Embed Size (px)
Citation preview
PROPENSITY SCORE-MATCHING METHODS FORNONEXPERIMENTAL CAUSAL STUDIES
Rajeev H. Dehejia and Sadek Wahba*
Abstract—This paper considers causal inference and sample selection biasin nonexperimental settings in which (i) few units in the nonexperimentalcomparison group are comparable to the treatment units, and (ii) selectinga subset of comparison units similar to the treatment units is difficultbecause units must be compared across a high-dimensional set of pre-treatment characteristics. We discuss the use of propensity score-matchingmethods, and implement them using data from the National SupportedWork experiment. Following LaLonde (1986), we pair the experimentaltreated units with nonexperimental comparison units from the CPS andPSID, and compare the estimates of the treatment effect obtained usingour methods to the benchmark results from the experiment. For bothcomparison groups, we show that the methods succeed in focusingattention on the small subset of the comparison units comparable to thetreated units and, hence, in alleviating the bias due to systematic differ-ences between the treated and comparison units.
I. Introduction
An important problem of causal inference is how toestimate treatment effects in observational studies,
situations (like an experiment) in which a group of units isexposed to a well-defined treatment, but (unlike an experi-ment) no systematic methods of experimental design areused to maintain a control group. It is well recognized thatthe estimate of a causal effect obtained by comparing atreatment group with a nonexperimental comparison groupcould be biased because of problems such as self-selectionor some systematic judgment by the researcher in selectingunits to be assigned to the treatment. This paper discussesthe use of propensity score-matching methods to correct forsample selection bias due to observable differences betweenthe treatment and comparison groups.
Matching involves pairing treatment and comparisonunits that are similar in terms of their observable character-istics. When the relevant differences between any two unitsare captured in the observable (pretreatment) covariates,which occurs when outcomes are independent of assign-ment to treatment conditional on pretreatment covariates,matching methods can yield an unbiased estimate of the
treatment impact.1 The first generation of matching methodspaired observations based on either a single variable orweighting several variables. (See, inter alia, Bassi (1984),Cave and Bos (1995), Czajka et al. (1992), Cochran andRubin (1973), Raynor (1983), Rosenbaum (1995), Rubin(1973, 1979), Westat (1981), and studies cited by Barnow(1987).)
The motivation for focusing on propensity score-matching methods is that, in many applications of interest,the dimensionality of the observable characteristics is high.With a small number of characteristics (for example, twobinary variables), matching is straightforward (one wouldgroup units in four cells). However, when there are manyvariables, it is difficult to determine along which dimen-sions to match units or which weighting scheme to adopt.Propensity score-matching methods, as we demonstrate, areespecially useful under such circumstances because theyprovide a natural weighting scheme that yields unbiasedestimates of the treatment impact.
The key contribution of this paper is to discuss and applypropensity score-matching methods, which are new to theeconomics literature. (Previous papers include Dehejia andWahba (1999), Heckman et al. (1996, 1998), Heckman,Ichimura, and Todd (1997, 1998). See Friedlander, Green-berg, and Robins (1997) for a review.) This paper differsfrom Dehejia and Wahba (1999) by focusing on matchingmethods in detail, and it complements the Heckman et al.papers by discussing a different array of matching estima-tors in the context of a different data set.
An important feature of our method is that, after units arematched, the unmatched comparison units are discarded andare not directly used in estimating the treatment impact. Ourapproach has two motivations. First, in some settings ofinterest, data on the outcome variable for the comparisongroup are costly to obtain. For example, in economics, somedata sets provide outcome information for only one year; ifthe outcome of interest takes place in a later period, possiblythousands of comparison units have to be linked across datasets or resurveyed. In such settings, the ability to obtain theneeded data for a subset of relevant comparison units,discarding the irrelevant potential comparison units, is ex-tremely valuable. Second, even if information on the out-come is available for all comparison units (as it is in ourdata), the process of searching for the best subset from thecomparison group reveals the extent of overlap between thetreatment and comparison groups in terms of pretreatmentcharacteristics. Because methods that use the full set of
Received for publication February 12, 1998. Revision accepted forpublication January 24, 2001.
* Columbia University and Morgan Stanley, respectively.Previous versions of this paper were circulated under the title “An
Oversampling Algorithm for Nonexperimental Causal Studies with In-complete Matching and Missing Outcome Variables” (1995) and asNational Bureau of Economic Research working paper no. 6829. We thankRobert Moffitt and two referees for detailed comments and suggestionsthat have improved the paper. We are grateful to Gary Chamberlain, GuidoImbens, and Donald Rubin for their support and encouragement, andgreatly appreciate comments from Joshua Angrist, George Cave, and JeffSmith. Special thanks are due to Robert LaLonde for providing, andhelping to reconstruct, the data from his 1986 study. Valuable commentswere received from seminar participants at Harvard, MIT, and the Man-power Demonstration Research Corporation. Any remaining errors are theauthors’ responsibility.
1 More precisely, to estimate the treatment impact on the treated, theoutcome in the untreated state must be independent of the treatmentassignment.
The Review of Economics and Statistics, February 2002, 84(1): 151–161© 2002 by the President and Fellows of Harvard College and the Massachusetts Institute of Technology
comparison units extrapolate or smooth across the treatmentand comparison groups, it is extremely useful to know howmany of the comparison units are in fact comparable andhence how much smoothing one’s estimator is expected toperform.
The data we use, obtained from LaLonde (1986), arefrom the National Supported Work (NSW) Demonstration, alabor market experiment in which participants were ran-domized between treatment (on-the-job training lasting be-tween nine months and a year) and control groups. Follow-ing LaLonde, we use the experimental controls to obtain abenchmark estimate for the treatment impact and then setthem aside, wedding the treated units from the experimentto comparison units from the Population Survey of IncomeDynamics (PSID) and the Current Population Survey(CPS).2 We compare estimates obtained using our nonex-perimental methods to the experimental benchmark. Weshow that most of the nonexperimental comparison units arenot good matches for the treated group. We succeed inselecting the comparison units that are most comparable tothe treated units and in replicating the benchmark treatmentimpact.
The paper is organized as follows. In section II, wediscuss the theory behind our estimation strategy. In sectionIII, we discuss propensity score-matching methods. In sec-tion IV, we describe the NSW data, which we then use insection V to implement our matching procedures. SectionVI tests the matching assumption and examines the sensi-tivity of our estimates to the specification of the propensityscore. Section VII concludes the paper.
II. Matching Methods
A. The Role of Randomization
A cause is viewed as a manipulation or treatment thatbrings about a change in the variable of interest, comparedto some baseline, called the control (Cox, 1992; Holland,1986). The basic problem in identifying a causal effect isthat the variable of interest is observed under either thetreatment or control regimes, but never both.
Formally, let i index the population under consideration.Yi1 is the value of the variable of interest when unit i issubject to treatment (1), and Yi0 is the value of the samevariable when the unit is exposed to the control (0). Thetreatment effect for a single unit, �i, is defined as �i � Yi1 �Yi0. The primary treatment effect of interest in nonexperi-mental settings is the expected treatment effect for thetreated population; hence
��T�1 � E��i�Ti � 1�
� E�Yi1�Ti � 1� � E�Yi0�Ti � 1�,
where Ti � 1 (� 0) if the ith unit was assigned to treatment(control).3 The problem of unobservability is summarizedby the fact that we can estimate E(Yi1�Ti � 1), but notE(Yi0�Ti � 1).
The difference, �e � E(Yi1�Ti � 1) � E(Yi0�Ti � 0),can be estimated, but it is potentially a biased estimator of�. Intuitively, if Yi0 for the treated and comparison unitssystematically differs, then in observing only Yi0 for thecomparison group we do not correctly estimate Yi0 for thetreated group. Such bias is of paramount concern in nonex-perimental studies. The role of randomization is to preventthis:
Yi1, Yi 0�Tif E�Yi0�Ti � 0� � E�Yi0�Ti � 1� � E�Yi�Ti � 0�,
where Yi � TiYi1 � (1 � Ti)Yi0 (the observed value of theoutcome) and � is the symbol for independence. The treatedand control groups do not systematically differ from eachother, making the conditioning on Ti in the expectationunnecessary (ignorable treatment assignment, in the termi-nology of Rubin (1977)), and yielding ��T�1 � �e.4
B. Exact Matching on Covariates
To substitute for the absence of experimental controlunits, we assume that data can be obtained for a set ofpotential comparison units, which are not necessarily drawnfrom the same population as the treated units but for whomwe observe the same set of pretreatment covariates, Xi. Thefollowing proposition extends the framework of the previ-ous section to nonexperimental settings:
Proposition 1 (Rubin, 1977). If for each unit we observea vector of covariates Xi and Yi0 � Ti�Xi, @i, then the popu-lation treatment effect for the treated, ��T�1, is identified: itis equal to the treatment effect conditional on covariates andon assignment to treatment, ��T�1,X, averaged over thedistribution X�Ti � 15.
2 Fraker and Maynard (1987) also conduct an evaluation of nonexperi-mental methods using the NSW data. Their findings were similar toLaLonde’s.
3 In a nonexperimental setting, the treatment and comparison samplesare either drawn from distinct groups or are nonrandom samples from acommon population. In the former case, typically the interest is thetreatment impact for the group from which the treatment sample is drawn.In the latter case, the interest could be in knowing the treatment effect forthe subpopulation from which the treatment sample is drawn or thetreatment effect for the full population from which both treatment andcomparison samples were drawn. In contrast, in a randomized experiment,the treatment and control samples are randomly drawn from the samepopulation, and thus the treatment effect for the treated group is identicalto the treatment effect for the untreated group.
4 We are also implicitly making what is sometimes called the stable-unit-treatment-value assumption (Rubin, 1980, 1986). This amounts to theassumption that Yi1(Yi0) does not depend upon which units other than iwere assigned to the treatment group; that is, there are no within-groupspillovers or general equilibrium effects.
5 Randomization implies Yi1, Yi0 � Ti, but Yi0 � Ti�Xi is all that is requiredto estimate the treatment effect on the treated. The stronger assumption,Yi1, Yi0 � Ti�Xi, would be needed to identify the treatment effect on thecomparison group or the overall average. Note that we are estimating thetreatment effect for the treatment group as it exists at the time of analysis.We are not estimating any program entry or exit effects that might arise if
THE REVIEW OF ECONOMICS AND STATISTICS152
Intuitively, this assumes that, conditioning on observablecovariates, we can take assignment to treatment to have beenrandom and that, in particular, unobservables play no role inthe treatment assignment; comparing two individuals with thesame observable characteristics, one of whom was treated andone of whom was not, is by proposition 1 like comparing thosetwo individuals in a randomized experiment. Under this as-sumption, the conditional treatment effect, ��T�1, is estimatedby first estimating ��T�1,X and then averaging over the distri-bution of X conditional on T � 1.
One way to estimate this equation would be by matchingunits on their vector of covariates, Xi. In principle, we couldstratify the data into subgroups (or bins), each defined by aparticular value of X; within each bin, this amounts toconditioning on X. The limitation of this method is that itrelies on a sufficiently rich comparison group so that no bincontaining a treated unit is without a comparison unit. Forexample, if all n variables are dichotomous, the number ofpossible values for the vector X will be 2n. Clearly, as thenumber of variables increases, the number of cells increasesexponentially, increasing the difficulty of finding exactmatches for each of the treated units.
C. Propensity Score and Dimensionality Reduction
Rosenbaum and Rubin (1983, 1985a, b) suggest the use ofthe propensity score—the probability of receiving treatmentconditional on covariates—to reduce the dimensionality of thematching problem discussed in the previous section.
Proposition 2 (Rosenbaum and Rubin, 1983). Let p(Xi) bethe probability of a unit i having been assigned to treatment,defined as p(Xi) � Pr(Ti � 1�Xi) � E(Ti�Xi). Then,
�Yi1, Yi0� � Ti�Xi f �Yi1, Yi0� � Ti�p�Xi�.
Proposition 3. ��T�1 � Ep(X)[(��T�1,p(X))�Ti � 1].
Thus, the conditional independence result extends to theuse of the propensity score, as does by immediate implica-tion our result on the computation of the conditional treat-ment effect, now ��T�1,p(X). The point of using the propen-sity score is that it substantially reduces the dimensionalityof the problem, allowing us to condition on a scalar variablerather than in a general n-space.
III. Propensity Score-Matching Algorithms
In the discussion that follows, we assume that the propensityscore is known, which of course it is not. The appendixdiscusses a straightforward method for estimating it.6
Matching on the propensity score is essentially a weight-ing scheme, which determines what weights are placed oncomparison units when computing the estimated treatmenteffect:
�̂�T�1 �1
�N� �i�N
�Yi �1
�Ji��
j�Ji
Yj� ,
where N is the treatment group, �N� the number of units inthe treatment group, Ji is the set of comparison unitsmatched to treatment unit i (see Heckman, Ichimura, andTodd (1998), who discuss more general weightingschemes), and �Ji� is the number of comparison units in Ji.
This estimator follows from proposition 3. Expectationsare replaced by sample means, and we condition on p(Xi)by matching each treatment unit i to a set of comparisonunits, Ji, with a similar propensity score. Taken literally,conditioning on p(Xi) implies exact matching on p(Xi).This is difficult in practice, so the objective becomes tomatch treated units to comparison units whose propensityscores are sufficiently close to consider the conditioning onp(Xi) in proposition 3 to be approximately valid.
Three issues arise in implementing matching: whether ornot to match with replacement, how many comparison unitsto match to each treated unit, and finally which matchingmethod to choose. We consider each in turn.
Matching with replacement minimizes the propensity-score distance between the matched comparison units andthe treatment unit: each treatment unit can be matched to thenearest comparison unit, even if a comparison unit ismatched more than once. This is beneficial in terms of biasreduction. In contrast, by matching without replacement,when there are few comparison units similar to the treatedunits, we may be forced to match treated units to compar-ison units that are quite different in terms of the estimatedpropensity score. This increases bias, but it could improvethe precision of the estimates. An additional complication ofmatching without replacement is that the results are poten-tially sensitive to the order in which the treatment units arematched (Rosenbaum, 1995).
The question of how many comparison units to matchwith each treatment unit is closely related. By using a singlecomparison unit for each treatment unit, we ensure thesmallest propensity-score distance between the treatmentand comparison units. By using more comparison units, oneincreases the precision of the estimates, but at the cost ofincreased bias. One method of selecting a set of comparisonunits is the nearest-neighbor method, which selects the mcomparison units whose propensity scores are closest to thetreated unit in question. Another method is caliper match-ing, which uses all of the comparison units within a pre-defined propensity score radius (or “caliper” ). A benefit of
the treatment were made more widely available. Estimation of such effectswould require additional data as described by Moffitt (1992).
6 Standard errors should adjust for the estimation error in the propensityscore and the variation that it induces in the matching process. In theapplication, we use bootstrap standard errors. Heckman, Ichimura, andTodd (1998) provide asymptotic standard errors for propensity score
estimators, but in their application paper, Heckman, Ichimura, and Todd(1997) also use bootstrap standard errors.
PROPENSITY SCORE-MATCHING METHODS FOR NONEXPERIMENTAL CAUSAL STUDIES 153
caliper matching is that it uses only as many comparisonunits as are available within the calipers, allowing for theuse of extra (fewer) units when good matches are (not)available.
In the application that follows, we consider a range ofsimple estimators. For matching without replacement, weconsider low-to-high, high-to-low, and random matching. Inthese methods, the treated units are ranked (from lowest tohighest or highest to lowest propensity score, or randomly).The highest-ranked unit is matched first, and the matchedcomparison unit is removed from further matching. Formatching with replacement, we consider single-nearest-neighbor matching and caliper matching for a range ofcalipers. In addition to using a weighted difference in meansto estimate the treatment effect, we also consider a weightedregression using the treatment and matched comparisonunits, with the comparison units weighted by the number oftimes that they are matched to a treated unit. A regressioncan potentially improve the precision of the estimates.
The question that remains is which method to select inpractice. In general, this depends on the data in question,and in particular on the degree of overlap between thetreatment and comparison groups in terms of the propensityscore. When there is substantial overlap in the distributionof the propensity score between the comparison and treat-ment groups, most of the matching algorithms will yieldsimilar results. When the treatment and comparison unitsare very different, finding a satisfactory match by matchingwithout replacement can be very problematic. In particular,if there are only a handful of comparison units comparableto the treated units, then once these comparison units havebeen matched, the remaining treated units will have to bematched to comparison units that are very different. In suchsettings, matching with replacement is the natural choice. Ifthere are no comparison units for a range of propensityscores, then for that range the treatment effect could not beestimated. The application that follows will further clarifythe choices that the researcher faces in practice.
IV. The Data
A. The National Supported Work Program
The NSW was a U.S. federally and privately fundedprogram that aimed to provide work experience for individ-uals who had faced economic and social problems prior toenrollment in the program (Hollister, Kemper, and May-nard, 1984; Manpower Demonstration Research Corpora-tion, 1983).7 Candidates for the experiment were selected onthe basis of eligibility criteria, and then were either ran-domly assigned to, or excluded from, the training program.
Table 1 provides the characteristics of the sample we use,LaLonde’s male sample (185 treated and 260 control obser-vations).8 The table highlights the role of randomization: thedistribution of the covariates for the treatment and controlgroups are not significantly different. We use the two non-experimental comparison groups constructed by LaLonde(1986), drawn from the CPS and PSID.9
B. Distribution of the Treatment and Comparison Samples
Tables 2 and 3 (rows 1 and 2) present the samplecharacteristics of the two comparison groups and the treat-ment group. The differences are striking: the PSID and CPSsample units are eight to nine years older than those in theNSW group, their ethnic composition is different, and theyhave on average completed high school degrees, whereasNSW participants were by and large high school dropouts,and, most dramatically, pretreatment earnings are muchhigher for the comparison units than for the treated units, bymore than $10,000. A more synoptic way to view thesedifferences is to use the estimated propensity score as asummary statistic. Using the method outlined in the appen-dix, we estimate the propensity score for the two compositesamples (NSW-CPS and NSW-PSID), incorporating thecovariates linearly and with some higher-order terms.
7 Four groups were targeted: Women on Aid to Families with DependentChildren (AFDC), former addicts, former offenders, and young schooldropouts. Several reports extensively document the NSW program. For ageneral summary of the findings, see Manpower Demonstration ResearchCorporation (1983).
8 The data we use are a subsample of the data used in LaLonde (1986).The analysis in LaLonde is based on one year of pretreatment earnings.But, as Ashenfelter (1978) and Ashenfelter and Card (1985) suggest, theuse of more than one year of pretreatment earnings is key in accuratelyestimating the treatment effect, because many people who volunteer fortraining programs experience a drop in their earnings just prior to enteringthe training program. Using the LaLonde sample of 297 treated and 425control units, we exclude the observations for which earnings in 1974could not be obtained, thus arriving at a reduced sample of 185 treatedobservations and 260 control observations. Because we obtain this subsetby looking at pretreatment covariates, we do not disturb the balance inobserved and unobserved characteristics between the experimental treatedand control groups. See Dehejia and Wahba (1999) for a comparison of thetwo samples.
9 These are the CPS-1 and PSID-1 comparison groups from LaLonde’spaper.
TABLE 1.—SAMPLE MEANS AND STANDARD ERRORS OF COVARIATES
FOR MALE NSW PARTICIPANTS
National Supported Work Sample (Treatment and Control)
Variable
Dehejia-Wahba Sample
Treatment Control
Age 25.81 (0.52) 25.05 (0.45)Years of schooling 10.35 (0.15) 10.09 (0.1)Proportion of school dropouts 0.71 (0.03) 0.83 (0.02)Proportion of blacks 0.84 (0.03) 0.83 (0.02)Proportion of Hispanic 0.06 (0.017) 0.10 (0.019)Proportion married 0.19 (0.03) 0.15 (0.02)Number of children 0.41 (0.07) 0.37 (0.06)No-show variable 0 (0) n/aMonth of assignment (Jan. 1978 � 0) 18.49 (0.36) 17.86 (0.35)Real earnings 12 months before training 1,689 (235) 1,425 (182)Real earnings 24 months before training 2,096 (359) 2,107 (353)Hours worked 1 year before training 294 (36) 243 (27)Hours worked 2 years before training 306 (46) 267 (37)Sample size 185 260
THE REVIEW OF ECONOMICS AND STATISTICS154
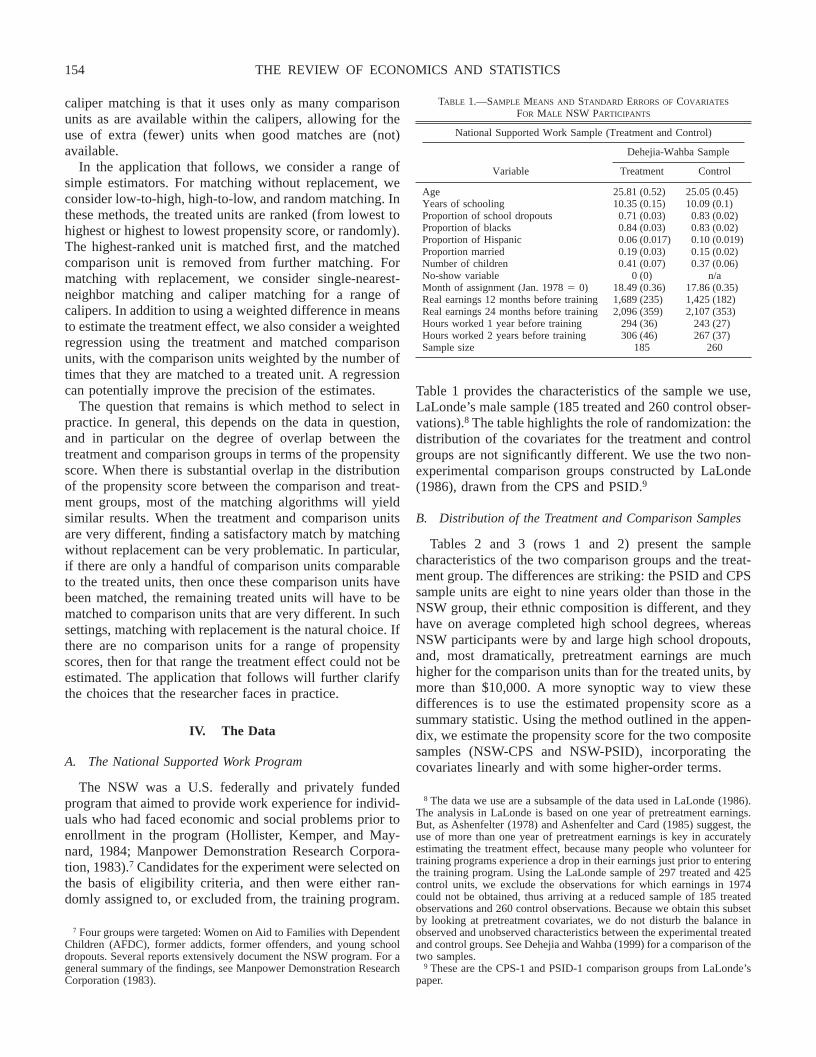
Figures 1 and 2 provide a simple diagnostic on the dataexamined, plotting the histograms of the estimated pro-pensity scores for the NSW-CPS and NSW-PSID sam-
ples. Note that the histograms do not include the com-parison units (11,168 units for the CPS and 1,254 unitsfor the PSID) whose estimated propensity score is less
TABLE 2.—SAMPLE CHARACTERISTICS AND ESTIMATED IMPACTS FROM THE NSW AND CPS SAMPLES
Control SampleNo. of
Observations
MeanPropensity
ScoreA Age School Black HispanicNo
Degree Married RE74 RE75 U74 U75
TreatmentEffect
(Diff. inMeans)
RegressionTreatment
Effect
NSW 185 0.37 25.82 10.35 0.84 0.06 0.71 0.19 2095 1532 0.29 0.40 1794B
(633)1672C
(638)Full CPS 15992 0.01
(0.02)D33.23(0.53)
12.03(0.15)
0.07(0.03)
0.07(0.02)
0.30(0.03)
0.71(0.03)
14017(367)
13651(248)
0.88(0.03)
0.89(0.04)
�8498(583)E
1066(554)
Without replacement:Random 185 0.32
(0.03)25.26(0.79)
10.30(0.23)
0.84(0.04)
0.06(0.03)
0.65(0.05)
0.22(0.04)
2305(495)
1687(341)
0.37(0.05)
0.51(0.05)
1559(733)
1651(709)
Low to high 185 0.32(0.03)
25.23(0.79)
10.28(0.23)
0.84(0.04)
0.06(0.03)
0.66(0.05)
0.22(0.04)
2286(495)
1687(341)
0.37(0.05)
0.51(0.05)
1605(730)
1681(704)
High to low 185 0.32(0.03)
25.26(0.79)
10.30(0.23)
0.84(0.04)
0.06(0.03)
0.65(0.05)
0.22(0.04)
2305(495)
1687(341)
0.37(0.05)
0.51(0.05)
1559(733)
1651(709)
With replacement:Nearest neighbor 119 0.37
(0.03)25.36(1.04)
10.31(0.31)
0.84(0.06)
0.06(0.04)
0.69(0.07)
0.17(0.06)
2407(727)
1516(506)
0.35(0.07)
0.49(0.07)
1360(913)
1375(907)
Caliper, � � 0.00001 325 0.37(0.03)
25.26(1.03)
10.31(0.30)
0.84(0.06)
0.07(0.04)
0.69(0.07)
0.17(0.06)
2424(845)
1509(647)
0.36(0.06)
0.50(0.06)
1119(875)
1142(874)
Caliper, � � 0.00005 1043 0.37(0.02)
25.29(1.03)
10.28(0.32)
0.84(0.05)
0.07(0.04)
0.69(0.06)
0.17(0.06)
2305(877)
1523(675)
0.35(0.06)
0.49(0.60)
1158(852)
1139(851)
Caliper, � � 0.0001 1731 0.37(0.02)
25.19(1.03)
10.36(0.31)
0.84(0.05)
0.07(0.04)
0.69(0.06)
0.17(0.06)
2213(890)
1545(701)
0.34(0.06)
0.50(0.06)
1122(850)
1119(843)
Variables: Age, age of participant; School, number of school years; Black, 1 if black, 0 otherwise; Hisp, 1 if Hispanic, 0 otherwise; No degree, 1 if participant had no school degrees, 0 otherwise; Married, 1 ifmarried, 0 otherwise; RE74, real earnings (1982US$) in 1974; RE75, real earnings (1982US$) in 1975; U74, 1 if unemployed in 1974, 0 otherwise; U75, 1 if unemployed in 1975, 0 otherwise; and RE78, real earnings(1982US$) in 1978.
(A) The propensity score is estimated using a logit of treatment status on: Age, Age2, Age3, School, School2, Married, No degree, Black, Hisp, RE74, RE75, U74, U75, School � RE74.(B) The treatment effect for the NSW sample is estimated using the experimental control group.(C) The regression treatment effect controls for all covariates linearly. For matching with replacement, weighted least squares is used, where treatment units are weighted at 1 and the weight for a control is the
number of times it is matched to a treatment unit.(D) The standard error applies to the difference in means between the matched and the NSW sample, except in the last two columns, where the standard error applies to the treatment effect.(E) Standard errors for the treatment effect and regression treatment effect are computed using a bootstrap with 500 replications.
TABLE 3.—SAMPLE CHARACTERISTICS AND ESTIMATED IMPACTS FROM THE NSW AND PSID SAMPLES
Control SampleNo. of
Observations
MeanPropensity
ScoreA Age School Black HispanicNo
Degree MarriedRE74US$
RE75US$ U74 U75
TreatmentEffect
(Diff. inMeans)
RegressionTreatment
Effect
NSW 185 0.37 25.82 10.35 0.84 0.06 0.71 0.19 2095 1532 0.29 0.40 1794B
(633)1672C
(638)Full PSID 2490 0.02
(0.02)D34.85(0.57)
12.12(0.16)
0.25(0.03)
0.03(0.02)
0.31(0.03)
0.87(0.03)
19429(449)
19063(361)
0.10(0.04)
0.09(0.03)
�15205(657)E
4(1014)
Without replacement:Random 185 0.25
(0.03)29.17(0.90)
10.30(0.25)
0.68(0.04)
0.07(0.03)
0.60(0.05)
0.52(0.05)
4659(554)
3263(361)
0.40(0.05)
0.40(0.05)
�916(1035)
77(983)
Low to high 185 0.25(0.03)
29.17(0.90)
10.30(0.25)
0.68(0.04)
0.07(0.03)
0.60(0.05)
0.52(0.05)
4659(554)
3263(361)
0.40(0.05)
0.40(0.05)
�916(1135)
77(983)
High to low 185 0.25(0.03)
29.17(0.90)
10.30(0.25)
0.68(0.04)
0.07(0.03)
0.60(0.05)
0.52(0.05)
4659(554)
3263(361)
0.40(0.05)
0.40(0.05)
�916(1135)
77(983)
With replacement:Nearest Neighbor 56 0.70
(0.07)24.81(1.78)
10.72(0.54)
0.78(0.11)
0.09(0.05)
0.53(0.12)
0.14(0.11)
2206(1248)
1801(963)
0.54(0.11)
0.69(0.11)
1890(1202)
2315(1131)
Caliper, � � 0.00001 85 0.70(0.08)
24.85(1.80)
10.72(0.56)
0.78(0.12)
0.09(0.05)
0.53(0.12)
0.13(0.12)
2216(1859)
1819(1896)
0.54(0.10)
0.69(0.11)
1893(1198)
2327(1129)
Caliper, � � 0.00005 193 0.70(0.06)
24.83(2.17)
10.72(0.60)
0.78(0.11)
0.09(0.04)
0.53(0.11)
0.14(0.10)
2247(1983)
1778(1869)
0.54(0.09)
0.69(0.09)
1928(1196)
2349(1121)
Caliper, � � 0.0001 337 0.70(0.05)
24.92(2.30)
10.73(0.67)
0.78(0.11)
0.09(0.04)
0.53(0.11)
0.14(0.09)
2228(1965)
1763(1777)
0.54(0.07)
0.70(0.08)
1973(1191)
2411(1122)
Caliper, � � 0.001 2021 0.70(0.03)
24.98(2.37)
10.74(0.70)
0.79(0.09)
0.09(0.04)
0.53(0.10)
0.13(0.07)
2398(2950)
1882(2943)
0.53(0.06)
0.69(0.06)
1824(1187)
2333(1101)
(A) The propensity score is estimated using a logit of treatment status on: Age, Age2, School, School2, Married, No degree, Black, Hisp, RE74, RE742, RE75, RE752, U74, U75, U74 � Hisp.(B) The treatment effect for the NSW sample is estimated using the experimental control group.(C) The regression treatment effect controls for all covariates linearly. For matching with replacement, weighted least squares is used, where treatment units are weighted at 1 and the weight for a control is the
number of times it is matched to a treatment unit.(D) The standard error applies to the difference in means between the matched and the NSW sample, except in the last two columns, where the standard error applies to the treatment effect.(E) Standard errors for the treatment effect and regression treatment effect are computed using a bootstrap with 500 replications.
PROPENSITY SCORE-MATCHING METHODS FOR NONEXPERIMENTAL CAUSAL STUDIES 155
than the minimum estimated propensity score for thetreated units. As well, the first bins of both diagramscontain most of the remaining comparison units (4,398for the CPS and 1,007 for the PSID). Hence, it is clearthat very few of the comparison units are comparable tothe treated units. In fact, one of the strengths of thepropensity score method is that it dramatically highlightsthis fact. In comparing the other bins, we note that thenumber of comparison units in each bin is approximatelyequal to the number of treated units in the NSW-CPSsample, but, in the NSW-PSID sample, many of the upperbins have far more treated units than comparison units.This last observation will be important in interpreting theresults of the next section.
V. Matching Results
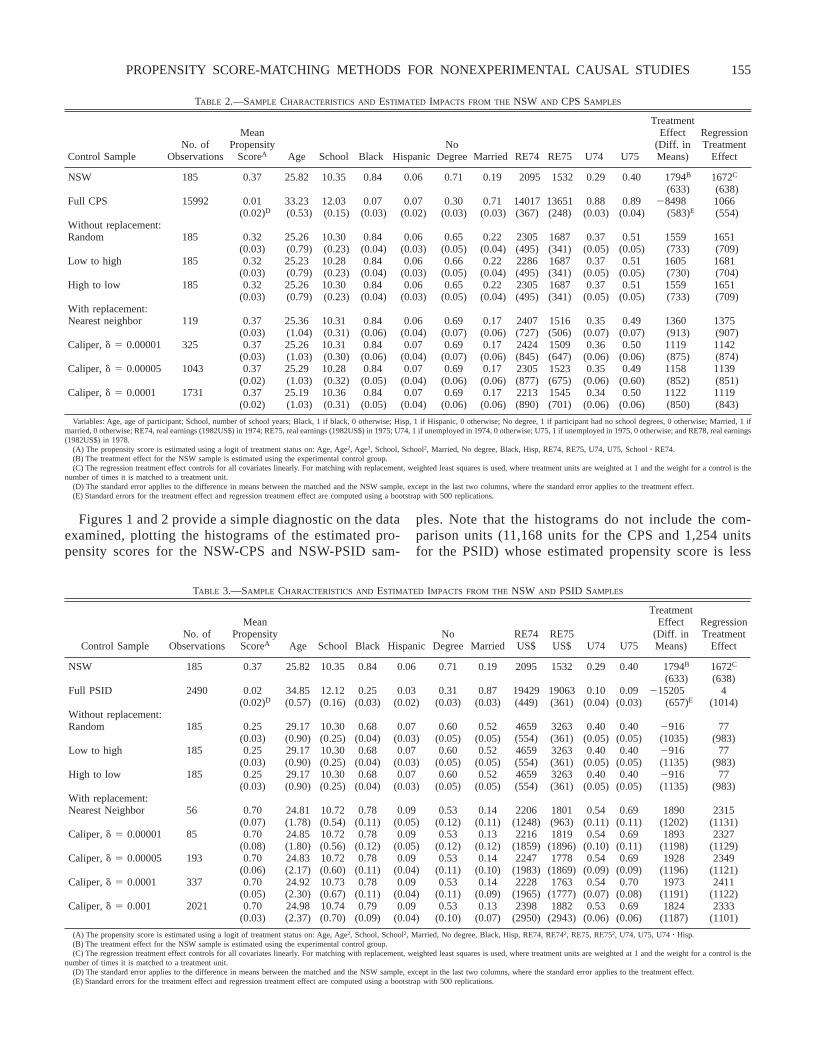
Figures 3 to 6 provide a snapshot of the matchingmethods described in section III and applied to theNSW-CPS sample, where the horizontal axis displaystreated units (indexed from lowest to highest estimatedpropensity score) and the vertical axis depicts the pro-pensity scores of the treated units and their matchedcomparison counterparts. (The corresponding figures forthe NSW-PSID sample look very similar.) Figures 3 to 5,which consider matching without replacement, share thecommon feature that the first 100 or so treated units arewell matched to their comparison group counterparts: thesolid and the dashed lines virtually overlap. But the
FIGURE 1.—HISTOGRAM OF ESTIMATED PROPENSITY SCORE,NSW AND CPS
FIGURE 2.—HISTOGRAM OF ESTIMATED PROPENSITY SCORE,NSW AND PSID
FIGURE 3.—PROPENSITY SCORE FOR TREATED AND MATCHED
COMPARISON UNITS, RANDOM WITHOUT REPLACEMENT
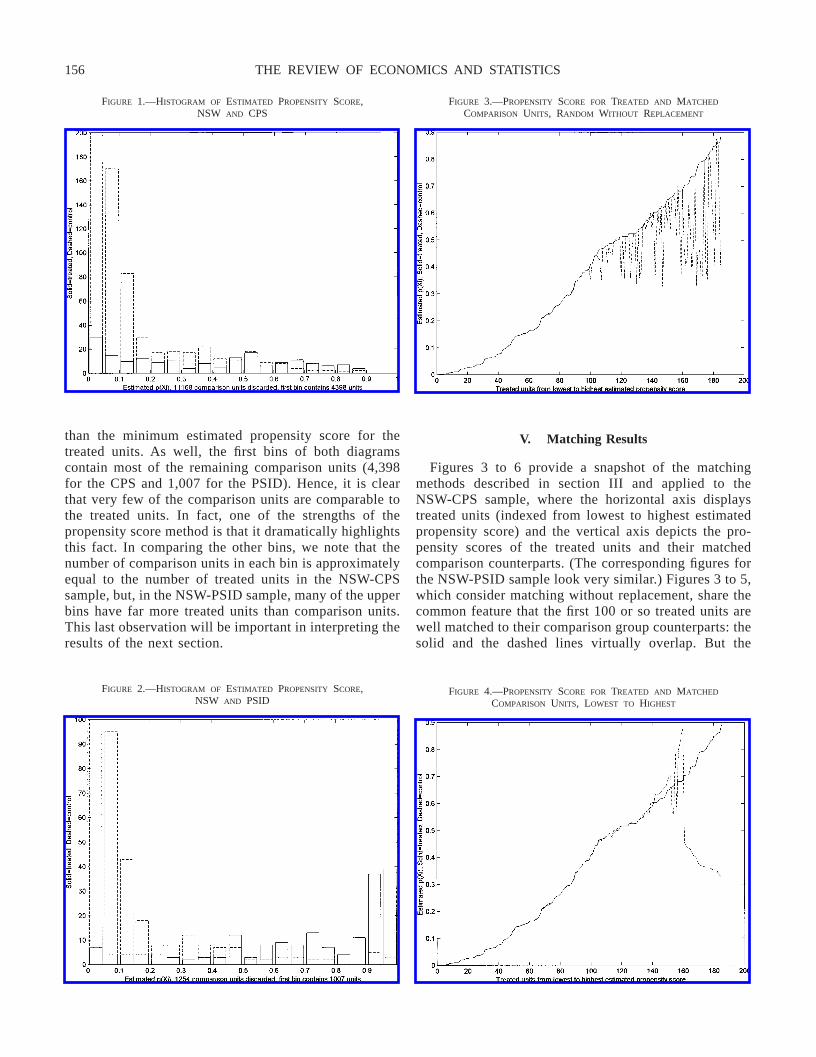
FIGURE 4.—PROPENSITY SCORE FOR TREATED AND MATCHED
COMPARISON UNITS, LOWEST TO HIGHEST
THE REVIEW OF ECONOMICS AND STATISTICS156
treated units with estimated propensity scores of 0.4 orhigher are not well matched.
In figure 3, units that are randomly selected to be matchedearlier find better matches, but those matched later arepoorly matched because the few comparison units compa-rable to the treated units have already been used. Likewise,in figure 4, where units are matched from lowest to highest,treated units in the 140th to 170th positions are forced to usecomparison units with ever-higher propensity scores. Fi-nally, for the remaining units (from approximately the 170th
position on), the comparison units with high propensityscores are exhausted and matches are found among com-parison units with much lower estimated propensity scores.Similarly, when we match from highest to lowest, thequality of matches begins to decline after the first fewtreated units, until we reach treated units whose propensityscore is (approximately) 0.4.
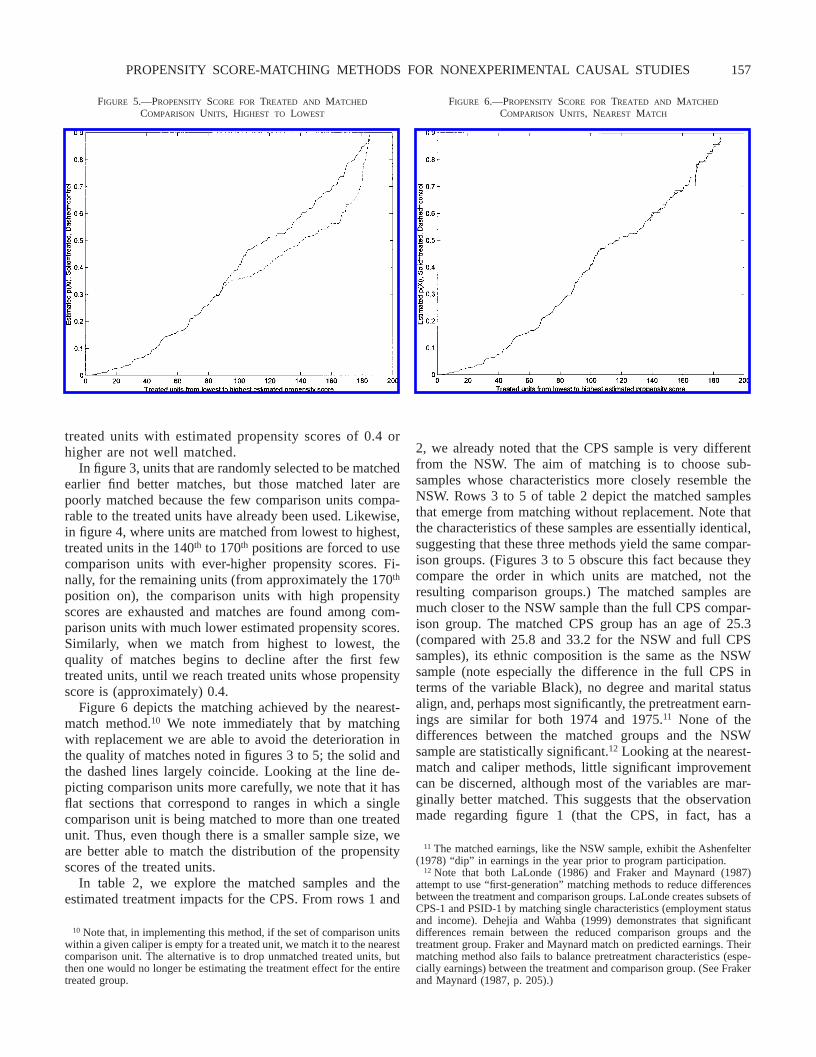
Figure 6 depicts the matching achieved by the nearest-match method.10 We note immediately that by matchingwith replacement we are able to avoid the deterioration inthe quality of matches noted in figures 3 to 5; the solid andthe dashed lines largely coincide. Looking at the line de-picting comparison units more carefully, we note that it hasflat sections that correspond to ranges in which a singlecomparison unit is being matched to more than one treatedunit. Thus, even though there is a smaller sample size, weare better able to match the distribution of the propensityscores of the treated units.
In table 2, we explore the matched samples and theestimated treatment impacts for the CPS. From rows 1 and
2, we already noted that the CPS sample is very differentfrom the NSW. The aim of matching is to choose sub-samples whose characteristics more closely resemble theNSW. Rows 3 to 5 of table 2 depict the matched samplesthat emerge from matching without replacement. Note thatthe characteristics of these samples are essentially identical,suggesting that these three methods yield the same compar-ison groups. (Figures 3 to 5 obscure this fact because theycompare the order in which units are matched, not theresulting comparison groups.) The matched samples aremuch closer to the NSW sample than the full CPS compar-ison group. The matched CPS group has an age of 25.3(compared with 25.8 and 33.2 for the NSW and full CPSsamples), its ethnic composition is the same as the NSWsample (note especially the difference in the full CPS interms of the variable Black), no degree and marital statusalign, and, perhaps most significantly, the pretreatment earn-ings are similar for both 1974 and 1975.11 None of thedifferences between the matched groups and the NSWsample are statistically significant.12 Looking at the nearest-match and caliper methods, little significant improvementcan be discerned, although most of the variables are mar-ginally better matched. This suggests that the observationmade regarding figure 1 (that the CPS, in fact, has a
10 Note that, in implementing this method, if the set of comparison unitswithin a given caliper is empty for a treated unit, we match it to the nearestcomparison unit. The alternative is to drop unmatched treated units, butthen one would no longer be estimating the treatment effect for the entiretreated group.
11 The matched earnings, like the NSW sample, exhibit the Ashenfelter(1978) “dip” in earnings in the year prior to program participation.
12 Note that both LaLonde (1986) and Fraker and Maynard (1987)attempt to use “fi rst-generation” matching methods to reduce differencesbetween the treatment and comparison groups. LaLonde creates subsets ofCPS-1 and PSID-1 by matching single characteristics (employment statusand income). Dehejia and Wahba (1999) demonstrates that significantdifferences remain between the reduced comparison groups and thetreatment group. Fraker and Maynard match on predicted earnings. Theirmatching method also fails to balance pretreatment characteristics (espe-cially earnings) between the treatment and comparison group. (See Frakerand Maynard (1987, p. 205).)
FIGURE 6.—PROPENSITY SCORE FOR TREATED AND MATCHED
COMPARISON UNITS, NEAREST MATCH
FIGURE 5.—PROPENSITY SCORE FOR TREATED AND MATCHED
COMPARISON UNITS, HIGHEST TO LOWEST
PROPENSITY SCORE-MATCHING METHODS FOR NONEXPERIMENTAL CAUSAL STUDIES 157
sufficient number of comparison units overlapping with theNSW) is borne out in terms of the matched sample.
Turning to the estimates of the treatment impact, in row1 we see that the benchmark estimate of the treatmentimpact from the randomized experiment is $1,794. For thefull CPS comparison group, the estimate is �$8,498 usinga difference in means and $1,066 using regression adjust-ment. The raw estimate is very misleading when comparedwith the benchmark, although the regression-adjusted esti-mate is better. The matching estimates are closer. For thewithout-replacement estimators, the estimate ranges from$1,559 to $1,605 for the difference in means and from$1,651 to $1,681 for the regression-adjusted estimator. Thenearest-neighbor with-replacement estimates are $1,360 and$1,375. Essentially, these methods succeed by picking outthe subset of the CPS that is the best comparison for theNSW. Based on these estimates, one might conclude thatmatching without replacement is the best strategy. Thereason why all the methods perform well is that there isreasonable overlap between the treatment and CPS compar-ison samples. As we will see, for the PSID comparisongroup the estimates are very different.
When using caliper matching, a larger comparison groupis selected: 325 for a caliper of 0.00001, 1,043 for a caliperof 0.0001, and 1,731 for a caliper of 0.0001. In terms of thecharacteristics of the sample, few significant differences areobserved, although we know that the quality of the matchesin terms of the propensity score is poorer. This is reflectedin the estimated treatment impact which ranges from $1,122to $1,149.
Using the PSID sample (table 3), somewhat differentconclusions are reached. Like the CPS, the PSID sample isvery different from the NSW sample. Unlike the CPS, thematched-without-replacement samples are not fully compa-rable to the NSW. They are reasonably comparable in termsof age, schooling, and ethnicity, but, in terms of pretreat-ment earnings, we observe a large (and statistically signif-icant) difference. As a result, it is not surprising that theestimates of the treatment impact, both by a difference inmeans and through regression adjustment, are far from theexperimental benchmark (ranging from $�916 to $77). Incontrast, the matched-with-replacement samples use evenfewer (56) comparison units, but they are able to match thepretreatment earnings of the NSW sample and the othervariables as well. This corresponds to our observation re-garding figure 2, namely that there are very few comparisonunits in the PSID that are similar to units in the NSW; whenthis is the case, we expect more sensitivity to the methodused to match observations, and we expect matching withreplacement to perform better. The treatment impact asestimated by the nearest-neighbor method through a differ-ence in means ($1,890) is very similar to the experimentalbenchmark, but differs by $425 when estimated throughregression adjustment (although it is still closer than theestimates in rows 1 to 4). The difference in the two esti-
mates is less surprising when we consider the sample sizeinvolved: we are using only 56 of the 2,490 potentialcomparison units from the PSID. For the PSID, calipermatching also performs well. The estimates range from$1,824 to $2,411. Slightly lower standard errors areachieved than nearest-neighbor matching.
In conclusion, propensity score-matching methods areable to yield reasonably accurate estimates of the treatmentimpact, especially when contrasted with the range of esti-mates that emerged in LaLonde’s paper. By selecting anappropriate subset from the comparison group, a simpledifference in means yields an estimate of the treatmenteffect close to the experimental benchmark. The choiceamong matching methods becomes important when there isminimal overlap between the treatment and comparisongroups. When there is minimal overlap, matching withreplacement emerges as a better choice. In principle, calipermatching can also improve standard errors relative to near-est-neighbor matching, although at the cost of greater bias.At least in our application, the benefits of caliper matchingwere limited. When there is greater overlap, the without-replacement estimators perform as well as the nearest-neighbor method, and their standard errors are somewhatlower than the nearest-neighbor method, so, when manycomparison units overlap with the treatment group, match-ing without replacement is probably a better choice.
VI. Testing
A. Testing the Matching Assumption
The special structure of the data we use allows us to testthe assumption that underlies propensity score matching.Because we have both an experimental control group(which we use to estimate the experimental benchmarkestimate in row 1 of tables 2 and 3) and two nonexperimen-tal comparison groups, we can test the assumption that,conditional on the propensity score, earnings in the non-treated state are independent of assignment to treatment(Heckman et al., 1998; Heckman, Ichimura, and Todd,1997). In practice, this amounts to comparing earnings for theexperimental control group with earnings for the two compar-ison groups using the propensity score. We apply the propen-sity score specifications from section V to the compositesample of NSW control units and CPS (or PSID) comparisonunits. Following Heckman et al. (1998), we compute the biaswithin strata defined on the propensity score.
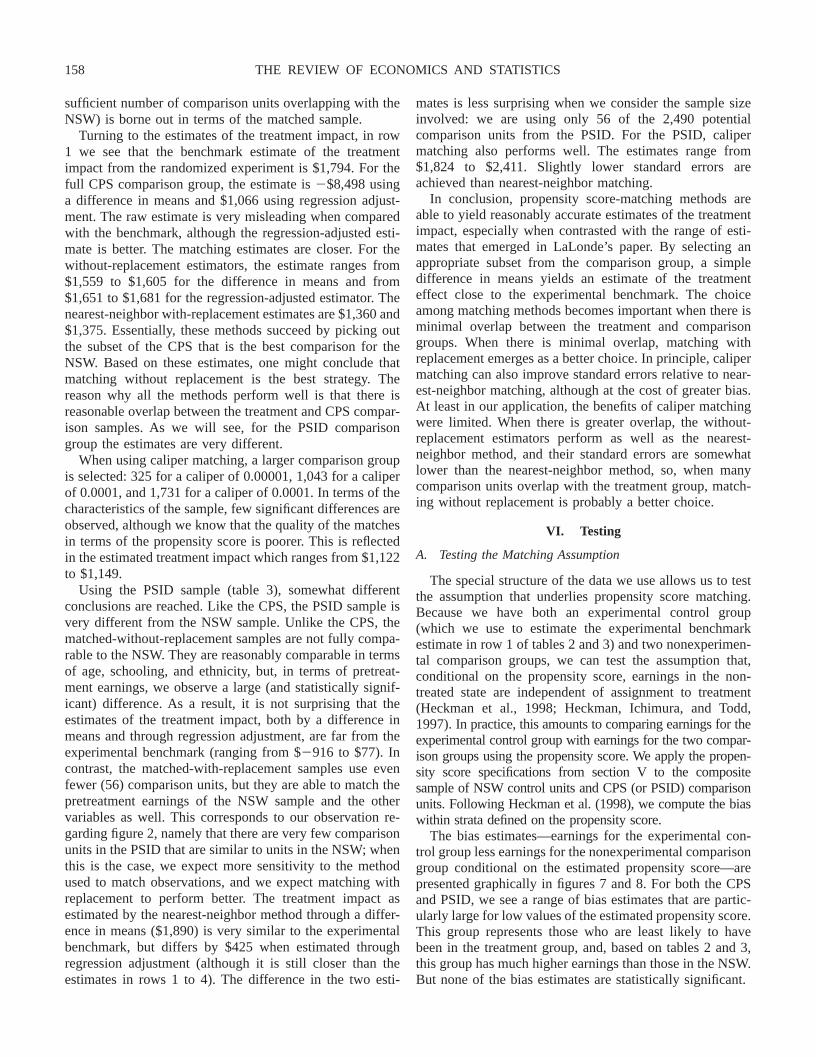
The bias estimates—earnings for the experimental con-trol group less earnings for the nonexperimental comparisongroup conditional on the estimated propensity score—arepresented graphically in figures 7 and 8. For both the CPSand PSID, we see a range of bias estimates that are partic-ularly large for low values of the estimated propensity score.This group represents those who are least likely to havebeen in the treatment group, and, based on tables 2 and 3,this group has much higher earnings than those in the NSW.But none of the bias estimates are statistically significant.
THE REVIEW OF ECONOMICS AND STATISTICS158
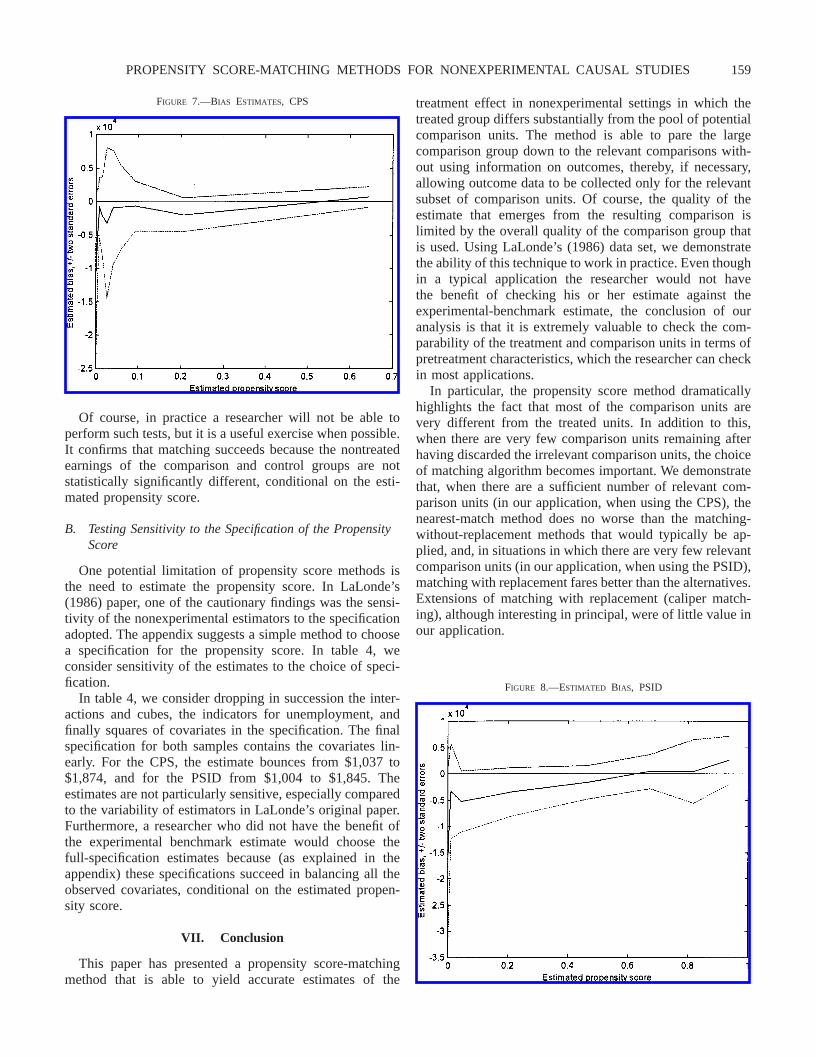
Of course, in practice a researcher will not be able toperform such tests, but it is a useful exercise when possible.It confirms that matching succeeds because the nontreatedearnings of the comparison and control groups are notstatistically significantly different, conditional on the esti-mated propensity score.
B. Testing Sensitivity to the Specification of the PropensityScore
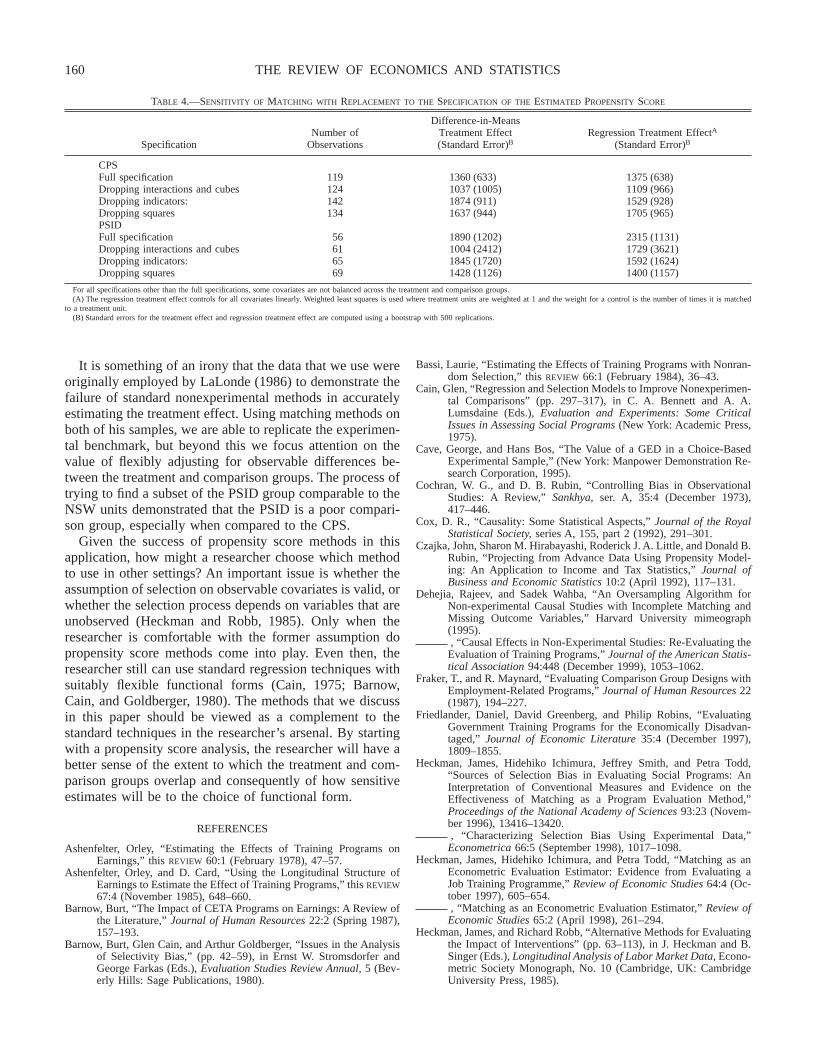
One potential limitation of propensity score methods isthe need to estimate the propensity score. In LaLonde’s(1986) paper, one of the cautionary findings was the sensi-tivity of the nonexperimental estimators to the specificationadopted. The appendix suggests a simple method to choosea specification for the propensity score. In table 4, weconsider sensitivity of the estimates to the choice of speci-fication.
In table 4, we consider dropping in succession the inter-actions and cubes, the indicators for unemployment, andfinally squares of covariates in the specification. The finalspecification for both samples contains the covariates lin-early. For the CPS, the estimate bounces from $1,037 to$1,874, and for the PSID from $1,004 to $1,845. Theestimates are not particularly sensitive, especially comparedto the variability of estimators in LaLonde’s original paper.Furthermore, a researcher who did not have the benefit ofthe experimental benchmark estimate would choose thefull-specification estimates because (as explained in theappendix) these specifications succeed in balancing all theobserved covariates, conditional on the estimated propen-sity score.
VII. Conclusion
This paper has presented a propensity score-matchingmethod that is able to yield accurate estimates of the
treatment effect in nonexperimental settings in which thetreated group differs substantially from the pool of potentialcomparison units. The method is able to pare the largecomparison group down to the relevant comparisons with-out using information on outcomes, thereby, if necessary,allowing outcome data to be collected only for the relevantsubset of comparison units. Of course, the quality of theestimate that emerges from the resulting comparison islimited by the overall quality of the comparison group thatis used. Using LaLonde’s (1986) data set, we demonstratethe ability of this technique to work in practice. Even thoughin a typical application the researcher would not havethe benefit of checking his or her estimate against theexperimental-benchmark estimate, the conclusion of ouranalysis is that it is extremely valuable to check the com-parability of the treatment and comparison units in terms ofpretreatment characteristics, which the researcher can checkin most applications.
In particular, the propensity score method dramaticallyhighlights the fact that most of the comparison units arevery different from the treated units. In addition to this,when there are very few comparison units remaining afterhaving discarded the irrelevant comparison units, the choiceof matching algorithm becomes important. We demonstratethat, when there are a sufficient number of relevant com-parison units (in our application, when using the CPS), thenearest-match method does no worse than the matching-without-replacement methods that would typically be ap-plied, and, in situations in which there are very few relevantcomparison units (in our application, when using the PSID),matching with replacement fares better than the alternatives.Extensions of matching with replacement (caliper match-ing), although interesting in principal, were of little value inour application.
FIGURE 8.—ESTIMATED BIAS, PSID
FIGURE 7.—BIAS ESTIMATES, CPS
PROPENSITY SCORE-MATCHING METHODS FOR NONEXPERIMENTAL CAUSAL STUDIES 159
It is something of an irony that the data that we use wereoriginally employed by LaLonde (1986) to demonstrate thefailure of standard nonexperimental methods in accuratelyestimating the treatment effect. Using matching methods onboth of his samples, we are able to replicate the experimen-tal benchmark, but beyond this we focus attention on thevalue of flexibly adjusting for observable differences be-tween the treatment and comparison groups. The process oftrying to find a subset of the PSID group comparable to theNSW units demonstrated that the PSID is a poor compari-son group, especially when compared to the CPS.
Given the success of propensity score methods in thisapplication, how might a researcher choose which methodto use in other settings? An important issue is whether theassumption of selection on observable covariates is valid, orwhether the selection process depends on variables that areunobserved (Heckman and Robb, 1985). Only when theresearcher is comfortable with the former assumption dopropensity score methods come into play. Even then, theresearcher still can use standard regression techniques withsuitably flexible functional forms (Cain, 1975; Barnow,Cain, and Goldberger, 1980). The methods that we discussin this paper should be viewed as a complement to thestandard techniques in the researcher’s arsenal. By startingwith a propensity score analysis, the researcher will have abetter sense of the extent to which the treatment and com-parison groups overlap and consequently of how sensitiveestimates will be to the choice of functional form.
REFERENCES
Ashenfelter, Orley, “Estimating the Effects of Training Programs onEarnings,” this REVIEW 60:1 (February 1978), 47–57.
Ashenfelter, Orley, and D. Card, “Using the Longitudinal Structure ofEarnings to Estimate the Effect of Training Programs,” this REVIEW67:4 (November 1985), 648–660.
Barnow, Burt, “The Impact of CETA Programs on Earnings: A Review ofthe Literature,” Journal of Human Resources 22:2 (Spring 1987),157–193.
Barnow, Burt, Glen Cain, and Arthur Goldberger, “ Issues in the Analysisof Selectivity Bias,” (pp. 42–59), in Ernst W. Stromsdorfer andGeorge Farkas (Eds.), Evaluation Studies Review Annual, 5 (Bev-erly Hills: Sage Publications, 1980).
Bassi, Laurie, “Estimating the Effects of Training Programs with Nonran-dom Selection,” this REVIEW 66:1 (February 1984), 36–43.
Cain, Glen, “Regression and Selection Models to Improve Nonexperimen-tal Comparisons” (pp. 297–317), in C. A. Bennett and A. A.Lumsdaine (Eds.), Evaluation and Experiments: Some CriticalIssues in Assessing Social Programs (New York: Academic Press,1975).
Cave, George, and Hans Bos, “The Value of a GED in a Choice-BasedExperimental Sample,” (New York: Manpower Demonstration Re-search Corporation, 1995).
Cochran, W. G., and D. B. Rubin, “Controlling Bias in ObservationalStudies: A Review,” Sankhya, ser. A, 35:4 (December 1973),417–446.
Cox, D. R., “Causality: Some Statistical Aspects,” Journal of the RoyalStatistical Society, series A, 155, part 2 (1992), 291–301.
Czajka, John, Sharon M. Hirabayashi, Roderick J. A. Little, and Donald B.Rubin, “Projecting from Advance Data Using Propensity Model-ing: An Application to Income and Tax Statistics,” Journal ofBusiness and Economic Statistics 10:2 (April 1992), 117–131.
Dehejia, Rajeev, and Sadek Wahba, “An Oversampling Algorithm forNon-experimental Causal Studies with Incomplete Matching andMissing Outcome Variables,” Harvard University mimeograph(1995)., “Causal Effects in Non-Experimental Studies: Re-Evaluating theEvaluation of Training Programs,” Journal of the American Statis-tical Association 94:448 (December 1999), 1053–1062.
Fraker, T., and R. Maynard, “Evaluating Comparison Group Designs withEmployment-Related Programs,” Journal of Human Resources 22(1987), 194–227.
Friedlander, Daniel, David Greenberg, and Philip Robins, “EvaluatingGovernment Training Programs for the Economically Disadvan-taged,” Journal of Economic Literature 35:4 (December 1997),1809–1855.
Heckman, James, Hidehiko Ichimura, Jeffrey Smith, and Petra Todd,“Sources of Selection Bias in Evaluating Social Programs: AnInterpretation of Conventional Measures and Evidence on theEffectiveness of Matching as a Program Evaluation Method,”Proceedings of the National Academy of Sciences 93:23 (Novem-ber 1996), 13416–13420., “Characterizing Selection Bias Using Experimental Data,”
Econometrica 66:5 (September 1998), 1017–1098.Heckman, James, Hidehiko Ichimura, and Petra Todd, “Matching as an
Econometric Evaluation Estimator: Evidence from Evaluating aJob Training Programme,” Review of Economic Studies 64:4 (Oc-tober 1997), 605–654., “Matching as an Econometric Evaluation Estimator,” Review of
Economic Studies 65:2 (April 1998), 261–294.Heckman, James, and Richard Robb, “Alternative Methods for Evaluating
the Impact of Interventions” (pp. 63–113), in J. Heckman and B.Singer (Eds.), Longitudinal Analysis of Labor Market Data, Econo-metric Society Monograph, No. 10 (Cambridge, UK: CambridgeUniversity Press, 1985).
TABLE 4.—SENSITIVITY OF MATCHING WITH REPLACEMENT TO THE SPECIFICATION OF THE ESTIMATED PROPENSITY SCORE
SpecificationNumber of
Observations
Difference-in-MeansTreatment Effect(Standard Error)B
Regression Treatment EffectA
(Standard Error)B
CPSFull specification 119 1360 (633) 1375 (638)Dropping interactions and cubes 124 1037 (1005) 1109 (966)Dropping indicators: 142 1874 (911) 1529 (928)Dropping squares 134 1637 (944) 1705 (965)PSIDFull specification 56 1890 (1202) 2315 (1131)Dropping interactions and cubes 61 1004 (2412) 1729 (3621)Dropping indicators: 65 1845 (1720) 1592 (1624)Dropping squares 69 1428 (1126) 1400 (1157)
For all specifications other than the full specifications, some covariates are not balanced across the treatment and comparison groups.(A) The regression treatment effect controls for all covariates linearly. Weighted least squares is used where treatment units are weighted at 1 and the weight for a control is the number of times it is matched
to a treatment unit.(B) Standard errors for the treatment effect and regression treatment effect are computed using a bootstrap with 500 replications.
THE REVIEW OF ECONOMICS AND STATISTICS160
Holland, Paul W., “Statistics and Causal Inference,” Journal of theAmerican Statistical Association 81:396 (December 1986), 945–960.
Hollister, Robinson, Peter Kemper, and Rebecca Maynard, The NationalSupported Work Demonstration (Madison, WI: University of Wis-consin Press, 1984).
LaLonde, Robert, “Evaluating the Econometric Evaluations of TrainingPrograms,” American Economic Review 76:4 (September 1986),604–620.
Manpower Demonstration Research Corporation, Summary and Findingsof the National Supported Work Demonstration (Cambridge, MA:Ballinger, 1983).
Moffitt, Robert, “Evaluation Methods for Program Entry Effects” (pp.231–252), in Charles Manski and Irwin Garfinkel (Eds.), Evaluat-ing Welfare and Training Programs (Cambridge, MA: HarvardUniversity Press, 1992).
Raynor, W. J., “Caliper Pair-Matching on a Continuous Variable in CaseControl Studies,” Communications in Statistics: Theory and Meth-ods 12:13 (June 1983), 1499–1509.
Rosenbaum, Paul, Observational Studies (New York: Springer Verlag,1995).
Rosenbaum, P., and D. Rubin, “The Central Role of the Propensity Scorein Observational Studies for Causal Effects,” Biometrika 70:1(April 1983), 41–55., “Constructing a Control Group Using Multivariate MatchedSampling Methods that Incorporate the Propensity,” AmericanStatistician 39:1 (February 1985a), 33–38., “The Bias Due to Incomplete Matching,” Biometrics 41 (March1985b), 103–116.
Rubin, D., “Matching to Remove Bias in Observational Studies,” Biomet-rics 29 (March 1973), 159–183., “Assignment to a Treatment Group on the Basis of a Covariate,”Journal of Educational Statistics 2:1 (Spring 1977), 1–26., “Using Multivariate Matched Sampling and Regression Adjust-ment to Control Bias in Observation Studies,” Journal of theAmerican Statistical Association 74:366 (June 1979), 318–328., “Discussion of Randomization Analysis of Experimental Data:The Fisher Randomization Test, by D. Basu,” Journal of theAmerican Statistical Association 75:371 (September 1980), 591–593., “Discussion of Holland (1986),” Journal of the American Statis-tical Association 81:396 (December 1986), 961–964.
Westat, “Continuous Longitudinal Manpower Survey Net Impact ReportNo. 1: Impact on 1977 Earnings of New FY 1976 CETA Enrolleesin Selected Program Activities,” report prepared for U.S. DOLunder contract 23-24-75-07 (1981).
APPENDIX: ESTIMATING THE PROPENSITY SCORE
The first step in estimating the treatment effect is to estimate thepropensity score. Any standard probability model can be used (for exam-ple, logit or probit). It is important to remember that the role of thepropensity score is only to reduce the dimensions of the conditioning; assuch, it has no behavioral assumptions attached to it. For ease of estima-tion, most applications in the statistics literature have concentrated on thelogit model:
Pr�Ti � 1�Xi� �eh�Xi�
1 � eh�Xi� ,
where Ti is the treatment status and h(Xi) is made up of linear andhigher-order terms of the covariates on which we condition to obtain anignorable treatment assignment.13
In estimating the propensity score through a probability model, thechoice of which interaction or higher-order term to include is determinedsolely by the need to condition fully on the observable characteristics thatmake up the assignment mechanism. The following proposition forms thebasis of the algorithm we use to estimate the propensity score (Rosenbaumand Rubin, 1983):
Proposition A:
X � T�p�X�.
Proof: From the definition of p(X) in proposition 2:E�Ti�Xi, p�Xi�� � E�Ti�Xi� � p�Xi�.
The algorithm works as follows. Starting with a parsimoniouslogistic function with linear covariates to estimate the score, rank allobservations by the estimated propensity score (from lowest to high-est). Divide the observations into strata such that within each stratumthe difference in propensity score for treated and comparison obser-vations is insignificant. Proposition A tells us that within each stratumthe distribution of the covariates should be approximately the sameacross the treated and comparison groups, once the propensity score iscontrolled for. Within each stratum, we can test for statisticallysignificant differences between the distribution of covariates fortreated and comparison units; operationally, t-tests on differences inthe first moments are often sufficient, but a joint test for the differencein means for all the variables within each stratum could also beperformed.14 When the covariates are not balanced within a particularstratum, the stratum may be too coarsely defined; recall that proposi-tion A deals with observations with an identical propensity score. Thesolution adopted is to divide the stratum into finer strata and test againfor no difference in the distribution of the covariates within the finerstrata. If, however, some covariates remain unbalanced for many strata,the score may be poorly estimated, which suggests that additionalterms (interaction or higher-order terms) of the unbalanced covariatesshould be added to the logistic specification to control better for thesecharacteristics. This procedure is repeated for each given stratum untilthe covariates are balanced. The algorithm is summarized next.
A Simple Algorithm for Estimating the Propensity Score
1. Start with a parsimonious logit specification to estimate the score.2. Sort data according to estimated propensity score (ranking from
lowest to highest).3. Stratify all observations such that estimated propensity scores
within a stratum for treated and comparison units are close (nosignificant difference); for example, start by dividing observationsinto strata of equal score range (0–0.2, . . . , 0.8–1).
4. Statistical test: for all covariates, differences in means across treatedand comparison units within each stratum are not significantlydifferent from zero.a. If covariates are balanced between treated and comparison ob-
servations for all strata, stop.b. If covariates are not balanced for some stratum, divide the
stratum into finer strata and reevaluate.c. If a covariate is not balanced for many strata, modify the logit by
adding interaction terms and/or higher-order terms of the covari-ate and reevaluate.
A key property of this procedure is that it uses a well-defined criterionto determine which interaction terms to use in the estimation, namelythose terms that balance the covariates. It also makes no use of theoutcome variable, and embodies one of the specification tests proposed byLaLonde (1986) and others in the context of evaluating the impact oftraining on earnings, namely to test for the regression-adjusted differencein the earnings prior to treatment.
13 Because we allow for higher-order terms in X, this choice is not veryrestrictive. By rearranging and taking logs, we obtain ln(Pr(Ti � 1�Xi)/1� Pr(Ti � 1�Xi)) � h(Xi). A Taylor-series expansion allows us anarbitrarily precise approximation. See also Rosenbaum and Rubin (1983). 14 More generally, one can also consider higher moments or interactions.
PROPENSITY SCORE-MATCHING METHODS FOR NONEXPERIMENTAL CAUSAL STUDIES 161
This article has been cited by:
1. Shelagh A. Heffernan, Xiaolan Fu, Xiaoqing (Maggie) Fu. 2013. Financial innovation in the UK. Applied Economics 45:24,3400-3411. [CrossRef]
2. Daniel C. Matisoff. 2013. Different rays of sunlight: Understanding information disclosure and carbon transparency. Energy Policy55, 579-592. [CrossRef]
3. Jirawan Boonperm, Jonathan Haughton, Shahidur R. Khandker. 2013. Does the Village Fund matter in Thailand? Evaluating theimpact on incomes and spending. Journal of Asian Economics 25, 3-16. [CrossRef]
4. Lewis Gaul, Ajay Palvia. 2013. Are regulatory management evaluations informative about bank accounting returns and risk?.Journal of Economics and Business 66, 1-21. [CrossRef]
5. Sea-Jin Chang, Jaiho Chung, Jon Jungbien Moon. 2013. When do wholly owned subsidiaries perform better than joint ventures?.Strategic Management Journal 34:3, 317-337. [CrossRef]
6. Sammy Zahran, Lori Peek, Jeffrey G. Snodgrass, Stephan Weiler, Lynn Hempel. 2013. Abnormal labor outcomes as a functionof maternal exposure to a catastrophic hurricane event during pregnancy. Natural Hazards 66:1, 61-76. [CrossRef]
7. Tracy A. Weitz, Diana Taylor, Sheila Desai, Ushma D. Upadhyay, Jeff Waldman, Molly F. Battistelli, Eleanor A. Drey. 2013.Safety of Aspiration Abortion Performed by Nurse Practitioners, Certified Nurse Midwives, and Physician Assistants Under aCalifornia Legal Waiver. American Journal of Public Health 103:3, 454-461. [CrossRef]
8. Sascha O. Becker, Peter H. Egger. 2013. Endogenous product versus process innovation and a firm’s propensity to export. EmpiricalEconomics 44:1, 329-354. [CrossRef]
9. Sandra Cavaco, Denis Fougère, Julien Pouget. 2013. Estimating the effect of a retraining program on the re-employment rate ofdisplaced workers. Empirical Economics 44:1, 261-287. [CrossRef]
10. Steven F. Lehrer, Gregory Kordas. 2013. Matching using semiparametric propensity scores. Empirical Economics 44:1, 13-45.[CrossRef]
11. Wang-Sheng Lee. 2013. Propensity score matching and variations on the balancing test. Empirical Economics 44:1, 47-80.[CrossRef]
12. Julie Riise Kolstad. 2013. How Does Additional Education Affect Willingness to Work in Rural Remote Areas in Low-IncomeContexts? An Application on Health Workers in Tanzania. Journal of Development Studies 49:2, 301-314. [CrossRef]
13. Suk Jeong Lee, ChaeWeon Chung. 2013. Comparisons of Health Conditions of Immigrant and Domestic Women in Korea andChina using Propensity Score Matching. Health Care for Women International 130122084800003. [CrossRef]
14. Delilah Greer, Damion J. Grasso, Andrew Cohen, Charles Webb. 2013. Trauma-Focused Treatment in a State System of Care:Is It Worth the Cost?. Administration and Policy in Mental Health and Mental Health Services Research . [CrossRef]
15. Ryan Burge. 2013. Using Matching to Investigate the Relationship between Religion and Tolerance. Politics and Religion 1-18.[CrossRef]
16. Cédric Afsa, Pauline Givord. 2013. The impact of working conditions on sickness absence: a theoretical model and an empiricalapplication to work schedules. Empirical Economics . [CrossRef]
17. E. Kathleen Adams, Genevieve M. Kenney, Katya Galactionova. 2013. Preventive and Reproductive Health Services for Women:The Role of California's Family Planning Waiver. American Journal of Health Promotion 27:sp3, eS1-eS10. [CrossRef]
18. Mari José Aranguren, Xabier de la Maza, Mario Davide Parrilli, Ferran Vendrell-Herrero, James R. Wilson. 2013. NestedMethodological Approaches for Cluster Policy Evaluation: An Application to the Basque Country. Regional Studies 1. [CrossRef]
19. Alberto F. Alesina, Francesca Lotti, Paolo Emilio Mistrulli. 2013. DO WOMEN PAY MORE FOR CREDIT? EVIDENCEFROM ITALY. Journal of the European Economic Association 11, 45-66. [CrossRef]
20. C. Towe, C. I. Tra. 2013. Vegetable Spirits and Energy Policy. American Journal of Agricultural Economics 95:1, 1-16. [CrossRef]21. Rebekah Levine Coley, Caitlin McPherran Lombardi. 2013. Does Maternal Employment Following Childbirth Support or Inhibit
Low-Income Children’s Long-Term Development?. Child Development 84:1, 178-197. [CrossRef]22. Amy Claessens, Jen-Hao Chen. 2013. Multiple child care arrangements and child well being: Early care experiences in Australia.
Early Childhood Research Quarterly 28:1, 49-61. [CrossRef]23. Lisa C. Smith, Faheem Khan, Timothy R. Frankenberger, A.K.M. Abdul Wadud. 2013. Admissible Evidence in the Court of
Development Evaluation? The Impact of CARE’s SHOUHARDO Project on Child Stunting in Bangladesh. World Development41, 196-216. [CrossRef]

24. K. J. Tobin. 2013. Fast-food consumption and educational test scores in the USA. Child: Care, Health and Development 39:1,118-124. [CrossRef]
25. Lekshmi Sasidharan, Eric T. Donnell. 2013. Application of propensity scores and potential outcomes to estimate effectiveness oftraffic safety countermeasures: Exploratory analysis using intersection lighting data. Accident Analysis & Prevention 50, 539-553.[CrossRef]
26. Brian S. Connelly, Paul R. Sackett, Shonna D. Waters. 2013. Balancing Treatment and Control Groups in Quasi-Experiments:An Introduction to Propensity Scoring. Personnel Psychology no-no. [CrossRef]
27. Sylvana M. Côté, Orla Doyle, Amélie Petitclerc, Lori Timmins. 2013. Child Care in Infancy and Cognitive Performance UntilMiddle Childhood in the Millennium Cohort Study. Child Development n/a-n/a. [CrossRef]
28. Gustavo Canavire-Bacarreza, Merlin M. Hanauer. 2013. Estimating the Impacts of Bolivia’s Protected Areas on Poverty. WorldDevelopment 41, 265-285. [CrossRef]
29. Michael R. Roberts, Toni M. WhitedEndogeneity in Empirical Corporate Finance1 2, 493-572. [CrossRef]30. James Alm, Yongzheng Liu. 2012. Did China's Tax‐for‐Fee Reform Improve Farmers' Welfare in Rural Areas?. Journal of
Development Studies 1-17. [CrossRef]31. M. Rodriguez, M. T. Gomez, M. F. Jimenez, J. L. Aranda, N. Novoa, G. Varela. 2012. The risk of death due to cardiorespiratory
causes increases with time after right pneumonectomy: a propensity score-matched analysis. European Journal of Cardio-ThoracicSurgery . [CrossRef]
32. K. J. Meier, L. J. O'Toole. 2012. Subjective Organizational Performance and Measurement Error: Common Source Bias andSpurious Relationships. Journal of Public Administration Research and Theory . [CrossRef]
33. Yuji Akematsu, Masatsugu Tsuji. 2012. Measuring the Effect of Telecare on Medical Expenditures Without Bias Using thePropensity Score Matching Method. Telemedicine and e-Health 18:10, 743-747. [CrossRef]
34. Yiwei Fang, Bill Francis, Iftekhar Hasan, Haizhi Wang. 2012. Product market relationships and cost of bank loans: Evidence fromstrategic alliances. Journal of Empirical Finance 19:5, 653-674. [CrossRef]
35. Ali Bakhtiari, B.P.S. Murthi, Erin Steffes. 2012. Evaluating the Effect of Affinity Card Programs on Customer Profitability UsingPropensity Score Matching. Journal of Interactive Marketing . [CrossRef]
36. Mark M. Pitt. 2012. Gunfight at the Not OK Corral: Reply to ‘High Noon for Microfinance’. Journal of Development Studies48:12, 1886-1891. [CrossRef]
37. VLADIMIR ATANASOV, VLADIMIR IVANOV, KATE LITVAK. 2012. Does Reputation Limit Opportunistic Behavior in theVC Industry? Evidence from Litigation against VCs. The Journal of Finance 67:6, 2215-2246. [CrossRef]
38. Sinan Gemici, Jay W. Rojewski, In Heok Lee. 2012. Use of propensity score matching for training research with observationaldata. International Journal of Training Research 10:3, 219-232. [CrossRef]
39. Armando Silva, Oscar Afonso, Ana Paula Africano. 2012. Which manufacturing firms learn by exporting?. The Journal ofInternational Trade & Economic Development 21:6, 773-805. [CrossRef]
40. Doris Läpple, Thia Hennessy, Carol Newman. 2012. Quantifying the Economic Return to Participatory Extension Programmesin Ireland: an Endogenous Switching Regression Analysis. Journal of Agricultural Economics no-no. [CrossRef]
41. Robert Girtz. 2012. The Effects of Personality Traits on Wages: A Matching Approach. LABOUR 26:4, 455-471. [CrossRef]42. Thomas J. Chemmanur, Karthik Krishnan. 2012. Heterogeneous Beliefs, IPO Valuation, and the Economic Role of the
Underwriter in IPOs. Financial Management 41:4, 769-811. [CrossRef]43. Malcolm Keswell, Justine Burns, Rebecca Thornton. 2012. Evaluating the Impact of Health Programmes on Productivity. African
Development Review 24:4, 302-315. [CrossRef]44. Junichi Ito, Zongshun Bao, Qun Su. 2012. Distributional effects of agricultural cooperatives in China: Exclusion of smallholders
and potential gains on participation. Food Policy 37:6, 700-709. [CrossRef]45. Xi Chen, Jennifer J.J. Clark, Supawadee Naorungroj. 2012. Oral health in older adults with dementia living in different
environments: a propensity analysis. Special Care in Dentistry n/a-n/a. [CrossRef]46. Avi Dor, Siran Koroukian, Fang Xu, Jonah Stulberg, Conor Delaney, Gregory Cooper. 2012. Pricing of surgeries for colon cancer.
Cancer 118:23, 5741-5748. [CrossRef]47. Bariş K. Yörük. 2012. Do Charitable Solicitations Matter? A Comparative Analysis of Fundraising Methods*. Fiscal Studies 33:4,
467-487. [CrossRef]48. Rosario Crinò. 2012. Imported inputs and skill upgrading. Labour Economics 19:6, 957-969. [CrossRef]
49. Mikko Zerni, Elina Haapamäki, Tuukka Järvinen, Lasse Niemi. 2012. Do Joint Audits Improve Audit Quality? Evidence fromVoluntary Joint Audits. European Accounting Review 21:4, 731-765. [CrossRef]
50. JOHN AMMER, SARA B. HOLLAND, DAVID C. SMITH, FRANCIS E. WARNOCK. 2012. U.S. International EquityInvestment. Journal of Accounting Research 50:5, 1109-1139. [CrossRef]
51. Cristina Borra, Almudena Sevilla, Jonathan Gershuny. 2012. Calibrating Time-Use Estimates for the British Household PanelSurvey. Social Indicators Research . [CrossRef]
52. D. M. Konisky, C. Reenock. 2012. Case Selection in Public Management Research: Problems and Solutions. Journal of PublicAdministration Research and Theory . [CrossRef]
53. M. G. Colombo, S. Giannangeli, L. Grilli. 2012. Public subsidies and the employment growth of high-tech start-ups: assessingthe impact of selective and automatic support schemes. Industrial and Corporate Change . [CrossRef]
54. Giovanni Cerulli, Bianca Potì. 2012. Evaluating the robustness of the effect of public subsidies on firms' R&D: an application toItaly. Journal of Applied Economics 15:2, 287-320. [CrossRef]
55. Mark L. DeFond, Xuesong Hu, Mingyi Y. Hung, Siqi Li. 2012. Has the Widespread Adoption of IFRS Reduced U.S. Firms'Attractiveness to Foreign Investors?. Journal of International Accounting Research 11:2, 27-55. [CrossRef]
56. Jasmin Kantarevic, Boris Kralj. 2012. LINK BETWEEN PAY FOR PERFORMANCE INCENTIVES AND PHYSICIANPAYMENT MECHANISMS: EVIDENCE FROM THE DIABETES MANAGEMENT INCENTIVE IN ONTARIO. HealthEconomics n/a-n/a. [CrossRef]
57. Daniel C. Matisoff. 2012. Privatizing Climate Change Policy: Is there a Public Benefit?. Environmental and Resource Economics53:3, 409-433. [CrossRef]
58. Fitsum Hagos, Gayathri Jayasinghe, Seleshi Bekele Awulachew, Mekonnen Loulseged, Aster Denekew Yilma. 2012. Agriculturalwater management and poverty in Ethiopia. Agricultural Economics 43, 99-111. [CrossRef]
59. Ruud Gerards, Joan Muysken, Riccardo Welters. 2012. Active Labour Market Policy by a Profit-Maximizing Firm. British Journalof Industrial Relations n/a-n/a. [CrossRef]
60. Chris L. Gibson, Marc L. Swatt, J. Mitchell Miller, Wesley G. Jennings, Angela R. Gover. 2012. The causal relationship betweengang joining and violent victimization: A critical review and directions for future research. Journal of Criminal Justice 40:6, 490-501.[CrossRef]
61. Allen Blackman, Maria A. Naranjo. 2012. Does eco-certification have environmental benefits? Organic coffee in Costa Rica.Ecological Economics 83, 58-66. [CrossRef]
62. Pratikshya Bohra-Mishra. 2012. Labour migration and investments by remaining households in rural Nepal. Journal of PopulationResearch . [CrossRef]
63. Salim Chahine, Mohamad Jamal Zeidan. 2012. Corporate governance and market performance of parent firms following equitycarve-out announcements. Journal of Management & Governance . [CrossRef]
64. Solomon Asfaw, Leslie Lipper, Timothy J. Dalton, Patrick Audi. 2012. Market participation, on-farm crop diversity and householdwelfare: micro-evidence from Kenya. Environment and Development Economics 17:05, 579-601. [CrossRef]
65. Tommaso Agasisti, Samuele Murtinu. 2012. ‘Perceived’ competition and performance in Italian secondary schools: new evidencefrom OECD–PISA 2006. British Educational Research Journal 38:5, 841-858. [CrossRef]
66. Alpesh Amin, Steven Deitelzweig, Rudell Christian, Keith Friend, Jay Lin, Kathy Belk, Dorothy Baumer, Timothy J. Lowe. 2012.Evaluation of incremental healthcare resource burden and readmission rates associated with hospitalized hyponatremic patients inthe US. Journal of Hospital Medicine 7:8, 634-639. [CrossRef]
67. Mike Mariathasan, Ouarda Merrouche. 2012. Recapitalization, credit and liquidity. Economic Policy 27:72, 603-646. [CrossRef]68. John Ele-Ojo Ataguba, Jane Goudge. 2012. The Impact of Health Insurance on Health-care Utilisation and Out-of-Pocket
Payments in South Africa. The Geneva Papers on Risk and Insurance Issues and Practice 37:4, 633-654. [CrossRef]69. Toman Omar Mahmoud, Rainer Thiele. 2012. Does Prime-Age Mortality Reduce Per-Capita Household Income? Evidence from
Rural Zambia. World Development . [CrossRef]70. Yu Ye, Jason C. Bond, Laura A. Schmidt, Nina Mulia, Tammy W. Tam. 2012. Toward a better understanding of when to apply
propensity scoring: a comparison with conventional regression in ethnic disparities research. Annals of Epidemiology 22:10, 691-697.[CrossRef]
71. P. C. Van Deusen, L. L. Irwin. 2012. Propensity score methods for assessing habitat selection with telemetry data. Forestry 85:4,523-529. [CrossRef]
72. Annelies Deuss. 2012. The Economic Growth Impacts of Sugarcane Expansion in Brazil: An Inter-regional Analysis. Journal ofAgricultural Economics 63:3, 528-551. [CrossRef]
73. Mathieu Bunel, Yannick L'Horty. 2012. The Effects of Reduced Social Security Contributions on Employment: An Evaluationof the 2003 French Reform*. Fiscal Studies 33:3, 371-398. [CrossRef]
74. Terri Friedline, William Elliott, Ilsung Nam. 2012. Predicting savings and mental accounting among adolescents: The case ofcollege. Children and Youth Services Review 34:9, 1884-1895. [CrossRef]
75. David T. Butry. 2012. Comparing the performance of residential fire sprinklers with other life-safety technologies. Accident Analysis& Prevention 48, 480-494. [CrossRef]
76. Solomon Asfaw, Menale Kassie, Franklin Simtowe, Leslie Lipper. 2012. Poverty Reduction Effects of Agricultural TechnologyAdoption: A Micro-evidence from Rural Tanzania. Journal of Development Studies 48:9, 1288-1305. [CrossRef]
77. Meng-Wen Wu, Chung-Hua Shen, Chin-Hwa Lu, Chia-Chung Chan. 2012. Impact of Foreign Strategic Investors on EarningsManagement in Chinese Banks. Emerging Markets Finance and Trade 48:5, 115-133. [CrossRef]
78. CEM DEMIROGLU, CHRISTOPHER JAMES, ATAY KIZILASLAN. 2012. Bank Lending Standards and Access to Lines ofCredit. Journal of Money, Credit and Banking 44:6, 1063-1089. [CrossRef]
79. Rachel M. Krause. 2012. An Assessment of the Impact that Participation in Local Climate Networks Has on Cities’ Implementationof Climate, Energy, and Transportation Policies. Review of Policy Research 29:5, 585-604. [CrossRef]
80. Md. Akhtaruzzaman Khan, Md. Ferdous Alam, Khan Jahirul Islam. 2012. The impact of co-management on household income andexpenditure: An empirical analysis of common property fishery resource management in Bangladesh. Ocean & Coastal Management65, 67-78. [CrossRef]
81. Kent Eliasson, Pär Hansson, Markus Lindvert. 2012. Do firms learn by exporting or learn to export? Evidence from small andmedium-sized enterprises. Small Business Economics 39:2, 453-472. [CrossRef]
82. Nobuhiro Hosoe, Shingo Takagi. 2012. Retail power market competition with endogenous entry decision—An auction dataanalysis. Journal of the Japanese and International Economies 26:3, 351-368. [CrossRef]
83. Robert Zymek. 2012. Sovereign Default, International Lending, and Trade. IMF Economic Review 60:3, 365-394. [CrossRef]84. ELIANA V. JIMENEZ-SOTO, RICHARD P. C. BROWN. 2012. Assessing the Poverty Impacts of Migrants’ Remittances Using
Propensity Score Matching: The Case of Tonga*. Economic Record 88:282, 425-439. [CrossRef]85. M. Pettinari, P. Sergeant, B. Meuris. 2012. Quantification of operational learning in off-pump coronary bypass. European Journal
of Cardio-Thoracic Surgery . [CrossRef]86. Michael Ostermann. 2012. Recidivism and the Propensity to Forgo Parole Release. Justice Quarterly 29:4, 596-618. [CrossRef]87. Akhter Ali, Muhammad Sharif. 2012. Impact of farmer field schools on adoption of integrated pest management practices among
cotton farmers in Pakistan. Journal of the Asia Pacific Economy 17:3, 498-513. [CrossRef]88. Evžen Kočenda, Jan Hanousek. 2012. State ownership and control in the Czech Republic. Economic Change and Restructuring
45:3, 157-191. [CrossRef]89. Shenggen Fan, Lixing Li, Xiaobo Zhang. 2012. Challenges of creating cities in China: Lessons from a short-lived county-to-city
upgrading policy. Journal of Comparative Economics 40:3, 476-491. [CrossRef]90. Rebekah Levine Coley, Caitlin McPherran Lombardi. 2012. Early maternal employment and childhood obesity among
economically disadvantaged families in the USA. Early Child Development and Care 182:8, 983-998. [CrossRef]91. Xiangping Liu, Danijel Nestic, Tomislav Vukina. 2012. ESTIMATING ADVERSE SELECTION AND MORAL HAZARD
EFFECTS WITH HOSPITAL INVOICES DATA IN A GOVERNMENT-CONTROLLED HEALTHCARE SYSTEM.Health Economics 21:8, 883-901. [CrossRef]
92. Peter Thisted Dinesen. 2012. Does Generalized (Dis)Trust Travel? Examining the Impact of Cultural Heritage and Destination-Country Environment on Trust of Immigrants. Political Psychology 33:4, 495-511. [CrossRef]
93. Olivier Bertrand, Marie-Ann Betschinger. 2012. Performance of domestic and cross-border acquisitions: Empirical evidence fromRussian acquirers. Journal of Comparative Economics 40:3, 413-437. [CrossRef]
94. Cristina Borra, Maria Iacovou, Almudena Sevilla. 2012. The effect of breastfeeding on children's cognitive and noncognitivedevelopment. Labour Economics 19:4, 496-515. [CrossRef]
95. C. Lockwood Reynolds. 2012. Where to attend? Estimating the effects of beginning college at a two-year institution. Economicsof Education Review 31:4, 345-362. [CrossRef]
96. Walter L. Leite, Robert Sandbach, Rong Jin, Jann W. MacInnes, M. Grace-Anne Jackman. 2012. An Evaluation of Latent GrowthModels for Propensity Score Matched Groups. Structural Equation Modeling: A Multidisciplinary Journal 19:3, 437-456. [CrossRef]
97. Allen Blackman. 2012. Does eco-certification boost regulatory compliance in developing countries? ISO 14001 in Mexico. Journalof Regulatory Economics . [CrossRef]
98. René Tapsoba. 2012. Do National Numerical Fiscal Rules really shape fiscal behaviours in developing countries? A treatment effectevaluation. Economic Modelling 29:4, 1356-1369. [CrossRef]
99. Zelalem Yilma, Luuk van Kempen, Thomas de Hoop. 2012. A perverse ‘net’ effect? Health insurance and ex-ante moral hazardin Ghana. Social Science & Medicine 75:1, 138-147. [CrossRef]
100. Henry Jarva. 2012. Economic consequences of SFAS 142 goodwill write-offs. Accounting & Finance no-no. [CrossRef]101. Rebecca Casciano, Douglas S. Massey. 2012. Neighborhood disorder and individual economic self-sufficiency: New evidence from
a quasi-experimental study. Social Science Research 41:4, 802-819. [CrossRef]102. Chirag Shah, J. Ben Wilkinson, Maureen Lyden, Alfred Mbah, Martin Keisch, Peter Beitsch, Frank A. Vicini. 2012. Comparison
of survival and regional failure between accelerated partial breast irradiation and whole breast irradiation. Brachytherapy 11:4,311-315. [CrossRef]
103. Marc F. Bellemare. 2012. As You Sow, So Shall You Reap: The Welfare Impacts of Contract Farming. World Development 40:7,1418-1434. [CrossRef]
104. Helder Ferreira de Mendonça, Gustavo José de Guimarães e Souza. 2012. Is inflation targeting a good remedy to control inflation?.Journal of Development Economics 98:2, 178-191. [CrossRef]
105. Sarah Borgloh, Peter Westerheide. 2012. The Impact of Mutual Support Based Housing Projects on the Costs of Care. HousingStudies 27:5, 620-642. [CrossRef]
106. Veronika J. Wirtz, Yared Santa-Ana-Tellez, Edson Servan-Mori, Leticia Avila-Burgos. 2012. Heterogeneous Effects of HealthInsurance on Out-of-Pocket Expenditure on Medicines in Mexico. Value in Health 15:5, 593-603. [CrossRef]
107. Julan DU, Yi LU, Zhigang TAO, Linhui YU. 2012. Do domestic and foreign exporters differ in learning by exporting? Evidencefrom China. China Economic Review 23:2, 296-315. [CrossRef]
108. Christophe Béné, Stephen Devereux, Rachel Sabates-Wheeler. 2012. Shocks and social protection in the Horn of Africa: analysisfrom the Productive Safety Net programme in Ethiopia. IDS Working Papers 2012:395, 1-120. [CrossRef]
109. A.A. Akinola, N.A. Sofoluwe. 2012. Impact of mulching technology adoption on output and net return to yam farmers in OsunState, Nigeria. Agrekon 51:2, 75-92. [CrossRef]
110. Onur Bayar, Thomas J. Chemmanur. 2012. What drives the valuation premium in IPOs versus acquisitions? An empirical analysis.Journal of Corporate Finance 18:3, 451-475. [CrossRef]
111. G. Fang, J. M. Brooks, E. A. Chrischilles. 2012. Comparison of Instrumental Variable Analysis Using a New Instrument WithRisk Adjustment Methods to Reduce Confounding by Indication. American Journal of Epidemiology 175:11, 1142-1151. [CrossRef]
112. Sonja Gensler, Peter Leeflang, Bernd Skiera. 2012. Impact of online channel use on customer revenues and costs to serve:Considering product portfolios and self-selection. International Journal of Research in Marketing 29:2, 192-201. [CrossRef]
113. Deven Carlson, Robert Haveman, Thomas Kaplan, Barbara Wolfe. 2012. Long-term effects of public low-income housing voucherson neighborhood quality and household composition. Journal of Housing Economics 21:2, 101-120. [CrossRef]
114. Giuseppe Scellato, Elisa Ughetto. 2012. Real effects of private equity investments: Evidence from European buyouts. Journal ofBusiness Research . [CrossRef]
115. Prabal K. De, Dilip Ratha. 2012. Impact of remittances on household income, asset and human capital: evidence from Sri Lanka.Migration and Development 1:1, 163-179. [CrossRef]
116. Kindie GETNET, Tsegaye ANULLO. 2012. AGRICULTURAL COOPERATIVES AND RURAL LIVELIHOODS:EVIDENCE FROM ETHIOPIA. Annals of Public and Cooperative Economics 83:2, 181-198. [CrossRef]
117. Scott Holupka, Sandra J. Newman. 2012. The Effects of Homeownership on Children's Outcomes: Real Effects or Self-Selection?.Real Estate Economics no-no. [CrossRef]
118. Manjiri Pawaskar, Qian Li, Matthew W. Reynolds. 2012. Metabolic outcomes of elderly patient populations initiating exenatideBID versus insulin glargine in an ambulatory care setting. Current Medical Research and Opinion 28:6, 991-997. [CrossRef]
119. Kornelius Kraft, Julia Lang. 2012. Profit Sharing and Training*. Oxford Bulletin of Economics and Statistics no-no. [CrossRef]120. Nidhi Khattri, Cristina Ling, Shreyasi Jha. 2012. The effects of school-based management in the Philippines: an initial assessment
using administrative data. Journal of Development Effectiveness 4:2, 277-295. [CrossRef]121. Alfred K. Mbah, Amina P. Alio, Doris W. Fombo, Karen Bruder, Getachew Dagne, Hamisu M. Salihu. 2012. Association
between cocaine abuse in pregnancy and placenta-associated syndromes using propensity score matching approach. Early HumanDevelopment 88:6, 333-337. [CrossRef]
122. Tarja Viitanen. 2012. The motherhood wage gap in the UK over the life cycle. Review of Economics of the Household . [CrossRef]123. Jane T. Bertrand, Stella Babalola, Joanna SkinnerThe Impact of Health Communication Programs 95-120. [CrossRef]
124. E. J. O. Rao, B. Brummer, M. Qaim. 2012. Farmer Participation in Supermarket Channels, Production Technology, and Efficiency:The Case of Vegetables in Kenya. American Journal of Agricultural Economics . [CrossRef]
125. Katsushi S. Imai, MD. Shafiul Azam. 2012. Does Microfinance Reduce Poverty in Bangladesh? New Evidence from HouseholdPanel Data. Journal of Development Studies 48:5, 633-653. [CrossRef]
126. Thorsten Schlomm, Pierre Tennstedt, Caroline Huxhold, Thomas Steuber, Georg Salomon, Uwe Michl, Hans Heinzer, JensHansen, Lars Budäus, Stefan Steurer, Corinna Wittmer, Sarah Minner, Alexander Haese, Guido Sauter, Markus Graefen, HartwigHuland. 2012. Neurovascular Structure-adjacent Frozen-section Examination (NeuroSAFE) Increases Nerve-sparing Frequencyand Reduces Positive Surgical Margins in Open and Robot-assisted Laparoscopic Radical Prostatectomy: Experience After 11 069Consecutive Patients. European Urology . [CrossRef]
127. Claudio Cozza, Franco Malerba, Maria Luisa Mancusi, Giulio Perani, Andrea Vezzulli. 2012. Innovation, profitability and growthin medium and high-tech manufacturing industries: evidence from Italy. Applied Economics 44:15, 1963-1976. [CrossRef]
128. D. MARK ANDERSON. 2012. THE IMPACT OF HIV EDUCATION ON BEHAVIOR AMONG YOUTHS: APROPENSITY SCORE MATCHING APPROACH. Contemporary Economic Policy no-no. [CrossRef]
129. Barnabas Kiiza, Glenn Pederson. 2012. ICT-based market information and adoption of agricultural seed technologies: Insightsfrom Uganda. Telecommunications Policy 36:4, 253-259. [CrossRef]
130. Fuhua Zhai, C. Cybele Raver, Stephanie M. Jones. 2012. Academic performance of subsequent schools and impacts of earlyinterventions: Evidence from a randomized controlled trial in Head Start settings. Children and Youth Services Review 34:5, 946-954.[CrossRef]
131. Ephraim Nkonya, Dayo Phillip, Tewodaj Mogues, John Pender, Edward Kato. 2012. Impacts of Community-driven DevelopmentPrograms on Income and Asset Acquisition in Africa: The Case of Nigeria. World Development . [CrossRef]
132. Pradyot Ranjan Jena, Bezawit Beyene Chichaibelu, Till Stellmacher, Ulrike Grote. 2012. The impact of coffee certification onsmall-scale producers’ livelihoods: a case study from the Jimma Zone, Ethiopia. Agricultural Economics no-no. [CrossRef]
133. Shammima Jesmin, Amardeep Thind, Sisira Sarma. 2012. Does team-based primary health care improve patients’ perception ofoutcomes? Evidence from the 2007–08 Canadian Survey of Experiences with Primary Health. Health Policy 105:1, 71-83. [CrossRef]
134. Laura Juznik Rotar. 2012. Evaluating the Effectiveness of an Institutional Training Program in Slovenia: A Comparison ofMethods. South East European Journal of Economics and Business 7:1, 43-51. [CrossRef]
135. Barış K. Yörük. 2012. The Effect of Media on Charitable Giving and Volunteering: Evidence from the “Give Five” Campaign.Journal of Policy Analysis and Management n/a-n/a. [CrossRef]
136. Jessica A. Myers, Thomas A. Louis. 2012. Comparing treatments via the propensity score: stratification or modeling?. HealthServices and Outcomes Research Methodology . [CrossRef]
137. Chunhao Tu, Woon Yuen Koh, Shuo Jiao. 2012. Using generalized doubly robust estimator to estimate average treatment effectsof multiple treatments in observational studies. Journal of Statistical Computation and Simulation 1-9. [CrossRef]
138. Rebecca Casciano, Douglas S. Massey. 2012. Neighborhood disorder and anxiety symptoms: New evidence from a quasi-experimental study. Health & Place 18:2, 180-190. [CrossRef]
139. Sonja Gensler, Peter Leeflang, Bernd Skiera. 2012. Comparing methods to separate treatment from self-selection effects in anonline banking setting. Journal of Business Research . [CrossRef]
140. RICHARD HARRIS, QIAN CHER LI, JOHN MOFFAT. 2012. THE IMPACT OF HIGHER EDUCATIONINSTITUTION-FIRM KNOWLEDGE LINKS ON ESTABLISHMENT-LEVEL PRODUCTIVITY IN BRITISHREGIONS*. The Manchester School no-no. [CrossRef]
141. M. M. Reynolds, D. Brady. 2012. Bringing You More Than the Weekend: Union Membership and Self-rated Health in theUnited States. Social Forces 90:3, 1023-1049. [CrossRef]
142. Anca M. Cotet, Daniel K. Benjamin. 2012. MEDICAL REGULATION AND HEALTH OUTCOMES: THE EFFECT OFTHE PHYSICIAN EXAMINATION REQUIREMENT. Health Economics n/a-n/a. [CrossRef]
143. Silvio Vismara, Stefano Paleari, Jay R. Ritter. 2012. Europe's Second Markets for Small Companies. European FinancialManagement no-no. [CrossRef]
144. Jörg-Markus Hitz, Jürgen Ernstberger, Michael Stich. 2012. Enforcement of Accounting Standards in Europe: Capital-Market-Based Evidence for the Two-Tier Mechanism in Germany. European Accounting Review 1-29. [CrossRef]
145. A. Jaklič, J. Ćirjaković, A. Chidlow. 2012. Exploring the effects of international sourcing on manufacturing versus service firms.The Service Industries Journal 1-15. [CrossRef]
146. Giusy Cannone, Elisa Ughetto. 2012. Funding Innovation at Regional Level: An Analysis of a Public Policy Intervention in thePiedmont Region. Regional Studies 1-14. [CrossRef]
147. Manjiri Pawaskar, Qian Li, Byron J. Hoogwerf, Matthew W. Reynolds, Doug Faries, William Engelman, David Bruhn, RichardM. Bergenstal. 2012. METABOLIC OUTCOMES OF MATCHED PATIENT POPULATIONS INITIATING EXENATIDEBID VERSUS INSULIN GLARGINE IN AN AMBULATORY CARE SETTING. Diabetes, Obesity and Metabolism no-no.[CrossRef]
148. Sankar Mukhopadhyay, David Oxborrow. 2012. The Value of an Employment-Based Green Card. Demography 49:1, 219-237.[CrossRef]
149. Manuel Eisner, Daniel Nagin, Denis Ribeaud, Tina Malti. 2012. Effects of a Universal Parenting Program for Highly AdherentParents: A Propensity Score Matching Approach. Prevention Science . [CrossRef]
150. Evzen Kocenda, Jan Hanousek. 2012. Firm break-up and performance. Economics of Governance . [CrossRef]151. Maria Isabella Leone, Toke Reichstein. 2012. Licensing-in fosters rapid invention! the effect of the grant-back clause and
technological unfamiliarity. Strategic Management Journal n/a-n/a. [CrossRef]152. Christiane Spiel, Dagmar Strohmeier. 2012. Evidence-based practice and policy: When researchers, policy makers, and practitioners
learn how to work together. European Journal of Developmental Psychology 9:1, 150-162. [CrossRef]153. Nichamon Thongphat. 2012. A Survey of Thai Student Performance in Mathematics and English: Evaluating the Effect of
Supplementary Tutoring. Procedia Economics and Finance 2, 353-362. [CrossRef]154. Renate Neubäumer. 2012. Bringing the unemployed back to work in Germany: training programs or wage subsidies?. International
Journal of Manpower 33:2, 159-177. [CrossRef]155. Jeffrey G Jarvik, Bryan A Comstock, Brian W Bresnahan, Srdjan S Nedeljkovic, David R Nerenz, Zoya Bauer, Andrew L Avins,
Kathryn James, Judith A Turner, Patrick Heagerty, Larry Kessler, Janna L Friedly, Sean D Sullivan, Richard A Deyo. 2012. Studyprotocol: The back pain outcomes using longitudinal data (BOLD) registry. BMC Musculoskeletal Disorders 13:1, 64. [CrossRef]
156. Nuttamon Teerakul, Renato A. Villano, Fiona Q. Wood, Stuart W. Mounter. 2012. A framework for assessing the impacts ofcommunity-based enterprises on household poverty. Journal of Enterprising Communities: People and Places in the Global Economy6:1, 5-27. [CrossRef]
157. Thierry Hanh, Patrick Serog, Jérôme Fauconnier, Pierre Batailler, Florence Mercier, Christian F. Roques, Patrick Blin. 2012. One-Year Effectiveness of a 3-Week Balneotherapy Program for the Treatment of Overweight or Obesity. Evidence-Based Complementaryand Alternative Medicine 2012, 1-7. [CrossRef]
158. Romain Pirracchio, Matthieu Resche-Rigon, Sylvie Chevret. 2012. Evaluation of the Propensity score methods for estimatingmarginal odds ratios in case of small sample size. BMC Medical Research Methodology 12:1, 70. [CrossRef]
159. S. Benin, E. Nkonya, G. Okecho, J. Randriamamonjy, E. Kato, G. Lubade, M. Kyotalimye. 2012. Impact of the NationalAgricultural Advisory Services (Naads) program of Uganda: Considering Different Levels of Likely Contamination with theTreatment. American Journal of Agricultural Economics 94:2, 386-392. [CrossRef]
160. Andr Uhde, Christian Farruggio, Tobias C. Michalak. 2012. Wealth Effects of Credit Risk Securitization in European Banking.Journal of Business Finance & Accounting 39:1-2, 193-228. [CrossRef]
161. Anita Alves Pena. 2012. Undocumented immigration and the business of farm labor contracting in the USA. American Journalof Business 27:1, 10-26. [CrossRef]
162. BRIAN GOFF, ALEX LEBEDINSKY, STEPHEN LILE. 2012. A MATCHED PAIRS ANALYSIS OF STATE GROWTHDIFFERENCES. Contemporary Economic Policy 30:2, 293. [CrossRef]
163. Antonio Accetturo, Guido de Blasio. 2012. Policies for local development: An evaluation of Italy's “Patti Territoriali”. RegionalScience and Urban Economics 42:1-2, 15-26. [CrossRef]
164. Nguyen Thanh, Lars Lindholm. 2012. Has Vietnam Health care funds for the poor policy favored the elderly poor?. BMC HealthServices Research 12:1, 333. [CrossRef]
165. Kathryn E. Rouse. 2012. The Impact of High School Leadership on Subsequent Educational Attainment*. Social Science Quarterlyn/a-n/a. [CrossRef]
166. Tu N. Dang. 2011. Evaluating the effectiveness of exchange rate bands in reducing inflation. Macroeconomics and Finance inEmerging Market Economies 1-20. [CrossRef]
167. Chang-Soo Kim. 2011. Effect of Group Affiliation on Investments: Evidence from the Global Economic Crisis*. Asia-Pacific Journalof Financial Studies 40:6, 799-823. [CrossRef]
168. Di Mo, Hongmei Yi, Linxiu Zhang, Yaojiang Shi, Scott Rozelle, Alexis Medina. 2011. Transfer paths and academic performance:The primary school merger program in china. International Journal of Educational Development . [CrossRef]
169. Patricia Augier, Marion Dovis. 2011. Does export-market participation improve productivity? Evidence from Spanishmanufacturing firms. The Journal of International Trade & Economic Development 1-29. [CrossRef]
170. Tereza Tykvová, Mariela Borell. 2011. Do private equity owners increase risk of financial distress and bankruptcy?. Journal ofCorporate Finance . [CrossRef]
171. References 643-654. [CrossRef]172. David Paton, Leighton Vaughan Williams. 2011. Do New Gambling Products Displace Old? Evidence from a Postcode Analysis.
Regional Studies 1-11. [CrossRef]173. William A. Pizer, Richard Morgenstern, Jhih-Shyang Shih. 2011. The performance of industrial sector voluntary climate
programs: Climate Wise and 1605(b). Energy Policy . [CrossRef]174. Martin Huber. 2011. Testing for covariate balance using quantile regression and resampling methods. Journal of Applied Statistics
1-19. [CrossRef]175. Shujing Li, Jiaping Qiu, Chi Wan. 2011. Corporate globalization and bank lending. Journal of International Business Studies .
[CrossRef]176. Tatiana Melguizo, Gregory C. Wolniak. 2011. The Earnings Benefits of Majoring in STEM Fields Among High Achieving
Minority Students. Research in Higher Education . [CrossRef]177. Pierre Azoulay, Joshua S. Graff Zivin, Gustavo Manso. 2011. Incentives and creativity: evidence from the academic life sciences.
The RAND Journal of Economics 42:3, 527-554. [CrossRef]178. Alejandra Mizala, Pilar Romaguera, Sebastián Gallegos. 2011. Public–private wage gap in Latin America (1992–2007): A matching
approach. Labour Economics . [CrossRef]179. Mark L. Humphery-Jenner. 2011. Internal and external discipline following securities class actions. Journal of Financial
Intermediation . [CrossRef]180. Inha Oh, Jeong-Dong Lee. 2011. Comparison of Effects from Different Institutions: Public Credit Guarantee in Korea*. Asian
Economic Journal 25:3, 331-353. [CrossRef]181. Ravi Hegde, Gary Q. Bull. 2011. Performance of an agro-forestry based Payments-for-Environmental-Services project in
Mozambique: A household level analysis. Ecological Economics . [CrossRef]182. T. Gantumur, A. Stephan. 2011. Mergers & acquisitions and innovation performance in the telecommunications equipment
industry. Industrial and Corporate Change . [CrossRef]183. Romina Cavatassi, Mario González-flores, Paul Winters, Jorge Andrade-Piedra, Patricio Espinosa, Graham Thiele. 2011. Linking
Smallholders to the New Agricultural Economy: The Case of the Plataformas de Concertación in Ecuador. Journal of DevelopmentStudies 1-29. [CrossRef]
184. S. M. Iacus, G. King, G. Porro. 2011. Causal Inference without Balance Checking: Coarsened Exact Matching. Political Analysis. [CrossRef]
185. C. D. Meyerhoefer, M. Yang. 2011. The Relationship between Food Assistance and Health: A Review of the Literature andEmpirical Strategies for Identifying Program Effects. Applied Economic Perspectives and Policy . [CrossRef]
186. Xiangzheng Deng, Jikun Huang, Qiuqiong Huang, Scott Rozelle, John Gibson. 2011. Do roads lead to grassland degradation orrestoration? A case study in Inner Mongolia, China. Environment and Development Economics 1-23. [CrossRef]
187. Sheng-Syan Chen, I-Ju Chen. 2011. Inefficient Investment and the Diversification Discount: Evidence from Corporate AssetPurchases. Journal of Business Finance & Accounting no-no. [CrossRef]
188. Xia Li, Christopher Gan, Baiding Hu. 2011. The welfare impact of microcredit on rural households in China. The Journal ofSocio-Economics 40:4, 404-411. [CrossRef]
189. Jocelyn Evans, Lin Tan, Weishen Wang. 2011. Comprehensive Study of the Stock Market’s Reaction to Fairness Opinions. TheJournal of Investing 20:3, 75-84. [CrossRef]
190. Matteo P. Arena, Stephen P. Ferris, Emre Unlu. 2011. It Takes Two: The Incidence and Effectiveness of Co-CEOs. FinancialReview 46:3, 385-412. [CrossRef]
191. Arthur Grimes, Cleo Ren, Philip Stevens. 2011. The need for speed: impacts of internet connectivity on firm productivity. Journalof Productivity Analysis . [CrossRef]
192. L. A. Meret-Hanke. 2011. Effects of the Program of All-Inclusive Care for the Elderly on Hospital Use. The Gerontologist .[CrossRef]
193. R. Harris, Q. C. Li, J. Moffat. 2011. The impact of higher education institution-firm knowledge links on firm-level productivityin Britain. Applied Economics Letters 1-4. [CrossRef]
194. Paolo Naticchioni,, Silvia Loriga,. 2011. Short and Long Term Evaluations of Public Employment Services in Italy. AppliedEconomics Quarterly 57:3, 201-229. [CrossRef]
195. Paul Hindsley, Craig E. Landry, Brad Gentner. 2011. Addressing onsite sampling in recreation site choice models. Journal ofEnvironmental Economics and Management 62:1, 95-110. [CrossRef]
196. Marlon G. Boarnet. 2011. A Broader Context for Land Use and Travel Behavior, and a Research Agenda. Journal of the AmericanPlanning Association 77:3, 197-213. [CrossRef]
197. Deven Carlson, Robert Haveman, Tom Kaplan, Barbara Wolfe. 2011. Long-term earnings and employment effects of housingvoucher receipt. Journal of Urban Economics . [CrossRef]
198. K. Davis, E. Nkonya, E. Kato, D.A. Mekonnen, M. Odendo, R. Miiro, J. Nkuba. 2011. Impact of Farmer Field Schools onAgricultural Productivity and Poverty in East Africa. World Development . [CrossRef]
199. Stephanie Cosner Berzin, Alison M. Rhodes, Marah A. Curtis. 2011. Housing experiences of former foster youth: How do theyfare in comparison to other youth?. Children and Youth Services Review . [CrossRef]
200. Yujun Lian, Zhi Su, Yuedong Gu. 2011. Evaluating the effects of equity incentives using PSM: Evidence from China. Frontiersof Business Research in China 5:2, 266-290. [CrossRef]
201. Benedito Cunguara, Ika Darnhofer. 2011. Assessing the impact of improved agricultural technologies on household income inrural Mozambique. Food Policy 36:3, 378-390. [CrossRef]
202. Junichi Nishimura, Hiroyuki Okamuro. 2011. Subsidy and networking: The effects of direct and indirect support programs ofthe cluster policy. Research Policy 40:5, 714-727. [CrossRef]
203. Rui Baptista, Francisco Lima, Joana Mendonça. 2011. Establishment of higher education institutions and new firm entry. ResearchPolicy 40:5, 751-760. [CrossRef]
204. B. Cunguara, K. Moder. 2011. Is Agricultural Extension Helping the Poor? Evidence from Rural Mozambique. Journal of AfricanEconomies . [CrossRef]
205. Haiyan Bai. 2011. Using Propensity Score Analysis for Making Causal Claims in Research Articles. Educational Psychology Review. [CrossRef]
206. DAVID DREYER LASSEN, SØREN SERRITZLEW. 2011. Jurisdiction Size and Local Democracy: Evidence on InternalPolitical Efficacy from Large-scale Municipal Reform. American Political Science Review 1-21. [CrossRef]
207. Menale Kassie, Bekele Shiferaw, Geoffrey Muricho. 2011. Agricultural Technology, Crop Income, and Poverty Alleviation inUganda. World Development . [CrossRef]
208. Andrew Dillon. 2011. The Effect of Irrigation on Poverty Reduction, Asset Accumulation, and Informal Insurance: Evidence fromNorthern Mali. World Development . [CrossRef]
209. Menale Kassie, Gunnar Köhlin, Randy Bluffstone, Stein Holden. 2011. Are soil conservation technologies “win-win?” A case studyof Anjeni in the north-western Ethiopian highlands. Natural Resources Forum no-no. [CrossRef]
210. Bevin Ashenmiller. 2011. The Effect of Bottle Laws on Income: New Empirical Results. American Economic Review 101:3, 60-64.[CrossRef]
211. Marcus Kirk. 2011. Research for sale: Determinants and consequences of paid-for analyst research☆. Journal of Financial Economics100:1, 182-200. [CrossRef]
212. GESINE STEPHAN, ANDRÉ PAHNKE. 2011. THE RELATIVE EFFECTIVENESS OF SELECTED ACTIVE LABORMARKET PROGRAMS: AN EMPIRICAL INVESTIGATION FOR GERMANY*. The Manchester School no-no. [CrossRef]
213. Sandhya Mehta, Hua Chen, Michael Johnson, Rajender R. Aparasu. 2011. Risk of Serious Cardiac Events in Older Adults UsingAntipsychotic Agents. The American Journal of Geriatric Pharmacotherapy 9:2, 120-132. [CrossRef]
214. Michael Lechner, Ruth Miquel, Conny Wunsch. 2011. LONG-RUN EFFECTS OF PUBLIC SECTOR SPONSOREDTRAINING IN WEST GERMANY. Journal of the European Economic Association no-no. [CrossRef]
215. I. D’Attoma, F. Camillo. 2011. A multivariate strategy to measure and test global imbalance in observational studies. Expert Systemswith Applications 38:4, 3451-3460. [CrossRef]
216. Stephen B. Billings. 2011. Estimating the value of a new transit option. Regional Science and Urban Economics . [CrossRef]217. A. Islam. 2011. Medium- and Long-Term Participation in Microcredit: An Evaluation Using a New Panel Dataset from
Bangladesh. American Journal of Agricultural Economics . [CrossRef]218. STEPHEN B. BILLINGS, J. SCOTT HOLLADAY. 2011. SHOULD CITIES GO FOR THE GOLD? THE LONG-TERM
IMPACTS OF HOSTING THE OLYMPICS. Economic Inquiry no-no. [CrossRef]219. Fuhua Zhai, Jane Waldfogel, Jeanne Brooks-Gunn. 2011. Estimating the Effects of Head Start on Parenting and Child
Maltreatment. Children and Youth Services Review . [CrossRef]
220. Wenjie Chen. 2011. The effect of investor origin on firm performance: Domestic and foreign direct investment in the UnitedStates☆. Journal of International Economics 83:2, 219-228. [CrossRef]
221. Gregory Berg. 2011. An application of kernel-based versus one-to-one propensity score matching for a nonexperimental causalstudy: example from a disease management program evaluation. Applied Economics Letters 18:5, 439-447. [CrossRef]
222. Thomas J. Miceli, Henry J. Munneke, C.F. Sirmans, Geoffrey K. Turnbull. 2011. A Question of Title: Property Rights and AssetValues. Regional Science and Urban Economics . [CrossRef]
223. M. S. Levendusky. 2011. Rethinking the Role of Political Information. Public Opinion Quarterly . [CrossRef]224. Eeshani Kandpal. 2011. Beyond Average Treatment Effects: Distribution of Child Nutrition Outcomes and Program Placement
in India’s ICDS. World Development . [CrossRef]225. M. Maertens, L. Colen, J. F. M. Swinnen. 2011. Globalisation and poverty in Senegal: a worst case scenario?. European Review
of Agricultural Economics . [CrossRef]226. Alex Acworth, Nicolas de Roos, Hajime Katayama. 2011. Substance use and adolescent sexual activity. Applied Economics 1-13.
[CrossRef]227. Howard S. Friedman, Srinivasan Rajagopalan, Jaime P. Barnes, Hal Roseman. 2011. Combination Therapy With Ezetimibe/
Simvastatin Versus Statin Monotherapy for Low-Density Lipoprotein Cholesterol Reduction and Goal Attainment in a Real-World Clinical Setting. Clinical Therapeutics 33:2, 212-224. [CrossRef]
228. Mine Ertugrul, Karthik Krishnan. 2011. Can CEO dismissals be proactive?. Journal of Corporate Finance 17:1, 134-151. [CrossRef]229. Po Yang. 2011. The Impact of Financial Aid on Learning, Career Decisions, and Employment. Chinese Education & Society 44:1,
27-57. [CrossRef]230. Roberto Antonietti, Davide Antonioli. 2011. The impact of production offshoring on the skill composition of manufacturing
firms: evidence from Italy. International Review of Applied Economics 25:1, 87-105. [CrossRef]231. Barnabas Kiiza, Glenn Pederson, Stephen Lwasa. 2011. The Role of Market Information in Adoption of Agricultural Seed
Technology in Rural Uganda. International Journal of ICT Research and Development in Africa 2:1, 29-46. [CrossRef]232. Sudheer Chava, Amiyatosh Purnanandam. 2011. The effect of banking crisis on bank-dependent borrowers☆. Journal of Financial
Economics 99:1, 116-135. [CrossRef]233. Jennifer L. Blouin. 2011. DISCUSSION OF Do Debt Constraints Influence Firms' Sensitivity to a Temporary Tax Holiday on
Repatriations?. Journal of the American Taxation Association 33:2, 29. [CrossRef]234. Suneetha Kadiyala, Beatrice Rogers, Agnes Quisumbing, Patrick Webb. 2011. The effect of prime age adult mortality on household
composition and consumption in rural Ethiopia. Food Policy . [CrossRef]235. Kim P. Huynh, David T. Jacho-Chávez, Marcel C. VoiaNonlinear Difference-in-Difference Treatment Effect Estimation: A
Distributional Analysis 27, 247-268. [CrossRef]236. Gabriel V. Montes-Rojas. 2011. Nonparametric Estimation of ATE and QTE: An Application of Fractile Graphical Analysis.
Journal of Probability and Statistics 2011, 1-23. [CrossRef]237. Jasmin Kantarevic, Boris Kralj, Darrel Weinkauf. 2011. Enhanced fee-for-service model and physician productivity: Evidence from
Family Health Groups in Ontario. Journal of Health Economics 30:1, 99-111. [CrossRef]238. Pilar García-Gómez. 2011. Institutions, health shocks and labour market outcomes across Europe. Journal of Health Economics
30:1, 200-213. [CrossRef]239. Xiangzheng Deng, Jikun Huang, Emi Uchida, Scott Rozelle, John Gibson. 2011. Pressure cookers or pressure valves: Do roads
lead to deforestation in China?. Journal of Environmental Economics and Management 61:1, 79-94. [CrossRef]240. Kathryn C. Monahan, Joanna M. Lee, Laurence Steinberg. 2011. Revisiting the Impact of Part-Time Work on Adolescent
Adjustment: Distinguishing Between Selection and Socialization Using Propensity Score Matching. Child Development 82:1,96-112. [CrossRef]
241. Ronald W. Masulis, Rajarishi Nahata. 2010. Venture Capital Conflicts of Interest: Evidence from Acquisitions of Venture BackedFirms. Journal of Financial and Quantitative Analysis 1-52. [CrossRef]
242. Daniel E. Ho, Donald B. Rubin. 2010. Credible Causal Inference for Empirical Legal Studies. Annual Review of Law and SocialScience 7:1, 110301100413081. [CrossRef]
243. Monica Escaleras, Shu Lin, Charles Register. 2010. Freedom of information acts and public sector corruption. Public Choice145:3-4, 435-460. [CrossRef]
244. Brian V. Carolan. 2010. Estimating the Effects of Students’ Social Networks: Does Attending a Norm-Enforcing School Pay Off?.The Urban Review 42:5, 422-440. [CrossRef]
245. Hala Abou-Ali, Hesham El-Azony, Heba El-Laithy, Jonathan Haughton, Shahid Khandker. 2010. Evaluating the impact ofEgyptian Social Fund for Development programmes. Journal of Development Effectiveness 2:4, 521-555. [CrossRef]
246. Ranjeeta Thomas, Andrew Jones, Lyn Squire. 2010. Methods for Evaluating Innovative Health Programs: a multi-country study.Journal of Development Effectiveness 2:4, 504-520. [CrossRef]
247. Sourafel Girma, Holger Görg, Aoife Hanley, Eric Strobl. 2010. The effect of grant receipt on start-up size: Evidence from plantlevel data. Journal of International Entrepreneurship 8:4, 371-391. [CrossRef]
248. Marcelo F. Jimenez, Angela van Baardwijk, Hugo J.W.L. Aerts, Dirk De Ruysscher, Nuria M. Novoa, Gonzalo Varela, PhilippeLambin. 2010. Effectiveness of surgery and individualized high-dose hyperfractionated accelerated radiotherapy on survival inclinical stage I non-small cell lung cancer. A propensity score matched analysis. Radiotherapy and Oncology 97:3, 413-417.[CrossRef]
249. A. M. G. Kandilov, I. T. Kandilov. 2010. The Effect of Legalization on Wages and Health Insurance: Evidence from the NationalAgricultural Workers Survey. Applied Economic Perspectives and Policy 32:4, 604-623. [CrossRef]
250. Xi Chen, Stephen K. Shuman, James S. Hodges, Laël C. Gatewood, Jia Xu. 2010. Patterns of Tooth Loss in Older Adults withand without Dementia: A Retrospective Study Based on a Minnesota Cohort. Journal of the American Geriatrics Society 58:12,2300-2307. [CrossRef]
251. Tarja Viitanen. 2010. Child care voucher and labour market behaviour: experimental evidence from Finland. Applied Economics1-10. [CrossRef]
252. Burt S. Barnow. 2010. Setting up social experiments: the good, the bad, and the ugly. Zeitschrift für ArbeitsmarktForschung 43:2,91-105. [CrossRef]
253. Marco Francesconi, Stephen P. Jenkins, Thomas Siedler. 2010. The effect of lone motherhood on the smoking behavior of youngadults. Health Economics 19:11, 1377-1384. [CrossRef]
254. Kevin A. Gee. 2010. Reducing Child Labour Through Conditional Cash Transfers: Evidence from Nicaragua's Red de ProtecciónSocial. Development Policy Review 28:6, 711-732. [CrossRef]
255. Andrew Dillon. 2010. Do Differences in the Scale of Irrigation Projects Generate Different Impacts on Poverty and Production?.Journal of Agricultural Economics no-no. [CrossRef]
256. Allen Blackman, Bidisha Lahiri, William Pizer, Marisol Rivera Planter, Carlos Muñoz Piña. 2010. Voluntary environmentalregulation in developing countries: Mexico’s Clean Industry Program. Journal of Environmental Economics and Management 60:3,182-192. [CrossRef]
257. Peter P. Houtzager, Arnab K. Acharya. 2010. Associations, active citizenship, and the quality of democracy in Brazil and Mexico.Theory and Society . [CrossRef]
258. Romain Ranciere, Aaron Tornell, Athanasios Vamvakidis. 2010. Currency mismatch, systemic risk and growth in emerging Europe.Economic Policy 25:64, 597-658. [CrossRef]
259. PHILIPPE ASKENAZY, EVE CAROLI. 2010. Innovative Work Practices, Information Technologies, and Working Conditions:Evidence for France. Industrial Relations: A Journal of Economy and Society 49:4, 544-565. [CrossRef]
260. Meripa Godinet, Pam Arnsberger, Fenfang Li, Theresa Kreif. 2010. Disproportionality, Ohana Conferencing, and the Hawai'iChild Welfare System. Journal of Public Child Welfare 4:4, 387-405. [CrossRef]
261. Samuel Benin, Ephraim Nkonya, Geresom Okecho, Joseé Randriamamonjy, Edward Kato, Geofrey Lubade, Miriam Kyotalimye.2010. Returns to spending on agricultural extension: the case of the National Agricultural Advisory Services (NAADS) programof Uganda†. Agricultural Economics no-no. [CrossRef]
262. Jay Rojewski, In Lee, Sinan Gemici. 2010. Using Propensity Score Matching to Determine the Efficacy of Secondary CareerAcademies in Raising Educational Aspirations. Career and Technical Education Research 35:1, 3-27. [CrossRef]
263. Murillo Campello, John R. Graham, Campbell R. Harvey. 2010. The real effects of financial constraints: Evidence from a financialcrisis☆. Journal of Financial Economics 97:3, 470-487. [CrossRef]
264. Menale Kassie, Precious Zikhali, John Pender, Gunnar Köhlin. 2010. The Economics of Sustainable Land Management Practicesin the Ethiopian Highlands. Journal of Agricultural Economics 61:3, 605-627. [CrossRef]
265. Avi Dor, William Encinosa. 2010. How Does Cost-Sharing Affect Drug Purchases? Insurance Regimes in the Private Market forPrescription Drugs. Journal of Economics & Management Strategy 19:3, 545-574. [CrossRef]
266. Thomas J. Chemmanur, Karen Simonyan. 2010. What Drives the Issuance of Putable Convertibles: Risk-Shifting, AsymmetricInformation, or Taxes?. Financial Management 39:3, 1027-1068. [CrossRef]
267. Aradhna Aggarwal. 2010. Impact evaluation of India's ‘Yeshasvini’ community-based health insurance programme. HealthEconomics 19:S1, 5-35. [CrossRef]
268. Xing Lin Feng, Guang Shi, Yan Wang, Ling Xu, Hao Luo, Juan Shen, Hui Yin, Yan Guo. 2010. An impact evaluation of the SafeMotherhood Program in China. Health Economics 19:S1, 69-94. [CrossRef]
269. William T. Gormley Jr., Deborah Phillips, Shirley Adelstein, Catherine Shaw. 2010. Head Start's Comparative Advantage: Mythor Reality?. Policy Studies Journal 38:3, 397-418. [CrossRef]
270. E. Michael Foster, Miao Jiang, Christina M. Gibson-Davis. 2010. The Effect of the WIC Program on the Health of Newborns.Health Services Research 45:4, 1083-1104. [CrossRef]
271. Michael F. Caldwell. 2010. Treatment-Related Changes in Behavioral Outcomes of Psychopathy Facets in Adolescent Offenders.Law and Human Behavior . [CrossRef]
272. Sinan Gemici, Jay Rojewski. 2010. Contributions of Cooperative Education in Preparing At-Risk Students for Post-High SchoolTransition. Journal of Education for Students Placed at Risk (JESPAR) 15:3, 241-258. [CrossRef]
273. Martin Huber, Michael Lechner, Conny Wunsch, Thomas Walter. 2010. Do German Welfare-to-Work Programmes ReduceWelfare Dependency and Increase Employment?. German Economic Review no-no. [CrossRef]
274. Rebecca J. Hannagan, Jamie P. Pimlott, Levente Littvay. 2010. Does an EMILY's List Endorsement Predict Electoral Success, orDoes EMILY Pick the Winners?. PS: Political Science & Politics 43:03, 503-508. [CrossRef]
275. VALERIE MUELLER, ABUSALEH SHARIFF. 2010. PRELIMINARY EVIDENCE ON INTERNAL MIGRATION,REMITTANCES, AND TEEN SCHOOLING IN INDIA. Contemporary Economic Policy no-no. [CrossRef]
276. David McKenzie, Steven Stillman, John Gibson. 2010. How Important is Selection? Experimental VS. Non-Experimental Measuresof the Income Gains from Migration. Journal of the European Economic Association 8:4, 913-945. [CrossRef]
277. Markus Gangl. 2010. Causal Inference in Sociological Research. Annual Review of Sociology 36:1, 21-47. [CrossRef]278. David Hedrick, Steven Henson, John Krieg, Charles Wassell. 2010. The Effects of AACSB Accreditation on Faculty Salaries and
Productivity. Journal of Education for Business 85:5, 284-291. [CrossRef]279. Lingwen Huang, Yang Yao. 2010. Impacts of privatization on employment: evidence from China. Journal of Chinese Economic and
Business Studies 8:2, 133-156. [CrossRef]280. Ying Qiu, Alex Z. Fu, Gordon G. Liu, Dale B. Christensen. 2010. Healthcare Costs of Atypical Antipsychotic Use for Patients
with Bipolar Disorder in a Medicaid Programme. Applied Health Economics and Health Policy 8:3, 167-177. [CrossRef]281. Wen-Hao Chen. 2010. The impact of the employment insurance repayment policy: nonexperimental approaches. Applied Economics
42:10, 1209-1226. [CrossRef]282. Jaap Dronkers, Silvia Avram. 2010. A cross-national analysis of the relations of school choice and effectiveness differences between
private-dependent and public schools. Educational Research and Evaluation 16:2, 151-175. [CrossRef]283. CHUNG-HUA SHEN, YUAN CHANG. 2010. TO JOIN OR NOT TO JOIN? DO BANKS THAT ARE PART OF A
FINANCIAL HOLDING COMPANY PERFORM BETTER THAN BANKS THAT ARE NOT?. Contemporary EconomicPolicy no-no. [CrossRef]
284. Geetha A. Subramaniam, Melissa L. Ives, Maxine L. Stitzer, Michael L. Dennis. 2010. The added risk of opioid problem useamong treatment-seeking youth with marijuana and/or alcohol problem use. Addiction 105:4, 686-698. [CrossRef]
285. Xin Meng, Jim Ryan. 2010. Does a food for education program affect school outcomes? The Bangladesh case. Journal of PopulationEconomics 23:2, 415-447. [CrossRef]
286. Damiano Bonardo, Stefano Paleari, Silvio Vismara. 2010. Valuing University-Based Firms: The Effects of Academic Affiliationon IPO Performance. Entrepreneurship Theory and Practice . [CrossRef]
287. H. Spencer Banzhaf, Nathan Lavery. 2010. Can the land tax help curb urban sprawl? Evidence from growth patterns in Pennsylvania.Journal of Urban Economics 67:2, 169-179. [CrossRef]
288. Sandra Garcia, Jennifer Hill. 2010. Impact of conditional cash transfers on children's school achievement: evidence from Colombia.Journal of Development Effectiveness 2:1, 117-137. [CrossRef]
289. Soo-yong Byun. 2010. Does policy matter in shadow education spending? Revisiting the effects of the high school equalizationpolicy in South Korea. Asia Pacific Education Review 11:1, 83-96. [CrossRef]
290. Vladimir I. Ivanov, Fei Xie. 2010. Do Corporate Venture Capitalists Add Value to Start-Up Firms? Evidence from IPOs andAcquisitions of VC-Backed Companies. Financial Management 39:1, 129-152. [CrossRef]
291. Kazushi TAKAHASHI, Takayuki HIGASHIKATA, Kazunari TSUKADA. 2010. THE SHORT-TERM POVERTYIMPACT OF SMALL-SCALE, COLLATERAL-FREE MICROCREDIT IN INDONESIA: A MATCHING ESTIMATORAPPROACH. The Developing Economies 48:1, 128-155. [CrossRef]
292. Michael Beenstock. 2010. Partial program evaluation with observational data: the effect of treatment on drug addiction. Journalof Experimental Criminology 6:1, 83-113. [CrossRef]
293. Fabio Veras Soares, Rafael Perez Ribas, Guilherme Issamu Hirata. 2010. Impact evaluation of a rural conditional cash transferprogramme on outcomes beyond health and education. Journal of Development Effectiveness 2:1, 138-157. [CrossRef]
294. Matthew W. Epperson, Nabila El-Bassel, Mingway Chang, Louisa Gilbert. 2010. Examining the Temporal Relationship BetweenCriminal Justice Involvement and Sexual Risk Behaviors among Drug-Involved Men. Journal of Urban Health 87:2, 324-336.[CrossRef]
295. Kenneth A Couch, Dana W Placzek. 2010. Earnings Losses of Displaced Workers Revisited. American Economic Review 100:1,572-589. [CrossRef]
296. Katrina Mullan, Andreas Kontoleon, Timothy M. Swanson, Shiqiu Zhang. 2010. Evaluation of the Impact of the Natural ForestProtection Program on Rural Household Livelihoods. Environmental Management 45:3, 513-525. [CrossRef]
297. Gesine Stephan. 2010. Employer wage subsidies and wages in Germany: empirical evidence from individual data. Zeitschrift fürArbeitsmarktForschung 43:1, 53-71. [CrossRef]
298. Richard G. Funderburg, Hilary Nixon, Marlon G. Boarnet, Gavin Ferguson. 2010. New highways and land use change: Resultsfrom a quasi-experimental research design. Transportation Research Part A: Policy and Practice 44:2, 76-98. [CrossRef]
299. Akhter Ali, Awudu Abdulai. 2010. The Adoption of Genetically Modified Cotton and Poverty Reduction in Pakistan. Journal ofAgricultural Economics 61:1, 175-192. [CrossRef]
300. John L. Gore, Hua-Yin Yu, Claude Setodji, Jan M. Hanley, Mark S. Litwin, Christopher S. Saigal. 2010. Urinary diversion andmorbidity after radical cystectomy for bladder cancer. Cancer 116:2, 331-339. [CrossRef]
301. Iftekhar Hasan, Nada Kobeissi, Haizhi Wang. 2010. Global equity offerings, corporate valuation, and subsequent internationaldiversification. Strategic Management Journal n/a-n/a. [CrossRef]
302. VASSO IOANNIDOU, STEVEN ONGENA. 2010. “Time for a Change”: Loan Conditions and Bank Behavior when FirmsSwitch Banks. The Journal of Finance 65:5, 1847. [CrossRef]
303. William E. Encinosa, Didem Bernard, Avi DorDoes prescription drug adherence reduce hospitalizations and costs? The case ofdiabetes 22, 151-173. [CrossRef]
304. Sandhya Mehta, Hua Chen, Michael L. Johnson, Rajender R. Aparasu. 2010. Risk of Falls and Fractures in Older Adults UsingAntipsychotic Agents : A Propensity-Matched Retrospective Cohort Study. Drugs & Aging 27:10, 815. [CrossRef]
305. Lester L. Yuan. 2010. Estimating the effects of excess nutrients on stream invertebrates from observational data. EcologicalApplications 20:1, 110-125. [CrossRef]
306. Alastair Lawrence, Miguel Minutti-Meza, Ping Zhang. 2010. Can Big 4 versus Non-Big 4 Differences in Audit-Quality ProxiesBe Attributed to Client Characteristics?. The Accounting Review 1:1, 9. [CrossRef]
307. Hangsheng Liu, Rachel M. Burns, Agnes G. Schaefer, Teague Ruder, Christopher Nelson, Amelia M. Haviland, Wayne B. Gray,John Mendeloff. 2010. The Pennsylvania certified safety committee program: An evaluation of participation and effects on workinjury rates. American Journal of Industrial Medicine n/a-n/a. [CrossRef]
308. Martin Huber, Michael Lechner, Conny Wunsch. 2010. Does leaving welfare improve health? Evidence for Germany. HealthEconomics n/a-n/a. [CrossRef]
309. Dohoon Lee. 2010. The early socioeconomic effects oftTeenage childbearing : A propensity score matching approach. DemographicResearch 23, 697. [CrossRef]
310. GIOVANNI CERULLI. 2010. Modelling and Measuring the Effect of Public Subsidies on Business R&D: A Critical Reviewof the Econometric Literature* : THE EFFECT OF PUBLIC SUBSIDIES ON BUSINESS R&D. Economic Record 86:274,421. [CrossRef]
311. Daniel W. Hill. 2010. Estimating the Effects of Human Rights Treaties on State Behavior. The Journal of Politics 72:4, 1161.[CrossRef]
312. C. D. Mayen, J. V. Balagtas, C. E. Alexander. 2010. Technology Adoption and Technical Efficiency: Organic and ConventionalDairy Farms in the United States. American Journal of Agricultural Economics 92:1, 181-195. [CrossRef]
313. Takako Nomi. 2010. The Effects of Within-Class Ability Grouping on Academic Achievement in Early Elementary Years. Journalof Research on Educational Effectiveness 3:1, 56-92. [CrossRef]
314. Lucas Joppa, Alexander Pfaff. 2010. Reassessing the forest impacts of protection. Annals of the New York Academy of Sciences1185:1, 135-149. [CrossRef]
315. John Gibson. 2009. The rising public sector pay premium in the New Zealand labour market. New Zealand Economic Papers 43:3,255-261. [CrossRef]
316. Cristina Borra, Luis Palma. 2009. Child Care Choices in Spain. Journal of Family and Economic Issues 30:4, 323-338. [CrossRef]317. PIERRE AZOULAY, WAVERLY DING, TOBY STUART. 2009. THE IMPACT OF ACADEMIC PATENTING ON THE
RATE, QUALITY AND DIRECTION OF (PUBLIC) RESEARCH OUTPUT. The Journal of Industrial Economics 57:4,637-676. [CrossRef]
318. Assefa Admassie, Degnet Abebaw, Andinet Woldemichael. 2009. Impact evaluation of the Ethiopian Health Services ExtensionProgramme. Journal of Development Effectiveness 1:4, 430-449. [CrossRef]
319. Rachel Connelly, Jean Kimmel. 2009. Spousal influences on parents’ non-market time choices. Review of Economics of the Household7:4, 361-394. [CrossRef]
320. P. Christopher Zegras, Yang Chen, Jürg M. Grütter. 2009. Behavior-Based Transportation Greenhouse Gas Mitigation Under theClean Development Mechanism. Transportation Research Record: Journal of the Transportation Research Board 2114:-1, 38-46.[CrossRef]
321. Y. Xuan. 2009. Empire-Building or Bridge-Building? Evidence from New CEOs' Internal Capital Allocation Decisions. Reviewof Financial Studies 22:12, 4919-4948. [CrossRef]
322. Bertha Nhlema Simwaka, Kisukyabo Simwaka, George Bello. 2009. Retrospective analysis of a school-based malaria treatmentprogramme demonstrates a positive impact on health and education outcomes in Mangochi district, Malawi. Journal of DevelopmentEffectiveness 1:4, 492-506. [CrossRef]
323. Ali Mehryar Karim, Timothy Williams, Leslie Patykewich, Disha Ali, Charlotte E. Colvin, Jessica Posner, Gideon Rutaremwa.2009. The Impact of the African Youth Alliance Program on the Sexual Behavior of Young People in Uganda. Studies in FamilyPlanning 40:4, 289-306. [CrossRef]
324. Michael Lechner, Stephan Wiehler. 2009. Kids or courses? Gender differences in the effects of active labor market policies. Journalof Population Economics . [CrossRef]
325. Howard Friedman, Xue Song, Simone Crespi, Prakash Navaratnam. 2009. Comparative Analysis of Length of Stay, Total Costs,and Treatment Success between Intravenous Moxifloxacin 400 mg and Levofloxacin 750 mg among Hospitalized Patients withCommunity-Acquired Pneumonia. Value in Health 12:8, 1135-1143. [CrossRef]
326. Michael Lechner, Conny Wunsch. 2009. Active labour market policy in East Germany. Economics of Transition 17:4, 661-702.[CrossRef]
327. Inha Oh, Jeong-Dong Lee, Almas Heshmati, Gyoung-Gyu Choi. 2009. Evaluation of credit guarantee policy using propensityscore matching. Small Business Economics 33:3, 335-351. [CrossRef]
328. Roger Koenker, Jungmo Yoon. 2009. Parametric links for binary choice models: A Fisherian–Bayesian colloquy. Journal ofEconometrics 152:2, 120-130. [CrossRef]
329. Jens Matthias Arnold, Beata S. Javorcik. 2009. Gifted kids or pushy parents? Foreign direct investment and plant productivity inIndonesia☆. Journal of International Economics 79:1, 42-53. [CrossRef]
330. Yu Ye, Lee Ann Kaskutas. 2009. Using propensity scores to adjust for selection bias when assessing the effectiveness of AlcoholicsAnonymous in observational studies. Drug and Alcohol Dependence 104:1-2, 56-64. [CrossRef]
331. Troy K. Trygstad, Dale B. Christensen, Steve E. Wegner, Rob Sullivan, Jennifer M. Garmise. 2009. Analysis of the North CarolinaLong-Term Care Polypharmacy Initiative: A multiple-cohort approach using propensity-score matching for both evaluation andtargeting. Clinical Therapeutics 31:9, 2018-2037. [CrossRef]
332. Maureen A. Pirog, Anne L. Buffardi, Colleen K. Chrisinger, Pradeep Singh, John Briney. 2009. Are the alternatives to randomizedassignment nearly as good? Statistical corrections to nonrandomized evaluations. Journal of Policy Analysis and Management 28:1,169-172. [CrossRef]
333. Xinxin Chen, Qiuqiong Huang, Scott Rozelle, Yaojiang Shi, Linxiu Zhang. 2009. Effect of Migration on Children's EducationalPerformance in Rural China. Comparative Economic Studies 51:3, 323-343. [CrossRef]
334. G. Krug. 2009. In-work Benefits for Low-wage Jobs: Can Additional Income Reduce Employment Stability?. European SociologicalReview 25:4, 459-474. [CrossRef]
335. RONALD W. MASULIS, CONG WANG, FEI XIE. 2009. Agency Problems at Dual-Class Companies. The Journal of Finance64:4, 1697-1727. [CrossRef]
336. Olivier Bertrand. 2009. Effects of foreign acquisitions on R&D activity: Evidence from firm-level data for France. Research Policy38:6, 1021-1031. [CrossRef]
337. Elizabeth A. Stuart, Sue M. Marcus, Marcela V. Horvitz-Lennon, Robert D. Gibbons, Sharon-Lise T. Normand, C. HendricksBrown. 2009. Using Non-Experimental Data to Estimate Treatment Effects. Psychiatric Annals 39:7, 719-728. [CrossRef]
338. Michael Lechner. 2009. Long-run labour market and health effects of individual sports activities. Journal of Health Economics28:4, 839-854. [CrossRef]
339. Azeem M. Shaikh, Marianne Simonsen, Edward J. Vytlacil, Nese Yildiz. 2009. A specification test for the propensity score usingits distribution conditional on participation☆. Journal of Econometrics 151:1, 33-46. [CrossRef]
340. Andrei A. Levchenko, Romain Rancière, Mathias Thoenig. 2009. Growth and risk at the industry level: The real effects offinancial liberalization. Journal of Development Economics 89:2, 210-222. [CrossRef]
341. Svetlana Yampolskaya, Paul E. Greenbaum, Ilene R. Berson. 2009. Profiles of Child Maltreatment Perpetrators and Risk for FatalAssault: A Latent Class Analysis. Journal of Family Violence 24:5, 337-348. [CrossRef]
342. Joel W. Hay, Michael A. Kaliner. 2009. Costs of second-generation antihistamines in the treatment of allergic rhinitis: USperspective. Current Medical Research and Opinion 25:6, 1421-1431. [CrossRef]
343. Begoña Cueto, F. Javier Mato. 2009. A nonexperimental evaluation of training programmes: regional evidence for Spain. TheAnnals of Regional Science 43:2, 415-433. [CrossRef]
344. David T. Butry. 2009. Fighting fire with fire: estimating the efficacy of wildfire mitigation programs using propensity scores.Environmental and Ecological Statistics 16:2, 291-319. [CrossRef]
345. Jasjeet S. Sekhon. 2009. Opiates for the Matches: Matching Methods for Causal Inference. Annual Review of Political Science 12:1,487-508. [CrossRef]
346. Bijan J. Borah, Xingyue Huang, Victoria Zarotsky, Denise Globe. 2009. Trends in RA patients’ adherence to subcutaneous anti-TNF therapies and costs. Current Medical Research and Opinion 25:6, 1365-1377. [CrossRef]
347. Liane Faltermeier, Awudu Abdulai. 2009. The impact of water conservation and intensification technologies: empirical evidencefor rice farmers in Ghana. Agricultural Economics 40:3, 365-379. [CrossRef]
348. Chung-Hua Shen, Yuan Chang. 2009. Ambition Versus Conscience, Does Corporate Social Responsibility Pay off? TheApplication of Matching Methods. Journal of Business Ethics 88:S1, 133-153. [CrossRef]
349. Adam C. Kolasinski. 2009. A tale of two intermediaries: A discussion of Johnston, Markov and Ramnath (2009), and Cheng andNeamtiu (2009). Journal of Accounting and Economics 47:1-2, 131-135. [CrossRef]
350. S BAIER, J BERGSTRAND. 2009. Estimating the effects of free trade agreements on international trade flows using matchingeconometrics. Journal of International Economics 77:1, 63-76. [CrossRef]
351. Brian C. Briggeman, Charles A. Towe, Mitchell J. Morehart. 2009. Credit Constraints: Their Existence, Determinants, andImplications for U.S. Farm and Nonfarm Sole Proprietorships. American Journal of Agricultural Economics 91:1, 275-289.[CrossRef]
352. Benu Bidani, Niels-Hugo Blunch, Chor-Ching Goh, Christopher O'Leary. 2009. Evaluating job training in two Chinese cities.Journal of Chinese Economic and Business Studies 7:1, 77-94. [CrossRef]
353. William R. Doyle. 2009. Impact of Increased Academic Intensity on Transfer Rates: An Application of Matching Estimators toStudent-Unit Record Data. Research in Higher Education 50:1, 52-72. [CrossRef]
354. M JOHAR. 2009. The impact of the Indonesian health card program: A matching estimator approach. Journal of Health Economics28:1, 35-53. [CrossRef]
355. Stella Babalola, D. Lawrence Kincaid. 2009. New Methods for Estimating the Impact of Health Communication Programs.Communication Methods and Measures 3:1, 61-83. [CrossRef]
356. Giuseppe Porro, Stefano Maria Iacus. 2009. Random Recursive Partitioning: a matching method for the estimation of the averagetreatment effect. Journal of Applied Econometrics 24:1, 163-185. [CrossRef]
357. James J. Heckman, Petra E. Todd. 2009. A note on adapting propensity score matching and selection models to choice basedsamples. Econometrics Journal 12, S230-S234. [CrossRef]
358. Joseph V. Carcello, Ann Vanstraelen, Michael Willenborg. 2009. Rules Rather than Discretion in Audit Standards: Going-ConcernOpinions in Belgium. The Accounting Review 84:5, 1395. [CrossRef]
359. R CHO. 2009. Impact of maternal imprisonment on children's probability of grade retention. Journal of Urban Economics 65:1,11-23. [CrossRef]
360. Lijing Ouyang, Xiangming Fang, James Mercy, Ruth Perou, Scott D. Grosse. 2008. Attention-Deficit/Hyperactivity DisorderSymptoms and Child Maltreatment: A Population-Based Study. The Journal of Pediatrics 153:6, 851-856. [CrossRef]
361. A. Bíró, P. Elek, J. Vincze. 2008. Model-based sensitivity analysis of the Hungarian economy to macroeconomic shocks anduncertainties. Acta Oeconomica 58:4, 367-401. [CrossRef]
362. Joan M. Teno, David Dosa, Therese Rochon, Virginia Casey, Vincent Mor. 2008. Development of a Brief Survey to MeasureNursing Home Residents' Perceptions of Pain Management. Journal of Pain and Symptom Management 36:6, 572-583. [CrossRef]
363. Nadia Garro, Davide Capodanno, Valeria Cammalleri, Corrado Tamburino. 2008. Very late thrombosis in acute myocardialinfarction: drug-eluting versus uncoated stents. EuroIntervention 4:3, 324-330. [CrossRef]
364. R. M. Nayga. 2008. Nutrition, obesity and health: policies and economic research challenges. European Review of AgriculturalEconomics 35:3, 281-302. [CrossRef]
365. Elizabeth Ty Wilde, Robinson Hollister. 2008. How close is close enough? Evaluating propensity score matching using data froma class size reduction experiment. Journal of Policy Analysis and Management 26:3, 455-477. [CrossRef]
366. Olivier Bertrand, Habib Zitouna. 2008. Domestic versus cross-border acquisitions: which impact on the target firms’ performance?.Applied Economics 40:17, 2221-2238. [CrossRef]
367. Deborah N Peikes, Lorenzo Moreno, Sean Michael Orzol. 2008. Propensity Score Matching. The American Statistician 62:3,222-231. [CrossRef]
368. Neil Malhotra. 2008. Disentangling the Relationship between Legislative Professionalism and Government Spending. LegislativeStudies Quarterly 33:3, 387-414. [CrossRef]
369. L HERRERA, M NIETO. 2008. The national innovation policy effect according to firm location. Technovation 28:8, 540-550.[CrossRef]
370. Cindy D. Kam, Carl L. Palmer. 2008. Reconsidering the Effects of Education on Political Participation. The Journal of Politics70:03. . [CrossRef]
371. Haruko Noguchi, Satoshi Shimizutani, Yuichiro Masuda. 2008. Regional variations in medical expenditure and hospitalizationdays for heart attack patients in Japan: evidence from the Tokai Acute Myocardial Study (TAMIS). International Journal of HealthCare Finance and Economics 8:2, 123-144. [CrossRef]
372. Lixin Cai, Guyonne Kalb, Yi-Ping Tseng, Ha Vu. 2008. The Effect of Financial Incentives on Labour Supply: Evidence for LoneParents from Microsimulation and Quasi-Experimental Evaluation. Fiscal Studies 29:2, 285-325. [CrossRef]
373. Stephanie Cosner Berzin. 2008. Difficulties in the Transition to Adulthood: Using Propensity Scoring to Understand What MakesFoster Youth Vulnerable. Social Service Review 82:2, 171-196. [CrossRef]
374. H. Spencer Banzhaf, Randall P Walsh. 2008. Do People Vote with Their Feet? An Empirical Test of Tiebout's Mechanism.American Economic Review 98:3, 843-863. [CrossRef]
375. Giorgia Marini, Marisa Miraldo, Rowena Jacobs, Maria Goddard. 2008. Giving greater financial independence to hospitals—doesit make a difference? The case of English NHS Trusts. Health Economics 17:6, 751-775. [CrossRef]
376. KATSUSHI IMAI, PER A. EKLUND. 2008. Women's Organizations and Social Capital to Reduce Prevalence of ChildMalnutrition in Papua New Guinea. Oxford Development Studies 36:2, 209-233. [CrossRef]
377. Feng Pan, Michael E. Chernew, A. Mark Fendrick. 2008. Impact of Fixed-Dose Combination Drugs on Adherence to PrescriptionMedications. Journal of General Internal Medicine 23:5, 611-614. [CrossRef]
378. Eric P. Slade, Elizabeth A. Stuart, David S. Salkever, Mustafa Karakus, Kerry M. Green, Nicholas Ialongo. 2008. Impacts of ageof onset of substance use disorders on risk of adult incarceration among disadvantaged urban youth: A propensity score matchingapproach. Drug and Alcohol Dependence 95:1-2, 1-13. [CrossRef]
379. Neal T. Wallace, K. John McConnell, Charles A. Gallia, Jeanene A. Smith. 2008. How Effective Are Copayments in ReducingExpenditures for Low-Income Adult Medicaid Beneficiaries? Experience from the Oregon Health Plan. Health Services Research43:2, 515-530. [CrossRef]
380. Andrea Ichino, Fabrizia Mealli, Tommaso Nannicini. 2008. From temporary help jobs to permanent employment: what can welearn from matching estimators and their sensitivity?. Journal of Applied Econometrics 23:3, 305-327. [CrossRef]
381. Roni Frish, Noam Zussman. 2008. The effect of transfer payments on the labor supply of single mothers. The Journal of Socio-Economics 37:2, 627-643. [CrossRef]
382. Eliane El Badaoui, Eric Strobl, Frank Walsh. 2008. Is There an Informal Employment Wage Penalty? Evidence from South Africa.Economic Development and Cultural Change 56:3, 683-710. [CrossRef]
383. M RAAIJMAKERS, H KOFFIJBERG, J POSTHUMUS, B VANHOUT, H VANENGELAND, W MATTHYS. 2008.Assessing performance of a randomized versus a non-randomized study design. Contemporary Clinical Trials 29:2, 293-303.[CrossRef]
384. Menale Kassie, John Pender, Mahmud Yesuf, Gunnar Kohlin, Randy Bluffstone, Elias Mulugeta. 2008. Estimating returns to soilconservation adoption in the northern Ethiopian highlands. Agricultural Economics 38:2, 213-232. [CrossRef]
385. Rebecca Callahan, Lindsey Wilkinson, Chandra Muller. 2008. School Context and the Effect of ESL Placement on Mexican-Origin Adolescents' Achievement*. Social Science Quarterly 89:1, 177-198. [CrossRef]
386. I BUSOM, A FERNANDEZRIBAS. 2008. The impact of firm participation in R&D programmes on R&D partnerships. ResearchPolicy 37:2, 240-257. [CrossRef]
387. Paula Veloso Veiga, Ronald P. Wilder. 2008. Maternal Smoking During Pregnancy and Birthweight: A Propensity Score MatchingApproach. Maternal and Child Health Journal 12:2, 194-203. [CrossRef]
388. Marco Caliendo, Sabine Kopeinig. 2008. SOME PRACTICAL GUIDANCE FOR THE IMPLEMENTATION OFPROPENSITY SCORE MATCHING. Journal of Economic Surveys 22:1, 31-72. [CrossRef]
389. Kathleen Carey, Avi Dor. 2008. Expense preference behavior and management “outsourcing”: a comparison of adopters and non-adopters of contract management in U.S. hospitals. Journal of Productivity Analysis 29:1, 61-75. [CrossRef]
390. Conny Wunsch, Michael Lechner. 2008. What Did All the Money Do? On the General Ineffectiveness of Recent West GermanLabour Market Programmes. Kyklos 61:1, 134-174. [CrossRef]
391. Pandej Chintrakarn. 2008. Estimating the Euro Effects on Trade with Propensity Score Matching*. Review of InternationalEconomics 16:1, 186-198. [CrossRef]
392. Alison Evans Cuellar, Larkin S. McReynolds, Gail A. Wasserman. 2007. A cure for crime: Can mental health treatment diversionreduce crime among youth?. Journal of Policy Analysis and Management 25:1, 197-214. [CrossRef]
393. Toby E. Stuart, Olav Sorenson. 2007. Strategic networks and entrepreneurial ventures. Strategic Entrepreneurship Journal 1:3-4,211-227. [CrossRef]
394. Antonio Bento, Charles Towe, Jacqueline Geoghegan. 2007. The Effects of Moratoria on Residential Development: Evidence froma Matching Approach. American Journal of Agricultural Economics 89:5, 1211-1218. [CrossRef]
395. Indranil Bardhan, Sunil Mithas, Shu Lin. 2007. Performance Impacts of Strategy, Information Technology Applications, andBusiness Process Outsourcing in U.S. Manufacturing Plants. Production and Operations Management 16:6, 747-762. [CrossRef]
396. Michael Lechner, Ruth Miquel, Conny Wunsch. 2007. The Curse and Blessing of Training the Unemployed in a ChangingEconomy: The Case of East Germany After Unification. German Economic Review 8:4, 468-509. [CrossRef]
397. S LIN, H YE. 2007. Does inflation targeting really make a difference? Evaluating the treatment effect of inflation targeting inseven industrial countries☆. Journal of Monetary Economics 54:8, 2521-2533. [CrossRef]
398. M MADAJEWICZ, A PFAFF, A VANGEEN, J GRAZIANO, I HUSSEIN, H MOMOTAJ, R SYLVI, H AHSAN. 2007. Caninformation alone change behavior? Response to arsenic contamination of groundwater in Bangladesh☆. Journal of DevelopmentEconomics 84:2, 731-754. [CrossRef]
399. Rachid Baz, Cristina Rodriguez, Alex Z. Fu, Rony Abou Jawde, Matt Kalaycio, Anjali Advani, Ronald Sobecks, Mikkael A.Sekeres. 2007. Impact of remission induction chemotherapy on survival in older adults with acute myeloid leukemia. Cancer 110:8,1752-1759. [CrossRef]
400. Daniela Del Boca, Daniela Vuri. 2007. The mismatch between employment and child care in Italy: the impact of rationing. Journalof Population Economics 20:4, 805-832. [CrossRef]
401. Arnstein Aassve, Maria A. Davia, Maria Iacovou, Stefano Mazzuco. 2007. Does Leaving Home Make You Poor? Evidence from 13European Countries. European Journal of Population / Revue européenne de Démographie 23:3-4, 315-338. [CrossRef]
402. Jonathan Whitaker, Sunil Mithas, M. S. Krishnan. 2007. A Field Study of RFID Deployment and Return Expectations. Productionand Operations Management 16:5, 599-612. [CrossRef]
403. Aron A. Gottesman, Gordon S. Roberts. 2007. Loan Rates and Collateral. The Financial Review 42:3, 401-427. [CrossRef]404. G GREEN, J TODD, D PEVALIN. 2007. Biographical disruption associated with multiple sclerosis: Using propensity scoring
to assess the impact. Social Science & Medicine 65:3, 524-535. [CrossRef]405. D SLOTTJE, D MILLIMET, M BUCHANAN. 2007. Econometric analysis of copyrights. Journal of Econometrics 139:2,
303-317. [CrossRef]406. Michelle L. Frisco, Chandra Muller, Kenneth Frank. 2007. Parents? Union Dissolution and Adolescents? School Performance:
Comparing Methodological Approaches. Journal of Marriage and Family 69:3, 721-741. [CrossRef]407. Gregory D. Berg, Sandeep Wadhwa. 2007. Health Services Outcomes for a Diabetes Disease Management Program for the Elderly.
Disease Management 10:4, 226-234. [CrossRef]408. Arnstein Aassve, Gianni Betti, Stefano Mazzuco, Letizia Mencarini. 2007. Marital disruption and economic well-being: a
comparative analysis. Journal of the Royal Statistical Society: Series A (Statistics in Society) 170:3, 781-799. [CrossRef]
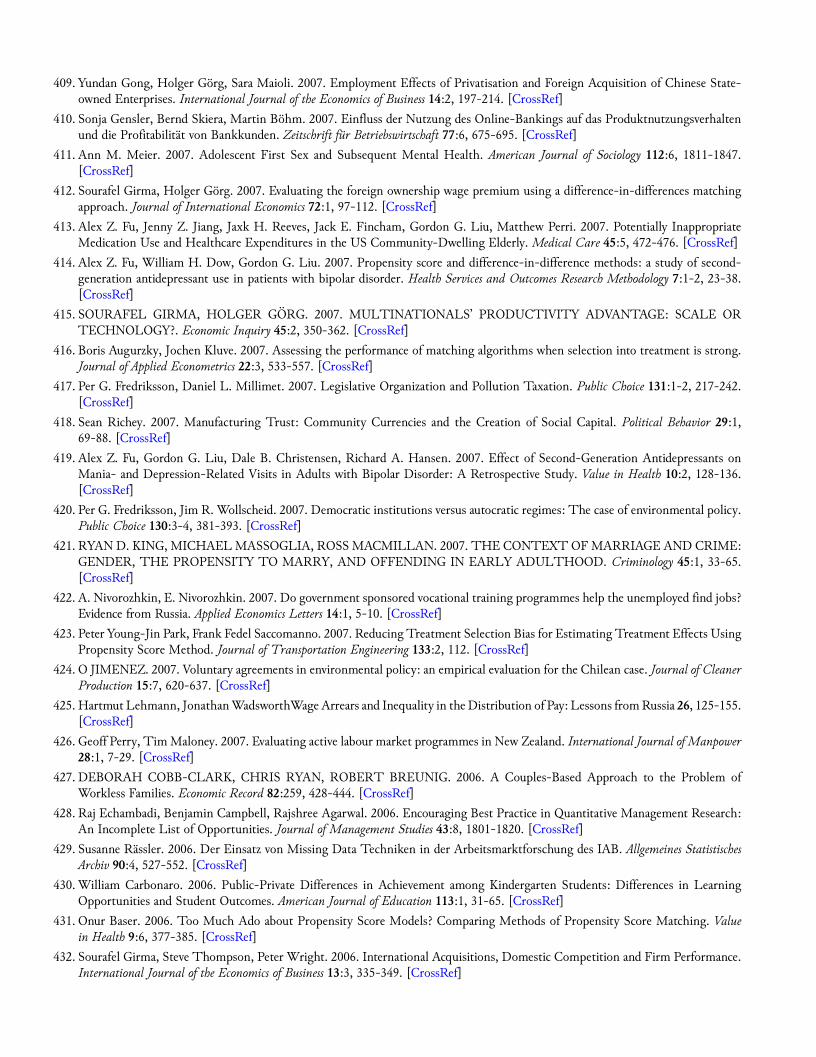
409. Yundan Gong, Holger Görg, Sara Maioli. 2007. Employment Effects of Privatisation and Foreign Acquisition of Chinese State-owned Enterprises. International Journal of the Economics of Business 14:2, 197-214. [CrossRef]
410. Sonja Gensler, Bernd Skiera, Martin Böhm. 2007. Einfluss der Nutzung des Online-Bankings auf das Produktnutzungsverhaltenund die Profitabilität von Bankkunden. Zeitschrift für Betriebswirtschaft 77:6, 675-695. [CrossRef]
411. Ann M. Meier. 2007. Adolescent First Sex and Subsequent Mental Health. American Journal of Sociology 112:6, 1811-1847.[CrossRef]
412. Sourafel Girma, Holger Görg. 2007. Evaluating the foreign ownership wage premium using a difference-in-differences matchingapproach. Journal of International Economics 72:1, 97-112. [CrossRef]
413. Alex Z. Fu, Jenny Z. Jiang, Jaxk H. Reeves, Jack E. Fincham, Gordon G. Liu, Matthew Perri. 2007. Potentially InappropriateMedication Use and Healthcare Expenditures in the US Community-Dwelling Elderly. Medical Care 45:5, 472-476. [CrossRef]
414. Alex Z. Fu, William H. Dow, Gordon G. Liu. 2007. Propensity score and difference-in-difference methods: a study of second-generation antidepressant use in patients with bipolar disorder. Health Services and Outcomes Research Methodology 7:1-2, 23-38.[CrossRef]
415. SOURAFEL GIRMA, HOLGER GÖRG. 2007. MULTINATIONALS’ PRODUCTIVITY ADVANTAGE: SCALE ORTECHNOLOGY?. Economic Inquiry 45:2, 350-362. [CrossRef]
416. Boris Augurzky, Jochen Kluve. 2007. Assessing the performance of matching algorithms when selection into treatment is strong.Journal of Applied Econometrics 22:3, 533-557. [CrossRef]
417. Per G. Fredriksson, Daniel L. Millimet. 2007. Legislative Organization and Pollution Taxation. Public Choice 131:1-2, 217-242.[CrossRef]
418. Sean Richey. 2007. Manufacturing Trust: Community Currencies and the Creation of Social Capital. Political Behavior 29:1,69-88. [CrossRef]
419. Alex Z. Fu, Gordon G. Liu, Dale B. Christensen, Richard A. Hansen. 2007. Effect of Second-Generation Antidepressants onMania- and Depression-Related Visits in Adults with Bipolar Disorder: A Retrospective Study. Value in Health 10:2, 128-136.[CrossRef]
420. Per G. Fredriksson, Jim R. Wollscheid. 2007. Democratic institutions versus autocratic regimes: The case of environmental policy.Public Choice 130:3-4, 381-393. [CrossRef]
421. RYAN D. KING, MICHAEL MASSOGLIA, ROSS MACMILLAN. 2007. THE CONTEXT OF MARRIAGE AND CRIME:GENDER, THE PROPENSITY TO MARRY, AND OFFENDING IN EARLY ADULTHOOD. Criminology 45:1, 33-65.[CrossRef]
422. A. Nivorozhkin, E. Nivorozhkin. 2007. Do government sponsored vocational training programmes help the unemployed find jobs?Evidence from Russia. Applied Economics Letters 14:1, 5-10. [CrossRef]
423. Peter Young-Jin Park, Frank Fedel Saccomanno. 2007. Reducing Treatment Selection Bias for Estimating Treatment Effects UsingPropensity Score Method. Journal of Transportation Engineering 133:2, 112. [CrossRef]
424. O JIMENEZ. 2007. Voluntary agreements in environmental policy: an empirical evaluation for the Chilean case. Journal of CleanerProduction 15:7, 620-637. [CrossRef]
425. Hartmut Lehmann, Jonathan WadsworthWage Arrears and Inequality in the Distribution of Pay: Lessons from Russia 26, 125-155.[CrossRef]
426. Geoff Perry, Tim Maloney. 2007. Evaluating active labour market programmes in New Zealand. International Journal of Manpower28:1, 7-29. [CrossRef]
427. DEBORAH COBB-CLARK, CHRIS RYAN, ROBERT BREUNIG. 2006. A Couples-Based Approach to the Problem ofWorkless Families. Economic Record 82:259, 428-444. [CrossRef]
428. Raj Echambadi, Benjamin Campbell, Rajshree Agarwal. 2006. Encouraging Best Practice in Quantitative Management Research:An Incomplete List of Opportunities. Journal of Management Studies 43:8, 1801-1820. [CrossRef]
429. Susanne Rässler. 2006. Der Einsatz von Missing Data Techniken in der Arbeitsmarktforschung des IAB. Allgemeines StatistischesArchiv 90:4, 527-552. [CrossRef]
430. William Carbonaro. 2006. Public‐Private Differences in Achievement among Kindergarten Students: Differences in LearningOpportunities and Student Outcomes. American Journal of Education 113:1, 31-65. [CrossRef]
431. Onur Baser. 2006. Too Much Ado about Propensity Score Models? Comparing Methods of Propensity Score Matching. Valuein Health 9:6, 377-385. [CrossRef]
432. Sourafel Girma, Steve Thompson, Peter Wright. 2006. International Acquisitions, Domestic Competition and Firm Performance.International Journal of the Economics of Business 13:3, 335-349. [CrossRef]
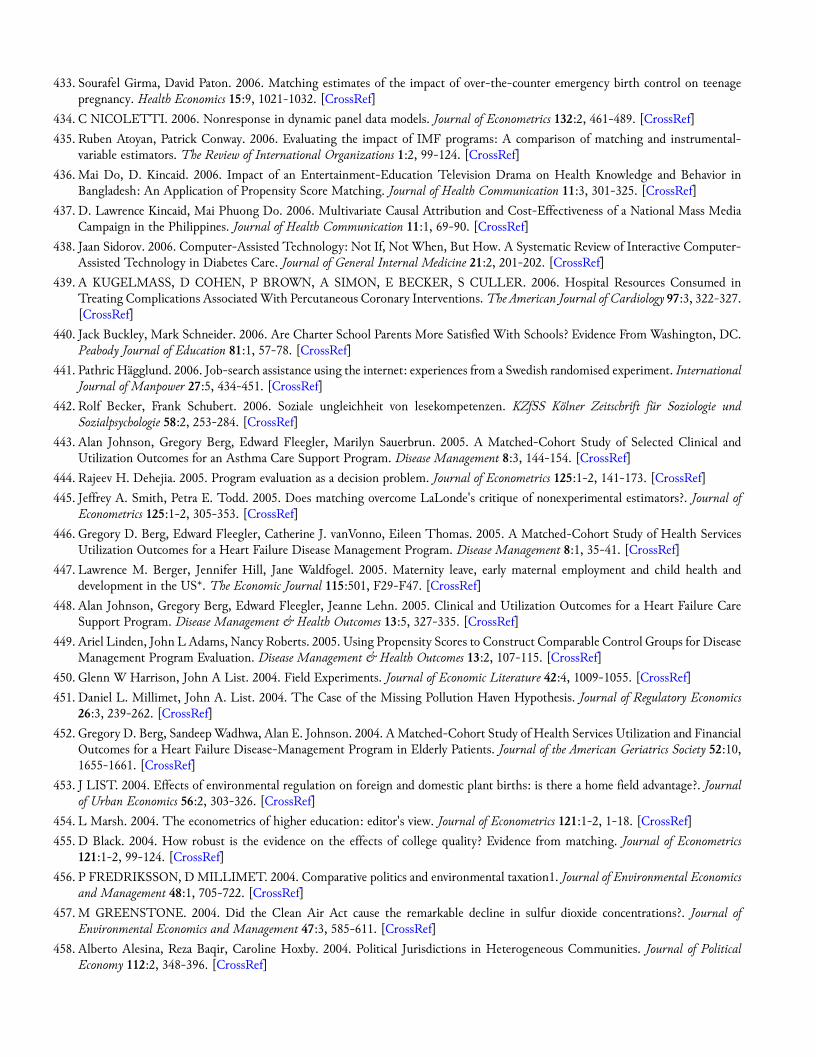
433. Sourafel Girma, David Paton. 2006. Matching estimates of the impact of over-the-counter emergency birth control on teenagepregnancy. Health Economics 15:9, 1021-1032. [CrossRef]
434. C NICOLETTI. 2006. Nonresponse in dynamic panel data models. Journal of Econometrics 132:2, 461-489. [CrossRef]435. Ruben Atoyan, Patrick Conway. 2006. Evaluating the impact of IMF programs: A comparison of matching and instrumental-
variable estimators. The Review of International Organizations 1:2, 99-124. [CrossRef]436. Mai Do, D. Kincaid. 2006. Impact of an Entertainment-Education Television Drama on Health Knowledge and Behavior in
Bangladesh: An Application of Propensity Score Matching. Journal of Health Communication 11:3, 301-325. [CrossRef]437. D. Lawrence Kincaid, Mai Phuong Do. 2006. Multivariate Causal Attribution and Cost-Effectiveness of a National Mass Media
Campaign in the Philippines. Journal of Health Communication 11:1, 69-90. [CrossRef]438. Jaan Sidorov. 2006. Computer-Assisted Technology: Not If, Not When, But How. A Systematic Review of Interactive Computer-
Assisted Technology in Diabetes Care. Journal of General Internal Medicine 21:2, 201-202. [CrossRef]439. A KUGELMASS, D COHEN, P BROWN, A SIMON, E BECKER, S CULLER. 2006. Hospital Resources Consumed in
Treating Complications Associated With Percutaneous Coronary Interventions. The American Journal of Cardiology 97:3, 322-327.[CrossRef]
440. Jack Buckley, Mark Schneider. 2006. Are Charter School Parents More Satisfied With Schools? Evidence From Washington, DC.Peabody Journal of Education 81:1, 57-78. [CrossRef]
441. Pathric Hägglund. 2006. Job-search assistance using the internet: experiences from a Swedish randomised experiment. InternationalJournal of Manpower 27:5, 434-451. [CrossRef]
442. Rolf Becker, Frank Schubert. 2006. Soziale ungleichheit von lesekompetenzen. KZfSS Kölner Zeitschrift für Soziologie undSozialpsychologie 58:2, 253-284. [CrossRef]
443. Alan Johnson, Gregory Berg, Edward Fleegler, Marilyn Sauerbrun. 2005. A Matched-Cohort Study of Selected Clinical andUtilization Outcomes for an Asthma Care Support Program. Disease Management 8:3, 144-154. [CrossRef]
444. Rajeev H. Dehejia. 2005. Program evaluation as a decision problem. Journal of Econometrics 125:1-2, 141-173. [CrossRef]445. Jeffrey A. Smith, Petra E. Todd. 2005. Does matching overcome LaLonde's critique of nonexperimental estimators?. Journal of
Econometrics 125:1-2, 305-353. [CrossRef]446. Gregory D. Berg, Edward Fleegler, Catherine J. vanVonno, Eileen Thomas. 2005. A Matched-Cohort Study of Health Services
Utilization Outcomes for a Heart Failure Disease Management Program. Disease Management 8:1, 35-41. [CrossRef]447. Lawrence M. Berger, Jennifer Hill, Jane Waldfogel. 2005. Maternity leave, early maternal employment and child health and
development in the US*. The Economic Journal 115:501, F29-F47. [CrossRef]448. Alan Johnson, Gregory Berg, Edward Fleegler, Jeanne Lehn. 2005. Clinical and Utilization Outcomes for a Heart Failure Care
Support Program. Disease Management & Health Outcomes 13:5, 327-335. [CrossRef]449. Ariel Linden, John L Adams, Nancy Roberts. 2005. Using Propensity Scores to Construct Comparable Control Groups for Disease
Management Program Evaluation. Disease Management & Health Outcomes 13:2, 107-115. [CrossRef]450. Glenn W Harrison, John A List. 2004. Field Experiments. Journal of Economic Literature 42:4, 1009-1055. [CrossRef]451. Daniel L. Millimet, John A. List. 2004. The Case of the Missing Pollution Haven Hypothesis. Journal of Regulatory Economics
26:3, 239-262. [CrossRef]452. Gregory D. Berg, Sandeep Wadhwa, Alan E. Johnson. 2004. A Matched-Cohort Study of Health Services Utilization and Financial
Outcomes for a Heart Failure Disease-Management Program in Elderly Patients. Journal of the American Geriatrics Society 52:10,1655-1661. [CrossRef]
453. J LIST. 2004. Effects of environmental regulation on foreign and domestic plant births: is there a home field advantage?. Journalof Urban Economics 56:2, 303-326. [CrossRef]
454. L Marsh. 2004. The econometrics of higher education: editor's view. Journal of Econometrics 121:1-2, 1-18. [CrossRef]455. D Black. 2004. How robust is the evidence on the effects of college quality? Evidence from matching. Journal of Econometrics
121:1-2, 99-124. [CrossRef]456. P FREDRIKSSON, D MILLIMET. 2004. Comparative politics and environmental taxation1. Journal of Environmental Economics
and Management 48:1, 705-722. [CrossRef]457. M GREENSTONE. 2004. Did the Clean Air Act cause the remarkable decline in sulfur dioxide concentrations?. Journal of
Environmental Economics and Management 47:3, 585-611. [CrossRef]458. Alberto Alesina, Reza Baqir, Caroline Hoxby. 2004. Political Jurisdictions in Heterogeneous Communities. Journal of Political
Economy 112:2, 348-396. [CrossRef]

459. Harry J. Holzer, Jens Ludwig. 2003. Measuring Discrimination in Education: Are Methodologies From Labor and MarketsUseful?. Teachers College Record 105:6, 1147-1178. [CrossRef]
460. Gregory D Berg, Alan Johnson, Edward Fleegler. 2003. Clinical and Utilization Outcomes for a Pediatric and AdolescentTelephonic Asthma Care Support Program. Disease Management & Health Outcomes 11:11, 737-743. [CrossRef]