Embed Size (px)
Citation preview
Rainfall and Runoff in the Leeward Koolau Mountains, Oahu, Hawaii1
JOHN F. MINK2
DURING THE COURSE of the investigation of theground-water resources of southern Oahu, madeby the U. S. Geological Survey in cooperationwith the State of Hawaii, a water-budget studywas used to estimate the quantity of groundwater available for development. The effectiveuse of this approach required a detailed knowledge of rainfall and runoff in the area beingstudied, especially in that part of it lying in thewet Koolau mountains, where most of theground water is recharged. Past estimates for therainfall-runoff relationship in this environmentwere rather speculative, and were based eitheron extrapolations from areas of lower rainfallor on experience obtained elsewhere. In thepresent study it became obvious that this relationship would have to be refined.
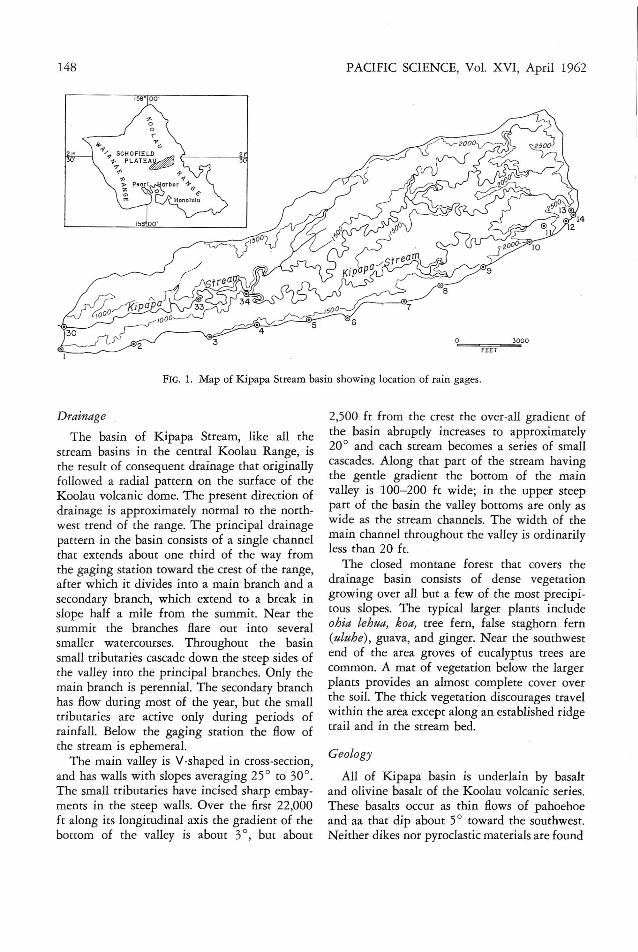
At the start of the investigation adequatelong-term records of rainfall were available forthe Schofield plateau and the coastal plain, butrecords for the rugged central Koolau Rangewere spotty and not definitive. To alleviate thisdeficiency, 17 storage rain gages were installedin that part of Kipapa Stream basin that isrepresentative of the high rainfall region of theleeward central part of the Koolau Range (Fig.1). This part of the basin is covered by anunbroken closed forest.
The gages were made of 5-ft lengths of 3-inchaluminum pipe welded shut at one end. Fourteen of the gages were distributed along theridge on the south side of the valley (KipapaRidge) between the isohyet for an average annual rainfall of approximately 70 inches andthe summit of the Koolau Range, and 3 wereplaced on the floor of the valley over the samedistance covered by the first 4 gages on the
1 Publication authorized by the Director, U. S. Geological Survey. Manuscript received May 8, 1961.
2 Present address, Board of Water Supply, City andCounty of Honolulu, Hawaii.
ridge (see Fig. 1). A tipping bucket recordingrain gage with an 8-inch catch was paired withthe first of the 3-inch aluminum gages in thevalley. The differences in rainfall recorded bythe 8-inch gage and measured in the 3-inchgage were insignificant in relation to the amountof rain that fell in the intervals between readings (Mink, 1960).
A recording stream gage was constructedwhere the stream emerges from the forest, coinciding in location with the first of the raingages (Fig. 1). Thus two of the variables in thewater-budget equation were subjected to closemeasurement. This paper analyzes the records ofrainfall and runoff in the basin for 3 completecalendar years (1957-59). Computations of rainfall and runoff quantities are given in millionsof gallons to accord with the terminology usuallyemployed in hydrologic investigations in theHawaiian Islands.
LOCATION AND DESCRIPTION OFKIPAPA BASIN
The basin of Kipapa Stream is in the centralpart of leeward Oahu, and, over its full extent,it reaches from the crest of the Koolau Rangeto the junction of Kipapa Stream with Waikakalaua Stream, which is about 2 miles fromPearl Harbor. Only the long and narrow upperthird of the basin was included in the study.This part of the basin is almost 5 miles long,ranges in width from about 2,000 to 7,000 ft,and has a drainage area of 4.3 sq miles. Thegaging station on the stream is 700 ft above sealevel and the rain gage on the ridge overlooking the stream gage is 1,150 ft above sea level.The widest and highest part of the basin is atits east end, near the crest of the range. Theaverage altitude of this part of the crest bounding the valley is 2,650 ft above sea level, andthe highest altitude is 2,785 ft.
147
148 PACIFIC SCIENCE, Vol. XVI, April 1962
FIG. 1. Map of Kipapa Stream basin showing location of rain gages.
Drainage
The basin of Kipapa Stream, like all thestream basins in the central Koolau Range, isthe result of consequent drainage that originallyfollowed a radial pattern on the surface of theKoolau volcanic dome. The present direction ofdrainage is approximately normal to the northcwest trend of the range. The principal drainagepattern in the basin consists of a single channelthat extends about one third of the way fromthe gaging station toward the crest of the range,after which it divides into a main branch and asecondary branch, which extend to a break inslope half a mile from the summit. Near thesummit the branches flare out into severalsmaller watercourses. Throughout the basinsmall tributaries cascade down the steep sides ofthe valley into the principal branches. Only themain branch is perennial. The secondary branchhas flow during most of the year, but the smalltributaries are active only during periods ofrainfall. Below the gaging station the flow ofthe stream is ephemeral.
The main valley is V-shaped in cross-section,and has walls with slopes averaging 25° to 30°.The small tributaries have incised sharp embayments in the steep walls. Over the first 22,000ft along its longitudinal axis the gradient of thebottom of the valley is about 30, but about
2,500 ft from the crest the over-all gradient ofthe basin abruptly increases to approximately20° and each stream becomes a series of smallcascades. Along that part of the stream havingthe gentle gradient the bottom of the mainvalley is 100-200 ft wide; in the upper steepp~rt of the basin the valley bottoms are only asWIde as the stream channels. The width of themain channel throughout the valley is ordinarilyless than 20 ft.
The closed montane forest that covers thedrainage basin consists of dense vegetationgrowing over all but a few of the most precipitous slopes. The typical larger plants includeohia lehua, koa, tree fern, false staghorn fern(uluhe), guava, and ginger. Near the southwestend of the area groves of eucalyptus trees arecommon. A mat of vegetation below the largerplants provides an almost complete cover overthe soil. The thick vegetation discourages travelwithin the area except along an established ridgetrail and in the stream bed.
Geology
All of Kipapa basin is underlain by basaltand olivine basalt of the Koolau volcanic series.These basalts occur as thin flows of pahoehoeand aa that dip about 5° toward the southwest.Neither dikes nor pyroclastic materials are found
Rainfall and Runoff-MINK
in the basin. Measurements taken at verticalsections along the stream show a higher proportion of aa than pahoehoe, but the differencemay be based upon a sample too small to besignificant. The proportion of aa-clinker couldbe expected to increase, however, with distancefrom the rift zone of the Koolau dome fromwhich the lavas effused, which is approximatelycoincident with the crest of the range.
The rocks of the Koolau volcanic seriesweather quickly and give rise to soils belongingto the Latasol suborder. Within the Latasolclassification are the groups of soils that formthrough the laterization process. In Hawaii thestages of laterization are determined chiefly bythe amount and distribution of rainfall. According to the Soil Survey of Hawaii (Cline et aI.,1955), the soils of the mountain section ofKipapa basin are classed generally as Lithosolsbecause of their lack of a genetic profile. However, it is probable that the soils of the wetterportion of the basin are akin to the HydrolHumic Latasols whereas those nearer the streamgage resemble Humic Latasols. Hydrol HumicLatasols are typical of forest-covered areas withvery high rainfall. They are continually wet, andtheir moisture content accounts for a large proportion of their total weight. The Humic Latasols are less highly weathered and are subject tooccasional drying. Both of these soils have highporosity and permeability and are able to holdlarge amounts of water.
The floor of the valley above the stream channel consists of an irregular terrace, which isunderlain by soil intercalated with small lensesof gravel, the whole of which averages from 5to 8 ft in thickness. The valley walls, exceptwhere cliffs occur, are covered by 2 to 3 ft ofsoil. Small patches of highly weathered talusand large boulders are common in the basin.The stream bed usually consists of deposits ofpoorly sorted gravel 3 to 5 ft thick, but overshort stretches the stream may flow directly onthe weathered parent basalt. The mixed gravelcontains particles ranging in size from sand toboulders, all of which are moderately to wellrounded. Virtually no silt or mud occurs in thestream bed. The smaller pieces of gravel commonly are completely weathered and the largerfragments have a fresh core. Fragments derivedfrom pahoehoe are generally smaller, more
149
rounded and more thoroughly weathered, thanthose from aa.
Heavy, dense vegetation covers the terrace inthe valley bottom. The terrace lies about 5 ftabove the stream during normal flow, but it isoften inundated by high runoff from frequentheavy rains in the narrow valley. During normalflow the stream is free of sediment, and evenduring flooding it is only slightly turbid. Theturbidity probably consists mostly of organicdebris and colloidal material from weatheredbasalt. The stream is in a down-cutting phase,but most of the cutting is due to chemical erosion and little physical erosion is taking place.The thick carpet of vegetation that covers thehighly porous soil mantle effectively retards theremoval of soil. Also the basalt is highly permeable and can absorb water at a high rate.Occasionally small landslides occur where slippage takes place between the weathered bedrockand the residuum above it, but the sliding material generally is trapped on the slopes, andquickly becomes revegetated. Any of the material from landslides that reaches the stream becomes part of the channel gravel and remainswithin the drainage basin. However, in thelower part of the basin outside the area of study,where rainfall is less and the land is cultivated,physical erosion is active, and it is this regionwhich provides the sediment that discharges intoPearl Harbor.
RAINFALL
Most of the rain that falls in the KoolauRange is the direct result of either of the twoprincipal atmospheric circulation patterns. Thecyclonic pattern associated with low-pressuresystems brings storms from which general rainsoften fall, and the anti-cyclonic pattern associated with high-pressure systems results in orographic rainfall. The precipitation from cyclonicstorms is uniformly distributed over wide areas,whereas orographic rainfall is usually restrictedto the mountain region. Cyclonic storms aremost common during the winter months (November through March), although they occurinfrequently during the remainder of the year.Orographic conditions occur throughout theyear but are most continuous during the summer period.
The areal distribution pattern of rainfall in
150
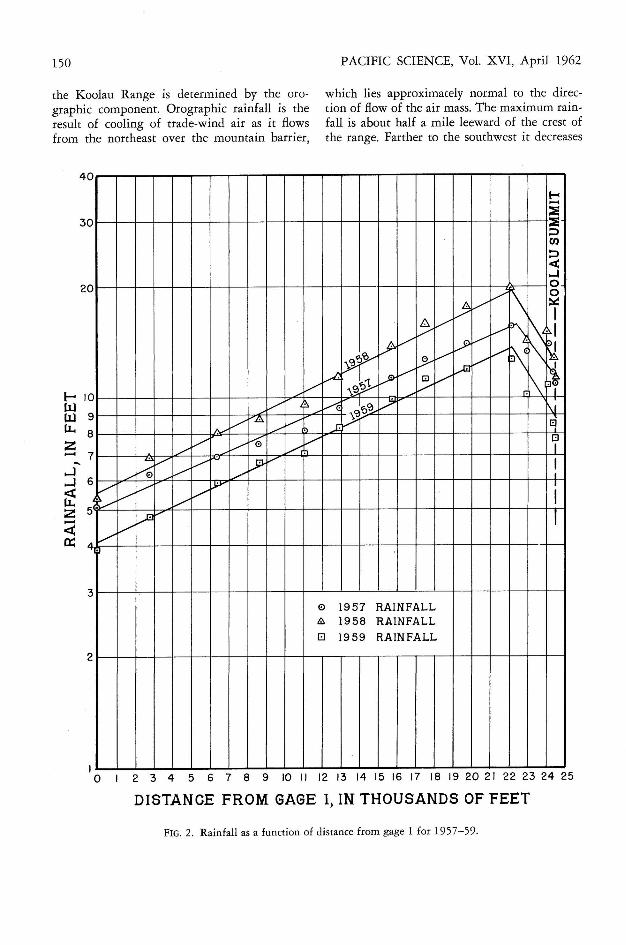
the Koolau Range is determined by the orographic component. Orographic rainfall is theresult of cooling of trade-wind air as it flowsfrom the northeast over the mountain barrier,
PACIFIC SCIENCE, Vol. XVI, April 1962
which lies approximately normal to the direction of flow of the air mass. The maximum rainfall is about half a mile leeward of the crest ofthe range. Farther to the southwest it decreases
...... 10lLllLl 9u.. 8:z:- 7
"'.....l.....l 6
~:z: 5
::(0:: 4
40
30
20
3
2
I-.....::e::e::>(J)
::::>c:(-IO·
,/"\ 0
~V ~
I~V V ~
~·1
1PV LPV L1:>1
pt j)1-V VV P\ /¥.
~ ~V G V \..A
f\~V \~ V .i
V ;\ ~ I'O~ j.? 1\1
V '.8, V \~
I·· ~ ....- .J:V l:l
V V 1.--0 V G/' I........... I
"" V V I"'" L9 v !...1..--0 V ....-"V V V
jJo:Y I
:~V V I
[..fi v IVV
0 1957 RAINFALL&, 1958 RAINFALL
EI 1959 RAINFALL
I o 2 3 4 5 6 7 8 9 10 II 12 13 14 15 16 17 18 19 20 21 22 23 24 25
DISTANCE FROM GAGE I, IN THOUSANDS OF FEET
FIG. 2. Rainfall as a function of distance from gage 1 for 1957-59.
Rainfall and Runoff-MINK
TABLE 1
RAINFALL SUMMARY
151
DISTANCE FROMANNUAL RAINFALL (it)_.
GAGE GAGE 1 (ft) 1957 1958 1959 1957-59 avo
Ridge
1 0 5.07 5.37 3.90 4.792 2750 6.20 6.93 4.76 5.973 6400 6.89 8.02 5.87 6.934 8,650 7.42 8.79 6.63 7.625 11,050 8.17 9.59 7.05 8.276 12900 9.33 11.37 8.28 9.667 15,700 11.36 13.72 9.82 11.638 17,500 12.69 15.63 11.15 13.169' 19,730 13.92 17.54 11.88 14.45
10 22,130 15.52 19.87 12.65 16.0111 23,000 13.38 14.34 10.05 12.5912 24,100 13.91 15.01 10.78 13.2313 24,400 11.70 12.71 8.54 10.9814 24,500 10.58 11.38 7.66 9.88
Valley
30 0 5.69 6.23 4.14 5.3633 6,500 7.92 8.80 6.24 7.6634 8,800 9.13 10.17 7.55 8.95
according to a geometric regression. The pointof maximum rainfall apparently coincides veryclosely with the location of rain gage 10 (Fig.1). Because cyclonic rains have general uniformareal distribution, they increase the total amountof rainfall over an extended period duringwhich orographic rains may also occur but donot alter the distribution pattern (Mink, 1960).
Early in the investigation it became obviousthat the decrease in rainfall in the leeward direction from the point of maximum fall followsthe simple decay expression:
y = ke- a."
where y is the rainfall at any distance, X, fromthe point of maximum fall; k is the rainfall atthe maximum; a is a constant of decrement; ande is equal to 2.7128. By referring the origin togage 1 for ease of handling in volumetric computations, the rainfall may be considered to increase toward the point of maximum fall, andthe equation then becomes:
y = ke'"
where y is the rainfall at any distance, X, fromgage 1, k is the rainfall at gage 1, a is a constantof increment; and e is equal to 2.7128. The
effect of cyclonic rain on this equation wouldbe to increase the value of k. Between the pointof maximum fall and the crest of the KoolauRange the rainfall appears to decrease geometrically, but the relationship is considerably lessperfect than that of the increase from gage 1(Mink, 1960).
Figure 2 gives plots on semilogarithmic paperof rainfall on Kipapa ridge as a function of distance from gage 1 to gage 14, which is on theKoolau summit, during the years 1957-59. Thelinear relationships are drawn to accord withregression equations derived by the least squaresmethod. These equations and the equation forthe 3-year average are given in Table 2 withpertinent statistical parameters. In all cases theparameters suggest that the equations are highlyreliable. A significance test of each of the correlation coefficients shows that it is unlikelythat the correlation is a matter of chance. TheSy (standard error of estimate) values fall veryclose to the line of regression for each of the 3years and for the 3-year average. In terms ofdeviation in rainfall at any given point on theline of regression the Sy values are 1.8% for1957,7.5% for 1958,3.9% for 1959, and 4.5%for the 3-year average.
152
Rainfall on the valley floor is somewhathigher than on the ridge above it on whichgages 1-14 are located (see Table 1). The 3gages on the valley floor cover the same distance relative to the crest as the first 4 gages onthe ridge (Fig. 1). Gage 30 lies opposite gage1, gage 33 is opposite gage 3, and gage 34 isopposite gage 4. Gages on the valley floor coveronly the lower third of the distance covered bygages on the ridge, but the plot of their rainfall as a function of distance toward the crestparallels the relationship obtained on the ridge.Assuming that this parallelism holds all the wayto the point of maximum rainfall, which approximately coincides with the break in slope,then only the value of k in the rainfall equationsas determined for the ridge would be affected.
The 3-year period covered here was, overall,considerably drier than would be expected onthe basis of long-term averages obtained elsewhere in the Koolau Range. The year 1957 wasmoderately dry, having about 20% less rainfallthan normal in the wet mountains; 1958 wasnearly normal but only because of heavy summer rains; and 1959 was extraordinarily dry,having about 35% less rainfall than normal inthe wet mountains. However, the absolute quantities of rainfall have no significant effect on therelative variations in rainfall as expressed in theequations.
Use of the transformed regression equations(see Table 2) enables simple and accurate calculations of the volume of rainfall in the basin.The volume of rainfall is obtained by taking theproduct of the area under the rainfall-distancecurve for the portion of the basin subject to thecurve and the width of the basin as follows:
PACIFIC SCIENCE, Vol. XVI, April 1962
x"
V=z of ke"'dx
where V is the volume of rainfall, z is the widthof the basin, and Xn is the distance betweengage 1 and the point of maximum rainfall,which is taken to be at gage 10. However, because the outline of the basin is irregular, nosingle average width is applicable. Therefore, toassure accurate computations, the basin betweengage 1 and gage 10 was divided into 22 strips,each of which covered 1,000 ft along the axisof the valley. The distance across the basin measured at the midpoint of each strip then becamethe width of the basin for that particular strip.The volume of rainfall could then be calculatedas follows:
~ ~ xn
V=" Jk/' dx+', Jk," dx+ .. .'" Jk," ax
o ~ ~1
where V is the volume of rainfall and z is thewidth of the basin for each strip. The volumecomputed by this method for 1957 fell within3.5 % of the volume determined by carefulplanimetry of an isohyetal map whose spacingsof isohyers conformed with the equation. Thevalue of k in all the computations was taken asthe mean between the rainfall at gage 1 andgage 30 in the valley below.
For the region between the maximum rainfall and the crest of the range the average rainfall was used in volume computations because
TABLE 2
RAINFALL REGRESSION EQUATIONS FOR KIPAPA RIDGE, ANNUAL BASIS
STANDARD ERROROF ESTIMATE TRANSFORMED
REGRESSION COEFFICIENT OF (Sy) REGRESSIONPERIOD EQUATION * CORRELATION (r) (log units) EQUATIONS *1957 ]og,oy=.0221x+.7000 .9987 .0078 y=5.01 e· 05O {)X
1958 ]og,oy=.0255x+.7346 .9847 .0313 y= 5.43 e·05S0X
1959 ]og,oy=.0237x+.6073 .9950 .0165 y=4.05 eo05.16X
1957-59(average) ]og,oy=.0235x+.6886 .9933 .0190 y=4.88 e .05Hx
" y=rainfall (ft); .\'=distance (Et) from gage 1 toward summit,
Rainfall and Runoff-MINK
of the imperfect regression relationship. Thevolume thus computed for 1957 nearly equaledthe volume determined by planimetry.
Rainfall volumes for selected periods otherthan annual were obtained similarly when therainfall included an orographic component. Theequations for these periods were graphically derived, however, rather than by the method ofleast squares. These equations are believed to besufficiently accurate to give significant results.For periods during which only cyclonic rai~sfell, volumes were computed by taking the average rainfall for the basin, because cyclonic rainfall is uniformly distributed. Two such periodswere selected for analysis. For each of theseperiods the total average catch amounted tosomewhat more than 14 inches, and for eachperiod the difference in catch among the gageswas less than 10%.
STREAM FLOW
Kipapa Stream has a perennial flow at thegaging station near Wahiawa, although theminimum flow is only. a few thousand gallonsper day. The part of the basin above the stationlies far above the basal water table, which isabout 25 ft above sea level in the Pearl Harborregion. It also lies southwest of the high-levelground water in the dike complex, so that virtually all stream flow derives either from immediate rainfall or from rainfall stored temporarilyin the porous soil and vegetative mantle. A verysmall part of the stream flow may be water discharging from small, perched aquifers on localimpermeable layers in the basalt. Aside frominformation obtained from field observations onthe movement of water in the basin, evidenceof the relationship between stream water, rainfall, and soil water is apparent also from thechemistry of each of these waters.
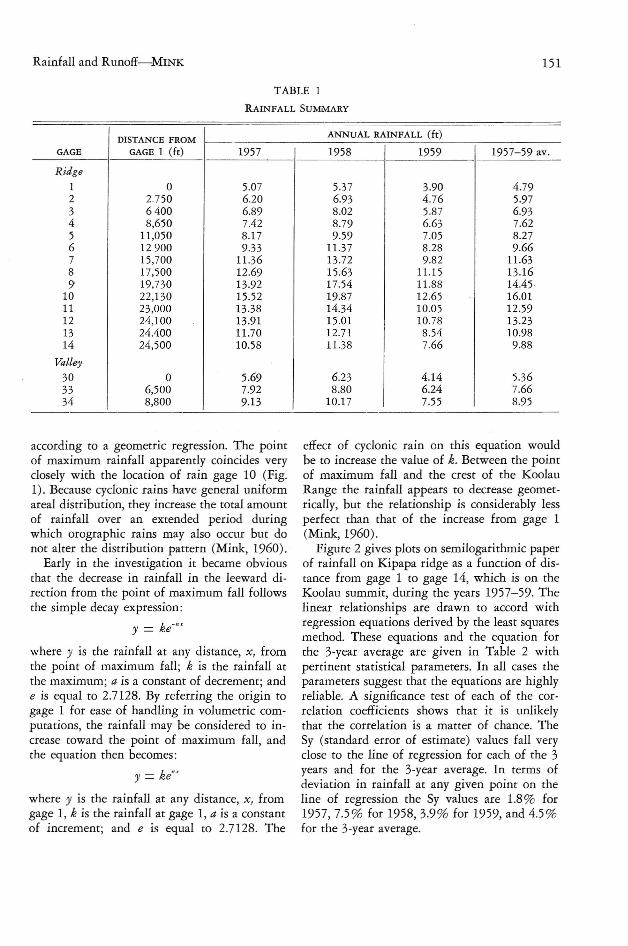
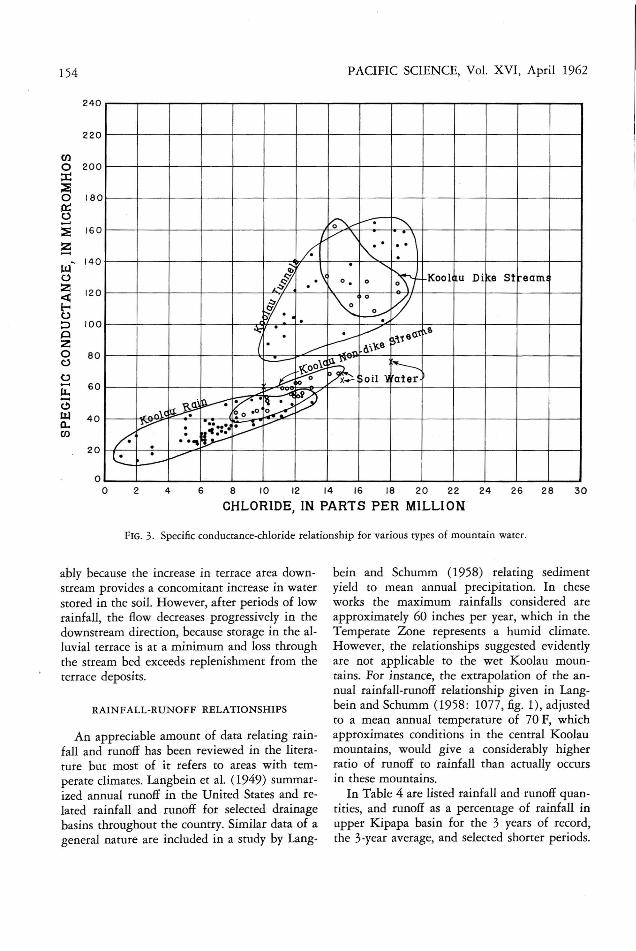
Figure 3 is a plot of specific conductance as afunction of chloride for Kipapa Stream water,rainfall, soil water, stream water flowing fromdike compartments in the Koolau Range, andwater from tunnels penetrating into Koolaudike compartments. The plots show that at similar chloride concentrations -the dike stream andrunnel waters have the highest conductances,suggesting that they have a higher burden ofdissolved solids acquired during a longer period
153
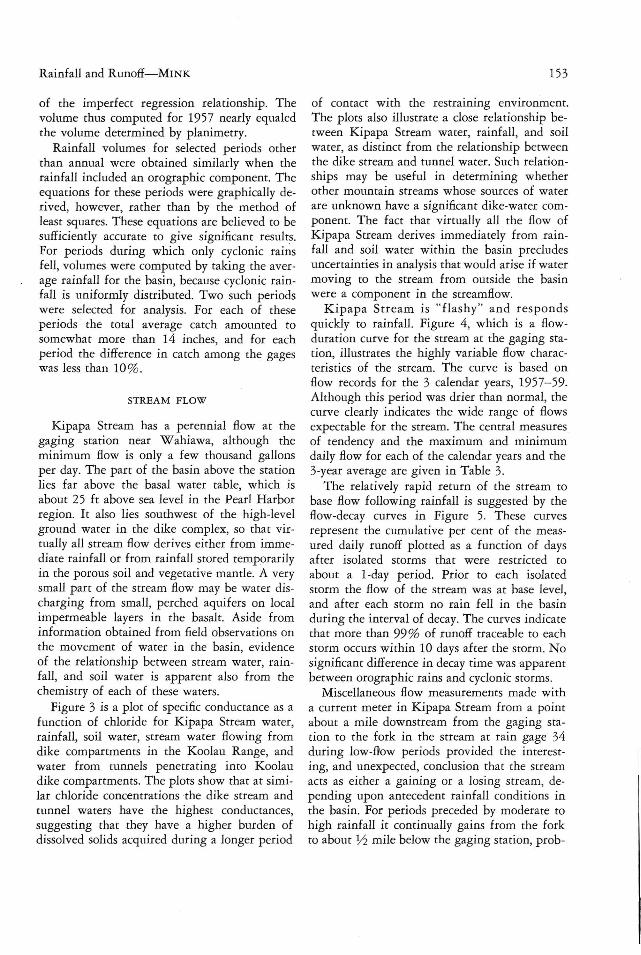
of contact with the restrammg environment.The plots also illustrate a close relationship between Kipapa Stream water, rainfall, and soilwater, as distinct from the relationship betweenthe dike stream and runnel water. Such relationships may be useful in determining whetherother mountain streams whose sources of waterare unknown have a significant dike-water component. The fact that virtually all the flow ofKipapa Stream derives immediately from rainfall and soil water within the basin precludesuncertainties in analysis that would arise if watermoving to the stream from outside the basinwere a component in the streamflow.
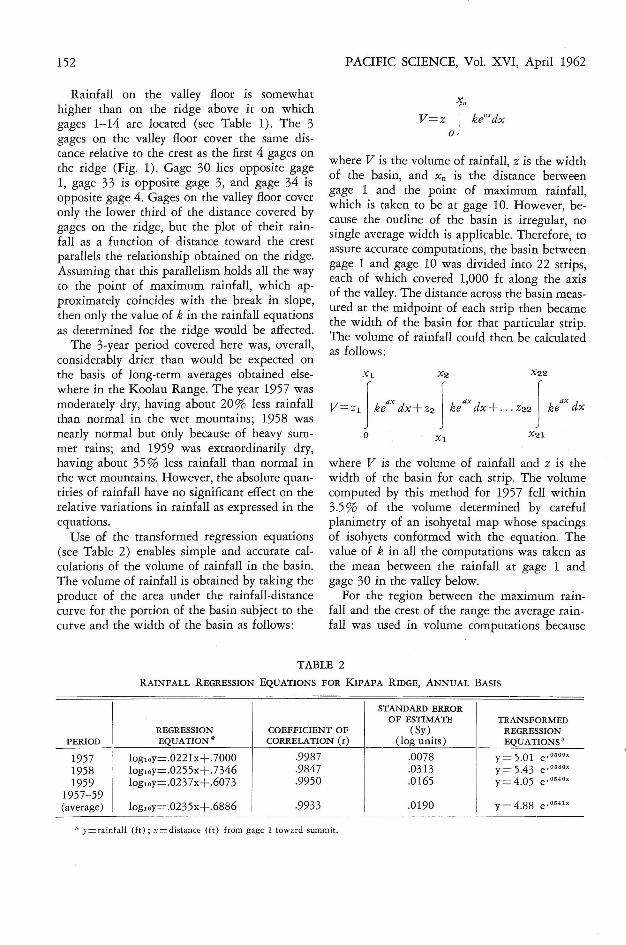
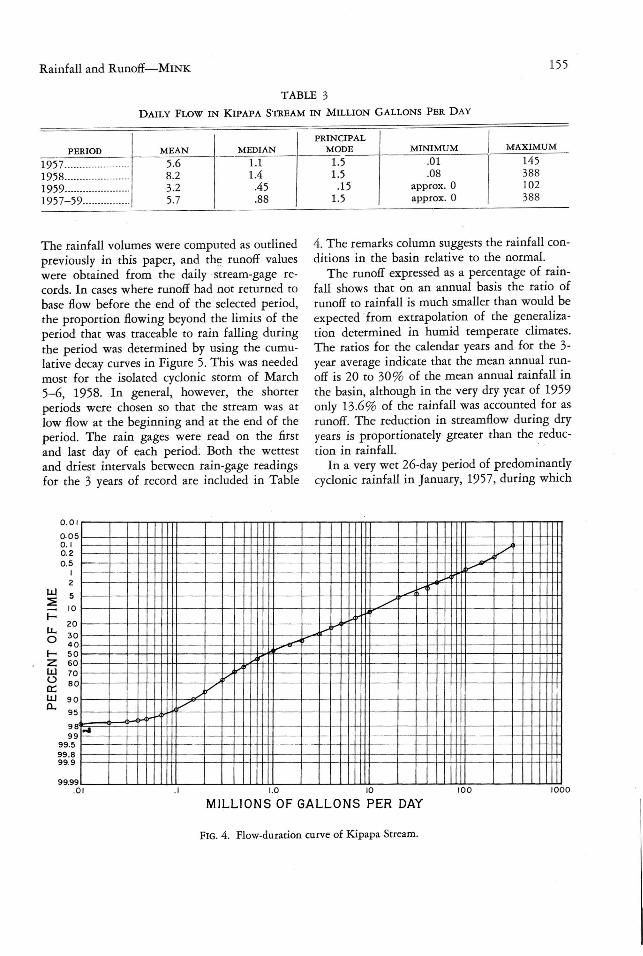
Kipapa Stream is "flashy" and respondsquickly to rainfall. Figure 4, which is a f1owduration curve for the stream at the gaging station, illustrates the highly variable flow characteristics of the stream. The curve is based onflow records for the 3 calendar years, 1957-59.Although this period was drier than normal, thecurve clearly indicates the wide range of flowsexpectable for the stream. The central measuresof tendency and the maximum and minimumdaily flow for each of the calendar years and the3-year average are given in Table 3.
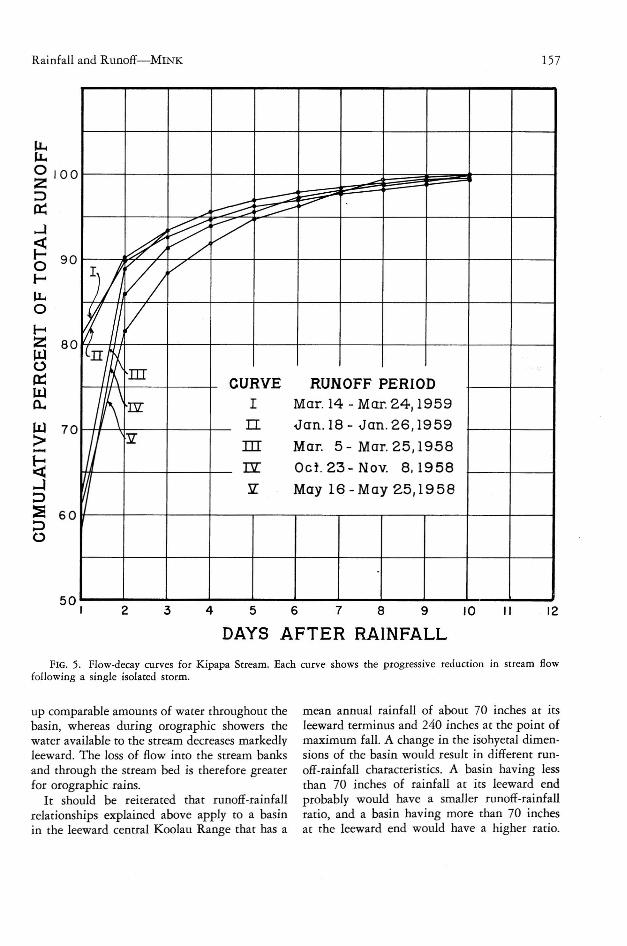
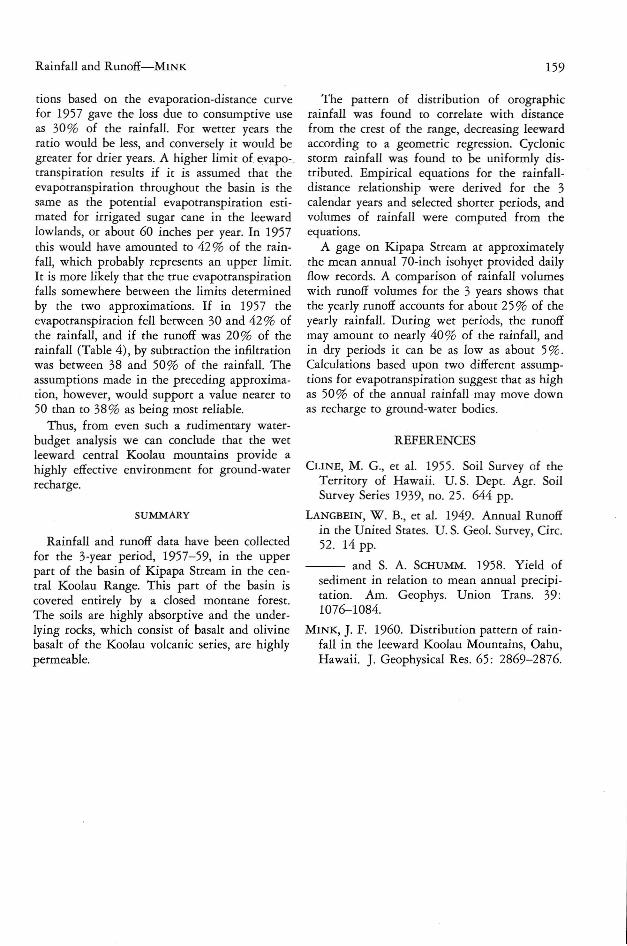
The relatively rapid return of the stream tobase flow following rainfall is suggested by theflow-decay curves in Figure 5. These curvesrepresent the cumulative per cent of the measured daily runoff plotted as a function of daysafter isolated storms that were restricted toabout a I-day period. Prior to each isolatedstorm the flow of the stream was at base level,and after each storm no rain fell in the basinduring the interval of decay. The curves indicatethat more than 99% of runoff traceable to eachstorm occurs within 10 days after the storm. Nosignificant difference in decay time was apparentbetween orographic rains and cyclonic storms.
Miscellaneous flow measurements made witha current meter in Kipapa Stream from a pointabout a mile downstream from the gaging station to the fork in the stream at rain gage 34during low-flow periods provided the interesting, and unexpected, conclusion that the streamacts as either a gaining or a losing stream, depending upon antecedent rainfall conditions inthe basin. For periods preceded by moderate tohigh rainfall it continually gains from the forkto about Y2 mile below the gaging station, prob-
154 PACIFIC SCIENCE, Vol. XVI, April 1962
3026 286 8 /0 12 14 16 18 20 22 24
CHLORIDE, IN PARTS PER MILLION42
~I-----;-~
~v \
f'(' ...."q,
~f! .'< o. 0 Kool u Dilee St eam.W· \Z
0
t1~.-\; . V p"16~1
S
I • . i.--/~ -" ~W6
1--=--
~fi f----J?IiO 0 oil 1 ater
R~~[Y" •
f~~-, 11 • 00 .0 o ;:....
~ .~V v
~.. .. '"
l' . V-
60
80
40
120
100
140
220
240
20
oo
CJ)
o 200::z::~o 180
5.....;:g 160
Z-
FIG. 3. Specific conductance-chloride relationship for various types of mountain water.
ably because the increase in terrace area downstream provides a concomitant increase in waterstored in the soil. However, after periods of lowrainfall, the flow decreases progressively in thedownstream direction, because storage in the alluvial terrace is at a minimum and loss throughthe stream bed exceeds replenishment from theterrace deposits.
RAINFALL-RUNOFF RELATIONSHIPS
An appreciable amount of data relating rainfall and runoff has been reviewed in the literature but most of it refers to areas with temperate climates. Langbein et al. (1949) summarized annual runoff in the United States and related rainfall and runoff for selected drainagebasins throughout the country. Similar data of ageneral nature are included in a study by Lang-
bein and Schumm (1958) relating sedimentyield to mean annual precipitation. In theseworks the maximum rainfalls considered areapproximately 60 inches per year, which in theTemperate Zone represents a humid climate.However, the relationships suggested evidentlyare not applicable to the wet Koolau mountains. For instance, the extrapolation of the annual rainfall-runoff relationship given in Langbein and Schumm (1958: 1077, fig. 1), adjustedto a mean annual temperature of 70 F, whichapproximates conditions in the central Koolaumountains, would give a considerably higherratio of runoff to rainfall than actually occursin these mountains.
In Table 4 are listed rainfall and runoff quantities, and runoff as a percentage of rainfall inupper Kipapa basin for the 3 years of record,the 3-year average, and selected shorter periods.
Rainfall and Runoff-MINK
TABLE 3
DAILY FLOW IN KIPAPA STREAM IN MILLION GALLONS PER DAY
155
,rAe IPERIOD MEAN MEDIAN MODE MINIMUM MAXIMUM
1957.............. --_ .... 5.6 1.1 1.5 .01 1451958...................... 8.2 1.4 1.5 .08 3881959...................... 3.2 .45 .15 approx.O 1021957-59............... 5.7 .88 1.5 approx.O 388
The rainfall volumes were computed as outlinedpreviously in this paper, and the. runoff valueswere obtained from the daily stream-gage records. In cases where runoff had not returned to
base flow before the end of the selected period,the proportion flowing beyond the limits of theperiod that was traceable to rain falling duringthe period was determined by using the cumulative decay curves in Figure 5. This was neededmost for the isolated cyclonic storm of March5-6, 1958. In general, however, the shorterperiods were chosen so that the stream was atlow flow at the beginning and at the end of theperiod. The rain gages were read on the firstand last day of each period: Both the wettestand driest intervals between rain-gage readingsfor the 3 years of record are included in Table
4. The remarks column suggests the rainfall conditions in the basin relative to the normal.
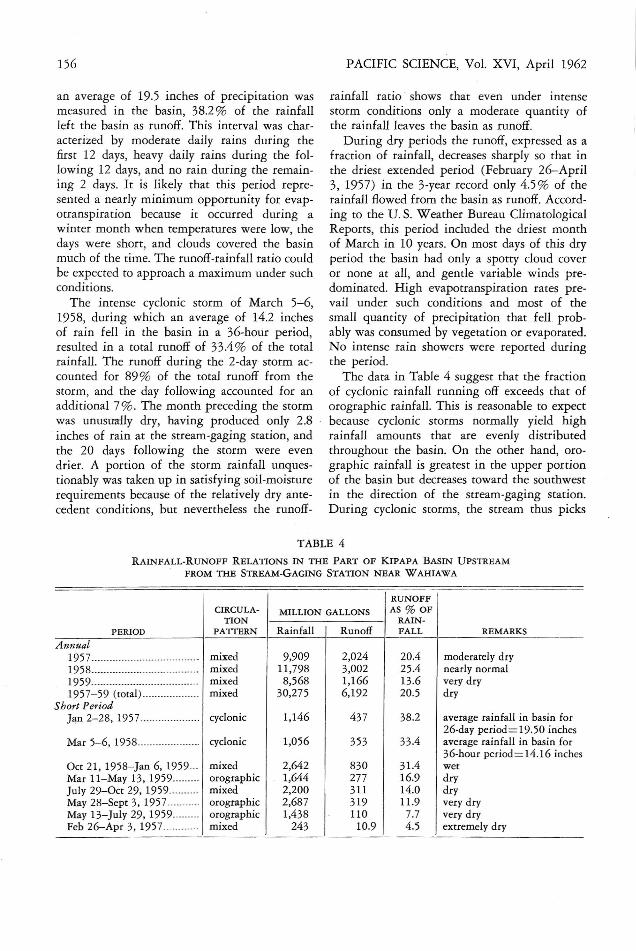
The runoff expressed as a percentage of rainfall shows that on an annual basis the ratio ofrunoff to rainfall is much smaller than would beexpected' from extrapolation of the generalization determined in humid temperate climates.The ratios for the calendar years and for the 3year average indicate that the mean annual runoff is 20 to 30% of the mean annual rainfall inthe basin, although in the very dry year of 1959only 13.6% of the rainfall was accounted for asrunoff. The reduction in streamflow during dryyears is proportionately greater than the reduction in rainfall.
In a very wet 26-day period of predominantlycyclonic rainfall in January, 1957, during which
0.01 r-'I'rTTn'-'-'ITTTTTr---r-'-.-""-TTrTT--.---r-,rrTT'-nT---'--.-"-""""""""'"
o.05~=~=S!a=m==t=tanW~=t=tE~tJiE=Ej±ti~E=±z±±±1±±~0.1o. 2 I-·_--+--~-+-+-H·..j-H- --v./"'-+-+++-+++-t0.5
I2
lJ,J 5 t--t---t--t-H-Hi+---t--+--t-++tttt--+--t-++l+1H+-~""~~V+++++-J+--+-++-J-l.-I-I-~::E I0 t---t-j-ttTtttj---r-t-t--t+tH-t----1-f-+++++I¥/~-I-1-+-H+++.J------1-1-+-I-l-~I-
20 1----+-H+t*H--t-+-t+++f-++--++-.!?K=1~-_+---I_+++++++----I~~+f..4.j..ju.. 30 t--t--t-tl--t-tttt--+--++++tt-tt---'p--1vq+I-H+f---+-t-I+++J+I---+-+-I-I-+J..J..J..lo 4 0r-:-+--++t+tt1+--+-+-+++++-+b,.4......~-1-++++J+I---+--HH--J-+.j..j.J.---l-+W-W+J-jI- 50t--'-t-+H+ttH----1-t-t-+H~=---+-H_+++J+I---+-H+t+I.J.J--+_l--+_J...+~z 60 j--j-H+l-ttH--+--t-Hft-jf++--+--++-J-+H-H---+----j~++-t+I-I--l---t--j+1-W.j.jlJ,J 70 t--t-+H+ttH----1-brq.+tHt--+-H_+++H+--+---iH+t+I.J.J--+-l-+-J...+~S 80t--t-+H+ttH----17fv+++tt1+--+-++++++++--+-++-l---l-l~~....-J~-I-W+J._l+j...... ~VW 90 t--t--t-Hiittt/""../T-++++tt1+--+-++H-H++--+-+-H--H++i---j~-I-W..J...l.-l+j0.. 95 t--t-+Hu-!1'fV'---/-t-iH--t+I+t--+-H+++I++---+-----1-+---t-.jf-.l-l..J+----l---J.-I--W++-J..1
98 ...
99 ~=t=ttim:tt=:=j=l:±llilli:-::..-=±±l±tl±Jt-+-·-+--1H-1-++++-----t--++-+-l-J...jf..l.j99.5 I-
99.8 i-===F+t~ffi+==+=+++t+t+t==+~=++j=J=~==+=qr=i:tiffi=~=±ti±l±B999 r99.99,~-..L..-.....L....l.-L.L.LJ..j-7--..L-L....L.1.J..1J..l;l;;--....L---l....L-l...W~-....L-LJw.l.lill----l-.LL1..L!l..U.01 .1 1.0 10 100 1000
MILLIONS OF GALLONS PER DAY
FIG. 4. Flow-duration curve of Kipapa Stream.
156
an average of 19.5 inches of precipitation wasmeasured in the basin, 38.2 % of the rainfallleft the basin as runoff. This interval was characterized by moderate daily rains during thefirst 12 days, heavy daily rains during the following 12 days, and no rain during the remaining 2 days. It is likely that this period represented a nearly minimum opportunity for evapotranspiration because it occurred during awinter month when temperatures were low, thedays were short, and clouds covered the basinmuch of the time. The runoff-rainfall ratio couldbe expected to approach a maximum under suchconditions.
The intense cyclonic storm of March 5..:.6,1958, during which an average of 14.2 inchesof rain fell in the basin in a 36-hour period,resulted in a total runoff of 33.4% of the totalrainfall. The runoff during the 2-day storm accounted for 89 % of the total runoff from thestorm, and the day following accounted for anadditional 7%. The month preceding the stormwas unusua:l.ly dry, having produced only 2.8inches of rain at the stream-gaging station, andthe 20 days following the storm were evendrier. A portion of the storm rainfall unquestionably was taken up in satisfying soil-moisturerequirements because of the relatively dry antecedent conditions, but nevertheless the runoff-
PACIFIC SCIENCE, Vol. XVI, April 1962
rainfall ratio shows that even under intensestorm conditions only a moderate quantity ofthe rainfall leaves the basin as runoff.
During dry periods the runoff, expressed as afraction of rainfall, decreases sharply so that inthe driest extended period (February 26-April3, 19'57) in the 3-year record only 4.5 % of therainfall flowed from the basin as runoff. According to the U. S. Weather Bureau ClimatologicalReports, this period included the driest monthof March in 10 years. On most days of this dryperiod the basin had only a spotty cloud coveror none at all, and gentle variable winds predominated. High evapotranspiration rates prevail under such conditions and most of thesmall quantity of precipitation that fell probably was consumed by vegetation or evaporated.No intense rain showers were reported duringthe period.
The data in Table 4 suggest that the fractionof cyclonic rainfall running off exceeds that oforographic rainfall. This is reasonable to expectbecause cyclonic storms normally yield highrainfall amounts that are evenly distributedthroughout the basin. On the other hand, orographic rainfall is greatest in the upper portionof the basin but decreases toward the southwestin the direction of the stream-gaging station.During cyclonic storms, the stream thus picks
TABLE 4
RAINFALL-RuNOFF RELATIONS IN THE PART OF KIPAPA BASIN UPSTREAMFROM THE STREAM-GAGING STATION NEAR WAHIAWA
RUNOFFCIRCULA- MILLION GALLONS AS % OF
TION RAIN-PERIOD PATTERN Rainfall Runoff FALL REMARKS
Annual1957................................... _ mixed 9,909 2,024 20.4 moderately dry1958.................................... mixed 11,798 3,002 25.4 nearly normal1959.................................... mixed 8,568 1,166 13.6 very dry1957-59 (rotal) ................... mixed 30,275 6,192 20.5 dry
Short PeriodJan 2-28, 1957.................. -- cyclonic 1,146 437 38.2 average rainfall in basin for
26-day period=19.50 inchesMar 5-6, 1958.................... cyclonic 1,056 353 33.4 average rainfall in basin for
36-hour period = 14.16 inchesOct 21, 1958-Jan 6, 1959... mixed 2,642 830 31.4 wetMar 11-May 13, 1959......... orographic 1,644 277 16.9 dryJuly 29-0ct 29, 1959.......... mixed 2,200 311 14.0 dryMay 28-Sept 3, 1957.......... orographic 2,687 319 11.9 very dryMay 13-July 29,1959......... orographic 1,438 110 7.7 very dryFeb 26-Apr 3,1957............ mixed 243 10.9 4.5 extremely dry
Rainfall and Runoff-MINK 157
J,L.J,L.0 100:z:::>0::-l
~o 90
.....J,L.o.....:z: 80Wo0::W0...
lJJ 70>-~.
-!::>::s 60::>o
J~~ v
~~V/
j!J//V
If /rlILII ~
1/\ ill;
CURVE RUNOFF PERIOD
\\nr I Mar. 14 - Mar. 24,1959
IT Jan. 18 - Jan. 26,1959~ ill Mar. 5 - Mar. 25,1958
IT Ocf.23-Nov.8,1958
~ May 16-May25,1958
50I 2 3 4 5 6 7 8 9 10 II 12
DAYS AFTER RAINFALL
FIG. 5. Flow-decay curves for Kipapa Stream. Each curve shows the progressive reduction in stream /lowfollowing a single isolated storm.
up comparable amounts of water throughout thebasin, whereas during orographic showers thewater available to the stream decreases markedlyleeward. The loss of flow into the stream banksand through the stream bed is therefore greaterfor orographic rains.
It should be reiterated that runoff-rainfallrelationships explained above apply to a basinin the leeward central Koolau Range that has a
mean annual rainfall of about 70 inches at itsleeward terminus and 240 inches at the point ofmaximum fall. A change in the isohyetal dimensions of the basin would result in different runoff-rainfall characteristics. A basin having lessthan 70 inches of rainfall at its leeward endprobably would have a smaller runoff-rainfallratio, and a basin having more than 70 inchesat the leeward end would have a higher ratio.
158 PACIFIC SCIENCE, Vol. XVI, April 1962
CUMULA.TIVE STREAM FLOW, IN MILLION gALLONS
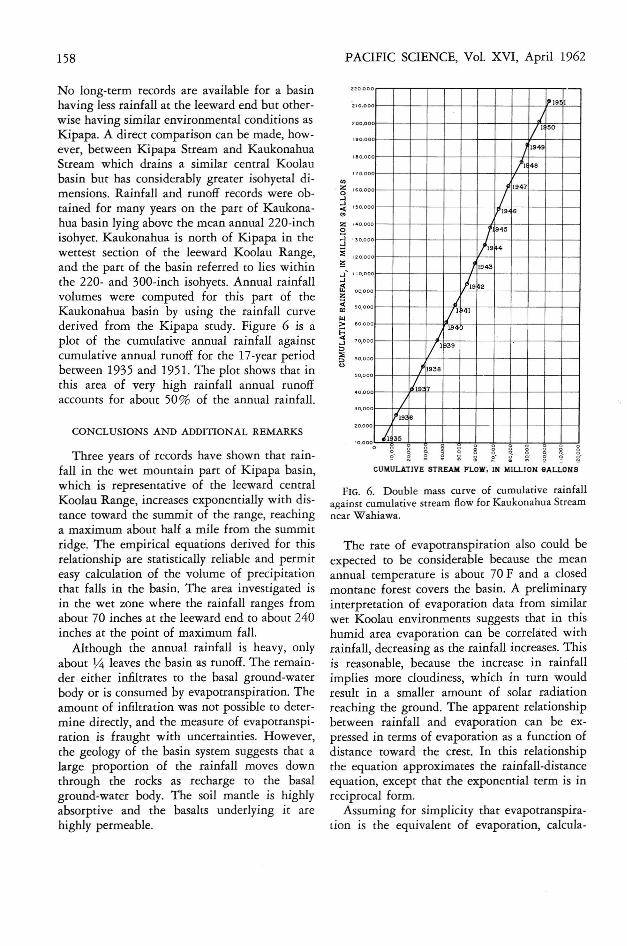
FIG. 6. Double mass curve of cumulative rainfallagainst cumulative stream flow for Kaukonahua Streamnear Wahiawa.
o 0
" 0~ g
0
0 1'19 I
0j
F 50
0
01
1949
01148
0 ~ 1947
/0
19 6
0
l'~450
1/1940
/19430
1~9 20
0.I
1141
0194
0j
1/ 1 39
0
011938
0Ilrs
0/
119 •0
/1;350
0 0 0 0 0 0 0 0
00,00
70,00
80,00
90,00
so,oo
'"~ 160.00
:::l..;
'"2:g..l
~ 120,00
~...J.... 110,00
..l
~Z;;:0:W>S..l~
~<>
30,00
~o,oo
The rate of evapotranspiration also could beexpected to be considerable because the meanannual temperature is about 70 F and a closedmontane forest covers the basin. A preliminaryinterpretation of evaporation data from similarwet Koolau environments suggests that in thishumid area evaporation can be correlated withrainfall, decreasing as the rainfall increases. Thisis reasonable, because the increase in rainfallimplies more cloudiness, which in turn wouldresult in a smaller amount of solar radiationreaching the ground. The apparent relationshipbetween rainfall and evaporation can be expressed in terms of evaporation as a function ofdistance toward the crest. In this relationshipthe equation approximates the rainfall-distanceequation, except that the exponential term is inreciprocal form.
Assuming for simplicity that evapotranspiration is the equivalent of evaporation, calcula-
'0.00
200,00
20.00
Three years of records have shown that rainfall in the wet mountain part of Kipapa basin,which is representative of the leeward centralKoolau Range, increases exponentially with distance toward the summit of the range, reachinga maximum about half a mile from the summitridge. The empirical equations derived for thisrelationship are statistically reliable and permiteasy calculation of the volume of precipitationthat falls in the basin. The area investigated isin the wet zone where the rainfall ranges fromabout 70 inches at the leeward end to about 240inches at the point of maximum fall.
Although the annual rainfall is heavy, onlyabout 1;:4 leaves the basin as runoff. The remainder either infiltrates to the basal ground-waterbody or is consumed by evapotranspiration. Theamount of infiltration was not possible to determine directly, and the measure of evapotranspiration is fraught with uncertainties. However,the geology of the basin system suggests that alarge proportion of the rainfall moves downthrough the rocks as recharge to the basalground-water body. The soil mantle is highlyabsorptive and the basalts underlying it arehighly permeable.
CONCLUSIONS AND ADDITIONAL REMARKS
No long-term records are available for a basinhaving less rainfall at the leeward end but otherwise having similar environmental conditions asK:ipapa. A direct comparison can be made, however, between Kipapa Stream and KaukonahuaStream which drains a similar central Koolaubasin but has considerably greater isohyetal dimensions. Rainfall and runoff records were obtained for many years on the part of Kaukonahua basin lying above the mean annual nO-inchisohyet. Kaukonahua is north of Kipapa in thewettest section of the leeward Koolau Range,and the part of the basin referred to lies withinthe 220- and 300-inch isohyets. Annual rainfallvolumes were computed for this part of theKaukonahua basin by using the rainfall curvederived from the Kipapa study. Figure 6 is aplot of the cumulative annual rainfall againstcumulative annual runoff for the 17-year periodbetween 1935 and 1951. The plot shows that inthis area of very high rainfall annual runoffaccounts for about 50 % of the annual rainfall.
Rainfall and Runoff-MINK
tions based on the evaporation-distance curvefor 1957 gave the loss due to consumptive useas 30% of the rainfall. For wetter years theratio would be less, and conversely it would begreater for drier years. A higher limit of evapo-.transpiration results if it is assumed that theevapotranspiration throughout the basin is thesame as the potential evapotranspiration estimated for irrigated sugar cane in the leewardlowlands, or about 60 inches per year. In 19'57this would have amounted to 42 % of the rainfall, which probably represents an upper limit.It is more likely that the true evapotranspirationfalls somewhere between the limits determinedby the twO approximations. If in 1957 theevapotranspiration fell between 30 and 42 % ofthe rainfall, and if the runoff was 20% of therainfall (Table 4), by subtraction the infiltrationwas between 38 and 50% of the rainfall. Theassumptions made in the preceding approximation, however, would support a value nearer to50 than to 38% as being most reliable.
Thus, from even such a rudimentary waterbudget analysis we can conclude that the wetleeward central Koolau mountains provide ahighly effective environment for ground-waterrecharge.
SUMMARY
Rainfall and runoff data have been collectedfor the 3-year period, 19'57-59, in the upperpart of the basin of Kipapa Stream in the central Koolau Range. This part of the basin iscovered entirely by a closed montane forest.The soils are highly absorptive and the underlying rocks, which consist of basalt and olivinebasalt of the Koolau volcanic series, are highlypermeable.
159
The panern of distribution of orographicrainfall was found to correlate with distancefrom the crest of the range, decreasing leewardaccording to a geometric regression. Cyclonicstorm rainfall was found to be uniformly distributed. Empirical equations for the rainfalldistance relationship were derived for the 3calendar years and selected shoner periods, andvolumes of rainfall were computed from theequations.
A gage on Kipapa Stream at approximatelythe mean annual 70-inch isohyet provided dailyflow records. A comparison of rainfall volumeswith runoff volumes for the 3 years shows thatthe yearly runoff accounts for about 25 % of theyearly rainfall. During wet periods, the runoffmay amount to nearly 40% of the rainfall, andin dry periods it can be as low as about 5%.Calculations based upon two different assumptions for evapotranspiration suggest that as highas 50% of the annual rainfall may move downas recharge to ground-water bodies.
REFERENCES
CLINE, M. G., et al. 1955. Soil Survey of theTerritory of Hawaii. U. S. Dept. Agr. SoilSurvey Series 1939, no. 25. 644 pp.
LANGBEIN, W. B., et al. 1949. Annual Runoffin the United States. U. S. Geol. Survey, Cire.52. 14 pp.
--- and S. A. SCHUMM. 1958. Yield ofsediment in relation to mean annual precipitation. Am. Geophys. Union Trans. 39:1076-1084.
MINK, J. F. 1960. Distribution pattern of rainfall in the leeward Koolau Mountains, Oahu,Hawaii. J. Geophysical Res. 65: 2869-2876.