Embed Size (px)
Citation preview
Document ID:Revision ID:
Effective Date:
GDE-205 1 05/11/04
Guide
Radioanalytical Data Validation
Form 412.14 10/9/2003 Rev. 05

Idaho National Engineering and Environmental Laboratory 412.09 (09/03/2002 - Rev. 7)
RADIOANALYTICAL DATA VALIDATION Identifier: Revision: Page:
GDE-205 1 1 of 78
Sample Analysis Management Guide For Additional Info: http://EDMS Effective Date: 05/11/04
Manual: Sample and Analysis Management Administrative Change Number: 111615 Entire document changed.
CONTENTS
1. INTRODUCTION ...............................................................................................................3
1.1 Purpose.....................................................................................................................3
1.2 Scope and Applicability...........................................................................................3
2. PRECAUTIONS AND LIMITATIONS..............................................................................4
3. RESPONSIBILITIES ..........................................................................................................5
4. INSTRUCTIONS.................................................................................................................5
4.1 Verification of Radioanalytical Data .......................................................................5
4.2 Completeness of the Data Report Package ..............................................................6
4.3 Radioanalytical Reporting Elements........................................................................8
4.4 Validation of Radioanalytical Data........................................................................12
4.5 Sample-Specific Parameters ..................................................................................13
4.6 Batch Control Parameters ......................................................................................27
4.7 Instrument Parameters ...........................................................................................44
4.8 Performance Evaluation Sample (see def.) (blinds [see def.]) Testing Program.....................................................................................................55
4.9 Data Validation Reporting .....................................................................................57
4.10 Post-Performance Activities ..................................................................................57
4.11 Detection Limit (see def.) Issues............................................................................58
4.12 Measurement Uncertainty Issues ...........................................................................59
5. RECORDS .........................................................................................................................59
6. DEFINITIONS...................................................................................................................59

Idaho National Engineering and Environmental Laboratory 412.09 (09/03/2002 - Rev. 7)
RADIOANALYTICAL DATA VALIDATION Identifier: Revision: Page:
GDE-205 1 2 of 78
7. REFERENCES ..................................................................................................................65
7.1 Source Requirements .............................................................................................66
8. APPENDIXES ...................................................................................................................67
Appendix A, Data Package Components...........................................................................68
Appendix B, Limitations and Validation Report ...............................................................74
TABLES
1. Standard deliverable................................................................................................................ 6
2. Standard deliverable plus raw data ......................................................................................... 7

Idaho National Engineering and Environmental Laboratory 412.09 (09/03/2002 - Rev. 7)
RADIOANALYTICAL DATA VALIDATION Identifier: Revision: Page:
GDE-205 1 3 of 78
1. INTRODUCTION
1.1 Purpose
This guide presents guidelines for verification (see def.) and validation (see def.) of radioanalytical data that are consistent among instrument types, objective, and defensible to provide data usable for a specific purpose.
Data verification and validation is a systematic process, performed externally from the data generator that applies a defined set of performance-based criteria to a body of data that can result in the qualification of data.
1.2 Scope and Applicability
Data verification is the process of checking data for completeness, correctness, consistency, and contract compliance. These requirements are contained in the statement of work (SOW) and project-specific planning documents (e.g., Sampling and Analyses Plans and Data Quality Objectives). The compliance verification process compares the laboratory data package (see def.) to requirements associated with the project and produces reports that identify those requirements that were and were not met. The verification process can identify deficiencies in the data package that can be addressed by obtaining additional information from the laboratory.
Validation is the process of examining a verified data package to provide a level of confidence in the reported analyte’s identification, concentration (including detectability), and associated measurement uncertainty (see def.). The validation process begins with a review of the verified data package to screen the areas of strength and weakness of the data. It continues with objective testing of sample data to confirm the presence or absence of an analyte and to evaluate the uncertainty of the quantification for the analyte. Each data point is then qualified as to its integrity and dependability in the context of the project requirements based on all available laboratory data.
The levels of analytical method validation and the extent of effort required to validate the data are described in GDE-7003, “Levels of Analytical Method Data Validation.” The level of validation required is generally defined at the program/project level. This guide addresses two levels of analytical data validation (i.e., Levels A and B). Level A is the maximum effort for analysis and validation. It requires a thorough assessment of the laboratory data package for contractual compliance with ER-SOW-394 and the associated task order statement of work (TOS; see def.), including calculation verification using the raw data. Level B is a reduced effort in that it does not require the submission or review of raw data. The requirements/criteria delineated in this guide are applicable to validation Level B, except where noted (for Level A) in the criteria section of each specific review parameter.

Idaho National Engineering and Environmental Laboratory 412.09 (09/03/2002 - Rev. 7)
RADIOANALYTICAL DATA VALIDATION Identifier: Revision: Page:
GDE-205 1 4 of 78
This guide specifies the validation parameters to be reviewed, defines the acceptance criteria for each parameter, and provides guidance for data qualification flags for analytical results. The validation parameters to be reviewed include instrument calibrations, calibration verification checks, quality control sample results, analytical yields (see def.), holding times, and sample preservation. This guide relies on the data deliverable requirements described in Section 13 of DOE Quality Systems for Analytical Services (QSAS)and Section 6 of the INEEL Sample and Analysis Management Statement of Work for Analytical Services (ER-SOW-394, 2004).
The product of data validation is a limitations and validations (L&V) report for each data package. The L&V report contains an overall assessment of the quality and usability of the radioanalytical data. The L&V report typically contains the assessment of data quality and the laboratory’s quality assurance/quality control (QA/QC; see def.) performance, a summary of the results data for each analysis type, a listing of the data qualifier flags (see def.) assigned to each individual analytical result, and an explanation of the flags assigned. The L&V report contains a detailed review of each parameter evaluated indicating whether the frequency requirements were met and whether the results obtained were acceptable; description of any nonconformance or deficiencies identified, and qualification of the affected data.
It is beyond the scope of this data validation guide to compare and evaluate the results of radioanalytical measurements against project data quality objectives or project action levels, as this assessment generally takes place at the project/program management level, after all pertinent information (including the data validation report) is compiled.
2. PRECAUTIONS AND LIMITATIONS
It should be noted that this guide describes method validation only and is not intended to provide guidance for validation of overall program/project objectives and requirements. Project validation is generally performed by project management personnel and involves a comprehensive review of all aspects (and objectives) of a sampling and analyses project.
The entire radioanalytical measurements process is composed of many elements and occurs in various phases/steps (from purchase, setup, calibration and maintenance of detection systems, chemical separations/sample preparation processes, sample counting, analyses, reporting, and performance monitoring of each of these elements). A considerable amount of information, data, and knowledge is generally required to technically support the accuracy (see def.), precision (see def.), and defensibility of each radioanalytical result. All the information and data necessary to properly defend each radioanalytical result are available at the laboratories; however, it would be unreasonable to request all such data be included in each data package. It is the attempt of this guide to

Idaho National Engineering and Environmental Laboratory 412.09 (09/03/2002 - Rev. 7)
RADIOANALYTICAL DATA VALIDATION Identifier: Revision: Page:
GDE-205 1 5 of 78
achieve the best possible assurance of data defensibility and usability with the information available (required/requested) with each data package.
Precautions and/or limitations that are specific to an analysis and its method data validation are described in the applicable validation sections of this guide.
3. RESPONSIBILITIES
Performer Responsibilities
Validator (see def.) Determines if all required information is presented in the data package
Performs and applies the quantitative acceptance criteria tests, and tests of detection
Makes objective judgments and decisions about the data quality and defensibility
Assigns data qualifier flags (see def.) to the radioanalytical results. The data qualifier flags indicate the validity and usability of the data and the limitations on its end use
Produces L&V report.
Sample and Analysis Management
Reviews each L&V report
Issues a cover letter with the L&V report, and distributes the report to the appropriate personnel.
4. INSTRUCTIONS
4.1 Verification of Radioanalytical Data
4.1.1 Validator: Perform the following general steps:
4.1.1.1 Perform an overview of the laboratory data report, and verify that the requested/required results data and supporting documentation are provided in the laboratory data package.
4.1.1.2 Determine and verify that laboratory operations, its data quality elements, and the resultant data are compliant with contractual agreements and requirements.
4.1.1.3 Assess the following verification review parameters:
A. Completeness of the data report package (Section 4.2).

Idaho National Engineering and Environmental Laboratory 412.09 (09/03/2002 - Rev. 7)
RADIOANALYTICAL DATA VALIDATION Identifier: Revision: Page:
GDE-205 1 6 of 78
B. Evaluation of the reported results (Section 4.3.)
4.2 Completeness of the Data Report Package
NOTE: The purpose of this review is to perform an overview of the data analysis report and ascertain whether all requested/required radioanalytical measurements data and supporting documentation are available to properly validate the data (to the requested data validation level).
This review applies to data validation Levels A and B. The specific data deliverables required for a Level A and Level B review are listed in the following criteria step.
4.2.1 Validator: Use the following criteria.
A. The required contents of the laboratory data package (see def.) are detailed in Appendix A of this guide.
NOTE: Any project-specific requirements that deviate from, or are in addition to, ER-SOW-394 will be described in a project-specific task order statement of work (TOS; see def.) made available to the validator.
B. Each data package being validated to analytical data validation Level B contains at a minimum the elements for a Standard Deliverable data package as shown in Table 1.
Table 1. Standard deliverable.
Component Name Description
Cover Page Chain of Custody Case Narrative
The cover page, Chain of Custody Form(s), and case narrative included per the requirements of ER-SOW-394 and DOE QSAS.
Sample Results Radiochemistry Sample Results Form(s) (see ER-SOW-394, Section 6.1.2.1).
Batch QC Results Radiochemistry Batch QC Results Form(s) (see ER-SOW-394, Section 6.1.2.2).
C. Each data package being validated to analytical data validation
Level A contains at a minimum the elements for Standard Deliverable Plus Raw Data as shown in Table 2.

Idaho National Engineering and Environmental Laboratory 412.09 (09/03/2002 - Rev. 7)
RADIOANALYTICAL DATA VALIDATION Identifier: Revision: Page:
GDE-205 1 7 of 78
Table 2. Standard deliverable plus raw data.
Component Name Description
Standard Deliverable
All components of the Standard Deliverable Data Package.
Raw Data Raw data (see ER-SOW-394, Section 6.1.2.3)
Laboratory control charts: A copy of the most recent instrument check source and instrument background control charts for each detector used for the analysis of the samples being reported. These control charts are up-to-date and cover the time period preceding and/or including the time of INEEL sample analysis.
Preparation Raw Data: The sample preparation raw data documented in the form of bench sheets and/or preparation logs.
Analysis Raw Data: Analysis raw data include raw data for matrix spike, duplicates, blanks, laboratory control samples (LCSs), and all samples in the batch.
Calibration Raw Data: Calibration raw data include raw data used to calibrate the instrument and the check sources for the period in which the samples were counted.
4.2.2 To perform the evaluation, compare the contents of the data package to
the data deliverables listed in Appendix A and the requirements of the associated TOS.
4.2.3 Perform the action that corresponds to the condition from the following table.
Condition Action
If all required items, forms, data, and information are included in the data package
Include a statement in the body of L&V report for this parameter.
If any required deliverables are missing from the data package that prevent the sample measurement data from being properly evaluated
Contact the laboratory, and obtain the missing information
If the required deliverable cannot be acquired from the laboratory, and it provides key information necessary to properly validate the data
Contact INEEL SAM

Idaho National Engineering and Environmental Laboratory 412.09 (09/03/2002 - Rev. 7)
RADIOANALYTICAL DATA VALIDATION Identifier: Revision: Page:
GDE-205 1 8 of 78
Condition Action
SAM: Contact project management, and determine a course of action (i.e., waive the requirement, validate to a lower level, or discontinue the validation). Communicate the course-of-action determination to the data validator
Validator: Describe the course-of-action determination in the main text of the L&V report.
If items are missing from the data package and the data package cannot be properly validated
Provide a comment that the data are contractually noncompliant and an explanation in the main text of the L&V Report.
4.3 Radioanalytical Reporting Elements
NOTE: The purpose of this review is to ensure that the required reporting elements for radioanalytical results and associated uncertainties are properly reported, are present, and compliant with ER-SOW-394 and INEEL program/project goals (as stated in the TOS).
4.3.1 Use the following criteria:
A. The reporting format used by the laboratory should include the information and data as described in ER-SOW-394, Section 6.1.2 and 6.1.3.
4.3.2 Perform the evaluation as follows:
4.3.2.1 Confirm that the laboratory name, sample delivery group (SDG; see def.) number, and TOS number is included with the radioanalytical results.
4.3.2.2 Confirm that the field and laboratory sample IDs are cross-referenced and that the field sample IDs in the laboratory analysis report correlate with those on the chain of custody (COC) (see def.) form(s).
4.3.2.3 Confirm that all the requested target radionuclides (as per TOS or the other analyses request form) have been analyzed for and are identified in the laboratory analysis report.

Idaho National Engineering and Environmental Laboratory 412.09 (09/03/2002 - Rev. 7)
RADIOANALYTICAL DATA VALIDATION Identifier: Revision: Page:
GDE-205 1 9 of 78
4.3.2.4 Confirm that any other radionuclides observed and reported in INEEL sample(s) are primarily fission and/or activation products (with some exceptions). If unexpected or uncommon/unusual radionuclides are reported, contact INEEL SAM.
4.3.2.5 INEEL SAM, in conjunction with project/program management (when applicable): Assess the data, and provide the validator with guidance on how it should be validated and addressed in the L&V report.
4.3.2.6 Validator: Confirm that the pertinent sample information is provided (sample IDs, matrix (see def.), collection date, analysis date, and sample size).
4.3.2.7 Confirm that the analytical yield (see def.) is reported as a percent value and reported analytical results are shown as the actual measured value (i.e., discrete numbers that include negative values or positive or zero values that have large uncertainties (see def.).
NOTE: Practices such as reporting results as less-than (<) values, “ND” (Not Detected), “BDL” (Below Detection Limits), or “0" (without an associated uncertainty), are not acceptable.
4.3.2.8 Confirm that the results are reported in the correct activity units of pCi/L (liquids) and pCi/g (solids) for all radioanalytical results. If other types of samples (e.g., air filters) or other INEEL project/program samples are analyzed, verify that the results are reported with the activity units specified in the TOS.
4.3.2.9 Confirm that the measured results are reported in scientific notation and with the proper number of significant figures (as determined by the precision of the measurement).
4.3.2.10 Confirm that the concentration values are rounded to the same number of decimal places as the uncertainty estimate (i.e., the result agrees decimally with the standard deviation).
4.3.2.11 Confirm that the uncertainties are reported in scientific notation and with the proper number of significant figures (as determined by the precision of the measurement).

Idaho National Engineering and Environmental Laboratory 412.09 (09/03/2002 - Rev. 7)
RADIOANALYTICAL DATA VALIDATION Identifier: Revision: Page:
GDE-205 1 10 of 78
4.3.2.12 Confirm that the uncertainty values are reported as one standard deviation and as a combined standard uncertainty (CSU; see def.). See discussion in Section 4.12 of this guide.
NOTE: Combined standard uncertainties reported by the laboratories subcontracted through INEEL SAM are evaluated during the vendor assessment (audit) to ensure that all significant uncertainty components are included and properly calculated.
4.3.2.13 Validator: Examine and evaluate any data qualifiers or false positive (see def.) flags assigned to the reported results by the laboratory. Consider these laboratory-assigned flags appropriate; however, verify their correctness or validity against the requirements in this guide.
NOTE: The “official” data qualifier flags (see def.) are those assigned by the validator. Many of the parameters reviewed are important to contractual compliance and do not require assignment of data qualifier flags. Items that relate directly to the quality of the reported results may require assignment of data qualifier flags.
4.3.3 Perform the action that corresponds to the condition from the following table.
Condition Action
If the analysis results are reported properly and correctly
Report this fact in the body of the L&V report.
Cite the following in the body of the L&V report:
A. All items reviewed and evaluated that do not meet contractual requirements.
B. Contractual noncompliance that causes any reported results to be qualified.
If the analysis report does not contain a cross-reference to field and laboratory IDs, or the IDs do not correlate with those on the accompanying chain of custody form
Attempt to obtain the correct information from the laboratory.
If the information cannot be obtained from the laboratory or the correlation of IDs cannot be rectified
Include a citation in the detailed review.

Idaho National Engineering and Environmental Laboratory 412.09 (09/03/2002 - Rev. 7)
RADIOANALYTICAL DATA VALIDATION Identifier: Revision: Page:
GDE-205 1 11 of 78
Condition Action
If the analyses results cannot be positively correlated to the samples listed on the chain of custody form
Qualify the affected sample results with an “R” flag.
If any of the targeted (requested) radionuclides are not analyzed/reported
Contact the laboratory, and request the laboratory to report the missing analysis results in revised data package submitted to SAM.
Mention the missing radioanalytical results and subsequent laboratory corrective action (e.g., revised data package to include the missing radionuclide results) in the main text of the L&V report.
If the radioanalytical results are reported as either “less-than (<) values,” “Not Detected,” “None,” “Below Detection Limits,” “0,” etc.
Assign an “R” data qualifier flag to such reported results. A “J” qualifier flag may be assigned to results reported as less-than values as they may be useable as an estimated quantity for certain applications.
If required detection limits (see def.) could not be achieved (for sample results that were expected to be �RDLs)
Provide an explanation as to why they were not met. Note the affected samples in the main text of the L&V report.
If raw data are not available to verify concentration calculations (for Level A validations)
Attempt to obtain the necessary data from the laboratory.
If the necessary raw data cannot be obtained from the laboratory
Include a comment in the body of the L&V report.
Missing raw data should not disqualify project sample results data; the noncompliance is noted in the main text of the L&V report. INEEL SAM will notify the laboratory of the deficiency in order to ensure that all future data report packages include the necessary raw data.
If raw data are not provided and the validator has substantiated evidence/suspicion that a concentration has been calculated incorrectly
Qualify the sample results as appropriate (depending on the inaccuracy of the incorrectly calculated result). Explain in the main text of the L&V report all data qualification made using the professional judgment of the validator.

Idaho National Engineering and Environmental Laboratory 412.09 (09/03/2002 - Rev. 7)
RADIOANALYTICAL DATA VALIDATION Identifier: Revision: Page:
GDE-205 1 12 of 78
4.4 Validation of Radioanalytical Data
4.4.1 Validator: Perform the data validation process as follows:
4.4.1.1 Evaluate data validation parameters (e.g., instrument calibrations, quality control and performance evaluation information, and measurement results and uncertainties) for each analysis result reported in the laboratory data package, against the acceptance criteria specified in this guide. Acceptance-criteria-tests and tests-of-detection are quantitative methods that are used to help ascertain the quality, defensibility, and limitations of the analytical data.
4.4.1.2 Assess the following validation review parameters:
A. Sample-Specific Parameters (Section 4.5)
Sample preservation (Section 4.5.1)
Holding times (Section 4.5.2)
Analytical yields (see def.) (Section 4.5.3)
Required Detection Level (see def.) (Section 4.5.4)
Nuclide Identification (level A validation only) (Section 4.5.5)
Quantification and combined standard uncertainty (see def.) (level A validation only) (Section 4.5.6)
Detectability (Section 4.5.7)
B. Batch Control Parameters (Section 4.6)
Laboratory control samples (see def.) analysis (Section 4.6.1)
Matrix spike analysis (Section 4.6.2)
Method blank samples (Section 4.6.3)
Duplicate sample analysis (Section 4.6.4)

Idaho National Engineering and Environmental Laboratory 412.09 (09/03/2002 - Rev. 7)
RADIOANALYTICAL DATA VALIDATION Identifier: Revision: Page:
GDE-205 1 13 of 78
C. Instrument Parameters (level A validation only) (Section 4.7)
Counting efficiency calibration (see def.) (Section 4.7.1)
Energy calibration (see def.) (Section 4.7.2)
Background (see def.) determination (Section 4.7.3).
4.4.1.3 Determine/assign data qualification flags to each analytical result, based on the results of quality control (QC) indicators, prescribed acceptance limits, acceptance-criteria-tests, and the professional judgment of the validator.
4.4.1.4 Issue a Limitations and Validation report.
4.5 Sample-Specific Parameters
4.5.1 Sample Preservation
NOTE: Proper sample preservation is necessary to ensure that the analytes of interest are not lost or degraded in such a way as to impact data use. Metals have been shown to adhere to the sides of sample containers if aqueous samples are not maintained below a pH of 2. Likewise, certain anionic species require either basic or no preservation because acidification can liberate the species of interest from the sample, thereby negating quantification (e.g., tritium, carbon-14, and iodine).
4.5.1.1 Use the following criteria:
A. The use of a preservative (typically nitric or hydrochloric acid to pH < 2) for aqueous samples is required. Some radionuclides (e.g., C-14, iodine and its ions) become volatile when in contact with acid; therefore, samples being analyzed for such radionuclides should not be preserved.
B. Sample preservation (pH) is checked, verified, and documented by the laboratory analyst prior to analysis.
C. If the preservative has to be added to the samples at the laboratory, the samples are held for a minimum of 16 hours prior to starting the analysis.

Idaho National Engineering and Environmental Laboratory 412.09 (09/03/2002 - Rev. 7)
RADIOANALYTICAL DATA VALIDATION Identifier: Revision: Page:
GDE-205 1 14 of 78
4.5.1.2 Verify that documentation exists to show that all appropriate aqueous samples in the SDG were properly preserved (pH <2) prior to analysis.
NOTE: The COC form generally shows the preservative added. Also, the laboratory analysis report shows verification of preservation (measured pH) for each sample.
4.5.1.3 Perform the action that corresponds to the condition from the following table.
Condition Action
If all appropriate aqueous samples in the SDG were properly preserved
Assign the project sample results no qualifier flags.
If an aqueous sample had to be preserved at the laboratory after sample collection
Include a comment in the body of the L&V report. Assign the project sample results no qualifier flags.
If an aqueous sample was not properly preserved prior to analysis
Include a comment in the body of the L&V report.
Qualify the applicable project sample results that are not statistically positive (see def.) with a “UJ” flag.
Qualify the applicable project sample results that are statistically positive with a “J” flag.
4.5.2 Sample Holding Time
NOTE: The purpose of this evaluation is to ensure that sample holding times were not exceeded. Sample holding time is generally not an issue with acid-preserved aqueous samples or solid matrices, unless the radionuclides of interest have very short half-lives or are known to be volatile.
4.5.2.1 Determine sample holding time by reviewing the sample collection date and time listed on the COC form, and the collection and analysis date shown in the laboratory analysis report.

Idaho National Engineering and Environmental Laboratory 412.09 (09/03/2002 - Rev. 7)
RADIOANALYTICAL DATA VALIDATION Identifier: Revision: Page:
GDE-205 1 15 of 78
4.5.2.2 Use the following criteria:
A. The maximum sample holding time established for gross alpha and gross beta measurements is 6 months (per 40 CFR 136). This holding time is often applied to all radionuclide analyses, but is not required.
B. If the project/program objectives require analysis of volatile radionuclides (such as, iodine and its ions, 3H or 14C) or INEEL-targeted radionuclides with short half-lives (e.g., 131I), the holding times will be adjusted accordingly. The targeted (requested) radionuclides and altered holding times will be listed and described in the specific TOS. For I-129 analysis, if the samples are collected in high density polyethylene (HDPE) containers, they are to be analyzed within 28 days from the sample collection date. Samples for I-129 collected in amber-colored glass containers are anticipated to have a holding time of 6 months or less.
4.5.2.3 Perform evaluation as follows.
4.5.2.3.1 Verify that the time interval between sample collection and sample analysis is approximately 6 months or less.
4.5.2.3.2 Determine if any short-lived or volatile radionuclides were targeted (requested) for analysis.
NOTE 1: Targeted radionuclides are described in the specific TOS.

Idaho National Engineering and Environmental Laboratory 412.09 (09/03/2002 - Rev. 7)
RADIOANALYTICAL DATA VALIDATION Identifier: Revision: Page:
GDE-205 1 16 of 78
NOTE 2: “Short-lived” is a relative term, and will require some judgment on the part of the validator, but in the context of this guide, it generally refers to radionuclides that have not decayed more than approximately 5 half-lives from the time of sample collection. This half-life criteria is highly dependent on the initial activity at the time of collection and the detection limits that must be achieved. The amount of time the contaminating radionuclide has been (or resided) in the field is also a consideration, but such information is generally not available to the validator and will be evaluated at the INEEL project management level.
NOTE 3: Volatile radionuclides can often be stabilized (to some degree) by various chemical methods or sample preparation/preservation techniques. Stabilizing a volatile radionuclide may only extend the holding time for a relatively short period; therefore, it is important to refer to the project-specific TOS for allowable holding times.
NOTE: Action determinations for holding times are entirely dependent on the radionuclides being analyzed. The 6-month holding time will apply to the majority of targeted radionuclides in the environment at the INEEL. However, in cases where the radionuclides being sought are either volatile or have short half-lives, the holding times specified in the TOS should be used as the action guideline.
4.5.2.4 Note all observations made in the L&V report.
4.5.2.5 Perform the action that corresponds to the condition from the following table.

Idaho National Engineering and Environmental Laboratory 412.09 (09/03/2002 - Rev. 7)
RADIOANALYTICAL DATA VALIDATION Identifier: Revision: Page:
GDE-205 1 17 of 78
Condition Action
If the sample holding time is approximately 6 months or less
State this fact in the body of the L&V report. The project sample results receive no qualifier flags.
If the holding time for short-lived or volatile radionuclides was not met; or if the applicable 6-month holding time is not met
Include a comment regarding the missed holding time in the body of the L&V report.
Qualify applicable project sample results that are statistically positive with a “J” flag.
Qualify applicable project sample results that are not statistically positive with a “UJ” flag.
4.5.3 Analytical Yields (see def.)
NOTE: The purpose of this review is to ensure that the analytical yields associated with the measured sample results are reasonable and meet ER-SOW-394 acceptance criteria. A tracer (see def.) or carrier (see def.) is used to measure and correct for losses that might have occurred during sample processing, separation, and quantification of the analyte (in a specific sample). Abnormally high or low chemical yields might be indicative of inappropriate separation methods for certain matrix interferences, instrument problems, calibration errors, or errors in the preparation of the tracer or carrier.
4.5.3.1 Use the following criteria:
A. A measured yield is reported on the sample result forms for each sample result that requires a chemical monitor or radioactive tracer.
B. The recovery range of isotopic tracers is 30%–110%. The recovery range of stable carriers is 40% - 110%.
C. Alpha spectrometry tracer peak criteria are full width half maximum (FWHM) for the tracer peak less than 100 keV and/or the peak energy within ±50 keV of the known peak energy.
NOTE: Abnormally low chemical yields can cause a large uncertainty (see def.) in affected sample results. Yields greater than expected (>100%) can add negative bias (see def.) of at least the amount greater than 100 and may indicate the presence of the radionuclide in the sample, contamination, or instrument problems.

Idaho National Engineering and Environmental Laboratory 412.09 (09/03/2002 - Rev. 7)
RADIOANALYTICAL DATA VALIDATION Identifier: Revision: Page:
GDE-205 1 18 of 78
4.5.3.2 Perform evaluation as follows:
4.5.3.2.1 Verify that a percent yield is reported for each sample result for analyses that require a carrier or tracer.
4.5.3.2.2 Compare the calculated/reported yield with the acceptance criteria.
4.5.3.2.3 (Level A validation) For alpha spectrometry data, verify the full width half maximum (FWHM) for the tracer peak is less than 100 keV and/or the peak energy falls within ±50 keV of the known peak energy.
NOTE: When yields of an entire batch analysis are low (or high) due to possible matrix problems, some judgment on the part of the validator is required.
4.5.3.3 Perform the action that corresponds to the condition from the following table.
Condition Action
If the sample-specific tracer recovery is 30–110% or the carrier recovery is 40–110%
State this fact in the body of the L&V report. The project sample results receive no qualifier flags.
If the sample-specific tracer recovery is greater than 110% and less than 120%, a sample result that is statistically positive
Qualify with a “J” flag.
If the sample-specific tracer recovery is greater than 110% and less than 120%, a sample result that is NOT statistically positive
Qualify with a “U” flag.
If the sample-specific tracer recovery is greater than 120%, a sample result is statistically positive
Qualify with an “R” flag.
If the sample-specific tracer recovery is greater than 120%, a sample result is NOT statistically positive
Qualify with a “U” flag.
If the sample-specific carrier recovery is less than 40% but greater than 10% or the tracer recovery is less than 30% but greater than 10%, a sample result that is statistically positive
Qualify with a “J” flag.
If the sample-specific carrier recovery is less than 40% but greater than 10% or the tracer recovery is less than 30% but greater than 10%, a sample result that is NOT statistically positive
Qualify with a “U” flag.

Idaho National Engineering and Environmental Laboratory 412.09 (09/03/2002 - Rev. 7)
RADIOANALYTICAL DATA VALIDATION Identifier: Revision: Page:
GDE-205 1 19 of 78
Condition Action
If a low (questionable) yield has caused a project sample result to exceed the required detection level (RDL)
Include a comment that the analytical yield caused a contractual noncompliance in the body of the L&V report.
If the sample-specific carrier recovery or tracer recovery is less than 10%
Qualify the sample result with an “R” flag.
(Level A validation) For alpha spectrometry measurements, if the full width half maximum (FWHM) for the tracer peak exceeds 100 keV and/or the peak energy does not fall within ±50 keV of the known peak energy
Note in the body of the L&V report.
4.5.4 Required Detection Level (see def.)
NOTE: The reported analytical results are evaluated to determine if the required detection level has been met. An estimate of the minimum detectable concentration (MDC; see def.) for specific data points can be made using the reported measurement uncertainty. The MDC calculation determines if the required detection level (RDL), as specified in the SOW or project-specific TOS, has been met. For this test, it is assumed that the calculation of the a priori MDC for the sample measurement is based on a 5% probability of falsely concluding that the analyte was greater than the decision level (Lc) and a 5% probability of falsely concluding that the analyte concentration was less than the Lc (k∀ =k∃ = 1.65). The decision level (or critical level) is the minimum measured analyte quantity or concentration (a posteriori result) required to give a stated confidence that a positive amount of the analyte is present (the analyte level considered different than background at the 5% false detection probability level).
4.5.4.1 Use the following criteria:
A. The reported analytical results are evaluated to determine if the required detection level has been met.
4.5.4.2 Verify that the MDC meets the RDL.

Idaho National Engineering and Environmental Laboratory 412.09 (09/03/2002 - Rev. 7)
RADIOANALYTICAL DATA VALIDATION Identifier: Revision: Page:
GDE-205 1 20 of 78
4.5.4.2.1 For each result that is less than the Lc, determine if the RDL has been met, using the following test:
RDLCSUk ≤×
where:
CSU is combined standard uncertainty;
k varies according to the number of counts observed in the background.
For paired observations, this test is applicable for background counts as small as 7. Typically, k = 4 for applications of alpha and gamma (depends on the energy) spectrometry and alpha gas proportional counting when the number of background counts is ~ 7. For applications of beta liquid scintillation and beta gas proportional counting, a k value = 3.5 can be used when the number of background counts is greater than 60. Refer to Currie and ANSI N42.23 for estimating the k value.
4.5.4.3 Perform the action that corresponds to the condition from the following table.
Condition Action
If the equation above is true The estimated MDC is less than the RDL and the contract RDL has been met.
If the above equation is false The reported MDC exceeds the RDL. Determine reason for the elevated MDC, and provide explanation in the L&V report. The affected project sample result receives no qualifier flag.
NOTE 1: When a minimum detectable concentration (MDC; see def.) is not listed or is questionable, an achieved detection limit (see def.) can be approximated/inferred directly from the uncertainty (standard deviation) associated with the sample measurement. For the purposes of this guide, the reported 1σ standard deviation (CSU) multiplied by three will provide a reasonable representation or estimation of the achieved detection limit.

Idaho National Engineering and Environmental Laboratory 412.09 (09/03/2002 - Rev. 7)
RADIOANALYTICAL DATA VALIDATION Identifier: Revision: Page:
GDE-205 1 21 of 78
NOTE 2: The laboratory is required to provide an explanation (in the case narrative) for those measurements that exceeded RDLs (e.g., insufficient sample volumes were received, the samples contained elevated levels of radioactivity, there were sample matrix or matrix interference problems, or the analytical yields were too low).
4.5.5 Nuclide Identification
NOTE: For Level A validation. The purpose is to ensure proper identification of the analyte within a sample. Analyte identification is achieved by two principal methods: (1) spectrometric analyses that identify the radionuclide by its characteristic radiation emission (alpha, x-ray, or gamma-ray energy) or by the subsequent photon detection after neutron activation and (2) the chemical isolation of the chemical element or chemical group of elements followed by radiometric analysis of the analyte's generic or characteristic radiation emission. For some radiochemical analyses followed by gross alpha or beta counting, the identification of short-lived analytes may be verified by measuring the analyte's half-life.
It should be verified that the raw spectral data and/or peak search and identification reports have been included in the data package for each analysis.
The validation process encompasses various qualitative evaluations and quantitative tests, qualifier assignment, and a validation report by the assessor.
Spectral and radionuclide contamination interferences can lead to significant biases if not properly addressed. The laboratory should have administrative or computerized methods to detect, evaluate, and adjust for these interferences. Visual inspection of alpha and gamma-ray spectrometric data and the analyte region of interest for liquid scintillation counting is the most common approach. Quantitative estimates of the bias as a result of the interference should be made based on the standard correction methodologies.

Idaho National Engineering and Environmental Laboratory 412.09 (09/03/2002 - Rev. 7)
RADIOANALYTICAL DATA VALIDATION Identifier: Revision: Page:
GDE-205 1 22 of 78
4.5.6 Quantification and Combined Standard Uncertainty (see def.) Propagation
NOTE 1: For Level A validation: The purpose is to confirm that sufficient raw data are available to verify and reproduce the final reported results.
NOTE 2: Calculation verifications are not required for radioanalytical data packages being validated to analytical data validation Level B.
The quantification of specific radionuclides should be contained as part of the measurement quality objectives and laboratory contract specifications. Industry practice and American National Standards Institute (ANSI) guidance include the calculation and reporting of the analyte concentration and its CSU.
The recommended approach is to add the individual fractional uncertainties of the parameters in quadrature (i.e., the square root of the sum of the squares). More detailed information can be obtained from ANSI N42.12 and from the International Standards Organization’s (ISO’s) Guide to the Expression of Uncertainty in Measurement.
The CSU is calculated by summing the relative uncertainties of each parameter in quadrature. The relative uncertainty of each parameter should be determined through experimentation or estimation, with documentation made available during the post-award audit process or provided as part of the data verification process. Certain parameter uncertainties, such as Poisson counting statistics, chemical yields from radiotracers, etc., are determined at the time of quantification and are provided for the data verification process. With the exception of counting and chemical yielding parameters, only parameters having a relative uncertainty (1σ) greater than 1−2% need to be considered in the CSU calculation process.
NOTE 3: Alpha and gamma spectrometric data are analyzed with computer analysis software involving sophisticated photopeak fitting algorithms. The spectrometric analysis program/software used by each subcontracted laboratory is evaluated and approved by INEEL SAM as part of the subcontracting process. The computer analysis software/algorithms are essentially tested and monitored with each quality control sample that is analyzed.
4.5.6.1 Perform the evaluation as follows:
4.5.6.1.1 Spot-check approximately 10% of the analytical results to verify that the calculations

Idaho National Engineering and Environmental Laboratory 412.09 (09/03/2002 - Rev. 7)
RADIOANALYTICAL DATA VALIDATION Identifier: Revision: Page:
GDE-205 1 23 of 78
are being performed correctly and consistently. In cases where very few samples are in the SDG (i.e., <10), verify at least two of the analytical results. Provide evidence (e.g., a worksheet) that shows the recalculated results and how they were calculated. Ensure that:
A. No transcriptions errors have occurred in manual data entries or electronic data transfers
B. The quantification calculations are correct by hand calculations when possible.
4.5.6.1.2 Confirm that all data relative to the quantification process have been received.
4.5.6.1.3 Ensure that correct dates and time intervals are used in the equations for radioactive decay and ingrowth.
4.5.6.1.4 Include the following for calculation verifications of raw data.
4.5.6.1.4.1 For gross alpha, gross beta and 90Sr, verify that the density of the sample residue on the counting planchet is ≤5 mg/cm2 (i.e., ≤ 100 mg total solids for a 2-inch planchet).
4.5.6.1.4.2 Verify that the results have been corrected for mass attenuation (self absorption) and that the dissolved solid content of the sample aliquot (see def.) is within the mass range of the attenuation curve.
4.5.6.1.4.3 For high-activity samples, verify that the results have been corrected for alpha-to-beta or beta-to-alpha crosstalk.

Idaho National Engineering and Environmental Laboratory 412.09 (09/03/2002 - Rev. 7)
RADIOANALYTICAL DATA VALIDATION Identifier: Revision: Page:
GDE-205 1 24 of 78
4.5.6.1.4.4 Verify that the results obtained by liquid scintillation counting have been corrected for quenching effects.
4.5.6.2 Evaluate the parametric values (e.g., baselines for spectra, quench factors, absorption factors for precipitates, or batch correction factors) used in the equations to calculate the result and CSU.
NOTE: Errors in parameter values would not be found during a data verification process even if the correct equations were used but the parametric values were incorrect.
4.5.6.3 Review raw data to find spectral resolution problems interfering or overlapping peaks.
4.5.6.4 Perform the action that corresponds to the condition from the following table.
Condition Action
If data are reported as a result of a parametric outlier
Note this in the body of the L&V report.
Qualify all affected data as either estimated “J” or rejected “R”, depending on the magnitude of the bias introduced
If spectral resolution problems, interfering or overlapping peaks
Note this fact in the body of the L&V report.
If the result is estimated as a result of the problem, interference, or peak overlap, then qualify the sample result with a “J” flag
If the result is incorrect based on the magnitude of the bias introduced, then qualify the sample result with a “R” flag
If it is found that the analyte concentration and CSU were not properly calculated
Qualify the data as estimated “J” or rejected “R”, depending on the magnitude of the bias introduced.
Test for excessive uncertainty. If supporting sample data parameters are not available to verify through an independent calculation of the reported result and CSU
Apply the following test to determine excess reported uncertainty for concentrations greater than 10 times the MDC:
SRCSU ×> 25.0 ,
where:
Rs =Sample result in the same unit as CSU.

Idaho National Engineering and Environmental Laboratory 412.09 (09/03/2002 - Rev. 7)
RADIOANALYTICAL DATA VALIDATION Identifier: Revision: Page:
GDE-205 1 25 of 78
Condition Action
If the above equation is true There is excessive uncertainty in the measurement and further review is required. Qualify the sample data with a “J” flag.
Test for biased negative results. Evaluate negative results against the reported 2σ CSU to determine if there is a negative bias resulting from improper background subtraction. If the net negative result is more negative than the 2σ CSU
Qualify the data as estimated “J”.
4.5.7 Detectability
NOTE: An analyte will be considered as positively detected if the result is above the sample-specific decision level (Lc). The a posteriori decision level or critical value, Lc, should be set at a 95% probability. The decision level, to be calculated for each measurement result, determines the minimum activity or concentration result that can be considered as statistically different from blank results. Therefore, the Lc is the level at which the blank results will not exceed more than 5% of the time. ANSI N42.23 and Currie provide information and guidance on the calculational methods used to estimate the MDC and Lc. The formula and data used for their derivation are reviewed during the on-site laboratory audit.
4.5.7.1 Use the following criteria:
A. The Lc determines the level of the analyte concentration in a sample or blank that would be considered statistically different from background with a 5% probability of false detection, k∀ = 1.65. The 1.65 value is rounded to 2 to approximate the 95% confidence level.
4.5.7.2 Perform the evaluation as follows:
4.5.7.2.1 For sample results close to or less than the Lc, the Lc can be estimated by the following equation:
Rc CSUL ×= 2 ,

Idaho National Engineering and Environmental Laboratory 412.09 (09/03/2002 - Rev. 7)
RADIOANALYTICAL DATA VALIDATION Identifier: Revision: Page:
GDE-205 1 26 of 78
where:
Lc = decision level (in pCi/unit);
CSUR = combined standard uncertainty of the result, R (pCi/unit).
Even though the CSU will be larger for samples results greater than the Lc, this equation can always be used for the positive detection decision. Using this equation actually evaluates the 95% probability that the true result is greater than zero.
4.5.7.3 Perform the action that corresponds to the condition from the following table.
Condition Action
If the analyte concentration is found to be less than the Lc
An undetected “U” qualifier should be applied to the data result.
If the analyte concentration is found to be greater than the Lc and less than the reported MDC
Apply the following test for additional assurance that the sample result is well above any statistical concern:
Rc CSUL ×= 399
This estimates the Lc at the 99% confidence level where k∀ = 2.58. The 2.58 value is rounded to 3 to approximate the 99% confidence level.
If the analyte concentration is less than Lc99 and the MDC associated with the sample result
Qualify the project sample result with a “UJ” flag.
If the analyte concentration is less than Lc99 and greater than the MDC associated with the sample result
Qualify the project sample result as estimated with a “J” flag.
If the analyte has not received a qualifier flag from the above tests
The analyte in the sample is considered to be statistically greater than background or blanks, (i.e., a detected analyte).

Idaho National Engineering and Environmental Laboratory 412.09 (09/03/2002 - Rev. 7)
RADIOANALYTICAL DATA VALIDATION Identifier: Revision: Page:
GDE-205 1 27 of 78
4.6 Batch Control Parameters
4.6.1 Laboratory Control Samples (see def.)
NOTE: Laboratory control samples (LCSs) are used to assess the bias and precision of the analytical process independent of field samples. The LCS results (percent recovery) are also used to indicate whether the laboratories radiochemical procedure is capable of recovering the radionuclide of interest (targeted).
4.6.1.1 Use the following criteria:
A. The laboratory is required to analyze a laboratory control sample (LCS) for each analysis type reported in the SDG.
B. The LCS matrix should be equivalent (as can be reasonably achieved) to that of the samples analyzed. Matrix specifications for gamma spectrometry LCSs are provided in ER-SOW-394. It is recognized that the LCS matrix may not simulate that of some sample matrices (e.g., waste characterization samples).
C. The LCS contains the radionuclide of interest (targeted), and/or a radionuclide that has similar chemical properties, and/or one that has similar quanta-emission energies, and/or contains a radionuclide(s) that adequately indicates the performance of the analytical process/measurement.
NOTE: Analytes for gamma spectroscopy need not be the same as the sample analyte but should fall in the approximate energy region of the spectrum (low, mid-range, or high energy) of approximately 50 keV to 2,000 keV.
D. The LCS is at least 5 times but not greater than 20 times the RDL with the following exceptions: For RDLs of low activity the analyte is at a level where the random (see def.) counting error does not exceed 10% in the counting time required to attain the RDL.
E. The measured results of the LCS are reported along with the known (reference) value.

Idaho National Engineering and Environmental Laboratory 412.09 (09/03/2002 - Rev. 7)
RADIOANALYTICAL DATA VALIDATION Identifier: Revision: Page:
GDE-205 1 28 of 78
F. The percent recovery acceptance range is established at 100 ± 25% (i.e., 75–125%), as per ER-SOW-394.
G. For gross alpha, gross beta analysis, the acceptance criteria are applicable when the analyte in the LCS is the same analyte used for the calibration curve (see ER-SOW-394 for the gross alpha, gross beta LCS requirements). The percent recovery acceptance criteria for gross alpha and gross beta measurements is 100 ± 30% when the analyte in the LCS is not the same analyte used for the calibration curve.
4.6.1.2 Perform the evaluation as follows:
4.6.1.2.1 Verify that a LCS was analyzed for each analysis type within the analytical batch.
4.6.1.2.2 Confirm that the LCS matrix was equivalent (or similar, to the extent possible) to the matrix (see def.) of the samples analyzed.
4.6.1.2.3 Confirm that the LCS contained the radionuclide(s) of interest.
4.6.1.2.4 Verify that the percent recovery of the LCS for all matrices is within the acceptance limits of 75–125%.
4.6.1.2.5 Verify the LCS is >5 times the RDL but <20 times the RDL with the following exceptions: For RDLs of low activity the analyte is at a level where the random counting error does not exceed 10% in the counting time required to attain the RDL.
4.6.1.3 Perform the action that corresponds to the condition from the following table.
Condition Action
If the LCS recovery is within the acceptable range
Note this in the body of the L&V report
If a LCS was not analyzed with the analytical batch
Note this fact in the main text of the L&V report.
Qualify the statistically positive project sample results with a “J” flag.

Idaho National Engineering and Environmental Laboratory 412.09 (09/03/2002 - Rev. 7)
RADIOANALYTICAL DATA VALIDATION Identifier: Revision: Page:
GDE-205 1 29 of 78
Condition Action
If the LCS percent recovery is outside the acceptance range
Note this fact in the main text of the L&V report.
Qualify the statistically positive project sample results with a “J” flag.
If the LCS activity is within the required range (or for low level samples, the random counting error is <10%)
Note this in the body of the L&V report.
If the LCS activity is not within the required range
Note this noncompliance in the body of the L&V report.
4.6.2 Matrix Spike Samples (see definition)
NOTE 1: The purpose of this review is to ensure that a MSS was analyzed concurrently with each set of project samples (SDG) for each required analysis and reported on the batch QC reporting form(s).
Matrix spikes consist of analysis of a replicate of an actual sample to which a known quantity of the analyte has been added. Recovery (determined as the percentage of “found” analyte relative to the known amount introduced) provides information on sample-specific matrix effects that result in an analytical bias for a given analysis batch. (e.g., H-3, C-14, etc.) Matrix spikes are added as early in the sample preparation steps as practicable.
NOTE 2: Matrix spikes are not required for radiochemical analyses if an isotopic tracer or chemical carrier is used in the analysis to determine chemical recovery (yield) for the chemical separation and sample mounting procedures. Matrix spikes are not required for gross alpha, gross beta, or gamma analysis.
4.6.2.1 Use the following criteria:
A. The laboratory is required to analyze a MSS for each matrix and applicable analysis type reported in each SDG of 20 samples or less.
B. Matrix spikes are run on a separate sample aliquot using the same analyte as that being analyzed whenever possible.
C. The matrix spike is added at a concentration of at least 5 but not greater than 20 times the RDL. In samples having known significant activity of the
Idaho National Engineering and Environmental Laboratory 412.09 (09/03/2002 - Rev. 7)
RADIOANALYTICAL DATA VALIDATION Identifier: Revision: Page:
GDE-205 1 30 of 78
radionuclides to be analyzed, more than 20 times the RDL may be added to minimize the effect of the sample activity on determination of spike recoveries.
D. The measured results of the MSS are reported along with the known spike value.
1. The matrix spike recovery acceptance range is established at 100 ± 40% (i.e., 60-140%), as per ER-SOW-394. MSSs for which the sample activity is greater than five times the spiking level are not required to meet this criterion.
4.6.2.2 Perform evaluation as follows.
4.6.2.2.1 Verify that a MSS was analyzed for each applicable analysis type within the analytical batch.
4.6.2.2.2 Verify that the MSS ID is traceable to an original sample in the SDG.
4.6.2.2.3 Verify that the spike recovery is within the acceptance limits of 60–140%.
4.6.2.2.4 For samples not expected to contain significant levels of the radionuclide to be analyzed, verify the matrix spike concentration is >5 times the RDL but <20 times the RDL.
4.6.2.2.5 For samples having known significant activity of the radionuclide to be analyzed, more than 20 times the RDL may be added to minimize the effect of the sample activity on determination of spike recoveries.
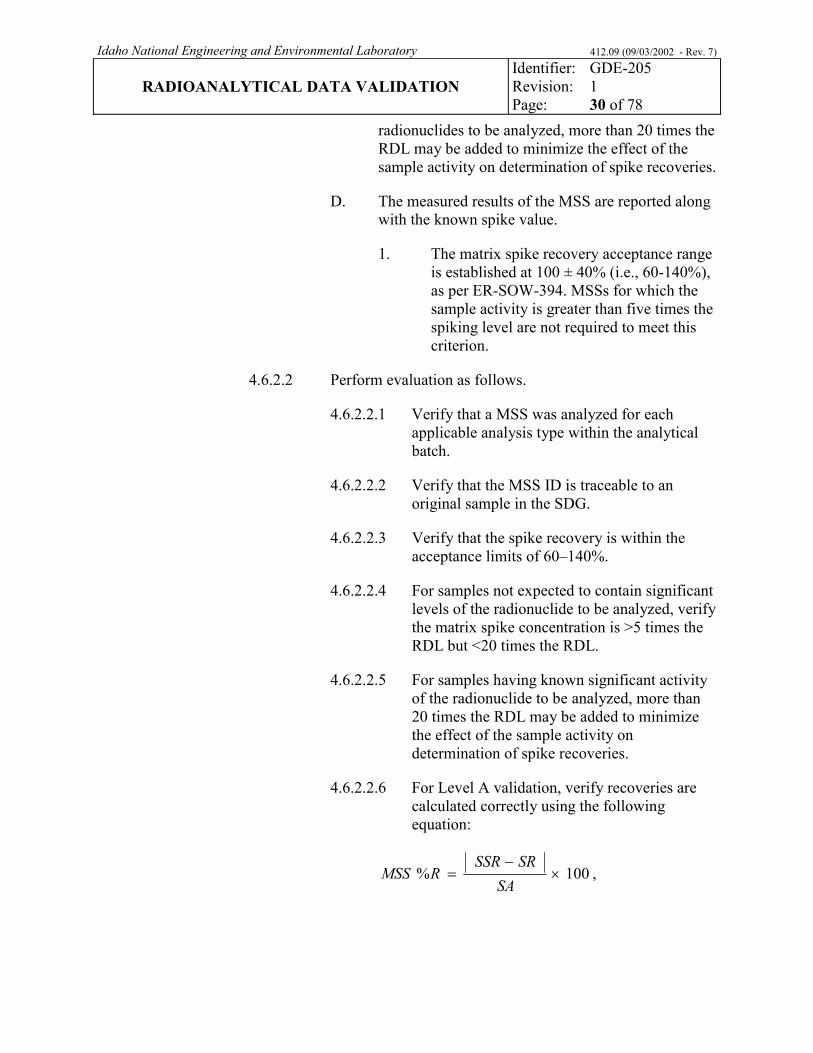
4.6.2.2.6 For Level A validation, verify recoveries are calculated correctly using the following equation:
100% ×−
=SA
SRSSRRMSS ,

Idaho National Engineering and Environmental Laboratory 412.09 (09/03/2002 - Rev. 7)
RADIOANALYTICAL DATA VALIDATION Identifier: Revision: Page:
GDE-205 1 31 of 78
where:
SSR is the spiked sample result;
SR is the sample result;
SA is the spike added.
The uncertainty associated with the preparation on the MSS should be small (>1/3 of required MSS %R) compared to the required MSS %R.
4.6.2.3 Perform the action that corresponds to the condition from the following table:
Condition Action
If the matrix spike recovery is within the acceptable range
Note this in the body of the L&V report.
If a MSS was not analyzed with the analytical batch
Note this fact in the body of the L&V report.
Qualify the project sample results with a “J” flag.
If the matrix spike recovery is outside the acceptance range
Note this fact in the body of the L&V report.
Qualify the project sample results with a “J” flag.
If the matrix spike concentration is within the required range
Note this in the body of the L&V report.
If the MSS activity is not within the required range
Note this noncompliance in the body of the L&V report.

Idaho National Engineering and Environmental Laboratory 412.09 (09/03/2002 - Rev. 7)
RADIOANALYTICAL DATA VALIDATION Identifier: Revision: Page:
GDE-205 1 32 of 78
4.6.3 Method Blank Samples
NOTE 1: The purpose of this review is to ensure a batch blank sample (method blank) was analyzed concurrently with each set of project samples (SDG). The batch blank is a laboratory-generated sample prepared with absence of the analyte of interest. Batch blanks are batch quality indicators and are carried through the entire sample analysis procedure with the samples in the batch. The blank should be of the same (or similar) matrix as the project samples and should be used as a means of determining the existence and magnitude of contamination resulting from the sample preparation and analysis/measurement process (such as from reagents, glassware, equipment, instruments and/or cross contamination between samples). Any targeted radionuclide activity detected in a blank indicates a potential positive bias in the project sample results for that radionuclide.
NOTE 2: The evaluation of field blanks and assessment of field contaminants is a process that is addressed at the project level. A project-specific request can be made for an assessment of field blank data that is separate from the data validation process. This type of evaluation would use the same conditions and corresponding actions appearing in Section 4.6.3.3 of this document.
4.6.3.1 Use the following criteria:
A. The laboratory is required to analyze a method blank (i.e., a laboratory-generated blank) for each matrix and analysis type reported in the analytical batch.
B. The method blank matrix should be equivalent (or similar, to the extent possible) to that of the samples analyzed.
C. No detectable target radionuclide activity should be found in the blank (i.e., the activity should be less than the 2σ total propagated uncertainty and its MDC).
1. The MDC of the batch blank is less than the RDL unless all samples in batch are positive.
2. If all sample results in the batch are greater than the RDL, then the batch blank MDC is

Idaho National Engineering and Environmental Laboratory 412.09 (09/03/2002 - Rev. 7)
RADIOANALYTICAL DATA VALIDATION Identifier: Revision: Page:
GDE-205 1 33 of 78
less than the activity of the least active sample in the batch of that sample.
3. If all of the samples in the batch are less than the RDL, the activity of the blank is less than the MDC.
4.6.3.2 Perform evaluation as follows.
4.6.3.2.1 Verify that a laboratory-generated blank (see def.) was analyzed with each matrix and analysis type in the analytical batch.
NOTE: In the absence of blank data (or questionable blank results), it should be noted that sample data, which is free of unwanted interferences/activity and is representative of the sample matrices being evaluated, can provide useful information to assess analytical or detector contamination problems.
4.6.3.2.2 Verify that the blank matrix was equivalent (or similar, to the extent possible) to that of the project samples analyzed.

Idaho National Engineering and Environmental Laboratory 412.09 (09/03/2002 - Rev. 7)
RADIOANALYTICAL DATA VALIDATION Identifier: Revision: Page:
GDE-205 1 34 of 78
PRECAUTION: Using a soil blank to determine whether or not a contaminant has been introduced during the sample preparation or analysis/measurement process, requires careful evaluation and interpretation on the part of the data validator. Radioactivity that is normally found in soils (both naturally occurring and man-made from fallout) can vary significantly; therefore, it can be difficult or nearly impossible to assess sample contamination for radionuclides and concentrations that are the same as those indigenous to soils. The data validator will have to exercise professional judgment when evaluating soil blanks for possible contamination, especially for those radionuclides (and concentrations) that are normally found in soils (e.g., uranium and thorium).
4.6.3.2.3 Verify the measured blank activity is not statistically positive and is less than its MDC, and the reported MDC is less than the RDL.
4.6.3.2.4 For Level A validation: Verify that the aliquot size, volume/mass of reagents, dilution, and counting times were the same as that of the samples.
4.6.3.2.5 If both the method blank and sample results are statistically positive or are greater than their respective MDC, perform the following mathematical test (mean difference [see def.]) to determine the significance of the contamination on the sample results.
NOTE: This test is the standard statistical method of assessing differences between radioactivity measurements and determining the significance of those differences. This test should not be performed if the QC blank has been subtracted from the sample result.

Idaho National Engineering and Environmental Laboratory 412.09 (09/03/2002 - Rev. 7)
RADIOANALYTICAL DATA VALIDATION Identifier: Revision: Page:
GDE-205 1 35 of 78
) + (| B - S| = MD2B
2S σσ
where:
MD = the statistical difference used to define the significance of the blank contaminant on sample results.
S = the sample result (as pCi/g or pCi/L).
B = the blank sample result (as pCi/g or pCi/L).
σS = the associated combined propagated 1σ uncertainty of the sample result (as a standard deviation).
σB = the associated combined propagated 1σ uncertainty of the blank result (as a standard deviation).
4.6.3.2.6 Determine the magnitude of the contamination interference by performing the following mathematical test:
Activity BlankActivity Sample = Factor Difference
4.6.3.2.7 Determine if the sample result is a false positive (see def.) due to either instrument background fluctuations or interferences from other radionuclides or radionuclide quanta (gamma rays and alpha particles).

Idaho National Engineering and Environmental Laboratory 412.09 (09/03/2002 - Rev. 7)
RADIOANALYTICAL DATA VALIDATION Identifier: Revision: Page:
GDE-205 1 36 of 78
NOTE: For example, in gamma spectroscopy, one of the common interferences is with Ra-226 and U-235. For example, in alpha spectroscopy, one of the common interferences is the Th-229 tracer peak tailing into the Th-230 energy region of interest.
4.6.3.3 Perform the action that corresponds to the condition from the following table.
NOTE: Action determinations for blanks that show detectable activity are dependent on various sample and analysis conditions and, therefore, will require careful evaluation and consideration on the part of the validator. In circumstances where determinations are somewhat obscure or indefinite (gray area), the data validator should use professional judgment to determine how the associated sample data should be qualified. The validator must recognize that every project sample that is analyzed and found to contain no detectable activity can provide very realistic blank data that should be considered in the final evaluation and qualification of project sample results.
Condition Action
If judgment calls and decisions are made Note judgment calls and decisions made in the L&V report.
If the blank was analyzed and the result showed no detectable activity (i.e., the result is less than the measured 2σ uncertainty and its MDC)
The project sample results receive no qualifier flag.
If batch method blank analysis was not performed at the specified frequency
Qualify the data for the affected samples as estimated “J”
If the blank result was statistically positive and greater than its MDC, and the associated project sample results are not statistically positive or are below their MDC, the effect from the blank contaminant is considered insignificant.
The project sample results receive no qualifier flag.
If both the method blank and sample results are statistically positive or are greater than their respective MDC, and the mean difference (see def.) is greater than 3 a and the sample and blank activity differ by a factor of 10 (i.e., � 10)
The project sample result receives no data qualifier flag.

Idaho National Engineering and Environmental Laboratory 412.09 (09/03/2002 - Rev. 7)
RADIOANALYTICAL DATA VALIDATION Identifier: Revision: Page:
GDE-205 1 37 of 78
Condition Action
If both the method blank and sample results are statistically positive or are greater than their respective MDC, and the mean difference is greater than 3 and the sample and blank activity differ by a factor of less than 10
Qualify the project sample result with a “J” qualifier flag.
If both the method blank and sample results are statistically positive or are greater than their respective MDC, and the mean difference is between 2 and 3b and the sample and blank activity differ by less than a factor of 10
Qualify the project sample result with a “J” qualifier flag.
If both the method blank and sample results are statistically positive or are greater than their respective MDC, and the mean difference result is between 0 and 2c and the sample and blank activity differ by less than a factor of 10 d
Qualify the project sample with a “UJ” validation flag as not statistically distinguishable from the blank.
a. A mean difference of >3 demonstrates that the contaminant had no significant effect on the sample results (i.e., the difference is great enough that there is no statistical overlap of results at the 3σ (99.7%) confidence interval [see def.]). There are cases where the mean difference can be >3 and the contaminant contribution can be significant. Such cases occur when there are conspicuous amounts of contamination and/or the measured sample and blank uncertainties are small (low). To prevent the assignment of an erroneous data qualifier for such cases, the factor-of-10 criteria are also applied.
b. Mean differences between 2 and 3 demonstrate that the contaminant had an effect on the sample results (i.e., the blank and sample result can statistically overlap at the 2σ to 3σ confidence interval). See Note a. above.
c. Mean differences between 0 and 2 demonstrate that the contaminant had a significant effect on the sample results (i.e., the blank and sample result can statistically overlap at the 1σ to 2σ confidence interval).
d. The typical statistical values for “MD” are 1.96 (at the 95% confidence interval) and 2.58 (for the 99% confidence interval). However, this guide has set the upper confidence interval at 99.7% (MD = 3) to provide additional assurance that the difference between blank and sample results is well above any possible statistical concern.
4.6.4 Duplicate Samples
NOTE 1: The purpose of this review is to ensure that a laboratory-generated duplicate (split) was analyzed concurrently with each set of project samples (SDG) for each analysis and reported on the batch QC reporting form(s). Duplicate analyses can indicate analytical variability and laboratory precision, or the homogeneity/inhomogeneity of the sample.

Idaho National Engineering and Environmental Laboratory 412.09 (09/03/2002 - Rev. 7)
RADIOANALYTICAL DATA VALIDATION Identifier: Revision: Page:
GDE-205 1 38 of 78
NOTE 2: The evaluation of field duplicates is a process that is addressed at the project level. A project-specific request can be made for an assessment of field duplicate data that is separate from the data validation process. This type of evaluation would use the same conditions and corresponding actions appearing in Section 4.6.4.4 of this document.
PRECAUTIONS AND LIMITATIONS: There are precautions and limitations that must be applied to the radioanalytical results obtained from duplicates/splits, especially for solid sample matrices (e.g., soils). When comparing results of duplicates/splits, the validator must be cognizant of the “particle nature” of radioactivity and the associated inhomogeneity problems that can exist. Inhomogeneity is an inherent problem with most solid sample matrices and can cause the radioanalytical results from duplicates/splits to vary drastically. Since sample results from different types of analysis are often compared, it is essential that sample inhomogeneity be assessed via duplicate analysis. Knowing the approximate magnitude of the sample inhomogeneity problem can be very helpful to project management when evaluating inconsistencies in sample analysis results.
Duplicates are generated both in the field and in the laboratory. Field duplicates provide information about the representativeness, homogeneity, and variances associated with a particular field sampling and characterization effort. Whereas, laboratory-generated duplicates (splits) provide a rough assessment of the homogeneity of the samples themselves, but can provide an indication of analytical variability or precision (under homogeneous conditions). The results of field duplicates are not assessed by analytical data validation because they are later evaluated by project management in their overall assessment of the data quality objectives (DQO). The results of laboratory-generated duplicates (see def.) are, however, evaluated by this guide and reported in the L&V report.
It is recognized that analysis results for duplicates of solids can vary drastically, and that using duplicates or splits of solid matrices, as a quality tool to evaluate the variability and precision associated with the analysis and measurement process, is a sensitive issue with many laboratories. Of concern to the laboratories is that the end-user of the radioanalytical data will misinterpret, misunderstand, or misrepresent the duplicate results, or make incorrect assumptions about the laboratories’ analytical abilities. This data validation process is somewhat accommodating to the issue, but is also obligated to provide a set of guidelines that can be applied objectively, consistently, and impartially to the analytical results from various laboratories. Some laboratories make considerable efforts to negate the effects of inhomogeneity, either by involved sample preparation methods or by elaborate detection system and sample container designs. Therefore, in order to treat the analytical data consistently and fairly, it is important to “consider” and assess the duplicate information provided
Idaho National Engineering and Environmental Laboratory 412.09 (09/03/2002 - Rev. 7)
RADIOANALYTICAL DATA VALIDATION Identifier: Revision: Page:
GDE-205 1 39 of 78
by all laboratories the same. The laboratory-generated duplicate (see def.) results may or may not provide a good means of measuring analytical precision or variability, but it does provide needed information on the inhomogeneity of the sample (“within container” and/or “between containers”). This information is especially useful to project management when comparing results from different analysis types, for a particular sample set. It is important for the laboratories and the data validators to realize that project sample analysis data is not usually disqualified (rejected), solely based on poor agreement between the results of duplicates/splits from solid sample matrices.
4.6.4.1 Use the following criteria:
A. The laboratory is required to analyze a laboratory-generated split (duplicate) of one of the samples, for each matrix and analysis type reported in each SDG of 20 samples or less.
B. The following limitations apply to duplicate analysis performed on solid sample matrices:
1. The acceptance criteria requirement for duplicates of solids should not be used to disqualify (reject) project sample analysis data, because it is recognized that analysis results of laboratory-generated splits of solids can vary drastically, due to matrix inhomogeneity.
NOTE: Analyzing replicates is a noteworthy practice, but should not be used as a substitute for a duplicate (unless no duplicate information is available). Using a replicate (a split that is generated after the sample digestion/dissolution process and then taken through the entire analytical process) is a good way to demonstrate the variability and precision associated with the sample analysis process but does not provide the information necessary to assess sample inhomogeneity.
C. All laboratory-generated duplicates are traceable to the sample number of the original project sample.
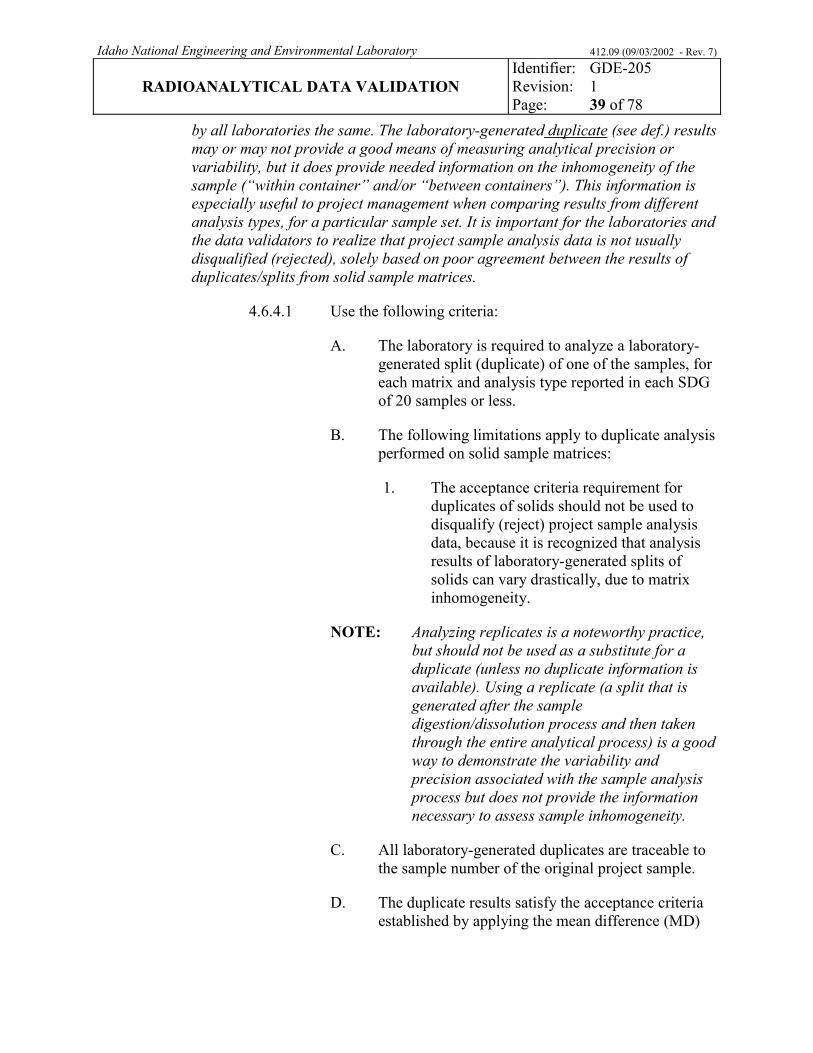
D. The duplicate results satisfy the acceptance criteria established by applying the mean difference (MD)

Idaho National Engineering and Environmental Laboratory 412.09 (09/03/2002 - Rev. 7)
RADIOANALYTICAL DATA VALIDATION Identifier: Revision: Page:
GDE-205 1 40 of 78
and/or relative percent difference (RPD) comparison.
1. The mean difference value is ≤ 3. The mean difference equation is described in the evaluation section (4.6.4.2).
2. The RPD for water samples is ≤ 20% and for soil samples is ≤ 30%. The RPD equation is described in the evaluation section (4.6.4.2). The following deviations are pertinent when applying the RPD criteria:
• The RPD acceptance criteria (i.e., 20% and 30%) become less exacting when the sample matrices are other than water or soil. Therefore, some deviation from the RPD criterion are allowable for nonroutine matrices. In such cases, the duplicate should also be evaluated using the mean difference equation.
• If one of the results is not statistically positive, the RPD is calculated by using ½ RDL value for the nonpositive radionuclide result. Refer to the equation in the evaluation section (4.6.4.2).
4.6.4.2 Perform evaluation as follows.
4.6.4.2.1 Verify that a laboratory-generated duplicate was analyzed for each matrix and analysis type in the SDG.
4.6.4.2.2 Verify that the duplicate sample ID is traceable to an original sample in the SDG.
4.6.4.2.3 Calculate the mean difference, and determine if it is ≤3.
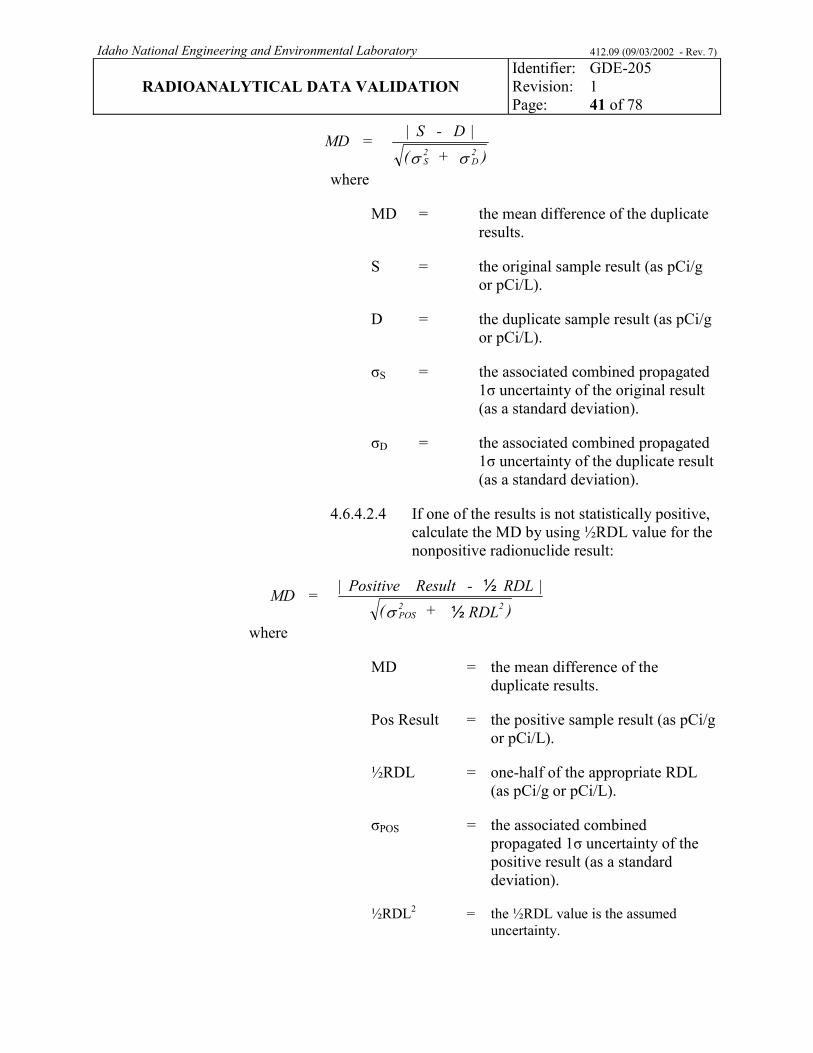
Idaho National Engineering and Environmental Laboratory 412.09 (09/03/2002 - Rev. 7)
RADIOANALYTICAL DATA VALIDATION Identifier: Revision: Page:
GDE-205 1 41 of 78
) + (| D - S| = MD2D
2S σσ
where
MD = the mean difference of the duplicate results.
S = the original sample result (as pCi/g or pCi/L).
D = the duplicate sample result (as pCi/g or pCi/L).
σS = the associated combined propagated 1σ uncertainty of the original result (as a standard deviation).
σD = the associated combined propagated 1σ uncertainty of the duplicate result (as a standard deviation).
4.6.4.2.4 If one of the results is not statistically positive, calculate the MD by using ½RDL value for the nonpositive radionuclide result:
)RDL + (| RDL - Result Positive | = MD
22POS ½
½σ
where
MD = the mean difference of the duplicate results.
Pos Result = the positive sample result (as pCi/g or pCi/L).
½RDL = one-half of the appropriate RDL (as pCi/g or pCi/L).
σPOS = the associated combined propagated 1σ uncertainty of the positive result (as a standard deviation).
½RDL2 = the ½RDL value is the assumed uncertainty.

Idaho National Engineering and Environmental Laboratory 412.09 (09/03/2002 - Rev. 7)
RADIOANALYTICAL DATA VALIDATION Identifier: Revision: Page:
GDE-205 1 42 of 78
NOTE: To provide a “feel” for the calculated mean difference values, an MD value of approximately 3 indicates that the results agree (overlap) at the ~3σ confidence interval, and an MD of approximately 2 indicates results agree (overlap) at the ~2σ confidence interval, and an MD of approximately 1 indicates the results agree (overlap) at the ~1σ confidence interval.
4.6.4.2.5 If the MD is >3, calculate the RPD, and determine whether or not it is ≤20% for waters and ≤30% for soils.
100 X RESULT) (AVERAGE
RESULT LOW - RESULT HIGH = RPD
NOTE: If the sample matrices are other than water or soil, the RPD criteria may not apply.
4.6.4.2.6 Apply the mean difference criteria, in conjunction with professional judgment, (see criteria Section 4.6.4.1).
4.6.4.2.7 If one of the results is not statistically positive, calculate the RPD using ½RDL value for the nonpositive radionuclide result:
100 X RDL)/2 + Result (Positive
| RDL - Result Positive | = RPD½½
NOTE: Action determinations for duplicate analyses results that do
not satisfy the acceptance criteria of this guide must be carefully dealt with. Sample conditions may cause poor duplicate agreement (e.g., inhomogeneity), that have no adverse affect or impact on the actual project sample analysis results. In such cases, the validator can only qualify the sample and corresponding duplicate. It can be difficult for the validator to determine why the duplicate results did not agree well, based solely on reported results. Such conditions and expected causes are typically described by the laboratory in the case narrative section of the data package. In some situations the data validator may need to apply professional judgment to determine how associated sample data should be qualified.

Idaho National Engineering and Environmental Laboratory 412.09 (09/03/2002 - Rev. 7)
RADIOANALYTICAL DATA VALIDATION Identifier: Revision: Page:
GDE-205 1 43 of 78
4.6.4.3 Note all decisions in the L&V report.
4.6.4.4 Perform the action that corresponds to the condition from the following table.
Condition Action
If a duplicate was analyzed for each analysis type in the SDG, the duplicate is traceable to a sample within the SDG, and the mean difference and/or RPD criteria are met.
The project sample results receive no qualifier flags.
If the mean difference criteria and/or RPD criteria (with consideration given to the matrix concerns) was not met
The MD takes precedence over the RPD criteria.
If the sample matrix is such that inhomogeneity is highly likely
(Inhomogeneity can be anticipated with sample matrices that include soil, solid wastes, and liquids with suspended solids or multiphases.)
All associated project sample results that are statistically positive should be qualified with a “J” flag.
The assumption is that the other sample aliquots and associated results also may not be representative of the entire sample volume due to inhomogeneity. Accompany a comment about the likelihood of inhomogeneity problems with the decision and include in the main text of the L&V report.
If the sample matrix is such that inhomogeneity is unlikely
Qualify only that sample result associated with the unacceptable duplicate result with a “J” flag (if it is statistically positive).
The assumption is that duplicate imprecision measured on one sample is insufficient information with which to qualify all other sample results in the SDG.
If it can be definitely determined that the duplicate imprecision was due to analytical or inhomogeneitya problems that may have affected all other related sample analysis results in the SDG
Qualify the affected sample results with a “J” flag.
Describe the validator’s decision in the main text of the L&V report.
a. If samples are known to be homogeneous, it cannot be assumed that duplicate disagreement on one sample is indicative of all other sample results being imprecise. It also cannot be assumed that duplicate imprecision on one sample is indicative of analytical problems associated with all samples in the SDG. Without duplicate analysis on every sample or the analysis of multiple aliquots for the same sample, imprecision due to inhomogeneity or analytical techniques cannot be properly assessed.

Idaho National Engineering and Environmental Laboratory 412.09 (09/03/2002 - Rev. 7)
RADIOANALYTICAL DATA VALIDATION Identifier: Revision: Page:
GDE-205 1 44 of 78
4.7 Instrument Parameters
NOTE 1: This is performed for Level A validation only.
NOTE 2: This section provides the evaluation criteria that are to be applied to instrument calibrations and routine performance checks that are required by ER-SOW-394. The calibration and performance checks include the primary calibration, calibration source (see def.) checks, efficiency verification checks, energy calibration of spectrometric systems, and background checks. The evaluation criteria are based on instrumental technologies and not specific radionuclide analysis types. On this basis, evaluation criteria are included in the following sections for gamma spectroscopy, alpha spectroscopy, gas flow proportional counting, and liquid scintillation counting.
NOTE 3: DOE QSAS requires that laboratory methods for instrument calibration incorporate the following:
A. ANSI N42.15-1997, American National Standard Check Sources for and Verification of Liquid Scintillation Systems
B. ANSI N42.25, Calibration and Usage of Alpha/Beta Proportional Counters
C. ANSI N42.14-1991, Calibration and Use of Germanium Spectrometers for the Measurement of Gamma Ray Emission Rate of Radionuclides.
NOTE 4: This guide acknowledges the American National Standards Institute (ANSI-N42.23) recognition that most radiation detection systems do not require frequent recalibrations. State-of-the-art detection systems are capable of producing reliable and accurate results for many years, with the original (initial or primary) efficiency calibration. However, if a detector or its associated electronics has malfunctioned, or if the detection system has had major repairs, or the operating characteristics of the instrument have changed, or the system does not respond properly to routine calibration verification checks, a recalibration is necessary.

Idaho National Engineering and Environmental Laboratory 412.09 (09/03/2002 - Rev. 7)
RADIOANALYTICAL DATA VALIDATION Identifier: Revision: Page:
GDE-205 1 45 of 78
4.7.1 Counting Efficiency Calibration (see def.)
NOTE: The purpose is to ensure that the instrument counting efficiency calibration is compliant with requirements and the instrument is capable of producing acceptable quantitative data. The calibration demonstrates that the instrument is capable of acceptable performance at the beginning of the calibration period and establishes efficiency calibration factors used in calculations. Routine efficiency performance checks document that the efficiency calibration factors are still valid.
Counting systems are efficiency calibrated for each detector and counting geometry prior to any sample analysis, when the instrument is placed back in service after malfunctioning and the instrument’s response has changed as determined by a QC check and when the daily performance check indicates an unacceptable change in detector response. Calibration standard (see def.) sources should contain sufficient activity and/or be counted long enough to obtain a relative counting uncertainty (1σ) of less than or equal to 1%.
4.7.1.1 Use the following criteria:
A. Efficiency calibration for each detector and counting geometry is performed prior to any sample analysis and when the daily performance check indicates an unacceptable change in system efficiency. The efficiency calibration information is provided and includes the detector ID, the calibration source ID, the date of the calibration.
NOTE: The efficiency calibration data is reviewed
during the laboratory audit process. The calibration standards (see def.), sources and reference materials are verified to be traceable to the National Institute of Standards and Technology (NIST).
B. Energy calibration for gamma spectroscopy is performed according to ANSI 42.14 guidance on isotope-specific efficiency and efficiency as a function of energy calibrations. The full-width-half-maximum (FWHM) resolution of the detector should be evaluated daily or prior to instrument use. The measured FWHM resolution are trended.

Idaho National Engineering and Environmental Laboratory 412.09 (09/03/2002 - Rev. 7)
RADIOANALYTICAL DATA VALIDATION Identifier: Revision: Page:
GDE-205 1 46 of 78
C. For gas proportional counting systems efficiency calibrations, include mass attenuation curves:
1. Self-absorption curves are required for both alpha and beta counting.
2. A cross-talk curve is established for alpha to beta cross-talk versus residue weight.
3. Beta to alpha cross-talk is not significantly affected by planchet residue weight, and is generally constant over the applicable weight range. Therefore this cross-talk correction does not require residue weight consideration.
4. The data used to generate self-absorption and cross-talk curves consist of at least 7 points, well distributed throughout the mass range.
5. Each alpha and beta calibration standard is counted to an accumulation of 10,000 counts.
D. For alpha spectrometry:
1. The efficiency counts for the region of interest (ROI) are background corrected using the same ROI for the background unless the background is less than 0.5% of the total counts in the ROI.
2. The efficiency is determined on at least 10,000 net counts in the ROI (after background correction).
3. Check source counts to verify efficiency is determined on at least 2,000 counts.
E. Detector response checks are analyzed prior to the counting of samples each day that samples are counted. Exceptions are:
1. For alpha spectrometry, check source counts are performed at least monthly.

Idaho National Engineering and Environmental Laboratory 412.09 (09/03/2002 - Rev. 7)
RADIOANALYTICAL DATA VALIDATION Identifier: Revision: Page:
GDE-205 1 47 of 78
2. When performing analyses with extended count times by gas flow proportional counting, check measurements may be performed between sample sets.
F. Calibration verification (source check) information is provided and includes the detector ID, the calibration source ID, the date of the calibration verification check.
NOTE: An efficiency calibration is not required when comparative measurement (i.e., standards analyzed with the batch of samples) or internal standardization (e.g., isotopic tracer or standard addition) methods are used; however, efficiency performance checks are still performed to monitor variability in system performance.
4.7.1.2 Perform evaluation as follows:
4.7.1.2.1 Verify that the most recent efficiency calibration was performed at the required frequency and satisfy the additional criteria listed by this guide.
4.7.1.2.2 Verify the calibration verification (source check) was performed prior to the counting of samples each day that samples are counted.
4.7.1.2.3 Verify the daily efficiency performance check source count-rate results and/or efficiency tolerance charts show that all data are within properly established tolerance limits or that recalibration was performed whenever the limits were exceeded after determination of cause was made. Verify that the same check source used in the preparation of the tolerance chart or control chart at the time of calibration is used in the calibration verification of the instrument.
4.7.1.2.4 Review the control/tolerance charts, and verify that calibration checks, for each detection system used, demonstrate that the measured efficiency value(s) are within the acceptable

Idaho National Engineering and Environmental Laboratory 412.09 (09/03/2002 - Rev. 7)
RADIOANALYTICAL DATA VALIDATION Identifier: Revision: Page:
GDE-205 1 48 of 78
tolerances. The limits are related to the mean count rate value established at the time of calibration for each detector.
NOTE: Questionable or missing calibration verification data can be supported or supplemented with data obtained from appropriate LCS measurements. Judgment on the part of the validator is required to properly evaluate the calibration check data versus the LCS data.
4.7.1.3 Perform the action that corresponds to the condition from the following table:
Condition Action If all necessary calibration information is provided
The efficiency verification frequency is met, and the QC performance checks fall within the appropriate tolerance limits. Include a statement of this fact in the body of the L&V report.
If the efficiency calibration and/or the verification frequency are not met
State this fact in the body of the L&V report. Qualify the results for all samples analyzed between acceptable calibration verifications as estimated with a “J” flag.
If the QC performance check count-rate results for a detector fall outside the laboratory’s tolerance limits criteria
Provide a description of the anomaly in the body of the L&V report. Qualify the results for all samples analyzed between acceptable calibration verifications as estimated with a “J” flag.
If instrument calibration verification checks were not provided with the data package
The LCS and other related QC data may be used to indirectly demonstrate that the detector response had not changed. Provide a description of the deficiency in the body of the L&V report. Apply professional judgment as to how the project sample data should be qualified, if indirect or supporting QC information is used. The sample results should receive no data qualifier flags, if other related QC data conclusively demonstrate that the detector response had not changed at the time of the counting measurements.

Idaho National Engineering and Environmental Laboratory 412.09 (09/03/2002 - Rev. 7)
RADIOANALYTICAL DATA VALIDATION Identifier: Revision: Page:
GDE-205 1 49 of 78
4.7.2 Energy Calibration (see def.)
NOTE: The purpose is to ensure that the instrument is capable of producing acceptable qualitative data (correct radionuclide identifications). Calibration demonstrates that the instrument is capable of acceptable performance at the beginning of the calibration period and establishes energy calibration factors used in nuclide identification. Routine energy calibration performance checks document that the energy calibration factors are still valid.
Alpha, beta, and gamma spectrometry systems are energy calibrated for each detector prior to any sample analysis and when the daily performance check indicates an unacceptable change in system energy gain or offset. In addition, proportional counters have the cross-talk and plateau settings determined after gas changes prior to use. Energy calibration performance checks are analyzed prior to the counting of samples.
4.7.2.1 Use the following criteria:
A. Energy calibration for each detector is performed prior to any sample analysis and when the daily performance check indicates an unacceptable change in system efficiency.
B. For alpha spectrometry, channel versus energy calibration is performed at least monthly. The following criteria apply to alpha spectroscopy:
1. The energy calibration for each detector shall be performed. A curve is fit for Energy (Y-axis) versus Channel (X-axis), and the equation with the slope and Y-intercept for the fit is documented.
2. The slope of the equation is <15 keV/channel.
3. The energy calibration is performed using at least three isotopes within the energy range of 3 to 6 MeV.
4. The final peak energy positions of all observed isotopes is within ±40 keV of the expected peak energy.
Idaho National Engineering and Environmental Laboratory 412.09 (09/03/2002 - Rev. 7)
RADIOANALYTICAL DATA VALIDATION Identifier: Revision: Page:
GDE-205 1 50 of 78
C. The energy calibration for gamma spectroscopy is performed according to ANSI 42.14 guidance on isotope-specific efficiency and efficiency as a function of energy calibrations.
D. The energy calibration for each gamma spectrometry system is checked each day of use. For systems using sample changers and/or long count times that run more than a day, the energy calibration is checked before each analytical batch
4.7.2.2 Perform evaluation as follows:
4.7.2.2.1 Verify that the most recent energy calibration was performed at the required frequency, and satisfy the additional criteria listed by this guide.
4.7.2.2.2 Verify the energy calibration performance checks for gamma spectroscopy and alpha spectroscopy systems were performed at the required frequency.
4.7.2.2.3 Verify the detector performance was within the established tolerance limits by reviewing the energy calibration performance check peak centroid or calculated energy for each peak.
4.7.2.2.4 Verify energy calibration information is included for the gamma spectrometer systems used for the measurement of the samples in the reported data.
NOTE: The energy calibration information (i.e., computed energy calibration coefficients and peak width coefficients) is generally produced by the vendor analysis software and included in the header section of each spectral measurement.
4.7.2.2.4.1 Verify that the energy calibration
coefficients and peak width coefficients are shown on the spectral analysis data or are included (in a tabular or control

Idaho National Engineering and Environmental Laboratory 412.09 (09/03/2002 - Rev. 7)
RADIOANALYTICAL DATA VALIDATION Identifier: Revision: Page:
GDE-205 1 51 of 78
chart format) with the presentation of other internal QC data in the data package.
4.7.2.2.4.2 If spectral data are included in the data package, verify energy calibrations by comparing the energies of some of the observed/measured photopeaks in the spectrum to their known energies. Some of the major gamma rays normally observed in a spectrum can be used for this purpose (e.g., Co-60, Cs-137 or common background gamma rays, such as those from radon/thoron and/or K-40). The measured versus the known/expected energies should be < ± 2.0 keV. An energy mismatch >2 keV is acceptable, if the measured photopeak is properly identified with the correct radionuclide. The energy calibration verification should include checking the energies of low, medium, and high energy radionuclides, if they are present in the spectrum.
4.7.2.2.4.3 Check the spectral data (if available) to determine if peak widths (full width at half maximum [FWHM]) are reasonable.
NOTE: Because peak widths are dependent on many factors (e.g., the detector and associated electronics, number of MCA channels, gamma-ray energy, and photopeak intensity), an acceptance criterion is not stipulated in this procedure. A guideline that can be applied to 8192-channel spectra is the FWHM at 662 keV (Cs-137) should be about 3.5 keV and for 1332 keV (Co-60) it should be about 5 keV.

Idaho National Engineering and Environmental Laboratory 412.09 (09/03/2002 - Rev. 7)
RADIOANALYTICAL DATA VALIDATION Identifier: Revision: Page:
GDE-205 1 52 of 78
4.7.2.2.4.4 Apply professional judgment when evaluating peak widths.
4.7.2.2.5 Verify energy calibration information is included for the alpha spectrometer systems used for the measurement of the samples in the reported data.
NOTE: Energy calibration information is generally produced by vendor analysis software and included in the header section of each spectral measurement.
4.7.2.2.5.1 Verify an energy calibration has been performed and the equation with the slope and Y-intercept for the fit is reported; the slope of the equation is <15 keV/channel; and the energy calibration has been performed using at least three isotopes within the energy range of 3 to 6 MeV.
4.7.2.2.5.2 If spectral data are included in the data package, verify the energy calibration by comparing energies of some of the observed/measured peaks in the spectrum (especially that of the tracer radionuclide) to their known alpha energies. The measured versus the known energies should be approximately ±40 keV. An energy mismatch >40 keV is acceptable, if the measured peak is properly integrated and identified with the correct radionuclide.

Idaho National Engineering and Environmental Laboratory 412.09 (09/03/2002 - Rev. 7)
RADIOANALYTICAL DATA VALIDATION Identifier: Revision: Page:
GDE-205 1 53 of 78
4.7.2.3 Perform the action that corresponds to the condition from the following table:
Condition Action
If the specified energy calibration and/or verification frequency is not followed, the energy calibration curves are not smooth or the QC performance check results fall outside the appropriate tolerance limits
Include a description of the deficiency in the body of the report.
If the error is great enough to cause misidentification of the nuclide (outside the peak identification energy limit)
Qualify the results of all samples analyzed between acceptable calibration verifications as rejected with an “R” flag.
4.7.3 Background (see def.) Determination
NOTE: The purpose is to ensure that appropriate instrument backgrounds are subtracted from gross counting results. Background determination demonstrates that the instrument is capable of acceptable performance at the beginning of the determination period and establishes background count-rate factors used in calculations. Routine background performance checks document that the background count-rate factors are still valid.
4.7.3.1 Use the following criteria:
A. Instrument background is determined for each detector is performed prior to any sample analysis and when the daily performance check indicates an unacceptable change in detector background count. Information usually includes detector ID, background spectral or tracking ID, date of the background.
B. Background measurements are monitored using control charts or tolerance charts.
C. Frequency of background measurements are:
1. For gamma spectrometry systems, background measurements are performed at least monthly.
2. For alpha spectrometry systems, background measurements are performed at least monthly.

Idaho National Engineering and Environmental Laboratory 412.09 (09/03/2002 - Rev. 7)
RADIOANALYTICAL DATA VALIDATION Identifier: Revision: Page:
GDE-205 1 54 of 78
3. For gas proportional counters, background measurements are performed at least weekly.
4. For liquid scintillation counters, background measurements are performed each day of use.
D. Background requirements for alpha spectrometry are:
1. The background total counts (or counts per unit time) for each target analyte and tracer isotope ROI are determined for each detector and documented.
2. The limits of acceptability for each background ROI are documented.
3. Background count times are equal to or longer than sample count times
E. Background performance checks are performed. The laboratory should acquire the data for a period of time comparable to the count time of the samples
4.7.3.2 Perform evaluation as follows:
4.7.3.2.1 Verify that the most recent background count was performed at the required frequency and satisfy the additional criteria listed by this guide.
4.7.3.2.2 Verify the background is within control limits by review of background performance check count-rate results and/or background tolerance charts
4.7.3.2.3 Verify the background performance checks were determined at the required frequency.
4.7.3.2.4 Verify the background performance check was at least as long as the sample count time.

Idaho National Engineering and Environmental Laboratory 412.09 (09/03/2002 - Rev. 7)
RADIOANALYTICAL DATA VALIDATION Identifier: Revision: Page:
GDE-205 1 55 of 78
4.7.3.3 Perform the action that corresponds to the condition from the following table:
Condition Action
If the specified background determination and/or verification frequency is not met, the quench curves do not reasonably fit the data, or the QC performance check results fall outside the appropriate tolerance limits
Qualify the results for all samples analyzed between acceptable verifications as estimated, “J”, or rejected, “R”, depending on the magnitude of the error.
When significant errors are found in the calculation
Then qualify all affected results as either estimated, “J”, or rejected, “R”, depending on the magnitude of the error.
4.8 Performance Evaluation Sample (see def.) (blinds [see def.]) Testing Program
NOTE 1: Blind QC samples of various matrices will be routinely included with various project samples. The purpose of PE blinds is to assess and monitor the laboratories’ proficiency in performing “routine” radioanalytical measurements. It provides an independent performance test that evaluates the accuracy and precision being achieved on routine analysis for QC samples that are submitted as regular samples.
This review applies to any data package that includes PE samples, regardless of the data validation level required.
NOTE 2: The assessment and performance tracking of blind PE sample results is one of the functions performed by SAM Laboratory Performance Evaluation Program (LPEP). The LPEP program monitors the overall performance of INEEL SAM subcontracted laboratories using many different quality indicators, each of which are described in the INEEL LPEP document. All LPEP nonconformance issues and laboratory approval status will be managed by SAM.
4.8.1 Use the following criteria:
A. The acceptance criteria used to assess PE sample results is managed by SAM in accordance with Guide-204, “Assessment of Radionuclide Analysis of INEEL Performance Evaluation Samples.”
B. Project sample data will be qualified by the data validator in accordance with INEEL SAM assessment of the PE sample results.

Idaho National Engineering and Environmental Laboratory 412.09 (09/03/2002 - Rev. 7)
RADIOANALYTICAL DATA VALIDATION Identifier: Revision: Page:
GDE-205 1 56 of 78
C. Project sample results require no data qualification, if the PE sample results are assessed as “Acceptable” or “Warning.”
D. Project sample results will require qualification, if the PE sample results are assessed as “Not Acceptable.”
4.8.1.1 INEEL SAM Radiochemist (or designated alternate): Perform the assessment of the PE sample results in accordance with Guide-204.
4.8.1.2 INEEL SAM: Provide the data validator with the PE sample identification and the evaluated results. Delineate such information to the data validator on INEEL SAM CSCR Validation Transmittal Form that accompanies the data package sent for validation or other equivalent form.
4.8.1.3 Data Validator: Qualify (validate) project sample data in accordance with the SAM assessment of the PE sample results.
4.8.1.4 Data Validator: Clearly identify the PE sample on the Data Qualifier (Validation Flag) Table, the appropriate Form I’s, and in the main text of the L&V report. Write “PE” flag in red indelible ink (or typed) adjacent to its corresponding field sample ID.
4.8.1.5 Perform the action that corresponds to the condition from the following table:
Condition Action
If the result for an applicable PE radionuclide is assessed as “Acceptable”
Include a notation in the body of the L&V report.
If the result for an applicable PE radionuclide is assessed as “Warning”
Include a notation in the body of the L&V report.
The project sample results receive no data qualifier flags.

Idaho National Engineering and Environmental Laboratory 412.09 (09/03/2002 - Rev. 7)
RADIOANALYTICAL DATA VALIDATION Identifier: Revision: Page:
GDE-205 1 57 of 78
Condition Action
If the result for an applicable PE radionuclide is assessed as “Not Acceptable”
Include a notation in the body of the L&V report.
Qualify the statistically positive project sample results that coincide with the PE sample radionuclide (that is assessed as “Not Acceptable”) with a “J” validation flag.
Qualify project sample results that are not statistically positive and/or are below the MDC, with a “U” validation flag.
If the PE sample contained a radionuclide that was not positively detected by the laboratory (and is assessed as “Not Acceptable”), assign a “UJ” validation flag to all project sample results that are not statistically positive and/or are below their MDC for that radionuclide.
4.8.1.6 SAM: When transmitting the L&V report to the INEEL project manager, conspicuously identify the PE sample in the SAM transmittal letter. Identify it with its INEEL field sample ID and associated laboratory ID. Include the PE sample assessment report, prepared by the SAM radiochemist (or designated alternate), with the L&V report.
4.9 Data Validation Reporting
4.9.1 Validator: Prepare an L&V report for each laboratory data package validated. Present each L&V Report in three parts: the introduction, the body of the report, and attachments, as shown in the outline in Appendix B.
4.10 Post-Performance Activities
4.10.1 SAM: Review each L&V report generated by an independent, non-INEEL data validation firm for correctness, completeness, consistency, and contractual compliance.
4.10.2 After reviewing additional/further project information and if appropriate, overrule a decision or judgment call made by the non-INEEL validation firm. Ensure the overruling does not violate the requirements of ER-SOW-394 or this guide (unless the change is scientifically grounded and completely defensible).

Idaho National Engineering and Environmental Laboratory 412.09 (09/03/2002 - Rev. 7)
RADIOANALYTICAL DATA VALIDATION Identifier: Revision: Page:
GDE-205 1 58 of 78
4.10.3 Issue a cover letter with the L&V report, and distribute the report to the appropriate personnel.
4.11 Detection Limit (see def.) Issues
When making radioactivity measurements of environmental-level samples, it is often difficult to determine whether a sample contains activity or not. To determine whether a sample contains net radioactivity frequently requires a statistical approach, because the sample and background activity levels are often indistinguishable (i.e., a no-net-activity condition); therefore, the detection limit is often applied. The application of the concept of detection limits is often misused in data validation.
Detection limits are often used to censor or otherwise qualify the results (and use) of individual sample measurements. Using detection limits (specifically a priori and sample-specific MDCs) to make determinations and judgments as to the “worth” or “accuracy” of a measured value is strongly discouraged by the American National Standards Institute (ANSI - N42.23, Measurement and Associated Instrumentation Quality Assurance for Radioassay Laboratories, February 1995). The ANSI feels that once a sample measurement is made, there is no valid information gained by comparing the result of the measurement to an a priori detection limit nor is there merit in making such assessments on a sample-specific basis (i.e., using sample-specific MDCs). If such assessments are to be made, the ANSI recommends that individual sample measurements be compared to a sample-specific “appropriate” blank (one that is truly representative of the samples being measured). The ANSI contends that the measured result with its associated combined standard uncertainty (confidence interval) is the best information available for assessing a particular measurement.
The use of detection limits as a broad-based statistical attempt to determine whether radioactive material is present in a sample or not is not given much priority (in this guide) for assessing/censoring radioanalytical data. The following discussion is intended to provide the validator, who may be accustomed to applying detection limits or MDCs in the validation of radioanalytical data, some clarification and understanding as to why their use and application is limited in this validation guide. The determination, application, theory, and concepts of detection limits have been the subject of argument, misunderstanding, and misapplication among analytical experts for many years. Also the terminology used to describe/define detection limits is often interchanged, misunderstood, and misapplied. A universally agreed-upon approach (or standardization) to detection limits does not currently exist throughout the ‘analytical community,’ and many analytical laboratories use various methods and techniques (to determine and interpret detection limits) that are specific to their needs or applications. Because of this, application of a nonstandardized element (detection limits) to the data validation process (which relies on consistency), may not be wise. Misuse, misunderstanding, or misapplication of detection limits can ultimately impact and

Idaho National Engineering and Environmental Laboratory 412.09 (09/03/2002 - Rev. 7)
RADIOANALYTICAL DATA VALIDATION Identifier: Revision: Page:
GDE-205 1 59 of 78
affect the validity of the data, and this is the reason that detection limits are not used when assessing the validity of radioanalytical data. Further information regarding detection limits and its various terminologies can be found in the Definitions section (Section 6).
4.12 Measurement Uncertainty Issues
The ANSI philosophy (that the measured result and its associated uncertainty provide the best information available for assessing a measurement) requires that the laboratories perform a thorough error analysis of their measurement process in order to ensure the proper confidence in the reported measurement. It is a requirement of ER-SOW-394 that the reported combined standard uncertainty include the statistical counting error and as many other sources of error as can be identified in the analytical/measurement process, propagated in quadrature. The laboratories are required/requested to report only the combined standard uncertainty (at the 1σ confidence level) on the sample result forms and QC result forms.
If an error component “break-out” is necessary for evaluation purposes, investigate the appropriate raw data provided by the laboratory.
Reporting the individual error components (that comprise the reported combined uncertainty) is preferred, as it provides the validator visible evidence that all significant error components are included in the combined uncertainty, thus allowing the validator to more comfortably and confidently assess a particular measurement result. However, where uncertainty reporting is not as detailed, some confidence can be realized in that uncertainty reporting is evaluated during the vendor assessment (audit) of the laboratories that are contracted through INEEL SAM.
5. RECORDS
Records Description
Uniform File Code
Disposition Authority
Retention Period ENV EPI LTS QA
QA Classification
Indexing Granularity
Limits and Validation Report
7101 ENV5-c-3 Destroy in 75 years
Y N Y Y Non-permanent
Case file
6. DEFINITIONS
Accuracy. Accuracy is the degree of agreement of a measurement with the known (reference) value of a calibrated (certified) standard, source, or reference material.
Achieved detection limit (ADL). The minimum amount of sample activity that can be detected or identified with 95% confidence for a particular analysis based on sample-

Idaho National Engineering and Environmental Laboratory 412.09 (09/03/2002 - Rev. 7)
RADIOANALYTICAL DATA VALIDATION Identifier: Revision: Page:
GDE-205 1 60 of 78
specific analysis and measurement conditions. See definition for detection limits. Further discussion about detection limits can also be found in Section 4.11.
Aliquot. It is a portion of the total sample used in the analysis.
Background. Ambient signal response due to spurious electronic noise or incidental radiation in the vicinity of the detector system as recorded by measuring instruments that is independent of radioactivity contributed by the radionuclides being measured in the sample.
Bias. A positive or negative deviation of the measured value from the assumed or accepted true value which does not tend toward zero.
Blind. QC samples that are prepared external to the analytical laboratory and are submitted to the laboratory unknowingly along with a regular set of samples.
Calibration (efficiency). A method of measuring and establishing the response of an instrument with the use of calibration standards, sources or samples. The response is a calibration factor or curve that corrects for the difference between the known number of radiation quanta emitted by a source and the actual number measured/detected by the instrument. Detection systems are only capable of detecting a fraction of the radioactivity actually being emitted from the radioactive nuclides. Therefore, in order to make quantitative determinations, it is imperative to establish the relationship between the measured counting rates and that of the known emission (disintegration) rates. Such a relationship is commonly referred to as the detector efficiency. The efficiency is typically expressed as a ratio or percentage of the measured counting rate to the known disintegration rate of radioactive calibration standard/source (Eff. = cpm/dpm). Detector efficiency is the essential element for the quantification of radioactivity in samples.
Calibration (energy). A method of calibrating an instrument for its channels versus energy relationship with the use of radioactive sources of well known photon or particle energies. Detection systems using multichannel analyzers (for spectrometric analysis) must be calibrated for the energy of the quanta (alpha particles or gamma rays) being emitted from the radioactive material, in order to make correct radionuclide identifications (i.e., qualitative measurements).
Carrier. Carriers are typically nonradioactive (e.g., natural strontium, barium, yttrium) elements. They follow similar chemical reactions as the analyte during processing and are added to samples to determine the overall chemical yield for the analytical preparation steps. The yield of the carrier is typically determined gravimetrically.
Chain of Custody (COC). A history of the transfer of samples from the time of sample acquisition to final disposal of the samples. It provides a tracking mechanism that allows the possession, handling, and security (custody) of individual samples to be maintained and traced from the time of sample collection, through laboratory analyses, to the final disposition.

Idaho National Engineering and Environmental Laboratory 412.09 (09/03/2002 - Rev. 7)
RADIOANALYTICAL DATA VALIDATION Identifier: Revision: Page:
GDE-205 1 61 of 78
Combined standard uncertainty (CSU). The total uncertainty associated with a sample measurement result, and includes all the individual uncertainty components incurred in the entire analytical/measurement process. The CSU is the addition of the square root of the sum of the squares of random components of the individual uncertainties, plus the magnitude of the estimated individual systematic uncertainties (often referred to as propagating the uncertainties in quadrature). For purposes of this guide, CSU includes only those random and systematic uncertainties associated with the analytical process and does not include the uncertainties associated with field sampling. The mathematical expression is as follows:
) + ( = TPU 2systematic
2random σσ ΣΣ
Confidence interval. A statistical distribution (band or interval) around a measured value within which the “true value” is expected to lie. This interval equates to the degree of confidence we have in the measured value, and is expressed as either a percentage or a standard deviation. Also see definitions for Precision and Uncertainty.
Data package. The report received from the laboratory containing the analytical results and supporting documentation for a set of samples. The contents and format of the data package are often specified by the client.
Data qualifier flag. The flag (letter codes) assigned to individual sample results during the data validation process to indicate the potential limitations and useability of the sample data. See Table B-2 of this guide for a definition of each qualifier flag.
Detection limit. The minimum amount of radioactivity that can be reliably detected (with an established degree of confidence) under certain defined sets of background, sample, instrument, analytical and measurement conditions. It is typically defined (by L.A. Currie, who is one of the foremost, recognized authorities in radiation statistics and detection limits) as 2.71 + 4.65 (B)½ , where B is the background value. The detection limit is usually expressed as a two-sided, probabilistic expression set far enough above zero (0) so that it includes both Type I and Type II errors. The probabilities associated with the Type I error (a 5% chance of deciding radioactivity is present when it is not—false positive) and the Type II error (a 5% chance of deciding radioactivity is not present when it is—false negative) assure us that the established detection limit (i.e., the detector response level and/or the sample response level) will detect activity in a sample (with 95% confidence), if it is present.
The detection limit is defined/described by various terminologies, such as lower limit of detection (LLD), minimum detectable activity (MDA; see def.), minimum detectable concentration (MDC), detection sensitivity, a-priori, a-posteriori, etc. These terminologies are often mistakenly interchanged, misused, and misapplied. Most are not synonymous and each has a different meaning and specific application. Generally, LLD refers to limits determined from appropriate blanks that are truly representative of the samples being analyzed; MDA and MDC refers to a limit that is sample-specific and is

Idaho National Engineering and Environmental Laboratory 412.09 (09/03/2002 - Rev. 7)
RADIOANALYTICAL DATA VALIDATION Identifier: Revision: Page:
GDE-205 1 62 of 78
determined from the actual sample being measured, a-priori is a limit that is more synonymous with the LLD and is a “before-the-measurement” estimate of what can be detected under ‘ideal’ sample and analysis conditions (where the sample and analytical variables can be controlled or held constant), and a-posteriori is a limit that is more synonymous with the MDA and MDC and is an “after-the-measurement” determination of what is actually detectable.
The detection limit often used as a probabilistic and statistical attempt to define and or determine whether radioactive material is present in a sample or not. A more practical definition is best defined by the function the detection limit performs: (1) it establishes a detector response level, which when exceeded, indicates that radioactive material is present in a sample, and (2) it establishes the sample activity necessary so that we can be assured that the radioactive material present in a sample will be detected.
FWHM. Full width at half maximum
False positive result. A false positive result, in the context of this guide, means that a statistically positive detection was made; however, the activity was due to blank contamination, photopeak interferences, or instrument/ambient background contributions (i.e., no radioactivity is present in the sample).
Laboratory blank. A laboratory-generated sample representative of the sample matrix being analyzed, that contains none of the constituents of interest that has gone through the entire analytical and measurement process using the same reagents added to the samples being analyzed. The blank provides verification that contamination has not occurred during the handling, preparation, and analysis of the samples.
Laboratory control sample (LCS). A certified material or an aliquot of a matrix (blank), which is free of radionuclide interferences (and the constituents of interest), which is spiked with a known concentration of a target radionuclide(s) and is put through the entire analytical/measurement process. Provides an indication of the adequacy of the laboratory procedure to measure the constituent of interest.
Laboratory duplicate. A laboratory-generated split of an actual sample that is put through the same exact analytical/measurement process as the original sample. Provides an indication of analytical variability/precision or sample inhomogeneity.
Matrix. The media in which a radioactive material of a sample is embedded.
Matrix spike sample (MSS). An aliquot or aliquant of a sample spiked with a known concentration of target analyte(s) prior to sample preparation. The recovery of the target analyte(s) from the MSS is used to determine the bias of the method in the specific sample matrix.

Idaho National Engineering and Environmental Laboratory 412.09 (09/03/2002 - Rev. 7)
RADIOANALYTICAL DATA VALIDATION Identifier: Revision: Page:
GDE-205 1 63 of 78
Mean difference (MD). A standard statistical method of assessing differences between radioactivity measurements and determining the significance of those differences. It is used in this guide to evaluate the statistical difference between method blank results and sample results and to evaluate results associated with duplicate measurements.
Minimum detectable activity (MDA). See definition for Detection Limits.
Minimum detectable concentration (MDC). See definition for Detection Limits.
Nondetect. A statistical interpretation that indicates the “absence” of radioactivity in a sample when the analytical result is less than two times the reported one sigma error of that result.
Performance evaluation (PE) sample. A QC sample that is specifically prepared with a known (referenceable and traceable) amount of radioactive material and submitted blind to the laboratory with a batch of field samples. It is used under sponsorship of INEEL SAM as a real-time tool to assess and monitor the laboratories proficiency in performing “routine” radioanalytical measurements on samples they believe are regular samples.
Precision. A measure of the variability of a set of repeated measurements of the same quantity using the same analytical technique or instrument. It can also be referred to reproducibility or repeatability. It is typically expressed quantitatively as the standard deviation of the results obtained from the series of measurements.
In radiation measurements, usually only a single measurement is made (and repeated measurements are not necessary) because the variability associated with the randomness of the radioactive decay process is very well understood and predictable. This randomness (variability) follows the basic laws of probabilities and probability distributions, which are described by Poisson and Gaussian statistics. The degree of precision is dependent on the intensity of the radioactivity being measured. Precision is often referred to as an uncertainty and is typically expressed quantitatively as a standard deviation. See the definition of Confidence Interval and Uncertainty.
Quality assurance (QA). A network of activities that assures that all information, data, and decisions are technically sound and properly documented, that the quality objectives are met, and that the results of analyses are correct (within the associated uncertainties). These activities include evaluating the data quality objectives, designing these into the laboratory requirements documents, monitoring the quality of analytical results by inspection and by the injection of quality control samples, and assuring that the personnel performing the analysis are qualified.
Quality control (QC). Quality control is the mechanism by which the QA system is directed. It is a system of activities whose purpose is to monitor and ensure the quality of the analysis and measurement process. This consists of routine performance tests and checks with QC materials (standards, sources, and samples) to verify the accuracy and precision of analysis/measurement process.

Idaho National Engineering and Environmental Laboratory 412.09 (09/03/2002 - Rev. 7)
RADIOANALYTICAL DATA VALIDATION Identifier: Revision: Page:
GDE-205 1 64 of 78
Random error. The deviation or variation of a measured value due to certain characteristics and fluctuations in the measurement process that cannot be controlled (e.g., randomness of the radioactive decay process, sample inhomogeneity, and sample positioning repeatability). It is the random occurrences that result in a change from one measurement to another causing the measured value to be somewhat different from the other measured values.
Required detection level (RDL). The minimum detection capability for a method required by project and/or statement of work.
Sample delivery group (SDG). A group or batch of samples from one sampling project, received by the laboratory over no more than a 14-calendar-day period, that does not exceed 20 samples. The group of samples are analyzed together and reported in one data package. The SDG number is assigned by the laboratory and one of the INEEL sample numbers included in the sample delivery group.
Source (calibration). A radioactive source of a standardized matrix and geometry that is used for detector efficiency calibration or calibration checks. The radioactive source typically contains standard reference materials (see def.) for which the activity of the radionuclide(s) are traceable, known, and certified within specified limits of uncertainty.
Standard (calibration). A radioactive source that is always used as whole, such that the activity for the whole source is quoted by the supplier and certified by a recognized standardizing agency or group (e.g., NIST).
Standard Reference Material (SRM). Material specially prepared, analyzed, and certified for radioactivity content under the jurisdiction of a recognized standardizing agency or group, such as the National Institute of Standards and Technology (NIST), for use by analytical laboratories as a calibration material or as an accurate basis for comparison.
Statistically positive. A statistical determination that identifies the “presence” of radioactivity in a sample when the analytical result is greater than two times the reported one sigma error of that result.
Systematic error. The inherent bias (offset) of a measurement process. It is the errors that are fixed or constant during the time measurements are being made (e.g., efficiency calibration, procedure, instrumentation, and nuclear decay data).
Task order statement of work (TOS). A written work order or statement of analytical requests and requirements for the laboratory, prepared by the SAM, that delineates project-specific information such as, numbers of samples to be collected, sample collection schedule, and types of analyses requested. The TOS also describes any deviations, additions, deletions, or changes to the SAM analytical statement of work (SOW).

Idaho National Engineering and Environmental Laboratory 412.09 (09/03/2002 - Rev. 7)
RADIOANALYTICAL DATA VALIDATION Identifier: Revision: Page:
GDE-205 1 65 of 78
Traceable (standards). All detection systems are calibrated with radionuclide reference materials, sources and standards traceable to accredited/certified national reference laboratories such as the National Institute of Standards and Technology (NIST-USA), the Physikalisch Technische Bundesanstalt (PTB-Germany), and the National Physical Laboratory (NPL-United Kingdom). Traceability provides a documented pedigree, confirmation, and assurance of accuracy and precision.
Tracer. A radionuclide that chemically mimics and does not interfere with the target radioanalyte through the chemical preparation and instrument analysis.
Uncertainty. The variability (or inaccuracy) associated with a measured value due to the statistical (random) fluctuations in the measurement system or process. It represents the band around the measured value within which the “true value” is expected to lie. It is often expressed as a standard deviation or a percentage, and is always described with an associated confidence level. See definitions for Confidence Interval, Precision, and Combined Standard Uncertainty.
Validation. A technically based analyte- and sample-specific evaluation process that extends beyond method or contractual compliance, provides a level of confidence that an analyte is present or absent, and examines the uncertainty of the reported concentration of the analyte relative to the intended use of the data. Data validation is a systematic process, performed externally from the data generator, that applies a defined set of performance-based criteria to a body of data that can result in qualification of the data. Data validation occurs prior to drawing a conclusion from the body of data.
Validator. An individual trained to this guide and the INEEL analytical statement of work that performs data validation. The individual(s) should have a scientific or technical background in the field of radiochemistry.
Verification. A review and evaluation process used to determine that laboratory operations, its data quality elements, and the resultant data are compliant with contractual agreements and requirements.
Yield. A measure of the efficiency of the radiochemical separation process. It is determined by adding a known amount of radioactive tracer or chemical carrier to the sample prior to sample preparation and analysis and measuring the analytical yield (gravimetrically or radiometrically) at the completion of the analytical/measurement process. The yield determinations are used in the calculation of sample results.
7. REFERENCES
American National Standards Institute (ANSI) N42.23, Measurement and Associated Instrumentation Quality Assurance for Radioassay Laboratories; 1996.
ANSI, 1997, American National Standard Calibration and Usage of Alpha/Beta Proportional Counters, ANSI N42.25-1997.

Idaho National Engineering and Environmental Laboratory 412.09 (09/03/2002 - Rev. 7)
RADIOANALYTICAL DATA VALIDATION Identifier: Revision: Page:
GDE-205 1 66 of 78
Brodsky, A., Accuracy and Detection Limits for Bioassay Measurements in Radiation Protection, NUREG-1156, Washington, DC: U.S. Nuclear Regulatory Commission, 1986.
Currie, L. A., Lower Limit of Detection: Definition and Elaboration of a Proposed Position for Radiological Effluent and Environmental Measurements, NUREG/CR-4007, Appendix D. Washington, D.C.: U.S. Nuclear Regulatory Commission; 1984.
Currie, Lloyd A., “Limits for Qualitative Detection and Quantitative Determination: Application to Radiochemistry,” Anal. Chem., 40:3, pp. 586−593; 1968.
DOE Quality Systems for Analytical Services, Rev. 0, 2003.
DOE-ID, Quality Assurance Project Plan for Waste Area Groups 1, 2, 3, 4, 5, 6, 7, 10 and Inactive Sites, DOE/ID-10587, Rev. 7, U.S. Department of Energy Idaho Operations Office, Idaho Falls, Idaho, 2002.
ER-SOW-394, INEEL Sample and Analysis Management Statement of Work for Analytical Services, 2004.
GDE-7003, “Levels of Analytical Method Data Validation.”
Guide-204, “Assessment of Radionuclide Analysis of INEEL Performance Evaluation Samples.”
Health Physics Society, 1996, Performance Criteria for Radiobioassay, HPS N13.30-1996.
PRD-5030, Environmental Requirements for Facilities, Processes, Materials, and Equipment, Companywide Manual 8, Environmental Protection and Compliance.
U.S. Environmental Protection Agency, Guidance for Data Useability in Risk Assessment (Part B), Publication 9285.7-09B, May 1992.
U.S. Environmental Protection Agency, Guidance for the Data Quality Objectives Process, EPA QA/G-4, 1994.
Yankee Atomic Electric Company, D. E. McCurdy, Performance Objectives and Criteria for Conducting DOE Radiochemical Data Validation, Rev. 8, 1996.
7.1 Source Requirements
DOE-ID, 1991, Federal Facility Agreement and Consent Order for the Idaho National Engineering Laboratory, Administrative Record No. 1088-06-29-120, U.S. Department of Energy, Idaho Field Office; U.S. Environmental Protection Agency, Region 10; Idaho Department of Health and Welfare.

Idaho National Engineering and Environmental Laboratory 412.09 (09/03/2002 - Rev. 7)
RADIOANALYTICAL DATA VALIDATION Identifier: Revision: Page:
GDE-205 1 67 of 78
DOE-ID, 2002, Quality Assurance Project Plan for Waste Area Groups 1, 2, 3, 4, 5, 6, 7, 10 and Inactive Sites, DOE/ID-10587, Rev. 7, U.S. Department of Energy Idaho Operations Office, Idaho Falls, Idaho.
8. APPENDIXES
Appendix A, Data Package Components
Appendix B, Limits and Validation Report

Idaho National Engineering and Environmental Laboratory 412.09 (09/03/2002 - Rev. 7)
RADIOANALYTICAL DATA VALIDATION Identifier: Revision: Page:
GDE-205 1 68 of 78
Appendix A
Appendix A
Data Package Components
Results Only Deliverable
The following is a listing of hard copy deliverables required for the Results Only Deliverable category. This category contains the minimum components required for a data package (see def.) deliverable. All components contained in this category are included in all other deliverable categories.
Table A-1. Results only deliverable.
Component Name Description
Cover Page The cover page contains a list of all samples analyzed within a Sample Delivery Group (SDG) and provides certain analytical information and general comments applicable to the SDG as a whole. At a minimum this is to include:
Laboratory Name
Subcontract Number
Statement of Work Identifier
Method Name or Description
Contractor SDG
Laboratory Report Identification
Line Item Code(s) associated with the SDG
Contractor Sample Numbers cross-referenced to laboratory ID numbers
Matrix
Date sample(s) received at laboratory
Comments:
Chain of Custody See DOE QSAS

Idaho National Engineering and Environmental Laboratory 412.09 (09/03/2002 - Rev. 7)
RADIOANALYTICAL DATA VALIDATION Identifier: Revision: Page:
GDE-205 1 69 of 78
Appendix A
Component Name Description
Case Narrative See DOE QSAS Section 13. The case narrative should include:
A listing of the procedures that are used in preparing the samples for analysis; if in-house procedures are used, reference is made to standard methods on which these procedures are based
Any significant technical difficulties encountered in preparing and analyzing the samples that may directly affect the quality of the results
Any instances of repreparation and/or reanalysis of samples due to nonconformances with requirements
A listing of deviations from regulatory-driven method requirements
Technically sound rationale for not achieving Contractor Required Detection Limits (RDLs)
Signature(s) of laboratory designee(s) for ensuring data quality and data package content.
Sample Results Radiochemistry Sample Results Form(s) (see ER-SOW-394 Section 6.1.2.1).
Standard Deliverable
The following is a listing of hard copy deliverables required for the Standard Deliverable category. This category contains all the components required for Results Only Deliverable plus all applicable data forms associated with the analyses. .
Table A-2. Standard deliverable.
Component Name Description
Results Only Deliverable
All components contained in the Results Only Deliverable data package
Batch QC Results. Radiochemistry Batch QC Results Form (see ER-SOW-394, Section 6.1.2.2)
Standard Plus Raw Data Deliverable
The following is a listing of hard copy deliverables required for the Standard Plus Raw Data Deliverable category. This category contains all the components required for the Standard Deliverable plus preparation and instrument raw data.

Idaho National Engineering and Environmental Laboratory 412.09 (09/03/2002 - Rev. 7)
RADIOANALYTICAL DATA VALIDATION Identifier: Revision: Page:
GDE-205 1 70 of 78
Appendix A
Table A-3. Standard plus raw data deliverable.
Component Name Description
Standard Deliverable
All components contained in the Standard Deliverable data package
Raw Data Preparation Raw Data Sample preparation raw data is documented in the form of:
• Bench sheets and/or preparation logs containing, at a minimum, the following:
Analytical Batch identifier
Date of preparation
Identifier for the laboratory SOP for the preparation
Identifiers for all sample and QC solutions prepared
Balance identifiers with dates of use
Initial and final weights and volumes for all samples and QC samples, including gross weights and tare weights where applicable
Pipette identifiers and dates of use (if applicable)
Comments describing any significant sample changes or reactions that occur during preparation
Indication of percent moisture and pH, as applicable
Signatures and dates of all analysts and reviewers
• Instrument run logs
Laboratory control charts A copy of the most recent instrument check source and instrument background control charts for each detector used for the analysis of the samples being reported. These control charts are up-to-date and cover the time period preceding and/or including the time of sample analysis.
Calibration Raw Data All associated raw data used to calibrate the instrument, used for continuing calibrations, etc. See the following detailed list.

Idaho National Engineering and Environmental Laboratory 412.09 (09/03/2002 - Rev. 7)
RADIOANALYTICAL DATA VALIDATION Identifier: Revision: Page:
GDE-205 1 71 of 78
Table A-3. (continued).
Appendix A
Component Name Description
Sample Analysis Raw Data All raw data associated with the generation of sample results. This includes data for analyses performed but not used for reporting. See the following detailed list.
QC Raw Data Raw data for all quality control analyses, including, but not limited to matrix spike, duplicate, blanks, LCS, etc. See the following detailed list.
Analysis Raw Data: Analysis raw data include raw data for matrix spike, duplicates, blanks, LCSs, and all samples in the batch.
• Sample identification
• Analysis batch identification
• Instrument and detector identification
• Analyte isotopes
• Start and end channels for all applicable regions of interest (ROIs)
• Sample counts (gross and net counts)
• Background counts (gross and net counts)
• Counter efficiency (if applicable)
• Channel by channel spectral printout (alpha spectrometry) that includes each ROI (including tracer) and an equivalent number of channels above and below the ROI
• Quench indicating parameter and its value (liquid scintillation counting)
• Full width half maximum (FWHM) and peak energy where applicable
• Analytical yield. If tracers are used to determine analytical yield, tracer isotope, start and end channels for all applicable ROIs, the raw tracer counts, background counts (with count time of background identified), tracer net counts, FWHM and peak energy (where applicable), counter efficiency, tracer amount added, and tracer pedigree is included. If gravimetric yields are used to determine analytical yield, the carrier identity, amount added, and recovery is included. For analyses
Idaho National Engineering and Environmental Laboratory 412.09 (09/03/2002 - Rev. 7)
RADIOANALYTICAL DATA VALIDATION Identifier: Revision: Page:
GDE-205 1 72 of 78
Appendix A
that use more than one analytical yield to calculate results (e.g., strontium-90 by the yttrium-90 daughter), all applicable analytical yield data is reported.
• Count time initiation
• Count duration
• Date and time of radiochemical separations determining isotope ingrowth.
Calibration Raw Data: Calibration raw data include raw data used to calibrate the instrument and the check sources for the period in which the samples were counted.
• Identification of software used to produce instrument calibration
• Data file name for the calibration
• Energy calibration data
- Alpha spec and gamma spec: Energy calibration date and isotopes used, calibration equation
- Liquid scintillation counting: Not applicable
- Gas Proportional Counting: Date of voltage plateau, discriminator settings, and isotopes used
• Background determination
- Date of background
- Length of background count
- Background counts
- Alpha spec and gamma spec: List ROI for each isotope of interest with counts in ROI
• Efficiency determination
- Alpha spec: Date of efficiency curve, isotopes used, and efficiency
- Gamma spec: Date of efficiency, isotopes used, and efficiency equation
- Liquid Scintillation Counting: Date of quench curve or date of efficiency calibration for constant quench, equation relating efficiency to quench. Daily measurements with appropriate control charts for Instrument Performance Assessment taken on the count date of samples in the SDG.

Idaho National Engineering and Environmental Laboratory 412.09 (09/03/2002 - Rev. 7)
RADIOANALYTICAL DATA VALIDATION Identifier: Revision: Page:
GDE-205 1 73 of 78
Appendix A
- Gas Proportional Counting: Date of efficiency/self-absorption curve(s) and isotope(s) used, and graph or equation of self-absorption curve. For gross alpha/beta, give calibration isotopes.
The laboratory may report the raw data in any format desired insofar as all required data elements are present.

Idaho National Engineering and Environmental Laboratory 412.09 (09/03/2002 - Rev. 7)
RADIOANALYTICAL DATA VALIDATION Identifier: Revision: Page:
GDE-205 1 74 of 78
Appendix B
Appendix B
Limitations and Validation Report
INTRODUCTION
Report coversheet
• Report title and identification (The report identification is an identifier unique to the report.)
• Client name, address, and project identification (This information is provided to the validator on the validation release.)
• Name and address of data validator
• Signature of data validator
• Report date
• Revision number (if applicable)
Project Scope/Description
• Project name (This is provided on the validation transmittal form.)
• SDG Number (This is the Sample Delivery Group number assigned to the data package by the laboratory.)
• Data deliverable (This is the reporting level as described in ER-SOW-394 and requested in the applicable TOS.)
• TOS number (This is the TOS number assigned by SAM to the task-specific laboratory work order.)
• Sample description
• Laboratory name and location
• Laboratory report identifier (This is the laboratory task identification, or work order number, assigned by the laboratory to the analytical data package.)
• Sample identifications (The validator identifies each field sample by its associated field identification number and laboratory identification.)
• Sample matrix

Idaho National Engineering and Environmental Laboratory 412.09 (09/03/2002 - Rev. 7)
RADIOANALYTICAL DATA VALIDATION Identifier: Revision: Page:
GDE-205 1 75 of 78
Appendix B
• Parameters/analyses (The specific radionuclide analyses performed listed (e.g., gamma spectrometry, gross alpha, 3H, 90Sr, 99Tc, etc.).
• Preparation and analysis methods
• Level of review – This is the applicable analytical data validation level (i.e., Level A or B)
BODY OF REPORT
Narrative summarizing any major nonconformances or deficiencies and their impact on the sample data.
Detailed review of each category evaluated indicating whether the frequency requirements were met and whether the results were acceptable; description of any nonconformance or deficiencies identified and qualification of the affected data accordingly; definitions of the qualifiers used
Sample-Specific Parameters
• Sample preservation
• Holding times
• Sample-specific chemical yield
• Required detection level
• Nuclide identification
• Quantification and combined standard uncertainty propagation
• Detectability
Batch Control Parameters
• Laboratory control sample analysis
• Matrix spike sample analysis
• Method blank and background analysis
• Laboratory duplicate analysis
Instrument Parameters
• Counting efficiency calibration
• Energy calibration
• Background determination

Idaho National Engineering and Environmental Laboratory 412.09 (09/03/2002 - Rev. 7)
RADIOANALYTICAL DATA VALIDATION Identifier: Revision: Page:
GDE-205 1 76 of 78
Appendix B
Written Summation
Address each main review parameter in a separate paragraph and specify whether or not the laboratory was in or out of compliance and list the actions taken for each analysis and the reason why a particular data qualifier flag was assigned. It should be made clear whether a finding and subsequent action was based strictly on adherence to this guide or was based on the professional judgment of the data validator. If decisions (data qualification) are based on the professional judgment of the validator, a brief description of the reasons and justifications applied should be included.
Data Limitations and Usability Overview
Provide an overview of the limitations of the data for each sample and for each analysis. The overview consists of:
Summary of qualified data with qualification of any samples and the affected analytes including explanation for qualification or reference to the applicable quality control criterion that was not met.
The summary of qualified data lists the field samples that had any of its radioanalytical results assigned a qualifier (validation) flag. It must be clearly documented which radionuclide results were assigned which data validation flag for each of the listed samples. In addition, a reference is made to each applicable parameter that describes why a data qualifier was assigned to a sample result. Usability of the data should be described in reference to the definitions of the data qualification flags in Table B-2.
Data Qualifier Table
The Data Qualifier (Validation Flag) Table lists qualification flags assigned to each analysis result reported in the SDG. An example of a completed data qualifier table follows (Table B-1); equivalent formats to present this information are also acceptable. The data qualifier flags are also added to the laboratory reporting forms by hand notation (preferably in red ink) by the validator and enclosed as an attachment.
Table B-1. Example of radioanalytical data qualifier (validation flag) table.
Analysis Type: Gross Alpha
Gross Beta Cs-137 Sr-90 H-3 I-129
∇ Sample Number ∇
XXX12345YY UJ J U
XXX12346YY UJ U U U U
XXX12347YY UJ J U U

Idaho National Engineering and Environmental Laboratory 412.09 (09/03/2002 - Rev. 7)
RADIOANALYTICAL DATA VALIDATION Identifier: Revision: Page:
GDE-205 1 77 of 78
Appendix B
The data qualifier flags used and their definitions are shown in Table B-2.
Table B-2. Data qualifier flags.
Flag Definition
<none> The analysis was performed, and radioactivity was detected (e.g., the radioanalytical result is statistically positive at the 95% confidence interval and is above its MDC).
NOTE: The radionuclide is considered to be present in the sample.
U The analysis was performed, but no radioactivity was detected (i.e., the radioanalytical result was not statistically positive at the 95% confidence interval and/or the result was below its MDC). The “U” qualifier flag is also applicable to any result reported as zero (0) (± an associated uncertainty).
NOTE: The radionuclide is not considered to be present in the sample.
UJ The analysis was performed, however, the result is highly questionable due to analytical and/or laboratory quality control anomalies. The use of such a result is strongly discouraged. Analytical and quality control anomalies include such items as: significant blank contamination, known photopeak interferences and/or photopeak resolution problems, known matrix interferences, unacceptable laboratory control sample recoveries, serious instrument calibration problems, improper sample preservation, etc.
The “UJ” qualifier flag could designate a possible false positive result in the case of a result that is statistically positive at the 95% confidence level. The “UJ” qualifier flag could indicate the result is considered an estimated nondetect (a nondetect that may be due to loss of analyte from lack of sample preservation, holding time exceedences, etc.). The specific use of the “UJ” flag is included by the validator in the text of the validation report.
NOTE: The radionuclide may or may not be present in the sample and the result is considered highly questionable.
J The analysis was performed, and radioactivity was detected (i.e., the radionuclide result is statistically positive at the 95% confidence interval and is above its MDC). However, the result is questionable due to analytical and/or laboratory quality control anomalies/irregularities and should therefore be used only as an estimated (approximated) quantity. Analytical and/or quality control anomalies include such items such as: laboratory duplicate imprecision, unsatisfactory analytical yields, insufficient laboratory control sample recoveries, unacceptable PE sample results, instrument calibration problems, improper sample preservation, etc.
NOTE: The radionuclide is considered to be present in the sample; however, the result may not be an accurate representation of the amount of activity actually present in the sample.

Idaho National Engineering and Environmental Laboratory 412.09 (09/03/2002 - Rev. 7)
RADIOANALYTICAL DATA VALIDATION Identifier: Revision: Page:
GDE-205 1 78 of 78
Table B-2. (continued).
Appendix B
Flag Definition
R The analysis result is unusable and was rejected due to severe analytical and/or quality control problems.
NOTE: The radionuclide may or may not be present, and the result is known to be inaccurate or imprecise.
DEFINITIONS
Any radioanalytical terminology used in the L&V report that may not be commonly understood or is unique to the data validation process, are defined in accordance with the definitions referenced in Section 6 of this guide. At a minimum, the following definitions shall be listed in each L&V report:
Data Qualification (Validation) Flag, Laboratory Blank, Laboratory Control Sample (LCS), Laboratory Duplicate, Matrix, Matrix Spike, Minimum Detectable Concentration (MDC), Sample Delivery Group (SDG), Statistically Positive Result, Validation, and Verification.
REFERENCES
All procedures, the SOW, the project-specific TOS, this guide and any other applicable documents used for data validation are referenced.
ATTACHMENTS
The following items are included as an attachment to the L&V report:
1. All validated radionuclide analyses results. The data qualifier flags are in red ink so that the original laboratory submission can be distinguished from the validated results. The validator initials and dates each page on which a qualifier, correction, or other notation was made.
3. The laboratory data package case narrative, cover page, and any other pertinent laboratory communication records.
4. A copy of the applicable chain of custody form(s).
5. All computations performed by the validator to assess quality indicators (e.g., blanks, duplicates, and calculational confirmation of any analytical results) are provided. The calculations can be submitted in either hand-written form or in a spreadsheet format.
6. Any other documentation the data validator deems necessary to support the findings, observations, and issues addressed in the L&V report.