Embed Size (px)
Citation preview

R. A. Brown 2003 U. ConcepciÓn

UW; Patoux, ‘03R. A. Brown 2003 U. ConcepciÓn

R. A. Brown 2003 U. ConcepciÓn

R. A. Brown 2003 U. ConcepciÓn

A Measure of the Success of a wind vector Model Function is the recognizable periodic response of backscatter in a global data set.
This will appear if data are binned in small increments of wind speed and incidence angle, and backscatter vs look angle are plotted.
The backscatter should rise and fall sinusoidally as look direction is up, down, or across the wind.
The microwave backscatter can be expected to vary with:• Wind stress, hence Surface wind speed• Incidence angle • Angle between radar look and wind forcing
R.A. Brown, 11/99R. A. Brown 2003 U. ConcepciÓn

R. A. Brown 2003 U. ConcepciÓn

Go to scatterometer profile file

SeaSat 1978 ERS -1 1991-95
ERS-2 1995-2001 NSCAT 1996-97
QuickScat 1999 -
SeaWinds 2002 -
ASCAT 2004
R. A. Brown 2003 U. ConcepciÓn
ERS-2 1995-2001; 2003 -

R. A. Brown 2003 U. ConcepciÓn

Active Microwave Radar Basics appraisalData: cm-scale, average density in a footprint. 50km 25km 7km 100m (SAR)
Theory: State: 1-10, poor to excellent
Wind generation of water waves 1 % energy into short/long waves 2 Wave-wave interaction 3 PBL wind (log layer, Ekman layer) 8 Parameterizations U10 (u*) land 7 U10 (u*) ocean 5 PBL (similarity) 7 Scatterometer Model Function u* (o) 4 U10 (o) 8 P (o) 7• Note: There’s room for new phenomena
R. A. Brown 2003 U. ConcepciÓn
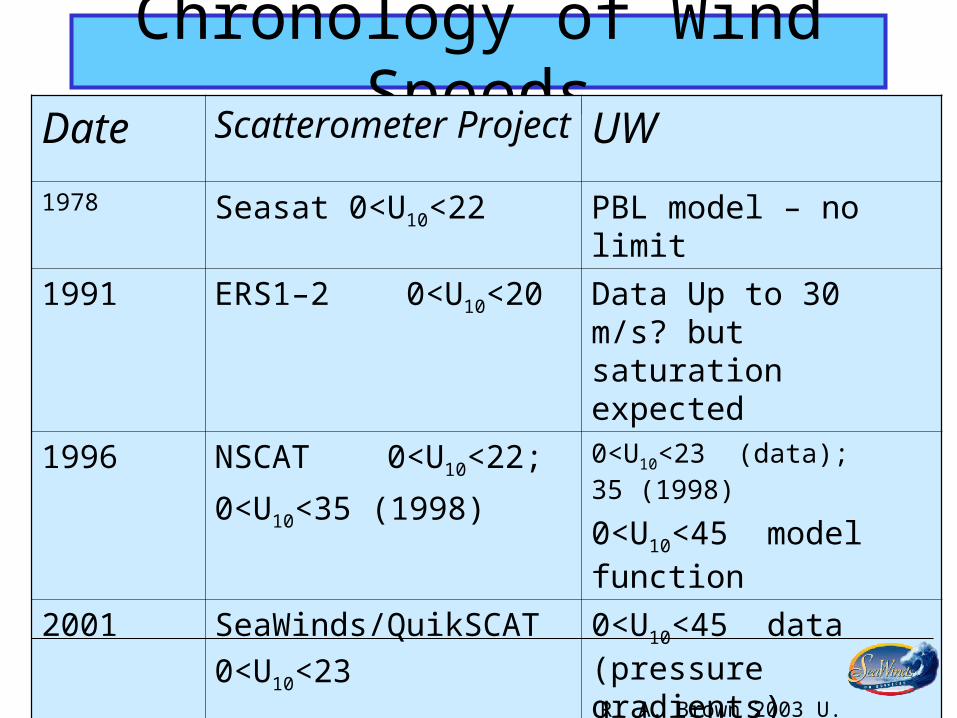
Chronology of Wind Speeds
Date Scatterometer Project UW1978 Seasat 0<U10<22 PBL model – no limit
1991 ERS1–2 0<U10<20 Data Up to 30 m/s? but saturation expected
1996 NSCAT 0<U10<22;
0<U10<35 (1998)
0<U10<23 (data); 35 (1998)
0<U10<45 model function
2001 SeaWinds/QuikSCAT
0<U10<23
0<U10<45 data (pressure gradients)
2002
2003
SeaWinds/QuikSCAT
0<U10<45; 0<U10<55
QuikScat & SeaWinds
0<U10<55 data
& model function
R. A. Brown 2003 U. ConcepciÓn
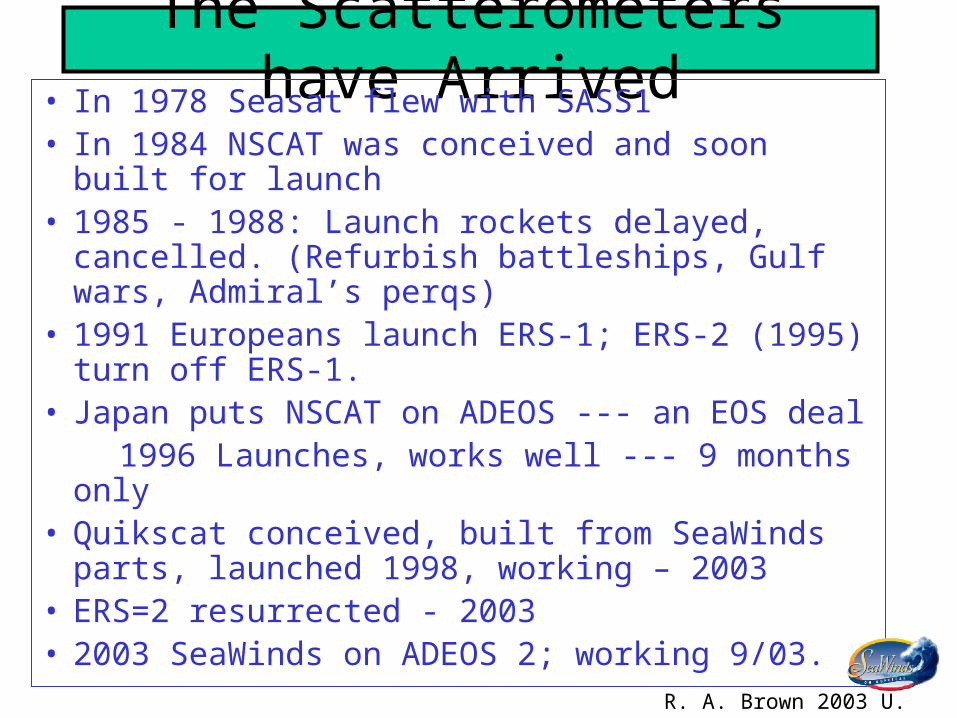
The Scatterometers have Arrived• In 1978 Seasat flew with SASS1• In 1984 NSCAT was conceived and soon built for
launch• 1985 - 1988: Launch rockets delayed, cancelled.
(Refurbish battleships, Gulf wars, Admiral’s perqs)• 1991 Europeans launch ERS-1; ERS-2 (1995) turn
off ERS-1.• Japan puts NSCAT on ADEOS --- an EOS deal 1996 Launches, works well --- 9 months only• Quikscat conceived, built from SeaWinds parts,
launched 1998, working – 2003• ERS=2 resurrected - 2003• 2003 SeaWinds on ADEOS 2; working 9/03.
R. A. Brown 2003 U. ConcepciÓn

• The surface layer relation, hence U10 {u*(o ) }works well
• There is almost no surface truth buoy or GCM surface winds with U10 > 25 m/s
• The U10 model function can be extrapolated to about 40 m/s
• There are indications that o responds to the sea state for U10>40 m/s. (H-pol > 60?)
• Winds > 30 m/s need an asterisk indicating a kluge• The JPL Model function still misses very high winds
(Wentz model doesn’t)
CONCLUSIONS
R. A. Brown 2003 U. ConcepciÓn

• The PBL relation
VG{U10 [u*(o )] } works well
• Scatterometer derived pressure fields can be used to choose the best direction ambiguity, substitute an average U10 or a high wind.
• Similarly, the pressure fields can be used to correct (smooth) o single or small area (rainy) anomalies
• GCM PBL models still have wrong physics, too-low winds, too low pressure gradients
CONCLUSIONS
R. A. Brown 2003 U. ConcepciÓn

R. A. Brown 2003 U. ConcepciÓn

Scatterometer Products from Space
WIND vectors WIND vectors
Surface stress vector Surface stress vector
1 9 7 81 9 7 8
R. A. Brown 2003 U. ConcepciÓn

Scatterometer Products from Space
WIND vectorsWIND vectors
FrontsFronts
Storms: Location; Strength
Storms: Location; Strength
Pack Ice location, concentration, thickness
Pack Ice location, concentration, thickness
Land VegetationLand Vegetation
Marine Surface Pressure Fields
Marine Surface Pressure Fields
Surface stress vectorSurface stress vector
Mean PBL temperatureMean PBL temperature
2 0 0 3
Ship, submarine detectionShip, submarine detection
Mean PBL stratificationMean PBL stratification

R. A. Brown 2003 U. ConcepciÓn

R. A. Brown 2003 U. ConcepciÓn

R. A. Brown 2003 U. ConcepciÓn
R. A. Brown 2003 U. ConcepciÓn

Storms & Fronts Analyses
R. A. Brown 2003 U. ConcepciÓn

The gradient wind correction is described in Patoux and Brown (2002) and uses the simple balance of forces in natural coordinates shown in the figure
The Gradient Wind Correction
R. A. Brown 2003 U. ConcepciÓn

On the right, the gradient wind correction has been included. The obtained pressure field is very similar to the uncorrected one, except for the center of the anticyclone, where the radius of curvature is smaller, and the effect of the correction bigger. The pressure gradients are weaker and the central area of the high is flatter, which seems in better agreement with ECMWF.
R. A. Brown 2003 U. ConcepciÓn

The low is deeper, and the pressure gradients are stronger, especially where the winds are strong and where the streamlines are curved the most. This can be appreciated on the western flank of the low. The whole structure of the pressure field is affected by the gradient wind correction: it is more asymmetric, as well as deeper. Note that the uncorrected low is shallower than indicated by ECMWF, but that the corrected low is deeper than indicated by ECMWF.
R. A. Brown 2003 U. ConcepciÓn

• In the first case, the system is decaying and the cold front is moving ahead of the low (note the correspondance between the convergence line and the frontal cloud band).
R. A. Brown 2003 U. ConcepciÓn

In the second case, the system is decaying but a secondary low is developing behind the remnants of the cold front. Note also the correspondance between convergence and clouds.
R. A. Brown 2003 U. ConcepciÓn

Go to scatterometer profile file