Embed Size (px)
Citation preview
45ISSN 1864-5755
65 (1): 45 – 55
4.5.2015© Senckenberg Gesellschaft für Naturforschung, 2015.
Quaternary refugia and secondary contact in the southern boundary of the Brazilian subregion: comparative phylogeography of freshwater fish
María C. Bruno 1 *, Jorge R. Casciotta 2, 5, Adriana E. Almirón 2, Fernando L. Ricillio 3 & Marta S. Lizarrade 4
1 Departamento de Biología, Facultad de Ciencias Exactas y Naturales, Universidad Nacional de Mar del Plata, Argentina, Dean Funes 3350, B7602AYL, Mar del Plata, Argentina — 2 División Zoología Vertebrados, Universidad Nacional de La Plata, Paseo del bosque s/n, B1900FWA Argentina — 3 Cátedra de Histología y Embriología Animal, Facultad de Ciencias Naturales y Museo, Universidad Nacional de La Plata, 122 y 60, B1900FWA, Argentina — 4 Centro Regional de Estudios Genómicos, Facultad de Ciencias Exactas, Universidad Nacional de La Plata, Blvd. 120 No. 1459, B1900FWA, Argentina — 5 Comisión de Investigaciones Científicas de la Provincia de Buenos Aires. Camino General Belgrano s/n, 1900 La Plata, Argentina — * Corresponding author: María Cecilia Bruno: mcecibruno(at)gmail.com
Accepted 19.ii.2015. Published online at www.senckenberg.de / vertebrate-zoology on 4.v.2015.
AbstractFreshwater fish are an ideal model to illustrate how climate-tectonic changes affect the distribution of genetic variation. Freshwater bod-ies are extensively affected by environmental changes, with streams even changing their courses in the most extreme cases. Fortunately, this situation is reflected in the genetic composition of populations and may currently be inferred from the study of mitochondrial DNA molecular markers. Here we analyze and compare the phylogeographic patterns of the species Corydoras paleatus and Jenynsia multiden-tata at the southern limit of the Brazilian subregion. These basins are isolated in the current hydrogeographic pattern due to geologic and paleoclimatic changes. Our results support a concurrent pattern for both species. Some lineages have persisted in the area under adverse climate conditions, possibly in environmental refuges, while other lineages may have colonized the area later by means of paleodrainages connections. In addition, the presence of independent, greatly diverging lineages, even within the same watercourses, suggests secondary contact between these lineages. This work represents a first approach to understand how geologic and paleoclimatic changes have affected the distribution of genetic variation in the Southern Pampean Area.
Key wordsCorydoras paleatus; Jenynsia multidentata; Control region; Southern Pampean Area.
Introduction
The distribution of genetic variation in freshwater organ-isms is affected by the configuration and the geologic evo-lution of the basins where they occur. Freshwater fishes show strong genetic structure as a result of their confine-ment to given hydrologic systems (Faulks et al. 2010; loxterman & keeley 2012).The diverse factors which influence basin morphology and dynamics may be ma-
jor barriers that limit the dispersal capacity of freshwater organisms. When such barriers arise, they restrict gene flow, thus increasing the differentiation of populations. In contrast, when no barriers are present, gene flow tends to homogenize the populations (HutcHinson & templeton 1999; allendorF & luikart 2007; loxterman & keeley 2012). The use of DNA markers in combination with
Bruno, M.C. et al.: Phylogeography of fish in southern Brazilian subregion
46
paleoclimatic reconstruction provides new information on the evolution of species during the climatic oscilla-tions of the Quaternary. Such analyses can identify ge-netic subdivision and its geographical pattern across a species range, and provide attenuated signals of past de-mographic and geographic changes (Hewitt 2004).
The Neotropical region is divided into the Austral and Brazilian subregions according to fish distribution (casciotta et al. 1999). The richest ichthyofauna oc-curs in the Brazilian subregion, extends to the drain-ages south of Buenos Aires province, Argentina. The Southern Pampean Area, in the Buenos Aires province
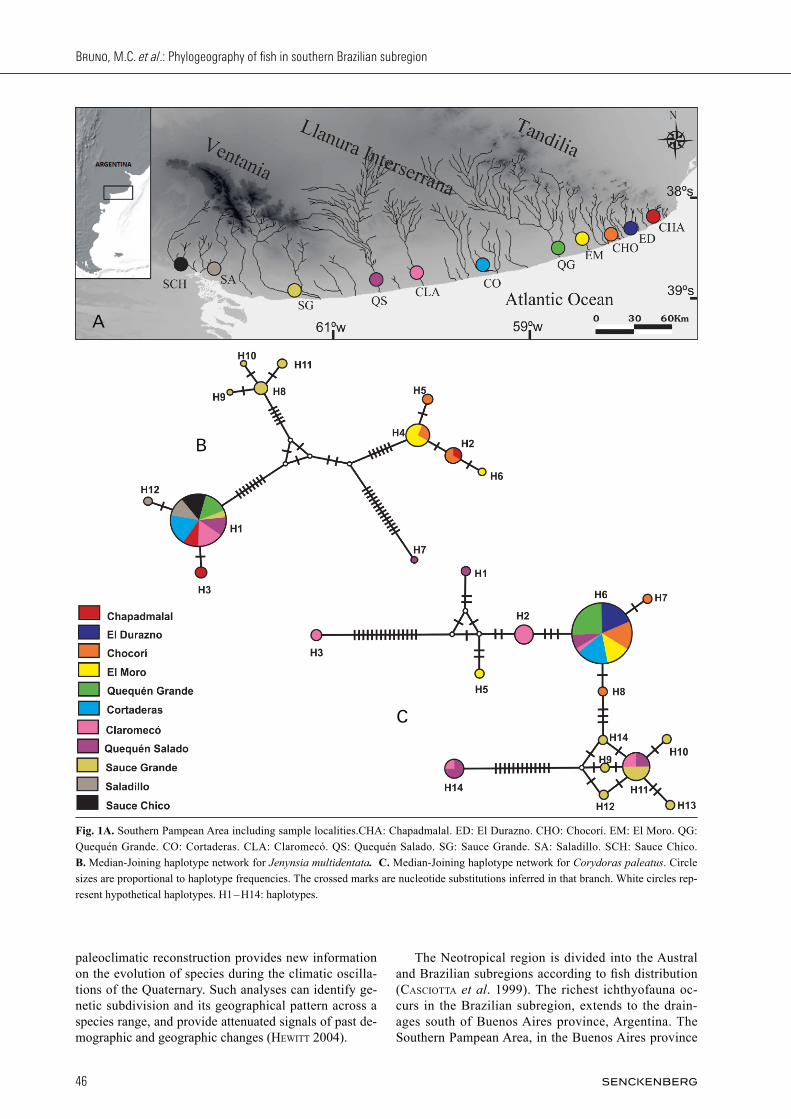
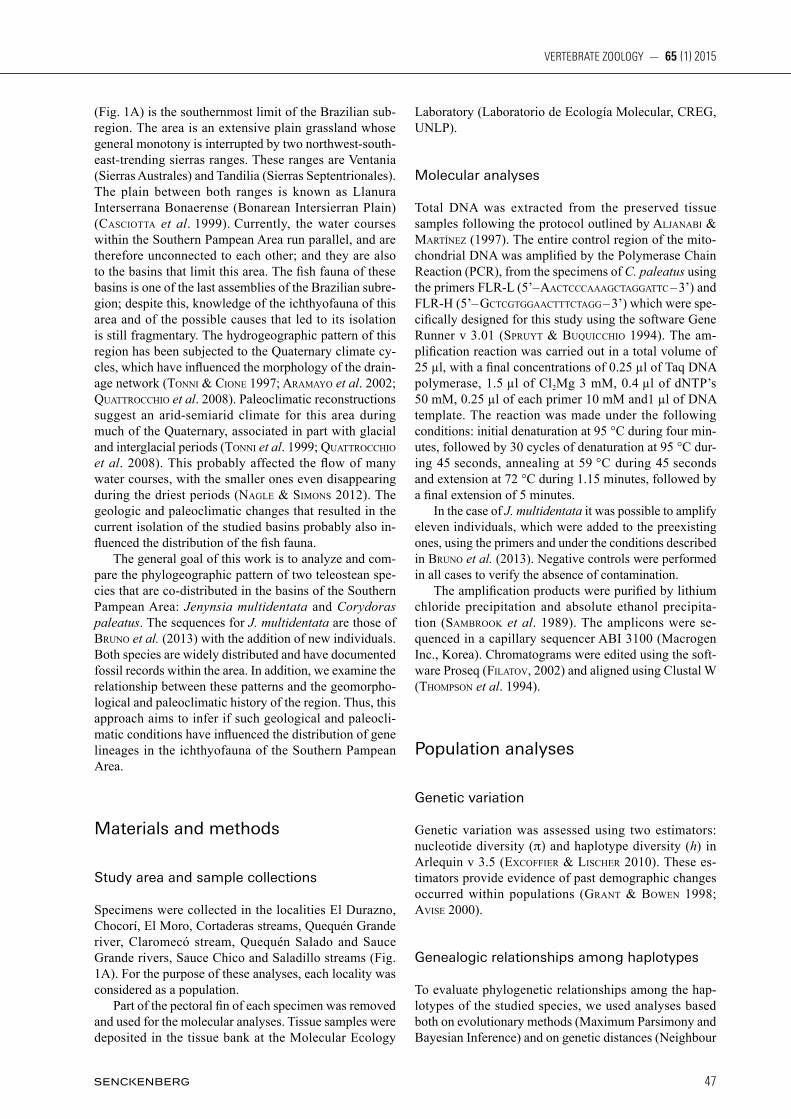
Fig. 1A. Southern Pampean Area including sample localities.CHA: Chapadmalal. ED: El Durazno. CHO: Chocorí. EM: El Moro. QG: Quequén Grande. CO: Cortaderas. CLA: Claromecó. QS: Quequén Salado. SG: Sauce Grande. SA: Saladillo. SCH: Sauce Chico. B. Median-Joining haplotype network for Jenynsia multidentata. C. Median-Joining haplotype network for Corydoras paleatus. Circle sizes are proportional to haplotype frequencies. The crossed marks are nucleotide substitutions inferred in that branch. White circles rep-resent hypothetical haplotypes. H1 – H14: haplotypes.
A
B
C
47
VERTEBRATE ZOOLOGY — 65 (1) 2015
(Fig. 1A) is the southernmost limit of the Bra zilian sub-region. The area is an extensive plain grassland whose general monotony is interrupted by two northwest-south-east-trending sierras ranges. These ranges are Ventania (Sierras Australes) and Tandilia (Sierras Se pten trionales). The plain between both ranges is known as Llanura Interserrana Bonaerense (Bonarean Intersierran Plain) (casciotta et al. 1999). Currently, the water courses within the Southern Pampean Area run parallel, and are therefore unconnected to each other; and they are also to the basins that limit this area. The fish fauna of these basins is one of the last assemblies of the Brazilian subre-gion; despite this, knowledge of the ichthyofauna of this area and of the possible causes that led to its isolation is still fragmentary. The hydrogeographic pattern of this region has been subjected to the Quaternary climate cy-cles, which have influenced the morphology of the drain-age network (tonni & cione 1997; aramayo et al. 2002; QuattroccHio et al. 2008). Paleoclimatic reconstructions suggest an arid-semiarid climate for this area during much of the Quaternary, associated in part with glacial and interglacial periods (tonni et al. 1999; QuattroccHio et al. 2008). This probably affected the flow of many water courses, with the smaller ones even disappearing during the driest periods (nagle & simons 2012). The geologic and paleoclimatic changes that resulted in the current isolation of the studied basins probably also in-fluenced the distribution of the fish fauna. The general goal of this work is to analyze and com-pare the phylogeographic pattern of two teleostean spe-cies that are co-distributed in the basins of the Southern Pampean Area: Jenynsia multidentata and Corydoras paleatus. The sequences for J. multidentata are those of Bruno et al. (2013) with the addition of new individuals. Both species are widely distributed and have documented fossil records within the area. In addition, we examine the relationship between these patterns and the geomorpho-logical and paleoclimatic history of the region. Thus, this approach aims to infer if such geological and paleocli-matic conditions have influenced the distribution of gene lineages in the ichthyofauna of the Southern Pampean Area.
Materials and methods
Study area and sample collections
Specimens were collected in the localities El Durazno, Chocorí, El Moro, Cortaderas streams, Quequén Grande river, Claromecó stream, Quequén Salado and Sauce Grande rivers, Sauce Chico and Saladillo streams (Fig. 1A). For the purpose of these analyses, each locality was considered as a population. Part of the pectoral fin of each specimen was removed and used for the molecular analyses. Tissue samples were deposited in the tissue bank at the Molecular Ecology
Laboratory (Laboratorio de Ecología Molecular, CREG, UNLP).
Molecular analyses
Total DNA was extracted from the preserved tissue samples following the protocol outlined by aljanaBi & martínez (1997). The entire control region of the mito-chondrial DNA was amplified by the Polymerase Chain Reaction (PCR), from the specimens of C. paleatus using the primers FLR-l (5’– aactcccaaagctaggattc – 3’) and FLR-H (5’– gctcgtggaactttctagg – 3’) which were spe-cifically designed for this study using the software Gene Runner v 3.01 (spruyt & BuQuiccHio 1994). The am-plification reaction was carried out in a total volume of 25 µl, with a final concentrations of 0.25 µl of Taq DNA polymerase, 1.5 µl of Cl2Mg 3 mM, 0.4 µl of dNTP’s 50 mM, 0.25 µl of each primer 10 mM and1 µl of DNA template. The reaction was made under the following conditions: initial denaturation at 95 °C during four min-utes, followed by 30 cycles of denaturation at 95 °C dur-ing 45 seconds, annealing at 59 °C during 45 seconds and extension at 72 °C during 1.15 minutes, followed by a final extension of 5 minutes. In the case of J. multidentata it was possible to amplify eleven individuals, which were added to the preexisting ones, using the primers and under the conditions described in Bruno et al. (2013). Negative controls were performed in all cases to verify the absence of contamination. The amplification products were purified by lithium chloride precipitation and absolute ethanol precipita-tion (samBrook et al. 1989). The amplicons were se-quenced in a capillary sequencer ABI 3100 (Macrogen Inc., Korea). Chromatograms were edited using the soft-ware Proseq (Filatov, 2002) and aligned using Clustal W (tHompson et al. 1994).
Population analyses
Genetic variation
Genetic variation was assessed using two estimators: nucleotide diversity (p) and haplotype diversity (h) in Arlequin v 3.5 (excoFFier & liscHer 2010). These es-timators provide evidence of past demographic changes occurred within populations (grant & Bowen 1998; avise 2000).
Genealogic relationships among haplotypes
To evaluate phylogenetic relationships among the hap-lotypes of the studied species, we used analyses based both on evolutionary methods (Maximum Parsimony and Bayesian Inference) and on genetic distances (Neighbour
Bruno, M.C. et al.: Phylogeography of fish in southern Brazilian subregion
48
Joining). The software JModelTest (posada & Buck ley 2004; posada 2008) with Akaike’s information criterion (akaike, 1974) was used to select the nucleotide substitu-tion model that best fit the data. For J. multidentata the resulting model was TPM1uf + G. For C. paleatus, the resulting nucleotide substitution model was HKY + G. The parameters obtained for the nucleotide substitution models were used to optimize the data in the phyloge-netic reconstruction. A Maximum Parsimony (MP) analysis was imple-mented in PAUP* 4.0b10 (swoFFord 2002), performing a heuristic search with 100 random stepwise addition and tree bisection and reconnection (tBr) branch swap-ping. Secondly, a Bayesian Inference (BI) analysis was performed using the software Mr. Bayes (ronQuist & HuelsenBeck 2003). Four independent runs of 3 × 10⁶ generations were made for the two species. The first 40,000 trees were discarded as burn-in for J. multiden-tata, and the first 30,000 for C. paleatus. The Neighbour-Joining (NJ) algorithm was implemented in PAUP* 4.0b10 (swoFFord 2002). Because of TPM1uf + G is not a model available in PAUP, the GTR model was se-lected in J. multidentata analyses. Node support for the MP and NJ analyses was tested using 1,000 bootstrap replicates (Felsenstein 1985). Sequences of Poecilia latipinna (GenBank accession number DQ445680.1) and Corydoras rabauti (GenBank accession number 29570739.1) were used as outgroup in the J. multidentata and C. paleatus analyses respectively. Alternatively the evolutionary relationships between haplotype were analyzed by constructing a haplotype net-work for each species, applying the Median Joining algo-rithm (Bandelt et al. 1999) implemented in the software Network 4.5.1 (http://www.fluxus-engineering.com).
Historical demography
Historical demography was assessed by means of Fu’s (1997) and Tajima’s (1989) neutrality tests. These analy-
ses were made both globally for the pooled samples of each species, and for each locality. Their significance was tested using 1,000 coalescent simulations in Arlequin v 3.5 (excoFFier & liscHer 2010). To evaluate for a sudden demographic expansion model a Mismatch distribution analysis (rogers & Harpending 1992) were conducted for the different pop-ulations and for the pooled samples using the software Arlequin v 3.5 (excoFFier & liscHer 2010). To test the validity of the population expansion model of the ob-served vs. the expected mismatch distribution we used a goodness of fit test based on square sum deviation (SSD) and Harpending’s Raggedness index (rg) (Harpending 1994). These analyses were also carried out using the software Arlequin v 3.5 (excoFFier & liscHer 2010).
Population structure
A description of the genetic structure was obtained from an Analysis of Molecular Variance (AMOVA) (excoFFier et al. 1992) using Arlequin v 3.5 (excoFFier & liscHer 2010). For this analysis, three hierarchical population groupings were established on the basis of the geological province where each water course was located: Eastern or Tandilia group, Central or Bonaerean Intersierran Plain group, and Western or Ventania group. The statisti-cal significance was assessed using 1,000 permutations. In order to evaluate the existence of migration- genetic drift equilibrium at regional scale, we used the approach proposed by HutcHinson & templeton (1999). Under equilibrium conditions, genetic distances are expected to increase with the increase of geographic distance be-tween populations, in a pattern known as isolation by distance (wrigHt 1943). The absence or weakness of one or both of these relationships would indicate lack of re-gional equilibrium. The relationship between geographic and genetic distances (Fst) was evaluated by means of a Mantel test (mantel 1967). Statistical significance was assessed using 1,000 permutations.
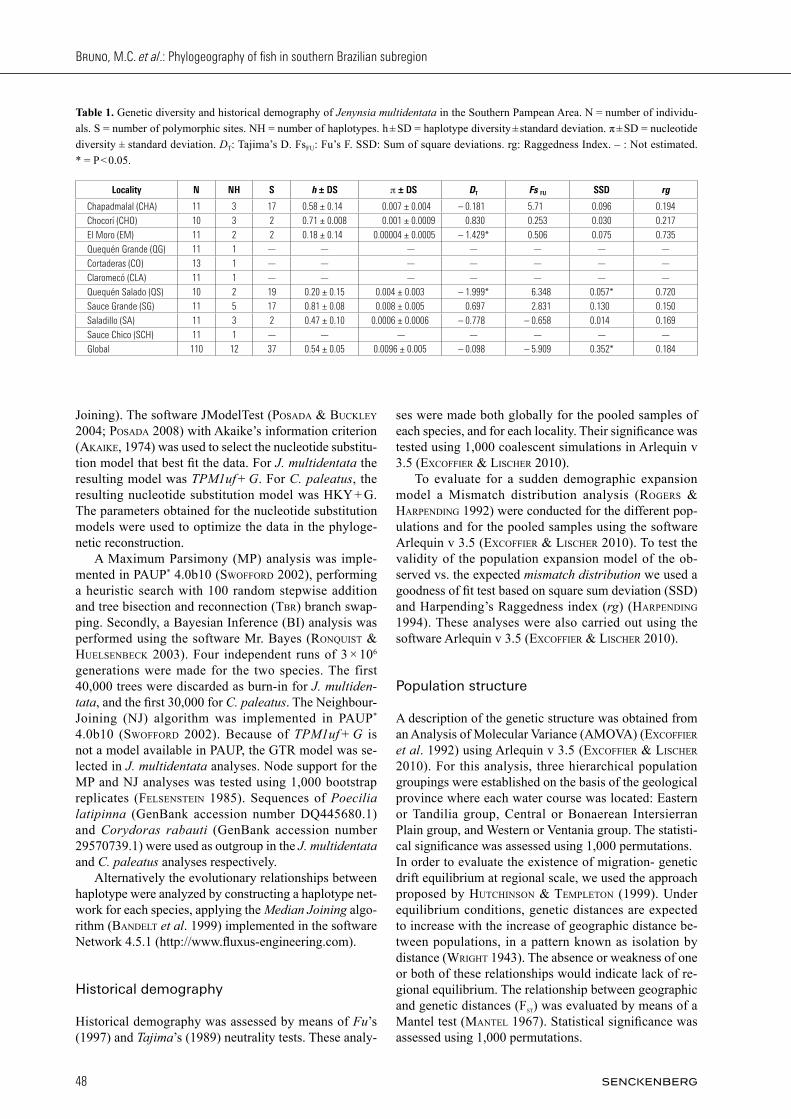
Table 1. Genetic diversity and historical demography of Jenynsia multidentata in the Southern Pampean Area. N = number of individu-als. S = number of polymorphic sites. NH = number of haplotypes. h ± SD = haplotype diversity ± standard deviation. π ± SD = nucleotide diversity ± standard deviation. DT: Tajima’s D. FsFU: Fu’s F. SSD: Sum of square deviations. rg: Raggedness Index. – : Not estimated. * = P < 0.05.
Locality N NH S h ± DS p ± DS DT Fs FU SSD rg
Chapadmalal (CHA) 11 3 17 0.58 ± 0.14 0.007 ± 0.004 – 0.181 5.71 0.096 0.194
Chocorí (CHO) 10 3 2 0.71 ± 0.008 0.001 ± 0.0009 0.830 0.253 0.030 0.217
El Moro (EM) 11 2 2 0.18 ± 0.14 0.00004 ± 0.0005 – 1.429* 0.506 0.075 0.735
Quequén Grande (QG) 11 1 — — — — — — —
Cortaderas (CO) 13 1 — — — — — — —
Claromecó (CLA) 11 1 — — — — — — —
Quequén Salado (QS) 10 2 19 0.20 ± 0.15 0.004 ± 0.003 – 1.999* 6.348 0.057* 0.720
Sauce Grande (SG) 11 5 17 0.81 ± 0.08 0.008 ± 0.005 0.697 2.831 0.130 0.150
Saladillo (SA) 11 3 2 0.47 ± 0.10 0.0006 ± 0.0006 – 0.778 – 0.658 0.014 0.169
Sauce Chico (SCH) 11 1 — — — — — — —
Global 110 12 37 0.54 ± 0.05 0.0096 ± 0.005 – 0.098 – 5.909 0.352* 0.184
49
VERTEBRATE ZOOLOGY — 65 (1) 2015
Results
Genetic variation
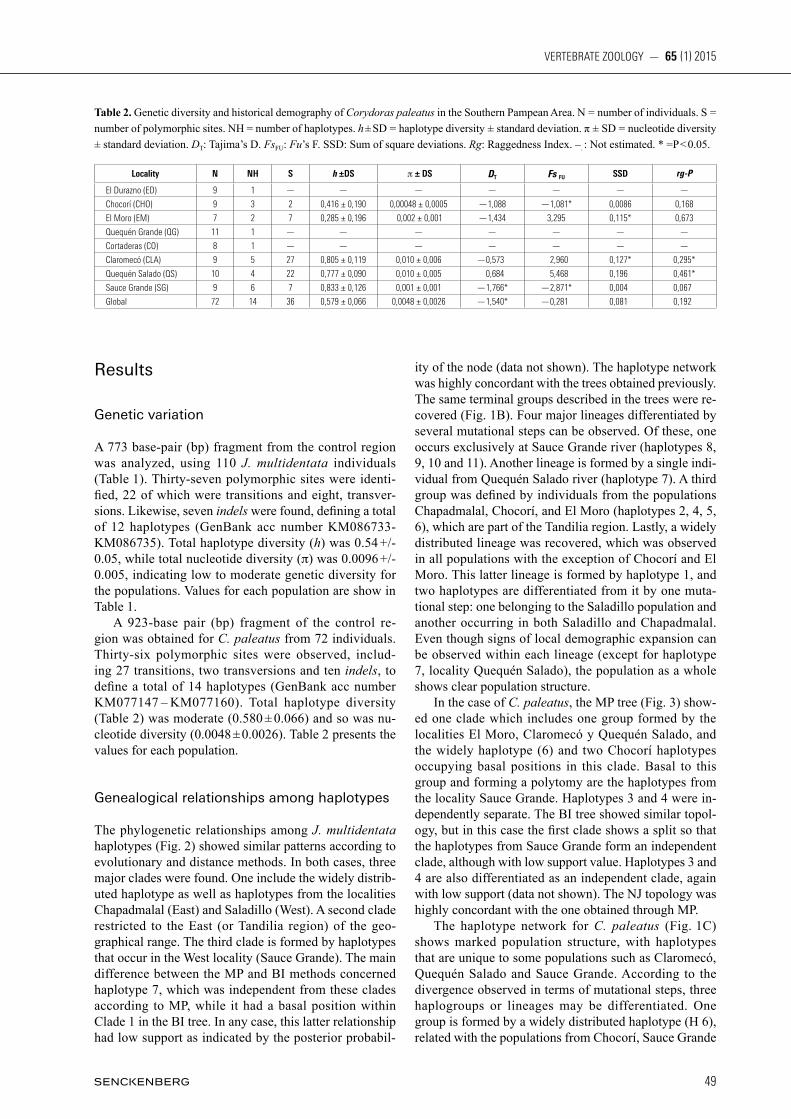
A 773 base-pair (bp) fragment from the control region was analyzed, using 110 J. multidentata individuals (Table 1). Thirty-seven polymorphic sites were identi-fied, 22 of which were transitions and eight, transver-sions. Likewise, seven indels were found, defining a total of 12 haplotypes (GenBank acc number KM086733-KM086735). Total haplotype diversity (h) was 0.54 +/- 0.05, while total nucleotide diversity (p) was 0.0096 +/- 0.005, indicating low to moderate genetic diversity for the populations. Values for each population are show in Table 1. A 923-base pair (bp) fragment of the control re-gion was obtained for C. paleatus from 72 individuals. Thirty-six polymorphic sites were observed, includ-ing 27 transitions, two transversions and ten indels, to define a total of 14 haplotypes (GenBank acc number KM077147 – KM077160). Total haplotype diversity (Table 2) was moderate (0.580 ± 0.066) and so was nu-cleotide diversity (0.0048 ± 0.0026). Table 2 presents the values for each population.
Genealogical relationships among haplotypes
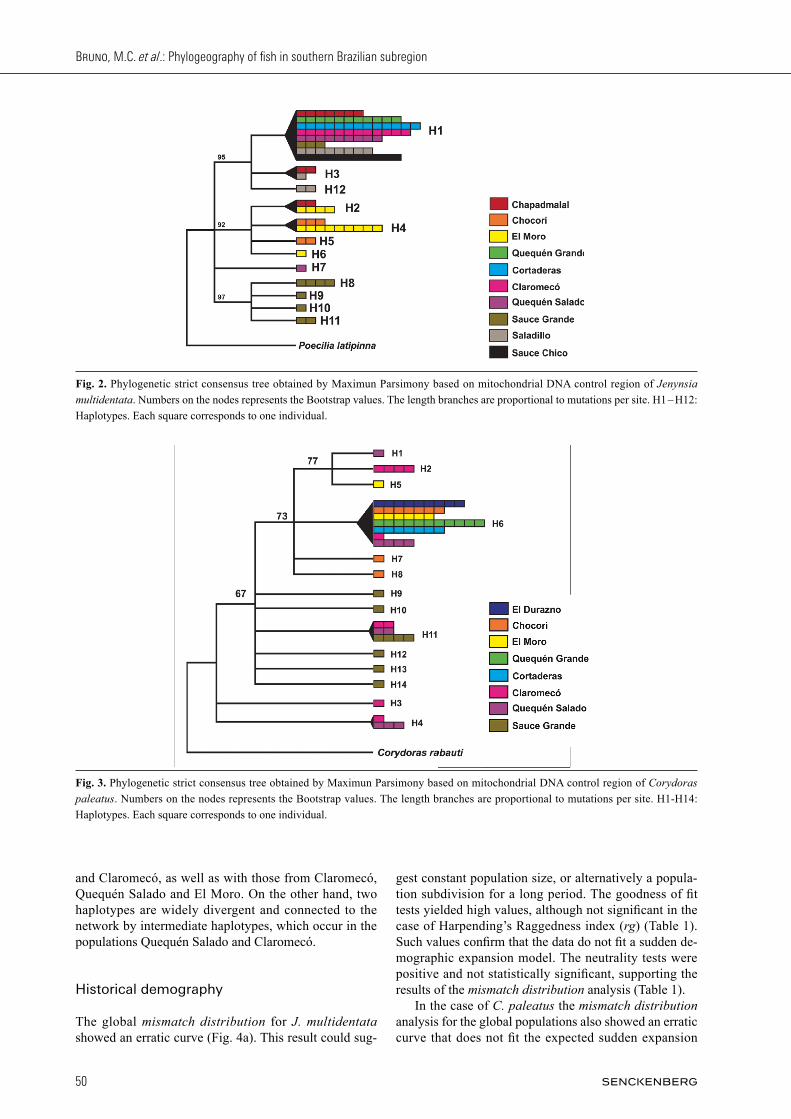
The phylogenetic relationships among J. multidentata haplotypes (Fig. 2) showed similar patterns according to evolutionary and distance methods. In both cases, three major clades were found. One include the widely distrib-uted haplotype as well as haplotypes from the localities Chapadmalal (East) and Saladillo (West). A second clade restricted to the East (or Tandilia region) of the geo-graphical range. The third clade is formed by haplotypes that occur in the West locality (Sauce Grande). The main difference between the MP and BI methods concerned haplotype 7, which was independent from these clades according to MP, while it had a basal position within Clade 1 in the BI tree. In any case, this latter relationship had low support as indicated by the posterior probabil-
ity of the node (data not shown). The haplotype network was highly concordant with the trees obtained previously. The same terminal groups described in the trees were re-covered (Fig. 1B). Four major lineages differentiated by several mutational steps can be observed. Of these, one occurs exclusively at Sauce Grande river (haplotypes 8, 9, 10 and 11). Another lineage is formed by a single indi-vidual from Quequén Salado river (haplotype 7). A third group was defined by individuals from the populations Chapadmalal, Chocorí, and El Moro (haplotypes 2, 4, 5, 6), which are part of the Tandilia region. Lastly, a widely distributed lineage was recovered, which was observed in all populations with the exception of Chocorí and El Moro. This latter lineage is formed by haplotype 1, and two haplotypes are differentiated from it by one muta-tional step: one belonging to the Saladillo population and another occurring in both Saladillo and Chapadmalal. Even though signs of local demographic expansion can be observed within each lineage (except for haplotype 7, locality Quequén Salado), the population as a whole shows clear population structure. In the case of C. paleatus, the MP tree (Fig. 3) show-ed one clade which includes one group formed by the localities El Moro, Claromecó y Quequén Salado, and the widely haplotype (6) and two Chocorí haplotypes occupying basal positions in this clade. Basal to this group and forming a polytomy are the haplotypes from the locality Sauce Grande. Haplotypes 3 and 4 were in-dependently separate. The BI tree showed similar topol-ogy, but in this case the first clade shows a split so that the haplotypes from Sauce Grande form an independent clade, although with low support value. Haplotypes 3 and 4 are also differentiated as an independent clade, again with low support (data not shown). The NJ topology was highly concordant with the one obtained through MP. The haplotype network for C. paleatus (Fig. 1C) shows marked population structure, with haplotypes that are unique to some populations such as Claromecó, Quequén Salado and Sauce Grande. According to the divergence observed in terms of mutational steps, three haplogroups or lineages may be differentiated. One group is formed by a widely distributed haplotype (H 6), related with the populations from Chocorí, Sauce Grande
Table 2. Genetic diversity and historical demography of Corydoras paleatus in the Southern Pampean Area. N = number of individuals. S = number of polymorphic sites. NH = number of haplotypes. h ± SD = haplotype diversity ± standard deviation. π ± SD = nucleotide di versity ± standard deviation. DT: Tajima’s D. FsFU: Fu’s F. SSD: Sum of square deviations. Rg: Raggedness Index. –. : Not estimated. * =P < 0.05.
Locality N NH S h ±DS p ± DS DT Fs FU SSD rg-P
El Durazno (ED) 9 1 — — — — — — —
Chocorí (CHO) 9 3 2 0,416 ± 0,190 0,00048 ± 0,0005 —1,088 —1,081* 0,0086 0,168
El Moro (EM) 7 2 7 0,285 ± 0,196 0,002 ± 0,001 —1,434 3,295 0,115* 0,673
Quequén Grande (QG) 11 1 — — — — — — —
Cortaderas (CO) 8 1 — — — — — — —
Claromecó (CLA) 9 5 27 0,805 ± 0,119 0,010 ± 0,006 —0,573 2,960 0,127* 0,295*
Quequén Salado (QS) 10 4 22 0,777 ± 0,090 0,010 ± 0,005 0,684 5,468 0,196 0,461*
Sauce Grande (SG) 9 6 7 0,833 ± 0,126 0,001 ± 0,001 —1,766* —2,871* 0,004 0,067
Global 72 14 36 0,579 ± 0,066 0,0048 ± 0,0026 —1,540* —0,281 0,081 0,192
BRUNO, M.C. et al.: Phylogeography of fi sh in southern Brazilian subregion
50
and Claromecó, as well as with those from Claromecó, Quequén Salado and El Moro. On the other hand, two haplotypes are widely divergent and connected to the network by intermediate haplotypes, which occur in the populations Quequén Salado and Claromecó.
Historical demography
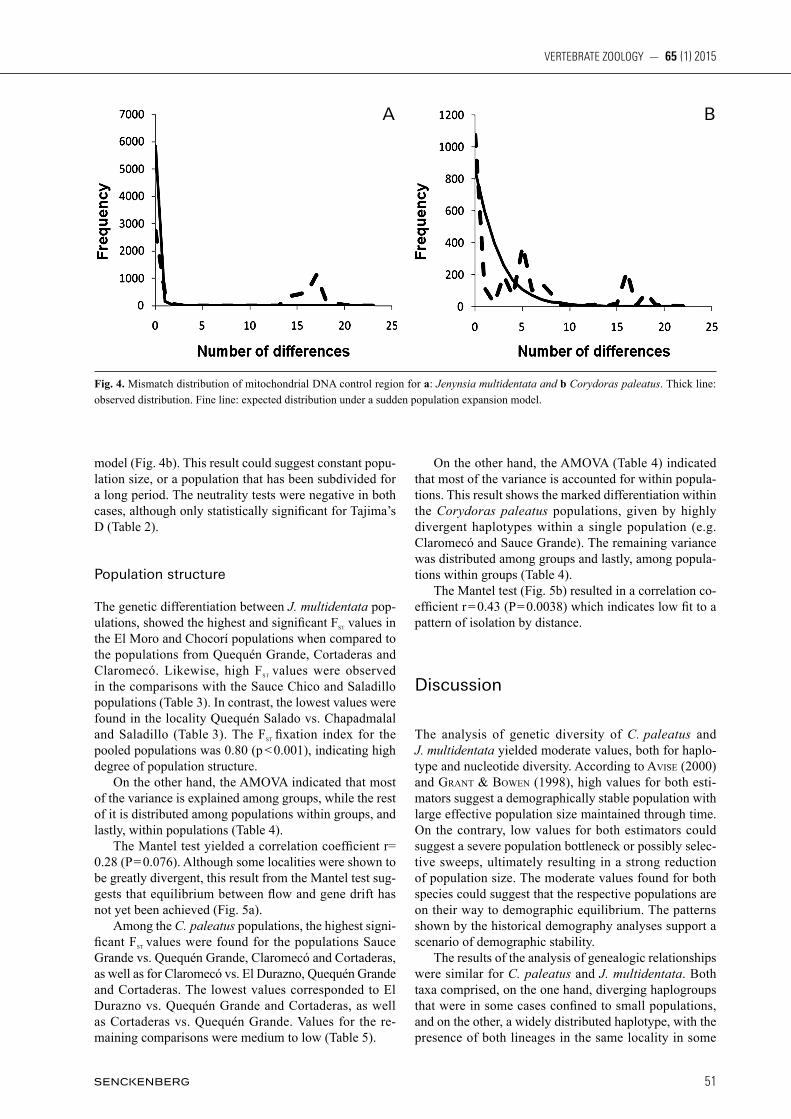
The global mismatch distribution for J. multidentata showed an erratic curve (Fig. 4a). This result could sug-
gest constant population size, or alternatively a popula-tion subdivision for a long period. The goodness of fi t tests yielded high values, although not signifi cant in the case of Harpending’s Raggedness index (rg) (Table 1). Such values confi rm that the data do not fi t a sudden de-mographic expansion model. The neutrality tests were positive and not statistically signifi cant, supporting the results of the mismatch distribution analysis (Table 1). In the case of C. paleatus the mismatch distribution analysis for the global populations also showed an erratic curve that does not fi t the expected sudden expansion
Fig. 3. Phylogenetic strict consensus tree obtained by Maximun Parsimony based on mitochondrial DNA control region of Corydoras paleatus. Numbers on the nodes represents the Bootstrap values. The length branches are proportional to mutations per site. H1-H14: Haplotypes. Each square corresponds to one individual.
Fig. 2. Phylogenetic strict consensus tree obtained by Maximun Parsimony based on mitochondrial DNA control region of Jenynsia multidentata. Numbers on the nodes represents the Bootstrap values. The length branches are proportional to mutations per site. H1 – H12: Haplotypes. Each square corresponds to one individual.
51
VERTEBRATE ZOOLOGY — 65 (1) 2015
model (Fig. 4b). This result could suggest constant popu-lation size, or a population that has been subdivided for a long period. The neutrality tests were negative in both cases, although only statistically significant for Tajima’s D (Table 2).
Population structure
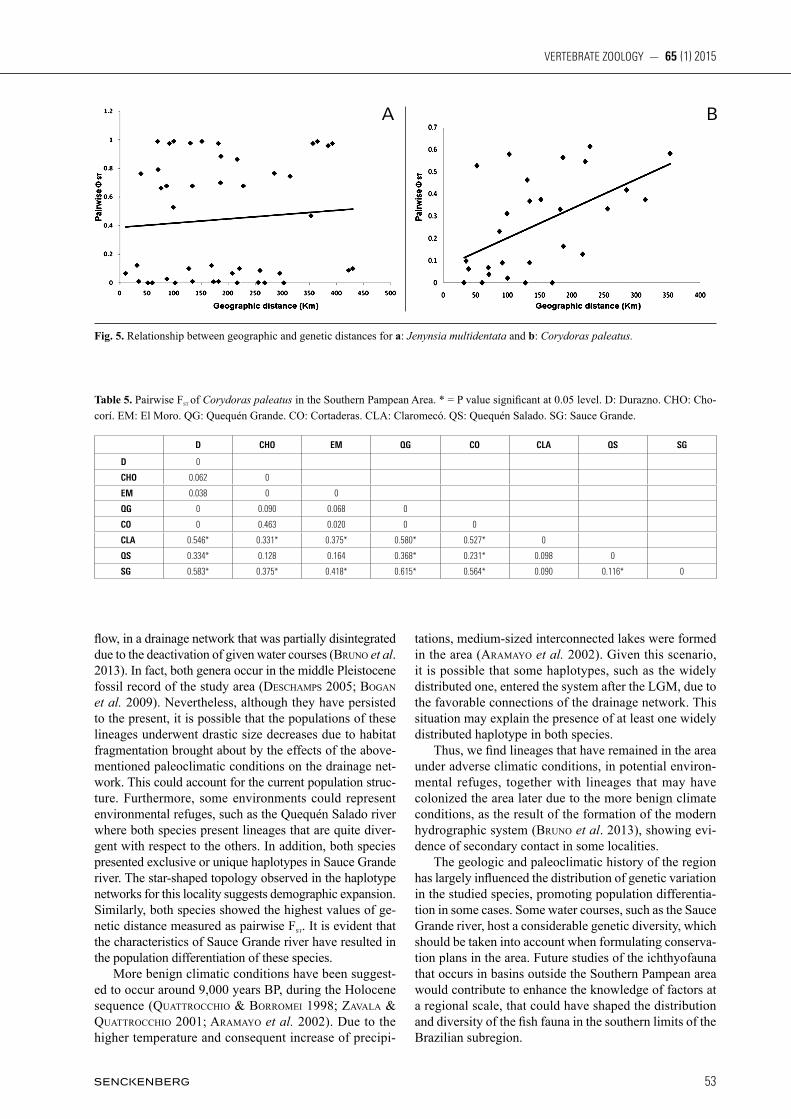
The genetic differentiation between J. multidentata pop-ulations, showed the highest and significant Fst values in the El Moro and Chocorí populations when compared to the populations from Quequén Grande, Cortaderas and Claromecó. Likewise, high Fst values were observed in the comparisons with the Sauce Chico and Saladillo populations (Table 3). In contrast, the lowest values were found in the locality Quequén Salado vs. Chapadmalal and Saladillo (Table 3). The Fst fixation index for the pooled populations was 0.80 (p < 0.001), indicating high degree of population structure. On the other hand, the AMOVA indicated that most of the variance is explained among groups, while the rest of it is distributed among populations within groups, and lastly, within populations (Table 4). The Mantel test yielded a correlation coefficient r= 0.28 (P = 0.076). Although some localities were shown to be greatly divergent, this result from the Mantel test sug-gests that equilibrium between flow and gene drift has not yet been achieved (Fig. 5a). Among the C. paleatus populations, the highest signi-ficant Fst values were found for the populations Sauce Grande vs. Quequén Grande, Claromecó and Cortaderas, as well as for Claromecó vs. El Durazno, Quequén Grande and Cortaderas. The lowest values corresponded to El Durazno vs. Quequén Grande and Cortaderas, as well as Cortaderas vs. Quequén Grande. Values for the re-maining comparisons were medium to low (Table 5).
On the other hand, the AMOVA (Table 4) indicated that most of the variance is accounted for within popula-tions. This result shows the marked differentiation within the Corydoras paleatus populations, given by highly divergent haplotypes within a single population (e.g. Claromecó and Sauce Grande). The remaining variance was distributed among groups and lastly, among popula-tions within groups (Table 4). The Mantel test (Fig. 5b) resulted in a correlation co-efficient r = 0.43 (P = 0.0038) which indicates low fit to a pattern of isolation by distance.
Discussion
The analysis of genetic diversity of C. paleatus and J. mul tidentata yielded moderate values, both for haplo-type and nucleotide diversity. According to avise (2000) and grant & Bowen (1998), high values for both esti-mators suggest a demographically stable population with large effective population size maintained through time. On the contrary, low values for both estimators could suggest a severe population bottleneck or possibly selec-tive sweeps, ultimately resulting in a strong reduction of population size. The moderate values found for both species could suggest that the respective populations are on their way to demographic equilibrium. The patterns shown by the historical demography analyses support a scenario of demographic stability. The results of the analysis of genealogic relationships were similar for C. paleatus and J. multidentata. Both taxa comprised, on the one hand, diverging haplogroups that were in some cases confined to small populations, and on the other, a widely distributed haplotype, with the presence of both lineages in the same locality in some
Fig. 4. Mismatch distribution of mitochondrial DNA control region for a: Jenynsia multidentata and b Corydoras paleatus. Thick line: observed distribution. Fine line: expected distribution under a sudden population expansion model.
A B
Bruno, M.C. et al.: Phylogeography of fish in southern Brazilian subregion
52
cases, suggesting the occurrence of secondary contact between the different lineages. The lack of fit between mutation-genetic drift equi-librium in J. multidentata could be explained by strong effect of genetic drift. According to HutcHinson & templeton (1999), the expected patterns in regions that have not reached equilibrium may be affected both by the time elapsed since colonization of the region, and by the degree of dispersal within said region. If environmental conditions change so that the population that occupies the colonized region becomes fragmented into small isolated populations, genetic drift will have relatively greater influence than gene flow (Case III, HutcHinson & templeton 1999). In contrast, for C. paleatus there was low although significant fit between genetic and geographic distances (Case IV, HutcHinson & templeton 1999). Given these results, it is probable that the most diverging lineages fit an isolation-by-distance pattern, but the presence of a widely distributed haplotype hinders a more defined manifestation of such pattern. The integration of the information available so far indicates a similar phylogeographic pattern for both spe-cies: both possess haplogroups that are greatly divergent among them. In both species one of these haplogroups
is widely distributed, while the remaining ones are re-stricted to a few watercourses. The geological and paleoclimatic changes that have affected the Southern Pampean Area could account for the distribution of genetic variation in the fish species that inhabit the area. For freshwater fishes, a pattern of wide colonization in an area can be explained in terms of basin connectivity. On the other hand, for population structure to occur, enough time is necessary so that the individu-als may accumulate differences through mutation and in absence of gene flow, which entails a certain degree of geographic discontinuity (avise, 2000; allendorF & luikart 2007). The existence of the phylogeographic patterns found in this study provide an approximation to a geologic and paleoclimatic scenario with alternating connection and disconnection of the basins in this region. Such phenomena have been characteristic of much of the Quaternary in the Southern Pampean Area. During the middle Pleistocene, the southeastern Buenos Aires province was characterized by arid condi-tions with marked eolic influence (aramayo et al. 2002; QuattroccHio et al. 1993, 2008). The sea level drop dur-ing the last glacial maximum (approx. 22.000 years AP, ponce et al. 2011) produced great eastwards expansion of the coastal line. In turn, this expansion favored changes in the distribution of rivers and the integration of the drainage network. By the late Pleistocene (16.000 – 12.000 AP), dur-ing dry periods, the main courses were discontinuous and accessory drainage networks, both permanent and semi-permanent, were established in association with shallow lakes, and their extension underwent marked seasonal fluc-tuations (zavala et al. 2005). These adverse geologic and climatic conditions could have caused, on the one hand, local extinctions, and on the other, the survival of some populations in those courses that remained active during climate fluctuations. Assuming this paleoclimatic scenar-io, it is possible that the highly genetically differentiated populations of J. multidentata and C. paleatus may have occupied environments that remained active during their evolution. Such populations could have achieved popula-tion differentiation in absence of or with restricted gene
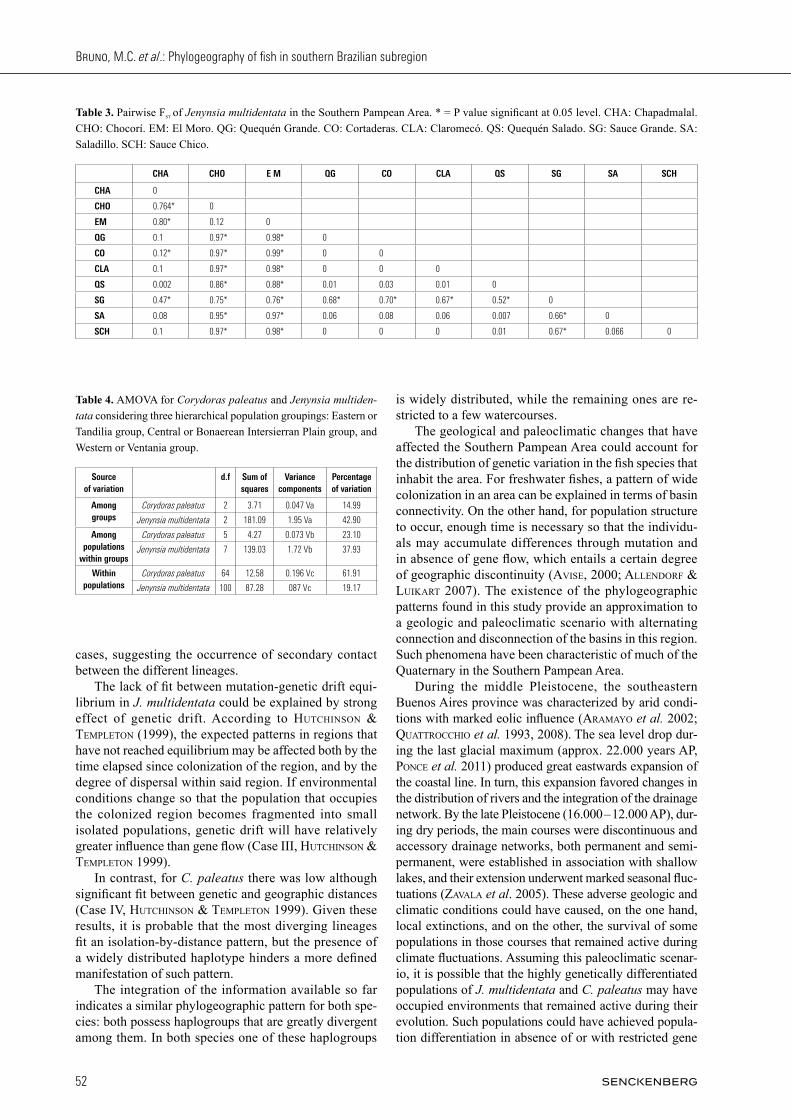
Table 3. Pairwise Fst of Jenynsia multidentata in the Southern Pampean Area. * = P value significant at 0.05 level. CHA: Chapadmalal. CHO: Chocorí. EM: El Moro. QG: Quequén Grande. CO: Cortaderas. CLA: Claromecó. QS: Quequén Salado. SG: Sauce Grande. SA: Saladillo. SCH: Sauce Chico.
CHA CHO E M QG CO CLA QS SG SA SCH
CHA 0
CHO 0.764* 0
EM 0.80* 0.12 0
QG 0.1 0.97* 0.98* 0
CO 0.12* 0.97* 0.99* 0 0
CLA 0.1 0.97* 0.98* 0 0 0
QS 0.002 0.86* 0.88* 0.01 0.03 0.01 0
SG 0.47* 0.75* 0.76* 0.68* 0.70* 0.67* 0.52* 0
SA 0.08 0.95* 0.97* 0.06 0.08 0.06 0.007 0.66* 0
SCH 0.1 0.97* 0.98* 0 0 0 0.01 0.67* 0.066 0
Table 4. AMOVA for Corydoras paleatus and Jenynsia multiden-tata considering three hierarchical population groupings: Eastern or Tandilia group, Central or Bonaerean Intersierran Plain group, and Western or Ventania group.
Sourceof variation
d.f Sum of squares
Variance components
Percentage of variation
Among groups
Corydoras paleatus 2 3.71 0.047 Va 14.99
2 181.09 1.95 Va 42.90Jenynsia multidentata
Among populations
within groups
Corydoras paleatus 5 4.27 0.073 Vb 23.10
Jenynsia multidentata 7 139.03 1.72 Vb 37.93
Within populations
Corydoras paleatus 64 12.58 0.196 Vc 61.91
Jenynsia multidentata 100 87.28 087 Vc 19.17
53
VERTEBRATE ZOOLOGY — 65 (1) 2015
flow, in a drainage network that was partially disintegrated due to the deactivation of given water courses (Bruno et al. 2013). In fact, both genera occur in the middle Pleistocene fossil record of the study area (descHamps 2005; Bogan et al. 2009). Nevertheless, although they have persisted to the present, it is possible that the populations of these lineages underwent drastic size decreases due to habitat fragmentation brought about by the effects of the above-mentioned paleoclimatic conditions on the drainage net-work. This could account for the current population struc-ture. Furthermore, some environments could represent environmental refuges, such as the Quequén Salado river where both species present lineages that are quite diver-gent with respect to the others. In addition, both species presented exclusive or unique haplotypes in Sauce Grande river. The star-shaped topology observed in the haplotype networks for this locality suggests demographic expansion. Similarly, both species showed the highest values of ge-netic distance measured as pairwise Fst. It is evident that the characteristics of Sauce Grande river have resulted in the population differentiation of these species. More benign climatic conditions have been suggest-ed to occur around 9,000 years BP, during the Holocene sequence (QuattroccHio & Borromei 1998; zavala & QuattroccHio 2001; aramayo et al. 2002). Due to the higher temperature and consequent increase of precipi-
tations, medium-sized interconnected lakes were formed in the area (aramayo et al. 2002). Given this scenario, it is possible that some haplotypes, such as the widely distributed one, entered the system after the LGM, due to the favorable connections of the drainage network. This situation may explain the presence of at least one widely distributed haplotype in both species. Thus, we find lineages that have remained in the area under adverse climatic conditions, in potential environ-mental refuges, together with lineages that may have colonized the area later due to the more benign climate conditions, as the result of the formation of the modern hydrographic system (Bruno et al. 2013), showing evi-dence of secondary contact in some localities. The geologic and paleoclimatic history of the region has largely influenced the distribution of genetic variation in the studied species, promoting population differentia-tion in some cases. Some water courses, such as the Sauce Grande river, host a considerable genetic diversity, which should be taken into account when formulating conserva-tion plans in the area. Future studies of the ichthyofauna that occurs in basins outside the Southern Pampean area would contribute to enhance the knowledge of factors at a regional scale, that could have shaped the distribution and diversity of the fish fauna in the southern limits of the Brazilian subregion.
Fig. 5. Relationship between geographic and genetic distances for a: Jenynsia multidentata and b: Corydoras paleatus.
Table 5. Pairwise Fst of Corydoras paleatus in the Southern Pampean Area. * = P value significant at 0.05 level. D: Durazno. CHO: Cho-corí. EM: El Moro. QG: Quequén Grande. CO: Cortaderas. CLA: Claromecó. QS: Quequén Salado. SG: Sauce Grande.
D CHO EM QG CO CLA QS SG
D 0
CHO 0.062 0
EM 0.038 0 0
QG 0 0.090 0.068 0
CO 0 0.463 0.020 0 0
CLA 0.546* 0.331* 0.375* 0.580* 0.527* 0
QS 0.334* 0.128 0.164 0.368* 0.231* 0.098 0
SG 0.583* 0.375* 0.418* 0.615* 0.564* 0.090 0.116* 0
BA

Bruno, M.C. et al.: Phylogeography of fish in southern Brazilian subregion
54
Acknowledgements
The authors thank to Consejo Nacional de Investigaciones Cien-tíficas y Técnicas (CONICET) and Comisión de Investi ga cio nes Científicas de la provincia de Buenos Aires (CIC) for financial sup-port.
References
akaike, H. (1974): A new look at the statistical model identifi- cation. – IEEE Transactions on Automatic Control, 19: 716 – 723.
aljanaBi, S.M. & martinez, I. (1997): Universal and rapid salt-extraction of high quality genomic DNA for PCR-based tech-niques. – Nucleic Acids Research, 25: 4692 – 4693.
allendorF, F.W. & luikart, G.H. (2007): Conservation and the Genetics of Populations. Blackwell Publishing Ltd.
aramayo, S., scHillizzi, R. & gutiérrez téllez, B. (2002) Evo-lu ción paleoambiental del Cuaternario en la costa atlántica del sur de la provincia de Buenos Aires, Argentina. Revista de la So ciedad Geológica de España, 15: 95 – 104.
avise, J.C. (2000). Phylogeography: the history and formation of species. Harvard University Press.
Bandelt, H.-J., Forster, P. & röHl, A. (1999): Median-joining networks for inferring intraspecific phylogenies. – Molecular Biology and Evolution, 16: 37 – 48.
Bogan, S., de los reyes, M.L. & cenizo, M.M. (2009): Primer registro del género Jenynsia Günther, 1866 (Teleostei: Cy pri-no don ti formes) en el Pleistoceno Medio tardío de la provincia de Buenos Aires (Argentina). – Papéis Avulsos de Zoologia (São Paulo), 49: 81 – 86.
Bruno, M.C., casciotta, J.R., almiron, A.E. & lizarralde, M.S. (2013): Phylogeographic pattern of Jenynsia multidentata (Cy-pri no dontiformes: Anablepidae) in the southern boundary of the Brazilian Subregion, Argentina. – Neotropical Ichthyology, 11: 477 – 486.
casciotta, J., almirón, A., cione, A. & azpelicueta, M. (1999): Brazilian freshwater fish assemblages from Southern Pampean Area, Argentina. – Biogeographica, 75: 67 – 78.
descHamps, C.M. (2005): Bio-cronoestratigrafía de mamíferos del Cenozoico tardío en el sudoeste de la provincia de Buenos Aires, Argentina. – Ameghiniana, 42: 733 – 750.
excoFFier, L. & liscHer, H. E. (2010): Arlequin suite ver 3.5: a new series of programs to perform population genetics analyses un-der Linux and Windows. – Molecular Ecology Resources, 10: 564 – 567.
excoFFier, L., smouse, P.E. & Quattro, J.M. (1992): Analysis of molecular variance inferred from metric distances among DNA haplotypes: application to human mitochondrial DNA restric-tion data. – Genetics, 131: 479 – 491.
Faulks, L.K., gilligan, D.M. & BeHeregaray, L.B. (2010): Is-lands of water in a sea of dry land: hydrological regime pre-dicts genetic diversity and dispersal in a widespread fish from Australia’s arid zone, the golden perch (Macquaria ambi-gua). – Molecular Ecology, 19: 4723 – 4737.
Felsenstein, J. (1985): Confidence limits on phylogenies: an ap-proach using the bootstrap. – Evolution, 39: 783 – 791.
Filatov, D.A. (2002): ProSeq: a software for preparation and evo-lu tionary analysis of DNA sequence data sets. – Molecular Eco logy Notes, 2: 621 – 624.
Fu, Y.X. (1997): Statistical tests of neutrality of mutations against population growth, hitchhiking and background selection. – Genetics, 147: 915 – 925.
grant, W. & Bowen, B. (1998): Shallow population histories in deep evolutionary lineages of marine fishes: insights from sar-dines and anchovies and lessons for conservation. – Journal of Here dity, 89: 415 – 426.
Harpending, H. (1994): Signature of ancient population growth in a low resolution mitochondrial DNA mismatch distribution. – Hu man Biology, 66(4): 591 – 600.
Hewitt, G. (2004.):Genetic consequences of climatic oscillations in the Quaternary. – Philosophical Transactions of the Royal Society of London. Series B: Biological Sciences, 359: 183 – 195.
HutcHison, D.W. & templeton, A.R. (1999). Correlation of pair-wise genetic and geographic distance measures: inferring the relative influences of gene flow and drift on the distribution of genetic variability. – Evolution, 53: 1898 – 1914.
loxterman, J.L. & keeley, E.R. (2012): Watershed boundaries and geographic isolation: patterns of diversification in cut-throat trout from western North America. – BMC Evolutionary Biology, 12: 38.
mantel, N. (1967): The detection of disease clustering and a gener-alized regression approach. – Cancer Research, 27: 209 – 220.
nagle, B.C. & simons, A.M. (2012): Rapid diversification in the North American minnow genus Nocomis. – Molecular Phy lo-genetics and Evolution, 63: 639 – 649.
ponce, J.F., raBassa, J., coronato, A. & Borromei, A. (2011): Pa laeo geographical evolution of the Atlantic coast of Pampa and Patagonia from the last glacial maximum to the Middle Holo cene. – Biological Journal of the Linnean Society, 103: 363 – 379.
posada, D. (2008): jModelTest: phylogenetic model averaging. – Molecular biology and evolution, 25: 1253 – 1256.
posada, D. & Buckley, T.R. (2004): Model selection and model averaging in phylogenetics: advantages of Akaike information criterion and Bayesian approaches over likelihood ratio tests. – Systematic Biology, 53: 793 – 808.
QuattroccHio, M.E. & Borromei, A.M. (1998): Paleovegetational and paleoclimatic changes during the late Quaternary in south-western Buenos Aires Province and southern Tierra del Fuego (Argentina). – Palynology, 22: 67 – 82.
QuattroccHio, M.E., Borromei, A.M., descHamps, C.M., grill, S.C. & zavala, C.A. (2008): Landscape evolution and climate changes in the Late Pleistocene – Holocene, southern Pampa (Argentina): evidence from palynology, mammals and sedi-mentology. – Quaternary International, 181: 123 – 138.
QuattroccHio, M.E., kostadinoFF, J., martinez, G. & prieto, A. (1993): Evidencias de neotectónica en el Río Sauce Chico, Prov. de Buenos Aires. – Revista de la Asociación Geológica Ar gen tina, 49: 297 – 305.
rogers, A.R. & Harpending, H. (1992): Population growth makes waves in the distribution of pairwise genetic differences. – Molecular Biology and Evolution, 9: 552 – 569.

55
VERTEBRATE ZOOLOGY — 65 (1) 2015
ronQuist, F. & HuelsenBeck, J.P. (2003): MrBayes 3: Bayesian phylogenetic inference under mixed models. – Bioinformatics, 19: 1572 – 1574.
samBrook, J., FritscH, E. F. & maniatis, T. (1989): Molecular clon-ing. – Cold spring harbor laboratory press New York.
spruyt, M. & BuQuiccHio, F. (1994): Gene Runner Version 3.05. Hastings Software. Inc.
swoFFord, D. (2002): PAUP* version 4.0. Phylogenetic analysis using parsimony (and other methods). Version 4. Sinauer Asso-ciates, Sunderland, Massachusetts.
tajima, F. (1989): Statistical method for testing the neutral mutation hypothesis by DNA polymorphism. – Genetics, 123: 585 – 595.
tHompson, J.D., Higgins, D.G., & giBson, T.J. (1994): CLUSTAL W: improving the sensitivity of progressive multiple sequence alignment through sequence weighting, position-specific gap penalties and weight matrix choice. – Nucleic Acids Research, 22: 4673 – 4680.
tonni, e. & cione, a. (1997): Did the Argentine Pampean ecosys-tem exist in the Pleistocene. – Current research in the Plei sto-cene, 14: 131 – 133.
tonni, E.P., cione, A.L. & Figini, A.J. (1999): Predominance of arid climates indicated by mammals in the pampas of Argentina during the Late Pleistocene and Holocene. – Palaeogeography, Palaeoeclimatology, Paleoecology, 147: 257 – 281.
wrigHt, S. (1943): Isolation by distance. – Genetics, 28: 114 – 138.zavala, C., garcía, L. & di meglio, M. (2005): Redes de drena-
je y paleoclimas en el Cuaternario del sur de la provincia de Buenos Aires. In: xvi Congreso Geológico Argentino, cd-rom, Artículo.
zavala, C. & QuattroccHio, M. (2001): Estratigrafía y evolución geológica del río Sauce Grande (Cuaternario), provincia de Buenos Aires, Argentina. – Revista de la Asociación Geológica Argentina, 56: 25 – 37.