Embed Size (px)
Citation preview
Physics of Atomic Nuclei, Vol. 68, No. 2, 2005, pp. 237–258. Translated from Yadernaya Fizika, Vol. 68, No. 2, 2005, pp. 262–282.Original Russian Text Copyright c© 2005 by Glushkov.
ELEMENTARY PARTICLES AND FIELDSExperiment
Quasars as Sources of Ultrahigh-Energy Cosmic Rays
A. V. Glushkov*
Institute of Cosmophysical Research and Aeronomy, Yakutsk Research Center, Siberian Division,Russian Academy of Sciences, pr. Lenina 31, Yakutsk, 677891 Russia
Received February 19, 2004
Abstract—The results are presented that were obtained by analyzing arrival directions for cosmic raysthat the Yakutsk array for studying extensive air showers recorded between 1974 and 2002 in the energyregion E0 ≥ 5 × 10¹⁷ eV for zenith angles in the region θ ≤ 60. It is shown that quasars for which theredshift lies in the region z ≤ 2.5 can be sources of these cosmic rays. Ordered structures are observed inthe disposition of quasars and in the cosmic-ray arrival directions. These structures can be associated inone way or another with the large-scale structure of the Universe. c© 2005 Pleiades Publishing, Inc.
1. INTRODUCTION
Searches for sources of primary cosmic rays areamong the most difficult problems in studying thestructure of the Universe. Primary cosmic rays ofultrahigh energy (E0 ≥ 1017 eV) are investigated byexploring extensive air showers. In recent years, thereappeared reports [1–4] suggesting that quasars char-acterized by redshifts of the spectral lines of theirradiation in the region z ≤ 0.3 may be sources ofultrahigh-energy cosmic rays.
Quasars are the most puzzling objects in theUniverse and the most powerful sources of radiationthere. For the overwhelming majority of quasars,the redshifts exceed 0.1, but, for some of them,the redshifts are as large as about 4 to 5 [5]! Thissuggests that they occur at cosmological distancesexceeding many hundred megaparsecs. It is assumedthat quasars characterized by the largest redshifts arethe most remote from us and belong to the group ofthe very first galaxies formed upon the beginning ofthe Big Bang in the expanding Universe [6].
A periodicity in the argument log(1 + z) was dis-covered in the distribution of quasars [7]; later on,this periodicity was repeatedly confirmed and refined(see, for example, [8, 9]). In the spectra of quasars,Ryabinkov et al. [9] observed cosmological variationsof the spacetime distribution of 847 absorptive sys-tems. These variations manifest themselves as a suc-cessive appearance of maxima and minima of func-tions in the arguments ln(1 + z) and (1 + z)−1/2. Itis believed that this structure is due to the alternationof distinguished and depressive eras in the course of acosmological evolution that are separated by a char-acteristic time interval in the range 520 ± 160 million
*e-mail: [email protected]
1063-7788/05/6802-0237$26.00
years, its specific duration being dependent on thechoice of cosmological model.
Presented below are experimental results obtainedfrom an analysis of correlations between the arrivaldirections of cosmic rays having energies in the regionE0 ≥ 5 × 10¹⁷ eV and the disposition of quasarscharacterized by redshifts not exceeding z = 2.5.These results reveal some new features of ultrahigh-energy primary cosmic rays and provide the possi-bility for studying, along these lines, the large-scalestructure of the Universe.
2. METHOD OF ANALYSIS
In the present study, we consider extensive airshowers characterized by zenith angles in range θ ≤60 and recorded by the Yakutsk array over the periodbetween 1974 and 2002. Our analysis covers showerswhose arrival directions were found on the basis ofdata from four or more stations and whose axes fellwithin the central circle of the array with a radius of1700 m. The primary-particle energy E0 was deter-mined from the relations
E0 = (4.8 ± 1.6) (1)
× 1017(ρs,600(0))1.0±0.02 [eV],
ρs,600(0) = ρs,600(θ)exp((sec θ − 1) (2)
× 1020/λρ) [m−2],
λρ = (450 ± 44) + (32 ± 15) (3)
× log(ρs,600(0)) [g/cm2],
where ρs,600(θ) is the charged-particle density mea-sured by ground-based scintillation detectors at adistance of R = 600 m from the shower axis.
c© 2005 Pleiades Publishing, Inc.
238 GLUSHKOV
90
60
30
0
–30
–60
–90
–60
–30
360
30
60
60 120 180 240 300
SG
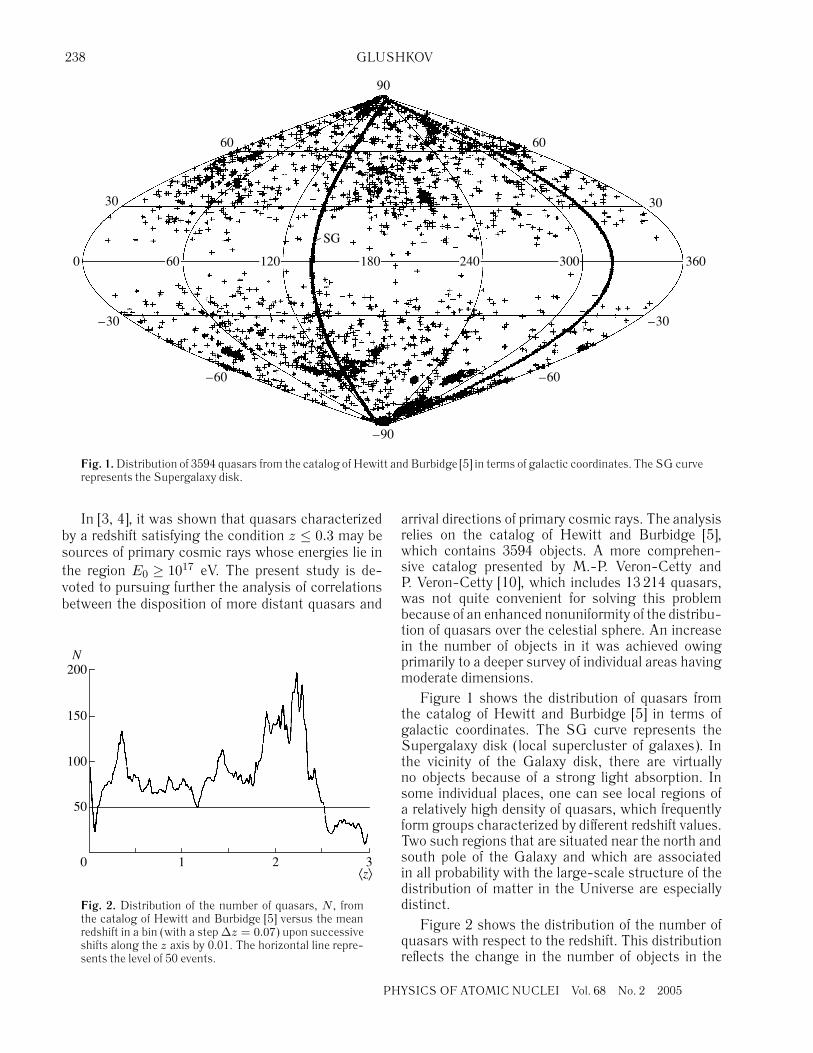
Fig. 1.Distribution of 3594 quasars from the catalog of Hewitt and Burbidge [5] in terms of galactic coordinates. The SG curverepresents the Supergalaxy disk.
In [3, 4], it was shown that quasars characterizedby a redshift satisfying the condition z ≤ 0.3 may besources of primary cosmic rays whose energies lie inthe region E0 ≥ 1017 eV. The present study is de-voted to pursuing further the analysis of correlationsbetween the disposition of more distant quasars and
0 1 2 3
50
100
150
200
⟨
z
⟩
N
Fig. 2. Distribution of the number of quasars, N , fromthe catalog of Hewitt and Burbidge [5] versus the meanredshift in a bin (with a step∆z = 0.07) upon successiveshifts along the z axis by 0.01. The horizontal line repre-sents the level of 50 events.
PH
arrival directions of primary cosmic rays. The analysisrelies on the catalog of Hewitt and Burbidge [5],which contains 3594 objects. A more comprehen-sive catalog presented by M.-P. Veron-Cetty andP. Veron-Cetty [10], which includes 13 214 quasars,was not quite convenient for solving this problembecause of an enhanced nonuniformity of the distribu-tion of quasars over the celestial sphere. An increasein the number of objects in it was achieved owingprimarily to a deeper survey of individual areas havingmoderate dimensions.
Figure 1 shows the distribution of quasars fromthe catalog of Hewitt and Burbidge [5] in terms ofgalactic coordinates. The SG curve represents theSupergalaxy disk (local supercluster of galaxes). Inthe vicinity of the Galaxy disk, there are virtuallyno objects because of a strong light absorption. Insome individual places, one can see local regions ofa relatively high density of quasars, which frequentlyform groups characterized by different redshift values.Two such regions that are situated near the north andsouth pole of the Galaxy and which are associatedin all probability with the large-scale structure of thedistribution of matter in the Universe are especiallydistinct.
Figure 2 shows the distribution of the number ofquasars with respect to the redshift. This distributionreflects the change in the number of objects in the
YSICS OF ATOMIC NUCLEI Vol. 68 No. 2 2005
QUASARS AS SOURCES OF ULTRAHIGH-ENERGY COSMIC RAYS 239
90
60
30
0
–30
–60
–90
–60
–30
360
30
60
60 120 180 240 300
α
= 270
δ
= 60
α
= 90
δ
= 30
α
= 0
δ
= –60
δ
= –30
δ
= 0
(
a
)
90
60
30
0
–30
–60
–90
–60
–30
360
30
60
60 120 180 240 300
α
= 270
δ
= 60
α
= 90
δ
= 30
α
= 0
δ
= –60
δ
= 0
(
b
)
δ
= –30
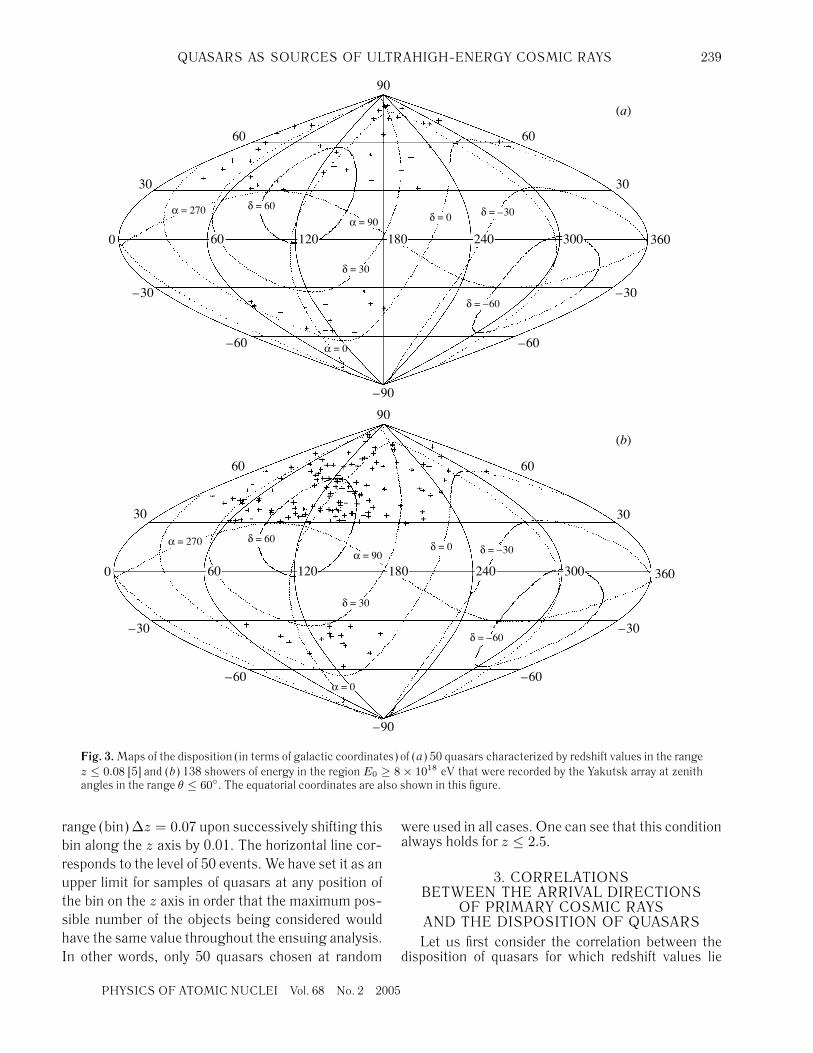
Fig. 3.Maps of the disposition (in terms of galactic coordinates) of (a) 50 quasars characterized by redshift values in the rangez ≤ 0.08 [5] and (b) 138 showers of energy in the region E0 ≥ 8 × 10¹⁸ eV that were recorded by the Yakutsk array at zenithangles in the range θ ≤ 60. The equatorial coordinates are also shown in this figure.
range (bin)∆z = 0.07 upon successively shifting thisbin along the z axis by 0.01. The horizontal line cor-responds to the level of 50 events. We have set it as anupper limit for samples of quasars at any position ofthe bin on the z axis in order that the maximum pos-sible number of the objects being considered wouldhave the same value throughout the ensuing analysis.In other words, only 50 quasars chosen at random
PHYSICS OF ATOMIC NUCLEI Vol. 68 No. 2 20
were used in all cases. One can see that this conditionalways holds for z ≤ 2.5.
3. CORRELATIONSBETWEEN THE ARRIVAL DIRECTIONS
OF PRIMARY COSMIC RAYSAND THE DISPOSITION OF QUASARSLet us first consider the correlation between the
disposition of quasars for which redshift values lie
05
240 GLUSHKOV
0 5 10 15 20
–2
0
2
4
d
min
, deg
k
σ
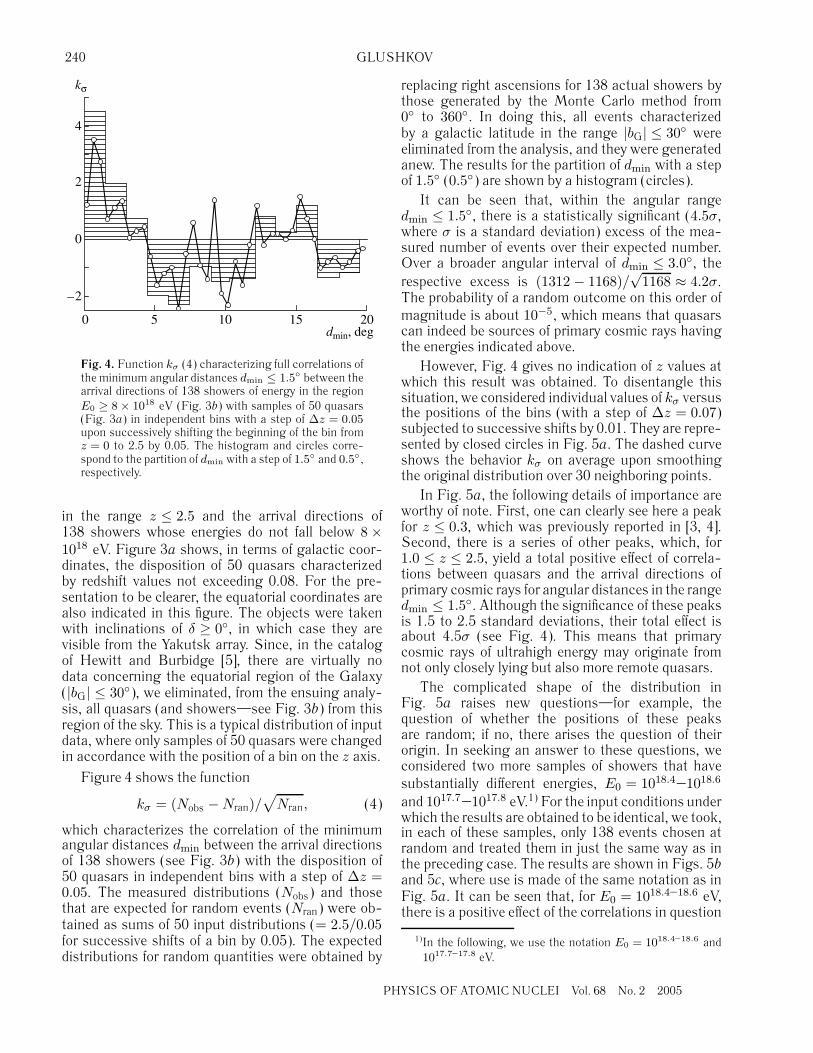
Fig. 4. Function kσ (4) characterizing full correlations ofthe minimum angular distances dmin ≤ 1.5 between thearrival directions of 138 showers of energy in the regionE0 ≥ 8 × 10¹⁸ eV (Fig. 3b) with samples of 50 quasars(Fig. 3a) in independent bins with a step of ∆z = 0.05upon successively shifting the beginning of the bin fromz = 0 to 2.5 by 0.05. The histogram and circles corre-spond to the partition of dmin with a step of 1.5 and 0.5,respectively.
in the range z ≤ 2.5 and the arrival directions of138 showers whose energies do not fall below 8 ×10¹⁸ eV. Figure 3a shows, in terms of galactic coor-dinates, the disposition of 50 quasars characterizedby redshift values not exceeding 0.08. For the pre-sentation to be clearer, the equatorial coordinates arealso indicated in this figure. The objects were takenwith inclinations of δ ≥ 0, in which case they arevisible from the Yakutsk array. Since, in the catalogof Hewitt and Burbidge [5], there are virtually nodata concerning the equatorial region of the Galaxy(|bG| ≤ 30), we eliminated, from the ensuing analy-sis, all quasars (and showers—see Fig. 3b) from thisregion of the sky. This is a typical distribution of inputdata, where only samples of 50 quasars were changedin accordance with the position of a bin on the z axis.
Figure 4 shows the function
kσ = (Nobs −Nran)/√Nran, (4)
which characterizes the correlation of the minimumangular distances dmin between the arrival directionsof 138 showers (see Fig. 3b) with the disposition of50 quasars in independent bins with a step of ∆z =0.05. The measured distributions (Nobs) and thosethat are expected for random events (Nran) were ob-tained as sums of 50 input distributions (= 2.5/0.05for successive shifts of a bin by 0.05). The expecteddistributions for random quantities were obtained by
P
replacing right ascensions for 138 actual showers bythose generated by the Monte Carlo method from0 to 360. In doing this, all events characterizedby a galactic latitude in the range |bG| ≤ 30 wereeliminated from the analysis, and they were generatedanew. The results for the partition of dmin with a stepof 1.5 (0.5) are shown by a histogram (circles).
It can be seen that, within the angular rangedmin ≤ 1.5, there is a statistically significant (4.5σ,where σ is a standard deviation) excess of the mea-sured number of events over their expected number.Over a broader angular interval of dmin ≤ 3.0, therespective excess is (1312 − 1168)/
√1168 ≈ 4.2σ.
The probability of a random outcome on this order ofmagnitude is about 10−5, which means that quasarscan indeed be sources of primary cosmic rays havingthe energies indicated above.
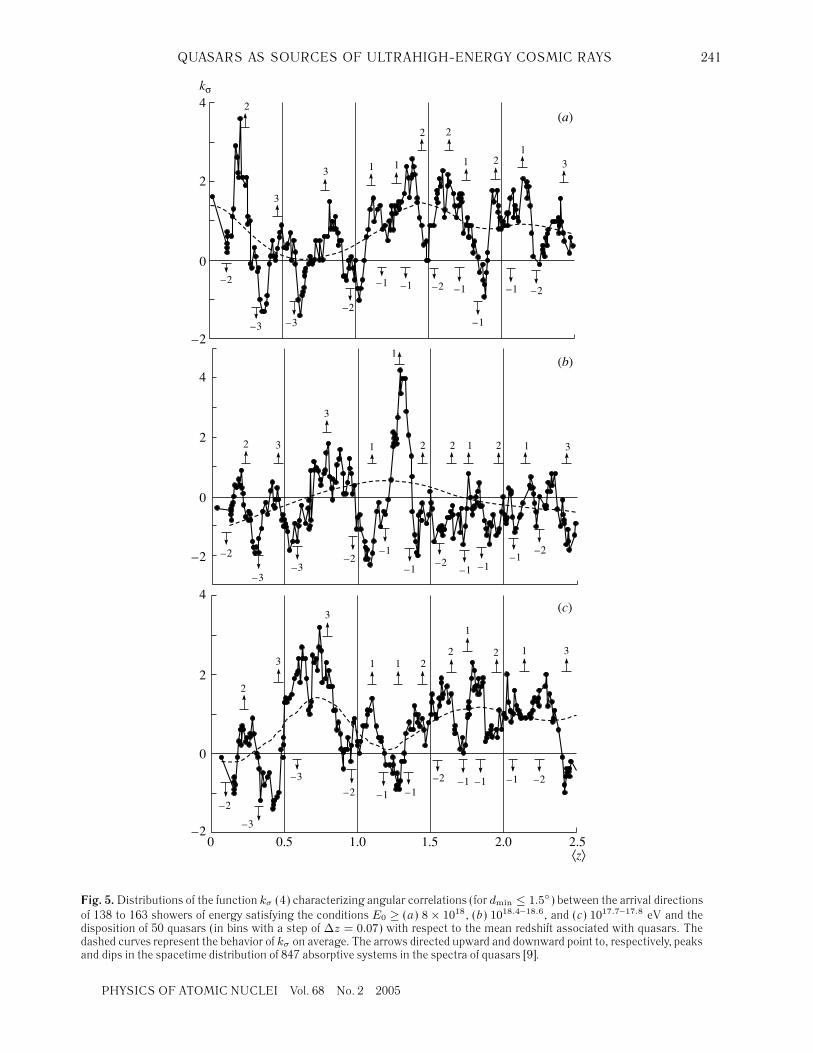
However, Fig. 4 gives no indication of z values atwhich this result was obtained. To disentangle thissituation, we considered individual values of kσ versusthe positions of the bins (with a step of ∆z = 0.07)subjected to successive shifts by 0.01. They are repre-sented by closed circles in Fig. 5a. The dashed curveshows the behavior kσ on average upon smoothingthe original distribution over 30 neighboring points.
In Fig. 5a, the following details of importance areworthy of note. First, one can clearly see here a peakfor z ≤ 0.3, which was previously reported in [3, 4].Second, there is a series of other peaks, which, for1.0 ≤ z ≤ 2.5, yield a total positive effect of correla-tions between quasars and the arrival directions ofprimary cosmic rays for angular distances in the rangedmin ≤ 1.5. Although the significance of these peaksis 1.5 to 2.5 standard deviations, their total effect isabout 4.5σ (see Fig. 4). This means that primarycosmic rays of ultrahigh energy may originate fromnot only closely lying but also more remote quasars.
The complicated shape of the distribution inFig. 5a raises new questions—for example, thequestion of whether the positions of these peaksare random; if no, there arises the question of theirorigin. In seeking an answer to these questions, weconsidered two more samples of showers that havesubstantially different energies, E0 = 1018.4–1018.6
and 1017.7–1017.8 eV.1) For the input conditions underwhich the results are obtained to be identical, we took,in each of these samples, only 138 events chosen atrandom and treated them in just the same way as inthe preceding case. The results are shown in Figs. 5band 5c, where use is made of the same notation as inFig. 5a. It can be seen that, for E0 = 1018.4–18.6 eV,there is a positive effect of the correlations in question
1)In the following, we use the notation E0 = 1018.4–18.6 and1017.7–17.8 eV.
HYSICS OF ATOMIC NUCLEI Vol. 68 No. 2 2005
QUASARS AS SOURCES OF ULTRAHIGH-ENERGY COSMIC RAYS 241
0 0.5 1.0 1.5 2.0 2.5
⟨
z
⟩
(
c
)
0
–2
2
4
–2
–3
–3
–2 –1 –1–1 –1–2 –2–1
2
3
3
211
1
2 2 1 3
(
b
)
0
–2
2
4
–2
–3–3
–2–1
–1 –1 –1–2–2
–1
2 3
3
2
1
1 12 2 1 3
1
(
a
)
0
–2
2
4
–2
–3 –3
–2
–1 –1 –1
–1
–2 –2–1
2
3
3
2
1
1
1
2
21
31
k
σ
Fig. 5.Distributions of the function kσ (4) characterizing angular correlations (for dmin ≤ 1.5) between the arrival directionsof 138 to 163 showers of energy satisfying the conditions E0 ≥ (a) 8 × 10¹⁸, (b) 1018.4–18.6, and (c) 1017.7–17.8 eV and thedisposition of 50 quasars (in bins with a step of ∆z = 0.07) with respect to the mean redshift associated with quasars. Thedashed curves represent the behavior of kσ on average. The arrows directed upward and downward point to, respectively, peaksand dips in the spacetime distribution of 847 absorptive systems in the spectra of quasars [9].
PHYSICS OF ATOMIC NUCLEI Vol. 68 No. 2 2005
242 GLUSHKOV
0 0.5 1.0 1.5 2.0 2.5
16
17
18
19
1
2
3
–1
–2
–3
11
12
22
33
–1
–1–1
–1–2
–2
–2
–3
⟨
z
⟩
⟨
M ⟩
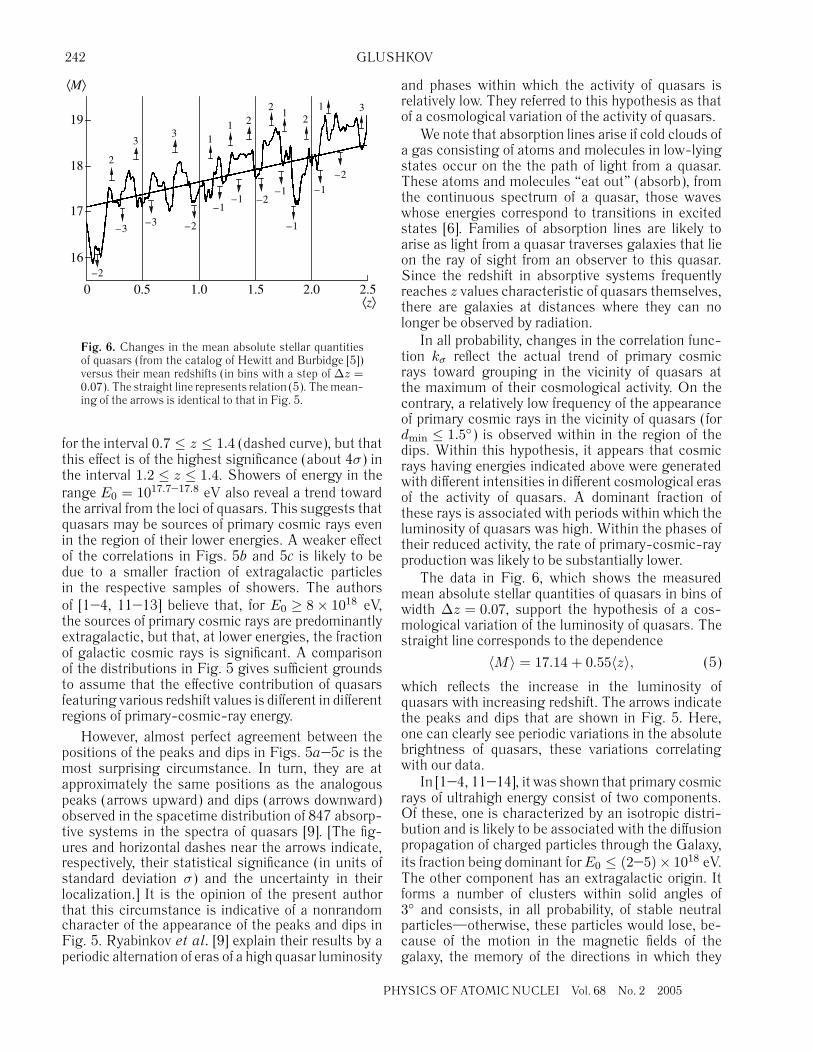
Fig. 6. Changes in the mean absolute stellar quantitiesof quasars (from the catalog of Hewitt and Burbidge [5])versus their mean redshifts (in bins with a step of ∆z =0.07). The straight line represents relation (5). Themean-ing of the arrows is identical to that in Fig. 5.
for the interval 0.7 ≤ z ≤ 1.4 (dashed curve), but thatthis effect is of the highest significance (about 4σ) inthe interval 1.2 ≤ z ≤ 1.4. Showers of energy in therange E0 = 1017.7–17.8 eV also reveal a trend towardthe arrival from the loci of quasars. This suggests thatquasars may be sources of primary cosmic rays evenin the region of their lower energies. A weaker effectof the correlations in Figs. 5b and 5c is likely to bedue to a smaller fraction of extragalactic particlesin the respective samples of showers. The authorsof [1–4, 11–13] believe that, for E0 ≥ 8 × 10¹⁸ eV,the sources of primary cosmic rays are predominantlyextragalactic, but that, at lower energies, the fractionof galactic cosmic rays is significant. A comparisonof the distributions in Fig. 5 gives sufficient groundsto assume that the effective contribution of quasarsfeaturing various redshift values is different in differentregions of primary-cosmic-ray energy.
However, almost perfect agreement between thepositions of the peaks and dips in Figs. 5a–5c is themost surprising circumstance. In turn, they are atapproximately the same positions as the analogouspeaks (arrows upward) and dips (arrows downward)observed in the spacetime distribution of 847 absorp-tive systems in the spectra of quasars [9]. [The fig-ures and horizontal dashes near the arrows indicate,respectively, their statistical significance (in units ofstandard deviation σ) and the uncertainty in theirlocalization.] It is the opinion of the present authorthat this circumstance is indicative of a nonrandomcharacter of the appearance of the peaks and dips inFig. 5. Ryabinkov et al. [9] explain their results by aperiodic alternation of eras of a high quasar luminosity
P
and phases within which the activity of quasars isrelatively low. They referred to this hypothesis as thatof a cosmological variation of the activity of quasars.
We note that absorption lines arise if cold clouds ofa gas consisting of atoms and molecules in low-lyingstates occur on the the path of light from a quasar.These atoms and molecules “eat out” (absorb), fromthe continuous spectrum of a quasar, those waveswhose energies correspond to transitions in excitedstates [6]. Families of absorption lines are likely toarise as light from a quasar traverses galaxies that lieon the ray of sight from an observer to this quasar.Since the redshift in absorptive systems frequentlyreaches z values characteristic of quasars themselves,there are galaxies at distances where they can nolonger be observed by radiation.
In all probability, changes in the correlation func-tion kσ reflect the actual trend of primary cosmicrays toward grouping in the vicinity of quasars atthe maximum of their cosmological activity. On thecontrary, a relatively low frequency of the appearanceof primary cosmic rays in the vicinity of quasars (fordmin ≤ 1.5) is observed within in the region of thedips. Within this hypothesis, it appears that cosmicrays having energies indicated above were generatedwith different intensities in different cosmological erasof the activity of quasars. A dominant fraction ofthese rays is associated with periods within which theluminosity of quasars was high. Within the phases oftheir reduced activity, the rate of primary-cosmic-rayproduction was likely to be substantially lower.
The data in Fig. 6, which shows the measuredmean absolute stellar quantities of quasars in bins ofwidth ∆z = 0.07, support the hypothesis of a cos-mological variation of the luminosity of quasars. Thestraight line corresponds to the dependence
〈M〉 = 17.14 + 0.55〈z〉, (5)
which reflects the increase in the luminosity ofquasars with increasing redshift. The arrows indicatethe peaks and dips that are shown in Fig. 5. Here,one can clearly see periodic variations in the absolutebrightness of quasars, these variations correlatingwith our data.
In [1–4, 11–14], it was shown that primary cosmicrays of ultrahigh energy consist of two components.Of these, one is characterized by an isotropic distri-bution and is likely to be associated with the diffusionpropagation of charged particles through the Galaxy,its fraction being dominant forE0 ≤ (2–5)× 1018 eV.The other component has an extragalactic origin. Itforms a number of clusters within solid angles of3 and consists, in all probability, of stable neutralparticles—otherwise, these particles would lose, be-cause of the motion in the magnetic fields of thegalaxy, the memory of the directions in which they
HYSICS OF ATOMIC NUCLEI Vol. 68 No. 2 2005
QUASARS AS SOURCES OF ULTRAHIGH-ENERGY COSMIC RAYS 243
are emitted by the sources and could not disclose theaforementioned structure of the distribution of matterin the Universe.
Let us revisit showers of energy in the range E0 =1017.7–17.8 eV. The isotropic and the cluster compo-nent contribute about, respectively, 75 and 25% totheir flux [13, 14].We consider the correlations of eachof these components with quasars. We found clustersin the following way. We partitioned all showers intoseven samples, each featuring about 1000 events. Theonly difference between these samples was that theaxes of showers belonging to different samples werewithin different annular areas of the central circle ofthe array. Each of the seven samples was analyzedfor the presence of local groups of showers on thecelestial sphere. To do this, all neighbors within theangular distance of d ≤ 3 were found around thearrival direction of any shower. If there were threeor more showers within this circle, their coordinateswere averaged and were used in the following as newpoints (below they are referred to as nodes). Thenodes were additionally analyzed for the presence ofnot less than two intersections within each of theseven samples (the condition of intersection was thattheir centers were within the angular distance of d ≤3). If there were such nodes, then the arrival directionof all showers belonging to them were averaged anew,and the resulting larger node (cluster) was used for afurther analysis.
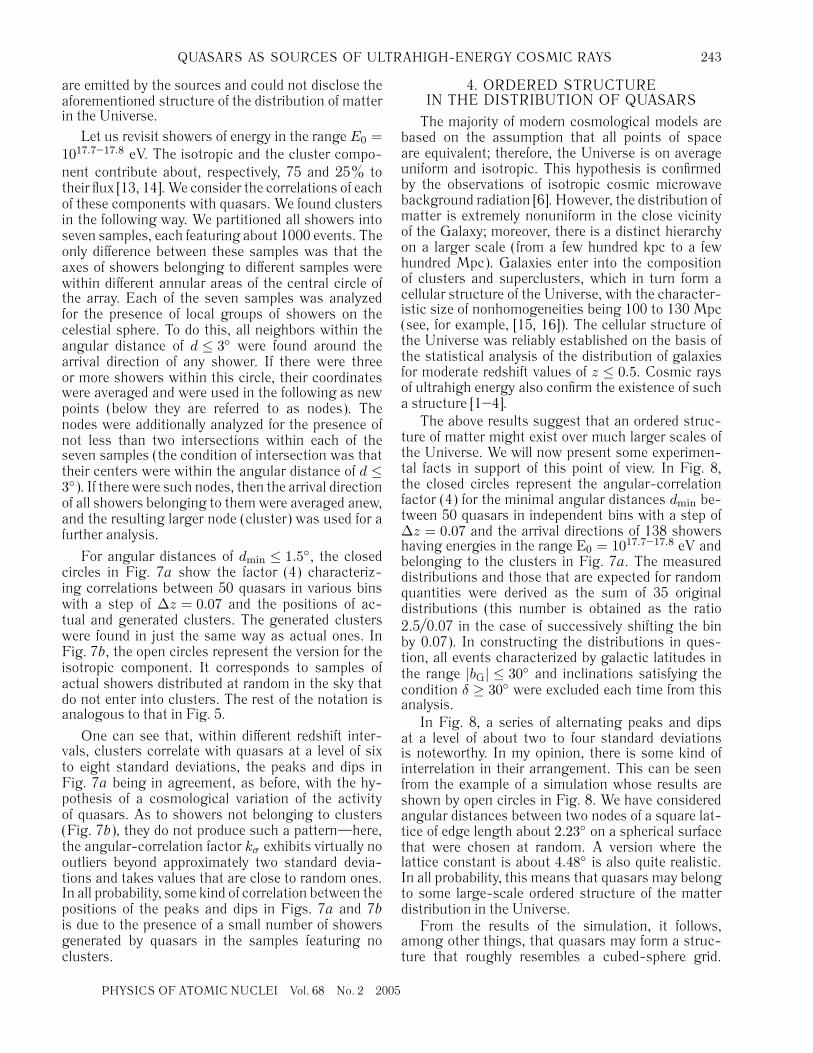
For angular distances of dmin ≤ 1.5, the closedcircles in Fig. 7a show the factor (4) characteriz-ing correlations between 50 quasars in various binswith a step of ∆z = 0.07 and the positions of ac-tual and generated clusters. The generated clusterswere found in just the same way as actual ones. InFig. 7b, the open circles represent the version for theisotropic component. It corresponds to samples ofactual showers distributed at random in the sky thatdo not enter into clusters. The rest of the notation isanalogous to that in Fig. 5.
One can see that, within different redshift inter-vals, clusters correlate with quasars at a level of sixto eight standard deviations, the peaks and dips inFig. 7a being in agreement, as before, with the hy-pothesis of a cosmological variation of the activityof quasars. As to showers not belonging to clusters(Fig. 7b), they do not produce such a pattern—here,the angular-correlation factor kσ exhibits virtually nooutliers beyond approximately two standard devia-tions and takes values that are close to random ones.In all probability, some kind of correlation between thepositions of the peaks and dips in Figs. 7a and 7bis due to the presence of a small number of showersgenerated by quasars in the samples featuring noclusters.
PHYSICS OF ATOMIC NUCLEI Vol. 68 No. 2 200
4. ORDERED STRUCTUREIN THE DISTRIBUTION OF QUASARS
The majority of modern cosmological models arebased on the assumption that all points of spaceare equivalent; therefore, the Universe is on averageuniform and isotropic. This hypothesis is confirmedby the observations of isotropic cosmic microwavebackground radiation [6]. However, the distribution ofmatter is extremely nonuniform in the close vicinityof the Galaxy; moreover, there is a distinct hierarchyon a larger scale (from a few hundred kpc to a fewhundred Mpc). Galaxies enter into the compositionof clusters and superclusters, which in turn form acellular structure of the Universe, with the character-istic size of nonhomogeneities being 100 to 130 Mpc(see, for example, [15, 16]). The cellular structure ofthe Universe was reliably established on the basis ofthe statistical analysis of the distribution of galaxiesfor moderate redshift values of z ≤ 0.5. Cosmic raysof ultrahigh energy also confirm the existence of sucha structure [1–4].
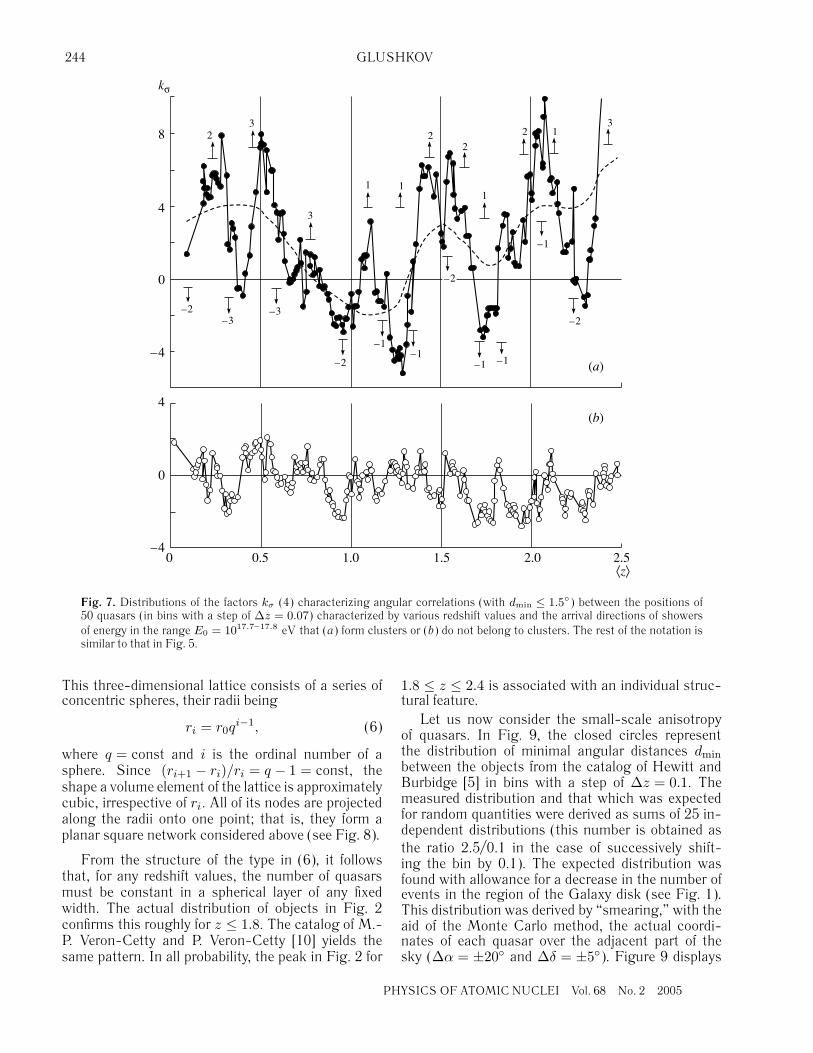
The above results suggest that an ordered struc-ture of matter might exist over much larger scales ofthe Universe. We will now present some experimen-tal facts in support of this point of view. In Fig. 8,the closed circles represent the angular-correlationfactor (4) for the minimal angular distances dmin be-tween 50 quasars in independent bins with a step of∆z = 0.07 and the arrival directions of 138 showershaving energies in the range Е0 = 1017.7–17.8 eV andbelonging to the clusters in Fig. 7a. The measureddistributions and those that are expected for randomquantities were derived as the sum of 35 originaldistributions (this number is obtained as the ratio2.5/0.07 in the case of successively shifting the binby 0.07). In constructing the distributions in ques-tion, all events characterized by galactic latitudes inthe range |bG| ≤ 30 and inclinations satisfying thecondition δ ≥ 30 were excluded each time from thisanalysis.
In Fig. 8, a series of alternating peaks and dipsat a level of about two to four standard deviationsis noteworthy. In my opinion, there is some kind ofinterrelation in their arrangement. This can be seenfrom the example of a simulation whose results areshown by open circles in Fig. 8. We have consideredangular distances between two nodes of a square lat-tice of edge length about 2.23 on a spherical surfacethat were chosen at random. A version where thelattice constant is about 4.48 is also quite realistic.In all probability, this means that quasars may belongto some large-scale ordered structure of the matterdistribution in the Universe.
From the results of the simulation, it follows,among other things, that quasars may form a struc-ture that roughly resembles a cubed-sphere grid.
5
244 GLUSHKOV
0 0.5 1.0 1.5 2.0 2.5
⟨
z
⟩
–4
0
4(
b
)
–4
0
4
(
a
)
8
k
σ
23
–2–3
–3
–2
–1–1
–1 –1
–2
–1
–2
3
11
22
2 13
1
Fig. 7. Distributions of the factors kσ (4) characterizing angular correlations (with dmin ≤ 1.5) between the positions of50 quasars (in bins with a step of ∆z = 0.07) characterized by various redshift values and the arrival directions of showersof energy in the range E0 = 1017.7–17.8 eV that (a) form clusters or (b) do not belong to clusters. The rest of the notation issimilar to that in Fig. 5.
This three-dimensional lattice consists of a series ofconcentric spheres, their radii being
ri = r0qi−1, (6)
where q = const and i is the ordinal number of asphere. Since (ri+1 − ri)/ri = q − 1 = const, theshape a volume element of the lattice is approximatelycubic, irrespective of ri. All of its nodes are projectedalong the radii onto one point; that is, they form aplanar square network considered above (see Fig. 8).
From the structure of the type in (6), it followsthat, for any redshift values, the number of quasarsmust be constant in a spherical layer of any fixedwidth. The actual distribution of objects in Fig. 2confirms this roughly for z ≤ 1.8. The catalog of M.-P. Veron-Cetty and P. Veron-Cetty [10] yields thesame pattern. In all probability, the peak in Fig. 2 for
P
1.8 ≤ z ≤ 2.4 is associated with an individual struc-tural feature.
Let us now consider the small-scale anisotropyof quasars. In Fig. 9, the closed circles representthe distribution of minimal angular distances dmin
between the objects from the catalog of Hewitt andBurbidge [5] in bins with a step of ∆z = 0.1. Themeasured distribution and that which was expectedfor random quantities were derived as sums of 25 in-dependent distributions (this number is obtained asthe ratio 2.5/0.1 in the case of successively shift-ing the bin by 0.1). The expected distribution wasfound with allowance for a decrease in the number ofevents in the region of the Galaxy disk (see Fig. 1).This distribution was derived by “smearing,” with theaid of the Monte Carlo method, the actual coordi-nates of each quasar over the adjacent part of thesky (∆α = ±20 and ∆δ = ±5). Figure 9 displays
HYSICS OF ATOMIC NUCLEI Vol. 68 No. 2 2005
QUASARS AS SOURCES OF ULTRAHIGH-ENERGY COSMIC RAYS 245
0 5 10 15
0
–5
5
10
d
min
, deg
k
σ
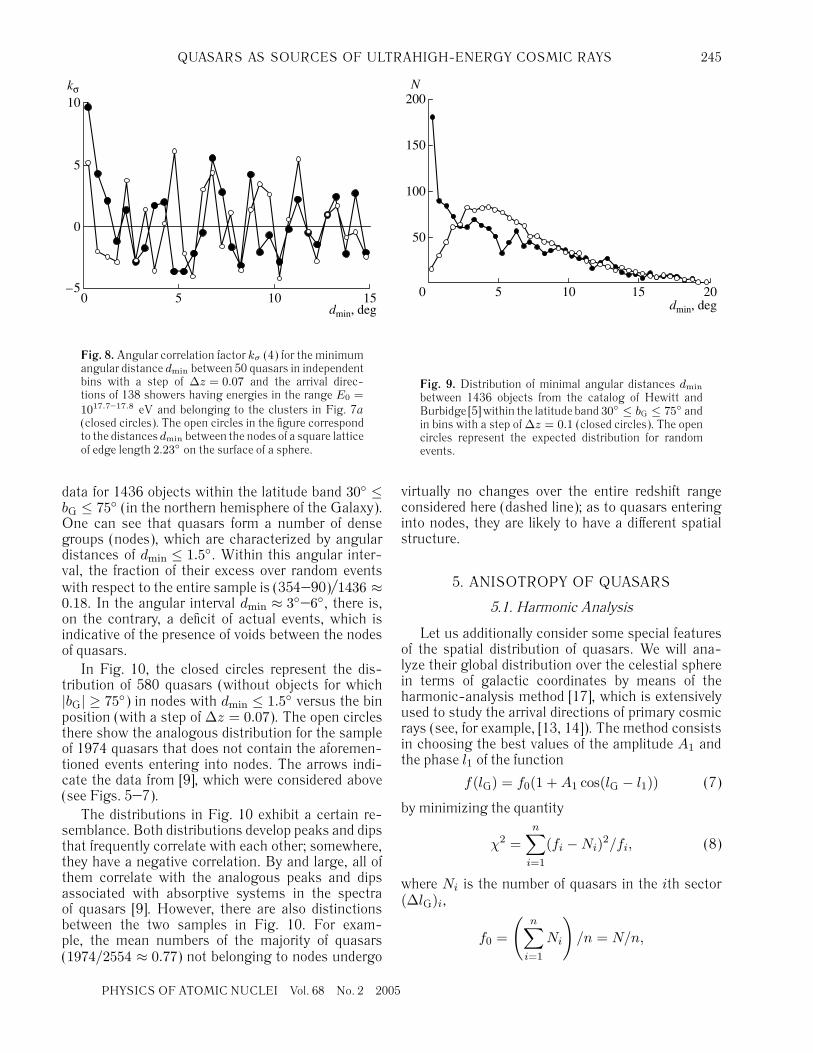
Fig. 8. Angular correlation factor kσ (4) for the minimumangular distance dmin between 50 quasars in independentbins with a step of ∆z = 0.07 and the arrival direc-tions of 138 showers having energies in the range E0 =1017.7–17.8 eV and belonging to the clusters in Fig. 7a(closed circles). The open circles in the figure correspondto the distances dmin between the nodes of a square latticeof edge length 2.23 on the surface of a sphere.
data for 1436 objects within the latitude band 30 ≤bG ≤ 75 (in the northern hemisphere of the Galaxy).One can see that quasars form a number of densegroups (nodes), which are characterized by angulardistances of dmin ≤ 1.5. Within this angular inter-val, the fraction of their excess over random eventswith respect to the entire sample is (354–90)/1436 ≈0.18. In the angular interval dmin ≈ 3–6, there is,on the contrary, a deficit of actual events, which isindicative of the presence of voids between the nodesof quasars.
In Fig. 10, the closed circles represent the dis-tribution of 580 quasars (without objects for which|bG| ≥ 75) in nodes with dmin ≤ 1.5 versus the binposition (with a step of ∆z = 0.07). The open circlesthere show the analogous distribution for the sampleof 1974 quasars that does not contain the aforemen-tioned events entering into nodes. The arrows indi-cate the data from [9], which were considered above(see Figs. 5–7).
The distributions in Fig. 10 exhibit a certain re-semblance. Both distributions develop peaks and dipsthat frequently correlate with each other; somewhere,they have a negative correlation. By and large, all ofthem correlate with the analogous peaks and dipsassociated with absorptive systems in the spectraof quasars [9]. However, there are also distinctionsbetween the two samples in Fig. 10. For exam-ple, the mean numbers of the majority of quasars(1974/2554 ≈ 0.77) not belonging to nodes undergo
PHYSICS OF ATOMIC NUCLEI Vol. 68 No. 2 200
0 5 10 15 20
50
100
150
200
d
min
, deg
N
Fig. 9. Distribution of minimal angular distances dmin
between 1436 objects from the catalog of Hewitt andBurbidge [5] within the latitude band 30 ≤ bG ≤ 75 andin bins with a step of∆z = 0.1 (closed circles). The opencircles represent the expected distribution for randomevents.
virtually no changes over the entire redshift rangeconsidered here (dashed line); as to quasars enteringinto nodes, they are likely to have a different spatialstructure.
5. ANISOTROPY OF QUASARS
5.1. Harmonic Analysis
Let us additionally consider some special featuresof the spatial distribution of quasars. We will ana-lyze their global distribution over the celestial spherein terms of galactic coordinates by means of theharmonic-analysis method [17], which is extensivelyused to study the arrival directions of primary cosmicrays (see, for example, [13, 14]). The method consistsin choosing the best values of the amplitude A1 andthe phase l1 of the function
f(lG) = f0(1 +A1 cos(lG − l1)) (7)
by minimizing the quantity
χ2 =n∑
i=1
(fi −Ni)2/fi, (8)
where Ni is the number of quasars in the ith sector(∆lG)i,
f0 =
(n∑
i=1
Ni
)/n = N/n,
5
246 GLUSHKOV
0 0.5 1.0 1.5 2.0 2.5
⟨
z
⟩
20
40
80
–2
–3 –3–2
–1
–1
–1
–1
–2 –2
–1
2
3
3
2
111
2 2
1
3
60
100
N
2
1
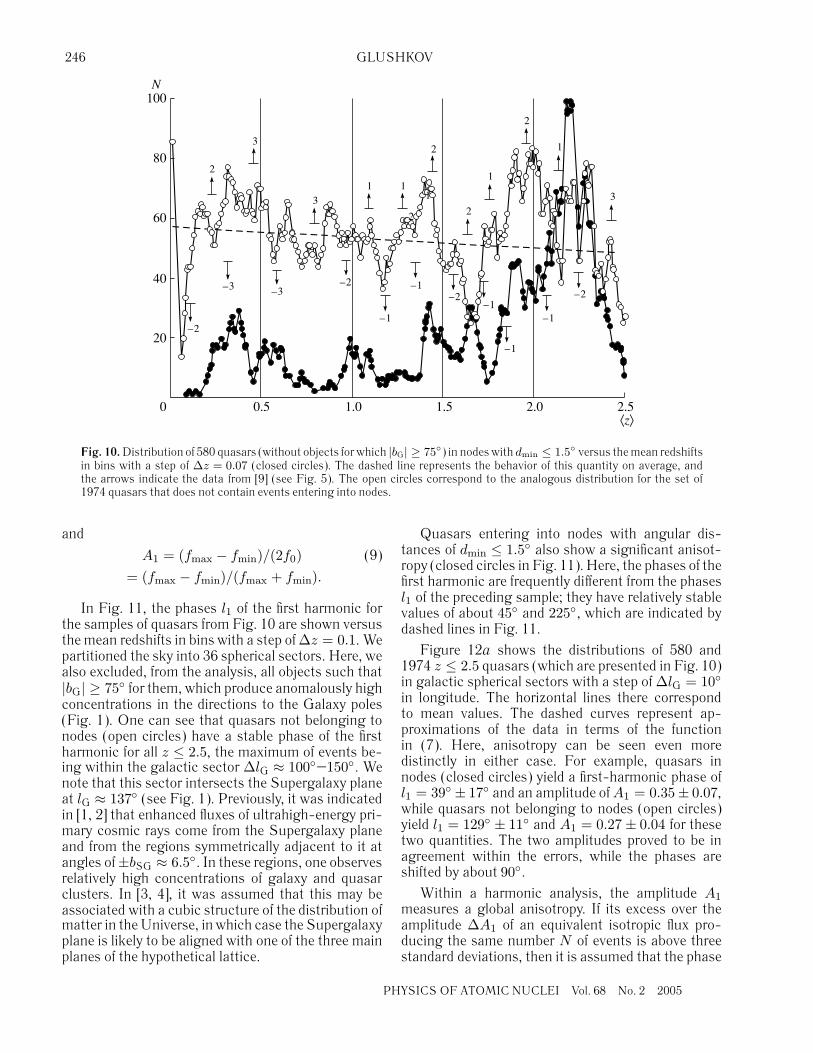
Fig. 10.Distribution of 580 quasars (without objects for which |bG| ≥ 75) in nodeswith dmin ≤ 1.5 versus themean redshiftsin bins with a step of ∆z = 0.07 (closed circles). The dashed line represents the behavior of this quantity on average, andthe arrows indicate the data from [9] (see Fig. 5). The open circles correspond to the analogous distribution for the set of1974 quasars that does not contain events entering into nodes.
and
A1 = (fmax − fmin)/(2f0) (9)
= (fmax − fmin)/(fmax + fmin).
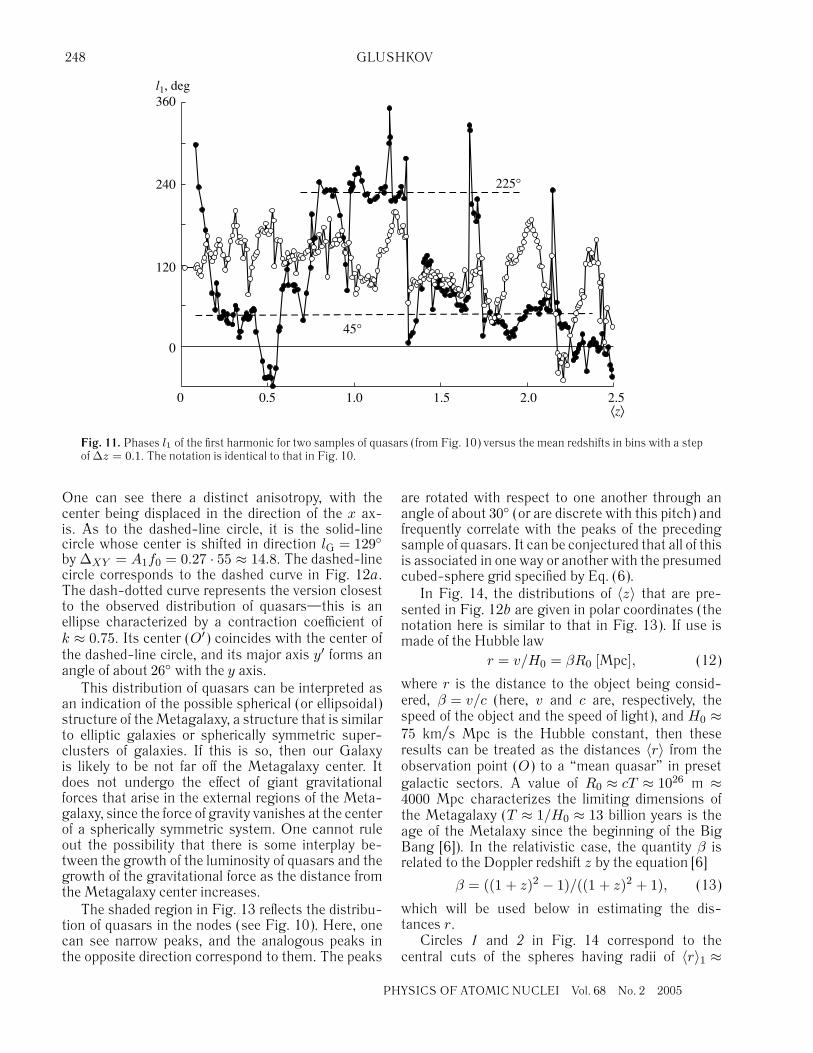
In Fig. 11, the phases l1 of the first harmonic forthe samples of quasars from Fig. 10 are shown versusthe mean redshifts in bins with a step of∆z = 0.1. Wepartitioned the sky into 36 spherical sectors. Here, wealso excluded, from the analysis, all objects such that|bG| ≥ 75 for them, which produce anomalously highconcentrations in the directions to the Galaxy poles(Fig. 1). One can see that quasars not belonging tonodes (open circles) have a stable phase of the firstharmonic for all z ≤ 2.5, the maximum of events be-ing within the galactic sector ∆lG ≈ 100–150. Wenote that this sector intersects the Supergalaxy planeat lG ≈ 137 (see Fig. 1). Previously, it was indicatedin [1, 2] that enhanced fluxes of ultrahigh-energy pri-mary cosmic rays come from the Supergalaxy planeand from the regions symmetrically adjacent to it atangles of±bSG ≈ 6.5. In these regions, one observesrelatively high concentrations of galaxy and quasarclusters. In [3, 4], it was assumed that this may beassociated with a cubic structure of the distribution ofmatter in theUniverse, in which case the Supergalaxyplane is likely to be aligned with one of the three mainplanes of the hypothetical lattice.
PH
Quasars entering into nodes with angular dis-tances of dmin ≤ 1.5 also show a significant anisot-ropy (closed circles in Fig. 11). Here, the phases of thefirst harmonic are frequently different from the phasesl1 of the preceding sample; they have relatively stablevalues of about 45 and 225, which are indicated bydashed lines in Fig. 11.
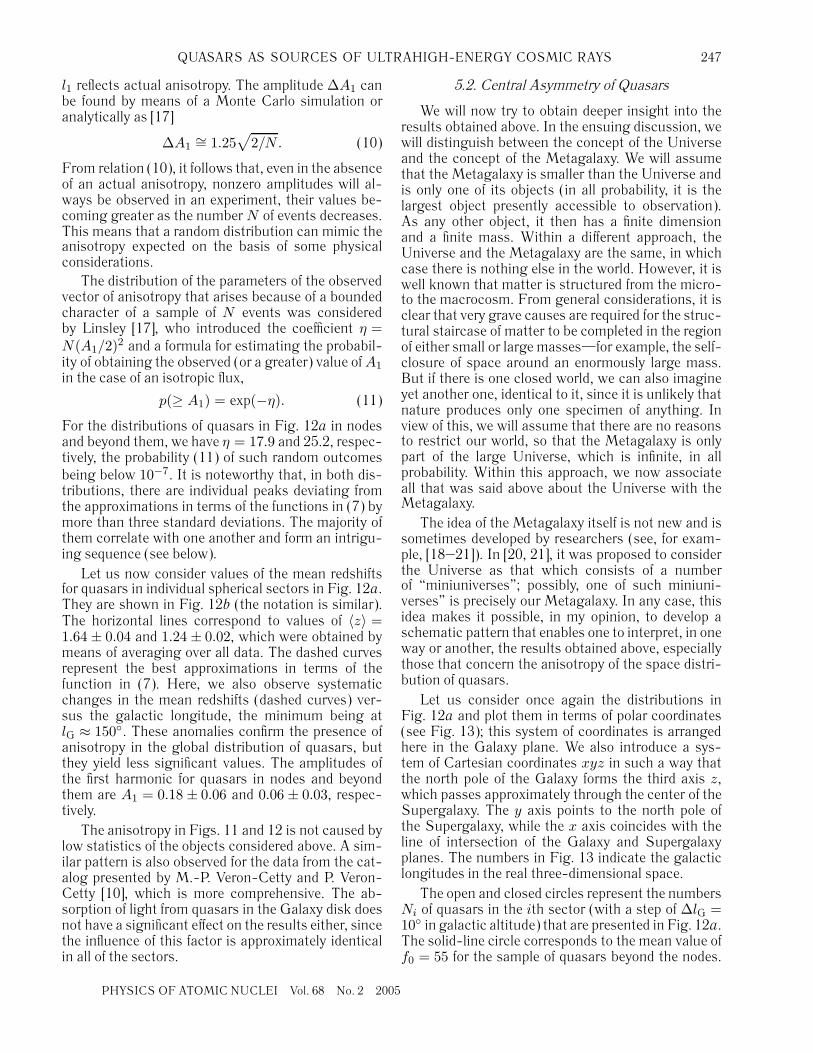
Figure 12a shows the distributions of 580 and1974 z ≤ 2.5 quasars (which are presented in Fig. 10)in galactic spherical sectors with a step of∆lG = 10in longitude. The horizontal lines there correspondto mean values. The dashed curves represent ap-proximations of the data in terms of the functionin (7). Here, anisotropy can be seen even moredistinctly in either case. For example, quasars innodes (closed circles) yield a first-harmonic phase ofl1 = 39 ± 17 and an amplitude ofA1 = 0.35± 0.07,while quasars not belonging to nodes (open circles)yield l1 = 129 ± 11 and A1 = 0.27 ± 0.04 for thesetwo quantities. The two amplitudes proved to be inagreement within the errors, while the phases areshifted by about 90.
Within a harmonic analysis, the amplitude A1
measures a global anisotropy. If its excess over theamplitude ∆A1 of an equivalent isotropic flux pro-ducing the same number N of events is above threestandard deviations, then it is assumed that the phase
YSICS OF ATOMIC NUCLEI Vol. 68 No. 2 2005
QUASARS AS SOURCES OF ULTRAHIGH-ENERGY COSMIC RAYS 247
l1 reflects actual anisotropy. The amplitude ∆A1 canbe found by means of a Monte Carlo simulation oranalytically as [17]
∆A1∼= 1.25
√2/N. (10)
From relation (10), it follows that, even in the absenceof an actual anisotropy, nonzero amplitudes will al-ways be observed in an experiment, their values be-coming greater as the number N of events decreases.This means that a random distribution can mimic theanisotropy expected on the basis of some physicalconsiderations.
The distribution of the parameters of the observedvector of anisotropy that arises because of a boundedcharacter of a sample of N events was consideredby Linsley [17], who introduced the coefficient η =N(A1/2)2 and a formula for estimating the probabil-ity of obtaining the observed (or a greater) value ofA1
in the case of an isotropic flux,
p(≥ A1) = ехр(−η). (11)
For the distributions of quasars in Fig. 12a in nodesand beyond them, we have η = 17.9 and 25.2, respec-tively, the probability (11) of such random outcomesbeing below 10−7. It is noteworthy that, in both dis-tributions, there are individual peaks deviating fromthe approximations in terms of the functions in (7) bymore than three standard deviations. The majority ofthem correlate with one another and form an intrigu-ing sequence (see below).
Let us now consider values of the mean redshiftsfor quasars in individual spherical sectors in Fig. 12a.They are shown in Fig. 12b (the notation is similar).The horizontal lines correspond to values of 〈z〉 =1.64 ± 0.04 and 1.24 ± 0.02, which were obtained bymeans of averaging over all data. The dashed curvesrepresent the best approximations in terms of thefunction in (7). Here, we also observe systematicchanges in the mean redshifts (dashed curves) ver-sus the galactic longitude, the minimum being atlG ≈ 150. These anomalies confirm the presence ofanisotropy in the global distribution of quasars, butthey yield less significant values. The amplitudes ofthe first harmonic for quasars in nodes and beyondthem are A1 = 0.18 ± 0.06 and 0.06 ± 0.03, respec-tively.
The anisotropy in Figs. 11 and 12 is not caused bylow statistics of the objects considered above. A sim-ilar pattern is also observed for the data from the cat-alog presented by M.-P. Veron-Cetty and P. Veron-Cetty [10], which is more comprehensive. The ab-sorption of light from quasars in the Galaxy disk doesnot have a significant effect on the results either, sincethe influence of this factor is approximately identicalin all of the sectors.
PHYSICS OF ATOMIC NUCLEI Vol. 68 No. 2 200
5.2. Central Asymmetry of Quasars
We will now try to obtain deeper insight into theresults obtained above. In the ensuing discussion, wewill distinguish between the concept of the Universeand the concept of the Metagalaxy. We will assumethat the Metagalaxy is smaller than the Universe andis only one of its objects (in all probability, it is thelargest object presently accessible to observation).As any other object, it then has a finite dimensionand a finite mass. Within a different approach, theUniverse and the Metagalaxy are the same, in whichcase there is nothing else in the world. However, it iswell known that matter is structured from the micro-to the macrocosm. From general considerations, it isclear that very grave causes are required for the struc-tural staircase of matter to be completed in the regionof either small or large masses—for example, the self-closure of space around an enormously large mass.But if there is one closed world, we can also imagineyet another one, identical to it, since it is unlikely thatnature produces only one specimen of anything. Inview of this, we will assume that there are no reasonsto restrict our world, so that the Metagalaxy is onlypart of the large Universe, which is infinite, in allprobability. Within this approach, we now associateall that was said above about the Universe with theMetagalaxy.
The idea of the Metagalaxy itself is not new and issometimes developed by researchers (see, for exam-ple, [18–21]). In [20, 21], it was proposed to considerthe Universe as that which consists of a numberof “miniuniverses”; possibly, one of such miniuni-verses” is precisely our Metagalaxy. In any case, thisidea makes it possible, in my opinion, to develop aschematic pattern that enables one to interpret, in oneway or another, the results obtained above, especiallythose that concern the anisotropy of the space distri-bution of quasars.
Let us consider once again the distributions inFig. 12a and plot them in terms of polar coordinates(see Fig. 13); this system of coordinates is arrangedhere in the Galaxy plane. We also introduce a sys-tem of Cartesian coordinates xyz in such a way thatthe north pole of the Galaxy forms the third axis z,which passes approximately through the center of theSupergalaxy. The y axis points to the north pole ofthe Supergalaxy, while the x axis coincides with theline of intersection of the Galaxy and Supergalaxyplanes. The numbers in Fig. 13 indicate the galacticlongitudes in the real three-dimensional space.
The open and closed circles represent the numbersNi of quasars in the ith sector (with a step of ∆lG =10 in galactic altitude) that are presented in Fig. 12a.The solid-line circle corresponds to the mean value off0 = 55 for the sample of quasars beyond the nodes.
5
248 GLUSHKOV
0 0.5 1.0 1.5 2.0 2.5
⟨
z
⟩
0
120
240
360
l
1
, deg
225°
45°
Fig. 11. Phases l1 of the first harmonic for two samples of quasars (from Fig. 10) versus the mean redshifts in bins with a stepof∆z = 0.1. The notation is identical to that in Fig. 10.
One can see there a distinct anisotropy, with thecenter being displaced in the direction of the x ax-is. As to the dashed-line circle, it is the solid-linecircle whose center is shifted in direction lG = 129by ∆XY = A1f0 = 0.27 · 55 ≈ 14.8. The dashed-linecircle corresponds to the dashed curve in Fig. 12a.The dash-dotted curve represents the version closestto the observed distribution of quasars—this is anellipse characterized by a contraction coefficient ofk ≈ 0.75. Its center (O′) coincides with the center ofthe dashed-line circle, and its major axis y′ forms anangle of about 26 with the y axis.
This distribution of quasars can be interpreted asan indication of the possible spherical (or ellipsoidal)structure of theMetagalaxy, a structure that is similarto elliptic galaxies or spherically symmetric super-clusters of galaxies. If this is so, then our Galaxyis likely to be not far off the Metagalaxy center. Itdoes not undergo the effect of giant gravitationalforces that arise in the external regions of the Meta-galaxy, since the force of gravity vanishes at the centerof a spherically symmetric system. One cannot ruleout the possibility that there is some interplay be-tween the growth of the luminosity of quasars and thegrowth of the gravitational force as the distance fromthe Metagalaxy center increases.
The shaded region in Fig. 13 reflects the distribu-tion of quasars in the nodes (see Fig. 10). Here, onecan see narrow peaks, and the analogous peaks inthe opposite direction correspond to them. The peaks
P
are rotated with respect to one another through anangle of about 30 (or are discrete with this pitch) andfrequently correlate with the peaks of the precedingsample of quasars. It can be conjectured that all of thisis associated in one way or another with the presumedcubed-sphere grid specified by Eq. (6).
In Fig. 14, the distributions of 〈z〉 that are pre-sented in Fig. 12b are given in polar coordinates (thenotation here is similar to that in Fig. 13). If use ismade of the Hubble law
r = v/H0 = βR0 [Mpc], (12)
where r is the distance to the object being consid-ered, β = v/c (here, v and c are, respectively, thespeed of the object and the speed of light), and H0 ≈75 km/s Mpc is the Hubble constant, then theseresults can be treated as the distances 〈r〉 from theobservation point (O) to a “mean quasar” in presetgalactic sectors. A value of R0 ≈ cT ≈ 1026 m ≈4000 Mpc characterizes the limiting dimensions ofthe Metagalaxy (T ≈ 1/H0 ≈ 13 billion years is theage of the Metalaxy since the beginning of the BigBang [6]). In the relativistic case, the quantity β isrelated to the Doppler redshift z by the equation [6]
β = ((1 + z)2 − 1)/((1 + z)2 + 1), (13)
which will be used below in estimating the dis-tances r.
Circles 1 and 2 in Fig. 14 correspond to thecentral cuts of the spheres having radii of 〈r〉1 ≈
HYSICS OF ATOMIC NUCLEI Vol. 68 No. 2 2005
QUASARS AS SOURCES OF ULTRAHIGH-ENERGY COSMIC RAYS 249
⟨
z
⟩
2.5
2.0
1.5
1.0
0.50 120 240 360
l
G
, deg
(
b
)
N
120
80
40
0
(
‡
)
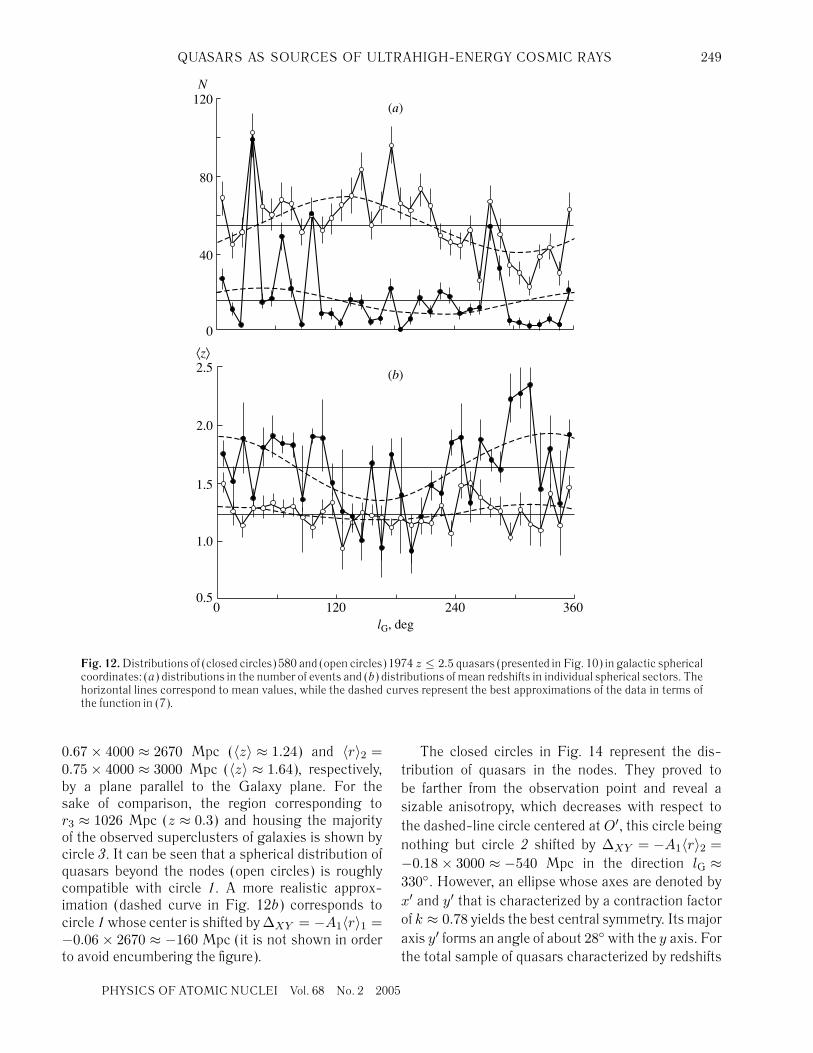
Fig. 12.Distributions of (closed circles) 580 and (open circles) 1974 z ≤ 2.5 quasars (presented in Fig. 10) in galactic sphericalcoordinates: (a) distributions in the number of events and (b) distributions of mean redshifts in individual spherical sectors. Thehorizontal lines correspond to mean values, while the dashed curves represent the best approximations of the data in terms ofthe function in (7).
0.67 × 4000 ≈ 2670 Mpc (〈z〉 ≈ 1.24) and 〈r〉2 =0.75 × 4000 ≈ 3000 Mpc (〈z〉 ≈ 1.64), respectively,by a plane parallel to the Galaxy plane. For thesake of comparison, the region corresponding tor3 ≈ 1026 Mpc (z ≈ 0.3) and housing the majorityof the observed superclusters of galaxies is shown bycircle 3. It can be seen that a spherical distribution ofquasars beyond the nodes (open circles) is roughlycompatible with circle 1. A more realistic approx-imation (dashed curve in Fig. 12b) corresponds tocircle 1whose center is shifted by∆XY = −A1〈r〉1 =−0.06 × 2670 ≈ −160 Mpc (it is not shown in orderto avoid encumbering the figure).
PHYSICS OF ATOMIC NUCLEI Vol. 68 No. 2 200
The closed circles in Fig. 14 represent the dis-tribution of quasars in the nodes. They proved tobe farther from the observation point and reveal asizable anisotropy, which decreases with respect tothe dashed-line circle centered at O′, this circle beingnothing but circle 2 shifted by ∆XY = −A1〈r〉2 =−0.18 × 3000 ≈ −540 Mpc in the direction lG ≈330. However, an ellipse whose axes are denoted byx′ and y′ that is characterized by a contraction factorof k ≈ 0.78 yields the best central symmetry. Its majoraxis y′ forms an angle of about 28 with the y axis. Forthe total sample of quasars characterized by redshifts
5
250 GLUSHKOV
270°
180°
90°
l
G
= 0°
Y
X
X
'
Y
'
O
'
Supergalaxy
plane
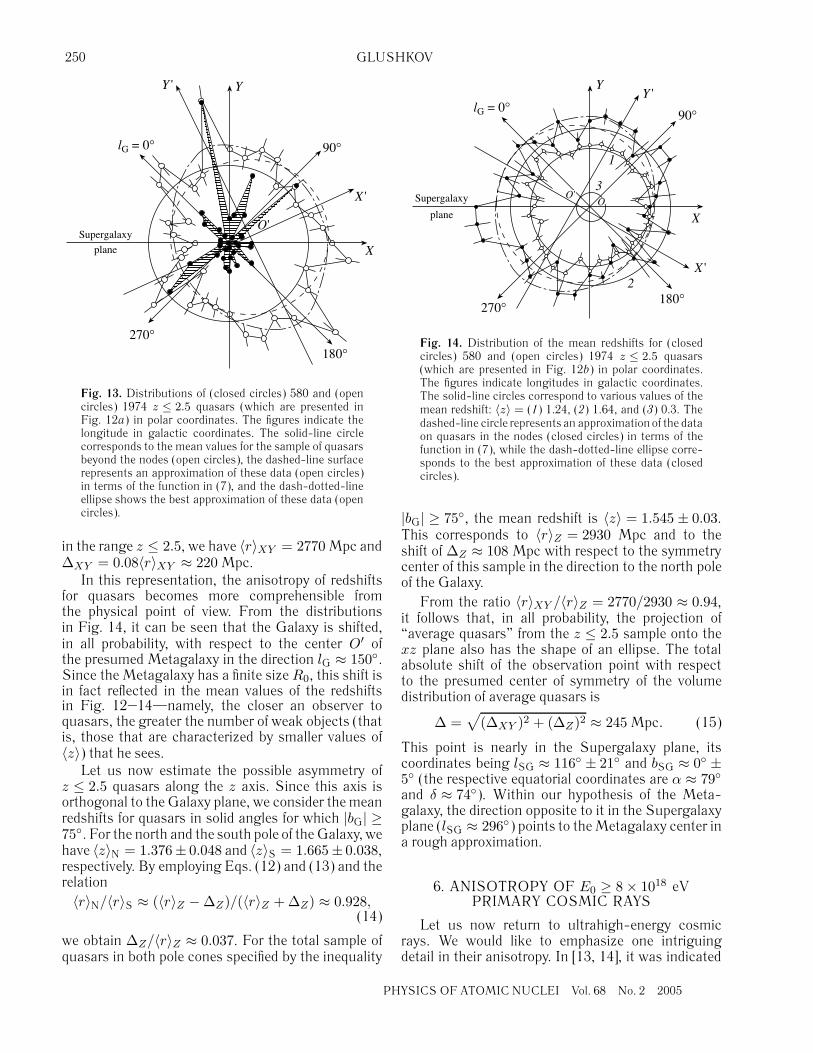
Fig. 13. Distributions of (closed circles) 580 and (opencircles) 1974 z ≤ 2.5 quasars (which are presented inFig. 12a) in polar coordinates. The figures indicate thelongitude in galactic coordinates. The solid-line circlecorresponds to the mean values for the sample of quasarsbeyond the nodes (open circles), the dashed-line surfacerepresents an approximation of these data (open circles)in terms of the function in (7), and the dash-dotted-lineellipse shows the best approximation of these data (opencircles).
in the range z ≤ 2.5, we have 〈r〉XY = 2770Mpc and∆XY = 0.08〈r〉XY ≈ 220 Mpc.
In this representation, the anisotropy of redshiftsfor quasars becomes more comprehensible fromthe physical point of view. From the distributionsin Fig. 14, it can be seen that the Galaxy is shifted,in all probability, with respect to the center O′ ofthe presumed Metagalaxy in the direction lG ≈ 150.Since the Metagalaxy has a finite size R0, this shift isin fact reflected in the mean values of the redshiftsin Fig. 12–14—namely, the closer an observer toquasars, the greater the number of weak objects (thatis, those that are characterized by smaller values of〈z〉) that he sees.
Let us now estimate the possible asymmetry ofz ≤ 2.5 quasars along the z axis. Since this axis isorthogonal to the Galaxy plane, we consider the meanredshifts for quasars in solid angles for which |bG| ≥75. For the north and the south pole of theGalaxy, wehave 〈z〉N = 1.376± 0.048 and 〈z〉S = 1.665± 0.038,respectively. By employing Eqs. (12) and (13) and therelation〈r〉N/〈r〉S ≈ (〈r〉Z − ∆Z)/(〈r〉Z + ∆Z) ≈ 0.928,
(14)
we obtain ∆Z/〈r〉Z ≈ 0.037. For the total sample ofquasars in both pole cones specified by the inequality
PH
180°270°
90°
l
G
= 0°
Y
X
X
'
Y
'
Supergalaxy
1
3
2
OO
'
plane
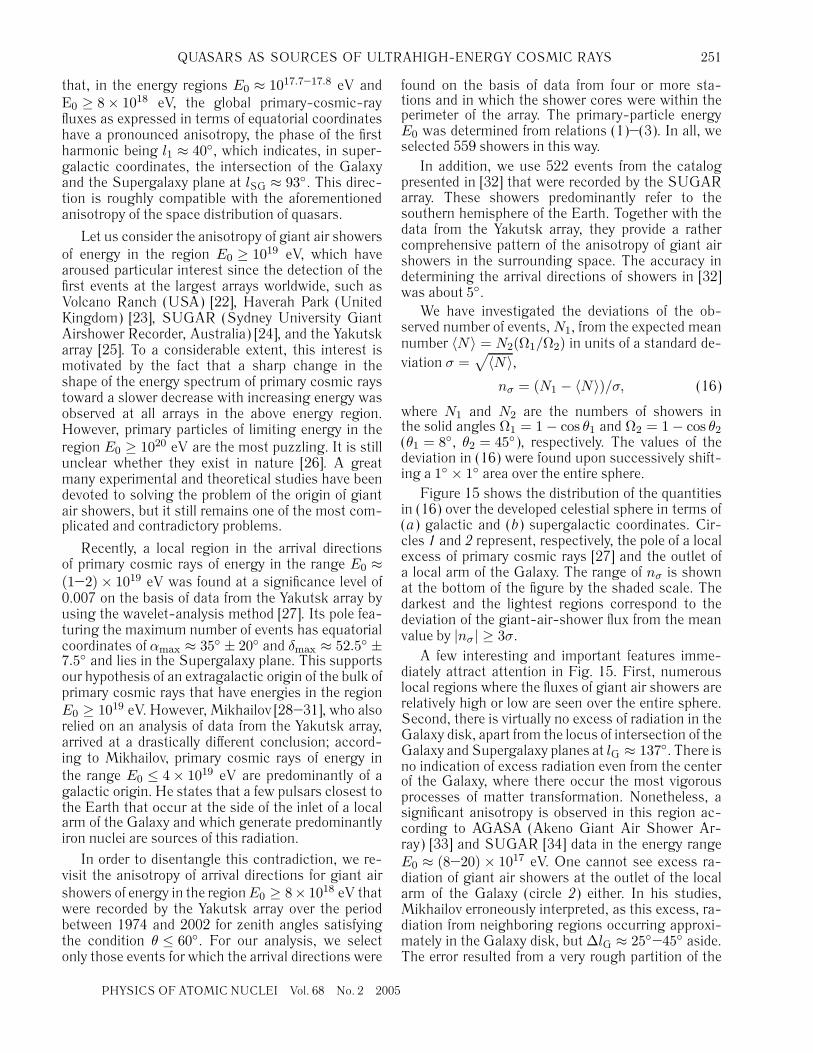
Fig. 14. Distribution of the mean redshifts for (closedcircles) 580 and (open circles) 1974 z ≤ 2.5 quasars(which are presented in Fig. 12b) in polar coordinates.The figures indicate longitudes in galactic coordinates.The solid-line circles correspond to various values of themean redshift: 〈z〉 = (1) 1.24, (2) 1.64, and (3) 0.3. Thedashed-line circle represents an approximation of the dataon quasars in the nodes (closed circles) in terms of thefunction in (7), while the dash-dotted-line ellipse corre-sponds to the best approximation of these data (closedcircles).
|bG| ≥ 75, the mean redshift is 〈z〉 = 1.545 ± 0.03.This corresponds to 〈r〉Z = 2930 Mpc and to theshift of ∆Z ≈ 108 Mpc with respect to the symmetrycenter of this sample in the direction to the north poleof the Galaxy.
From the ratio 〈r〉XY /〈r〉Z = 2770/2930 ≈ 0.94,it follows that, in all probability, the projection of“average quasars” from the z ≤ 2.5 sample onto thexz plane also has the shape of an ellipse. The totalabsolute shift of the observation point with respectto the presumed center of symmetry of the volumedistribution of average quasars is
∆ =√
(∆XY )2 + (∆Z)2 ≈ 245 Mpc. (15)
This point is nearly in the Supergalaxy plane, itscoordinates being lSG ≈ 116 ± 21 and bSG ≈ 0 ±5 (the respective equatorial coordinates are α ≈ 79and δ ≈ 74). Within our hypothesis of the Meta-galaxy, the direction opposite to it in the Supergalaxyplane (lSG ≈ 296) points to theMetagalaxy center ina rough approximation.
6. ANISOTROPY OF E0 ≥ 8 × 10¹⁸ eVPRIMARY COSMIC RAYS
Let us now return to ultrahigh-energy cosmicrays. We would like to emphasize one intriguingdetail in their anisotropy. In [13, 14], it was indicated
YSICS OF ATOMIC NUCLEI Vol. 68 No. 2 2005
QUASARS AS SOURCES OF ULTRAHIGH-ENERGY COSMIC RAYS 251
that, in the energy regions E0 ≈ 1017.7–17.8 eV andЕ0 ≥ 8 × 10¹⁸ eV, the global primary-cosmic-rayfluxes as expressed in terms of equatorial coordinateshave a pronounced anisotropy, the phase of the firstharmonic being l1 ≈ 40, which indicates, in super-galactic coordinates, the intersection of the Galaxyand the Supergalaxy plane at lSG ≈ 93. This direc-tion is roughly compatible with the aforementionedanisotropy of the space distribution of quasars.
Let us consider the anisotropy of giant air showersof energy in the region E0 ≥ 1019 eV, which havearoused particular interest since the detection of thefirst events at the largest arrays worldwide, such asVolcano Ranch (USA) [22], Haverah Park (UnitedKingdom) [23], SUGAR (Sydney University GiantAirshower Recorder, Australia) [24], and the Yakutskarray [25]. To a considerable extent, this interest ismotivated by the fact that a sharp change in theshape of the energy spectrum of primary cosmic raystoward a slower decrease with increasing energy wasobserved at all arrays in the above energy region.However, primary particles of limiting energy in theregion E0 ≥ 1020 eV are the most puzzling. It is stillunclear whether they exist in nature [26]. A greatmany experimental and theoretical studies have beendevoted to solving the problem of the origin of giantair showers, but it still remains one of the most com-plicated and contradictory problems.
Recently, a local region in the arrival directionsof primary cosmic rays of energy in the range E0 ≈(1–2) × 1019 eV was found at a significance level of0.007 on the basis of data from the Yakutsk array byusing the wavelet-analysis method [27]. Its pole fea-turing the maximum number of events has equatorialcoordinates of αmax ≈ 35 ± 20 and δmax ≈ 52.5 ±7.5 and lies in the Supergalaxy plane. This supportsour hypothesis of an extragalactic origin of the bulk ofprimary cosmic rays that have energies in the regionE0 ≥ 1019 eV. However, Mikhailov [28–31], who alsorelied on an analysis of data from the Yakutsk array,arrived at a drastically different conclusion; accord-ing to Mikhailov, primary cosmic rays of energy inthe range E0 ≤ 4 × 10¹⁹ eV are predominantly of agalactic origin. He states that a few pulsars closest tothe Earth that occur at the side of the inlet of a localarm of the Galaxy and which generate predominantlyiron nuclei are sources of this radiation.
In order to disentangle this contradiction, we re-visit the anisotropy of arrival directions for giant airshowers of energy in the regionE0 ≥ 8× 10¹⁸ eV thatwere recorded by the Yakutsk array over the periodbetween 1974 and 2002 for zenith angles satisfyingthe condition θ ≤ 60. For our analysis, we selectonly those events for which the arrival directions were
PHYSICS OF ATOMIC NUCLEI Vol. 68 No. 2 200
found on the basis of data from four or more sta-tions and in which the shower cores were within theperimeter of the array. The primary-particle energyE0 was determined from relations (1)–(3). In all, weselected 559 showers in this way.
In addition, we use 522 events from the catalogpresented in [32] that were recorded by the SUGARarray. These showers predominantly refer to thesouthern hemisphere of the Earth. Together with thedata from the Yakutsk array, they provide a rathercomprehensive pattern of the anisotropy of giant airshowers in the surrounding space. The accuracy indetermining the arrival directions of showers in [32]was about 5.
We have investigated the deviations of the ob-served number of events,N1, from the expected meannumber 〈N〉 = N2(Ω1/Ω2) in units of a standard de-viation σ =
√〈N〉,nσ = (N1 − 〈N〉)/σ, (16)
where N1 and N2 are the numbers of showers inthe solid angles Ω1 = 1 − cos θ1 and Ω2 = 1 − cos θ2(θ1 = 8, θ2 = 45), respectively. The values of thedeviation in (16) were found upon successively shift-ing a 1 × 1 area over the entire sphere.
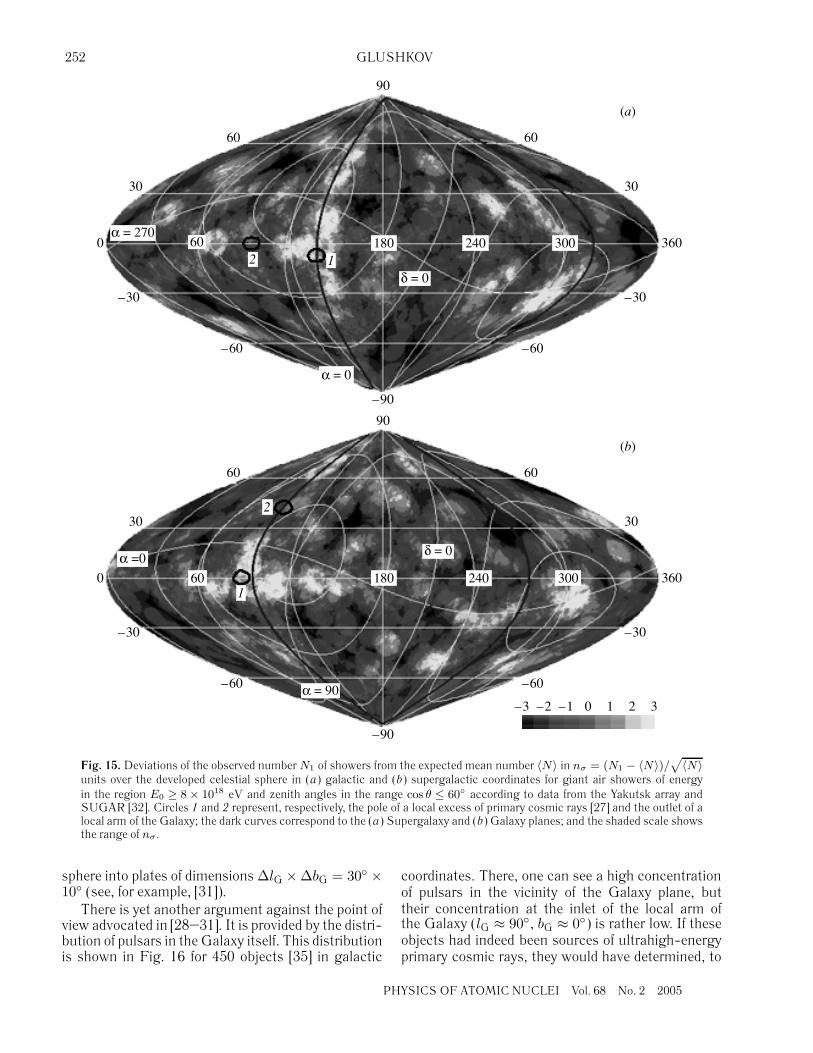
Figure 15 shows the distribution of the quantitiesin (16) over the developed celestial sphere in terms of(а) galactic and (b) supergalactic coordinates. Cir-cles 1 and 2 represent, respectively, the pole of a localexcess of primary cosmic rays [27] and the outlet ofa local arm of the Galaxy. The range of nσ is shownat the bottom of the figure by the shaded scale. Thedarkest and the lightest regions correspond to thedeviation of the giant-air-shower flux from the meanvalue by |nσ| ≥ 3σ.
A few interesting and important features imme-diately attract attention in Fig. 15. First, numerouslocal regions where the fluxes of giant air showers arerelatively high or low are seen over the entire sphere.Second, there is virtually no excess of radiation in theGalaxy disk, apart from the locus of intersection of theGalaxy and Supergalaxy planes at lG ≈ 137. There isno indication of excess radiation even from the centerof the Galaxy, where there occur the most vigorousprocesses of matter transformation. Nonetheless, asignificant anisotropy is observed in this region ac-cording to AGASA (Akeno Giant Air Shower Ar-ray) [33] and SUGAR [34] data in the energy rangeE0 ≈ (8–20) × 1017 eV. One cannot see excess ra-diation of giant air showers at the outlet of the localarm of the Galaxy (circle 2) either. In his studies,Mikhailov erroneously interpreted, as this excess, ra-diation from neighboring regions occurring approxi-mately in the Galaxy disk, but∆lG ≈ 25–45 aside.The error resulted from a very rough partition of the
5
252 GLUSHKOV
90
60
30
0
–30
–60
–90
–60
–30
360
30
60
60
α
= 270
(
a
)
240 300180
12
α
= 0
δ
= 0
90
60
30
0
–30
–60
–90
–60
–30
360
30
60
α
=0
(
b
)
240 300180
1
2
α
= 90
δ
= 0
60
–3 –2 –1 0 1 2 3
Fig. 15. Deviations of the observed number N1 of showers from the expected mean number 〈N〉 in nσ = (N1 − 〈N〉)/√
〈N〉units over the developed celestial sphere in (a) galactic and (b) supergalactic coordinates for giant air showers of energyin the region E0 ≥ 8 × 10¹⁸ eV and zenith angles in the range cos θ ≤ 60 according to data from the Yakutsk array andSUGAR [32]. Circles 1 and 2 represent, respectively, the pole of a local excess of primary cosmic rays [27] and the outlet of alocal arm of the Galaxy; the dark curves correspond to the (a) Supergalaxy and (b) Galaxy planes; and the shaded scale showsthe range of nσ .
sphere into plates of dimensions∆lG × ∆bG = 30 ×10 (see, for example, [31]).
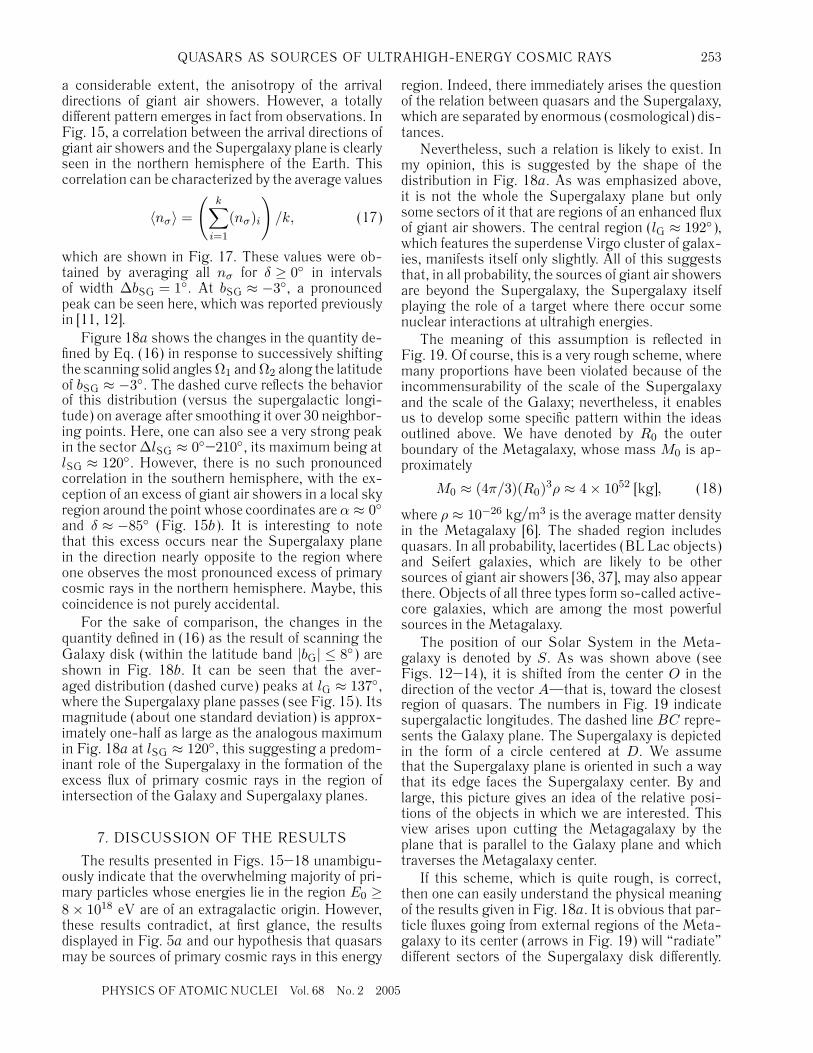
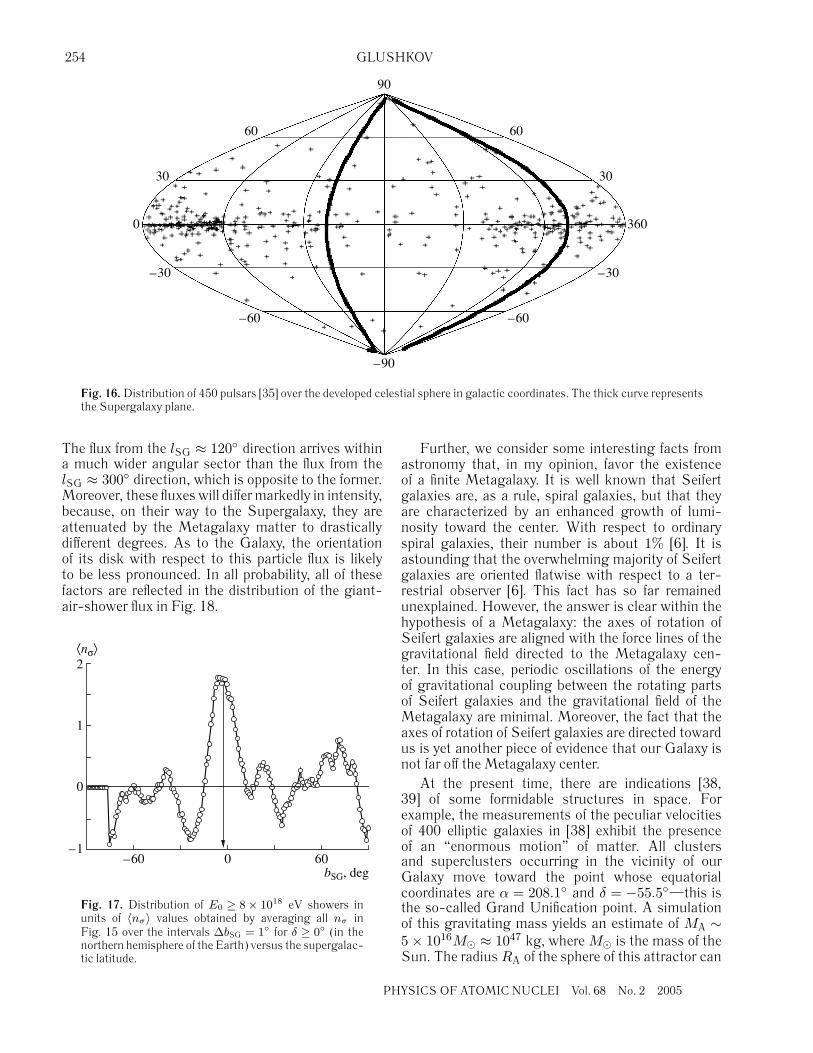
There is yet another argument against the point ofview advocated in [28–31]. It is provided by the distri-bution of pulsars in the Galaxy itself. This distributionis shown in Fig. 16 for 450 objects [35] in galactic
P
coordinates. There, one can see a high concentrationof pulsars in the vicinity of the Galaxy plane, buttheir concentration at the inlet of the local arm ofthe Galaxy (lG ≈ 90, bG ≈ 0) is rather low. If theseobjects had indeed been sources of ultrahigh-energyprimary cosmic rays, they would have determined, to
HYSICS OF ATOMIC NUCLEI Vol. 68 No. 2 2005
QUASARS AS SOURCES OF ULTRAHIGH-ENERGY COSMIC RAYS 253
a considerable extent, the anisotropy of the arrivaldirections of giant air showers. However, a totallydifferent pattern emerges in fact from observations. InFig. 15, a correlation between the arrival directions ofgiant air showers and the Supergalaxy plane is clearlyseen in the northern hemisphere of the Earth. Thiscorrelation can be characterized by the average values
〈nσ〉 =
(k∑
i=1
(nσ)i
)/k, (17)
which are shown in Fig. 17. These values were ob-tained by averaging all nσ for δ ≥ 0 in intervalsof width ∆bSG = 1. At bSG ≈ −3, a pronouncedpeak can be seen here, which was reported previouslyin [11, 12].
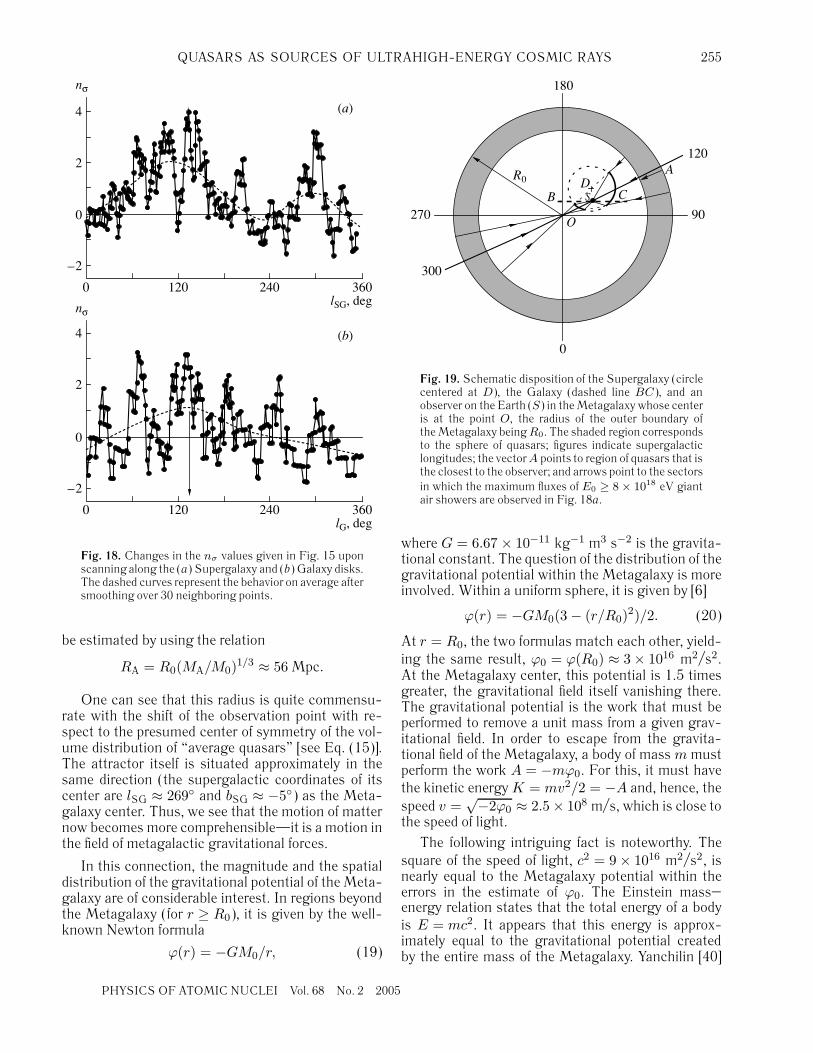
Figure 18a shows the changes in the quantity de-fined by Eq. (16) in response to successively shiftingthe scanning solid anglesΩ1 andΩ2 along the latitudeof bSG ≈ −3. The dashed curve reflects the behaviorof this distribution (versus the supergalactic longi-tude) on average after smoothing it over 30 neighbor-ing points. Here, one can also see a very strong peakin the sector∆lSG ≈ 0–210, its maximum being atlSG ≈ 120. However, there is no such pronouncedcorrelation in the southern hemisphere, with the ex-ception of an excess of giant air showers in a local skyregion around the point whose coordinates are α ≈ 0and δ ≈ −85 (Fig. 15b). It is interesting to notethat this excess occurs near the Supergalaxy planein the direction nearly opposite to the region whereone observes the most pronounced excess of primarycosmic rays in the northern hemisphere. Maybe, thiscoincidence is not purely accidental.
For the sake of comparison, the changes in thequantity defined in (16) as the result of scanning theGalaxy disk (within the latitude band |bG| ≤ 8) areshown in Fig. 18b. It can be seen that the aver-aged distribution (dashed curve) peaks at lG ≈ 137,where the Supergalaxy plane passes (see Fig. 15). Itsmagnitude (about one standard deviation) is approx-imately one-half as large as the analogous maximumin Fig. 18a at lSG ≈ 120, this suggesting a predom-inant role of the Supergalaxy in the formation of theexcess flux of primary cosmic rays in the region ofintersection of the Galaxy and Supergalaxy planes.
7. DISCUSSION OF THE RESULTS
The results presented in Figs. 15–18 unambigu-ously indicate that the overwhelming majority of pri-mary particles whose energies lie in the region E0 ≥8 × 10¹⁸ eV are of an extragalactic origin. However,these results contradict, at first glance, the resultsdisplayed in Fig. 5a and our hypothesis that quasarsmay be sources of primary cosmic rays in this energy
PHYSICS OF ATOMIC NUCLEI Vol. 68 No. 2 200
region. Indeed, there immediately arises the questionof the relation between quasars and the Supergalaxy,which are separated by enormous (cosmological) dis-tances.
Nevertheless, such a relation is likely to exist. Inmy opinion, this is suggested by the shape of thedistribution in Fig. 18a. As was emphasized above,it is not the whole the Supergalaxy plane but onlysome sectors of it that are regions of an enhanced fluxof giant air showers. The central region (lG ≈ 192),which features the superdense Virgo cluster of galax-ies, manifests itself only slightly. All of this suggeststhat, in all probability, the sources of giant air showersare beyond the Supergalaxy, the Supergalaxy itselfplaying the role of a target where there occur somenuclear interactions at ultrahigh energies.
The meaning of this assumption is reflected inFig. 19. Of course, this is a very rough scheme, wheremany proportions have been violated because of theincommensurability of the scale of the Supergalaxyand the scale of the Galaxy; nevertheless, it enablesus to develop some specific pattern within the ideasoutlined above. We have denoted by R0 the outerboundary of the Metagalaxy, whose mass M0 is ap-proximately
M0 ≈ (4π/3)(R0)3ρ ≈ 4 × 1052 [kg], (18)
where ρ ≈ 10−26 kg/m3 is the average matter densityin the Metagalaxy [6]. The shaded region includesquasars. In all probability, lacertides (BL Lac objects)and Seifert galaxies, which are likely to be othersources of giant air showers [36, 37], may also appearthere. Objects of all three types form so-called active-core galaxies, which are among the most powerfulsources in the Metagalaxy.
The position of our Solar System in the Meta-galaxy is denoted by S. As was shown above (seeFigs. 12–14), it is shifted from the center O in thedirection of the vector A—that is, toward the closestregion of quasars. The numbers in Fig. 19 indicatesupergalactic longitudes. The dashed line BC repre-sents the Galaxy plane. The Supergalaxy is depictedin the form of a circle centered at D. We assumethat the Supergalaxy plane is oriented in such a waythat its edge faces the Supergalaxy center. By andlarge, this picture gives an idea of the relative posi-tions of the objects in which we are interested. Thisview arises upon cutting the Metagagalaxy by theplane that is parallel to the Galaxy plane and whichtraverses the Metagalaxy center.
If this scheme, which is quite rough, is correct,then one can easily understand the physical meaningof the results given in Fig. 18a. It is obvious that par-ticle fluxes going from external regions of the Meta-galaxy to its center (arrows in Fig. 19) will “radiate”different sectors of the Supergalaxy disk differently.
5
254 GLUSHKOV
90
–90
60 60
3030
–30 –30
–60–60
0 360
Fig. 16. Distribution of 450 pulsars [35] over the developed celestial sphere in galactic coordinates. The thick curve representsthe Supergalaxy plane.
The flux from the lSG ≈ 120 direction arrives withina much wider angular sector than the flux from thelSG ≈ 300 direction, which is opposite to the former.Moreover, these fluxes will differ markedly in intensity,because, on their way to the Supergalaxy, they areattenuated by the Metagalaxy matter to drasticallydifferent degrees. As to the Galaxy, the orientationof its disk with respect to this particle flux is likelyto be less pronounced. In all probability, all of thesefactors are reflected in the distribution of the giant-air-shower flux in Fig. 18.
–60 0 60–1
0
1
2
b
SG
, deg
⟨ n
σ
⟩
Fig. 17. Distribution of E0 ≥ 8 × 10¹⁸ eV showers inunits of 〈nσ〉 values obtained by averaging all nσ inFig. 15 over the intervals ∆bSG = 1 for δ ≥ 0 (in thenorthern hemisphere of the Earth) versus the supergalac-tic latitude.
P
Further, we consider some interesting facts fromastronomy that, in my opinion, favor the existenceof a finite Metagalaxy. It is well known that Seifertgalaxies are, as a rule, spiral galaxies, but that theyare characterized by an enhanced growth of lumi-nosity toward the center. With respect to ordinaryspiral galaxies, their number is about 1% [6]. It isastounding that the overwhelming majority of Seifertgalaxies are oriented flatwise with respect to a ter-restrial observer [6]. This fact has so far remainedunexplained. However, the answer is clear within thehypothesis of a Metagalaxy: the axes of rotation ofSeifert galaxies are aligned with the force lines of thegravitational field directed to the Metagalaxy cen-ter. In this case, periodic oscillations of the energyof gravitational coupling between the rotating partsof Seifert galaxies and the gravitational field of theMetagalaxy are minimal. Moreover, the fact that theaxes of rotation of Seifert galaxies are directed towardus is yet another piece of evidence that our Galaxy isnot far off the Metagalaxy center.
At the present time, there are indications [38,39] of some formidable structures in space. Forexample, the measurements of the peculiar velocitiesof 400 elliptic galaxies in [38] exhibit the presenceof an “enormous motion” of matter. All clustersand superclusters occurring in the vicinity of ourGalaxy move toward the point whose equatorialcoordinates are α = 208.1 and δ = −55.5—this isthe so-called Grand Unification point. A simulationof this gravitating mass yields an estimate of MА ∼5 × 10¹⁶M ≈ 1047 kg, whereM is the mass of theSun. The radius RА of the sphere of this attractor can
HYSICS OF ATOMIC NUCLEI Vol. 68 No. 2 2005
QUASARS AS SOURCES OF ULTRAHIGH-ENERGY COSMIC RAYS 255
–2
0
l
G
, deg
0
2
4
120 240 360
–2
n
σ
0
2
4
0
l
SG
, deg120 240 360
(
a
)
(
b
)
n
σ
Fig. 18. Changes in the nσ values given in Fig. 15 uponscanning along the (a) Supergalaxy and (b) Galaxy disks.The dashed curves represent the behavior on average aftersmoothing over 30 neighboring points.
be estimated by using the relation
RА = R0(MА/M0)1/3 ≈ 56 Mpc.
One can see that this radius is quite commensu-rate with the shift of the observation point with re-spect to the presumed center of symmetry of the vol-ume distribution of “average quasars” [see Eq. (15)].The attractor itself is situated approximately in thesame direction (the supergalactic coordinates of itscenter are lSG ≈ 269 and bSG ≈ −5) as the Meta-galaxy center. Thus, we see that the motion of matternow becomes more comprehensible—it is a motion inthe field of metagalactic gravitational forces.
In this connection, the magnitude and the spatialdistribution of the gravitational potential of theMeta-galaxy are of considerable interest. In regions beyondthe Metagalaxy (for r ≥ R0), it is given by the well-known Newton formula
ϕ(r) = −GM0/r, (19)
PHYSICS OF ATOMIC NUCLEI Vol. 68 No. 2 200
O
B CD
S
R
0
A
90
120
180
270
300
0
Fig. 19. Schematic disposition of the Supergalaxy (circlecentered at D), the Galaxy (dashed line BC), and anobserver on the Earth (S) in theMetagalaxy whose centeris at the point O, the radius of the outer boundary oftheMetagalaxy beingR0. The shaded region correspondsto the sphere of quasars; figures indicate supergalacticlongitudes; the vectorA points to region of quasars that isthe closest to the observer; and arrows point to the sectorsin which the maximum fluxes of E0 ≥ 8 × 10¹⁸ eV giantair showers are observed in Fig. 18a.
where G = 6.67 × 10⁻¹¹ kg−1 m3 s−2 is the gravita-tional constant. The question of the distribution of thegravitational potential within the Metagalaxy is moreinvolved. Within a uniform sphere, it is given by [6]
ϕ(r) = −GM0(3 − (r/R0)2)/2. (20)
At r = R0, the two formulas match each other, yield-ing the same result, ϕ0 = ϕ(R0) ≈ 3 × 10¹⁶ m2/s2.At the Metagalaxy center, this potential is 1.5 timesgreater, the gravitational field itself vanishing there.The gravitational potential is the work that must beperformed to remove a unit mass from a given grav-itational field. In order to escape from the gravita-tional field of the Metagalaxy, a body of massmmustperform the work A = −mϕ0. For this, it must havethe kinetic energyK = mv2/2 = −A and, hence, thespeed v =
√−2ϕ0 ≈ 2.5 × 10⁸ m/s, which is close to
the speed of light.The following intriguing fact is noteworthy. The
square of the speed of light, c2 = 9 × 10¹⁶ m2/s2, isnearly equal to the Metagalaxy potential within theerrors in the estimate of ϕ0. The Einstein mass–energy relation states that the total energy of a bodyis E = mc2. It appears that this energy is approx-imately equal to the gravitational potential createdby the entire mass of the Metagalaxy. Yanchilin [40]
5
256 GLUSHKOV
considered some surprising consequences from thiscircumstance, but we will not dwell on them here.
Particles forming primary cosmic rays of ultrahighenergy are of great interest. It was stated above—and previously in [1–4, 11–14]—that, in all prob-ability, these particles must be neutral and stable.At the present time, it is difficult to determine theirsort, but some of their properties are already known.These cannot be photons, since, according to variousmodel estimates, photons initiate extensive air show-ers where the number of muons is approximately tentimes smaller than in showers from primary cosmicrays of ordinary composition—in experiments, therewere no such deviations of the muon fraction in theoverwhelming majority of events.
We cannot rule out the possibility that these areneutrinos. The calculations performed in [41] revealedthat, under certain conditions on the growth of thecross section for neutrino–nucleon interaction (σνN )in the region of ultrahigh energies, there can ariseextensive air showers that are similar in many re-spects to showers initiated by primary cosmic raysof ordinary composition. The hypothesis of ultrahigh-energy neutrinos interacting with relic neutrinos inthe vicinity of the Earth and generating “Z-boson”showers was considered in [42, 43].
According to [44], neutral pions can also appearas the presumed neutral particles of primary cosmicrays. It was shown there that stable pions can exist inthe composition of cosmic rays whose energy lies inthe region E0 ≥ 1019 eV. The respective calculationsrelied on the model of quark–gluon strings [45] withallowance for the Landau–Pomeranchuk–Migdaleffect [46] and admitted a very weak violation ofLorentz invariance in accordance with the Coleman–Glashow hypothesis. It is of paramount importancethat, within this hypothesis, pion interaction with relicphotons is kinematically forbidden, which makes itpossible to resolve the Greisen–Zatsepin–Kuz’minparadox [47, 48]. The calculations performed in [44]revealed that neutral pions and protons lead topatterns of giant-air-shower development that aresimilar in many respects, although there are somedistinctions between them.
Possibly, neutral pions are produced not only in lo-cal sources characterized by a vigorous energy releasebut also in collisions of ultrahigh-energy primary cos-mic rays with a metagalactic gas. In my opinion, suchprocesses in the Supergalaxy and in other large-scalestructures of the Metagalaxy could lead to the resultsdisplayed in Figs. 17 and 18a. In this connection, afurther development of the hypothesis that long-livedneutral pions can be present in primary cosmic raysseems quite promising.
PH
However, we will assume that extragalactic pri-mary cosmic rays can also involve other neutral par-ticles generated by active-core galaxies. An attemptat experimentally estimating the nuclear-interactionrange of puzzling neutral particles at an energy ofE0 ∼ 1017 eV was made in [4]. It turned out to beabout (3–4) × 10−2 g/cm2, which is approximately1000 times smaller than the nuclear-interactionrange of ultrahigh-energy protons. Therefore, theseparticles initiate the development of extensive airshowers much earlier than primary cosmic rays ofordinary composition. But after the first interactionevent, they are likely to disappear, giving way, in thedevelopment of extensive air showers, to a normalcascade of secondary particles; otherwise, showersgenerated by them would differ considerably fromconventional showers and would be readily identifi-able.
Because of so short a range to the first nuclearinteraction, showers from the presumed neutral par-ticles are expected to cause an enhanced develop-ment of extensive air showers, with the cascade-curvemaximum lying higher in that case than in the caseof primary protons. In view of this, showers from ironnuclei can mimic showers from puzzling neutral par-ticles. The point is that the majority of themethods fordetermining the composition of primary cosmic raysare indirect: they rely on a comparison of observedfeatures of extensive air showers with their calculatedcounterparts that are found on the basis of modelconcepts of the development of extensive air showersfor one preset composition of primary cosmic raysor another. Here, one cannot rule out the situationwhere effects of any primary particles having veryshort ranges can be misinterpreted by researchers asthose which are associated with an increase in thefraction of heavy nuclei.
8. CONCLUSION
The above results can be partitioned into twogroups that are independent to some extent. The firstgroup has some bearing on the origin of ultrahigh-energy primary cosmic rays. The results presentedin Figs. 4–9 can be interpreted as the indication thatquasars characterized by redshift values satisfying thecondition z ≤ 2.5may be among the probable sourcesof cosmic rays whose energies lie in the region E0 ≥5 × 10¹⁷ eV. On the basis of a comparison of thedistributions in Fig. 5, it can be assumed that theeffective contributions of quasars for which z takesdifferent values are different in different regions of theenergy of primary cosmic rays. That quasars formingclusters play a more important role in the formationof primary cosmic rays than the remaining events notentering into these clusters can most clearly be seen
YSICS OF ATOMIC NUCLEI Vol. 68 No. 2 2005
QUASARS AS SOURCES OF ULTRAHIGH-ENERGY COSMIC RAYS 257
(at a significance level not lower than five standarddeviations) from the example of the data in Fig. 7.
Our results are consistent with the hypothesis [9]that the activity of quasars can undergo variations—that is, there are periods of their high and low lumi-nosity. The angular correlations between the arrivaldirections of primary cosmic rays and the positionsof quasars are the most pronounced in those redshiftintervals that are associated with the high-activityperiods.
The results presented in Figs. 1, 2, and 8–14 re-flect the spatial structure of quasars. It is hardly con-sistent with the hypothesis of a uniform and isotropicuniverse on a scale where z ≤ 2.5. For example, thedata in Fig. 8 are indicative of the possible existence ofan ordered structure belonging to the cubed-sphere-grid type. The total distribution of quasars over thecelestial sphere (Fig. 1) is characterized by a small-scale anisotropy accompanied by the presence of alarge number of nodes (see Fig. 9). Objects formingnodes and those that do not enter into them are likelyto have different spatial structures (Figs. 10–12).
The results displayed in Fig. 12 indicate thatthere can exist a global anisotropy of quasars. Thisanisotropy is characterized by a central asymmetry ofthe spatial distribution of quasars (see Figs. 13 and14). Its structure does not rule out the existence of aMetagalaxy, a gravitationally bound set of matter inthe Universe within which we live and beyond whichour sight cannot penetrate in principle. In my opinion,the hypothesis that the Supergalaxy is situated nearthe center of the Metagalaxy (see Fig. 19) makesit possible to obtain deeper insight into the resultsconcerning the anisotropy of the spatial distributionof quasars and the anisotropy of the arrival directionsof the global flux of giant air showers.
The results in Figs. 15–18 evince an extragalacticorigin of primary cosmic rays whose energies lie inthe region E0 ≥ 8 × 10¹⁸ eV. Some of these parti-cles (possibly neutral pions [44]) are formed in theSupergalaxy. It can be assumed that they are formedin collisions of neutral particles generated by quasarswith a supergalactic gas. Here, further investigationsare required, and they are under way now.
ACKNOWLEDGMENTS
The financial support extended by the Ministry ofScience of the Russian Federation to the Yakutskmultipurpose array for studying extensive air showers(grant no. 01-30), which was included in the list ofunique experimental facilities of national importance,is gratefully acknowledged.
PHYSICS OF ATOMIC NUCLEI Vol. 68 No. 2 200
REFERENCES
1. A. V. Glushkov, Pis’ma Zh. Eksp. Teor. Fiz. 73, 355(2001) [JETP Lett. 73, 313 (2001)].
2. A. V. Glushkov and M. I. Pravdin, Pis’ma Astron. Zh.28, 341 (2002) [Astron. Lett. 28, 296 (2002)].
3. A. V. Glushkov, Izv. Akad. Nauk, Ser. Fiz. 66, 1599(2002).
4. A. V. Glushkov, Yad. Fiz. 66, 1292 (2003) [Phys. At.Nucl. 66, 1252 (2003)].
5. A. Hewitt and G. Burbidge, Astrophys. J., Suppl. Ser.63, 1 (1987).
6. Physics of Space: Small Encyclopedia, Ed. byR. A. Syunyaev (Sov. Encyclopedia, Moscow, 1986)[in Russian].
7. K. G. Karlsson, Astron. Astrophys. 13, 333 (1971).8. M. F. Khodyachikh, Astron. Zh. 73, 11 (1996) [As-
tron. Rep. 40, 6 (1996)].9. A. I. Ryabinkov, A. D. Kaminker, and D. A. Var-
shalovich, Pis’ma Astron. Zh. 27, 643 (2001) [Astron.Lett. 27, 549 (2001)].
10. M.-P. Veron-Cetty and P. Veron-Cetty, A Catalogueof Quasars and Active Nuclei, 9th ed. (ESO Scien-tific Report, 2000).
11. A. V. Glushkov andM. I. Pravdin, Zh. Eksp. Teor. Fiz.119, 1029 (2001) [JETP 92, 887 (2001)].
12. A. V. Glushkov and M. I. Pravdin, Pis’ma Astron. Zh.27, 577 (2001) [Astron. Lett. 27, 493 (2001)].
13. A. V. Glushkov, Pis’ma Astron. Zh. 29, 172 (2003)[Astron. Lett. 29, 142 (2003)].
14. A. V. Glushkov and M. I. Pravdin, Yad. Fiz. 66, 886(2003) [Phys. At. Nucl. 66, 854 (2003)].
15. B. A. Vorontsov-Vel’yaminov, I. D. Karachentsev,E. Turner, et al., Large-Scale Structure of the Uni-verse (Mir, Moscow, 1981) [in Russian].
16. A. V. Gurevich and K. P. Zybin, Usp. Fiz. Nauk 165,3 (1995) [Phys. Usp. 38, 1 (1995)].
17. J. Linsley, Phys. Rev. Lett. 34, 1530 (1975).18. A. D. Chernin, Stars and Physics (Nauka, Moscow,
1984) [in Russian].19. I. D. Novikov, How the Universe Have Been Ex-
plored (Nauka, Moscow, 1988) [in Russian].20. A. D. Linde, Usp. Fiz. Nauk 144, 177 (1984) [Sov.
Phys. Usp. 27, 81 (1984)].21. A. D. Linde, Phys. Lett. B 175, 395 (1986).22. J. Linsley, Phys. Rev. Lett. 10, 146 (1963).23. D. M. Edge, A. C. Evans, H. J. Garmston, et al.,
J. Phys. A 6, 1612 (1973).24. C. J. Bell et al., J. Phys. A 7, 990 (1974).25. D. D. Krasilnikov, A. I. Kuzmin, J. Linsley, et al.,
J. Phys. A 7, 176 (1974).26. A. V. Glushkov, Pis’ma Zh. Eksp. Teor. Fiz. 78, 1265
(2003) [JETP Lett. 78, 745 (2003)].27. A. A. Ivanov, A. D. Krasilnikov, and M. I. Pravdin, in
Proc. 28th ICRC, Tsukuba, 2003, Vol. 1, p. 341.28. A. A. Mikhaılov, Izv. Akad. Nauk, Ser. Fiz. 63, 557
(1999).29. A. A. Mikhaılov, Pis’ma Zh. Eksp. Teor. Fiz. 72, 233
(2000) [JETP Lett. 72, 160 (2000)].30. A. A. Mikhaılov, Izv. Akad. Nauk, Ser. Fiz. 66, 1596
(2002).
5
258 GLUSHKOV
31. A. Mikhailov and G. Nikolayeva, in Proc. 28th ICRC,Tsukuba, 2003, Vol. 1, p. 417.
32. M. M. Winn et al., Catalog of Highest EnergyCosmic Rays. Giant Extensive Air Showers (WorldData Center C2 for Cosmic Rays,Mito, Japan, 1986),No. 2.
33. N. Hayashida, M. Nagano, D. Nishikawa, et al., As-tropart. Phys. 10, 303 (1999).
34. J. A. Bellido, B. W. Clay, R. B. Dawson, andM. Johnston-Hollitt, astro-ph/0009039.
35. A. G. Lyne and F. Graham-Smith, Pulsar As-tronomy (Cambridge University Press, Cambridge,1990).
36. P. G. Tinyakov and I. I. Tkachov, Pis’ma Zh. Eksp.Teor. Fiz. 74, 499 (2001) [JETP Lett. 74, 445 (2001)].
37. A. V. Uryson, Zh. Eksp. Teor. Fiz. 116, 1121 (1999)[JETP 89, 597 (1999)].
38. A. Dressler, Nature 350, 391 (1991).39. H. F. Klapdor-Kleingrothaus and K. Zuber, Particle
Astrophysics (Usp. Fiz. Nauk, Moscow, 2000).
P
40. V. L. Yanchilin, Uncertainty, Gravitation, Space(Editorial URSS, Moscow, 2003) [in Russian].
41. L. Anchordoqui, H. Goldberg, T. McCauley, et al.,hep-ph/0011097.
42. D. Fargion, B. Mele, and A. Salis, Astrophys. J. 517,725 (1999).
43. T. J. Weiler, Astropart. Phys. 11, 303 (1999).44. L. G. Dedenko, T. M. Roganova, G. F. Fedorova, and
E. Yu. Fedunin, Pis’ma Zh. Eksp. Teor. Fiz. 78, 131(2003) [JETP Lett. 78, 101 (2003)].
45. A. B. Kaıdalov, K. A. Ter-Martirosyan, andYu. M. Shabel’skiı, Yad. Fiz. 43, 1282 (1986)[Sov. J. Nucl. Phys. 43, 822 (1986)].
46. A. B. Migdal, Phys. Rev. 103, 1811 (1956).47. K. Greisen, Phys. Rev. Lett. 16, 748 (1966).48. G. T. Zatsepin and V. A. Kuz’min, Pis’ma Zh. Eksp.
Teor. Fiz. 4, 78 (1966) [JETP Lett. 4, 53 (1966)].
Translated by A. Isaakyan
HYSICS OF ATOMIC NUCLEI Vol. 68 No. 2 2005