Embed Size (px)
Citation preview

O
Comptroller of the Currency Administrator of National Banks
Washington, DC 20219
OCC’s Quarterly Report on Bank Trading and Derivatives Activities Fourth Quarter 2011
Executive Summary
Insured U.S. commercial banks reported trading revenues of $2.5 billion in the fourth quarter, 70%
lower than revised1 third quarter revenues of $8.5 billion, and 27% lower than $3.5 billion in the fourth
quarter of 2010. Credit exposure from derivatives fell in the fourth quarter. Net current credit exposure decreased 15%,
or $74 billion, to $430 billion.
Trading risk exposure, as measured by Value-at-Risk (VaR), decreased in 2011 as dealers actively
reduced risk in the face of increasing global financial risks. Aggregate average VaR at the 5 largest trading companies declined 9.3% from 2010 to $680 million.
The notional amount of derivatives held by insured U.S. commercial banks fell $17 trillion, or 7%, from
the third quarter of 2011, to $231 trillion. The fourth quarter decline in notionals followed a 0.6%
decline during the third quarter, and marks the first time notionals have declined in consecutive quarters. Notional derivatives at year-end were 0.2% lower than at the end of 2010, the first year-
over-year decline on record. Derivative contracts remain concentrated in interest rate products, which comprise 81% of total
derivative notional amounts. Credit derivatives, which represent 6% of total derivatives notionals, fell
6% to $14.8 trillion.
The OCC’s quarterly report on trading revenues and bank derivatives activities is based on Call Report information provided by all insured U.S. commercial banks and trust companies, reports filed by U.S. financial
holding companies, and other published data.
A total of 1,078 insured U.S. commercial banks reported derivatives activities at the end of the fourth quarter, a
decrease of 10 banks from the prior quarter. Derivatives activity in the U.S. banking system continues to be dominated by a small group of large financial institutions. Five large commercial banks represent 96% of the
total banking industry notional amounts and 86% of industry net current credit exposure.
The OCC and other supervisors have examiners on-site at the largest banks to continuously evaluate the credit, market, operational, reputation, and compliance risks of bank derivatives activities. In addition to the OCC’s on-
site supervisory activities, the OCC continues to work with other financial supervisors and major market
participants to address infrastructure issues in OTC derivatives, including development of objectives and milestones for stronger trade processing and improved market transparency across all OTC derivatives
categories.
Revenues Insured U.S. commercial banks reported $2.5 billion in trading revenues in the fourth quarter, 70% lower than
revised third quarter revenues, and 27% lower than $3.5 billion in the fourth quarter of 2010. Trading
1 3Q revenues revised due to a call report restatement.

2
revenues in the third quarter were originally reported at $13.1 billion, but were reduced to $8.5 billion to reflect
call report revisions to properly report the results of mortgage servicing asset hedges.
Seasonal factors typically lead to weaker trading revenues in the final quarter of each year, as market participants become less willing to take risks. Trading revenues have been weakest in the fourth quarter in 10
of the past 12 years. The normal seasonal weakness, however, was exacerbated by a significant reduction in
risk appetite, not only by bank clients but also the banks themselves, as investors were especially reluctant to take risks amidst lingering uncertainty associated with Europe’s sovereign debt crisis. Reduced risk appetite,
reflected not only by lower risk measures (see Market Risk section below) but also the largest decline in notional derivatives contracts on record, suppressed trading revenues.
The decline in revenues occurred across asset classes, led by interest rate and foreign exchange (FX) revenues
which together decreased 54%, or $2.5 billion, to $2.2 billion. Interest rate and FX trading are closely aligned,
as dealers often use interest rate contracts to hedge FX risk. Therefore it is useful to view these categories together. Credit trading revenues fell 89%, or $1.6 billion, to $193 million, while equity revenues fell 108%, or
$1.6 billion, to a loss of $119 million.
Valuation adjustments for derivatives receivables and payables, which are not part of core trading revenues but
nevertheless are accounted for as trading revenues, were not a material factor in bank trading revenues in the fourth quarter of 2011.
Commercial Bank Trading Revenue
Note: 3Q revenues revised due to a call report restatement.
Bank Trading Revenue
$ in millions 4Q11 3Q11
Interest Rate 253 2,125 (1,873) -88% 1,469 (1,216) -83%
Foreign Exchange 1,940 2,595 (655) -25% 1,905 35 2%
Equity (119) 1,442 (1,561) -108% 338 (457) -135%
Commodity & Other 258 558 (300) -54% 252 6 2%
Credit 193 1,764 (1,571) -89% (485) 678 140%
Total Trading Revenues 2,525 8,484 (5,959) -70% 3,479 (954) -27%
% Change
4Q11 vs.
4Q10
% Change
4Q11 vs.
3Q11
Change
4Q11 vs.
3Q11 4Q10
Change
4Q11 vs.
4Q10
4Q11
Avg Hi Low Avg Hi Low
Interest Rate 253 167 1,367 9,099 (3,420) 2,181 4,587 145
Foreign Exchange 1,940 1,857 1,497 4,261 (1,535) 1,768 4,261 (1,047)
Equity (119) 243 405 1,829 (1,229) 607 1,442 (119)
Commodity & Other 258 96 159 789 (320) 257 558 (25)
Credit* 193 N/A N/A 2,707 (11,780) 1,225 2,707 (485)
Total Trading Revenues 2,525 6,037
*Credit trading revenues became reportable in 1Q07. Highs and lows are for available quarters only.
Past 8 QuartersALL Quarters Since Q4 1996Bank Trading Revenue
$ in millions
Avg Past
12 Q4's

3
Note: Beginning 1Q07, credit exposures are broken out as a separate category. 3Q revenues revised due to a call report restatement. Data Source: Call Reports.
Annual Bank Trading Revenue
Insured U.S. commercial banks reported full-year 2011 revenues of $25.8 billion, $3.3 billion higher (14%) than in 2010. Trading revenues for 2011 were a record, 14% higher than the previous record of $22.6 billion in
2009. Strong trading revenues in the first half of 2011 offset weaker performance in the second half of the year. Trading revenues in 2011 were higher across market factors. Interest rate and FX revenues together
increased 7%, or $1.1 billion, to $16.3 billion. Revenues from equity, commodity and credit contracts all
exhibited substantial increases.
$253
$1,940
$(119)
$258 $193
$2,525 $2,125 $2,595
$1,442
$558
$1,764
$8,484
$1,469
$1,905
$338 $252
$(485)
$3,479
$(1,000)
$-
$1,000
$2,000
$3,000
$4,000
$5,000
$6,000
$7,000
$8,000
$9,000
Interest Rate Foreign Exchange Equity Commodity & Other Credit Total
($ m
illi
on
s)
Quarterly Bank Trading Revenues
4Q11 3Q11 4Q10
Bank Trading Revenue
$ in millions 2011 2010
Interest Rate 11,285 6,162 5,123 83% 14,470 (8,307) -57%
Foreign Exchange 5,061 9,081 (4,020) -44% 5,595 3,486 62%
Equity 2,802 2,051 750 37% 1,061 991 93%
Commodity & Other 1,434 618 816 132% 1,460 (842) -58%
Credit 5,193 4,605 588 13% 6 4,599 75324%
Total Trading Revenues 25,776 22,518 3,258 14% 22,592 (74) 0%
Change
2011 vs.
2010
% Change
2011 vs.
2010 2009
Change
2010 vs.
2009
% Change
2010 vs.
2009

4
Holding Company Trading Revenues2
To get a more complete picture of trading revenues in the banking system, it is useful to consider consolidated
holding company trading performance. As illustrated in the table below, consolidated holding company trading revenues of $5.1 billion in the fourth quarter of 2011 were 42% lower than revised third quarter revenues, and
32% lower ($2.4 billion) than the fourth quarter of 2010. Bank holding companies originally reported trading
revenues of $14.0 billion in the third quarter. The significant revision reflects the same restatement as discussed above for insured commercial banks, related to the reporting of results from hedges of mortgage
servicing assets. Holding company trading revenues faced the same headwinds as did insured commercial banks, with seasonally soft client demand made worse by global macro uncertainties. Net valuation
adjustments for derivatives receivables and payables, which are included in trading revenue totals, were a material positive contributor to reported trading revenues.
Note: 3Q revenues revised due to a Y-9 restatement.
Prior to the financial crisis, bank trading revenues typically ranged from 60-80% of consolidated holding company trading revenues. Since the financial crisis, and the adoption of bank charters by the former
investment banks, the percentage of bank trading revenues to consolidated company revenues has fallen into a range of 30-50%. This decline reflects the significant amount of the trading activity by the former investment
2 The OCC’s Quarterly Report on Bank Trading and Derivatives Activities focuses on the activity and performance of insured commercial
banks. Discussion of consolidated bank holding company activity and performance is limited to this section, as well as the data in Table 2 and Graph 5D.
11,285
5,061
2,802
1,434
5,193
$6,162
$9,081
$2,051
$618
$4,605
0
2,000
4,000
6,000
8,000
10,000
12,000
Interest Rate Foreign Exchange Equity Commodity & Other Credit
($ m
illi
on
s)
2011 versus 2010 Bank Trading Revenues
2011 2010
Holding Co. Trading Revenue
$ in millions 4Q11 3Q11
Interest Rate 324 1,466 (1,142) -78% (1,595) 1,919 120%
Foreign Exchange 3,034 5,160 (2,127) -41% 4,194 (1,160) -28%
Equity 3,047 (2,673) 5,721 214% 3,035 12 0%
Commodity & Other 1,646 2,141 (495) -23% 1,622 24 1%
Credit (2,912) 2,792 (5,704) -204% 271 (3,183) -1176%
Total HC Trading Revenues 5,139 8,885 (3,747) -42% 7,526 (2,387) -32%
% Change
4Q11 vs.
4Q10
Change
4Q11 vs.
3Q11
% Change
4Q11 vs.
3Q11 4Q10
Change
4Q11 vs.
4Q10

5
banks that, while included in holding company results, remains outside the insured commercial bank. More
generally, insured commercial banks have more limited legal authorities than do their holding companies, particularly in commodity and equity products.
In the fourth quarter, bank trading revenues represented 49% of consolidated company trading revenues,
compared to 95% in the third quarter, and 43% in the second quarter. Third quarter holding company trading
revenues were depressed by equity trading revenues, as banking companies sustained $2.7 billion of losses, compared to $3.0 billion in revenues in the fourth quarter.
Annual Holding Company Trading Revenue
Full-year 2011 trading revenues for banking companies of $51.8 billion fell 15%, or $9.2 billion, from 2010. The
most significant decrease came from credit, where revenues declined $11.7 billion (54%) to $9.8 billion. During
the financial crisis, some dealer banks incurred very large losses on certain illiquid credit assets. As the economy recovered, dealers recorded gains as prices on these legacy assets improved. Because legacy assets
were largely held in the holding company, the impact on trading revenues over the past several years is more pronounced at the bank holding company than at the insured commercial bank. The relative absence of these
write-ups in 2011, compared to 2010, made it challenging for bank holding companies to achieve the same level
of trading revenues. Equity revenues declined 25%, or $3.6 billion, to $10.9 billion. Offsetting these declines, combined interest rate and FX revenues increased $3.7 billion, or 19%, to $23.2 billion.
Holding Company Revenue
$ in millions 2011 2010
Interest Rate 13,160 4,962 8,198 165% 23,998 (19,036) -79%
Foreign Exchange 10,058 14,554 (4,496) -31% 11,457 3,097 27%
Equity 10,894 14,542 (3,648) -25% 17,389 (2,848) -16%
Commodity & Other 7,906 5,486 2,420 44% 11,000 (5,515) -50%
Credit 9,761 21,415 (11,655) -54% 4,578 16,838 368%
Total Trading Revenues 51,778 60,959 (9,181) -15% 68,422 (7,463) -11%
Change
2011 vs.
2010
% Change
2011 vs.
2010 2009
Change
2010 vs.
2009
% Change
2010 vs.
2009
13,160
10,058 10,894
7,906
9,761
4,962
14,554 14,542
5,486
21,415
0
5,000
10,000
15,000
20,000
25,000
Interest Rate Foreign Exchange Equity Commodity & Other Credit
($ m
illi
on
s)
2011 versus 2010 Holding Company Revenues
2011 2010

6
Credit Risk Credit risk is a significant risk in bank derivatives trading activities. The notional amount of a derivative contract
is a reference amount from which contractual payments will be derived, but it is generally not an amount at risk. The credit risk in a derivative contract is a function of a number of variables, such as whether
counterparties exchange notional principal, the volatility of the underlying market factors (interest rate,
currency, commodity, equity or corporate reference entity), the maturity and liquidity of the contract, and the creditworthiness of the counterparty.
Credit risk in derivatives differs from credit risk in loans due to the more uncertain nature of the potential credit
exposure. With a funded loan, the amount at risk is the amount advanced to the borrower. The credit risk is
unilateral; the bank faces the credit exposure of the borrower. However, in most derivatives transactions, such as swaps (which make up the bulk of bank derivatives contracts), the credit exposure is bilateral. Each party to
the contract may (and, if the contract has a long enough tenor, probably will) have a current credit exposure to the other party at various points in time over the contract’s life. Moreover, because the credit exposure is a
function of movements in market factors, banks do not know, and can only estimate, how much the value of the derivative contract might be at various points of time in the future.
The first step to measuring credit exposure in derivative contracts involves identifying those contracts where a bank would lose value if the counterparty to a contract defaulted today. The total of all contracts with positive
value (i.e., derivatives receivables) to the bank is the gross positive fair value (GPFV) and represents an initial measurement of credit exposure. The total of all contracts with negative value (i.e., derivatives payables) to
the bank is the gross negative fair value (GNFV) and represents a measurement of the exposure the bank poses
to its counterparties.
Gross positive fair values (i.e., derivatives receivables) decreased 8%, or $493 billion, to $5.5 trillion in the
fourth quarter. Receivables from interest rate contracts, which make up 81% of gross derivatives receivables
(and hence are the dominant source of credit exposure), decreased 5%, or $258 billion, notwithstanding very limited changes in interest rates during the quarter. Receivables from credit, FX, equity, and commodity
contracts all had significantly larger percentage declines than receivables from interest rate contracts. Because banks hedge the market risk of their derivatives portfolios, the decrease in gross positive fair values
was offset by a similar decrease in gross negative fair values (i.e., derivatives payables). Derivatives payables
decreased 8%, or $471 billion, to $5.4 trillion, with payables declining across asset classes, consistent with the decline in receivables on those same asset classes.
For a portfolio of contracts with a single counterparty where the bank has a legally enforceable bilateral netting
agreement, contracts with negative values may be used to offset contracts with positive values. This process
generates a “net” current credit exposure (NCCE), as shown in the example below:
Counterparty A Portfolio # of
Contracts Value of Contracts Credit Measure/Metric
Contracts With Positive Value
6 $500 Gross Positive Fair Value
Contracts With Negative Value
4 $350 Gross Negative Fair Value
Total Contracts 10 $150 Net Current Credit Exposure (NCCE) to Counterparty A
$ in billions
4Q11 3Q11 Change %Change 4Q11 3Q11 Change %Change
Interest Rates 4,478 4,735 (258) -5% 4,388 4,642 (254) -5%
FX 503 636 (133) -21% 477 603 (126) -21%
Equity 77 93 (17) -18% 75 87 (12) -14%
Commodity 53 66 (12) -19% 55 65 (10) -16%
Credit 418 490 (72) -15% 404 473 (69) -15%
Total 5,528 6,021 (493) -8% 5,400 5,871 (471) -8%
Gross Negative Fair Values Gross Positive Fair Values
7
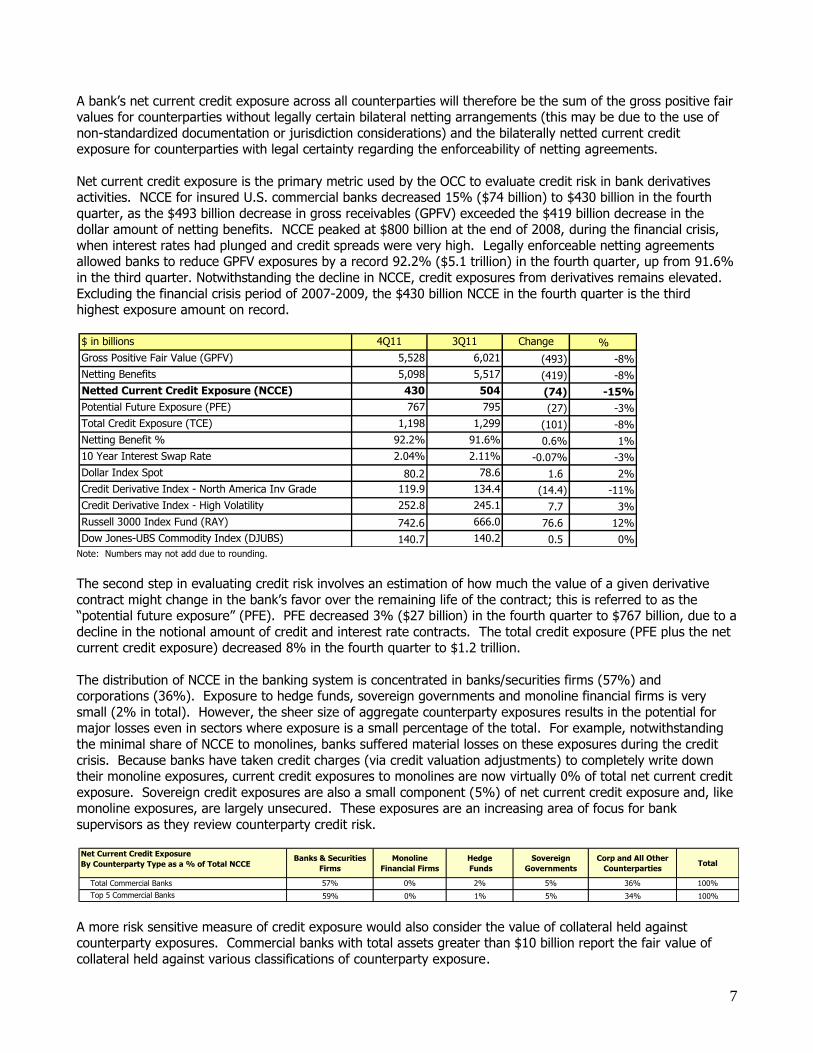
A bank’s net current credit exposure across all counterparties will therefore be the sum of the gross positive fair values for counterparties without legally certain bilateral netting arrangements (this may be due to the use of
non-standardized documentation or jurisdiction considerations) and the bilaterally netted current credit exposure for counterparties with legal certainty regarding the enforceability of netting agreements.
Net current credit exposure is the primary metric used by the OCC to evaluate credit risk in bank derivatives activities. NCCE for insured U.S. commercial banks decreased 15% ($74 billion) to $430 billion in the fourth
quarter, as the $493 billion decrease in gross receivables (GPFV) exceeded the $419 billion decrease in the dollar amount of netting benefits. NCCE peaked at $800 billion at the end of 2008, during the financial crisis,
when interest rates had plunged and credit spreads were very high. Legally enforceable netting agreements allowed banks to reduce GPFV exposures by a record 92.2% ($5.1 trillion) in the fourth quarter, up from 91.6%
in the third quarter. Notwithstanding the decline in NCCE, credit exposures from derivatives remains elevated.
Excluding the financial crisis period of 2007-2009, the $430 billion NCCE in the fourth quarter is the third highest exposure amount on record.
Note: Numbers may not add due to rounding.
The second step in evaluating credit risk involves an estimation of how much the value of a given derivative
contract might change in the bank’s favor over the remaining life of the contract; this is referred to as the “potential future exposure” (PFE). PFE decreased 3% ($27 billion) in the fourth quarter to $767 billion, due to a
decline in the notional amount of credit and interest rate contracts. The total credit exposure (PFE plus the net current credit exposure) decreased 8% in the fourth quarter to $1.2 trillion.
The distribution of NCCE in the banking system is concentrated in banks/securities firms (57%) and corporations (36%). Exposure to hedge funds, sovereign governments and monoline financial firms is very
small (2% in total). However, the sheer size of aggregate counterparty exposures results in the potential for major losses even in sectors where exposure is a small percentage of the total. For example, notwithstanding
the minimal share of NCCE to monolines, banks suffered material losses on these exposures during the credit
crisis. Because banks have taken credit charges (via credit valuation adjustments) to completely write down their monoline exposures, current credit exposures to monolines are now virtually 0% of total net current credit
exposure. Sovereign credit exposures are also a small component (5%) of net current credit exposure and, like monoline exposures, are largely unsecured. These exposures are an increasing area of focus for bank
supervisors as they review counterparty credit risk.
A more risk sensitive measure of credit exposure would also consider the value of collateral held against counterparty exposures. Commercial banks with total assets greater than $10 billion report the fair value of
collateral held against various classifications of counterparty exposure.
$ in billions 4Q11 3Q11 Change %
Gross Positive Fair Value (GPFV) 5,528 6,021 (493) -8%
Netting Benefits 5,098 5,517 (419) -8%
Netted Current Credit Exposure (NCCE) 430 504 (74) -15%
Potential Future Exposure (PFE) 767 795 (27) -3%
Total Credit Exposure (TCE) 1,198 1,299 (101) -8%
Netting Benefit % 92.2% 91.6% 0.6% 1%
10 Year Interest Swap Rate 2.04% 2.11% -0.07% -3%
Dollar Index Spot 80.2 78.6 1.6 2%
Credit Derivative Index - North America Inv Grade 119.9 134.4 (14.4) -11%
Credit Derivative Index - High Volatility 252.8 245.1 7.7 3%
Russell 3000 Index Fund (RAY) 742.6 666.0 76.6 12%
Dow Jones-UBS Commodity Index (DJUBS) 140.7 140.2 0.5 0%
Net Current Credit Exposure
By Counterparty Type as a % of Total NCCEBanks & Securities
Firms
Monoline
Financial Firms
Hedge
Funds
Sovereign
Governments
Corp and All Other
CounterpartiesTotal
Total Commercial Banks 57% 0% 2% 5% 36% 100%
Top 5 Commercial Banks 59% 0% 1% 5% 34% 100%

8
Reporting banks held collateral against 66% of total NCCE at the end of the fourth quarter, up from 64% in the
third quarter of 2011. Credit exposures to banks/securities firms and hedge funds are well secured. Banks held collateral against 87% of their current exposure to banks and securities firms, up from 86% in the third quarter.
Collateral held against hedge fund exposures increased to 245% in the fourth quarter, from 179% in the third quarter. The collateral coverage of hedge fund exposures had declined during the third quarter, as hedge funds
were increasingly reluctant to leave idle balances at their banks given global financial uncertainties. Coverage
of hedge fund exposures at U.S. insured banks rebounded to more historical levels in the fourth quarter, as concerns about the health of the global banking system focused more heavily on European institutions. Hedge
fund exposures have always been very well secured, because banks take “initial margin” on transactions with hedge funds, in addition to fully securing any current credit exposure. Collateral coverage of corporate,
monoline and sovereign exposures is much less than for financial institutions and hedge funds.
Collateral quality held by banks is very high and liquid, with 80.3% held in cash (both U.S. dollar and non-dollar), and an additional 9% held in U.S. Treasuries and government agencies.
Key credit performance metrics for derivatives receivables improved in the fourth quarter, with fewer charge-
offs and lower volumes of past due contracts. The fair value of derivatives contracts past due 30 days or more decreased 52% to $37 million. Past-due derivative contracts represent 0.01% of NCCE. Banks charged-off $69
million in derivatives receivables in the fourth quarter, down from $89 million in the third quarter. In the fourth quarter, 23 banks reported charge-offs of derivatives exposures, up from 22 in the third quarter. Charge-offs in
the fourth quarter of 2011 represented 0.02% of the net current credit exposure from derivative contracts, the
same as in the third quarter. [See Graph 5C.] For comparison purposes, Commercial and Industrial (C&I) loan net charge-offs increased $35 million, or 2%, to $2.3 billion, in the fourth quarter. Net C&I charge-offs were
0.19% of total C&I loans in the fourth quarter, the same as in the third quarter.
The level of charge-offs of derivatives credit exposures is typically much less than for C&I exposures. Two
factors account for the historically favorable charge-off performance of derivatives. First, the credit quality of the typical derivatives counterparty is higher than the credit quality of the typical C&I borrower. Second, most
of the large credit exposures from derivatives, whether from other dealers, large non-dealer banks, or hedge funds are collateralized daily, typically by cash and/or government securities.
Market Risk
Banks control market risk in trading operations primarily by establishing limits against potential losses. Value-at-Risk (VaR) is a statistical measure that banks use to quantify the maximum expected loss, over a specified
horizon and at a certain confidence level, in normal markets. It is important to emphasize that VaR is not the maximum potential loss; it provides a loss estimate at a specified confidence level. A VaR of $50 million at 99%
confidence measured over one trading day, for example, indicates that a trading loss of greater than $50 million
in the next day on that portfolio should occur only once in every 100 trading days under normal market conditions. Since VaR does not measure the maximum potential loss, banks stress test trading portfolios to
assess the potential for loss beyond the VaR measure. Banks and supervisors have been working to expand the use of stress analyses to complement the VaR risk measurement process that is typically used when assessing a
bank’s exposure to market risk.
FV of Collateral to Net Current Credit
Exposure Banks & Securities
Firms
Monoline
Financial Firms
Hedge
Funds
Sovereign
Governments
Corp and All Other
Counterparties
Overall
FV/NCCE
Total Commercial Banks 87% 6% 245% 17% 31% 66%
Fair Value of Collateral Cash
U.S. Dollar
Cash
Other
U.S. Treas
Securities
U.S. Gov't
Agency
Corp
Bonds
Equity
Securities
All Other
Collateral
Total
Collateral Compostion (%) 48.2% 32.1% 2.7% 6.3% 0.5% 0.8% 9.6% 100.0%
9
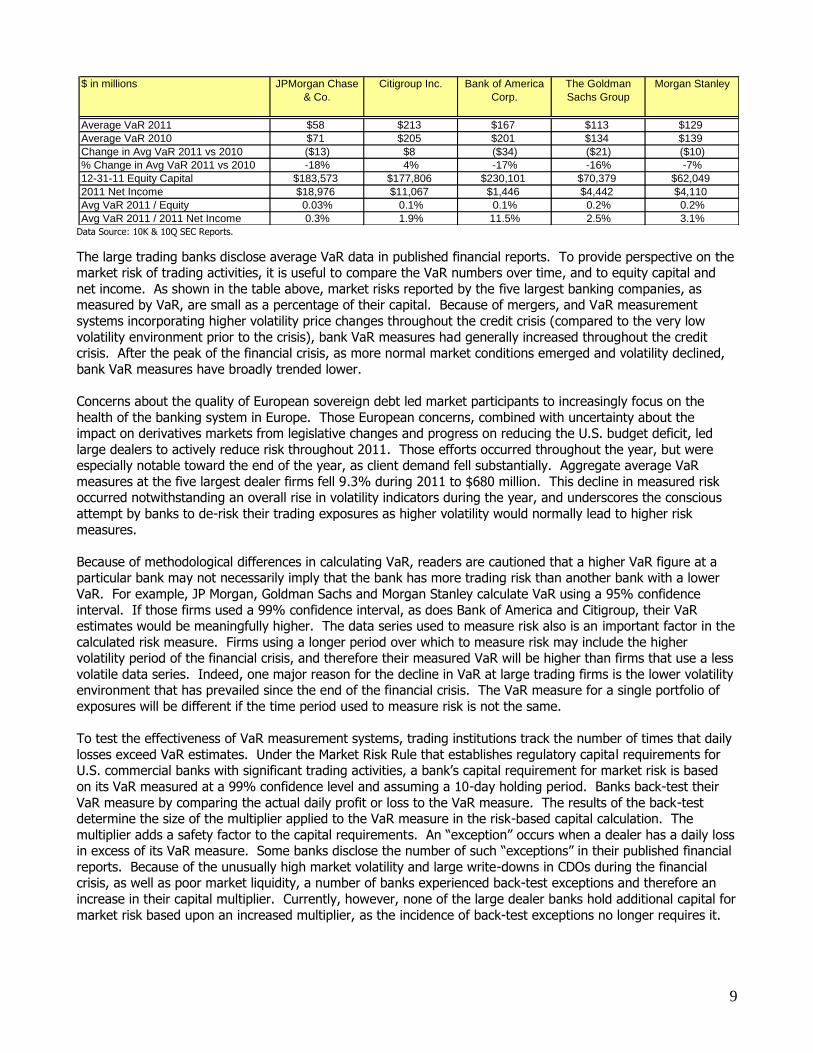
Data Source: 10K & 10Q SEC Reports.
The large trading banks disclose average VaR data in published financial reports. To provide perspective on the market risk of trading activities, it is useful to compare the VaR numbers over time, and to equity capital and
net income. As shown in the table above, market risks reported by the five largest banking companies, as measured by VaR, are small as a percentage of their capital. Because of mergers, and VaR measurement
systems incorporating higher volatility price changes throughout the credit crisis (compared to the very low
volatility environment prior to the crisis), bank VaR measures had generally increased throughout the credit crisis. After the peak of the financial crisis, as more normal market conditions emerged and volatility declined,
bank VaR measures have broadly trended lower.
Concerns about the quality of European sovereign debt led market participants to increasingly focus on the
health of the banking system in Europe. Those European concerns, combined with uncertainty about the impact on derivatives markets from legislative changes and progress on reducing the U.S. budget deficit, led
large dealers to actively reduce risk throughout 2011. Those efforts occurred throughout the year, but were especially notable toward the end of the year, as client demand fell substantially. Aggregate average VaR
measures at the five largest dealer firms fell 9.3% during 2011 to $680 million. This decline in measured risk occurred notwithstanding an overall rise in volatility indicators during the year, and underscores the conscious
attempt by banks to de-risk their trading exposures as higher volatility would normally lead to higher risk
measures.
Because of methodological differences in calculating VaR, readers are cautioned that a higher VaR figure at a particular bank may not necessarily imply that the bank has more trading risk than another bank with a lower
VaR. For example, JP Morgan, Goldman Sachs and Morgan Stanley calculate VaR using a 95% confidence
interval. If those firms used a 99% confidence interval, as does Bank of America and Citigroup, their VaR estimates would be meaningfully higher. The data series used to measure risk also is an important factor in the
calculated risk measure. Firms using a longer period over which to measure risk may include the higher volatility period of the financial crisis, and therefore their measured VaR will be higher than firms that use a less
volatile data series. Indeed, one major reason for the decline in VaR at large trading firms is the lower volatility environment that has prevailed since the end of the financial crisis. The VaR measure for a single portfolio of
exposures will be different if the time period used to measure risk is not the same.
To test the effectiveness of VaR measurement systems, trading institutions track the number of times that daily
losses exceed VaR estimates. Under the Market Risk Rule that establishes regulatory capital requirements for U.S. commercial banks with significant trading activities, a bank’s capital requirement for market risk is based
on its VaR measured at a 99% confidence level and assuming a 10-day holding period. Banks back-test their
VaR measure by comparing the actual daily profit or loss to the VaR measure. The results of the back-test determine the size of the multiplier applied to the VaR measure in the risk-based capital calculation. The
multiplier adds a safety factor to the capital requirements. An “exception” occurs when a dealer has a daily loss in excess of its VaR measure. Some banks disclose the number of such “exceptions” in their published financial
reports. Because of the unusually high market volatility and large write-downs in CDOs during the financial crisis, as well as poor market liquidity, a number of banks experienced back-test exceptions and therefore an
increase in their capital multiplier. Currently, however, none of the large dealer banks hold additional capital for
market risk based upon an increased multiplier, as the incidence of back-test exceptions no longer requires it.
$ in millions JPMorgan Chase
& Co.
Citigroup Inc. Bank of America
Corp.
The Goldman
Sachs Group
Morgan Stanley
Average VaR 2011 $58 $213 $167 $113 $129
Average VaR 2010 $71 $205 $201 $134 $139
Change in Avg VaR 2011 vs 2010 ($13) $8 ($34) ($21) ($10)
% Change in Avg VaR 2011 vs 2010 -18% 4% -17% -16% -7%
12-31-11 Equity Capital $183,573 $177,806 $230,101 $70,379 $62,049
2011 Net Income $18,976 $11,067 $1,446 $4,442 $4,110
Avg VaR 2011 / Equity 0.03% 0.1% 0.1% 0.2% 0.2%
Avg VaR 2011 / 2011 Net Income 0.3% 1.9% 11.5% 2.5% 3.1%

10
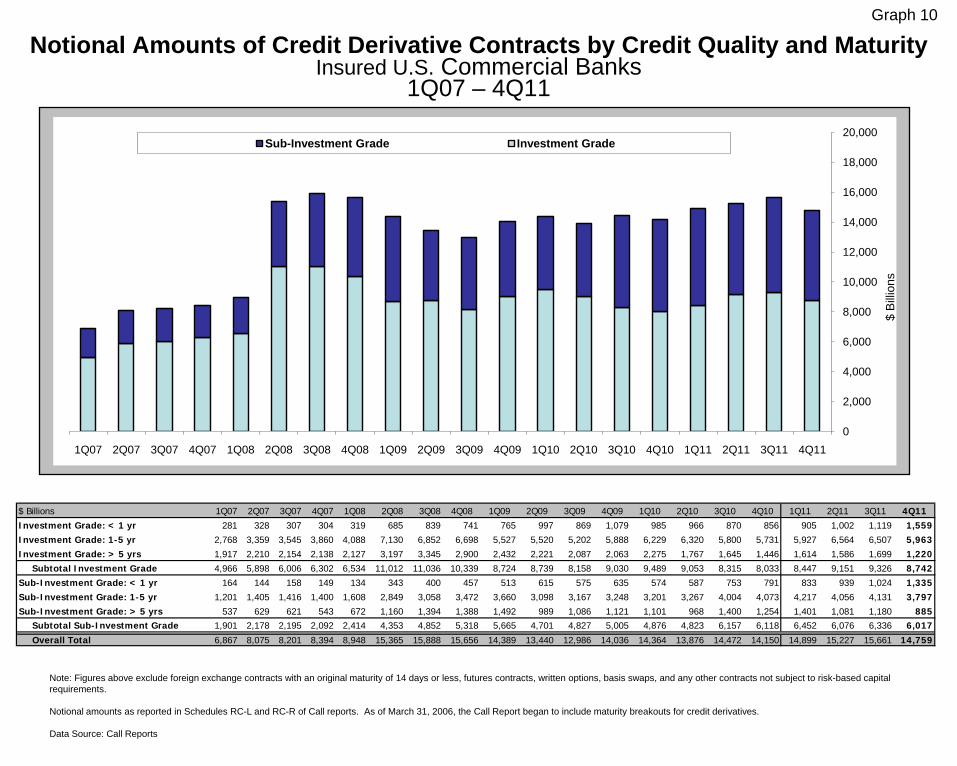
Credit Derivatives Credit derivatives decreased 5.8% in the fourth quarter to $14.8 trillion. Credit derivatives outstanding remain
below the peak of $16.4 trillion in the first quarter of 2008. From year-end 2003 to 2008, credit derivative contracts grew at a 100% compounded annual growth rate. Industry efforts to eliminate offsetting trades
(“trade compression”), as well as reduced demand for structured products, has led to a decline in credit
derivative notionals. Tables 11 and 12 provide detail on individual bank holdings of credit derivatives by product and maturity, as well as the credit quality of the underlying reference entities. As shown in the first
chart below, credit default swaps are the dominant product at 97% of all credit derivatives notionals. [See charts below, Tables 11 and 12, and Graph 10.]
Note: Beginning 1Q07, credit exposures are broken out as a separate category. Data Source: Call Reports.
Contracts referencing investment grade entities with maturities from 1-5 years represent the largest segment of
the market at 40% of all credit derivatives notionals, down from 42% at end of the third quarter of 2011. Contracts of all tenors that reference investment grade entities are 59% of the market, down from 60% in the
third quarter. [See chart on right above.]
The notional amount for the 34 insured U.S. commercial banks that sold credit protection (i.e., assumed credit
risk) was $7.3 trillion, down 6% ($436 billion) from the third quarter. The notional amount for the 31 banks that purchased credit protection (i.e., hedged credit risk) was $7.5 trillion, a decrease of 6% ($466 billion).
[See Tables 1, 3, 11 and 12 and Graphs 2, 3 and 4.]
Notionals Changes in notional volumes are generally reasonable reflections of business activity, and therefore can provide
insight into potential revenue and operational issues. However, the notional amount of derivatives contracts does not provide a useful measure of either market or credit risks.
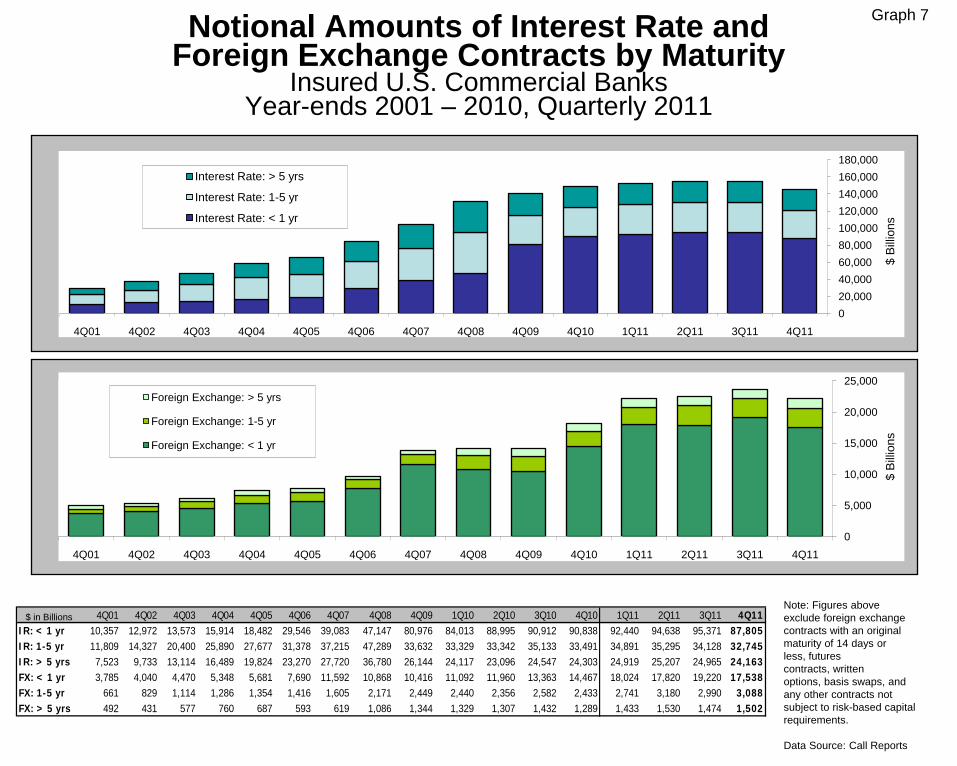
The notional amount of derivatives contracts held by insured U.S. commercial banks in the fourth quarter fell by $17.2 trillion (6.9%) to $230.8 trillion from the third quarter. Notionals had also fallen 0.6% during the third
quarter. The declines in notionals in the third and fourth quarter mark the first time notionals have fallen in consecutive quarters. The fourth quarter decline in notionals, the largest dollar decline (and third largest
percentage decline) on record, reflects ongoing trade compression activities, in which dealers terminate trades among each other, as well as substantially reduced client activity toward the end of the year. The decline in
client activity reflects not only seasonal trends but also broad-based uncertainty associated with a range of
issues, most notably the continuing focus on European sovereign debt. The notional amount of derivatives at year-end 2011 is 0.2% lower than a year ago, the first time notionals have fallen on an annual basis.
CREDIT
DEFAULT
SWAPS96.7%
TOTAL
RETURN
SWAPS0.6%
CREDIT
OPTIONS
1.1%
OTHER CREDIT
DERIVS
1.6%
4Q11
Credit Derivatives Composition by Product Type
Investment Grade: < 1 yr
11%
Investment Grade: 1-5 yr
40%
Investment Grade: > 5 yrs
8%Sub-Investment Grade: < 1 yr
9%
Sub-Investment Grade: 1-5 yr
26%
Sub Investment Grade: > 5 yrs
6%
4Q11
Credit Derivatives Composition by Maturity & Quality of Underlying Reference Entity

11
The five banks with the most derivatives activity hold 96% of all derivatives, while the largest 25 banks account
for nearly 100% of all contracts. [See Tables 3, 5 and Graph 4.]
Note: Beginning 1Q07, credit exposures are broken out as a separate category.
Data Source: Call Reports.
Interest rate contracts comprise 81% of total derivatives. FX and credit derivatives are 11% and 6.4%, respectively, of total notionals.
Swap contracts, at 63% of total notional derivatives, unchanged from the third quarter, continue to represent the bulk of derivative contracts.
Interest Rate Contracts
81.2%
Foreign Exchange Contracts
11.0%
Equity Contracts
0.7%
Commodity/Other0.7%
Credit Derivatives
6.4%
Percentage Total Notionals by Type - 4Q11
Interest Rate Contracts
81.5%
Foreign Exchange Contracts
10.8%
Equity Contracts
0.7%
Commodity/Other0.6%
Credit Derivatives
6.3%
Percentage Total Notionals by Type - 3Q11
$ in billions
4Q11 3Q11 $ Change % Change % of Total
Derivatives
Interest Rate Contracts 187,509 202,107 (14,598) -7% 81%
Foreign Exchange Contracts 25,436 26,795 (1,359) -5% 11%
Equity Contracts 1,589 1,786 (197) -11% 1%
Commodity/Other 1,501 1,602 (101) -6% 1%
Credit Derivatives 14,759 15,661 (902) -6% 6%
Total 230,794 247,952 (17,157) -7% 100%
Note: Numbers may not add due to rounding.
$ in billions
4Q11 3Q11 $ Change % Change % of Total
Derivatives
Futures & Forwards 37,248 39,791 (2,543) -6% 16%
Swaps 146,253 156,132 (9,879) -6% 63%
Options 32,534 36,368 (3,833) -11% 14%
Credit Derivatives 14,759 15,661 (902) -6% 6%
Total 230,794 247,952 (17,157) -7% 100%
Note: Numbers may not add due to rounding.

12
GLOSSARY OF TERMS Bilateral Netting: A legally enforceable arrangement between a bank and a counterparty that creates a single
legal obligation covering all included individual contracts. This means that a bank’s receivable or payable, in the event of the default or insolvency of one of the parties, would be the net sum of all positive and negative fair
values of contracts included in the bilateral netting arrangement.
Credit Derivative: A financial contract that allows a party to take, or reduce, credit exposure (generally on a
bond, loan or index). Our derivatives survey includes over-the-counter (OTC) credit derivatives, such as credit default swaps, total return swaps, and credit spread options.
Derivative: A financial contract whose value is derived from the performance of underlying market factors, such as interest rates, currency exchange rates, commodity, credit, and equity prices. Derivative transactions
include a wide assortment of financial contracts including structured debt obligations and deposits, swaps, futures, options, caps, floors, collars, forwards and various combinations thereof.
Gross Negative Fair Value (GNFV): The sum total of the fair values of contracts where the bank owes
money to its counterparties, without taking into account netting. This represents the maximum losses the
bank’s counterparties would incur if the bank defaults and there is no netting of contracts, and no bank collateral was held by the counterparties. Gross negative fair values associated with credit derivatives are
included.
Gross Positive Fair Value (GPFV): The sum total of the fair values of contracts where the bank is owed
money by its counterparties, without taking into account netting. This represents the maximum losses a bank could incur if all its counterparties default and there is no netting of contracts, and the bank holds no
counterparty collateral. Gross positive fair values associated with credit derivatives are included.
Net Current Credit Exposure (NCCE): For a portfolio of derivative contracts, NCCE is the gross positive fair
value of contracts less the dollar amount of netting benefits. On any individual contract, current credit exposure (CCE) is the fair value of the contract if positive, and zero when the fair value is negative or zero. NCCE is also
the net amount owed to banks if all contracts were immediately liquidated.
Notional Amount: The nominal or face amount that is used to calculate payments made on swaps and other risk management products. This amount generally does not change hands and is thus referred to as notional.
Over-the-Counter Derivative Contracts: Privately negotiated derivative contracts that are transacted off organized exchanges.
Potential Future Exposure (PFE): An estimate of what the current credit exposure (CCE) could be over time,
based upon a supervisory formula in the agencies’ risk-based capital rules. PFE is generally determined by
multiplying the notional amount of the contract by a credit conversion factor that is based upon the underlying market factor (e.g., interest rates, commodity prices, equity prices, etc.) and the contract’s remaining maturity.
However, the risk-based capital rules permit banks to adjust the formulaic PFE measure by the “net to gross ratio,” which proxies the risk-reduction benefits attributable to a valid bilateral netting contract. PFE data in this
report uses the amounts upon which banks hold risk-based capital.
Total Credit Exposure (TCE): The sum total of net current credit exposure (NCCE) and potential future
exposure (PFE).
Total Risk-Based Capital: The sum of tier 1 plus tier 2 capital. Tier 1 capital consists of common shareholders’ equity, perpetual preferred shareholders’ equity with noncumulative dividends, retained earnings,
and minority interests in the equity accounts of consolidated subsidiaries. Tier 2 capital consists of
subordinated debt, intermediate-term preferred stock, cumulative and long-term preferred stock, and a portion of a bank’s allowance for loan and lease losses.

0
20
40
60
80
100
120
140
160
180
200
220
240
260
1996 1997 1998 1999 2000 2001 2002 2003 2004 2005 2006 2007 2008 2009 2010 2011
Derivative Notionals by Type of UserInsured U.S. Commercial Banks
Note: Numbers may not add due to rounding. Total derivative notionals are now reported including credit derivatives, for which regulatory reporting does not differentiate between trading and non-trading.
Data Source: Call Reports.
$ Tr
illion
s
Graph 1
Total Notionals
Dealer (Trading)
Credit DerivativesEnd User (Non-Trading)
Q1 Q2 Q3 Q4 Q1 Q2 Q3 Q4 Q1 Q2 Q3 Q4 Q1 Q2 Q3 Q4 Q1 Q2 Q3 Q4 Q1 Q2 Q3 Q4 Q1 Q2 Q3 Q4
Total Derivative Notionals 91.1 96.2 98.8 101.5 110.2 119.2 126.2 131.5 145.8 153.6 173.6 165.6 180.3 182.1 175.8 200.4 202.0 203.5 204.3 212.8 216.5 223.4 234.7 231.2 244.0 249.3 248.0 230.8
Dealer (Trading) 85.5 89.6 91.1 93.0 102.1 110.1 115.3 119.6 131.8 138.1 155.3 147.2 161.1 163.9 157.1 181.9 185.1 187.6 189.2 196.8 200.1 207.5 218.1 215.2 225.2 229.8 227.5 210.3
End User (Non-Trading) 2.5 2.5 2.6 2.6 2.6 2.6 3.0 2.8 2.9 2.6 2.8 2.6 2.8 2.8 2.6 2.6 2.3 2.4 2.1 2.0 2.0 2.0 2.1 1.9 3.9 4.3 4.8 5.8
Credit Derivatives 3.1 4.1 5.1 5.8 5.5 6.6 7.9 9.0 11.1 12.9 15.4 15.9 16.4 15.5 16.1 15.9 14.6 13.4 13.0 14.0 14.4 13.9 14.5 14.2 14.9 15.2 15.7 14.8
201120092006 2008 201020072005$ in Trillions

0
40,000
80,000
120,000
160,000
200,000
240,000
280,000
4Q01 4Q02 4Q03 40Q4 4Q05 4Q06 4Q07 4Q08 4Q09 4Q10 1Q11 2Q11 3Q11 4Q11
Credit Derivatives
Options
Swaps
Futures & Fwrds
Derivative Contracts by ProductInsured U.S. Commercial Banks
Year-ends 2001 – 2010, Quarterly 2011
*Notional amount of total: futures, exchange traded options, over the counter options, forwards, and swaps.
Note: Numbers may not add due to rounding.
Data Source: Call Reports
$ B
illion
s
Graph 2
$ in Billions 4Q01 4Q02 4Q03 4Q04 4Q05 4Q06 4Q07 4Q08 4Q09 4Q10 1Q11 2Q11 3Q11 4Q11
Futures & Fwrds 9,313 11,374 11,393 11,373 12,049 14,877 18,967 22,512 26,493 35,709 39,081 41,097 39,791 37,248
Swaps 25,645 32,613 44,083 56,411 64,738 81,328 103,090 131,706 142,011 149,247 152,736 156,054 156,132 146,253
Options 10,032 11,452 14,605 17,750 18,869 26,275 27,728 30,267 30,267 32,075 37,275 36,958 36,368 32,534
Credit Derivatives 395 635 1,001 2,347 5,822 9,019 15,861 15,897 14,036 14,150 14,899 15,227 15,661 14,759
TOTAL* 45,386 56,074 71,082 87,880 101,478 131,499 165,645 200,382 212,808 231,181 243,991 249,337 247,952 230,794

0
40
80
120
160
200
240
280
4Q01 4Q02 4Q03 4Q04 4Q05 4Q06 4Q07 4Q08 4Q09 4Q10 1Q11 2Q11 3Q11 4Q11
$ Tr
illio
ns
Credit Derivatives
Commodities
Equities
Foreign Exch
Interest Rate
Derivative Contracts by TypeInsured U.S. Commercial Banks
Year-ends 2001 – 2010, Quarterly 2011
*Notional amount of total: futures, exchange traded options, over the counter options, forwards, and swaps.
Note: As of 2Q06 equities and commodities types are shown as separate categories. They were previously shown as “Other Derivs.” Numbers may not add due to rounding.
Data Source: Call Reports
81.2%
11.0%
0.7% 0.7%
6.4%
4Q11 Distribution
Interest Rate Foreign Exch Equities
Commodities Credit Derivatives
Graph 3
$ in Billions 4Q01 4Q02 4Q03 4Q04 4Q05 4Q06 4Q07 4Q08 4Q09 4Q10 1Q11 2Q11 3Q11 4Q11
Interest Rate 38,305 48,347 61,856 75,518 84,520 107,415 129,574 164,404 179,555 193,482 199,532 204,620 202,107 187,509
Foreign Exch 5,736 6,076 7,182 8,607 9,282 11,900 16,614 16,824 16,553 20,990 26,712 26,483 26,795 25,436
Equities 770 783 829 1,120 1,255 2,271 2,522 2,207 1,685 1,364 1,471 1,654 1,786 1,589
Commodities 179 233 214 289 598 893 1,073 1,050 979 1,195 1,377 1,352 1,602 1,501
Credit Derivatives 395 635 1,001 2,347 5,822 9,019 15,861 15,897 14,036 14,150 14,899 15,227 15,661 14,759
TOTAL* 45,385 56,075 71,082 87,880 101,477 131,499 165,645 200,382 212,808 231,181 243,991 249,337 247,952 230,794

$ % $ % $ %Top 5 Bks Tot Derivs All Other Bks Tot Derivs All Bks Tot Derivs
Futures & Fwrds 34,449 14.9 2,798 1.2 37,248 16.1Swaps 140,449 60.9 5,804 2.5 146,253 63.4Options 31,377 13.6 1,158 0.5 32,534 14.1Credit Derivatives 14,628 6.3 131 0.1 14,759 6.4TOTAL* 220,904 95.7 9,891 4.3 230,794 100.0
0 50 100 150 200 250
Futures & Forwards
Swaps
Options
Credit Derivatives
TOTAL
$ Trillions
Top 5 Banks All Other Banks
Five Banks Dominate in DerivativesInsured U.S. Commercial Banks, 4Q11
*Notional amount of total: futures, exchange traded options, over the counter options, forwards, and swaps.
Note: In 1Q11, HSBC replaced Wells Fargo as one of the top five commercial banks in derivatives. See Table 1.
Data Source: Call Reports
Graph 4
Concentration of Derivative Contracts
$ in Billions

Percentage of Total Credit Exposure to Risk Based Capital Top 5 Insured U.S. Commercial Banks by Derivative Holdings
1Q09 – 4Q11
0
100
200
300
400
1Q 2Q 3Q 4Q 1Q 2Q 3Q 4Q 1Q 2Q 3Q 4Q
2009 2010 2011
JPMorgan Chase Bank, N.A.
0
50
100
150
200
1Q 2Q 3Q 4Q 1Q 2Q 3Q 4Q 1Q 2Q 3Q 4Q
2009 2010 2011
Bank of America, N.A.
0
50
100
150
200
250
1Q 2Q 3Q 4Q 1Q 2Q 3Q 4Q 1Q 2Q 3Q 4Q
2009 2010 2011
Citibank, N.A.
Note: In 1Q11, HSBC replaced Wells Fargo as one of the top five commercial banks in derivatives. See Table 1.
Beginning in the 2Q09, the methodology to calculate the Credit Risk Exposure to Capital ratio for the Top 5 category was adjusted to a summing methodology.
Data Source: Call Reports
0
200
400
600
800
1,000
1,200
1Q 2Q 3Q 4Q 1Q 2Q 3Q 4Q 1Q 2Q 3Q 4Q
2009 2010 2011
Goldman Sachs Bank USA
% % %
%
Graph 5A
Total Credit Exposure to Risk Based Capital (%)
0
50
100
150
200
250
300
350
400
450
500
1Q 2Q 3Q 4Q 1Q 2Q 3Q 4Q 1Q 2Q 3Q 4Q
2009 2010 2011
HSBC Bank USA, N.A. %
(%)JPMCBank
Bank ofAmerica
Citi-bank
Goldman Sachs Bank
HSBC Top 5 Banks
1Q09 323 169 213 1048 475 2862Q09 283 137 209 921 304 2073Q09 290 135 203 858 213 3114Q09 265 151 180 766 192 2841Q10 266 161 180 672 185 2672Q10 257 162 171 690 183 2933Q10 267 172 194 638 172 2894Q10 265 174 180 629 167 2611Q11 275 182 183 781 168 3182Q11 274 182 203 788 168 3233Q11 285 187 195 801 200 3344Q11 256 176 177 794 179 316

Netting Benefit: Amount of Gross Credit Exposure Eliminated Through Bilateral Netting
Insured U.S. Commercial Banks with Derivatives1Q98 – 4Q11
45
50
55
60
65
70
75
80
85
90
95
Netting Benefit
% N
ettin
g B
enef
it
Graph 5B
*The netting benefit is defined as: $ amount of netting benefits/gross positive fair value.
Data Source: Call Reports
Netting Benefit (%)*1Q98 2Q98 3Q98 4Q98 1Q99 2Q99 3Q99 4Q99 1Q00 2Q00 3Q00 4Q00 1Q01 2Q01 3Q01 4Q01
50.6 54.6 58.9 61.7 61.5 62.9 62.7 60.9 66.8 66.8 65.4 69.3 70.4 71.5 75.5 73.8
1Q02 2Q02 3Q02 4Q02 1Q03 2Q03 3Q03 4Q03 1Q04 2Q04 3Q04 4Q04 1Q05 2Q05 3Q05 4Q05
75.7 76.2 79.9 81.5 81.7 83.3 83.8 81.7 84.2 83.1 84.3 83.7 83.9 86.9 84.7 84.9
1Q06 2Q06 3Q06 4Q06 1Q07 2Q07 3Q07 4Q07 1Q08 2Q08 3Q08 4Q08 1Q09 2Q09 3Q09 4Q09
84.9 85.4 85.5 84.7 85.2 86.4 83.9 84.8 85.6 85.3 84.3 88.7 89.0 88.0 89.7 90.2
1Q10 2Q10 3Q10 4Q10 1Q11 2Q11 3Q11 4Q1191.0 91.9 92.1 91.1 90.4 90.8 91.6 92.2

(0.10)
0.00
0.10
0.20
0.30
0.40
0.50
(50)
150
350
550
750
950
1150
1350
1550
1750
1Q98 1Q99 1Q00 1Q01 1Q02 1Q03 1Q04 1Q05 1Q06 1Q07 1Q08 1Q09 1Q10 1Q11
Charge-offs % NCCE
Quarterly (Charge-Offs)/Recoveries from DerivativesInsured U.S. Commercial Banks with Derivatives
1Q98 – 4Q11
Note:
The figures are for each quarter alone, not year-to-date.
The 1Q11 charge-off figure was adjusted in 3Q11 to reflect an amended Call Report.
Data Source: Call Reports.
% N
ette
d C
urre
nt C
redi
t Exp
osur
e (li
ne)
Graph 5C
Charge-offs in $ m
illions (bars)
1Q98 2Q98 3Q98 4Q98 1Q99 2Q99 3Q99 4Q99 1Q00 2Q00 3Q00 4Q00 1Q01 2Q01 3Q01 4Q01
121.3 72.9 466.4 121.2 58.9 (33.1) 72.1 141.0 0.0 (1.0) (1.0) (3.0) 2.0 (1.0) 107.3 370.0
1Q02 2Q02 3Q02 4Q02 1Q03 2Q03 3Q03 4Q03 1Q04 2Q04 3Q04 4Q04 1Q05 2Q05 3Q05 4Q05
75.8 28.2 59.0 73.7 25.3 29.9 32.3 83.7 46.7 34.9 92.2 5.4 1.3 14.2 23.0 8.3
1Q06 2Q06 3Q06 4Q06 1Q07 2Q07 3Q07 4Q07 1Q08 2Q08 3Q08 4Q08 1Q09 2Q09 3Q09 4Q09
3.6 (7.0) (16.0) (5.8) (2.9) (9.2) 119.4 30.7 14.8 120.0 91.9 846.7 218.1 166.3 213.9 159.3
1Q10 2Q10 3Q10 4Q10 1Q11 2Q11 3Q11 4Q11
103.5 118.6 284.5 111.0 1598.0 71.0 89.0 68.8
$ in Millions
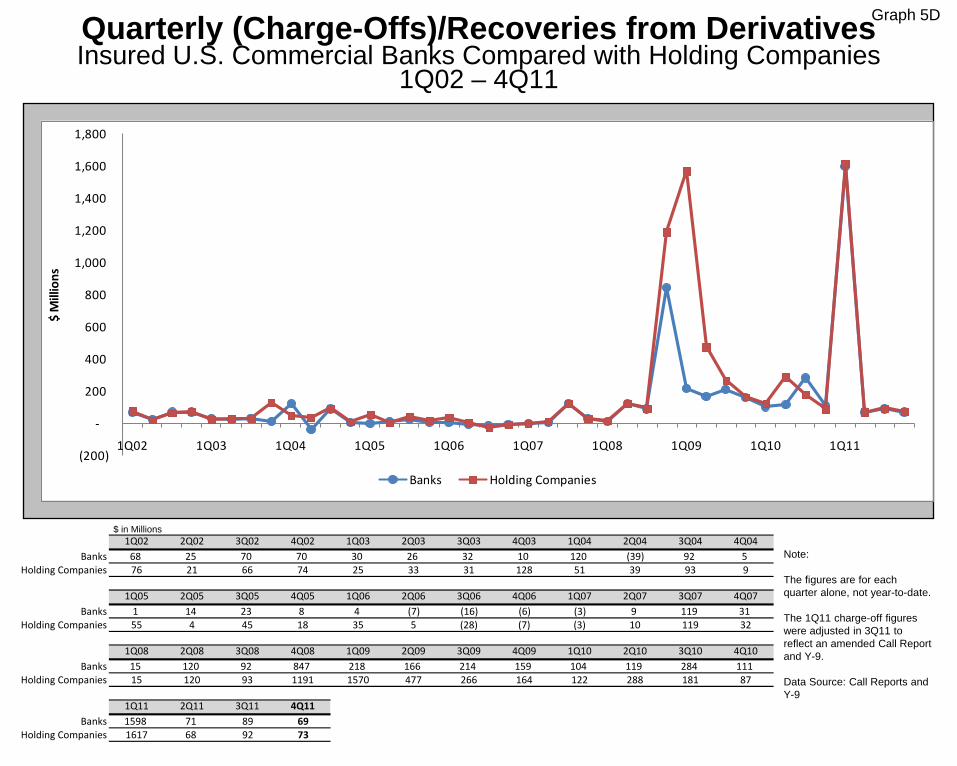
Quarterly (Charge-Offs)/Recoveries from DerivativesInsured U.S. Commercial Banks Compared with Holding Companies
1Q02 – 4Q11
Note:
The figures are for each quarter alone, not year-to-date.
The 1Q11 charge-off figures were adjusted in 3Q11 to reflect an amended Call Report and Y-9.
Data Source: Call Reports and Y-9
Graph 5D
1Q02 2Q02 3Q02 4Q02 1Q03 2Q03 3Q03 4Q03 1Q04 2Q04 3Q04 4Q04Banks 68 25 70 70 30 26 32 10 120 (39) 92 5
Holding Companies 76 21 66 74 25 33 31 128 51 39 93 9
1Q05 2Q05 3Q05 4Q05 1Q06 2Q06 3Q06 4Q06 1Q07 2Q07 3Q07 4Q07Banks 1 14 23 8 4 (7) (16) (6) (3) 9 119 31
Holding Companies 55 4 45 18 35 5 (28) (7) (3) 10 119 32
1Q08 2Q08 3Q08 4Q08 1Q09 2Q09 3Q09 4Q09 1Q10 2Q10 3Q10 4Q10Banks 15 120 92 847 218 166 214 159 104 119 284 111
Holding Companies 15 120 93 1191 1570 477 266 164 122 288 181 87
1Q11 2Q11 3Q11 4Q11Banks 1598 71 89 69
Holding Companies 1617 68 92 73
$ in Millions
(200)
-
200
400
600
800
1,000
1,200
1,400
1,600
1,800
1Q02 1Q03 1Q04 1Q05 1Q06 1Q07 1Q08 1Q09 1Q10 1Q11
$ M
illio
ns
Banks Holding Companies

1Q07 2Q07 3Q07 4Q07 1Q08 2Q08 3Q08 4Q08 1Q09 2Q09 3Q09 4Q09 1Q10 2Q10 3Q10 4Q10 1Q11 2Q11 3Q11 4Q11
Interest Rate 2,413 2,950 2,896 (357) 1,853 1,449 984 (3,420) 9,099 1,108 5,451 (1,188) 333 145 4,215 1,469 4,587 4,320 2,125 253
Foreign Exchange 1,831 1,265 2,005 1,873 2,083 2,096 3,090 4,093 2,437 2,132 (1,535) 2,560 3,962 4,261 (1,047) 1,905 35 491 2,595 1,940
Equity 1,735 1,024 27 205 (15) 183 (954) (1,229) 1,042 (279) 154 144 965 378 371 338 743 736 1,442 (119)
Comdty & Other 175 25 7 88 261 601 342 338 344 281 446 389 297 (25) 94 252 315 304 558 258
Credit 878 883 (2,655) (11,780) (3,461) (2,715) 2,544 (8,958) (3,154) 1,930 1,204 27 2,707 1,840 543 (485) 1,729 1,507 1,764 193
Total Trading Revenue* 7,032 6,146 2,281 (9,970) 721 1,614 6,005 (9,176) 9,768 5,172 5,720 1,932 8,263 6,600 4,176 3,479 7,409 7,357 8,484 2,525
-15,000
-10,000
-5,000
0
5,000
10,000
15,000
1Q07 2Q07 3Q07 4Q07 1Q08 2Q08 3Q08 4Q08 1Q09 2Q09 3Q09 4Q09 1Q10 2Q10 3Q10 4Q10 1Q11 2Q11 3Q11 4Q11
Credit Comdty & Other Equity Foreign Exchange Interest Rate Total Trading Revenue
Quarterly Trading Revenues Cash & Derivative PositionsInsured U.S. Commercial Banks
1Q07 – 4Q11
*The trading revenue figures above are for cash and derivative activities. Revenue figures are for each quarter alone, not year-to-date.
Note: 3Q revenues revised due to a call report restatement.
Numbers may not add due to rounding.
Data Source: Call Reports
Graph 6A
$ in Millions
$ M
illion
s
0
20
40
60
80
1Q 2Q 3Q 4Q 1Q 2Q 3Q 4Q 1Q 2Q 3Q 4Q
2009 2010 2011
Goldman Sachs Bank USA
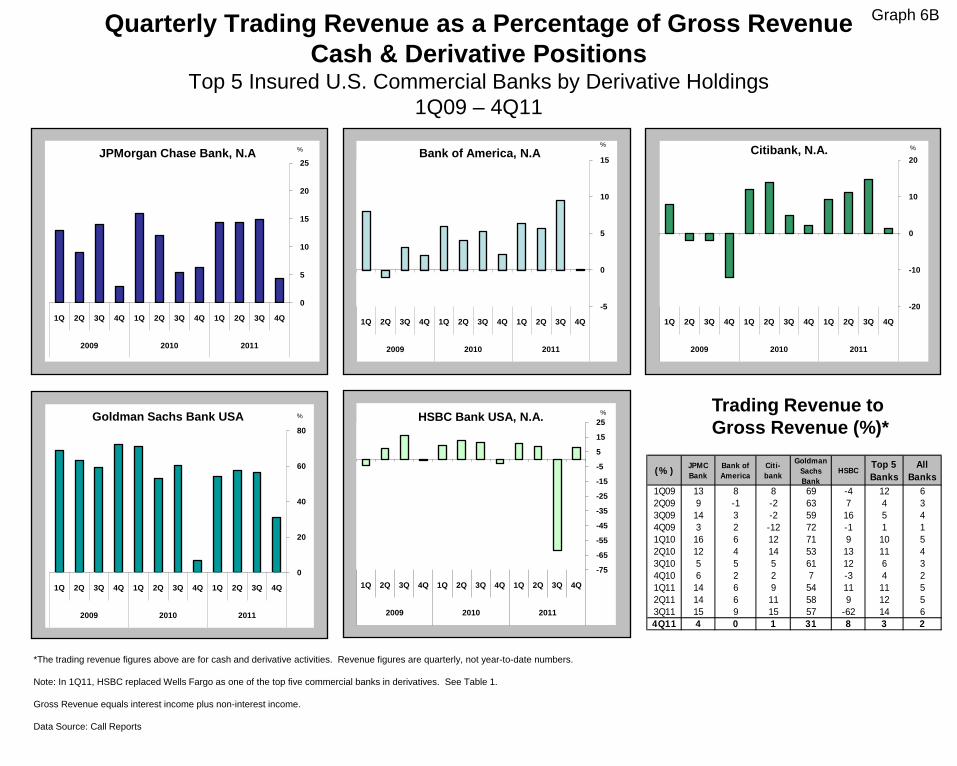
Quarterly Trading Revenue as a Percentage of Gross RevenueCash & Derivative Positions
Top 5 Insured U.S. Commercial Banks by Derivative Holdings1Q09 – 4Q11
0
5
10
15
20
25
1Q 2Q 3Q 4Q 1Q 2Q 3Q 4Q 1Q 2Q 3Q 4Q
2009 2010 2011
JPMorgan Chase Bank, N.A
-5
0
5
10
15
1Q 2Q 3Q 4Q 1Q 2Q 3Q 4Q 1Q 2Q 3Q 4Q
2009 2010 2011
Bank of America, N.A
-20
-10
0
10
20
1Q 2Q 3Q 4Q 1Q 2Q 3Q 4Q 1Q 2Q 3Q 4Q
2009 2010 2011
Citibank, N.A.
*The trading revenue figures above are for cash and derivative activities. Revenue figures are quarterly, not year-to-date numbers.
Note: In 1Q11, HSBC replaced Wells Fargo as one of the top five commercial banks in derivatives. See Table 1.
Gross Revenue equals interest income plus non-interest income.
Data Source: Call Reports
Graph 6B
Trading Revenue toGross Revenue (%)*
%% %
%
-75
-65
-55
-45
-35
-25
-15
-5
5
15
25
1Q 2Q 3Q 4Q 1Q 2Q 3Q 4Q 1Q 2Q 3Q 4Q
2009 2010 2011
HSBC Bank USA, N.A. %
(%) JPMCBank
Bank ofAmerica
Citi-bank
Goldman Sachs Bank
HSBCTop 5 Banks
AllBanks
1Q09 13 8 8 69 -4 12 62Q09 9 -1 -2 63 7 4 33Q09 14 3 -2 59 16 5 44Q09 3 2 -12 72 -1 1 11Q10 16 6 12 71 9 10 52Q10 12 4 14 53 13 11 43Q10 5 5 5 61 12 6 34Q10 6 2 2 7 -3 4 21Q11 14 6 9 54 11 11 52Q11 14 6 11 58 9 12 53Q11 15 9 15 57 -62 14 64Q11 4 0 1 31 8 3 2
0
50,000
100,000
150,000
01Q4 02Q4 03Q4 04Q4 05Q4 06Q4 07Q4 08Q4 09Q4 10Q1
Interest Rate: > 5 yrsInterest Rate: 1-5 yrInterest Rate: < 1 yr
Notional Amounts of Interest Rate and Foreign Exchange Contracts by Maturity
Insured U.S. Commercial BanksYear-ends 2001 – 2010, Quarterly 2011
020,00040,00060,00080,000100,000120,000140,000160,000180,000
4Q01 4Q02 4Q03 4Q04 4Q05 4Q06 4Q07 4Q08 4Q09 4Q10 1Q11 2Q11 3Q11 4Q11
Interest Rate: > 5 yrs
Interest Rate: 1-5 yr
Interest Rate: < 1 yr
Note: Figures above exclude foreign exchange contracts with an original maturity of 14 days or less, futures contracts, written options, basis swaps, and any other contracts not subject to risk-based capital requirements.
Data Source: Call Reports
0
5,000
10,000
15,000
20,000
25,000
4Q01 4Q02 4Q03 4Q04 4Q05 4Q06 4Q07 4Q08 4Q09 4Q10 1Q11 2Q11 3Q11 4Q11
Foreign Exchange: > 5 yrs
Foreign Exchange: 1-5 yr
Foreign Exchange: < 1 yr
Graph 7
$ B
illion
s$
Billi
ons
4Q01 4Q02 4Q03 4Q04 4Q05 4Q06 4Q07 4Q08 4Q09 1Q10 2Q10 3Q10 4Q10 1Q11 2Q11 3Q11 4Q11IR: < 1 yr 10,357 12,972 13,573 15,914 18,482 29,546 39,083 47,147 80,976 84,013 88,995 90,912 90,838 92,440 94,638 95,371 87,805IR: 1-5 yr 11,809 14,327 20,400 25,890 27,677 31,378 37,215 47,289 33,632 33,329 33,342 35,133 33,491 34,891 35,295 34,128 32,745IR: > 5 yrs 7,523 9,733 13,114 16,489 19,824 23,270 27,720 36,780 26,144 24,117 23,096 24,547 24,303 24,919 25,207 24,965 24,163FX: < 1 yr 3,785 4,040 4,470 5,348 5,681 7,690 11,592 10,868 10,416 11,092 11,960 13,363 14,467 18,024 17,820 19,220 17,538FX: 1-5 yr 661 829 1,114 1,286 1,354 1,416 1,605 2,171 2,449 2,440 2,356 2,582 2,433 2,741 3,180 2,990 3,088FX: > 5 yrs 492 431 577 760 687 593 619 1,086 1,344 1,329 1,307 1,432 1,289 1,433 1,530 1,474 1,502
$ in Billions

Notional Amounts of Gold and Precious Metals Contracts by Maturity
Insured U.S. Commercial BanksYear-ends 2001 – 2010, Quarterly 2011
0
50
100
150
200
250
4Q01 4Q02 4Q03 4Q04 4Q05 4Q06 4Q07 4Q08 4Q09 4Q10 1Q11 2Q11 3Q11 4Q11
Gold: > 5 yrs
Gold: 1-5 yr
Gold: < 1 yr
Note: Figures above exclude foreign exchange contracts with an original maturity of 14 days or less, futures contracts, written options, basis swaps, and any other contracts not subject to risk-based capital requirements.
Data Source: Call Reports
0
5
10
15
20
25
30
35
4Q01 4Q02 4Q03 4Q04 4Q05 4Q06 4Q07 4Q08 4Q09 4Q10 1Q11 2Q11 3Q11 4Q11
Prec Met: > 5 yrs
Prec Met: 1-5 yr
Prec Met: < 1 yr
Graph 8
$ B
illion
s$
Billi
ons
4Q01 4Q02 4Q03 4Q04 4Q05 4Q06 4Q07 4Q08 4Q09 4Q10 1Q11 2Q11 3Q11 4Q11Gold: < 1 yr 31 36 40 35 42 40 72 78 74 162 109 89 113 94Gold: 1-5 yr 26 28 32 31 27 36 37 27 25 29 27 31 33 28Gold: > 5 yrs 7 8 5 2 1 1 3 2 1 1 1 1 1 1Prec Met: < 1 yr 2 3 4 4 9 10 11 8 12 17 24 20 24 21Prec Met: 1-5 yr 0 0 0 1 1 2 2 2 1 2 4 4 5 5Prec Met: > 5 yrs 0 0 0 0 0 0 0 0 0 0 0 0 0 0
$ in Billions

Notional Amounts of Commodity and Equity Contracts by Maturity
Insured U.S. Commercial BanksYear-ends 2001 – 2010, Quarterly 2011
0
200
400
600
800
1,000
1,200
4Q01 4Q02 4Q03 4Q04 4Q05 4Q06 4Q07 4Q08 4Q09 4Q10 1Q11 2Q11 3Q11 4Q11
Oth Comm: > 5 yrs Oth Comm: 1-5 yr
Oth Comm: < 1 yr
Note: Figures above exclude foreign exchange contracts with an original maturity of 14 days or less, futures contracts, written options, basis swaps, and any other contracts not subject to risk-based capital requirements.
Data Source: Call Reports
0
400
800
1,200
1,600
2,000
2,400
4Q01 4Q02 4Q03 4Q04 4Q05 4Q06 4Q07 4Q08 4Q09 4Q10 1Q11 2Q11 3Q11 4Q11
Equity: > 5 yrs Equity: 1-5 yr
Equity: < 1 yr
Graph 9
$ B
illion
s$
Billi
ons
4Q01 4Q02 4Q03 4Q04 4Q05 4Q06 4Q07 4Q08 4Q09 4Q10 1Q11 2Q11 3Q11 4Q11Oth Comm: < 1 yr 28 55 41 68 165 185 205 179 176 203 371 329 297 261Oth Comm: 1-5 yr 23 35 102 206 714 235 298 233 198 209 194 203 229 209Oth Comm: > 5 yrs 2 9 14 40 175 20 23 43 33 25 24 29 28 46Equity: < 1 yr 124 127 197 273 321 341 473 409 312 296 350 358 375 427Equity: 1-5 yr 195 249 674 736 1,428 221 297 256 228 191 204 226 242 210Equity: > 5 yrs 23 25 84 140 383 45 70 72 82 85 84 93 98 94
$ in Billions
0
2,000
4,000
6,000
8,000
10,000
12,000
14,000
16,000
18,000
20,000
1Q07 2Q07 3Q07 4Q07 1Q08 2Q08 3Q08 4Q08 1Q09 2Q09 3Q09 4Q09 1Q10 2Q10 3Q10 4Q10 1Q11 2Q11 3Q11 4Q11
Sub-Investment Grade Investment Grade
Notional Amounts of Credit Derivative Contracts by Credit Quality and MaturityInsured U.S. Commercial Banks
1Q07 – 4Q11
Note: Figures above exclude foreign exchange contracts with an original maturity of 14 days or less, futures contracts, written options, basis swaps, and any other contracts not subject to risk-based capital requirements.
Notional amounts as reported in Schedules RC-L and RC-R of Call reports. As of March 31, 2006, the Call Report began to include maturity breakouts for credit derivatives.
Data Source: Call Reports
Graph 10
$ B
illion
s
$ Billions 1Q07 2Q07 3Q07 4Q07 1Q08 2Q08 3Q08 4Q08 1Q09 2Q09 3Q09 4Q09 1Q10 2Q10 3Q10 4Q10 1Q11 2Q11 3Q11 4Q11Investment Grade: < 1 yr 281 328 307 304 319 685 839 741 765 997 869 1,079 985 966 870 856 905 1,002 1,119 1,559Investment Grade: 1-5 yr 2,768 3,359 3,545 3,860 4,088 7,130 6,852 6,698 5,527 5,520 5,202 5,888 6,229 6,320 5,800 5,731 5,927 6,564 6,507 5,963Investment Grade: > 5 yrs 1,917 2,210 2,154 2,138 2,127 3,197 3,345 2,900 2,432 2,221 2,087 2,063 2,275 1,767 1,645 1,446 1,614 1,586 1,699 1,220 Subtotal Investment Grade 4,966 5,898 6,006 6,302 6,534 11,012 11,036 10,339 8,724 8,739 8,158 9,030 9,489 9,053 8,315 8,033 8,447 9,151 9,326 8,742Sub-Investment Grade: < 1 yr 164 144 158 149 134 343 400 457 513 615 575 635 574 587 753 791 833 939 1,024 1,335Sub-Investment Grade: 1-5 yr 1,201 1,405 1,416 1,400 1,608 2,849 3,058 3,472 3,660 3,098 3,167 3,248 3,201 3,267 4,004 4,073 4,217 4,056 4,131 3,797Sub-Investment Grade: > 5 yrs 537 629 621 543 672 1,160 1,394 1,388 1,492 989 1,086 1,121 1,101 968 1,400 1,254 1,401 1,081 1,180 885 Subtotal Sub-Investment Grade 1,901 2,178 2,195 2,092 2,414 4,353 4,852 5,318 5,665 4,701 4,827 5,005 4,876 4,823 6,157 6,118 6,452 6,076 6,336 6,017 Overall Total 6,867 8,075 8,201 8,394 8,948 15,365 15,888 15,656 14,389 13,440 12,986 14,036 14,364 13,876 14,472 14,150 14,899 15,227 15,661 14,759

TABLE 1
TOTALTOTAL TOTAL TOTAL TOTAL TOTAL CREDIT
TOTAL TOTAL FUTURES OPTIONS FORWARDS SWAPS OPTIONS DERIVATIVES SPOTRANK BANK NAME STATE ASSETS DERIVATIVES (EXCH TR) (EXCH TR) (OTC) (OTC) (OTC) (OTC) FX1 JPMORGAN CHASE BANK NA OH $1,811,678 $70,151,756 $1,054,889 $1,604,737 $10,519,547 $42,193,147 $9,003,696 $5,775,740 $116,7412 CITIBANK NATIONAL ASSN SD 1,288,658 52,102,260 417,068 1,188,019 6,290,464 32,991,242 8,240,371 2,975,096 518,4363 BANK OF AMERICA NA NC 1,451,969 50,135,890 1,469,653 406,328 9,309,135 31,203,103 3,027,351 4,720,320 254,9914 GOLDMAN SACHS BANK USA NY 103,790 44,192,474 942,082 391,465 3,550,525 31,536,163 7,272,498 499,741 2,9125 HSBC BANK USA NATIONAL ASSN VA 206,010 4,321,240 58,874 72,342 837,018 2,525,646 170,126 657,234 60,1276 WELLS FARGO BANK NA SD 1,161,490 3,332,642 208,049 57,777 609,909 1,952,377 423,287 81,243 8,5547 MORGAN STANLEY BANK NA UT 67,047 1,722,966 6,732 0 10,853 1,610,050 70,920 24,411 34,7138 STATE STREET BANK&TRUST CO MA 212,293 1,390,579 66,618 0 861,509 395,072 67,275 105 19,1899 BANK OF NEW YORK MELLON NY 256,205 1,375,225 25,498 17,161 330,708 734,791 266,734 333 37,26210 PNC BANK NATIONAL ASSN DE 263,310 389,730 64,250 9,250 24,627 237,975 50,065 3,563 70511 SUNTRUST BANK GA 171,292 309,154 28,340 20,842 32,737 177,303 45,929 4,003 11312 NORTHERN TRUST CO IL 99,831 244,337 0 0 235,976 8,199 100 61 6,68813 REGIONS BANK AL 123,368 150,281 4,365 0 66,309 75,630 3,367 610 10014 U S BANK NATIONAL ASSN OH 330,471 107,934 400 2,000 45,960 47,616 9,255 2,703 33915 TD BANK NATIONAL ASSN DE 188,913 73,794 0 0 8,064 62,503 1,285 1,943 316 KEYBANK NATIONAL ASSN OH 86,199 70,700 3,279 20 9,306 49,791 5,094 3,210 51717 BRANCH BANKING&TRUST CO NC 168,868 69,027 342 0 16,371 39,404 12,910 0 3118 FIFTH THIRD BANK OH 114,540 68,382 201 0 13,335 32,304 21,379 1,163 55719 UNION BANK NATIONAL ASSN CA 88,968 53,238 5,062 0 2,522 31,885 13,768 0 39020 RBS CITIZENS NATIONAL ASSN RI 106,941 39,572 0 0 7,011 29,799 1,945 817 4721 ALLY BANK UT 85,332 32,692 0 0 9,823 16,312 6,557 0 022 TD BANK USA NATIONAL ASSN ME 13,521 30,300 0 0 9,199 21,100 0 0 023 CAPITAL ONE NATIONAL ASSN VA 133,478 27,448 245 0 723 25,727 31 721 724 DEUTSCHE BANK TR CO AMERICAS NY 51,180 27,370 0 0 300 22,726 414 3,930 025 BMO HARRIS BANK NA IL 97,264 25,586 0 0 950 21,699 2,920 16 12
TOP 25 COMMERCIAL BANKS & TCs WITH DERIVATIVES $8,682,613 $230,444,576 $4,355,947 $3,769,940 $32,802,883 $146,041,566 $28,717,278 $14,756,962 $1,062,435OTHER COMMERCIAL BANKS & TCs WITH DERIVATIVES 2,554,276 349,810 9,831 2,868 78,956 211,670 44,392 2,094 743TOTAL COMMERCIAL BANKS & TCs WITH DERIVATIVES 11,236,890 230,794,386 4,365,777 3,772,808 32,881,838 146,253,236 28,761,670 14,759,056 1,063,177
Note: Before the first quarter of 1995 total derivatives included spot foreign exchange. Beginning in the first quarter, 1995, spot foreign exchange was reported separately.Note: Numbers may not add due to rounding.Data source: Call Reports, schedule RC-L
NOTIONAL AMOUNT OF DERIVATIVE CONTRACTS
Note: Credit derivatives have been included in the sum of total derivatives. Credit derivatives have been included as an "over the counter" category, although the Call Report does not differentiate by market currently.
TOP 25 COMMERCIAL BANKS AND TRUST COMPANIES IN DERIVATIVESDECEMBER 31, 2011, $ MILLIONS

TABLE 2
CREDITTOTAL TOTAL FUTURES OPTIONS FORWARDS SWAPS OPTIONS DERIVATIVES SPOT
RANK HOLDING COMPANY STATE ASSETS DERIVATIVES (EXCH TR) (EXCH TR) (OTC) (OTC) (OTC) (OTC) FX1 JPMORGAN CHASE & CO. NY $2,265,792 $71,040,875 $1,573,422 $1,701,890 $10,936,497 $42,095,596 $8,959,674 $5,773,796 $116,6102 BANK OF AMERICA CORPORATION NC 2,136,578 68,567,203 2,297,428 1,204,833 12,677,737 43,004,545 5,516,596 3,866,064 202,0163 MORGAN STANLEY NY 749,898 52,162,976 142,939 896,223 6,464,333 33,675,187 6,075,566 4,908,728 132,3114 CITIGROUP INC. NY 1,873,878 50,205,275 322,181 2,435,783 6,635,391 29,695,160 8,209,342 2,907,418 464,2545 GOLDMAN SACHS GROUP, INC., THE NY 923,718 48,272,746 1,902,843 1,592,151 4,887,670 26,945,555 8,912,164 4,032,363 150,9176 HSBC NORTH AMERICA HOLDINGS INC. NY 331,403 4,304,431 59,450 93,592 839,852 2,484,437 170,124 656,976 60,0697 WELLS FARGO & COMPANY CA 1,313,867 3,274,244 218,243 62,374 629,199 1,875,577 414,167 74,684 8,5548 STATE STREET CORPORATION MA 216,436 1,392,353 66,622 0 861,529 396,822 67,275 105 19,1899 BANK OF NEW YORK MELLON CORPORATION, THE NY 325,793 1,358,252 25,884 17,511 330,434 717,386 266,704 333 37,27010 TAUNUS CORPORATION NY 354,737 792,674 83,912 101,271 388,105 137,614 52,416 29,356 4,12611 ALLY FINANCIAL INC. MI 183,940 642,261 127,921 743 68,695 409,568 35,304 30 012 PNC FINANCIAL SERVICES GROUP, INC., THE PA 271,407 390,624 65,033 9,250 24,738 237,975 50,065 3,563 70513 SUNTRUST BANKS, INC. GA 176,900 310,795 28,621 20,842 32,737 176,303 48,289 4,003 11314 METLIFE, INC. NY 799,625 290,021 22,652 0 37,514 102,291 114,429 13,136 015 NORTHERN TRUST CORPORATION IL 100,224 244,937 0 0 235,976 8,799 100 61 6,68816 REGIONS FINANCIAL CORPORATION AL 127,050 157,587 4,365 0 66,309 82,572 3,731 610 10017 U.S. BANCORP MN 340,122 109,170 400 2,000 45,959 49,155 9,256 2,400 33918 TD BANK US HOLDING COMPANY ME 201,057 104,094 0 0 17,263 83,603 1,285 1,943 319 KEYCORP OH 88,763 74,544 3,369 20 9,306 52,501 6,138 3,210 51720 CAPITAL ONE FINANCIAL CORPORATION VA 206,104 73,234 245 0 5,300 66,936 31 721 721 FIFTH THIRD BANCORP OH 116,967 72,210 201 0 13,335 36,132 21,379 1,163 55722 BB&T CORPORATION NC 174,579 67,626 342 0 16,371 39,063 11,850 0 3123 RBC USA HOLDCO CORPORATION NY 83,153 55,834 912 11,919 37,797 4,364 158 684 024 UNIONBANCAL CORPORATION CA 89,677 53,238 5,062 0 2,522 31,885 13,768 0 39025 CITIZENS FINANCIAL GROUP, INC. RI 129,811 48,261 0 0 7,011 36,870 2,226 2,153 47
TOP 25 HOLDING COMPANIES WITH DERIVATIVES $13,581,477 $304,065,465 $6,952,046 $8,150,401 $45,271,581 $182,445,899 $38,962,038 $22,283,500 $1,204,813
Note: Currently, the Y-9 report does not differentiate credit derivatives by contract type. Credit derivatives have been included in the sum of total derivatives.Note: Prior to the first quarter of 2005, total derivatives included spot foreign exchange. Beginning in that quarter, spot foreign exchange has been reported separately.Note: Numbers may not add due to rounding.Data source: Consolidated Financial Statements for Bank Holding Companies, FR Y- 9, schedule HC-L
NOTIONAL AMOUNT OF DERIVATIVE CONTRACTSTOP 25 HOLDING COMPANIES IN DERIVATIVES
DECEMBER 31, 2011, $ MILLIONS

TABLE 3
PERCENT PERCENT PERCENT PERCENT PERCENT PERCENTTOTAL TOTAL EXCH TRADED OTC INT RATE FOREIGN EXCH OTHER CREDIT
RANK BANK NAME STATE ASSETS DERIVATIVES CONTRACTS CONTRACTS CONTRACTS CONTRACTS CONTRACTS DERIVATIVES(%) (%) (%) (%) (%) (%)
1 JPMORGAN CHASE BANK NA OH $1,811,678 $70,151,756 3.8 96.2 76.6 12.4 2.8 8.22 CITIBANK NATIONAL ASSN SD 1,288,658 52,102,260 3.1 96.9 81.7 11.5 1.1 5.73 BANK OF AMERICA NA NC 1,451,969 50,135,890 3.7 96.3 81.4 8.8 0.4 9.44 GOLDMAN SACHS BANK USA NY 103,790 44,192,474 3.0 97.0 94.4 4.4 0.0 1.15 HSBC BANK USA NATIONAL ASSN VA 206,010 4,321,240 3.0 97.0 64.4 18.7 1.7 15.26 WELLS FARGO BANK NA SD 1,161,490 3,332,642 8.0 92.0 88.0 5.1 4.4 2.47 MORGAN STANLEY BANK NA UT 67,047 1,722,966 0.4 99.6 0.4 98.2 0.0 1.48 STATE STREET BANK&TRUST CO MA 212,293 1,390,579 4.8 95.2 22.3 74.8 2.9 0.09 BANK OF NEW YORK MELLON NY 256,205 1,375,225 3.1 96.9 73.5 25.9 0.6 0.010 PNC BANK NATIONAL ASSN DE 263,310 389,730 18.9 81.1 96.1 3.0 0.0 0.911 SUNTRUST BANK GA 171,292 309,154 15.9 84.1 89.8 1.9 7.1 1.312 NORTHERN TRUST CO IL 99,831 244,337 0.0 100.0 3.0 97.0 0.0 0.013 REGIONS BANK AL 123,368 150,281 2.9 97.1 99.2 0.3 0.1 0.414 U S BANK NATIONAL ASSN OH 330,471 107,934 2.2 97.8 80.0 17.4 0.1 2.515 TD BANK NATIONAL ASSN DE 188,913 73,794 0.0 100.0 85.9 11.5 0.0 2.616 KEYBANK NATIONAL ASSN OH 86,199 70,700 4.7 95.3 86.0 8.6 0.8 4.517 BRANCH BANKING&TRUST CO NC 168,868 69,027 0.5 99.5 99.1 0.9 0.0 0.018 FIFTH THIRD BANK OH 114,540 68,382 0.3 99.7 67.4 25.4 5.5 1.719 UNION BANK NATIONAL ASSN CA 88,968 53,238 9.5 90.5 77.6 7.1 15.4 0.020 RBS CITIZENS NATIONAL ASSN RI 106,941 39,572 0.0 100.0 82.0 15.9 0.0 2.121 ALLY BANK UT 85,332 32,692 0.0 100.0 95.8 0.0 4.2 0.022 TD BANK USA NATIONAL ASSN ME 13,521 30,300 0.0 100.0 67.3 32.7 0.0 0.023 CAPITAL ONE NATIONAL ASSN VA 133,478 27,448 0.9 99.1 97.1 0.3 0.0 2.624 DEUTSCHE BANK TR CO AMERICAS NY 51,180 27,370 0.0 100.0 59.2 26.5 0.0 14.425 BMO HARRIS BANK NA IL 97,264 25,586 0.0 100.0 89.9 3.1 7.0 0.1
TOP 25 COMMERCIAL BANKS & TCs WITH DERIVATIVES $8,682,613 $230,444,576 $8,125,887 $222,318,689 $187,211,773 $25,402,001 $3,073,839 $14,756,962OTHER COMMERCIAL BANKS & TCs WITH DERIVATIVES 2,554,276 349,810 12,699 337,111 297,479 34,335 15,902 2,094TOTAL FOR COMMERCIAL BANKS & TCs WITH DERIVATIVES 11,236,890 230,794,386 8,138,586 222,655,800 187,509,252 25,436,336 3,089,741 14,759,056
(%) (%) (%) (%) (%) (%) (%)TOP 25 COMMERCIAL BANKS & TC: % OF TOTAL COMMERCIAL BKS &TCs WITH DERIVATIVES 99.8 3.5 96.3 81.1 11.0 1.3 6.4OTHER COMMERCIAL BANKS & TCs: % OF TOTAL COMMERCIAL BKs & TCs WITH DERIVATIVES 0.2 0.0 0.1 0.1 0.0 0.0 0.0TOTAL FOR COMMERCIAL BANKs & TCs: % OF TOTAL COMMERCIAL BANKs & TCs WITH DERIVATIVES 100.0 3.5 96.5 81.2 11.0 1.3 6.4
Note: "Foreign Exchange" does not include spot fx.
Note: "Other" is defined as the sum of commodity and equity contracts.Note: Numbers may not add due to rounding.Data source: Call Reports, schedule RC-L
Note: Currently, the Call Report does not differentiate credit derivatives by over the counter or exchange traded. Credit derivatives have been included in the "over the counter" category as well as in the sum of total derivatives here.
DISTRIBUTION OF DERIVATIVE CONTRACTSTOP 25 COMMERCIAL BANKS AND TRUST COMPANIES IN DERIVATIVES
DECEMBER 31, 2011, $ MILLIONS

TABLE 4
BILATERALLY TOTAL CREDIT (%)TOTAL NETTED CURRENT POTENTIAL EXPOSURE TOTAL CREDIT
TOTAL TOTAL RISK-BASED CREDIT FUTURE FROM ALL EXPOSURERANK BANK NAME STATE ASSETS DERIVATIVES CAPITAL EXPOSURE EXPOSURE CONTRACTS TO CAPITAL1 JPMORGAN CHASE BANK NA OH $1,811,678 $70,151,756 $136,017 $172,723 $175,376 $348,099 2562 CITIBANK NATIONAL ASSN SD 1,288,658 52,102,260 134,284 72,044 165,707 237,751 1773 BANK OF AMERICA NA NC 1,451,969 50,135,890 154,317 64,303 207,342 271,645 1764 GOLDMAN SACHS BANK USA NY 103,790 44,192,474 19,257 30,063 122,845 152,908 7945 HSBC BANK USA NATIONAL ASSN VA 206,010 4,321,240 22,328 8,071 31,844 39,915 1796 WELLS FARGO BANK NA SD 1,161,490 3,332,642 117,925 30,206 20,695 50,901 437 MORGAN STANLEY BANK NA UT 67,047 1,722,966 10,221 2,244 10,317 12,561 1238 STATE STREET BANK&TRUST CO MA 212,293 1,390,579 13,607 9,899 15,458 25,357 1869 BANK OF NEW YORK MELLON NY 256,205 1,375,225 15,421 7,260 5,426 12,686 8210 PNC BANK NATIONAL ASSN DE 263,310 389,730 32,299 3,797 610 4,407 1411 SUNTRUST BANK GA 171,292 309,154 17,209 3,149 1,480 4,629 2712 NORTHERN TRUST CO IL 99,831 244,337 7,763 3,861 2,486 6,348 8213 REGIONS BANK AL 123,368 150,281 14,447 1,002 244 1,246 914 U S BANK NATIONAL ASSN OH 330,471 107,934 32,542 1,457 255 1,711 515 TD BANK NATIONAL ASSN DE 188,913 73,794 14,441 2,391 771 3,163 2216 KEYBANK NATIONAL ASSN OH 86,199 70,700 11,628 1,170 125 1,296 1117 BRANCH BANKING&TRUST CO NC 168,868 69,027 17,855 1,494 426 1,920 1118 FIFTH THIRD BANK OH 114,540 68,382 13,859 1,752 647 2,399 1719 UNION BANK NATIONAL ASSN CA 88,968 53,238 10,004 988 886 1,874 1920 RBS CITIZENS NATIONAL ASSN RI 106,941 39,572 10,536 1,138 290 1,428 1421 ALLY BANK UT 85,332 32,692 13,643 112 213 326 222 TD BANK USA NATIONAL ASSN ME 13,521 30,300 1,081 693 343 1,035 9623 CAPITAL ONE NATIONAL ASSN VA 133,478 27,448 11,229 619 184 803 724 DEUTSCHE BANK TR CO AMERICAS NY 51,180 27,370 8,430 1,585 812 2,397 2825 BMO HARRIS BANK NA IL 97,264 25,586 10,289 717 260 978 10
TOP 25 COMMERCIAL BANKS & TCs WITH DERIVATIVES $8,682,613 $230,444,576 $850,632 $422,738 $765,042 $1,187,780 140OTHER COMMERCIAL BANKS & TCs WITH DERIVATIVES 2,554,276 349,810 289,592 7,730 2,247 9,976 3TOTAL AMOUNT FOR COMMERCIAL BANKS & TCs WITH DERIVATIVES 11,236,890 230,794,386 1,140,224 430,467 767,289 1,197,756 105
Commercial banks also hold on-balance sheet assets in volumes that are multiples of bank capital. For example:
EXPOSURES FROM OTHER ASSETS EXPOSURE TO RISKALL COMMERCIAL BANKS BASED CAPITAL 1-4 FAMILY MORTGAGES 161% C&I LOANS 99% SECURITIES NOT IN TRADING ACCOUNT 196%
Note: Total credit exposure is defined as the credit equivalent amount from derivative contracts (RC-R line 54), which is the sum of netted current credit exposure and PFE.Note: The total credit exposure to capital ratio is calculated using risk based capital (tier one plus tier two capital). Note: Currently, the Call Report does not differentiate credit derivatives by contract type. Credit derivatives have been included in the sum of total derivatives here.Note: Numbers may not add due to rounding.Note: Beginning in 2Q09, the methodology to calculate the Credit Risk Exposure to Capital ratio for the aggregated categories (Top 25, Other and Overall Total) was adjustedto a summing methodology.Data source: Call Reports, Schedule RC-R.
CREDIT EQUIVALENT EXPOSURESTOP 25 COMMERCIAL BANKS AND TRUST COMPANIES IN DERIVATIVES
DECEMBER 31, 2011, $ MILLIONS

TABLE 5
TOTAL % TOTAL %HELD FOR HELD FOR NOT FOR NOT FOR
TOTAL TOTAL TRADING TRADING TRADING TRADINGRANK BANK NAME STATE ASSETS DERIVATIVES & MTM & MTM MTM MTM1 JPMORGAN CHASE BANK NA OH $1,811,678 $64,376,016 $63,747,610 99.0 $628,406 1.02 CITIBANK NATIONAL ASSN SD 1,288,658 49,127,164 49,069,552 99.9 57,612 0.13 BANK OF AMERICA NA NC 1,451,969 45,415,570 41,647,501 91.7 3,768,069 8.34 GOLDMAN SACHS BANK USA NY 103,790 43,692,733 43,686,955 100.0 5,778 0.05 HSBC BANK USA NATIONAL ASSN VA 206,010 3,664,006 3,636,376 99.2 27,630 0.8
TOP 5 COMMERCIAL BANKS & TCs WITH DERIVATIVES $4,862,105 $206,275,489 $201,787,994 97.8 $4,487,495 2.2OTHER COMMERCIAL BANKS & TCs WITH DERIVATIVES 6,374,785 9,759,841 8,474,911 86.8 1,284,930 13.2TOTAL AMOUNT FOR COMMERCIAL BANKS & TCs WITH DERIVATIVES 11,236,890 216,035,329 210,262,905 97.3 5,772,425 2.7
Note: Currently, the Call Report does not differentiate between traded and not-traded credit derivatives. Credit derivatives have been excluded from the sum of total derivatives here.Note: Numbers may not add due to rounding.Data source: Call Reports, schedule RC-L
NOTIONAL AMOUNTS OF DERIVATIVE CONTRACTS HELD FOR TRADINGTOP 5 COMMERCIAL BANKS AND TRUST COMPANIES IN DERIVATIVES
DECEMBER 31, 2011, $ MILLIONS

TABLE 6
GROSS GROSS GROSS GROSS GROSS GROSSTOTAL TOTAL POSITIVE NEGATIVE POSITIVE NEGATIVE POSITIVE NEGATIVE
RANK BANK NAME STATE ASSETS DERIVATIVES FAIR VALUE* FAIR VALUE** FAIR VALUE* FAIR VALUE** FAIR VALUE* FAIR VALUE**1 JPMORGAN CHASE BANK NA OH $1,811,678 $70,151,756 $1,674,434 $1,649,247 $17,221 $9,673 $169,710 $166,2602 CITIBANK NATIONAL ASSN SD 1,288,658 52,102,260 1,007,627 992,887 841 2,404 89,873 84,4443 BANK OF AMERICA NA NC 1,451,969 50,135,890 1,101,730 1,085,234 130,597 141,269 122,942 119,0244 GOLDMAN SACHS BANK USA NY 103,790 44,192,474 869,895 821,072 388 2 14,389 13,8275 HSBC BANK USA NATIONAL ASSN VA 206,010 4,321,240 77,930 77,052 15 1,609 14,630 14,434
TOP 5 COMMERCIAL BANKS & TCs WITH DERIVATIVES $4,862,105 $220,903,620 $4,731,616 $4,625,492 $149,062 $154,957 $411,544 $397,990OTHER COMMERCIAL BANKS & TCs WITH DERIVATIVES 6,374,785 9,890,766 203,542 199,160 26,306 15,875 6,220 6,071TOTAL AMOUNT FOR COMMERCIAL BANKS & TCs WITH DERIVATIVES 11,236,890 230,794,386 4,935,158 4,824,652 175,369 170,832 417,764 404,060
Note: Currently, the Call Report does not differentiate between traded and non-traded credit derivatives. Credit derivatives have been included in the sum of total derivatives here. Numbers may not sum due to rounding.*Market value of contracts that have a positive fair value as of the end of the quarter.**Market value of contracts that have a negative fair value as of the end of the quarter.Data source: Call Reports, schedule RC-L
TRADING CREDIT DERIVATIVES
GROSS FAIR VALUES OF DERIVATIVE CONTRACTSTOP 5 COMMERCIAL BANKS AND TRUST COMPANIES IN DERIVATIVES
DECEMBER 31, 2011, $ MILLIONS
NOT FOR TRADING

TABLE 7
TOTAL TRADING TRADING REV TRADING REV TRADING REV TRADING REV TRADING REVREV FROM CASH & FROM FROM FROM FROM FROM
TOTAL TOTAL OFF BAL SHEET INT RATE FOREIGN EXCH EQUITY COMMOD & OTH CREDITRANK BANK NAME STATE ASSETS DERIVATIVES POSITIONS POSITIONS POSITIONS POSITIONS POSITIONS POSITIONS1 JPMORGAN CHASE BANK NA OH $1,811,678 $70,151,756 $778 ($46) $163 ($69) $270 $4602 CITIBANK NATIONAL ASSN SD 1,288,658 52,102,260 196 100 389 (41) (78) (174)3 BANK OF AMERICA NA NC 1,451,969 50,135,890 11 46 235 21 2 (293)4 GOLDMAN SACHS BANK USA NY 103,790 44,192,474 219 22 214 0 0 (17)5 HSBC BANK USA NATIONAL ASSN VA 206,010 4,321,240 104 81 94 3 11 (86)
TOP 5 COMMERCIAL BANKS & TCs WITH DERIVATIVES $4,862,105 $220,903,620 $1,308 $203 $1,095 ($86) $205 ($110)OTHER COMMERCIAL BANKS & TCs WITH DERIVATIVES 6,374,785 9,890,766 1,217 50 845 (33) 53 303TOTAL AMOUNT FOR COMMERCIAL BANKS & TCs WITH DERIVATIVES 11,236,890 230,794,386 2,525 253 1,940 (119) 258 193
Note: Trading revenue is defined here as "trading revenue from cash instruments and off balance sheet derivative instruments."Note: Numbers may not sum due to rounding.Data source: Call Reports, schedule RI
Note: Effective in the first quarter of 2007, trading revenues from credit exposures are reported separately, along with the four other types of exposures. The total derivatives column includes credit exposures.
TRADING REVENUES FROM CASH INSTRUMENTS AND DERIVATIVESTOP 5 COMMERCIAL BANKS AND TRUST COMPANIES IN DERIVATIVES
NOTE: REVENUE FIGURES ARE FOR THE QUARTER (NOT YEAR-TO-DATE)DECEMBER 31, 2011, $ MILLIONS

TABLE 8
INT RATE INT RATE INT RATE INT RATE FOREIGN EXCH FOREIGN EXCH FOREIGN EXCH FOREIGN EXCHTOTAL TOTAL MATURITY MATURITY MATURITY ALL MATURITY MATURITY MATURITY ALL
RANK BANK NAME STATE ASSETS DERIVATIVES < 1 YR 1 - 5 YRS > 5 YRS MATURITIES < 1 YR 1 - 5 YRS > 5 YRS MATURITIES1 JPMORGAN CHASE BANK NA OH $1,811,678 $70,151,756 $30,653,762 $8,799,877 $6,334,023 $45,787,662 $6,558,039 $652,279 $202,974 $7,413,2922 CITIBANK NATIONAL ASSN SD 1,288,658 52,102,260 22,850,480 7,164,433 5,115,756 35,130,669 4,446,875 377,679 155,315 4,979,8693 BANK OF AMERICA NA NC 1,451,969 50,135,890 10,329,005 6,063,655 4,481,718 20,874,378 2,863,369 859,410 386,409 4,109,1874 GOLDMAN SACHS BANK USA NY 103,790 44,192,474 21,967,393 8,303,772 6,715,642 36,986,807 408,321 775,044 666,241 1,849,6065 HSBC BANK USA NATIONAL ASSN VA 206,010 4,321,240 696,402 1,073,780 659,909 2,430,091 551,271 127,319 51,437 730,028
TOP 5 COMMERCIAL BANKS & TCs WITH DERIVATIVES $4,862,105 $220,903,620 $86,497,042 $31,405,517 $23,307,048 $141,209,607 $14,827,875 $2,791,731 $1,462,376 $19,081,983OTHER COMMERCIAL BANKS & TCs WITH DERIVATIVES 6,374,785 9,890,766 1,308,142 1,339,316 856,137 3,503,595 2,710,380 296,437 39,986 3,046,802TOTAL AMOUNT FOR COMMERCIAL BANKS & TCs WITH DERIVATIVES 11,236,890 230,794,386 87,805,184 32,744,833 24,163,184 144,713,202 17,538,255 3,088,168 1,502,362 22,128,785
Note: Figures above exclude any contracts not subject to risk-based capital requirements, such as foreign exchange contracts with an original maturity of 14 days or less, futures contracts, written options, and basis swaps. Therefore, the total notional amount of derivatives by maturity will not add to the total derivatives figure in this table.Note: Numbers may not add due to rounding.Data source: Call Reports, schedule RC-R
NOTIONAL AMOUNTS OF DERIVATIVE CONTRACTS BY CONTRACT TYPE & MATURITYTOP 5 COMMERCIAL BANKS AND TRUST COMPANIES IN DERIVATIVES
DECEMBER 31, 2011, $ MILLIONS

TABLE 9
GOLD GOLD GOLD GOLD PREC METALS PREC METALS PREC METALS PREC METALSTOTAL TOTAL MATURITY MATURITY MATURITY ALL MATURITY MATURITY MATURITY ALL
RANK BANK NAME STATE ASSETS DERIVATIVES < 1 YR 1 - 5 YRS > 5 YRS MATURITIES < 1 YR 1 - 5 YRS > 5 YRS MATURITIES1 JPMORGAN CHASE BANK NA OH $1,811,678 $70,151,756 $58,551 $27,767 $576 $86,894 $13,542 $2,834 $85 $16,4612 CITIBANK NATIONAL ASSN SD 1,288,658 52,102,260 398 0 0 398 44 0 0 443 BANK OF AMERICA NA NC 1,451,969 50,135,890 0 0 0 0 7 253 0 2604 GOLDMAN SACHS BANK USA NY 103,790 44,192,474 0 0 0 0 0 0 0 05 HSBC BANK USA NATIONAL ASSN VA 206,010 4,321,240 34,900 545 0 35,445 7,530 1,653 18 9,201
TOP 5 COMMERCIAL BANKS & TCs WITH DERIVATIVES $4,862,105 $220,903,620 $93,849 $28,312 $576 $122,737 $21,123 $4,740 $103 $25,965OTHER COMMERCIAL BANKS & TCs WITH DERIVATIVES 6,374,785 9,890,766 104 86 0 190 0 0 0 0TOTAL FOR COMMERCIAL BANKS & TCs WITH DERIVATIVES 11,236,890 230,794,386 93,953 28,398 576 122,927 21,123 4,740 103 25,965
Note: Figures above exclude any contracts not subject to risk-based capital requirements, such as foreign exchange contracts with an original maturity of 14 days or less, futures contracts, written options, and basis swaps. Therefore, the total notional amount of derivatives by maturity will not add to the total derivatives figure in this table.Note: Numbers may not add due to rounding.Data source: Call Reports, schedule RC-R
NOTIONAL AMOUNTS OF DERIVATIVE CONTRACTS BY CONTRACT TYPE & MATURITYTOP 5 COMMERCIAL BANKS AND TRUST COMPANIES IN DERIVATIVES
DECEMBER 31, 2011, $ MILLIONS

TABLE 10
OTHER COMM OTHER COMM OTHER COMM OTHER COMM EQUITY EQUITY EQUITY EQUITYTOTAL TOTAL MATURITY MATURITY MATURITY ALL MATURITY MATURITY MATURITY ALL
RANK BANK NAME STATE ASSETS DERIVATIVES < 1 YR 1 - 5 YRS > 5 YRS MATURITIES < 1 YR 1 - 5 YRS > 5 YRS MATURITIES1 JPMORGAN CHASE BANK NA OH $1,811,678 $70,151,756 $177,331 $172,866 $43,146 $393,343 $204,111 $113,961 $43,215 $361,2872 CITIBANK NATIONAL ASSN SD 1,288,658 52,102,260 39,743 16,505 505 56,753 104,194 44,440 23,647 172,2813 BANK OF AMERICA NA NC 1,451,969 50,135,890 5,090 851 0 5,941 88,185 21,959 15,977 126,1204 GOLDMAN SACHS BANK USA NY 103,790 44,192,474 11,885 0 0 11,885 0 85 22 1075 HSBC BANK USA NATIONAL ASSN VA 206,010 4,321,240 145 0 0 145 7,649 7,560 4,550 19,760
TOP 5 COMMERCIAL BANKS & TCs WITH DERIVATIVES $4,862,105 $220,903,620 $234,195 $190,222 $43,651 $468,068 $404,139 $188,005 $87,411 $679,554OTHER COMMERCIAL BANKS & TCs WITH DERIVATIVES 6,374,785 9,890,766 26,605 18,363 1,851 46,819 22,482 22,384 6,242 51,108TOTAL FOR COMMERCIAL BANKS & TCs WITH DERIVATIVES 11,236,890 230,794,386 260,799 208,585 45,502 514,887 426,621 210,389 93,653 730,663
Note: Figures above exclude any contracts not subject to risk-based capital requirements, such as foreign exchange contracts with an original maturity of 14 days or less, futures contracts, written options, and basis swaps. Therefore, the total notional amount of derivatives by maturity will not add to the total derivatives figure in this table.Note: Numbers may not add due to rounding.Data source: Call Reports, schedule RC-R
DECEMBER 31, 2011, $ MILLIONS
NOTIONAL AMOUNTS OF DERIVATIVE CONTRACTS BY CONTRACT TYPE & MATURITYTOP 5 COMMERCIAL BANKS AND TRUST COMPANIES IN DERIVATIVES

TABLE 11
TOTAL TOTAL TOTAL CREDIT MATURITY MATURITY MATURITY ALL MATURITY MATURITY MATURITY ALLRANK BANK NAME STATE ASSETS DERIVATIVES DERIVATIVES < 1 YR 1 - 5 YRS > 5 YRS MATURITIES < 1 YR 1 - 5 YRS > 5 YRS MATURITIES1 JPMORGAN CHASE BANK NA OH $1,811,678 $70,151,756 $5,775,740 $737,509 $2,530,564 $642,577 $3,910,650 $472,496 $1,148,604 $243,990 $1,865,0902 CITIBANK NATIONAL ASSN SD 1,288,658 52,102,260 2,975,096 215,463 878,465 175,964 1,269,892 320,312 1,169,134 215,758 1,705,2043 BANK OF AMERICA NA NC 1,451,969 50,135,890 4,720,320 489,664 2,136,236 338,336 2,964,235 346,746 1,063,915 345,424 1,756,0854 GOLDMAN SACHS BANK USA NY 103,790 44,192,474 499,741 38,094 183,664 24,709 246,467 83,645 159,551 10,078 253,2745 HSBC BANK USA NATIONAL ASSN VA 206,010 4,321,240 657,234 64,794 190,554 27,934 283,281 101,149 222,791 50,012 373,952
TOP 5 COMMERCIAL BANKS & TCs WITH DERIVATIVES $4,862,105 $220,903,620 $14,628,131 $1,545,523 $5,919,483 $1,209,520 $8,674,526 $1,324,348 $3,763,995 $865,262 $5,953,605OTHER COMMERCIAL BANKS & TCs WITH DERIVATIVES 6,374,785 9,890,766 130,926 13,615 43,147 10,492 67,254 10,738 32,801 20,133 63,672TOTAL AMOUNT FOR COMMERCIAL BANKS & TCs WITH DERIVATIVES 11,236,890 230,794,386 14,759,056 1,559,138 5,962,630 1,220,011 8,741,779 1,335,086 3,796,796 885,395 6,017,277
Note: Figures above exclude any contracts not subject to risk-based capital requirements, such as foreign exchange contracts with an original maturity of 14 days or less, futures contracts, written options, and basis swaps. Therefore, the total notional amount of derivatives by maturity will not add to the total derivatives figure in this table.Note: Numbers may not add due to rounding.Note: Beginning in 2Q10, HSBC replaced Wells Fargo as one of the top five commerical banks in derivatives. See Table 1.Data source: Call Reports, schedule RC-L and RC-R
SUB-INVESTMENT GRADEINVESTMENT GRADECREDIT DERIVATIVES
NOTIONAL AMOUNTS OF CREDIT DERIVATIVE CONTRACTS BY CONTRACT TYPE & MATURITYTOP 5 COMMERCIAL BANKS AND TRUST COMPANIES IN DERIVATIVES
CREDIT DERIVATIVES
DECEMBER 31, 2011, $ MILLIONS

TABLE 12
TOTAL CREDIT TOTAL OTHER CREDIT TOTAL OTHERTOTAL TOTAL CREDIT DEFAULT RETURN CREDIT CREDIT DEFAULT RETURN CREDIT CREDIT
RANK BANK NAME STATE ASSETS DERIVATIVES DERVATIVES BOUGHT SOLD SWAPS SWAPS OPTIONS DERIVATIVES SWAPS SWAPS OPTIONS DERIVATIVES1 JPMORGAN CHASE BANK NA OH $1,811,678 $64,376,016 $5,775,740 $2,854,854 $2,920,886 $2,827,607 $14,258 $4,922 $8,067 $2,841,186 $1,109 $6,476 $72,1152 CITIBANK NATIONAL ASSN SD 1,288,658 49,127,164 2,975,096 1,535,348 1,439,748 1,505,846 23,354 6,148 0 1,427,209 4,377 8,162 03 BANK OF AMERICA NA NC 1,451,969 45,415,570 4,720,320 2,377,776 2,342,544 2,366,731 362 10,684 0 2,330,093 1,718 10,734 04 GOLDMAN SACHS BANK USA NY 103,790 43,692,733 499,741 296,018 203,723 235,984 3,999 3,014 53,021 198,417 3,950 1,349 75 HSBC BANK USA NATIONAL ASSN VA 206,010 3,664,006 657,234 319,773 337,461 306,217 13,556 0 0 318,732 18,728 0 06 WELLS FARGO BANK NA SD 1,161,490 3,251,399 81,243 40,501 40,742 36,079 110 0 4,312 37,217 294 0 3,2317 MORGAN STANLEY BANK NA UT 67,047 1,698,555 24,411 22,382 2,029 22,382 0 0 0 2,029 0 0 08 STATE STREET BANK&TRUST CO MA 212,293 1,390,474 105 105 0 105 0 0 0 0 0 0 09 BANK OF NEW YORK MELLON NY 256,205 1,374,892 333 331 2 331 0 0 0 2 0 0 010 PNC BANK NATIONAL ASSN DE 263,310 386,168 3,563 1,901 1,661 210 0 0 1,691 94 0 0 1,56811 SUNTRUST BANK GA 171,292 305,151 4,003 2,180 1,823 528 1,650 0 2 167 1,650 0 612 NORTHERN TRUST CO IL 99,831 244,276 61 61 0 61 0 0 0 0 0 0 013 REGIONS BANK AL 123,368 149,671 610 128 482 0 0 0 128 0 0 0 48214 U S BANK NATIONAL ASSN OH 330,471 105,231 2,703 978 1,725 503 0 0 475 310 0 0 1,41515 TD BANK NATIONAL ASSN DE 188,913 71,851 1,943 1,892 51 1,892 0 0 0 51 0 0 016 KEYBANK NATIONAL ASSN OH 86,199 67,490 3,210 1,846 1,364 1,846 0 0 0 1,239 125 0 017 BRANCH BANKING&TRUST CO NC 168,868 69,027 0 0 0 0 0 0 0 0 0 0 018 FIFTH THIRD BANK OH 114,540 67,219 1,163 355 808 0 0 0 355 0 0 0 80819 UNION BANK NATIONAL ASSN CA 88,968 53,238 0 0 0 0 0 0 0 0 0 0 020 RBS CITIZENS NATIONAL ASSN RI 106,941 38,755 817 0 817 0 0 0 0 0 0 0 81721 ALLY BANK UT 85,332 32,692 0 0 0 0 0 0 0 0 0 0 022 TD BANK USA NATIONAL ASSN ME 13,521 30,300 0 0 0 0 0 0 0 0 0 0 023 CAPITAL ONE NATIONAL ASSN VA 133,478 26,727 721 193 528 0 0 11 182 0 0 131 39724 DEUTSCHE BANK TR CO AMERICAS NY 51,180 23,440 3,930 3,930 0 19 3,911 0 0 0 0 0 025 BMO HARRIS BANK NA IL 97,264 25,569 16 14 3 3 0 0 10 3 0 0 0
TOP 25 COMMERCIAL BANKS & TCs WITH DERIVATIVES $8,682,613 $215,687,614 $14,756,962 $7,460,566 $7,296,396 $7,306,343 $61,200 $24,779 $68,244 $7,156,748 $31,951 $26,852 $80,846OTHER COMMERCIAL BANKS & TCs WITH DERIVATIVES 2,554,276 347,716 2,094 1,118 977 30 37 0 1,050 46 0 0 931TOTAL AMOUNT FOR COMMERCIAL BANKS & TCs WITH DERIVATIVES 11,236,890 216,035,329 14,759,056 7,461,683 7,297,373 7,306,373 61,237 24,779 69,294 7,156,794 31,951 26,852 81,777
(%) (%) (%) (%) (%) (%) (%) (%) (%) (%) (%)TOP 25 COMMERCIAL BANKS & TC: % OF TOTAL COMMERCIAL BANKS &TCs WITH DERIVATIVES 100.0 50.5 49.4 49.5 0.4 0.2 0.5 48.5 0.2 0.2 0.5OTHER COMMERCIAL BANKS & TCs: % OF TOTAL COMMERCIAL BANKs & TCs WITH DERIVATIVES 0.0 0.0 0.0 0.0 0.0 0.0 0.0 0.0 0.0 0.0 0.0TOTAL AMOUNT FOR COMMERCIAL BANKs & TCs: % OF TOTAL COMMERCIAL BANKs & TCs WITH DERIVATIVES 100.0 50.6 49.4 49.5 0.4 0.2 0.5 48.5 0.2 0.2 0.6
Note: Credit derivatives have been excluded from the sum of total derivatives here.Note: Numbers may not add due to rounding.Data source: Call Reports, schedule RC-L
DISTRIBUTION OF CREDIT DERIVATIVE CONTRACTSTOP 25 COMMERCIAL BANKS AND TRUST COMPANIES IN DERIVATIVES
DERIVATIVESBOUGHT SOLDTOTAL CREDIT
DECEMBER 31, 2011, $ MILLIONS


![· 2020. 11. 19. · ñ— ò (20219 OR 12345 1234 xxttf* 123-45 c:ggg::] XXX-XXX-XXX . (2020 (20219 1234 1234567 01 t±flJ -k 88888888 (2021 O O or . 11 Qoo AOO Qoo A 00 F '234](https://img.dokumen.tips/doc/110x75/60adfdb81a58271f8972dda3/2020-11-19-a-20219-or-12345-1234-xxttf-123-45-cggg-xxx-xxx-xxx.jpg)


![250 E Street, SW Washington, DC 20219 12 CFR Part 3 ...Washington, DC 20219 [12 CFR Part 3; Docket No. 06-09 RIN 1557-AC91] Robert E Feldman Executive Secretary, FDIC 550 17th Street,](https://img.dokumen.tips/doc/110x75/5f64e9000611662ffe12a2f2/250-e-street-sw-washington-dc-20219-12-cfr-part-3-washington-dc-20219-12.jpg)