Embed Size (px)
Citation preview

WE DRIVE INNOVATION AS ONE
Quarterly Report 3/2015
Munich Re
Quarterly Report 3/2015Munich Re
130
120
110
100
90
Supervisory BoardDr. Bernd Pischetsrieder(Chairman)
Board of ManagementDr. Nikolaus von Bomhard(Chairman)Giuseppina Albo Dr. Ludger ArnoldussenDr. Thomas BlunckDr. Doris HöpkeDr. Torsten JeworrekDr. Markus Rieß (since 16 September 2015)Dr. Peter RöderDr. Jörg SchneiderDr. Joachim Wenning
Key figures (IFRS)1
Munich Re at a glance
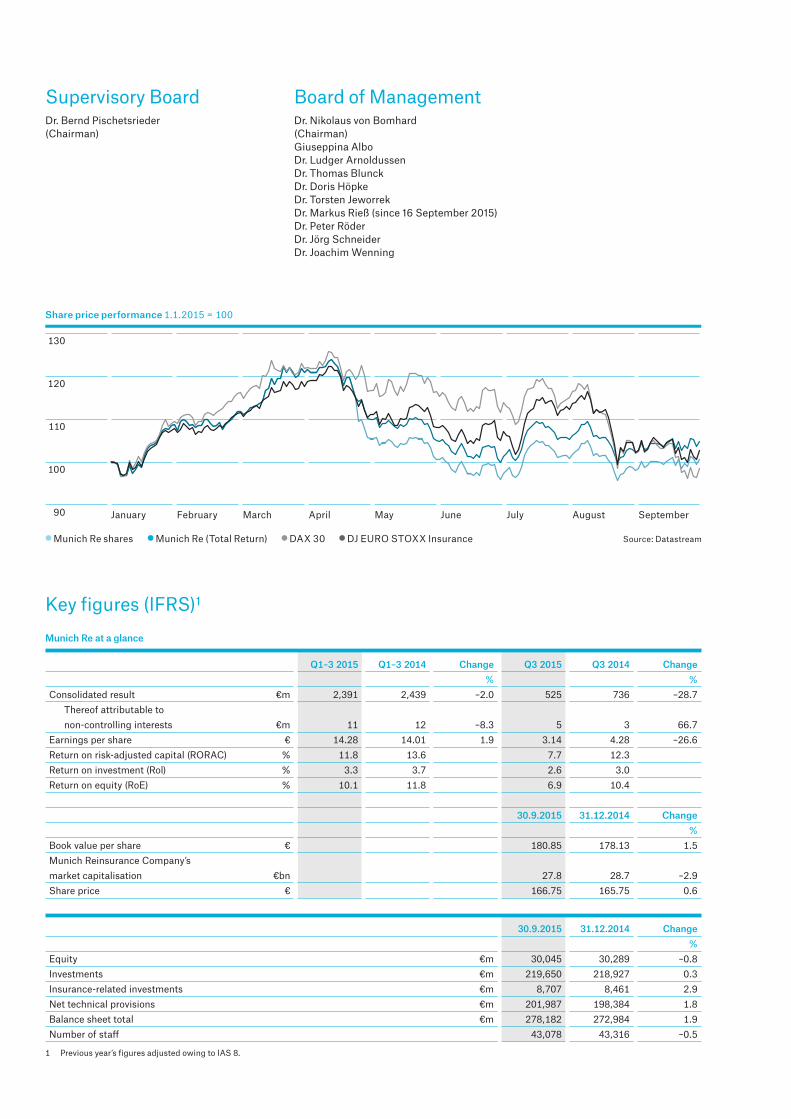
Q1–3 2015 Q1–3 2014 Change Q3 2015 Q3 2014 Change % %Consolidated result €m 2,391 2,439 –2.0 525 736 –28.7
Thereof attributable to non-controlling interests €m 11 12 –8.3 5 3 66.7
Earnings per share € 14.28 14.01 1.9 3.14 4.28 –26.6Return on risk-adjusted capital (RORAC) % 11.8 13.6 7.7 12.3 Return on investment (Rol) % 3.3 3.7 2.6 3.0 Return on equity (RoE) % 10.1 11.8 6.9 10.4
30.9.2015 31.12.2014 Change %Book value per share € 180.85 178.13 1.5Munich Reinsurance Company’s market capitalisation €bn 27.8 28.7 –2.9Share price € 166.75 165.75 0.6
30.9.2015 31.12.2014 Change %Equity €m 30,045 30,289 –0.8Investments €m 219,650 218,927 0.3Insurance-related investments €m 8,707 8,461 2.9Net technical provisions €m 201,987 198,384 1.8Balance sheet total €m 278,182 272,984 1.9Number of staff 43,078 43,316 –0.5
1 Previous year’s figures adjusted owing to IAS 8.
Munich Re shares DAX 30 DJ EURO STOXX Insurance Source: Datastream
Share price performance 1.1.2015 = 100
Munich Re (Total Return)
January February March April May June July August September
95
100
105
110
115
120
125
130

Contents
Letter to shareholders 3
Interim management report 4
Business environment 4
Business performance 6Overview 6Reinsurance 7ERGO 10Munich Health 14Investment performance 16
Prospects 20
Condensed interim consolidated financial statements as at 30 September 2015 24
Important dates
This document is a translation of the original German version and is intended to be used for informational purposes only. While every effort has been made to ensure the accuracy and completeness of the translation, please note that the German original is binding.
Munich Re Quarterly Report 3/2015


Dear Shareholders,
Sustainability and a long-term view are key aspects of the Munich Re business model. We not only plan far into the future, but also look back on a long history. The fi rst academic study of Munich Re’s history has just been published by the historians Professor Johannes Bähr and Professor Christopher Kopper.1
Munich Re’s rise to its position as one of the world’s leading reinsurers has not been without setbacks. The Group has repeatedly faced enormous challenges, most notably two World Wars, along with currency turbulences, economic crises and hyperinfl ation – partly also as a result of these wars. The lessons learned from these crises are still relevant to Munich Re today. Understanding clients’ needs, a readiness to embrace innovation, internationality, conservative investment, and a prudent reserving policy have been part of the Munich Re tradition for 135 years.
A look back at our history shows that ongoing development of products and innovative coverage models as a response to the diff icult market conditions we are experiencing is not uncharted territory for us. Time and time again, Munich Re has succeeded in keeping pace with technical advances, and has always been able to come up with the right covers for the main risks of each era. Once, this might have involved the introduction of machinery insurance, while nowadays this means performance guarantees for renewable energy facilities or cyber policies.
When Munich Re was set up in 1880, we had eight shareholders. Today, that number has risen to almost 200,000. Probably the most well-known of our current share-holders, Warren Buff ett, recently reduced his shareholding. Naturally, we are sorry about this, but we were aware that Berkshire Hathaway has always regarded its invest-ment in Munich Re purely as a fi nancial investment. We are nevertheless convinced that Munich Re is still an attractive investment for share holders, and will remain so in the future – not only because of our sustained high dividends, but also because for years we have been pursuing a strategy of disciplined pricing, cycle management and targeted innovation that makes us more resilient to the varied developments in our business environment.
Munich Re posted a result of €525m in the third quarter of 2015. Overall, the past quarter was not quite as strong as the fi rst two quarters of the year, but – given the very good result for the fi rst six months – we are holding to the annual forecast that we raised as a consequence of our half-year results. The 2015 result should still reach at least €3bn. And you might be interested to learn that in the very fi rst year Munich Re was in business (1880/1881), its profi t amounted to 64,723 Marks.
Yours sincerely,
Nikolaus von Bomhard
To our shareholders
Dr. Nikolaus von BomhardChairman of MunichReinsurance Company’s Board of Management
1 Munich Re: Die Geschichte der Münchener Rück 1880–1980 was published on 26 October 2015 by the Munich publishing house C.H. Beck (463pp., €39.95). An English edition will follow in 2016.
3
Munich Re Quarterly Report 3/2015
Letter to shareholders
Business environment
— Weak global economic growth — Slight fall in long-term interest rates — Sharp falls in the stock markets
Global economic growth remained weak in the third quarter of 2015 and throughout the year. The economies of the USA and the United Kingdom showed solid growth, and the slow recovery in the eurozone continued, driven above all by Germany and Spain. But muted developments in the large emerging markets had an impact on the dynamics of the global economy: in China there were increasing signs of a slowdown in growth, and Brazil and Russia remained mired in recession.
Long-term interest rates declined slightly in the third quarter. Yields on ten-year US government bonds fell from 2.4% at the end of June to 2.0% at the end of September, and German Bunds decreased from 0.8% to 0.6% in the same period. This decline in interest rates caused the market value of fixed-income bonds to increase. Volatility in the bond markets was more restrained than the turbulence experienced in the second quarter. Yet there was great uncertainty on the global stock markets, triggered by several sharp falls in the Chinese market. Doubts about the pace of growth in China, the financial stability of other emerging markets and continuing low inflation resulted in the US Federal Reserve leaving its key interest rates unchanged at 0.0%–0.25%.
As against 31 December 2014, interest rates were somewhat higher at the end of the third quarter 2015, although still very low by long-term comparison. This has a negative impact on insurers when they invest and reinvest on behalf of their clients, because yields on new fixed-interest securities with high ratings are far lower than the average return on the securities maturing or sold. This has a particularly adverse effect on life insurers, which have to meet interest-rate guarantees.
Interim management report
4
Munich Re Quarterly Report 3/2015
Interim management reportBusiness environment

We write a large portion of our business outside the eurozone. Therefore, appreciation of the euro has a negative impact on the development of premium income posted in euros, while depreciation has a positive effect. In a year-on-year comparison, during the first three quarters of 2015 the euro exchange rate was significantly lower on average against the US dollar (–18%), the pound sterling (–10%), the Canadian dollar (–5%) and the Japanese yen (–3%). Compared with the same quarter last year, the average euro exchange rate for the third quarter of 2015 was much lower for the US dollar and the pound sterling, only slightly lower for the yen, and marginally up for the Canadian dollar. Overall, currency translation effects have had a positive year-on-year impact on premium income and on other income and expenses in foreign currencies, both for the first nine months and for the third quarter. The value shown for investments, which is translated at period-end exchange rates, was also up in the first nine months owing to currency translation effects. On 30 September 2015, the euro exchange rate of US$ 1.12 was 8% lower than at the end of 2014. The euro was also weaker against the pound sterling (–5%) and the Japanese yen (–8%) at the end of September than at the end of 2014. By contrast, the euro climbed by 6% against the Canadian dollar. For most currencies, development in the third quarter differed significantly from that in the first nine months of the year. At the end of September, by contrast with the end of June, the euro exchange rate was almost unchanged against the US dollar, higher against the pound sterling (4%) and the Canadian dollar (7%), and lower against the yen (–2%).
5Interim management reportBusiness environment
Munich Re Quarterly Report 3/2015

Business performance
Overview
With a consolidated profit of €2.4bn (2.4bn), Munich Re looks back on a gratifying result overall for the first nine months of 2015. For the period from July to September, we posted a profit of €0.5bn (0.7bn). The third quarter of 2015 was marked by a below-average random incidence of major losses, and also by strains on our investment result.
Our premium income increased year on year due to currency translation effects. To avoid taking on risks at inadequate prices, terms and conditions in a highly competitive environment, we refrained from renewing some existing reinsurance treaties. If exchange rates had remained unchanged, premium income would have declined by 3.7%.
Our investment result for the first nine months was below that of the same period last year, as the third quarter was impacted by strains on strategic derivatives and write-downs on shares.
Overall, the operating result benefited from the depreciation in the euro compared with the first three quarters of 2014. We achieved a higher result contribution from the conversion of profits from underwriting business, and investment income in foreign currencies. The revaluation of balance-sheet items in foreign currencies led to a negative currency result in the fist nine months, which is recognised in the “other non-operating result”.
Our tax burden for the first three quarters of 2015 was low, and in the third quarter we even posted tax income of €101m. This owed mainly to differing country-specific tax rates, prior-year taxes, and a revaluation of the provision for tax risks.
Group equity as at 30 September 2015 was at about the same level as at the beginning of the year. The rise in the consolidated result and the reserve for currency translation adjustments was countered primarily by the decrease in unrealised gains on investments and the dividend payment. Compared with the position as at 30 June, our shareholders’ equity decreased by €0.7bn, due primarily to the reduced balance of unrealised gains and losses in our equity portfolio.
QB_200Key figures1
Q1–3 2015 Q1–3 2014 Change Q3 2015 Q3 2014 Change €m €m % €m €m %Gross premiums written 37,986 36,833 3.1 12,481 12,053 3.6Technical result 2,641 2,629 0.5 861 956 –9.9Investment result 5,872 6,030 –2.6 1,531 1,670 –8.3Insurance-related investment result –69 362 – –322 85 –Operating result 3,392 3,372 0.6 579 908 –36.2Taxes on income –300 –296 –1.4 101 11 818.2Consolidated result 2,391 2,439 –2.0 525 736 –28.7
Thereof: Attributable to non-controlling interests 11 12 –8.3 5 3 66.7
30.9.2015 31.12.2014 Change €bn €bn %Equity 30.0 30.3 –0.8
1 Previous year’s figures adjusted owing to IAS 8.
Interim management reportBusiness performance
6
Munich Re Quarterly Report 3/2015
Reinsurance
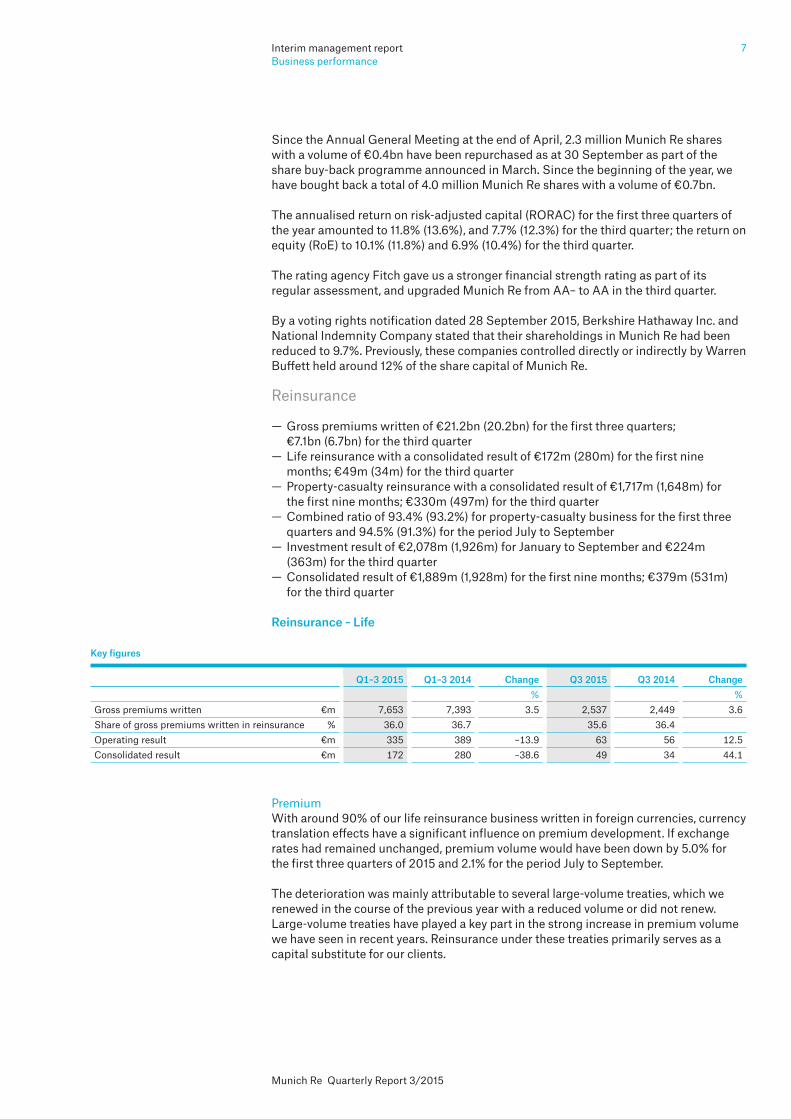
— Gross premiums written of €21.2bn (20.2bn) for the first three quarters; €7.1bn (6.7bn) for the third quarter
— Life reinsurance with a consolidated result of €172m (280m) for the first nine months; €49m (34m) for the third quarter
— Property-casualty reinsurance with a consolidated result of €1,717m (1,648m) for the first nine months; €330m (497m) for the third quarter
— Combined ratio of 93.4% (93.2%) for property-casualty business for the first three quarters and 94.5% (91.3%) for the period July to September
— Investment result of €2,078m (1,926m) for January to September and €224m (363m) for the third quarter
— Consolidated result of €1,889m (1,928m) for the first nine months; €379m (531m) for the third quarter
Reinsurance – Life
PremiumWith around 90% of our life reinsurance business written in foreign currencies, currency translation effects have a significant influence on premium development. If exchange rates had remained unchanged, premium volume would have been down by 5.0% for the first three quarters of 2015 and 2.1% for the period July to September.
The deterioration was mainly attributable to several large-volume treaties, which we renewed in the course of the previous year with a reduced volume or did not renew. Large-volume treaties have played a key part in the strong increase in premium volume we have seen in recent years. Reinsurance under these treaties primarily serves as a capital substitute for our clients.
Key figures
Q1–3 2015 Q1–3 2014 Change Q3 2015 Q3 2014 Change % %Gross premiums written €m 7,653 7,393 3.5 2,537 2,449 3.6Share of gross premiums written in reinsurance % 36.0 36.7 35.6 36.4 Operating result €m 335 389 –13.9 63 56 12.5Consolidated result €m 172 280 –38.6 49 34 44.1
Since the Annual General Meeting at the end of April, 2.3 million Munich Re shares with a volume of €0.4bn have been repurchased as at 30 September as part of the share buy-back programme announced in March. Since the beginning of the year, we have bought back a total of 4.0 million Munich Re shares with a volume of €0.7bn.
The annualised return on risk-adjusted capital (RORAC) for the first three quarters of the year amounted to 11.8% (13.6%), and 7.7% (12.3%) for the third quarter; the return on equity (RoE) to 10.1% (11.8%) and 6.9% (10.4%) for the third quarter.
The rating agency Fitch gave us a stronger financial strength rating as part of its regular assessment, and upgraded Munich Re from AA– to AA in the third quarter.
By a voting rights notification dated 28 September 2015, Berkshire Hathaway Inc. and National Indemnity Company stated that their shareholdings in Munich Re had been reduced to 9.7%. Previously, these companies controlled directly or indirectly by Warren Buffett held around 12% of the share capital of Munich Re.
7Interim management reportBusiness performance
Munich Re Quarterly Report 3/2015
Growth in the Asian insurance markets remains pleasing. In contrast to this, primary insurance business has been impacted by the weak economy in many other markets, which has also dampened demand for reinsurance.
ResultWe are very satisfied with our technical result of €114m (55m) for the past quarter. The chief reason for this gratifying figure was satisfying claims experience overall, which more than offset even the payment of a single mortality claim in the mid two-digit million euro range. Our technical result for the first three quarters thus amounted to €247m (274m).
We posted an investment result of €628m (589m) for the period from January to September and €104m (147m) for the third quarter. The year-on-year improvement from January to September is mainly due to higher regular income from interest- bearing investments. The decline in the third quarter derived in particular from the poorer result of write-downs and write-ups of equities.
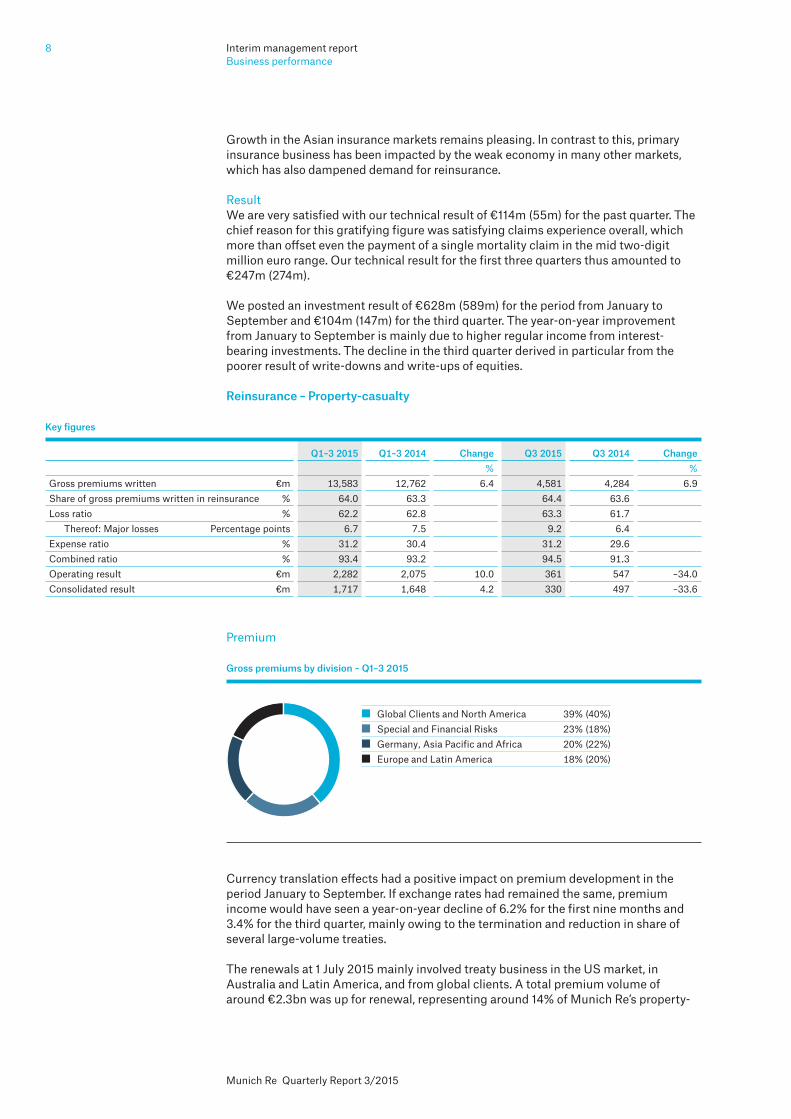
Reinsurance – Property-casualty
Premium
Currency translation effects had a positive impact on premium development in the period January to September. If exchange rates had remained the same, premium income would have seen a year-on-year decline of 6.2% for the first nine months and 3.4% for the third quarter, mainly owing to the termination and reduction in share of several large-volume treaties.
The renewals at 1 July 2015 mainly involved treaty business in the US market, in Australia and Latin America, and from global clients. A total premium volume of around €2.3bn was up for renewal, representing around 14% of Munich Re’s property-
Key figures
Q1–3 2015 Q1–3 2014 Change Q3 2015 Q3 2014 Change % %Gross premiums written €m 13,583 12,762 6.4 4,581 4,284 6.9Share of gross premiums written in reinsurance % 64.0 63.3 64.4 63.6 Loss ratio % 62.2 62.8 63.3 61.7
Thereof: Major losses Percentage points 6.7 7.5 9.2 6.4 Expense ratio % 31.2 30.4 31.2 29.6 Combined ratio % 93.4 93.2 94.5 91.3 Operating result €m 2,282 2,075 10.0 361 547 –34.0Consolidated result €m 1,717 1,648 4.2 330 497 –33.6
Gross premiums by division – Q1–3 2015
Global Clients and North America 39% (40%) Special and Financial Risks 23% (18%) Germany, Asia Pacific and Africa 20% (22%) Europe and Latin America 18% (20%)
Interim management reportBusiness performance
8
Munich Re Quarterly Report 3/2015
casualty business. Pressure on prices, terms and conditions remained high, in particular for natural catastrophe covers, which accounted for about 20% of these renewals. Prices declined by 2.1% (previous year’s renewals as at 1 July 2014: –3.6%), which could be interpreted as an initial sign of price stabilisation. Premium volume remained almost constant, as Munich Re was able to take advantage of selective opportunities in individual markets, but withdrew from business in other areas due to pricing pressures. Nevertheless, our portfolio remained profitable even after the fall in prices in recent renewal rounds of 1.6% for 2015 overall.
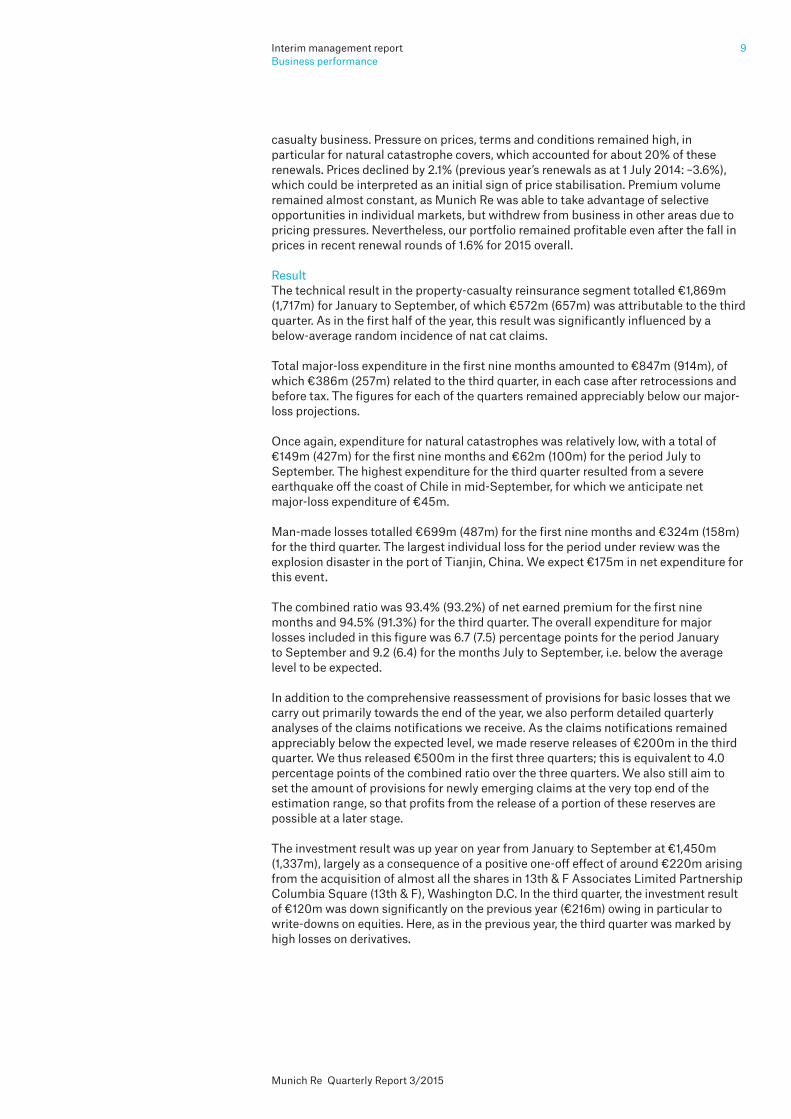
ResultThe technical result in the property-casualty reinsurance segment totalled €1,869m (1,717m) for January to September, of which €572m (657m) was attributable to the third quarter. As in the first half of the year, this result was significantly influenced by a below-average random incidence of nat cat claims.
Total major-loss expenditure in the first nine months amounted to €847m (914m), of which €386m (257m) related to the third quarter, in each case after retrocessions and before tax. The figures for each of the quarters remained appreciably below our major-loss projections.
Once again, expenditure for natural catastrophes was relatively low, with a total of €149m (427m) for the first nine months and €62m (100m) for the period July to September. The highest expenditure for the third quarter resulted from a severe earthquake off the coast of Chile in mid-September, for which we anticipate net major-loss expenditure of €45m.
Man-made losses totalled €699m (487m) for the first nine months and €324m (158m) for the third quarter. The largest individual loss for the period under review was the explosion disaster in the port of Tianjin, China. We expect €175m in net expenditure for this event.
The combined ratio was 93.4% (93.2%) of net earned premium for the first nine months and 94.5% (91.3%) for the third quarter. The overall expenditure for major losses included in this figure was 6.7 (7.5) percentage points for the period January to September and 9.2 (6.4) for the months July to September, i.e. below the average level to be expected.
In addition to the comprehensive reassessment of provisions for basic losses that we carry out primarily towards the end of the year, we also perform detailed quarterly a nalyses of the claims notifications we receive. As the claims notifications remained appreciably below the expected level, we made reserve releases of €200m in the third quarter. We thus released €500m in the first three quarters; this is equivalent to 4.0 percentage points of the combined ratio over the three quarters. We also still aim to set the amount of provisions for newly emerging claims at the very top end of the estimation range, so that profits from the release of a portion of these reserves are possible at a later stage.
The investment result was up year on year from January to September at €1,450m (1,337m), largely as a consequence of a positive one-off effect of around €220m arising from the acquisition of almost all the shares in 13th & F Associates Limited Partnership Columbia Square (13th & F), Washington D.C. In the third quarter, the investment result of €120m was down significantly on the previous year (€216m) owing in particular to write-downs on equities. Here, as in the previous year, the third quarter was marked by high losses on derivatives.
9Interim management reportBusiness performance
Munich Re Quarterly Report 3/2015

ERGO
— Total premium income of €13.4bn (13.6bn) for the first three quarters; €4.3bn (4.3bn) for the third quarter
— Gross premiums written of €12.5bn (12.6bn) for the first three quarters; €4.0bn (4.0bn) for the third quarter
— ERGO Life and Health Germany with a consolidated result of €133m (139m) for the first nine months; €28m (73m) for the third quarter
— ERGO Property-casualty Germany with a consolidated result of €233m (157m) for the first nine months; €46m (31m) for the third quarter
— Combined ratio for ERGO Property-casualty Germany of 95.8% (94.7%) for the first three quarters and 96.1% (93.5%) for the third quarter
— ERGO International with a consolidated result of €52m (120m) for the first nine months; €26m (48m) for the third quarter
— Combined ratio of 101.1% (97.5%) for ERGO International for the first three quarters; 104.1% (100.0%) for the period July to September
— Investment result of €3.7bn (4.0bn) for January to September and €1.3bn (1.3bn) for the third quarter
— Consolidated result of €418m (416m) for the first nine months; €100m (152m) for the third quarter
ERGO Life and Health Germany
PremiumIn the ERGO Life and Health Germany segment, we report on German life business, German health business and German direct business.
Overall premium income in the ERGO Life and Health Germany segment decreased due to continuing poor market conditions and an ongoing struggle with low interest rates.
Gross premiums by business segment – Q1–3 2015
Life Germany 33% (36%) Health Germany 56% (54%) Direct business Germany 11% (10%)
1 Total premium income includes not only gross premiums written but also savings premiums for unit-linked life insurance and capitalisation products in accordance with the applicable statutory accounting guidelines.
Key figures
Q1–3 2015 Q1–3 2014 Change Q3 2015 Q3 2014 Change % %Total premium income1 €m 7,697 7,992 –3.7 2,511 2,605 –3.6Gross premiums written €m 7,025 7,314 –4.0 2,298 2,409 –4.6Share of gross premiums written by ERGO % 56.2 57.9 57.9 60.0 Operating result €m 314 311 1.0 83 106 –21.7Consolidated result €m 133 139 –4.3 28 73 –61.6
Interim management reportBusiness performance
10
Munich Re Quarterly Report 3/2015
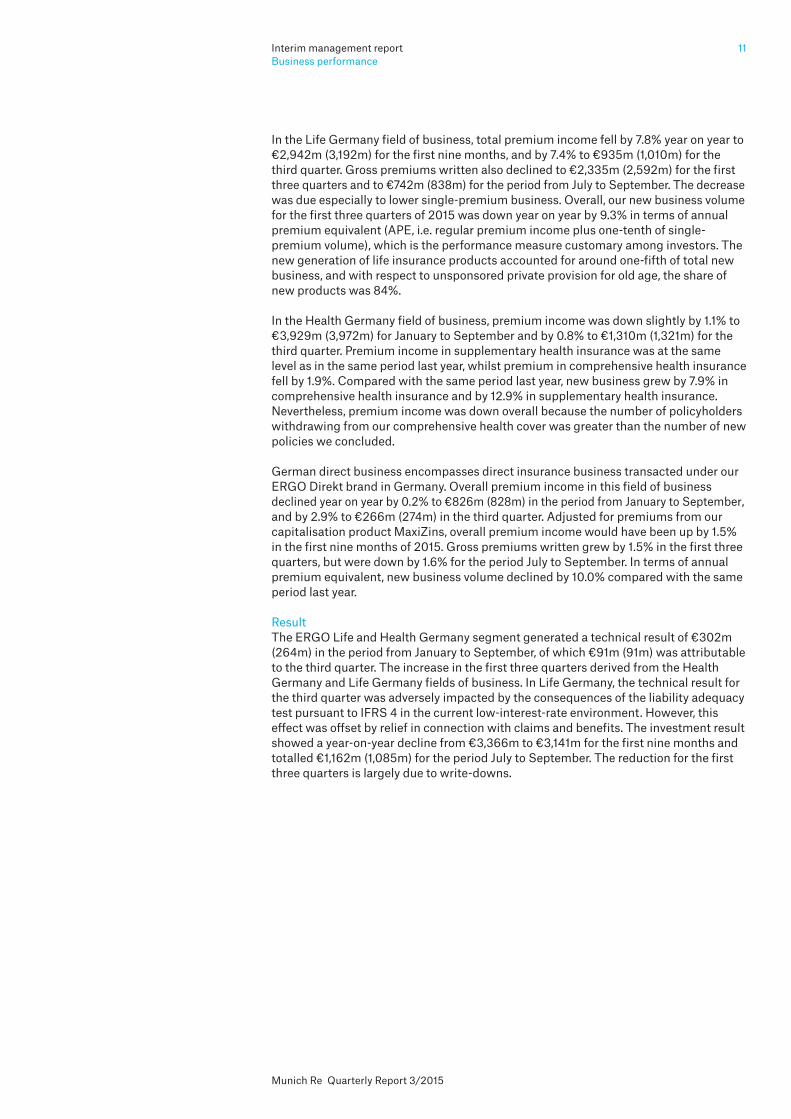
In the Life Germany field of business, total premium income fell by 7.8% year on year to €2,942m (3,192m) for the first nine months, and by 7.4% to €935m (1,010m) for the third quarter. Gross premiums written also declined to €2,335m (2,592m) for the first three quarters and to €742m (838m) for the period from July to September. The decrease was due especially to lower single-premium business. Overall, our new business volume for the first three quarters of 2015 was down year on year by 9.3% in terms of annual premium equivalent (APE, i.e. regular premium income plus one-tenth of single- premium volume), which is the performance measure customary among investors. The new generation of life insurance products accounted for around one-fifth of total new business, and with respect to unsponsored private provision for old age, the share of new products was 84%.
In the Health Germany field of business, premium income was down slightly by 1.1% to €3,929m (3,972m) for January to September and by 0.8% to €1,310m (1,321m) for the third quarter. Premium income in supplementary health insurance was at the same level as in the same period last year, whilst premium in comprehensive health insurance fell by 1.9%. Compared with the same period last year, new business grew by 7.9% in comprehensive health insurance and by 12.9% in supplementary health insurance. Nevertheless, premium income was down overall because the number of policyholders withdrawing from our comprehensive health cover was greater than the number of new policies we concluded.
German direct business encompasses direct insurance business transacted under our ERGO Direkt brand in Germany. Overall premium income in this field of business declined year on year by 0.2% to €826m (828m) in the period from January to September, and by 2.9% to €266m (274m) in the third quarter. Adjusted for premiums from our capitalisation product MaxiZins, overall premium income would have been up by 1.5% in the first nine months of 2015. Gross premiums written grew by 1.5% in the first three quarters, but were down by 1.6% for the period July to September. In terms of annual premium equivalent, new business volume declined by 10.0% compared with the same period last year.
ResultThe ERGO Life and Health Germany segment generated a technical result of €302m (264m) in the period from January to September, of which €91m (91m) was attributable to the third quarter. The increase in the first three quarters derived from the Health Germany and Life Germany fields of business. In Life Germany, the technical result for the third quarter was adversely impacted by the consequences of the liability adequacy test pursuant to IFRS 4 in the current low-interest-rate environment. However, this effect was offset by relief in connection with claims and benefits. The investment result showed a year-on-year decline from €3,366m to €3,141m for the first nine months and totalled €1,162m (1,085m) for the period July to September. The reduction for the first three quarters is largely due to write-downs.
11Interim management reportBusiness performance
Munich Re Quarterly Report 3/2015
ERGO Property-casualty Germany
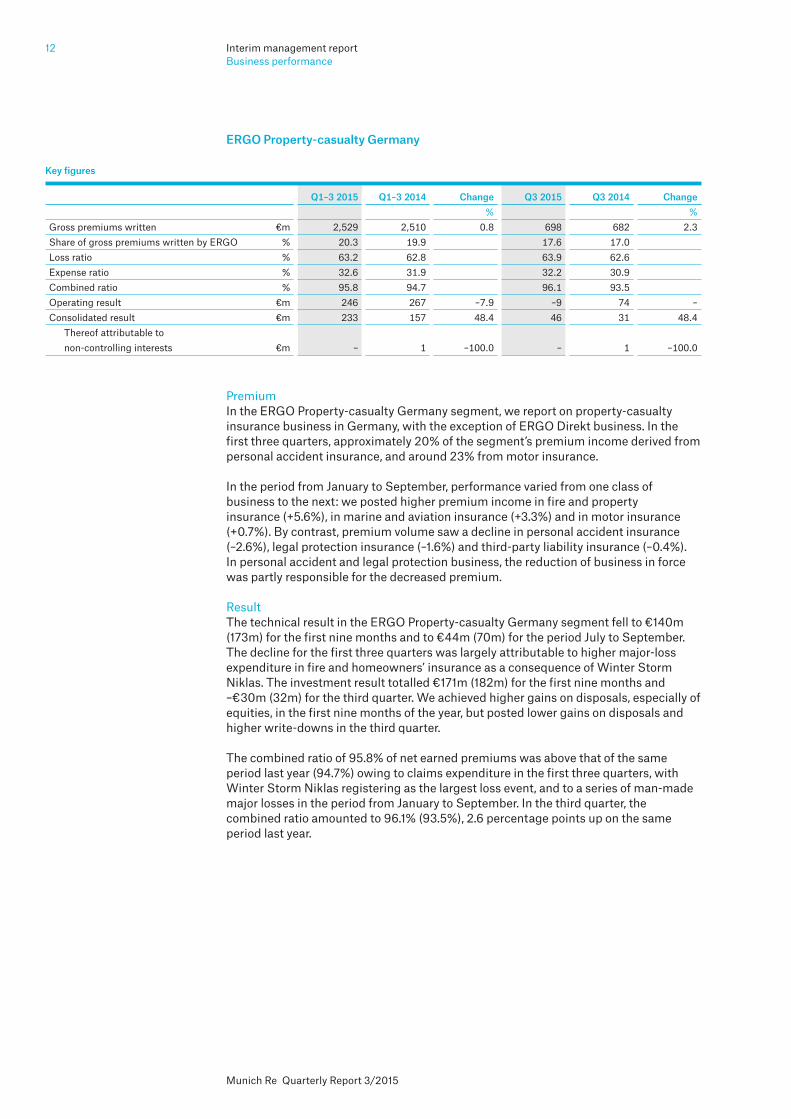
PremiumIn the ERGO Property-casualty Germany segment, we report on property-casualty insurance business in Germany, with the exception of ERGO Direkt business. In the first three quarters, approximately 20% of the segment’s premium income derived from personal accident insurance, and around 23% from motor insurance.
In the period from January to September, performance varied from one class of business to the next: we posted higher premium income in fire and property insurance (+5.6%), in marine and aviation insurance (+3.3%) and in motor insurance (+0.7%). By contrast, premium volume saw a decline in personal accident insurance (–2.6%), legal protection insurance (–1.6%) and third-party liability insurance (–0.4%). In personal accident and legal protection business, the reduction of business in force was partly responsible for the decreased premium.
ResultThe technical result in the ERGO Property-casualty Germany segment fell to €140m (173m) for the first nine months and to €44m (70m) for the period July to September. The decline for the first three quarters was largely attributable to higher major-loss expenditure in fire and homeowners’ insurance as a consequence of Winter Storm Niklas. The investment result totalled €171m (182m) for the first nine months and –€30m (32m) for the third quarter. We achieved higher gains on disposals, especially of equities, in the first nine months of the year, but posted lower gains on disposals and higher write-downs in the third quarter.
The combined ratio of 95.8% of net earned premiums was above that of the same period last year (94.7%) owing to claims expenditure in the first three quarters, with Winter Storm Niklas registering as the largest loss event, and to a series of man-made major losses in the period from January to September. In the third quarter, the combined ratio amounted to 96.1% (93.5%), 2.6 percentage points up on the same period last year.
Key figures
Q1–3 2015 Q1–3 2014 Change Q3 2015 Q3 2014 Change % %Gross premiums written €m 2,529 2,510 0.8 698 682 2.3Share of gross premiums written by ERGO % 20.3 19.9 17.6 17.0 Loss ratio % 63.2 62.8 63.9 62.6 Expense ratio % 32.6 31.9 32.2 30.9 Combined ratio % 95.8 94.7 96.1 93.5 Operating result €m 246 267 –7.9 –9 74 –Consolidated result €m 233 157 48.4 46 31 48.4
Thereof attributable to non-controlling interests €m – 1 –100.0 – 1 –100.0
Interim management reportBusiness performance
12
Munich Re Quarterly Report 3/2015

ERGO International
PremiumIn the ERGO International segment, we bundle our life and property-casualty insurance business outside Germany. In the first nine months of 2015, approximately 39% of the segment’s premium income stemmed from life insurance, and around 61% from property-casualty insurance. Our biggest markets are Poland, which accounts for approximately 32% of the premium volume, Austria with around 17%, and Belgium with some 10%.
We saw an increase in premium income for the period from January to September and for the third quarter, with good organic growth particularly in Poland and Turkey. Premium growth in the United Kingdom was significantly due to positive currency translation effects. Adjusted to eliminate these effects, gross premiums written in the ERGO International segment were up year on year by 4.5% for the first nine months, and by 6.7% for the third quarter.
In international life insurance business, we posted overall premium income of €1,412m (1,457m) for the first nine months of 2015, of which €445m (491m) was attributable to the period from July to September. Good organic growth in Poland contrasted with decreases in premium income in particular in Belgium and Austria. In the first nine months, international new life insurance business was down by 20.2% compared with the same period last year. The decline was due especially to lower regular premium income in Russia. In international property-casualty business, gross premium totalled €1,791m (1,640m) for the period from January to September and €608m (525m) for the third quarter. The development of premium income was gratifying, especially in Poland and Turkey. Our new property-casualty insurer in Singapore contributed €28m (8m) to our premium income in the first nine months.
ResultThe technical result in the ERGO International segment totalled €50m (113m) for the period from January to September, and €5m (33m) for the third quarter. The main reason for the reduction in the first nine months of 2015 was the year-on-year increase in expenditure in Belgium, the UK and Poland. We posted an investment result of €390m (498m) for January to September and €150m (175m) for the third quarter. The decrease is primarily due to higher losses on derivatives and to write-downs.
Key figures
Q1–3 2015 Q1–3 2014 Change Q3 2015 Q3 2014 Change % %Total premium income1 €m 3,203 3,097 3.4 1,053 1,016 3.6Gross premiums written €m 2,936 2,811 4.4 974 926 5.2Share of gross premiums written by ERGO % 23.5 22.2 24.5 23.0 Loss ratio % 61.7 59.2 66.5 60.8 Expense ratio % 39.4 38.3 37.6 39.2 Combined ratio % 101.1 97.5 104.1 100.0 Operating result €m 129 219 –41.1 39 74 –47.3Consolidated result €m 52 120 –56.7 26 48 –45.8
Thereof attributable to non-controlling interests €m 10 7 42.9 4 1 300.0
1 Total premium income includes not only gross premiums written but also savings premiums for unit-linked life insurance and capitalisation products in accordance with the applicable statutory accounting guidelines.
13Interim management reportBusiness performance
Munich Re Quarterly Report 3/2015

Munich Health
— Gross premiums written of €4.3bn (4.0bn) for the first three quarters; €1.4bn (1.3bn) for the third quarter
— Combined ratio of 99.6% (98.5%) for the first three quarters and 98.5% (96.7%) for the third quarter
— Investment result of €92m (58m) for January to September and €25m (15m) for the third quarter
— Consolidated result of €84m (95m) for the first nine months; €46m (53m) for the third quarter
Premium
1 Excluding business conducted like life insurance.
Key figures
Q1–3 2015 Q1–3 2014 Change Q3 2015 Q3 2014 Change % %Gross premiums written €m 4,260 4,043 5.4 1,393 1,303 6.9Loss ratio1 % 84.8 82.0 85.1 80.9 Expense ratio1 % 14.8 16.5 13.4 15.8 Combined ratio1 % 99.6 98.5 98.5 96.7 Operating result €m 86 111 –22.5 42 51 –17.6Consolidated result €m 84 95 –11.6 46 53 –13.2
Thereof attributable to non-controlling interests €m 1 4 –75.0 1 1 –
Gross premiums – Q1–3 2015
Reinsurance North America 54% (55%) Europe and Latin America 9% (12%) Middle East/Africa 9% (7%) Asia-Pacific 4% (2%)
Primary insurance
Spain 13% (13%) Belgium 9% (9%) Other 2% (2%)
The increase in the combined ratio to 101.1% (97.5%) of net earned premiums for the period from January to September was especially due to the higher loss ratio, which was partly due to the keen competition in Poland. Additionally, the rise was attributable to higher loss reserves in Turkey and the UK. In international property-casualty business, the expense ratio also saw a rise, not least because of the disproportionate increase in acquisition costs in the UK. The figure for the third quarter was 104.1% (100.0%).
Interim management reportBusiness performance
14
Munich Re Quarterly Report 3/2015

In reinsurance, the rise in premium volume by 6.7% to €3.3bn (3.1bn) in the first three quarters of 2015 was mainly attributable to positive currency translation effects, particularly from the exchange rate of the Canadian dollar and US dollar. In primary insurance, premium income increased slightly to €980m (970m), despite the sale of our share in DKV Luxembourg as at 1 January 2015. If exchange rates had remained unchanged, and adjusted for this sale, Munich Health’s gross premiums would have decreased by 0.5% year on year, mainly owing to the reduction of Munich Re’s share in a large-volume treaty in North America as at 1 April 2014.
Result Our technical result of €33m (88m) for the period from January to September and €35m (50m) for the third quarter was significantly down year on year, mainly due to a decreased result at DKV Belgium, which was attributable to increased medical inflation, and a higher claims burden in reinsurance.
The Munich Health combined ratio of 99.6% (98.5%) for the period January to September and 98.5% (96.7%) for the third quarter relates only to short-term health business, not to business conducted like life insurance. Business conducted like life insurance accounted for 8.9% (9.8%) of gross premiums written in the first three quarters of 2015. In reinsurance, the combined ratio amounted to 100.8% (99.5%) for the first nine months and 101.3% (99.7%) for the third quarter. In primary insurance, the combined ratio totalled 92.7% (92.9%) for the first nine months and 83.8% (81.1%) for the third quarter.
The investment result improved year on year to €92m (58m) for the period from January to September, mainly owing to gains on a subsequent purchase price adjustment from the sale of the Windsor Health Group. In the third quarter, the investment result rose to €25m (15m), because in the same period last year write-downs for impairment on investments in associates had to be made.
15Interim management reportBusiness performance
Munich Re Quarterly Report 3/2015

Investment performance
— Market values of €235.4bn (235.8bn) almost unchanged since beginning of year — Decrease in valuation reserves to €27.4bn (32.0bn) — Investment result of €5.9bn (6.0bn) for the first three quarters; €1.5bn (1.7bn) for the third quarter
We gear the selection of our investments to the economic characteristics of our technical provisions and liabilities. In addition, we use derivative financial instruments for port folio management (especially for acquisition preparation) and hedging against fluctuations on the interest-rate, equity and currency markets. Volatility in the markets results in changes in the values of derivatives, which under IFRS accounting we recognise in profit or loss.
Investments by type according to carrying amounts
30.9.2015 31.12.2014 Change €m €m %Land and buildings, including buildings on third-party land 4,155 3,732 11.3Investments in affiliated companies 229 274 –16.4Investments in associates and joint ventures 1,210 1,285 –5.8Loans 53,852 54,550 –1.3Other securities held to maturity – – –Other securities available for sale
Fixed-interest 130,881 129,806 0.8Non-fixed-interest 14,233 14,037 1.4
Other securities at fair value through profit or loss Held for trading
Fixed-interest 30 45 –33.3Non-fixed-interest 54 45 20.0Derivatives 2,285 1,874 21.9
Designated as at fair value through profit or loss Fixed-interest 170 204 –16.7Non-fixed-interest 1 1 –
Deposits retained on assumed reinsurance 8,430 8,750 –3.7Other investments 4,120 4,324 –4.7Total 219,650 218,927 0.3
Total: €220bn (219bn)
Distribution of investments by type
Fixed-interest securities 60% (60%) Loans 24% (25%) Miscellaneous investments 8% (8%) Shares and equity funds 5% (4%) Real estate 2% (2%) Participating interests 1% (1%)
Interim management reportBusiness performance
16
Munich Re Quarterly Report 3/2015

Our investment portfolio is decisively shaped by fixed-interest securities and loans. In the first quarter of 2015, interest rates fell to a historic low; in the second quarter, they climbed markedly and fell again marginally in the third quarter. As at 30 September, they were at around the same level as at the end of 2014. The carrying and market values of our investments have remained almost unchanged since the start of the year.
In the period under review, we increased our portfolio of government and corporate bonds, but slightly reduced our investments in covered bonds, credit derivatives and structured credit products.
In particular, the moderate increase in spreads compared with the beginning of the year and the gains on the disposal of fixed-interest securities and equities resulted in a decrease in on- and off-balance-sheet gains and losses, which will only be posted to the income statement upon disposal of the relevant investments. Including investments in affiliated companies and associates, these dropped from €32.0bn at 31 December 2014 to €27.4bn at 30 September 2015.
As at the reporting date, our portfolio of fixed-interest securities was made up as follows:
Off-balance-sheet unrealised gains and losses
Off-balance-sheet Fair values unrealised gains and losses Carrying amounts€m 30.9.2015 31.12.2014 30.9.2015 31.12.2014 30.9.2015 31.12.2014Land and buildings1 9,138 8,647 2,588 2,491 6,550 6,156Associates 1,627 1,796 422 516 1,205 1,280Loans 67,084 68,950 13,232 14,400 53,852 54,550Other securities – – – – – –Total 77,849 79,393 16,242 17,407 61,607 61,986
1 Including owner-occupied property.
Other securities available for sale
On-balance-sheet Carrying amounts unrealised gains and losses At amortised cost€m 30.9.2015 31.12.2014 30.9.2015 31.12.2014 30.9.2015 31.12.2014Fixed-interest 130,881 129,806 9,286 11,967 121,595 117,839Non-fixed-interest 14,233 14,037 1,603 2,270 12,630 11,767Total 145,114 143,843 10,889 14,237 134,225 129,606
1 Presentation essentially shows fixed-interest securities and loans, including deposits with banks, at market value. The approximation is not fully comparable with the IFRS figures.
2 Including other public issuers and government-guaranteed bank bonds.
Total: €207bn (207bn)
Fixed-interest portfolio according to economic categories1
Government bonds2 52% (50%) Thereof: Inflation-linked bonds 8% (8%)
Pfandbriefs/Covered bonds 25% (27%) Corporate bonds 10% (10%) Cash/Other 4% (4%) Bank bonds 3% (3%) Structured products (credit structures) 3% (3%) Policy and mortgage loans 3% (3%)
17Interim management reportBusiness performance
Munich Re Quarterly Report 3/2015

A total of 52% of our fixed-interest portfolio was invested in government bonds at the reporting date. In the current financial year, new investments have mainly been made in US and French government bonds. The purchase of government bonds from emerging markets is also part of our balanced investment strategy. Reductions focused on our holdings of bonds from German and Austrian issuers. The vast majority of our government bonds continue to come from countries with a high credit rating. As part of our risk management, we gear our risk capital requirements and limits to the ratings of the relevant issuers, and do not treat any of the bonds as risk-free. At present, 45% of our government bond portfolio is made up of German and US bonds, with Italian, Spanish, Portuguese and Irish issuers accounting for 10%. We do not hold any government bonds from Greece, Cyprus or Argentina.
Our portfolio of covered bonds decreased. Above all, we reduced our holdings of German, Spanish and French covered bonds.
Our investment in bank bonds is limited and at the reporting date amounted to 3% (3%) of our portfolio of fixed-interest securities. Corporate bonds from other sectors account for 10% (10%) of our fixed-interest securities.
We ensure that the maturities of fixed-interest investments do not deviate significantly from those of our liabilities. Thanks to this active duration management, the economic interest-rate risk within the Group remains at an acceptable level, even in a low-interest-rate environment.
The carrying amount of our equity portfolio (before taking derivatives into account, and including investments in affiliated companies, associates and joint ventures at market value) fell slightly in the first three quarters owing to price development. Our equity-backing ratio was 5.1% (5.2%). The derivatives used to hedge our equity portfolio were decreased marginally, thus slightly increasing our equity exposure. Including hedges, our equity-backing ratio was 4.2% (4.3%). Besides this, we are protecting ourselves against accelerated inflation. For this, we hold inflation-linked bonds with a volume (at market values) of €8.6bn (8.5bn) and inflation-linked swaps with an exposure of €4.2bn (5.9bn). Real assets like shares, property, commodities, and investments in infra structure, renewable energies and new technologies also serve as protection against inflation. Additionally, our investments in real assets have a positive diversification effect on the overall portfolio. In the third quarter, we extended our infrastructure investments within the framework of a consortium with a share in the German motorway service station operator Tank & Rast.
1 Presentation essentially shows fixed-interest securities and loans at market value. The approximation is not fully comparable with the IFRS figures.
Fixed-interest securities: Bank bonds1
% 30.9.2015 31.12.2014Senior bonds 80 81Loss-bearing bonds 5 5Subordinated bonds 15 14
Interim management reportBusiness performance
18
Munich Re Quarterly Report 3/2015
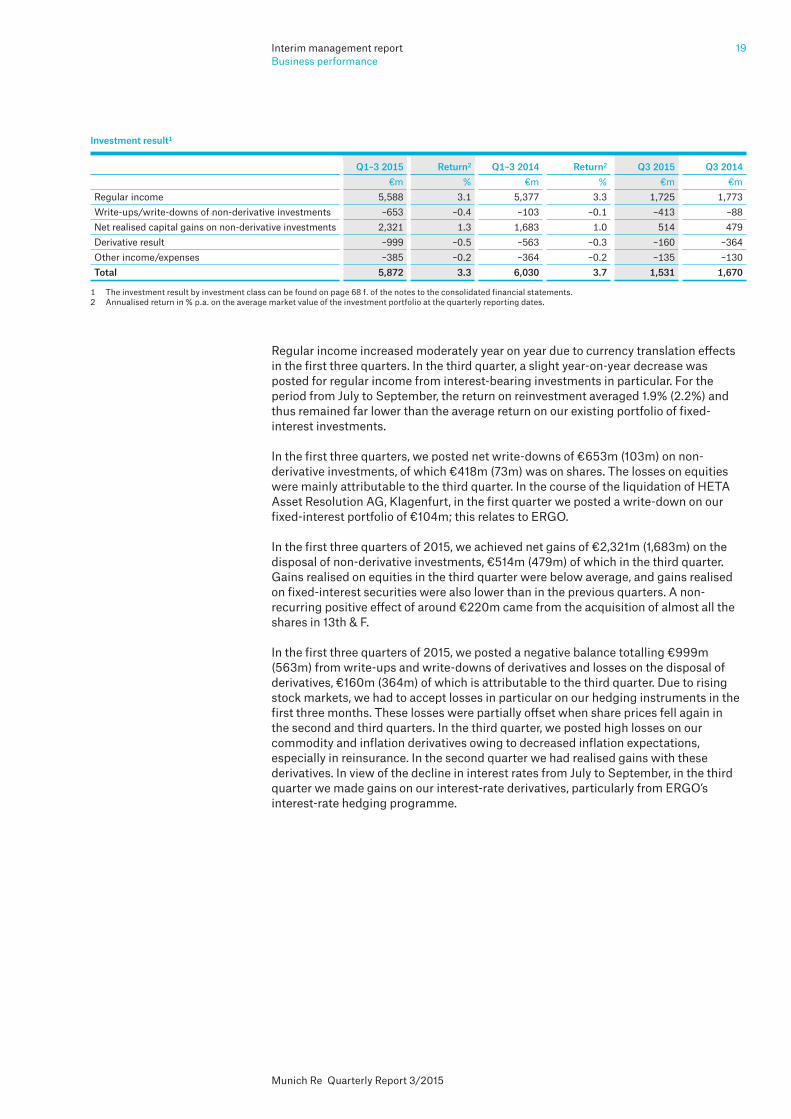
Regular income increased moderately year on year due to currency translation effects in the first three quarters. In the third quarter, a slight year-on-year decrease was posted for regular income from interest-bearing investments in particular. For the period from July to September, the return on reinvestment averaged 1.9% (2.2%) and thus remained far lower than the average return on our existing portfolio of fixed- interest investments.
In the first three quarters, we posted net write-downs of €653m (103m) on non- derivative investments, of which €418m (73m) was on shares. The losses on equities were mainly attributable to the third quarter. In the course of the liquidation of HETA Asset Resolution AG, Klagenfurt, in the first quarter we posted a write-down on our fixed-interest portfolio of €104m; this relates to ERGO.
In the first three quarters of 2015, we achieved net gains of €2,321m (1,683m) on the disposal of non-derivative investments, €514m (479m) of which in the third quarter. Gains realised on equities in the third quarter were below average, and gains realised on fixed-interest securities were also lower than in the previous quarters. A non- recurring positive effect of around €220m came from the acquisition of almost all the shares in 13th & F.
In the first three quarters of 2015, we posted a negative balance totalling €999m (563m) from write-ups and write-downs of derivatives and losses on the disposal of derivatives, €160m (364m) of which is attributable to the third quarter. Due to rising stock markets, we had to accept losses in particular on our hedging instruments in the first three months. These losses were partially offset when share prices fell again in the second and third quarters. In the third quarter, we posted high losses on our commodity and inflation derivatives owing to decreased inflation expectations, especially in reinsurance. In the second quarter we had realised gains with these derivatives. In view of the decline in interest rates from July to September, in the third quarter we made gains on our interest-rate derivatives, particularly from ERGO’s interest-rate hedging programme.
Investment result1
Q1–3 2015 Return2 Q1–3 2014 Return2 Q3 2015 Q3 2014 €m % €m % €m €mRegular income 5,588 3.1 5,377 3.3 1,725 1,773Write-ups/write-downs of non-derivative investments –653 –0.4 –103 –0.1 –413 –88Net realised capital gains on non-derivative investments 2,321 1.3 1,683 1.0 514 479Derivative result –999 –0.5 –563 –0.3 –160 –364Other income/expenses –385 –0.2 –364 –0.2 –135 –130Total 5,872 3.3 6,030 3.7 1,531 1,670
1 The investment result by investment class can be found on page 68 f. of the notes to the consolidated financial statements.2 Annualised return in % p.a. on the average market value of the investment portfolio at the quarterly reporting dates.
19Interim management reportBusiness performance
Munich Re Quarterly Report 3/2015

Prospects
— Gross premium of around €50bn expected — Return on investment likely to be around 3.0% — Result target of at least €3bn still valid
Our expectations for the future are based primarily on planning figures and forecasts whose realisation we, of course, cannot guarantee. Losses from natural catastrophes and other major losses, for example, can have a strong effect on the result of the reporting period in which they randomly and unforeseeably occur. Late-reported claims for major loss events can also lead to significant fluctuations in individual quarterly or annual results. In addition, changes in tax parameters and other special factors can have a considerable impact. The results of individual quarters are therefore not always a reliable indicator for the results of the financial year as a whole.
Fluctuations of the capital markets and exchange rates as well as the special features of IFRS accounting also make it difficult to provide a forecast. Thus, there may be significant fluctuations in the investment result, currency result and consolidated result, despite the fact that our assets are geared to the characteristics of our liabilities. Changes in market value, and net gains or losses on the disposal of derivatives used by us as hedging instruments and for fine-tuning investments, can also substantially impact the result. Changes in exchange rates influence our premium income and results in different directions, depending on which foreign currencies are affected. There may be significant swings if exchange-rate fluctuations are strong, although economically speaking – relative to the volume of our business and our investments – we hold few open currency items on our books.
Compared with our statements in the half-year financial report, we can confirm our premium-income projections in all fields of business for the 2015 financial year. With regard to the result, especially of our investments, our expectations in view of the third-quarter burdens are somewhat more subdued than they were towards the middle of the year. Nevertheless, we are holding to our forecast of at least €3bn for the 2015 consolidated result.
Reinsurance
Reinsurance remains an attractive business field with a wide variety of long-term earnings opportunities for us. Although insurance density in many industrialised countries is already high, even these markets often have an additional need for insurance cover. For example, weather-related natural hazards exposure is showing an increasing trend as the climate changes and the concentration of values in particularly exposed regions becomes greater. And even previously, only a small portion of the overall economic losses from major natural catastrophes was insured. In growth regions, there is increasing demand for insurance to protect manufacturing capacity and the rising prosperity of the population. Technological advances, and economic and social upheavals, are creating new and changing coverage demands that need to be met through the ongoing development of products and innovations. Moreover, all around the world, only a small portion of the risks from potential liability claims by third parties are insured. As a result, the strongly increasing capacity supply in the primary insurance and reinsurance sectors at present is matched by a demand potential in many classes of business that is not yet exhausted.
As a well-diversified reinsurer with extensive know-how, Munich Re is able to offer its cedants specialist consulting services and comprehensive solutions. Reinsurance provides primary insurers with efficient and flexible protection against major claims and accumulation losses, and strengthens their capital base. In addition to this, we devise innovative coverage concepts that go beyond the scope of traditional reinsurance and, to an increasing extent, also beyond the conventional boundaries of
Interim management reportProspects
20
Munich Re Quarterly Report 3/2015

insurability. Thus, for example, we provide non-damage business interruption insurance, coverage for internet and reputational risks, and for the effects of weather fluctuations on the financial position of companies. We make every effort to analyse new and altered risks in conjunction with our clients, in order to be able to offer them tailor-made insurance solutions. This allows us to take advantage of profit potential, and balance out some of the reductions in traditional business. In connection with alternative risk transfer, we exploit the advantages of the dynamic market environment and securitise insurance risks on the capital markets both for our clients and for ourselves. We also partner our clients in the often challenging task of adjusting to changes in regulatory requirements, which are currently being revised in many countries.
Gross premiums in reinsurance should be in the range of around €28bn overall in 2015, which is an improvement on the previous year. The increase of approximately €1.5bn compared with the median value of the forecast we made in our annual report for 2014 is due primarily to positive currency translation effects. These may still have an impact on our estimate. For 2015, we expect the consolidated result in reinsurance to total at least €2.5bn, which is less than the excellent result of €2.9bn for 2014. It needs to be borne in mind that there are likely to be fewer special tax effects and that prices continued to fall.
We project that gross premiums written in life reinsurance will remain in the region of €10bn for 2015. Given that business performance in the first nine months of the year was generally below our expectations, we anticipate a technical result of €300–350m for the year as a whole. We expect the technical result for future financial years to once again be in the region of €400m.
In property-casualty reinsurance, we are currently experiencing unrelenting competition. Given their good capitalisation, primary insurers are ceding fewer risks to reinsurance, which tends to result in falling demand for cover. At the same time, reinsurers are able to provide ample capacity, since their capital base has also steadily improved thanks to the good results posted over the last few years. There is also the ongoing availability of alternative capital in the US market: institutional investors, such as pension funds, increasingly favour insurance securitisation and other reinsurance-like transactions. This means there is currently appreciable surplus capacity on the supply side. Especially smaller-scale providers have come under pressure, which has recently led to an accumulation of takeovers and mergers in the industry.
We therefore expect the highly competitive environment to stay unchanged for the forthcoming renewals as at 1 January 2016, and we accordingly anticipate that the prices, terms and conditions for reinsurance coverage will be under pressure across the board, albeit with decreasing intensity. Munich Re will maintain its consistently profit-oriented underwriting policy, and only accept risks at commensurate prices. In the future, we will thus continue to systematically withdraw from business we do not consider to be sustainably profitable, and we will especially use innovative approaches to open up new growth potential.
For 2015, we anticipate that gross premiums written in property-casualty reinsurance will total around €18bn, which is some €1bn more than last year. The increase of €1bn compared with the forecast we made in our Annual Report for 2014 is due to positive currency translation effects. As the combined ratio of 93.4% for the first nine months of the year was below our expectations owing to the low burden for major losses, we now anticipate that this ratio will be around 95% of net earned premiums for the year as a whole, an improvement by three percentage points in comparison with our forecast in the Annual Report 2014 and by one percentage point compared with our expectation in the report for the second quarter of 2015.
21Interim management reportProspects
Munich Re Quarterly Report 3/2015
ERGO
We see good opportunities for ERGO, not only in evolving foreign markets but also in various sectors of the German market.
In 2015, total premium income for ERGO should be around €17.5bn, with gross premiums written of around €16.5bn, and therefore somewhat below the levels of the previous year. We project a consolidated result for 2015 of around €500m for ERGO, a significant improvement on the low 2014 result, which was mainly caused by the impairment of goodwill in the segment ERGO International.
In ERGO Life and Health Germany, our total premium income is likely to be around €10.5bn, with gross premiums written ranging between €9bn and €9.5bn.
We expect premium income for ERGO’s Life Germany business to be lower overall at around €4bn in 2015. As at the end of 2015, we will largely stop underwriting new life insurance business that provides traditional guarantees. This excludes business in force and all term insurance products – including death benefits – and immediate annuities. In future, we will focus on our new product generations for unsponsored deferred annuities for old age.
For the Health Germany segment, we are proceeding on the assumption that gross premiums written will roughly maintain the previous year’s level at around €5bn. In private health insurance, premium volume in comprehensive health cover is likely to decline. By contrast, we see good growth opportunities in supplementary health business, particularly in supplementary long-term care insurance and company health insurance.
In 2015, gross premiums written for direct business in Germany should remain largely stable at around €1bn compared with 2014. Falls in life primary insurance will probably be compensated for again by growth in health insurance.
Gross premiums written in the segment Property-casualty Germany should be somewhat over €3bn. Given the development of claims in the first three quarters, our combined ratio should amount to around 96%, one percentage point higher than we had projected three months ago.
We aim to achieve gross premiums written in the range of €3.5–4bn for the ERGO International segment in 2015, and to generate overall premium volume of around €4bn. Given that business performance was below our expectations, especially in the third quarter of 2015, we now anticipate that the combined ratio for the financial year as a whole will be around 101%, a deterioration of two percentage points in comparison with our forecast in the second quarterly report.
Munich Health
Owing to medical advances, generally higher life expectancies and the increasing prosperity of broad sectors of the population, the international healthcare market offers diverse growth opportunities for Munich Health. We intend to utilise these opportunities even better in future, following some individual adjustments to our strategic orientation. In reinsurance, we see avenues for growth from our clients’ increasing numbers of insureds and strong demand for customised solutions.
For 2015, we forecast gross premiums written of over €5.5bn. This is somewhat more than we had forecast in our Annual Report for 2014 due to positive currency translation
Interim management reportProspects
22
Munich Re Quarterly Report 3/2015
effects. The combined ratio is likely to be around 100%, a deterioration of almost one percentage point compared with our expectation in the report for the second quarter.
Altogether, we project a profit of between €50m and €100m for 2015.
Munich Re (Group)
We are proceeding on the assumption that the Group’s gross premiums written for 2015 will total around €50bn, some €1.2bn more than in the previous year. This improvement and the increase of €2bn compared with the median value of the forecast we made in our Annual Report for 2014 are chiefly due to positive currency translation effects.
We are adhering to our long-term objective of a 15% return on our risk-adjusted capital (RORAC) after tax across the cycle of the insurance and interest-rate markets. In the long term, we want to grow profitably with innovative business. However, this target will be difficult to achieve in the current environment of very low interest rates, even on investments entailing risk.
Provided that major-loss experience is in line with expectations in the fourth quarter of the year, our assumption is that Munich Re’s technical result for 2015 will be at the same high level as last year, when we posted €3.2bn.
Contrary to our mid-year projections of a return on investment of 3.3%, the figure for 2015 is likely to be around 3.0%, the decrease being due to expenditure in the third quarter. We continue to anticipate that market interest rates will remain very low overall, with correspondingly falling regular income from fixed-interest investments.
As in previous years, a review of our loss reserves, tax provisions and intangible assets may result in substantial income or expenses in the fourth quarter of the year; they could also significantly impact the results of the respective fields of business. Subject to such result effects, and to random fluctuations in the incidence of major losses or upheavals on the capital markets, we confirm the adjusted profit guidance of at least €3bn we made in our Half-Year Financial Report. Existing uncertainties in forecasting the result mean that in the ERGO field of business the risks outweigh the opportunities, whereas in reinsurance it is the opportunities that predominate.
Our good capitalisation enables us to continue taking selective advantage of opportunities for profitable growth in individual regions and classes of business. We intend to carry on returning excess capital to equity holders in future as well. As part of the share buy-back programme announced in March, we therefore aim to repurchase shares with a total volume of up to €1bn before the Annual General Meeting in April 2016, provided no major upheavals occur on the capital markets or in underwriting business.
With the Solvency II rules taking effect on 1 January 2016, final implementation of the fundamentally modified supervisory regime is imminent. Although a significant amount of additional effort still needs to be made, we are well prepared for the new requirements. We are proceeding on the assumption that by the end of 2015 the supervisory authorities will have approved our internal risk model for regulatory capital requirement calculations. Our internal management and the requirements of state insurance supervision will thus be congruent for the first time as far as the assessment of risk is concerned. Nevertheless, Solvency II will have a significant impact on insurance supply and demand. As a consequence, new business opportunities will emerge for Munich Re.
Beyond this, the statements relating to opportunities and risks as presented in the Munich Re Group Annual Report 2014 apply unchanged.
23Interim management reportProspects
Munich Re Quarterly Report 3/2015
24
Munich Re Quarterly Report 3/2015
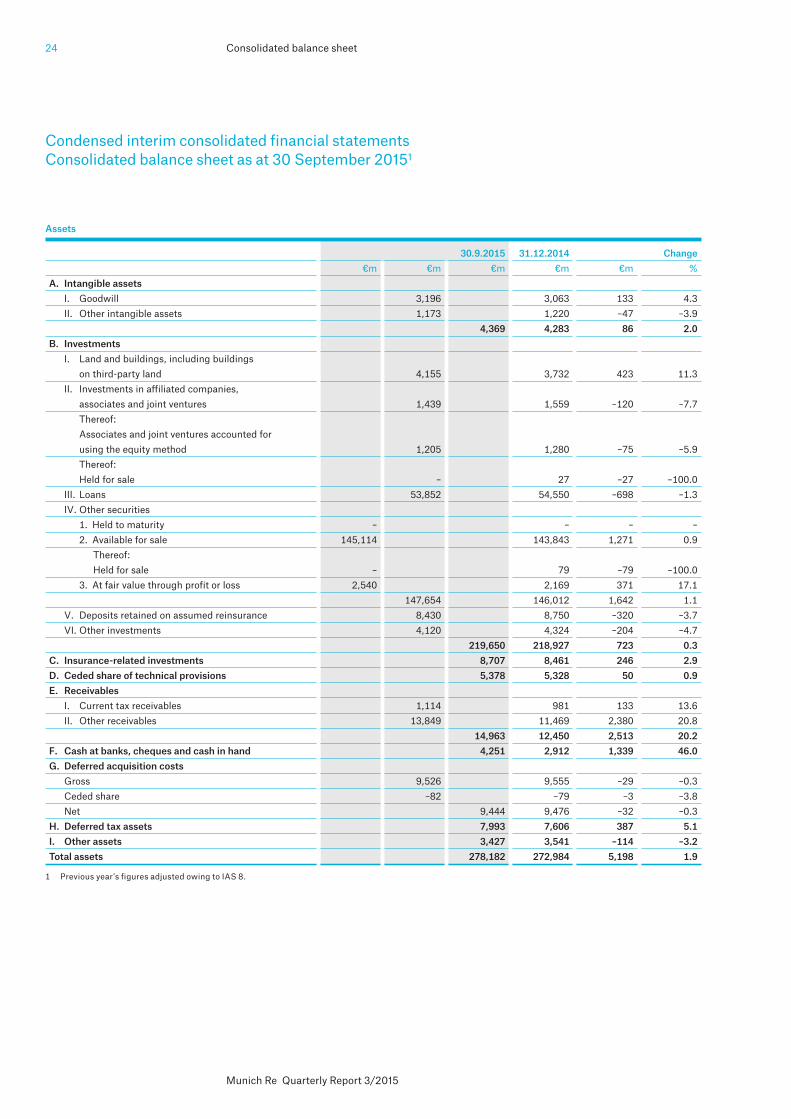
Condensed interim consolidated financial statementsConsolidated balance sheet as at 30 September 20151
Assets
30.9.2015 31.12.2014 Change €m €m €m €m €m %A. Intangible assets I. Goodwill 3,196 3,063 133 4.3 II. Other intangible assets 1,173 1,220 –47 –3.9 4,369 4,283 86 2.0B. Investments I. Land and buildings, including buildings on third-party land 4,155 3,732 423 11.3 II. Investments in affiliated companies, associates and joint ventures 1,439 1,559 –120 –7.7 Thereof: Associates and joint ventures accounted for using the equity method 1,205 1,280 –75 –5.9 Thereof: Held for sale – 27 –27 –100.0 III. Loans 53,852 54,550 –698 –1.3 IV. Other securities 1. Held to maturity – – – – 2. Available for sale 145,114 143,843 1,271 0.9 Thereof: Held for sale – 79 –79 –100.0 3. At fair value through profit or loss 2,540 2,169 371 17.1 147,654 146,012 1,642 1.1 V. Deposits retained on assumed reinsurance 8,430 8,750 –320 –3.7 VI. Other investments 4,120 4,324 –204 –4.7 219,650 218,927 723 0.3C. Insurance-related investments 8,707 8,461 246 2.9D. Ceded share of technical provisions 5,378 5,328 50 0.9E. Receivables I. Current tax receivables 1,114 981 133 13.6 II. Other receivables 13,849 11,469 2,380 20.8 14,963 12,450 2,513 20.2F. Cash at banks, cheques and cash in hand 4,251 2,912 1,339 46.0G. Deferred acquisition costs Gross 9,526 9,555 –29 –0.3 Ceded share –82 –79 –3 –3.8 Net 9,444 9,476 –32 –0.3H. Deferred tax assets 7,993 7,606 387 5.1I. Other assets 3,427 3,541 –114 –3.2Total assets 278,182 272,984 5,198 1.9
Consolidated balance sheet
1 Previous year’s figures adjusted owing to IAS 8.

25
Munich Re Quarterly Report 3/2015
Equity and liabilities
30.9.2015 31.12.2014 Change €m €m €m €m %A. Equity I. Issued capital and capital reserve 7,424 7,417 7 0.1 II. Retained earnings 14,370 12,991 1,379 10.6 III. Other reserves 5,584 6,458 –874 –13.5 IV. Consolidated result attributable to Munich Reinsurance Company equity holders 2,380 3,152 –772 –24.5 V. Non-controlling interests 287 271 16 5.9 30,045 30,289 –244 –0.8B. Subordinated liabilities 4,428 4,413 15 0.3C. Gross technical provisions I. Unearned premiums 9,297 8,373 924 11.0 II. Provision for future policy benefits 113,963 112,648 1,315 1.2 Thereof: Held for sale – 48 –48 –100.0 III. Provision for outstanding claims 58,880 56,362 2,518 4.5 IV. Other technical provisions 17,346 18,492 –1,146 –6.2 199,486 195,875 3,611 1.8D. Gross technical provisions for unit-linked life insurance 7,879 7,837 42 0.5E. Other accrued liabilities 4,175 4,473 –298 –6.7F. Liabilities I. Bonds and notes issued 306 282 24 8.5 II. Deposits retained on ceded business 2,558 2,673 –115 –4.3 III. Current tax liabilities 2,205 2,729 –524 –19.2 IV. Other liabilities 17,032 14,637 2,395 16.4 22,101 20,321 1,780 8.8G. Deferred tax liabilities 10,068 9,776 292 3.0Total equity and liabilities 278,182 272,984 5,198 1.9
Consolidated balance sheet

26
Munich Re Quarterly Report 3/2015
Consolidated income statement 1 January to 30 September 20151
1 Previous year’s figures adjusted owing to IAS 8.
Items
Q1–3 2015 Q1–3 2014 Change €m €m €m €m €m %Gross premiums written 37,986 36,833 1,153 3.1 1. Earned premiums Gross 37,315 36,429 886 2.4 Ceded –1,148 –1,120 –28 –2.5 Net 36,167 35,309 858 2.4 2. Income from technical interest 4,974 5,580 –606 –10.9 3. Expenses for claims and benefits Gross –30,201 –30,313 112 0.4 Ceded share 626 525 101 19.2 Net –29,575 –29,788 213 0.7 4. Operating expenses Gross –9,144 –8,708 –436 –5.0 Ceded share 219 236 –17 –7.2 Net –8,925 –8,472 –453 –5.3 5. Technical result (1– 4) 2,641 2,629 12 0.5
6. Investment result 5,872 6,030 –158 –2.6 Thereof: Income from associates and joint ventures accounted for using the equity method 375 53 322 607.5 7. Insurance-related investment result –69 362 –431 – 8. Other operating income 588 529 59 11.2 9. Other operating expenses –666 –598 –68 –11.4 10. Deduction of income from technical interest –4,974 –5,580 606 10.9 11. Non-technical result (6 – 10) 751 743 8 1.1
12. Operating result (5 + 11) 3,392 3,372 20 0.6
13. Other non-operating result –523 –467 –56 –12.0 14. Impairment losses of goodwill – – – – 15. Net finance costs –178 –170 –8 –4.7 16. Taxes on income –300 –296 –4 –1.4 17. Consolidated result (12 – 16) 2,391 2,439 –48 –2.0 Thereof: Attributable to Munich Reinsurance Company equity holders 2,380 2,427 –47 –1.9 Attributable to non-controlling interests 11 12 –1 –8.3
€ € € %Earnings per share 14.28 14.01 0.27 1.9
Consolidated income statement

27
Munich Re Quarterly Report 3/2015
Consolidated income statement 1 July to 30 September 20151
1 Previous year’s figures adjusted owing to IAS 8.
Items
Q3 2015 Q3 2014 Change €m €m €m €m €m %Gross premiums written 12,481 12,053 428 3.6 1. Earned premiums Gross 12,375 12,100 275 2.3 Ceded –419 –391 –28 –7.2 Net 11,956 11,709 247 2.1 2. Income from technical interest 1,463 1,776 –313 –17.6 3. Expenses for claims and benefits Gross –9,881 –9,874 –7 –0.1 Ceded share 203 200 3 1.5 Net –9,678 –9,674 –4 0.0 4. Operating expenses Gross –2,970 –2,950 –20 –0.7 Ceded share 90 95 –5 –5.3 Net –2,880 –2,855 –25 –0.9 5. Technical result (1– 4) 861 956 –95 –9.9
6. Investment result 1,531 1,670 –139 –8.3 Thereof: Income from associates and joint ventures accounted for using the equity method 248 17 231 >1,000.0 7. Insurance-related investment result –322 85 –407 – 8. Other operating income 200 170 30 17.6 9. Other operating expenses –228 –197 –31 –15.7 10. Deduction of income from technical interest –1,463 –1,776 313 17.6 11. Non-technical result (6 – 10) –282 –48 –234 –487.5
12. Operating result (5 + 11) 579 908 –329 –36.2
13. Other non-operating result –97 –127 30 23.6 14. Impairment losses of goodwill – – – – 15. Net finance costs –58 –56 –2 –3.6 16. Taxes on income 101 11 90 818.2 17. Consolidated result (12 – 16) 525 736 –211 –28.7 Thereof: Attributable to Munich Reinsurance Company equity holders 520 733 –213 –29.1 Attributable to non-controlling interests 5 3 2 66.7
€ € € %Earnings per share 3.14 4.28 –1.14 –26.6
Consolidated income statement

28
Munich Re Quarterly Report 3/2015
Consolidated income statement1
(quarterly breakdown)
1 Previous year’s figures adjusted owing to IAS 8.
Items
Q3 2015 Q2 2015 Q1 2015 Q4 2014 Q3 2014 Q2 2014 Q1 2014 €m €m €m €m €m €m €mGross premiums written 12,481 12,467 13,038 12,015 12,053 11,856 12,924 1. Earned premiums Gross 12,375 12,757 12,183 12,558 12,100 12,056 12,273 Ceded –419 –406 –323 –483 –391 –351 –378 Net 11,956 12,351 11,860 12,075 11,709 11,705 11,895 2. Income from technical interest 1,463 1,244 2,267 1,923 1,776 1,882 1,922 3. Expenses for claims and benefits Gross –9,881 –9,940 –10,380 –10,103 –9,874 –10,340 –10,099 Ceded share 203 239 184 197 200 197 128 Net –9,678 –9,701 –10,196 –9,906 –9,674 –10,143 –9,971 4. Operating expenses Gross –2,970 –3,114 –3,060 –3,556 –2,950 –3,064 –2,694 Ceded share 90 88 41 77 95 76 65 Net –2,880 –3,026 –3,019 –3,479 –2,855 –2,988 –2,629 5. Technical result (1– 4) 861 868 912 613 956 456 1,217
6. Investment result 1,531 2,521 1,820 1,972 1,670 2,368 1,992 Thereof: Income from associates and joint ventures accounted for using the equity method 248 87 40 24 17 31 5 7. Insurance-related investment result –322 –326 579 52 85 199 78 8. Other operating income 200 209 179 218 170 182 177 9. Other operating expenses –228 –210 –228 –277 –197 –186 –215 10. Deduction of income from technical interest –1,463 –1,244 –2,267 –1,923 –1,776 –1,882 –1,922 11. Non-technical result (6 – 10) –282 950 83 42 –48 681 110 12. Operating result (5 + 11) 579 1,818 995 655 908 1,137 1,327
13. Other non-operating result –97 –432 6 –29 –127 –225 –115 14. Impairment losses of goodwill – – – –445 – – – 15. Net finance costs –58 –60 –60 –58 –56 –58 –56 16. Taxes on income 101 –250 –151 608 11 –92 –215 17. Consolidated result (12 – 16) 525 1,076 790 731 736 762 941 Thereof: Attributable to Munich Reinsurance Company equity holders 520 1,070 790 725 733 758 936 Attributable to non-controlling interests 5 6 – 6 3 4 5
€ € € € € € €Earnings per share 3.14 6.42 4.71 4.29 4.28 4.39 5.33
Consolidated income statement

29
Munich Re Quarterly Report 3/2015
Statement of recognised income and expense1 January to 30 September 20151
€m Q1–3 2015 Q1–3 2014Consolidated result 2,391 2,439 Currency translation
Gains (losses) recognised in equity 1,027 1,110Recognised in the consolidated income statement – –
Unrealised gains and losses on investments Gains (losses) recognised in equity –1,160 2,778Recognised in the consolidated income statement –723 –800
Change resulting from valuation at equity Gains (losses) recognised in equity –37 15Recognised in the consolidated income statement – –
Change resulting from cash flow hedges Gains (losses) recognised in equity 1 –Recognised in the consolidated income statement – –
Other changes 1 14I. Items where income and expenses recognised directly in equity are reallocated to the consolidated income statement –891 3,117 Remeasurements of defined benefit plans 235 –110 Other changes – –II. Items where income and expenses recognised directly in equity are not reallocated to the consolidated income statement 235 –110Income and expense recognised directly in equity (I + II) –656 3,007Total recognised income and expense 1,735 5,446Thereof: Attributable to Munich Reinsurance Company equity holders 1,722 5,429Attributable to non-controlling interests 13 17
Statement of recognised income and expense
1 Previous year’s figures adjusted owing to IAS 8.
30
Munich Re Quarterly Report 3/2015
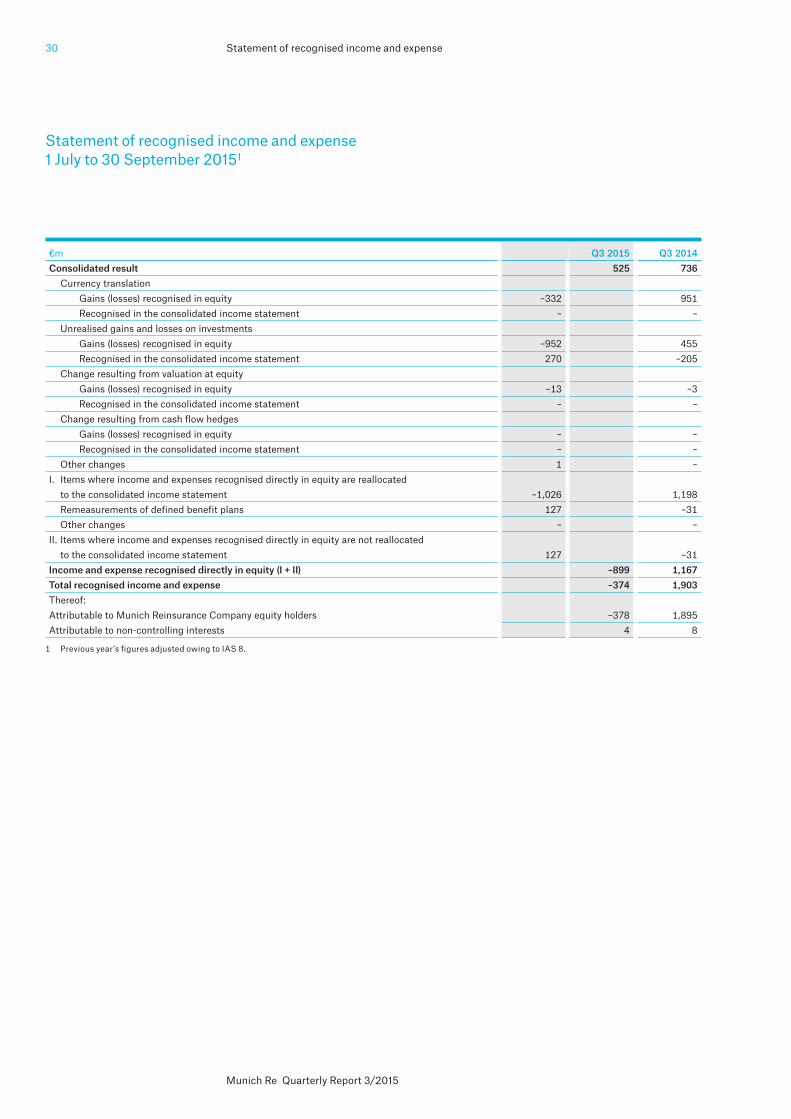
Statement of recognised income and expense1 July to 30 September 20151
€m Q3 2015 Q3 2014Consolidated result 525 736 Currency translation
Gains (losses) recognised in equity –332 951Recognised in the consolidated income statement – –
Unrealised gains and losses on investments Gains (losses) recognised in equity –952 455Recognised in the consolidated income statement 270 –205
Change resulting from valuation at equity Gains (losses) recognised in equity –13 –3Recognised in the consolidated income statement – –
Change resulting from cash flow hedges Gains (losses) recognised in equity – –Recognised in the consolidated income statement – –
Other changes 1 –I. Items where income and expenses recognised directly in equity are reallocated to the consolidated income statement –1,026 1,198 Remeasurements of defined benefit plans 127 –31 Other changes – –II. Items where income and expenses recognised directly in equity are not reallocated to the consolidated income statement 127 –31Income and expense recognised directly in equity (I + II) –899 1,167Total recognised income and expense –374 1,903Thereof: Attributable to Munich Reinsurance Company equity holders –378 1,895Attributable to non-controlling interests 4 8
1 Previous year’s figures adjusted owing to IAS 8.
Statement of recognised income and expense


32
Munich Re Quarterly Report 3/2015
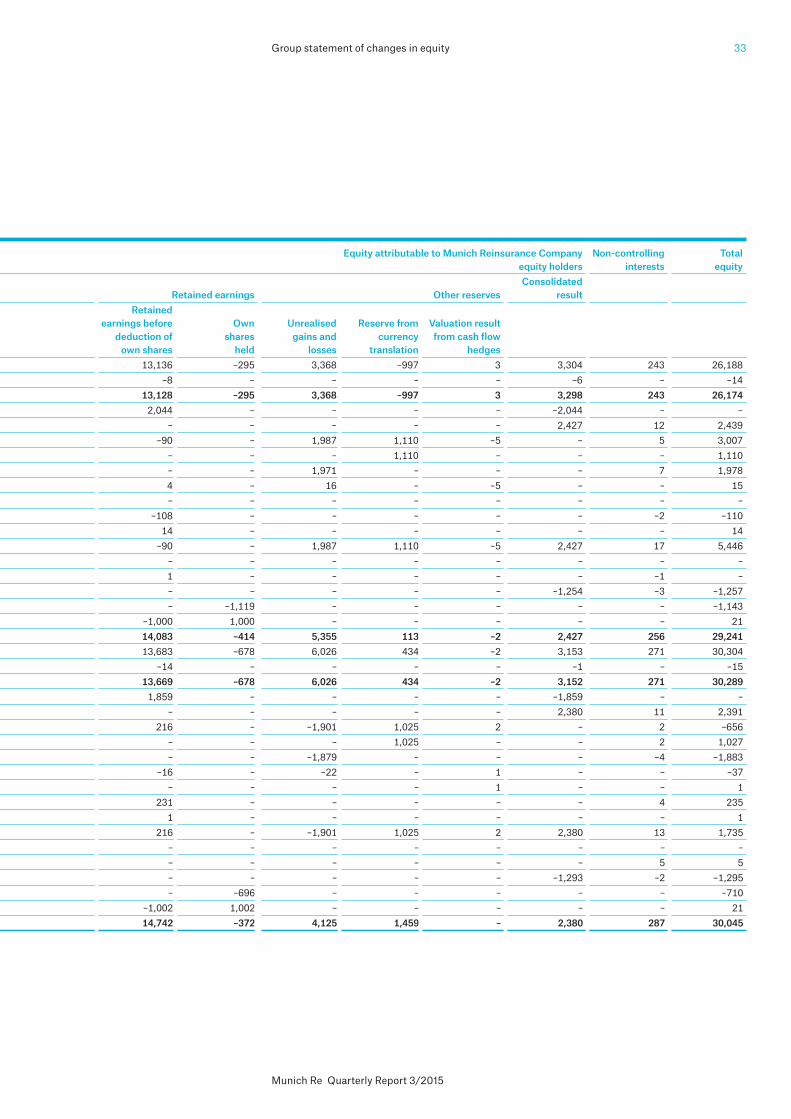
Group statement of changes in equity1
1 Previous year’s figures adjusted owing to IAS 8.
Group statement of changes in equity
Equity attributable to Munich Reinsurance Company Non-controlling Total equity holders interests equity Issued Consolidated capital Capital reserve Retained earnings Other reserves result Retained earnings before Own Unrealised Reserve from Valuation result deduction of shares gains and currency from cash flow €m own shares held losses translation hedges 31.12.2013 as originally recognised 581 6,845 13,136 –295 3,368 –997 3 3,304 243 26,188Change from retrospective adjustment – – –8 – – – – –6 – –14Status at 31.12.2013 581 6,845 13,128 –295 3,368 –997 3 3,298 243 26,174Allocation to retained earnings – – 2,044 – – – – –2,044 – –Consolidated result – – – – – – – 2,427 12 2,439Income and expense recognised directly in equity – – –90 – 1,987 1,110 –5 – 5 3,007
Currency translation – – – – – 1,110 – – – 1,110Unrealised gains and losses on investments – – – – 1,971 – – – 7 1,978Change resulting from valuation at equity – – 4 – 16 – –5 – – 15Change resulting from cash flow hedges – – – – – – – – – –Remeasurements of defined benefit plans – – –108 – – – – – –2 –110Other changes – – 14 – – – – – – 14
Total recognised income and expense – – –90 – 1,987 1,110 –5 2,427 17 5,446Change in shareholdings in subsidiaries – – – – – – – – – –Change in consolidated group – – 1 – – – – – –1 –Dividend – – – – – – – –1,254 –3 –1,257Purchase/sale of own shares –24 – – –1,119 – – – – – –1,143Retirement of own shares 21 – –1,000 1,000 – – – – – 21Status at 30.9.2014 578 6,845 14,083 –414 5,355 113 –2 2,427 256 29,24131.12.2014 as originally recognised 572 6,845 13,683 –678 6,026 434 –2 3,153 271 30,304Change from retrospective adjustment – – –14 – – – – –1 – –15Status at 31.12.2014 572 6,845 13,669 –678 6,026 434 –2 3,152 271 30,289Allocation to retained earnings – – 1,859 – – – – –1,859 – –Consolidated result – – – – – – – 2,380 11 2,391Income and expense recognised directly in equity – – 216 – –1,901 1,025 2 – 2 –656
Currency translation – – – – – 1,025 – – 2 1,027Unrealised gains and losses on investments – – – – –1,879 – – – –4 –1,883Change resulting from valuation at equity – – –16 – –22 – 1 – – –37Change resulting from cash flow hedges – – – – – – 1 – – 1Remeasurements of defined benefit plans – – 231 – – – – – 4 235Other changes – – 1 – – – – – – 1
Total recognised income and expense – – 216 – –1,901 1,025 2 2,380 13 1,735Change in shareholdings in subsidiaries – – – – – – – – – –Change in consolidated group – – – – – – – – 5 5Dividend – – – – – – – –1,293 –2 –1,295Purchase/sale of own shares –14 – – –696 – – – – – –710Retirement of own shares 21 – –1,002 1,002 – – – – – 21Status at 30.9.2015 579 6,845 14,742 –372 4,125 1,459 – 2,380 287 30,045
33
Munich Re Quarterly Report 3/2015
Equity attributable to Munich Reinsurance Company Non-controlling Total equity holders interests equity Issued Consolidated capital Capital reserve Retained earnings Other reserves result Retained earnings before Own Unrealised Reserve from Valuation result deduction of shares gains and currency from cash flow €m own shares held losses translation hedges 31.12.2013 as originally recognised 581 6,845 13,136 –295 3,368 –997 3 3,304 243 26,188Change from retrospective adjustment – – –8 – – – – –6 – –14Status at 31.12.2013 581 6,845 13,128 –295 3,368 –997 3 3,298 243 26,174Allocation to retained earnings – – 2,044 – – – – –2,044 – –Consolidated result – – – – – – – 2,427 12 2,439Income and expense recognised directly in equity – – –90 – 1,987 1,110 –5 – 5 3,007
Currency translation – – – – – 1,110 – – – 1,110Unrealised gains and losses on investments – – – – 1,971 – – – 7 1,978Change resulting from valuation at equity – – 4 – 16 – –5 – – 15Change resulting from cash flow hedges – – – – – – – – – –Remeasurements of defined benefit plans – – –108 – – – – – –2 –110Other changes – – 14 – – – – – – 14
Total recognised income and expense – – –90 – 1,987 1,110 –5 2,427 17 5,446Change in shareholdings in subsidiaries – – – – – – – – – –Change in consolidated group – – 1 – – – – – –1 –Dividend – – – – – – – –1,254 –3 –1,257Purchase/sale of own shares –24 – – –1,119 – – – – – –1,143Retirement of own shares 21 – –1,000 1,000 – – – – – 21Status at 30.9.2014 578 6,845 14,083 –414 5,355 113 –2 2,427 256 29,24131.12.2014 as originally recognised 572 6,845 13,683 –678 6,026 434 –2 3,153 271 30,304Change from retrospective adjustment – – –14 – – – – –1 – –15Status at 31.12.2014 572 6,845 13,669 –678 6,026 434 –2 3,152 271 30,289Allocation to retained earnings – – 1,859 – – – – –1,859 – –Consolidated result – – – – – – – 2,380 11 2,391Income and expense recognised directly in equity – – 216 – –1,901 1,025 2 – 2 –656
Currency translation – – – – – 1,025 – – 2 1,027Unrealised gains and losses on investments – – – – –1,879 – – – –4 –1,883Change resulting from valuation at equity – – –16 – –22 – 1 – – –37Change resulting from cash flow hedges – – – – – – 1 – – 1Remeasurements of defined benefit plans – – 231 – – – – – 4 235Other changes – – 1 – – – – – – 1
Total recognised income and expense – – 216 – –1,901 1,025 2 2,380 13 1,735Change in shareholdings in subsidiaries – – – – – – – – – –Change in consolidated group – – – – – – – – 5 5Dividend – – – – – – – –1,293 –2 –1,295Purchase/sale of own shares –14 – – –696 – – – – – –710Retirement of own shares 21 – –1,002 1,002 – – – – – 21Status at 30.9.2015 579 6,845 14,742 –372 4,125 1,459 – 2,380 287 30,045
Group statement of changes in equity

34
Munich Re Quarterly Report 3/2015
Condensed consolidated cash flow statement 1 January to 30 September 20151
1 Previous year’s figures adjusted owing to IAS 8.
€m Q1–3 2015 Q1–3 2014Consolidated result 2,391 2,439
Net change in technical provisions 4,054 5,282Change in deferred acquisition costs 31 –147Change in deposits retained and accounts receivable and payable –300 764Change in other receivables and liabilities –327 590Gains and losses on the disposal of investments –1,539 –1,214Change in securities at fair value through profit or loss –1,309 –187Change in other balance sheet items 77 –117Other income/expenses without impact on cash flow 216 –194
I. Cash flows from operating activities 3,294 7,216Change from losing control of consolidated subsidiaries 16 –Change from obtaining control of consolidated subsidiaries –69 –97Change from the acquisition, sale and maturities of other investments 145 –4,154Change from the acquisition and sale of investments for unit-linked life insurance contracts –310 –411Other 63 –103
II. Cash flows from investing activities –155 –4,765Inflows from increases in capital and from non-controlling interests – –Outflows to ownership interests and non-controlling interests –689 –1,122Dividend payments –1,295 –1,257Change from other financing activities –13 –10
III. Cash flows from financing activities –1,997 –2,389Cash flows for the financial year (I + II + III) 1,142 62
Effect of exchange-rate changes on cash 197 190Cash at the beginning of the financial year 2,912 2,820Cash at 30 September of the financial year 4,251 3,072
Condensed consolidated cash flow statement
35Selected notes to the consolidated financial statements
Munich Re Quarterly Report 3/2015
Recognition and measurement This quarterly report as at 30 September 2015 has been prepared in accordance with International Financial Reporting Standards (IFRSs) as applicable in the European Union. The condensed interim consolidated financial statements are prepared in accordance with IAS 34, Interim Financial Reporting. We have complied with all new and amended IFRSs and IFRIC interpretations whose application is compulsory for Munich Re for the first time for periods beginning on 1 January 2015. For existing or unchanged IFRSs, the same principles of recognition, measurement, consolidation and disclosure have been applied as in our consolidated financial statements as at 31 December 2014, with the exception of the changes mentioned below. In accordance with the rules of IFRS 4, underwriting items are recognised and measured on the basis of US GAAP (United States Generally Accepted Accounting Principles) at first-time adoption of IFRS 4 on 1 January 2005.
As of the financial year 2015, the following new or amended IFRSs have to be applied for the first time:
The IASB concluded the project Annual Improvement to IFRSs 2011–2013 Cycle in December 2013 with the publication of the revised standards. These amendments concern IFRS 1, First-time Adoption of International Financial Reporting Standards; IFRS 3, Business Combinations; IFRS 13, Fair Value Measurement; and IAS 40, Investment Property. Clarifications were made to these standards concerning individual provisions that have turned out to be unclear in practice; they have no impact on Munich Re’s financial statements.
IFRIC Interpretation 21 (05/2013), Levies, clarifies the point of recognition of a liability within the scope of IAS 37 for levies imposed by governments, other than income taxes, that do not fall within the scope of application of other IFRSs. As well as determining the point of recognition, the Interpretation clarifies how to interpret the definition of “present obligation” within the meaning of IAS 37 with respect to such levies. It has no material effects on Munich Re.
Selected notes to the consolidated financial statements
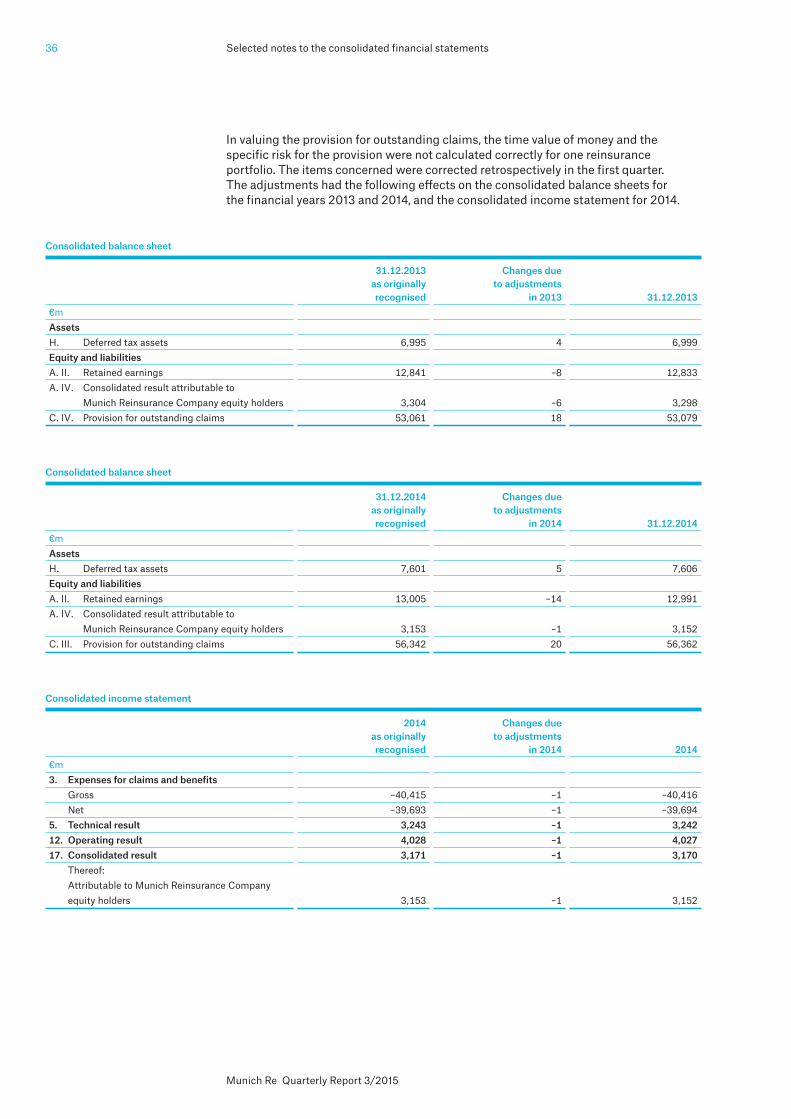
Selected notes to the consolidated financial statements36
Munich Re Quarterly Report 3/2015
In valuing the provision for outstanding claims, the time value of money and the specific risk for the provision were not calculated correctly for one reinsurance portfolio. The items concerned were corrected retrospectively in the first quarter. The adjustments had the following effects on the consolidated balance sheets for the financial years 2013 and 2014, and the consolidated income statement for 2014.
QB_400
QB_405
QB_410
Consolidated balance sheet
31.12.2013 Changes due as originally to adjustments recognised in 2013 31.12.2013€m Assets H. Deferred tax assets 6,995 4 6,999Equity and liabilities A. II. Retained earnings 12,841 –8 12,833A. IV. Consolidated result attributable to Munich Reinsurance Company equity holders 3,304 –6 3,298C. IV. Provision for outstanding claims 53,061 18 53,079
Consolidated balance sheet
31.12.2014 Changes due as originally to adjustments recognised in 2014 31.12.2014€m Assets H. Deferred tax assets 7,601 5 7,606Equity and liabilities A. II. Retained earnings 13,005 –14 12,991A. IV. Consolidated result attributable to Munich Reinsurance Company equity holders 3,153 –1 3,152C. III. Provision for outstanding claims 56,342 20 56,362
Consolidated income statement
2014 Changes due as originally to adjustments recognised in 2014 2014€m 3. Expenses for claims and benefits Gross –40,415 –1 –40,416 Net –39,693 –1 –39,6945. Technical result 3,243 –1 3,24212. Operating result 4,028 –1 4,02717. Consolidated result 3,171 –1 3,170 Thereof: Attributable to Munich Reinsurance Company equity holders 3,153 –1 3,152
37Selected notes to the consolidated financial statements
Munich Re Quarterly Report 3/2015
Changes in the consolidated group
On 1 January 2015, via its subsidiary MR RENT-Investment GmbH, Munich, Munich Re acquired 100% of the voting shares in the solar park companies KS SPV 23 Limited, London, England, and Countryside Renewables (Forest Heath) Limited, London, England, from BayWa r.e. 205. Projektgesellschaft mbH, Gräfelfing, Germany and BayWa r.e. 149. Projektgesellschaft mbH, Gräfelfing, Germany. The solar parks have a total installed capacity of 22.7 megawatts (MW).
On 1 March 2015, via its subsidiary MR RENT-Investment GmbH, Munich, Munich Re acquired 100% of the voting shares in the solar park company Cornwall Power (Polmaugan) Limited, London, England from BayWa r.e. 148. Projektgesellschaft mbH, Gräfelfing, Germany. The solar park has a total installed capacity of 5 MW. These corporate acquisitions form part of our infrastructure investment programme (including renewable energies and new technologies).
On 23 July 2015, via its subsidiary Victoria Investment Properties Two L.P., Atlanta, USA, Munich Re acquired as an investment measure an additional 18% of the capital of 13th & F Associates Limited Partnership Columbia Square (13th & F), Washington, D.C., USA, from Hines Columbia Square (Hines), L.P., Houston, USA. Furthermore, the share-holding of Hines, the previous general managing partner, was converted into the non-voting interest of a limited partner, enabling us to obtain 100% of the voting shares. We consequently increased our shareholding to 98% and gained control over the company, which is the property management and holding company of an office building in Washington, D.C. The fair value of Munich Re’s shareholding in 13th & F immediately prior to the time of acquisition totalled €325m. A revaluation of this shareholding resulted in a positive one-off effect of €220m, which was recognised as income from investments in associates. A purchase price of US$ 82.0m (€75.3m) was paid for the acquisition of the shares, of which US$ 80.2m (€73.6m) was in cash. The fair value of the non-controlling interest in the acquired company was set at €8m, by discounting the future cash flow attributable to the non-controlling interests as a result of the transaction at the valuation date.
The provisional IFRS fair values of the assets and liabilities of the acquired company at the time of acquisition are as follows:
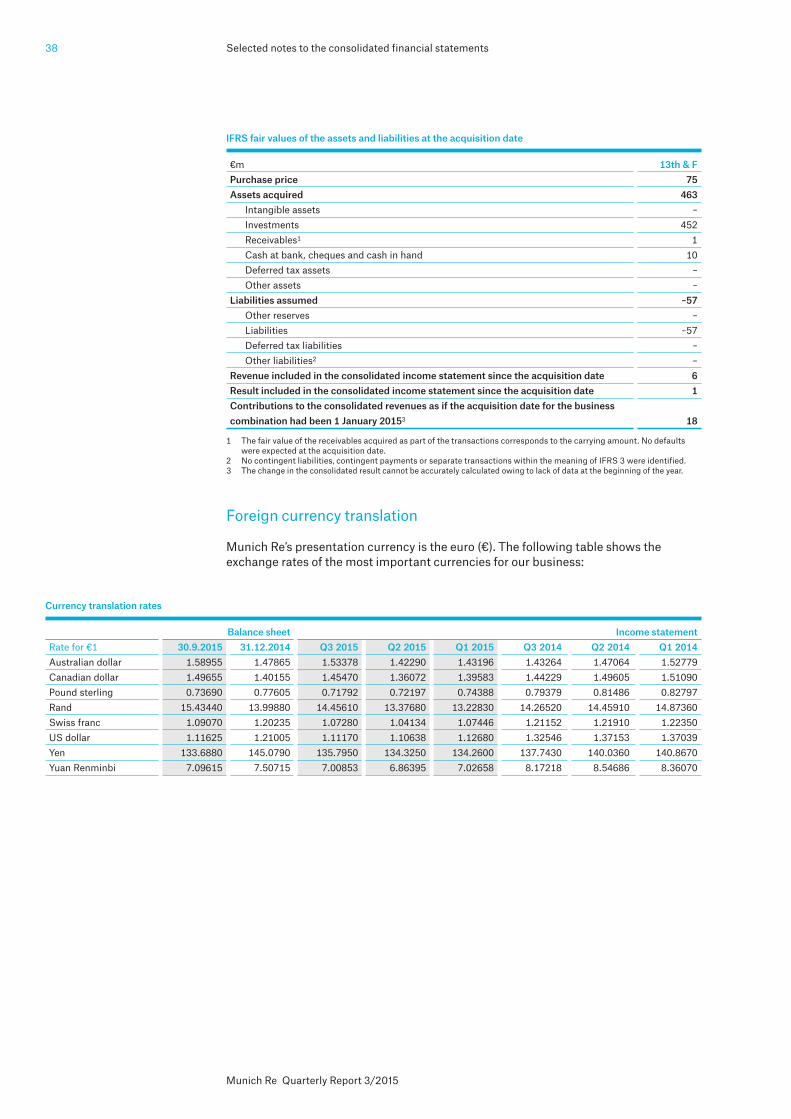
Selected notes to the consolidated financial statements38
Munich Re Quarterly Report 3/2015
Foreign currency translation
Munich Re’s presentation currency is the euro (€). The following table shows the exchange rates of the most important currencies for our business:
QB_412
QB_415 Currency translation rates
Balance sheet Income statementRate for €1 30.9.2015 31.12.2014 Q3 2015 Q2 2015 Q1 2015 Q3 2014 Q2 2014 Q1 2014Australian dollar 1.58955 1.47865 1.53378 1.42290 1.43196 1.43264 1.47064 1.52779Canadian dollar 1.49655 1.40155 1.45470 1.36072 1.39583 1.44229 1.49605 1.51090Pound sterling 0.73690 0.77605 0.71792 0.72197 0.74388 0.79379 0.81486 0.82797Rand 15.43440 13.99880 14.45610 13.37680 13.22830 14.26520 14.45910 14.87360Swiss franc 1.09070 1.20235 1.07280 1.04134 1.07446 1.21152 1.21910 1.22350US dollar 1.11625 1.21005 1.11170 1.10638 1.12680 1.32546 1.37153 1.37039Yen 133.6880 145.0790 135.7950 134.3250 134.2600 137.7430 140.0360 140.8670Yuan Renminbi 7.09615 7.50715 7.00853 6.86395 7.02658 8.17218 8.54686 8.36070
IFRS fair values of the assets and liabilities at the acquisition date
€m 13th & FPurchase price 75Assets acquired 463
Intangible assets –Investments 452Receivables1 1Cash at bank, cheques and cash in hand 10Deferred tax assets –Other assets –
Liabilities assumed –57Other reserves –Liabilities –57Deferred tax liabilities –Other liabilities2 –
Revenue included in the consolidated income statement since the acquisition date 6Result included in the consolidated income statement since the acquisition date 1Contributions to the consolidated revenues as if the acquisition date for the business combination had been 1 January 20153 18
1 The fair value of the receivables acquired as part of the transactions corresponds to the carrying amount. No defaults were expected at the acquisition date.
2 No contingent liabilities, contingent payments or separate transactions within the meaning of IFRS 3 were identified.3 The change in the consolidated result cannot be accurately calculated owing to lack of data at the beginning of the year.

Selected notes to the consolidated financial statements40
Munich Re Quarterly Report 3/2015
In accordance with the management approach, the segmentation of our business operations is based on the way in which Munich Re is managed internally.
We have consequently identified six segments to be reported:
— Life reinsurance (global life reinsurance business) — Property-casualty reinsurance (global property-casualty reinsurance business) — ERGO Life and Health Germany (German life and health primary insurance business, German direct property-casualty primary insurance business, and global travel insurance business)
— ERGO Property-casualty Germany (German property-casualty primary insurance business, excluding direct business)
— ERGO International (ERGO primary insurance business outside Germany) — Munich Health (global health reinsurance business and health primary insurance business outside Germany)
Certain primary insurers whose business requires special solution-finding competence are coupled to reinsurance as the risk carrier. We therefore transact their business from within reinsurance and consequently allocate them to the reinsurance segment.
Munich Re uses different performance indicators and measures. The main performance metrics at Group level are economic earnings and the return on risk-adjusted capital (RORAC). Besides this, IFRS result contributions are the basis of planning and strategy in all segments. Therefore the uniform assessment basis used for measuring the segment result is the operating result adjusted to eliminate non-operating components. The operating result is split into a technical result and a non-technical result, with an interest component allocated to the underwriting business in the form of income from technical interest. The non-technical result also separately discloses the insurance-related investment result and the result of other investments. The segments reported under IFRS 8 are now shown after elimination of all intra-Group transactions (mainly dividend payments, sales, reinsurance transactions, receivables and corresponding interest income). Our segment reporting has no consolidation column.
Segment reporting
41Selected notes to the consolidated financial statements
Munich Re Quarterly Report 3/2015
In the case of intra-Group sales of assets where a provision for premium refunds has to be posted, the latter always has to be shown by the selling segment. Intra-Group loans are completely eliminated in the balance sheet through consolidation. By contrast, the expenditure for the borrowers and income for the lenders is shown unconsolidated under “Other non-operating result, impairment losses of goodwill and net finance costs” for the segments concerned. All intra-Group shareholdings are consolidated, and all earnings and expenditure of the subsidiaries are shown in their segments.
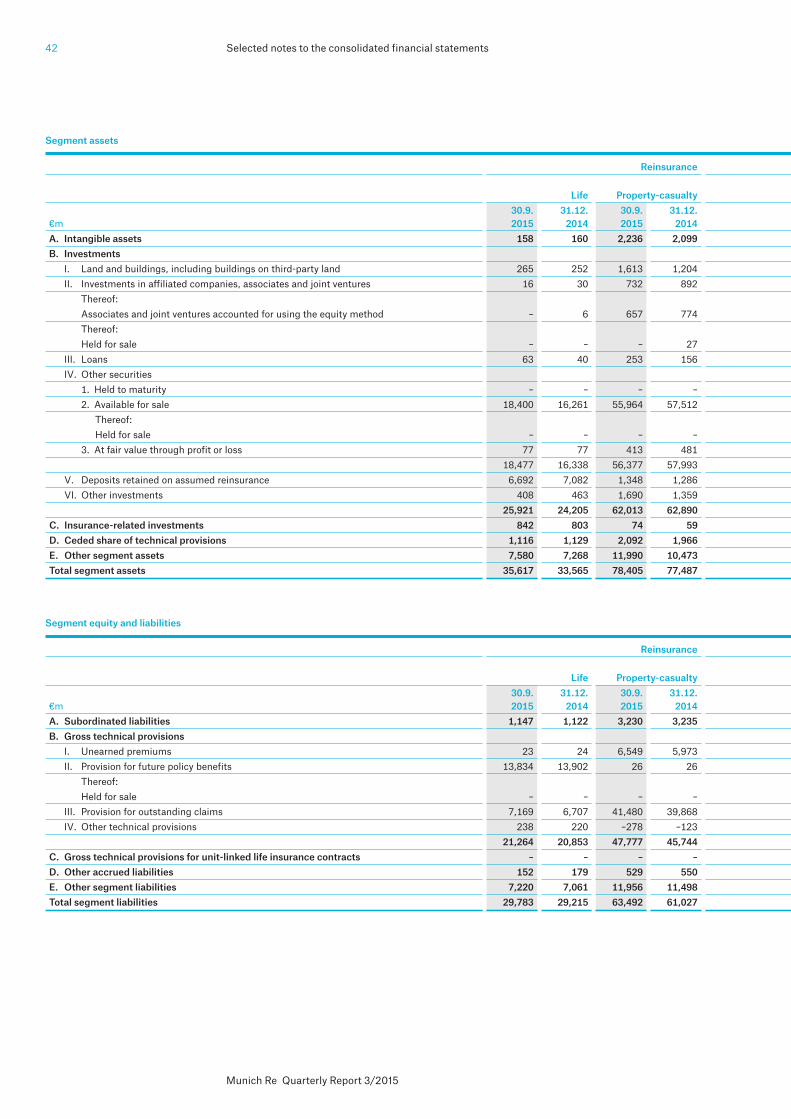
Selected notes to the consolidated financial statements42
Munich Re Quarterly Report 3/2015
Segment assets
Reinsurance ERGO Munich Health Total Life and Health Property-casualty Inter- Life Property-casualty Germany Germany national 30.9. 31.12. 30.9. 31.12. 30.9. 31.12. 30.9. 31.12. 30.9. 31.12. 30.9. 31.12. 30.9. 31.12.€m 2015 2014 2015 2014 2015 2014 2015 2014 2015 2014 2015 2014 2015 2014A. Intangible assets 158 160 2,236 2,099 652 664 962 974 351 375 10 11 4,369 4,283B. Investments I. Land and buildings, including buildings on third-party land 265 252 1,613 1,204 2,021 2,016 149 140 93 110 14 10 4,155 3,732 II. Investments in affiliated companies, associates and joint ventures 16 30 732 892 333 335 55 70 192 143 111 89 1,439 1,559 Thereof: Associates and joint ventures accounted for using the equity method – 6 657 774 274 272 21 35 154 105 99 88 1,205 1,280 Thereof: Held for sale – – – 27 – – – – – – – – – 27 III. Loans 63 40 253 156 51,643 52,181 1,479 1,709 388 440 26 24 53,852 54,550 IV. Other securities 1. Held to maturity – – – – – – – – – – – – – – 2. Available for sale 18,400 16,261 55,964 57,512 46,134 45,591 4,940 4,791 16,244 16,316 3,432 3,372 145,114 143,843 Thereof: Held for sale – – – – – – – – – – – 79 – 79 3. At fair value through profit or loss 77 77 413 481 1,591 1,159 75 32 375 416 9 4 2,540 2,169 18,477 16,338 56,377 57,993 47,725 46,750 5,015 4,823 16,619 16,732 3,441 3,376 147,654 146,012 V. Deposits retained on assumed reinsurance 6,692 7,082 1,348 1,286 33 39 5 8 14 14 338 321 8,430 8,750 VI. Other investments 408 463 1,690 1,359 1,453 1,733 121 170 297 514 151 85 4,120 4,324 25,921 24,205 62,013 62,890 103,208 103,054 6,824 6,920 17,603 17,953 4,081 3,905 219,650 218,927C. Insurance-related investments 842 803 74 59 4,430 4,301 – – 3,360 3,297 1 1 8,707 8,461D. Ceded share of technical provisions 1,116 1,129 2,092 1,966 15 8 93 76 1,903 1,940 159 209 5,378 5,328E. Other segment assets 7,580 7,268 11,990 10,473 11,840 10,424 3,035 2,567 3,830 3,597 1,803 1,656 40,078 35,985Total segment assets 35,617 33,565 78,405 77,487 120,145 118,451 10,914 10,537 27,047 27,162 6,054 5,782 278,182 272,984
Segment equity and liabilities
Reinsurance ERGO Munich Health Total Life and Health Property-casualty Inter- Life Property-casualty Germany Germany national 30.9. 31.12. 30.9. 31.12. 30.9. 31.12. 30.9. 31.12. 30.9. 31.12. 30.9. 31.12. 30.9. 31.12.€m 2015 2014 2015 2014 2015 2014 2015 2014 2015 2014 2015 2014 2015 2014A. Subordinated liabilities 1,147 1,122 3,230 3,235 – – – – 25 25 26 31 4,428 4,413B. Gross technical provisions I. Unearned premiums 23 24 6,549 5,973 203 174 657 443 1,441 1,363 424 396 9,297 8,373 II. Provision for future policy benefits 13,834 13,902 26 26 86,101 84,896 429 428 12,478 12,328 1,095 1,068 113,963 112,648 Thereof: Held for sale – – – – – – – – – – – 48 – 48 III. Provision for outstanding claims 7,169 6,707 41,480 39,868 2,765 2,653 3,952 3,866 2,348 2,231 1,166 1,037 58,880 56,362 IV. Other technical provisions 238 220 –278 –123 16,144 17,077 102 107 932 1,049 208 162 17,346 18,492 21,264 20,853 47,777 45,744 105,213 104,800 5,140 4,844 17,199 16,971 2,893 2,663 199,486 195,875C. Gross technical provisions for unit-linked life insurance contracts – – – – 4,891 4,742 – – 2,987 3,094 1 1 7,879 7,837D. Other accrued liabilities 152 179 529 550 1,858 1,981 718 759 783 856 135 148 4,175 4,473E. Other segment liabilities 7,220 7,061 11,956 11,498 6,838 5,473 1,657 1,671 3,096 3,044 1,402 1,350 32,169 30,097Total segment liabilities 29,783 29,215 63,492 61,027 118,800 116,996 7,515 7,274 24,090 23,990 4,457 4,193 248,137 242,695 Equity 30,045 30,289 Total equity and liabilities 278,182 272,984
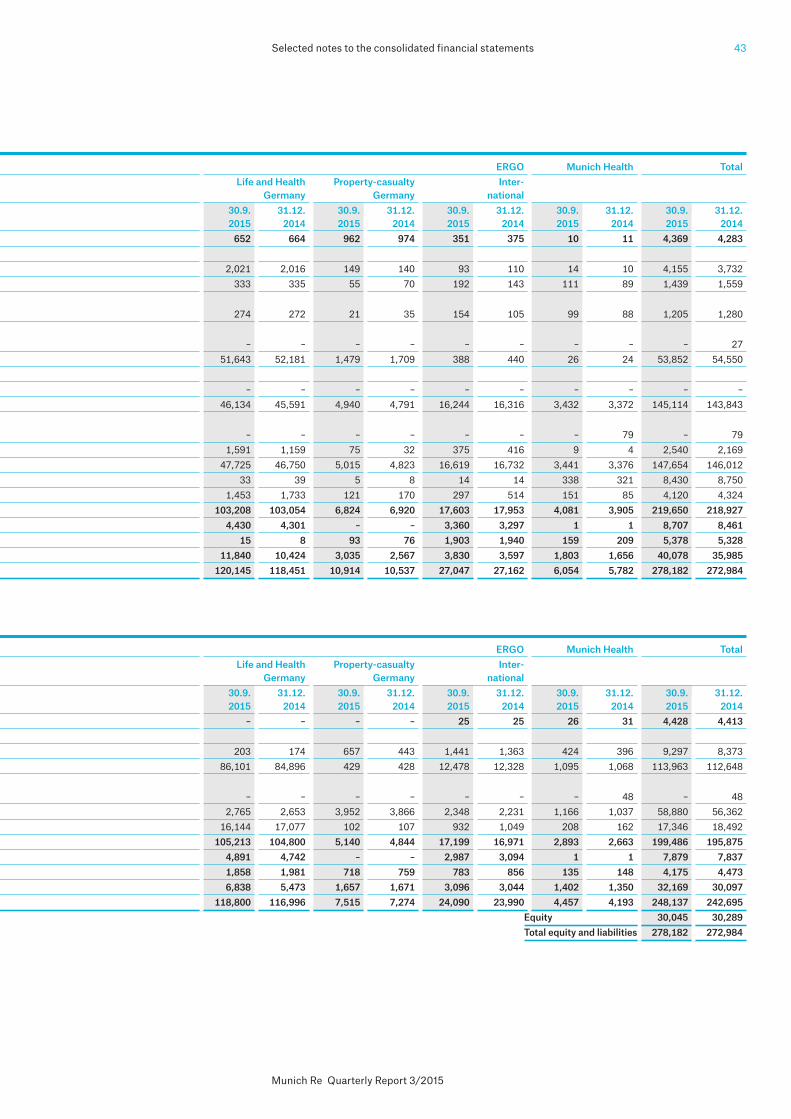
43Selected notes to the consolidated financial statements
Munich Re Quarterly Report 3/2015
Segment assets
Reinsurance ERGO Munich Health Total Life and Health Property-casualty Inter- Life Property-casualty Germany Germany national 30.9. 31.12. 30.9. 31.12. 30.9. 31.12. 30.9. 31.12. 30.9. 31.12. 30.9. 31.12. 30.9. 31.12.€m 2015 2014 2015 2014 2015 2014 2015 2014 2015 2014 2015 2014 2015 2014A. Intangible assets 158 160 2,236 2,099 652 664 962 974 351 375 10 11 4,369 4,283B. Investments I. Land and buildings, including buildings on third-party land 265 252 1,613 1,204 2,021 2,016 149 140 93 110 14 10 4,155 3,732 II. Investments in affiliated companies, associates and joint ventures 16 30 732 892 333 335 55 70 192 143 111 89 1,439 1,559 Thereof: Associates and joint ventures accounted for using the equity method – 6 657 774 274 272 21 35 154 105 99 88 1,205 1,280 Thereof: Held for sale – – – 27 – – – – – – – – – 27 III. Loans 63 40 253 156 51,643 52,181 1,479 1,709 388 440 26 24 53,852 54,550 IV. Other securities 1. Held to maturity – – – – – – – – – – – – – – 2. Available for sale 18,400 16,261 55,964 57,512 46,134 45,591 4,940 4,791 16,244 16,316 3,432 3,372 145,114 143,843 Thereof: Held for sale – – – – – – – – – – – 79 – 79 3. At fair value through profit or loss 77 77 413 481 1,591 1,159 75 32 375 416 9 4 2,540 2,169 18,477 16,338 56,377 57,993 47,725 46,750 5,015 4,823 16,619 16,732 3,441 3,376 147,654 146,012 V. Deposits retained on assumed reinsurance 6,692 7,082 1,348 1,286 33 39 5 8 14 14 338 321 8,430 8,750 VI. Other investments 408 463 1,690 1,359 1,453 1,733 121 170 297 514 151 85 4,120 4,324 25,921 24,205 62,013 62,890 103,208 103,054 6,824 6,920 17,603 17,953 4,081 3,905 219,650 218,927C. Insurance-related investments 842 803 74 59 4,430 4,301 – – 3,360 3,297 1 1 8,707 8,461D. Ceded share of technical provisions 1,116 1,129 2,092 1,966 15 8 93 76 1,903 1,940 159 209 5,378 5,328E. Other segment assets 7,580 7,268 11,990 10,473 11,840 10,424 3,035 2,567 3,830 3,597 1,803 1,656 40,078 35,985Total segment assets 35,617 33,565 78,405 77,487 120,145 118,451 10,914 10,537 27,047 27,162 6,054 5,782 278,182 272,984
Segment equity and liabilities
Reinsurance ERGO Munich Health Total Life and Health Property-casualty Inter- Life Property-casualty Germany Germany national 30.9. 31.12. 30.9. 31.12. 30.9. 31.12. 30.9. 31.12. 30.9. 31.12. 30.9. 31.12. 30.9. 31.12.€m 2015 2014 2015 2014 2015 2014 2015 2014 2015 2014 2015 2014 2015 2014A. Subordinated liabilities 1,147 1,122 3,230 3,235 – – – – 25 25 26 31 4,428 4,413B. Gross technical provisions I. Unearned premiums 23 24 6,549 5,973 203 174 657 443 1,441 1,363 424 396 9,297 8,373 II. Provision for future policy benefits 13,834 13,902 26 26 86,101 84,896 429 428 12,478 12,328 1,095 1,068 113,963 112,648 Thereof: Held for sale – – – – – – – – – – – 48 – 48 III. Provision for outstanding claims 7,169 6,707 41,480 39,868 2,765 2,653 3,952 3,866 2,348 2,231 1,166 1,037 58,880 56,362 IV. Other technical provisions 238 220 –278 –123 16,144 17,077 102 107 932 1,049 208 162 17,346 18,492 21,264 20,853 47,777 45,744 105,213 104,800 5,140 4,844 17,199 16,971 2,893 2,663 199,486 195,875C. Gross technical provisions for unit-linked life insurance contracts – – – – 4,891 4,742 – – 2,987 3,094 1 1 7,879 7,837D. Other accrued liabilities 152 179 529 550 1,858 1,981 718 759 783 856 135 148 4,175 4,473E. Other segment liabilities 7,220 7,061 11,956 11,498 6,838 5,473 1,657 1,671 3,096 3,044 1,402 1,350 32,169 30,097Total segment liabilities 29,783 29,215 63,492 61,027 118,800 116,996 7,515 7,274 24,090 23,990 4,457 4,193 248,137 242,695 Equity 30,045 30,289 Total equity and liabilities 278,182 272,984

Selected notes to the consolidated financial statements44
Munich Re Quarterly Report 3/2015
Segment income statement 1.1.–30.9.2015
Reinsurance ERGO Munich Health Total Life and Health Property-casualty Inter- Life Property-casualty Germany Germany national€m Q1–3 2015 Q1–3 2014 Q1–3 2015 Q1–3 2014 Q1–3 2015 Q1–3 2014 Q1–3 2015 Q1–3 2014 Q1–3 2015 Q1–3 2014 Q1–3 2015 Q1–3 2014 Q1–3 2015 Q1–3 2014Gross premiums written 7,653 7,393 13,583 12,762 7,025 7,314 2,529 2,510 2,936 2,811 4,260 4,043 37,986 36,833 1. Net earned premiums 7,485 7,090 12,632 12,052 6,984 7,279 2,269 2,290 2,670 2,566 4,127 4,032 36,167 35,309 2. Income from technical interest 550 513 1,032 898 3,073 3,514 65 74 225 553 29 28 4,974 5,580 3. Net expenses for claims and benefits –6,081 –5,850 –7,863 –7,577 –8,674 –9,443 –1,452 –1,460 –1,993 –2,145 –3,512 –3,313 –29,575 –29,788 4. Net operating expenses –1,707 –1,479 –3,932 –3,656 –1,081 –1,086 –742 –731 –852 –861 –611 –659 –8,925 –8,472 5. Technical result (1– 4) 247 274 1,869 1,717 302 264 140 173 50 113 33 88 2,641 2,629 6. Investment result 628 589 1,450 1,337 3,141 3,366 171 182 390 498 92 58 5,872 6,030 7. Insurance-related investment result –36 –1 59 –39 –19 228 – – –73 174 – – –69 362 8. Other operating result 46 40 –64 –42 –37 –33 – –14 –13 –13 –10 –7 –78 –69 9. Deduction of income from technical interest –550 –513 –1,032 –898 –3,073 –3,514 –65 –74 –225 –553 –29 –28 –4,974 –5,580 10. Non-technical result (6– 9) 88 115 413 358 12 47 106 94 79 106 53 23 751 743 11. Operating result (5+10) 335 389 2,282 2,075 314 311 246 267 129 219 86 111 3,392 3,372 12. Other non-operating result, net finance costs and impairment losses of goodwill –109 –83 –352 –316 –135 –129 –54 –56 –50 –48 –1 –5 –701 –637 13. Taxes on income –54 –26 –213 –111 –46 –43 41 –54 –27 –51 –1 –11 –300 –296 14. Consolidated result (11–13) 172 280 1,717 1,648 133 139 233 157 52 120 84 95 2,391 2,439
Segment income statement 1.7.–30.9.2015
Reinsurance ERGO Munich Health Total Life and Health Property-casualty Inter- Life Property-casualty Germany Germany national€m Q3 2015 Q3 2014 Q3 2015 Q3 2014 Q3 2015 Q3 2014 Q3 2015 Q3 2014 Q3 2015 Q3 2014 Q3 2015 Q3 2014 Q3 2015 Q3 2014Gross premiums written 2,537 2,449 4,581 4,284 2,298 2,409 698 682 974 926 1,393 1,303 12,481 12,053 1. Net earned premiums 2,476 2,358 4,177 4,024 2,307 2,412 772 766 873 875 1,351 1,274 11,956 11,709 2. Income from technical interest 180 168 343 305 867 1,119 21 25 42 150 10 9 1,463 1,776 3. Net expenses for claims and benefits –2,029 –1,880 –2,642 –2,483 –2,729 –3,090 –499 –485 –634 –702 –1,145 –1,034 –9,678 –9,674 4. Net operating expenses –513 –591 –1,306 –1,189 –354 –350 –250 –236 –276 –290 –181 –199 –2,880 –2,855 5. Technical result (1– 4) 114 55 572 657 91 91 44 70 5 33 35 50 861 956 6. Investment result 104 147 120 216 1,162 1,085 –30 32 150 175 25 15 1,531 1,670 7. Insurance-related investment result 8 9 34 –1 –295 61 – – –69 16 – – –322 85 8. Other operating result 17 13 –22 –20 –8 –12 –2 –3 –5 – –8 –5 –28 –27 9. Deduction of income from technical interest –180 –168 –343 –305 –867 –1,119 –21 –25 –42 –150 –10 –9 –1,463 –1,776 10. Non-technical result (6– 9) –51 1 –211 –110 –8 15 –53 4 34 41 7 1 –282 –48 11. Operating result (5+10) 63 56 361 547 83 106 –9 74 39 74 42 51 579 908 12. Other non-operating result, net finance costs and impairment losses of goodwill –15 –11 –72 –99 –36 –46 –23 –15 –9 –10 – –2 –155 –183 13. Taxes on income 1 –11 41 49 –19 13 78 –28 –4 –16 4 4 101 11 14. Consolidated result (11–13) 49 34 330 497 28 73 46 31 26 48 46 53 525 736

45Selected notes to the consolidated financial statements
Munich Re Quarterly Report 3/2015
Segment income statement 1.1.–30.9.2015
Reinsurance ERGO Munich Health Total Life and Health Property-casualty Inter- Life Property-casualty Germany Germany national€m Q1–3 2015 Q1–3 2014 Q1–3 2015 Q1–3 2014 Q1–3 2015 Q1–3 2014 Q1–3 2015 Q1–3 2014 Q1–3 2015 Q1–3 2014 Q1–3 2015 Q1–3 2014 Q1–3 2015 Q1–3 2014Gross premiums written 7,653 7,393 13,583 12,762 7,025 7,314 2,529 2,510 2,936 2,811 4,260 4,043 37,986 36,833 1. Net earned premiums 7,485 7,090 12,632 12,052 6,984 7,279 2,269 2,290 2,670 2,566 4,127 4,032 36,167 35,309 2. Income from technical interest 550 513 1,032 898 3,073 3,514 65 74 225 553 29 28 4,974 5,580 3. Net expenses for claims and benefits –6,081 –5,850 –7,863 –7,577 –8,674 –9,443 –1,452 –1,460 –1,993 –2,145 –3,512 –3,313 –29,575 –29,788 4. Net operating expenses –1,707 –1,479 –3,932 –3,656 –1,081 –1,086 –742 –731 –852 –861 –611 –659 –8,925 –8,472 5. Technical result (1– 4) 247 274 1,869 1,717 302 264 140 173 50 113 33 88 2,641 2,629 6. Investment result 628 589 1,450 1,337 3,141 3,366 171 182 390 498 92 58 5,872 6,030 7. Insurance-related investment result –36 –1 59 –39 –19 228 – – –73 174 – – –69 362 8. Other operating result 46 40 –64 –42 –37 –33 – –14 –13 –13 –10 –7 –78 –69 9. Deduction of income from technical interest –550 –513 –1,032 –898 –3,073 –3,514 –65 –74 –225 –553 –29 –28 –4,974 –5,580 10. Non-technical result (6– 9) 88 115 413 358 12 47 106 94 79 106 53 23 751 743 11. Operating result (5+10) 335 389 2,282 2,075 314 311 246 267 129 219 86 111 3,392 3,372 12. Other non-operating result, net finance costs and impairment losses of goodwill –109 –83 –352 –316 –135 –129 –54 –56 –50 –48 –1 –5 –701 –637 13. Taxes on income –54 –26 –213 –111 –46 –43 41 –54 –27 –51 –1 –11 –300 –296 14. Consolidated result (11–13) 172 280 1,717 1,648 133 139 233 157 52 120 84 95 2,391 2,439
Segment income statement 1.7.–30.9.2015
Reinsurance ERGO Munich Health Total Life and Health Property-casualty Inter- Life Property-casualty Germany Germany national€m Q3 2015 Q3 2014 Q3 2015 Q3 2014 Q3 2015 Q3 2014 Q3 2015 Q3 2014 Q3 2015 Q3 2014 Q3 2015 Q3 2014 Q3 2015 Q3 2014Gross premiums written 2,537 2,449 4,581 4,284 2,298 2,409 698 682 974 926 1,393 1,303 12,481 12,053 1. Net earned premiums 2,476 2,358 4,177 4,024 2,307 2,412 772 766 873 875 1,351 1,274 11,956 11,709 2. Income from technical interest 180 168 343 305 867 1,119 21 25 42 150 10 9 1,463 1,776 3. Net expenses for claims and benefits –2,029 –1,880 –2,642 –2,483 –2,729 –3,090 –499 –485 –634 –702 –1,145 –1,034 –9,678 –9,674 4. Net operating expenses –513 –591 –1,306 –1,189 –354 –350 –250 –236 –276 –290 –181 –199 –2,880 –2,855 5. Technical result (1– 4) 114 55 572 657 91 91 44 70 5 33 35 50 861 956 6. Investment result 104 147 120 216 1,162 1,085 –30 32 150 175 25 15 1,531 1,670 7. Insurance-related investment result 8 9 34 –1 –295 61 – – –69 16 – – –322 85 8. Other operating result 17 13 –22 –20 –8 –12 –2 –3 –5 – –8 –5 –28 –27 9. Deduction of income from technical interest –180 –168 –343 –305 –867 –1,119 –21 –25 –42 –150 –10 –9 –1,463 –1,776 10. Non-technical result (6– 9) –51 1 –211 –110 –8 15 –53 4 34 41 7 1 –282 –48 11. Operating result (5+10) 63 56 361 547 83 106 –9 74 39 74 42 51 579 908 12. Other non-operating result, net finance costs and impairment losses of goodwill –15 –11 –72 –99 –36 –46 –23 –15 –9 –10 – –2 –155 –183 13. Taxes on income 1 –11 41 49 –19 13 78 –28 –4 –16 4 4 101 11 14. Consolidated result (11–13) 49 34 330 497 28 73 46 31 26 48 46 53 525 736
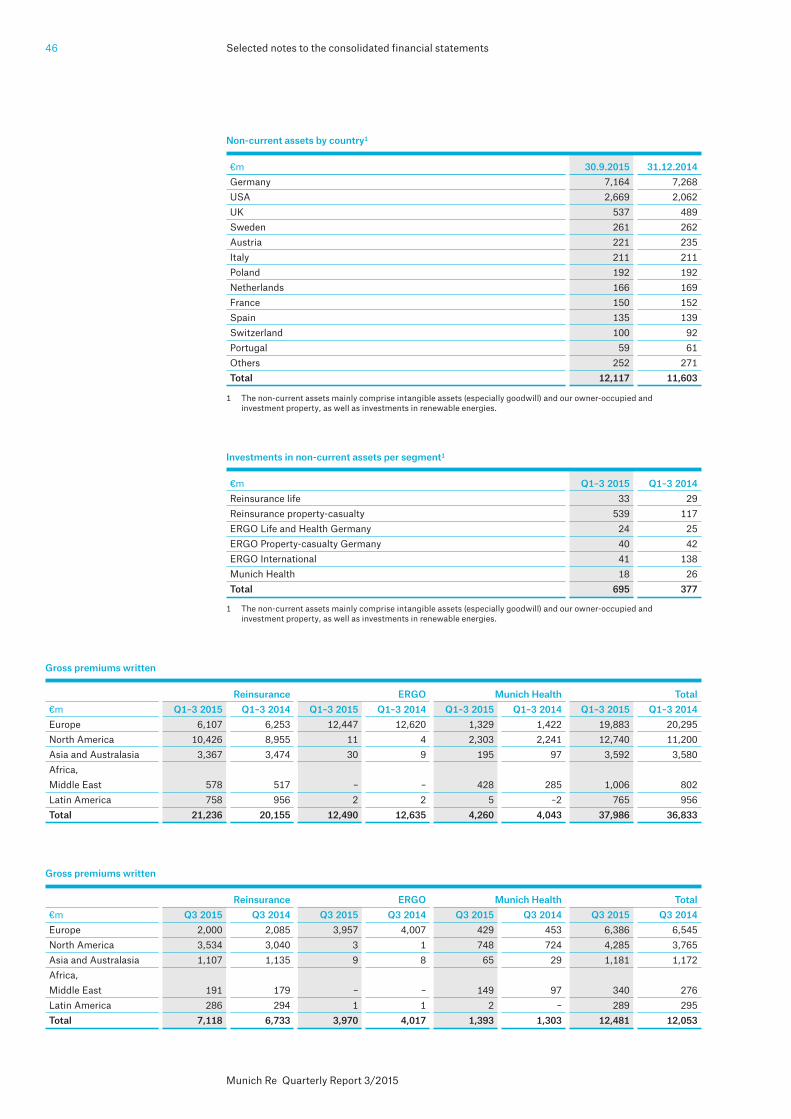
Selected notes to the consolidated financial statements46
Munich Re Quarterly Report 3/2015
1 The non-current assets mainly comprise intangible assets (especially goodwill) and our owner-occupied and investment property, as well as investments in renewable energies.
Non-current assets by country1
€m 30.9.2015 31.12.2014Germany 7,164 7,268USA 2,669 2,062UK 537 489Sweden 261 262Austria 221 235Italy 211 211Poland 192 192Netherlands 166 169France 150 152Spain 135 139Switzerland 100 92Portugal 59 61Others 252 271Total 12,117 11,603
1 The non-current assets mainly comprise intangible assets (especially goodwill) and our owner-occupied and investment property, as well as investments in renewable energies.
Investments in non-current assets per segment1
€m Q1–3 2015 Q1–3 2014Reinsurance life 33 29Reinsurance property-casualty 539 117ERGO Life and Health Germany 24 25ERGO Property-casualty Germany 40 42ERGO International 41 138Munich Health 18 26Total 695 377
Gross premiums written
Reinsurance ERGO Munich Health Total€m Q1–3 2015 Q1–3 2014 Q1–3 2015 Q1–3 2014 Q1–3 2015 Q1–3 2014 Q1–3 2015 Q1–3 2014Europe 6,107 6,253 12,447 12,620 1,329 1,422 19,883 20,295North America 10,426 8,955 11 4 2,303 2,241 12,740 11,200Asia and Australasia 3,367 3,474 30 9 195 97 3,592 3,580Africa, Middle East 578 517 – – 428 285 1,006 802Latin America 758 956 2 2 5 –2 765 956Total 21,236 20,155 12,490 12,635 4,260 4,043 37,986 36,833
Gross premiums written
Reinsurance ERGO Munich Health Total€m Q3 2015 Q3 2014 Q3 2015 Q3 2014 Q3 2015 Q3 2014 Q3 2015 Q3 2014Europe 2,000 2,085 3,957 4,007 429 453 6,386 6,545North America 3,534 3,040 3 1 748 724 4,285 3,765Asia and Australasia 1,107 1,135 9 8 65 29 1,181 1,172Africa, Middle East 191 179 – – 149 97 340 276Latin America 286 294 1 1 2 – 289 295Total 7,118 6,733 3,970 4,017 1,393 1,303 12,481 12,053

47Selected notes to the consolidated financial statements
Munich Re Quarterly Report 3/2015
Notes to the consolidated balance sheet
The main items of the consolidated balance sheet are made up as follows:
Intangible assets
Development of goodwill
Reinsurance Primary insurance Munich Re ERGOGoodwill from the acquisition of America Other Insurance Group€m Q1–3 2015 Q1–3 2014 Q1–3 2015 Q1–3 2014 Q1–3 2015 Q1–3 2014Gross carrying amount at 31 Dec. previous year 1,140 1,001 493 440 1,754 1,754Accumulated impairment losses at 31 Dec. previous year – – –51 –51 –440 –Carrying amount at 31 Dec. previous year 1,140 1,001 442 389 1,314 1,754Currency translation differences 96 91 35 34 – –Additions – – – – – –Disposals – – – – – –Reclassifications – – – – – –Impairment losses – – – – – –Carrying amount at 30 September financial year 1,236 1,092 477 423 1,314 1,754Accumulated impairment losses at 30 September financial year – – –51 –51 –440 –Gross carrying amount at 30 September financial year 1,236 1,092 528 474 1,754 1,754
Primary insurance Munich Health Total Goodwill from the acquisition of Other Other €m Q1–3 2015 Q1–3 2014 Q1–3 2015 Q1–3 2014 Q1–3 2015 Q1–3 2014Gross carrying amount at 31 Dec. previous year 581 557 156 156 4,124 3,908Accumulated impairment losses at 31 Dec. previous year –414 –409 –156 –156 –1,061 –616Carrying amount at 31 Dec. previous year 167 148 – – 3,063 3,292Currency translation differences 2 1 – – 133 126Additions – 26 – – – 26Disposals – – – – – –Reclassifications – – – – – –Impairment losses – – – – – –Carrying amount at 30 September financial year 169 175 – – 3,196 3,444Accumulated impairment losses at 30 September financial year –414 –409 –156 –156 –1,061 –616Gross carrying amount at 30 September financial year 583 584 156 156 4,257 4,060
Breakdown of other intangible assets
€m 30.9.2015 31.12.2014Acquired insurance portfolios 300 318Software
Self-developed 68 82Other 266 279
Acquired brand names 38 36Acquired distribution networks/client bases 204 212Acquired licences/patents 261 253Other
Self-developed – –Other 36 40
Total 1,173 1,220
Selected notes to the consolidated financial statements48
Munich Re Quarterly Report 3/2015
Investments
IFRS 13 defines fair value as the price that would be received to sell an asset or paid to transfer a liability in an orderly transaction between market participants at the measurement date. All financial instruments recognised at fair value are allocated to one of the valuation hierarchy levels of IFRS 13. This fair value hierarchy provides for three levels. The allocation reflects which of the fair values derive from transactions in the market and where valuation is based on models because market transactions are lacking.
Regularly, at each quarterly reporting date, we assess whether the allocation of our investments and liabilities to the levels of the valuation hierarchy is still appropriate. If changes in the basis of valuation have occurred – for instance, if a market is no longer active or the valuation was performed using inputs requiring another allocation – we make the necessary adjustments.
The following table provides an overview of the methods used to measure the fair values of our investments.

49Selected notes to the consolidated financial statements
Munich Re Quarterly Report 3/2015
Valuation models Bonds Pricing method Parameters Pricing modelInterest-rate risks Loans against borrower’s note/ Theoretical price Sector-, rating- or Present value methodregistered bonds issuer-specific yield curve Cat bond (host) Theoretical price Interest-rate curve Present value methodMortgage loans Theoretical price Sector-specific yield curve Present value method
Derivatives Pricing method Parameters Pricing modelEquity and index risks OTC stock options Theoretical price Listing of underlying shares Black-Scholes (European) Effective volatilities Cox, Ross and Rubinstein Money-market interest rate (American) Dividend yield Monte Carlo simulationEquity forwards Theoretical price Listing of underlying shares Present value method Money-market interest rate Dividend yield Interest-rate risks Interest-rate swaps Theoretical price Swap curve Present value method Money-market interest-rate curve Swaptions/interest-rate Theoretical price At-the-money volatility matrix and Bachelier modelguarantee skew swap curve Money-market interest-rate curve Interest-rate currency swaps Theoretical price Swap curve Present value method Money-market interest-rate curve Currency spot rates Inflation swaps Theoretical price Zero-coupon inflation swap rates Present value method Swap curve Money-market interest-rate curve Currency risks Currency options Theoretical price At-the-money volatility Garman-Kohlhagen Currency spot rates (European) Money-market interest-rate curve Currency forwards Theoretical price Currency spot rates Present value method Money-market interest-rate curve Other transactions Insurance derivatives Theoretical price Market values of cat bonds Present value method(excluding variable annuities) Historical event data Interest-rate curve Insurance derivatives Theoretical price Biometric and lapse rates Present value method(variable annuities) Volatilities Interest-rate curve Currency spot rates Credit default swaps Theoretical price Credit spreads Present value method Recovery rates ISDA CDS Standard Model Interest-rate curve Total return swaps on Theoretical price Listing of underlying index Index ratio calculationcommodities Commodity options Theoretical price Listing of underlying shares Black-Scholes (European) Effective volatilities Cox, Ross and Rubinstein Money-market interest rate (American)
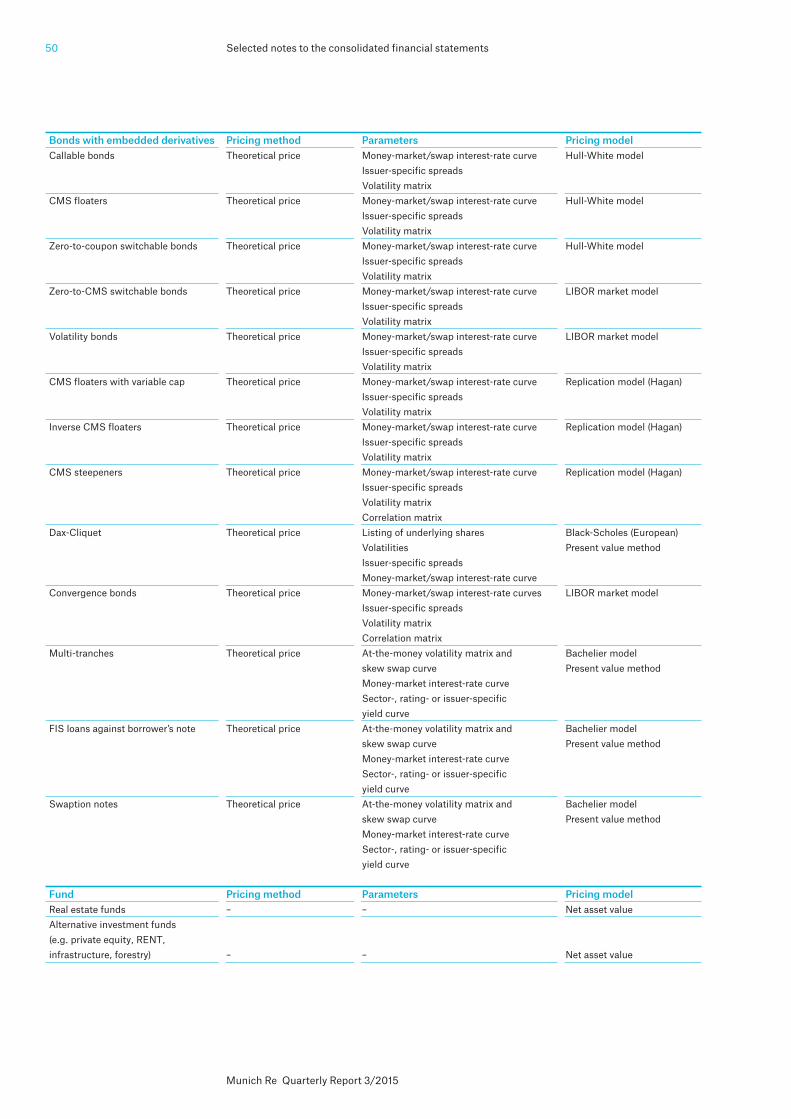
Selected notes to the consolidated financial statements50
Munich Re Quarterly Report 3/2015
Bonds with embedded derivatives Pricing method Parameters Pricing modelCallable bonds Theoretical price Money-market/swap interest-rate curve Hull-White model Issuer-specific spreads Volatility matrix CMS floaters Theoretical price Money-market/swap interest-rate curve Hull-White model Issuer-specific spreads Volatility matrix Zero-to-coupon switchable bonds Theoretical price Money-market/swap interest-rate curve Hull-White model Issuer-specific spreads Volatility matrix Zero-to-CMS switchable bonds Theoretical price Money-market/swap interest-rate curve LIBOR market model Issuer-specific spreads Volatility matrix Volatility bonds Theoretical price Money-market/swap interest-rate curve LIBOR market model Issuer-specific spreads Volatility matrix CMS floaters with variable cap Theoretical price Money-market/swap interest-rate curve Replication model (Hagan) Issuer-specific spreads Volatility matrix Inverse CMS floaters Theoretical price Money-market/swap interest-rate curve Replication model (Hagan) Issuer-specific spreads Volatility matrix CMS steepeners Theoretical price Money-market/swap interest-rate curve Replication model (Hagan) Issuer-specific spreads Volatility matrix Correlation matrix Dax-Cliquet Theoretical price Listing of underlying shares Black-Scholes (European) Volatilities Present value method Issuer-specific spreads Money-market/swap interest-rate curve Convergence bonds Theoretical price Money-market/swap interest-rate curves LIBOR market model Issuer-specific spreads Volatility matrix Correlation matrix Multi-tranches Theoretical price At-the-money volatility matrix and Bachelier model skew swap curve Present value method Money-market interest-rate curve Sector-, rating- or issuer-specific yield curveFIS loans against borrower’s note Theoretical price At-the-money volatility matrix and Bachelier model skew swap curve Present value method Money-market interest-rate curve Sector-, rating- or issuer-specific yield curve Swaption notes Theoretical price At-the-money volatility matrix and Bachelier model skew swap curve Present value method Money-market interest-rate curve Sector-, rating- or issuer-specific yield curve
Fund Pricing method Parameters Pricing modelReal estate funds – – Net asset value Alternative investment funds (e.g. private equity, RENT, infrastructure, forestry) – – Net asset value

51Selected notes to the consolidated financial statements
Munich Re Quarterly Report 3/2015
Insurance-linked derivatives (excluding variable annuities) are allocated to Level 3 of the fair value hierarchy. The valuation of the derivative components of catastrophe bonds is based on the values supplied by brokers for the underlying bonds, which is why it is not possible to quantify the inputs used that were not based on observable market data. If no observable inputs are available for customised insurance-linked derivatives, valuation is made using the present value method on the basis of current interest-rate curves and historical event data. Due to the low volume, the effects of alternative inputs and assumptions are immaterial.
At Munich Re, the valuation of variable annuities is performed on a market-consistent basis. The inputs requiring consideration in this valuation are derived in part directly from market data, in particular volatilities, interest-rate curves and currency spot rates, and estimated in part on the basis of external data, especially correlation assumptions and actuarial assumptions. The lapse rates used are modelled dynamically and range between 0.5% and 20%. A 10% increase or decrease in the lapse rates would lead to a change of –/+1% in the fair value of the portfolio. The assumptions with regard to mortality are based on published mortality tables. The impact of these and other non-observable assumptions is not material. Since inputs not observable on the market were also used in valuation, we allocate these products to Level 3 of the fair value hierarchy.
The other investments allocated to Level 3 are mainly external fund units (in particular, private equity and real estate) as well as relatively illiquid credit structures (especially collateralised mortgage-backed securities and credit-linked obligations). In the case of the former, market data are not available on a regular basis; instead, net asset values (NAVs) are provided by the asset managers. With regard to the latter, the quality of the market quotes available from market data providers is insufficient, so we resort to broker valuations. With these investments, we thus do not perform our own valuations using inputs that are not based on observable market data, but rely on what is supplied by the brokers. We regularly subject the valuations supplied to plausibility tests on the basis of comparable investments.
At 30 September 2015, around 11% of the investments measured at fair value were allocated to Level 1 of the fair value hierarchy, 86% to Level 2 and 3% to Level 3.
Other Pricing method Parameters Pricing modelReal estate Theoretical market value Interest-rate curve Present value method or Market rents valuationAlternative direct investments Theoretical market value Interest-rate curve (among others) Present value method or(e.g. RENT, infrastructure, forestry) Electricity price forecast and valuation inflation forecast
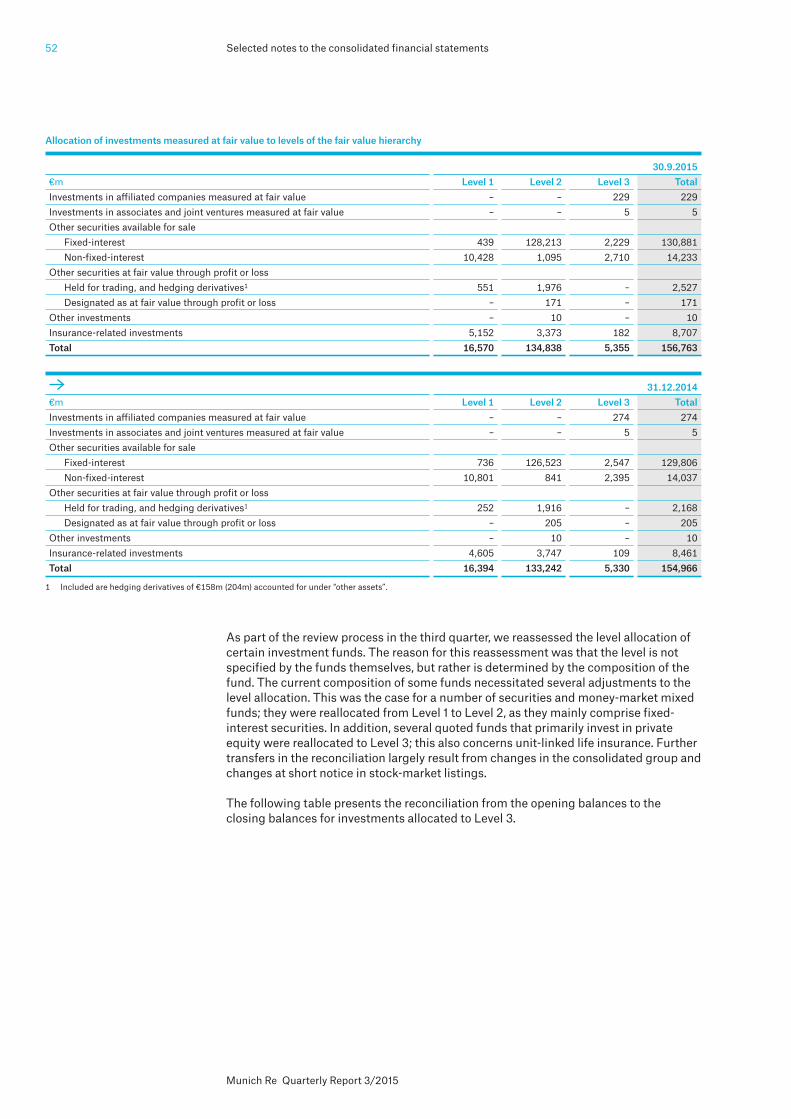
Selected notes to the consolidated financial statements52
Munich Re Quarterly Report 3/2015
As part of the review process in the third quarter, we reassessed the level allocation of certain investment funds. The reason for this reassessment was that the level is not specified by the funds themselves, but rather is determined by the composition of the fund. The current composition of some funds necessitated several adjustments to the level allocation. This was the case for a number of securities and money-market mixed funds; they were reallocated from Level 1 to Level 2, as they mainly comprise fixed-interest securities. In addition, several quoted funds that primarily invest in private equity were reallocated to Level 3; this also concerns unit-linked life insurance. Further transfers in the reconciliation largely result from changes in the consolidated group and changes at short notice in stock-market listings.
The following table presents the reconciliation from the opening balances to the closing balances for investments allocated to Level 3.
Allocation of investments measured at fair value to levels of the fair value hierarchy
30.9.2015€m Level 1 Level 2 Level 3 TotalInvestments in affiliated companies measured at fair value – – 229 229Investments in associates and joint ventures measured at fair value – – 5 5Other securities available for sale
Fixed-interest 439 128,213 2,229 130,881Non-fixed-interest 10,428 1,095 2,710 14,233
Other securities at fair value through profit or loss Held for trading, and hedging derivatives1 551 1,976 – 2,527Designated as at fair value through profit or loss – 171 – 171
Other investments – 10 – 10Insurance-related investments 5,152 3,373 182 8,707Total 16,570 134,838 5,355 156,763
1 Included are hedging derivatives of €158m (204m) accounted for under “other assets”.
31.12.2014€m Level 1 Level 2 Level 3 TotalInvestments in affiliated companies measured at fair value – – 274 274Investments in associates and joint ventures measured at fair value – – 5 5Other securities available for sale
Fixed-interest 736 126,523 2,547 129,806Non-fixed-interest 10,801 841 2,395 14,037
Other securities at fair value through profit or loss Held for trading, and hedging derivatives1 252 1,916 – 2,168Designated as at fair value through profit or loss – 205 – 205
Other investments – 10 – 10Insurance-related investments 4,605 3,747 109 8,461Total 16,394 133,242 5,330 154,966

53Selected notes to the consolidated financial statements
Munich Re Quarterly Report 3/2015
Continued on next page
Reconciliation for investments allocated to Level 3
Investments in affiliated Investments in associates companies measured at and joint ventures fair value measured at fair value
€m Q1–3 2015 Q1–3 2014 Q1–3 2015 Q1–3 2014Carrying amount at 31 Dec. previous year 274 176 5 9Gains and losses –58 11 – –
Gains (losses) recognised in the income statement 1 –1 – –Gains (losses) recognised in equity –59 12 – –
Acquisitions 30 43 1 –Disposals –28 –14 –1 –1Transfer to Level 3 11 38 – –Transfer out of Level 3 – – – –1Changes in the market value of derivatives – – – –Carrying amount at 30 September financial year 229 254 5 7Gains (losses) recognised in the income statement that are attributable to investments shown at 30 September financial year –1 –2 – –
Other securities available for sale Fixed-interest Non-fixed-interest€m Q1–3 2015 Q1–3 2014 Q1–3 2015 Q1–3 2014Carrying amount at 31 Dec. previous year 2,547 2,777 2,395 2,107Gains and losses 77 116 134 128
Gains (losses) recognised in the income statement 2 13 –10 –2Gains (losses) recognised in equity 75 103 144 130
Acquisitions 702 723 340 301Disposals –1,094 –1,062 –127 –222Transfer to Level 3 – 7 6 4Transfer out of Level 3 –2 –4 –38 –5Changes in the market value of derivatives –1 – – –Carrying amount at 30 September financial year 2,229 2,557 2,710 2,313Gains (losses) recognised in the income statement that are attributable to investments shown at 30 September financial year 2 13 –9 –3
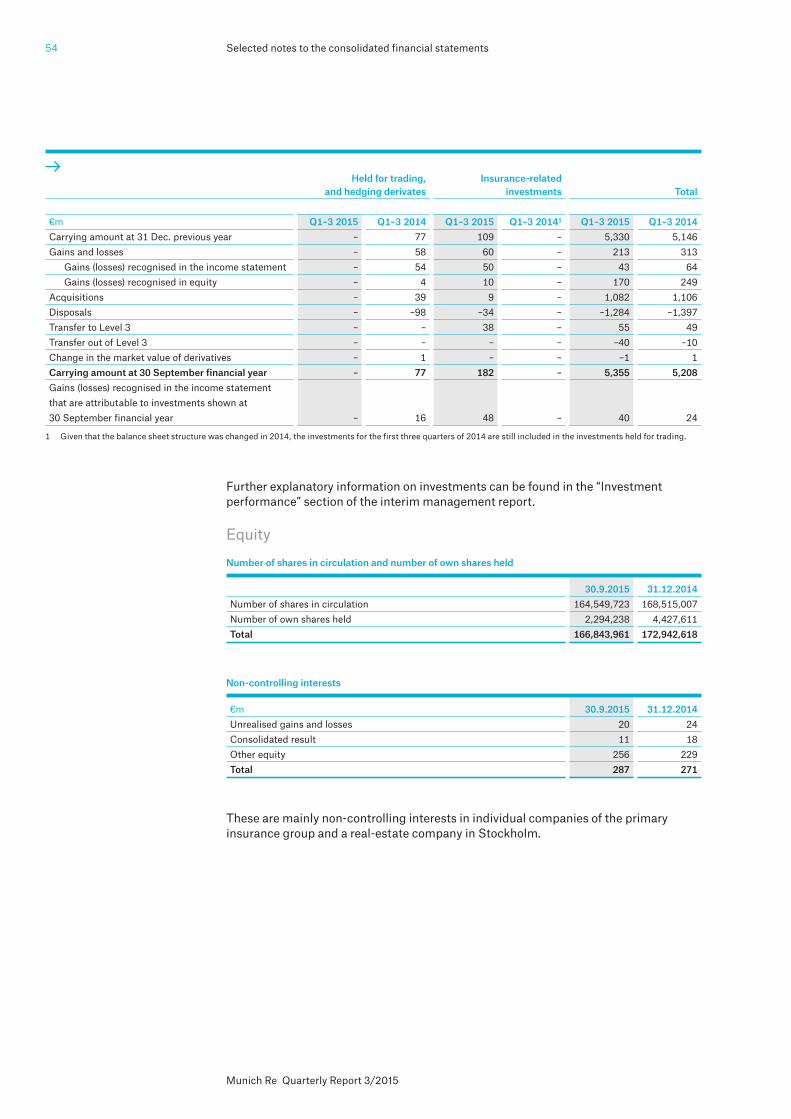
Selected notes to the consolidated financial statements54
Munich Re Quarterly Report 3/2015
Further explanatory information on investments can be found in the “Investment performance” section of the interim management report.
Equity
These are mainly non-controlling interests in individual companies of the primary insurance group and a real-estate company in Stockholm.
Held for trading, Insurance-related and hedging derivates investments Total €m Q1–3 2015 Q1–3 2014 Q1–3 2015 Q1–3 20141 Q1–3 2015 Q1–3 2014Carrying amount at 31 Dec. previous year – 77 109 – 5,330 5,146Gains and losses – 58 60 – 213 313
Gains (losses) recognised in the income statement – 54 50 – 43 64Gains (losses) recognised in equity – 4 10 – 170 249
Acquisitions – 39 9 – 1,082 1,106Disposals – –98 –34 – –1,284 –1,397Transfer to Level 3 – – 38 – 55 49Transfer out of Level 3 – – – – –40 –10Change in the market value of derivatives – 1 – – –1 1Carrying amount at 30 September financial year – 77 182 – 5,355 5,208Gains (losses) recognised in the income statement that are attributable to investments shown at 30 September financial year – 16 48 – 40 24
1 Given that the balance sheet structure was changed in 2014, the investments for the first three quarters of 2014 are still included in the investments held for trading.
Number of shares in circulation and number of own shares held
30.9.2015 31.12.2014Number of shares in circulation 164,549,723 168,515,007Number of own shares held 2,294,238 4,427,611Total 166,843,961 172,942,618
Non-controlling interests
€m 30.9.2015 31.12.2014Unrealised gains and losses 20 24Consolidated result 11 18Other equity 256 229Total 287 271
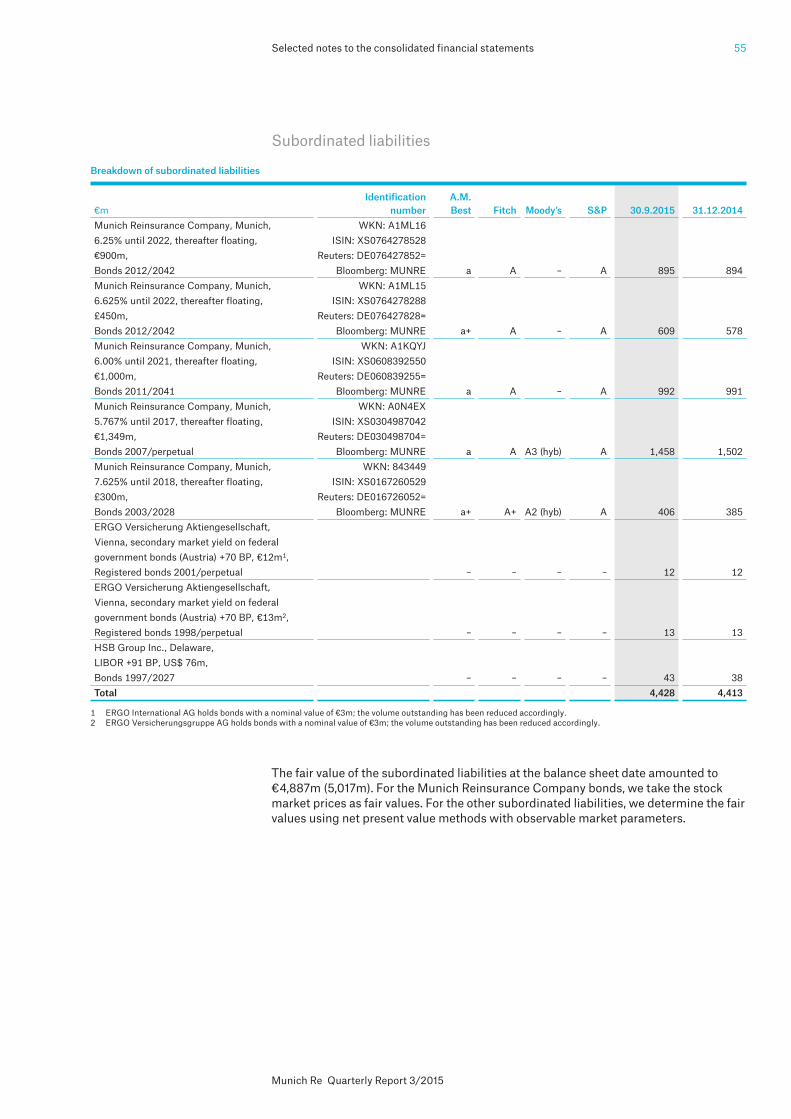
55Selected notes to the consolidated financial statements
Munich Re Quarterly Report 3/2015
Subordinated liabilities
The fair value of the subordinated liabilities at the balance sheet date amounted to €4,887m (5,017m). For the Munich Reinsurance Company bonds, we take the stock market prices as fair values. For the other subordinated liabilities, we determine the fair values using net present value methods with observable market parameters.
1 ERGO International AG holds bonds with a nominal value of €3m; the volume outstanding has been reduced accordingly.2 ERGO Versicherungsgruppe AG holds bonds with a nominal value of €3m; the volume outstanding has been reduced accordingly.
Breakdown of subordinated liabilities
Identification A.M. €m number Best Fitch Moody’s S&P 30.9.2015 31.12.2014Munich Reinsurance Company, Munich, WKN: A1ML166.25% until 2022, thereafter floating, ISIN: XS0764278528€900m, Reuters: DE076427852= Bonds 2012/2042 Bloomberg: MUNRE a A – A 895 894Munich Reinsurance Company, Munich, WKN: A1ML156.625% until 2022, thereafter floating, ISIN: XS0764278288£450m, Reuters: DE076427828= Bonds 2012/2042 Bloomberg: MUNRE a+ A – A 609 578Munich Reinsurance Company, Munich, WKN: A1KQYJ 6.00% until 2021, thereafter floating, ISIN: XS0608392550 €1,000m, Reuters: DE060839255= Bonds 2011/2041 Bloomberg: MUNRE a A – A 992 991Munich Reinsurance Company, Munich, WKN: A0N4EX 5.767% until 2017, thereafter floating, ISIN: XS0304987042 €1,349m, Reuters: DE030498704= Bonds 2007/perpetual Bloomberg: MUNRE a A A3 (hyb) A 1,458 1,502Munich Reinsurance Company, Munich, WKN: 843449 7.625% until 2018, thereafter floating, ISIN: XS0167260529 £300m, Reuters: DE016726052= Bonds 2003/2028 Bloomberg: MUNRE a+ A+ A2 (hyb) A 406 385ERGO Versicherung Aktiengesellschaft, Vienna, secondary market yield on federal government bonds (Austria) +70 BP, €12m1, Registered bonds 2001/perpetual – – – – 12 12ERGO Versicherung Aktiengesellschaft, Vienna, secondary market yield on federal government bonds (Austria) +70 BP, €13m2, Registered bonds 1998/perpetual – – – – 13 13HSB Group Inc., Delaware, LIBOR +91 BP, US$ 76m, Bonds 1997/2027 – – – – 43 38Total 4,428 4,413
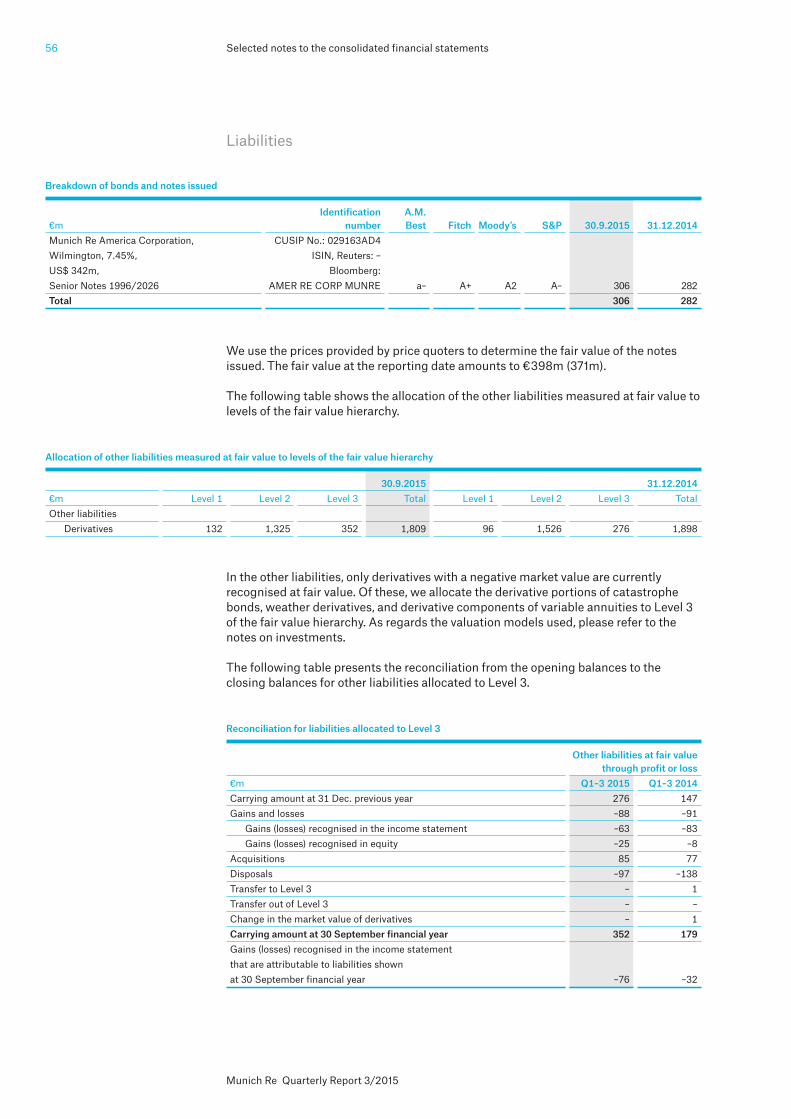
Selected notes to the consolidated financial statements56
Munich Re Quarterly Report 3/2015
Liabilities
We use the prices provided by price quoters to determine the fair value of the notes issued. The fair value at the reporting date amounts to €398m (371m).
The following table shows the allocation of the other liabilities measured at fair value to levels of the fair value hierarchy.
In the other liabilities, only derivatives with a negative market value are currently recognised at fair value. Of these, we allocate the derivative portions of catastrophe bonds, weather derivatives, and derivative components of variable annuities to Level 3 of the fair value hierarchy. As regards the valuation models used, please refer to the notes on investments.
The following table presents the reconciliation from the opening balances to the closing balances for other liabilities allocated to Level 3.
Breakdown of bonds and notes issued
Identification A.M. €m number Best Fitch Moody’s S&P 30.9.2015 31.12.2014Munich Re America Corporation, CUSIP No.: 029163AD4 Wilmington, 7.45%, ISIN, Reuters: – US$ 342m, Bloomberg: Senior Notes 1996/2026 AMER RE CORP MUNRE a– A+ A2 A– 306 282Total 306 282
Allocation of other liabilities measured at fair value to levels of the fair value hierarchy
30.9.2015 31.12.2014€m Level 1 Level 2 Level 3 Total Level 1 Level 2 Level 3 TotalOther liabilities
Derivatives 132 1,325 352 1,809 96 1,526 276 1,898
Reconciliation for liabilities allocated to Level 3
Other liabilities at fair value through profit or loss€m Q1–3 2015 Q1–3 2014Carrying amount at 31 Dec. previous year 276 147Gains and losses –88 –91
Gains (losses) recognised in the income statement –63 –83Gains (losses) recognised in equity –25 –8
Acquisitions 85 77Disposals –97 –138Transfer to Level 3 – 1Transfer out of Level 3 – –Change in the market value of derivatives – 1Carrying amount at 30 September financial year 352 179Gains (losses) recognised in the income statement that are attributable to liabilities shown at 30 September financial year –76 –32

57Selected notes to the consolidated financial statements
Munich Re Quarterly Report 3/2015
Notes to the consolidated income statement
The main items of the consolidated income statement are made up as follows:
Munich Health Total €m Q1–3 2015 Q1–3 2014 Q1–3 2015 Q1–3 2014Gross premiums written 4,260 4,043 37,986 36,833Change in unearned premiums – Gross –19 107 –671 –404Gross earned premiums 4,241 4,150 37,315 36,429 Ceded premiums written –78 –112 –1,196 –1,196Change in unearned premiums – Ceded share –36 –6 48 76Earned premiums ceded –114 –118 –1,148 –1,120 Net earned premiums 4,127 4,032 36,167 35,309
ERGO Life and Health Property-casualty Germany Germany International€m Q1–3 2015 Q1–3 2014 Q1–3 2015 Q1–3 2014 Q1–3 2015 Q1–3 2014Gross premiums written 7,025 7,314 2,529 2,510 2,936 2,811Change in unearned premiums – Gross –28 –18 –214 –183 –82 –79Gross earned premiums 6,997 7,296 2,315 2,327 2,854 2,732 Ceded premiums written –12 –9 –46 –33 –188 –173Change in unearned premiums – Ceded share –1 –8 – –4 4 7Earned premiums ceded –13 –17 –46 –37 –184 –166 Net earned premiums 6,984 7,279 2,269 2,290 2,670 2,566
Premiums
Reinsurance Life Property-casualty€m Q1–3 2015 Q1–3 2014 Q1–3 2015 Q1–3 2014Gross premiums written 7,653 7,393 13,583 12,762Change in unearned premiums – Gross 2 6 –330 –237Gross earned premiums 7,655 7,399 13,253 12,525
Ceded premiums written –170 –309 –702 –560Change in unearned premiums – Ceded share – – 81 87Earned premiums ceded –170 –309 –621 –473 Net earned premiums 7,485 7,090 12,632 12,052
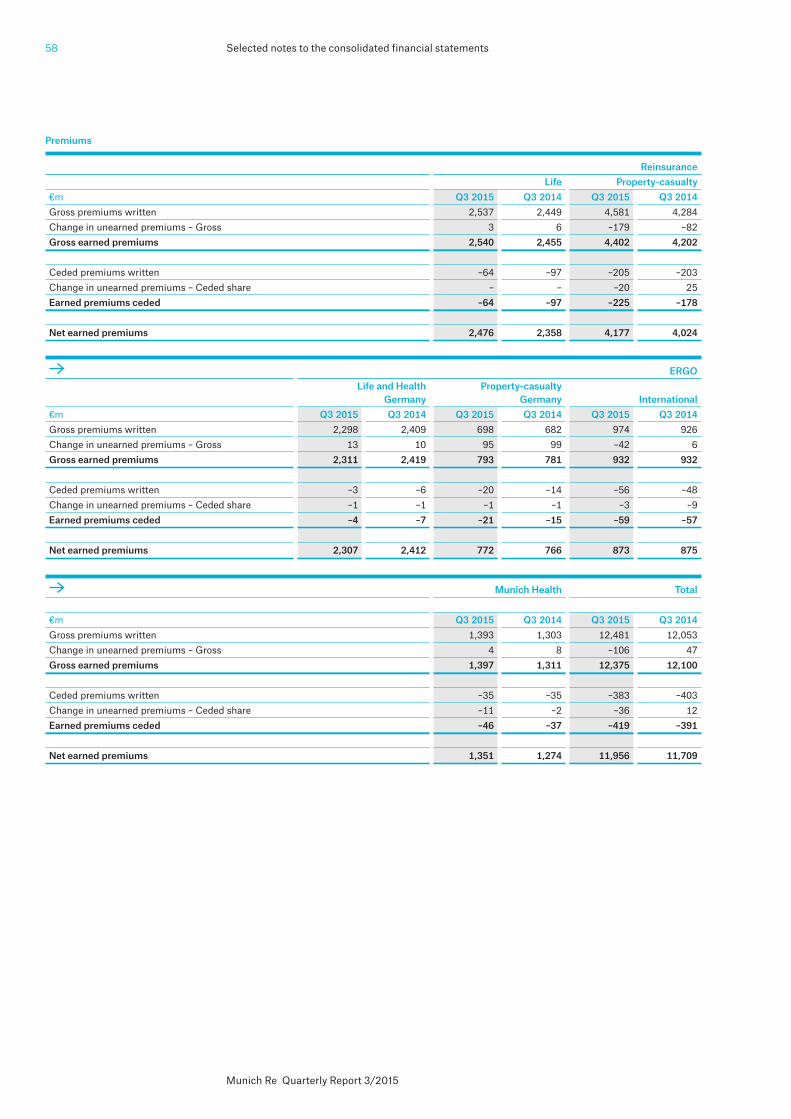
Selected notes to the consolidated financial statements58
Munich Re Quarterly Report 3/2015
Munich Health Total €m Q3 2015 Q3 2014 Q3 2015 Q3 2014Gross premiums written 1,393 1,303 12,481 12,053Change in unearned premiums – Gross 4 8 –106 47Gross earned premiums 1,397 1,311 12,375 12,100 Ceded premiums written –35 –35 –383 –403Change in unearned premiums – Ceded share –11 –2 –36 12Earned premiums ceded –46 –37 –419 –391 Net earned premiums 1,351 1,274 11,956 11,709
ERGO Life and Health Property-casualty Germany Germany International€m Q3 2015 Q3 2014 Q3 2015 Q3 2014 Q3 2015 Q3 2014Gross premiums written 2,298 2,409 698 682 974 926Change in unearned premiums – Gross 13 10 95 99 –42 6Gross earned premiums 2,311 2,419 793 781 932 932 Ceded premiums written –3 –6 –20 –14 –56 –48Change in unearned premiums – Ceded share –1 –1 –1 –1 –3 –9Earned premiums ceded –4 –7 –21 –15 –59 –57 Net earned premiums 2,307 2,412 772 766 873 875
Premiums
Reinsurance Life Property-casualty€m Q3 2015 Q3 2014 Q3 2015 Q3 2014Gross premiums written 2,537 2,449 4,581 4,284Change in unearned premiums – Gross 3 6 –179 –82Gross earned premiums 2,540 2,455 4,402 4,202
Ceded premiums written –64 –97 –205 –203Change in unearned premiums – Ceded share – – –20 25Earned premiums ceded –64 –97 –225 –178 Net earned premiums 2,476 2,358 4,177 4,024
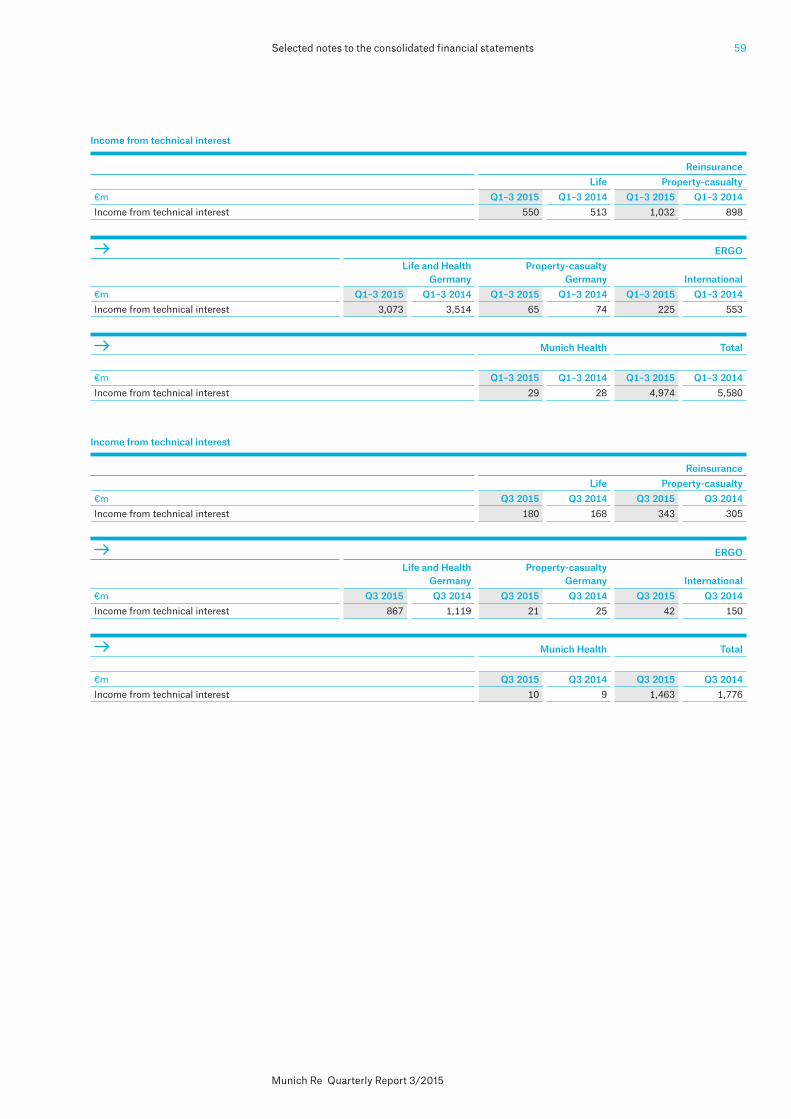
59Selected notes to the consolidated financial statements
Munich Re Quarterly Report 3/2015
Income from technical interest
Reinsurance Life Property-casualty€m Q1–3 2015 Q1–3 2014 Q1–3 2015 Q1–3 2014Income from technical interest 550 513 1,032 898
Munich Health Total
€m Q1–3 2015 Q1–3 2014 Q1–3 2015 Q1–3 2014Income from technical interest 29 28 4,974 5,580
ERGO Life and Health Property-casualty Germany Germany International€m Q1–3 2015 Q1–3 2014 Q1–3 2015 Q1–3 2014 Q1–3 2015 Q1–3 2014Income from technical interest 3,073 3,514 65 74 225 553
Income from technical interest
Reinsurance Life Property-casualty€m Q3 2015 Q3 2014 Q3 2015 Q3 2014Income from technical interest 180 168 343 305
Munich Health Total
€m Q3 2015 Q3 2014 Q3 2015 Q3 2014Income from technical interest 10 9 1,463 1,776
ERGO Life and Health Property-casualty Germany Germany International€m Q3 2015 Q3 2014 Q3 2015 Q3 2014 Q3 2015 Q3 2014Income from technical interest 867 1,119 21 25 42 150

Selected notes to the consolidated financial statements60
Munich Re Quarterly Report 3/2015
Expenses for claims and benefits
Reinsurance Life Property-casualty€m Q1–3 2015 Q1–3 2014 Q1–3 2015 Q1–3 2014Gross Claims and benefits paid –5,904 –5,493 –8,091 –7,716Changes in technical provisions
Provision for future policy benefits 129 –131 – 1Provision for outstanding claims –428 –398 –58 –70Provision for premium refunds – – –4 –3
Other technical result 4 2 2 –4Gross expenses for claims and benefits –6,199 –6,020 –8,151 –7,792
Ceded share Claims and benefits paid 195 256 334 280Changes in technical provisions
Provision for future policy benefits –25 –49 – –Provision for outstanding claims –46 –9 –46 –65Provision for premium refunds – – – –
Other technical result –6 –28 – –Expenses for claims and benefits – Ceded share 118 170 288 215
Net Claims and benefits paid –5,709 –5,237 –7,757 –7,436Changes in technical provisions
Provision for future policy benefits 104 –180 – 1Provision for outstanding claims –474 –407 –104 –135Provision for premium refunds – – –4 –3
Other technical result –2 –26 2 –4Net expenses for claims and benefits –6,081 –5,850 –7,863 –7,577

61Selected notes to the consolidated financial statements
Munich Re Quarterly Report 3/2015
Continued on next page
ERGO Life and Health Property-casualty Germany Germany International€m Q1–3 2015 Q1–3 2014 Q1–3 2015 Q1–3 2014 Q1–3 2015 Q1–3 2014Gross Claims and benefits paid –6,885 –6,924 –1,376 –1,396 –1,989 –1,715Changes in technical provisions
Provision for future policy benefits –507 –798 –1 –3 –72 –417Provision for outstanding claims –112 –4 –83 –26 –132 –71Provision for premium refunds –1,090 –1,603 –14 –15 35 –29
Other technical result –92 –123 –4 –5 20 10Gross expenses for claims and benefits –8,686 –9,452 –1,478 –1,445 –2,138 –2,222
Ceded share Claims and benefits paid 5 14 9 15 213 188Changes in technical provisions
Provision for future policy benefits – – – – –85 –59Provision for outstanding claims 7 –5 16 –30 62 –3Provision for premium refunds – – 1 –1 – –
Other technical result – – – 1 –45 –49Expenses for claims and benefits – Ceded share 12 9 26 –15 145 77
Net Claims and benefits paid –6,880 –6,910 –1,367 –1,381 –1,776 –1,527Changes in technical provisions
Provision for future policy benefits –507 –798 –1 –3 –157 –476Provision for outstanding claims –105 –9 –67 –56 –70 –74Provision for premium refunds –1,090 –1,603 –13 –16 35 –29
Other technical result –92 –123 –4 –4 –25 –39Net expenses for claims and benefits –8,674 –9,443 –1,452 –1,460 –1,993 –2,145
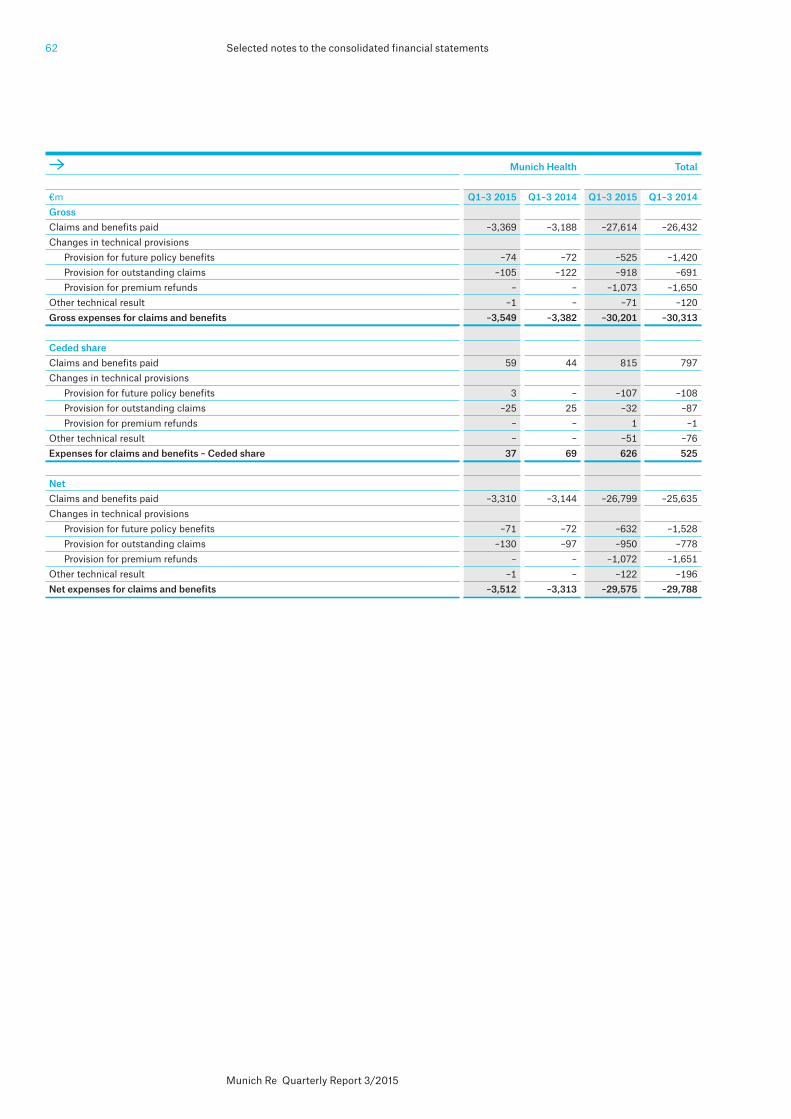
Selected notes to the consolidated financial statements62
Munich Re Quarterly Report 3/2015
Munich Health Total
€m Q1–3 2015 Q1–3 2014 Q1–3 2015 Q1–3 2014Gross Claims and benefits paid –3,369 –3,188 –27,614 –26,432Changes in technical provisions
Provision for future policy benefits –74 –72 –525 –1,420Provision for outstanding claims –105 –122 –918 –691Provision for premium refunds – – –1,073 –1,650
Other technical result –1 – –71 –120Gross expenses for claims and benefits –3,549 –3,382 –30,201 –30,313
Ceded share Claims and benefits paid 59 44 815 797Changes in technical provisions
Provision for future policy benefits 3 – –107 –108Provision for outstanding claims –25 25 –32 –87Provision for premium refunds – – 1 –1
Other technical result – – –51 –76Expenses for claims and benefits – Ceded share 37 69 626 525
Net Claims and benefits paid –3,310 –3,144 –26,799 –25,635Changes in technical provisions
Provision for future policy benefits –71 –72 –632 –1,528Provision for outstanding claims –130 –97 –950 –778Provision for premium refunds – – –1,072 –1,651
Other technical result –1 – –122 –196Net expenses for claims and benefits –3,512 –3,313 –29,575 –29,788

63Selected notes to the consolidated financial statements
Munich Re Quarterly Report 3/2015
Expenses for claims and benefits
Reinsurance Life Property-casualty€m Q3 2015 Q3 2014 Q3 2015 Q3 2014Gross Claims and benefits paid –1,998 –1,833 –2,682 –2,326Changes in technical provisions
Provision for future policy benefits 58 –39 – –Provision for outstanding claims –133 –58 1 –280Provision for premium refunds – – –1 –
Other technical result 4 2 2 –2Gross expenses for claims and benefits –2,069 –1,928 –2,680 –2,608
Ceded share Claims and benefits paid 97 49 69 100Changes in technical provisions
Provision for future policy benefits –18 –12 – –Provision for outstanding claims –39 19 –31 25Provision for premium refunds – – – –
Other technical result – –8 – –Expenses for claims and benefits – Ceded share 40 48 38 125
Net Claims and benefits paid –1,901 –1,784 –2,613 –2,226Changes in technical provisions
Provision for future policy benefits 40 –51 – –Provision for outstanding claims –172 –39 –30 –255Provision for premium refunds – – –1 –
Other technical result 4 –6 2 –2Net expenses for claims and benefits –2,029 –1,880 –2,642 –2,483
Continued on next page

Selected notes to the consolidated financial statements64
Munich Re Quarterly Report 3/2015
ERGO Life and Health Property-casualty Germany Germany International€m Q3 2015 Q3 2014 Q3 2015 Q3 2014 Q3 2015 Q3 2014Gross Claims and benefits paid –2,271 –2,364 –475 –465 –701 –550Changes in technical provisions
Provision for future policy benefits –37 –154 1 – 67 –109Provision for outstanding claims –67 –34 –40 3 –67 –40Provision for premium refunds –334 –509 –5 –4 –20 –34
Other technical result –26 –31 –1 –1 12 5Gross expenses for claims and benefits –2,735 –3,092 –520 –467 –709 –728
Ceded share Claims and benefits paid 2 3 – 7 87 58Changes in technical provisions
Provision for future policy benefits – – – – –35 –18Provision for outstanding claims 4 –1 21 –25 38 2Provision for premium refunds – – – – – –
Other technical result – – – – –15 –16Expenses for claims and benefits – Ceded share 6 2 21 –18 75 26
Net Claims and benefits paid –2,269 –2,361 –475 –458 –614 –492Changes in technical provisions
Provision for future policy benefits –37 –154 1 – 32 –127Provision for outstanding claims –63 –35 –19 –22 –29 –38Provision for premium refunds –334 –509 –5 –4 –20 –34
Other technical result –26 –31 –1 –1 –3 –11Net expenses for claims and benefits –2,729 –3,090 –499 –485 –634 –702
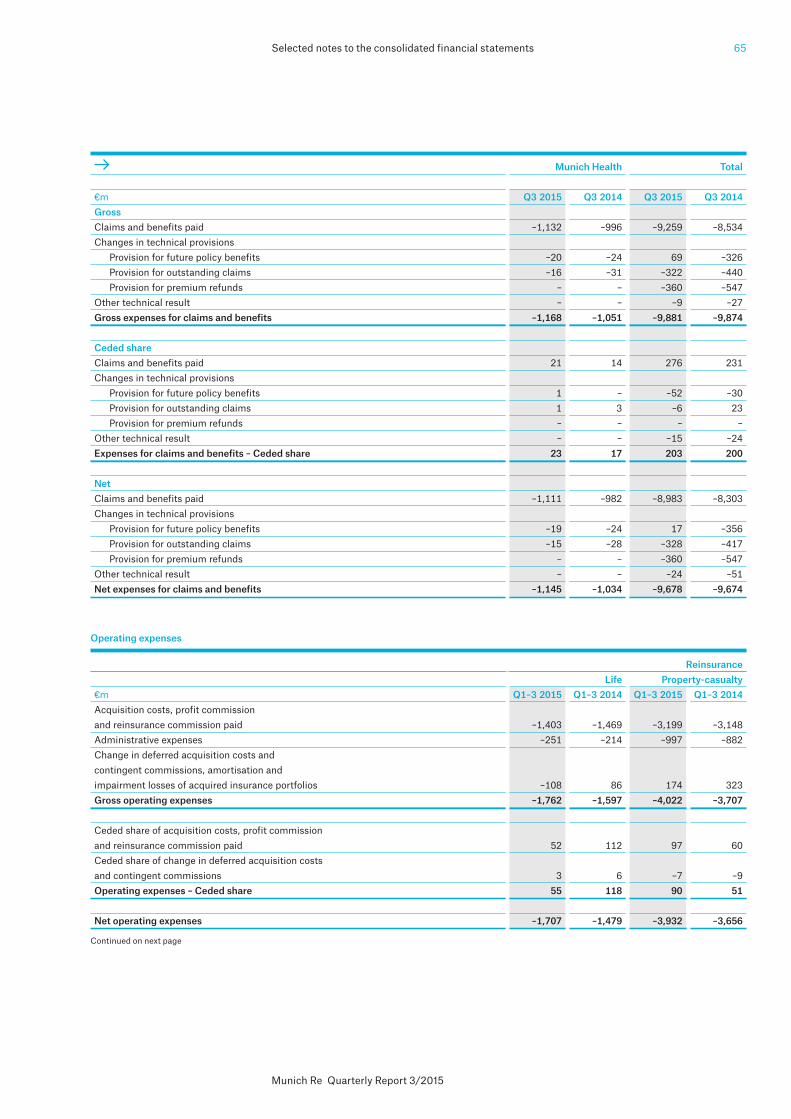
65Selected notes to the consolidated financial statements
Munich Re Quarterly Report 3/2015
Munich Health Total
€m Q3 2015 Q3 2014 Q3 2015 Q3 2014Gross Claims and benefits paid –1,132 –996 –9,259 –8,534Changes in technical provisions
Provision for future policy benefits –20 –24 69 –326Provision for outstanding claims –16 –31 –322 –440Provision for premium refunds – – –360 –547
Other technical result – – –9 –27Gross expenses for claims and benefits –1,168 –1,051 –9,881 –9,874
Ceded share Claims and benefits paid 21 14 276 231Changes in technical provisions
Provision for future policy benefits 1 – –52 –30Provision for outstanding claims 1 3 –6 23Provision for premium refunds – – – –
Other technical result – – –15 –24Expenses for claims and benefits – Ceded share 23 17 203 200
Net Claims and benefits paid –1,111 –982 –8,983 –8,303Changes in technical provisions
Provision for future policy benefits –19 –24 17 –356Provision for outstanding claims –15 –28 –328 –417Provision for premium refunds – – –360 –547
Other technical result – – –24 –51Net expenses for claims and benefits –1,145 –1,034 –9,678 –9,674
Operating expenses
Reinsurance Life Property-casualty€m Q1–3 2015 Q1–3 2014 Q1–3 2015 Q1–3 2014Acquisition costs, profit commission and reinsurance commission paid –1,403 –1,469 –3,199 –3,148Administrative expenses –251 –214 –997 –882Change in deferred acquisition costs and contingent commissions, amortisation and impairment losses of acquired insurance portfolios –108 86 174 323Gross operating expenses –1,762 –1,597 –4,022 –3,707
Ceded share of acquisition costs, profit commission and reinsurance commission paid 52 112 97 60Ceded share of change in deferred acquisition costs and contingent commissions 3 6 –7 –9Operating expenses – Ceded share 55 118 90 51 Net operating expenses –1,707 –1,479 –3,932 –3,656
Continued on next page

Selected notes to the consolidated financial statements66
Munich Re Quarterly Report 3/2015
ERGO Life and Health Property-casualty Germany Germany International€m Q1–3 2015 Q1–3 2014 Q1–3 2015 Q1–3 2014 Q1–3 2015 Q1–3 2014Acquisition costs, profit commission and reinsurance commission paid –693 –665 –400 –355 –702 –747Administrative expenses –270 –264 –372 –370 –205 –195Change in deferred acquisition costs and contingent commissions, amortisation and impairment losses of acquired insurance portfolios –120 –159 30 –6 27 57Gross operating expenses –1,083 –1,088 –742 –731 –880 –885
Ceded share of acquisition costs, profit commission and reinsurance commission paid 2 1 – –1 28 26Ceded share of change in deferred acquisition costs and contingent commissions – 1 – 1 – –2Operating expenses – Ceded share 2 2 – – 28 24 Net operating expenses –1,081 –1,086 –742 –731 –852 –861
Munich Health Total
€m Q1–3 2015 Q1–3 2014 Q1–3 2015 Q1–3 2014Acquisition costs, profit commission and reinsurance commission paid –512 –559 –6,909 –6,943Administrative expenses –84 –75 –2,179 –2,000Change in deferred acquisition costs and contingent commissions, amortisation and impairment losses of acquired insurance portfolios –59 –66 –56 235Gross operating expenses –655 –700 –9,144 –8,708
Ceded share of acquisition costs, profit commission and reinsurance commission paid 36 39 215 237Ceded share of change in deferred acquisition costs and contingent commissions 8 2 4 –1Operating expenses – Ceded share 44 41 219 236 Net operating expenses –611 –659 –8,925 –8,472
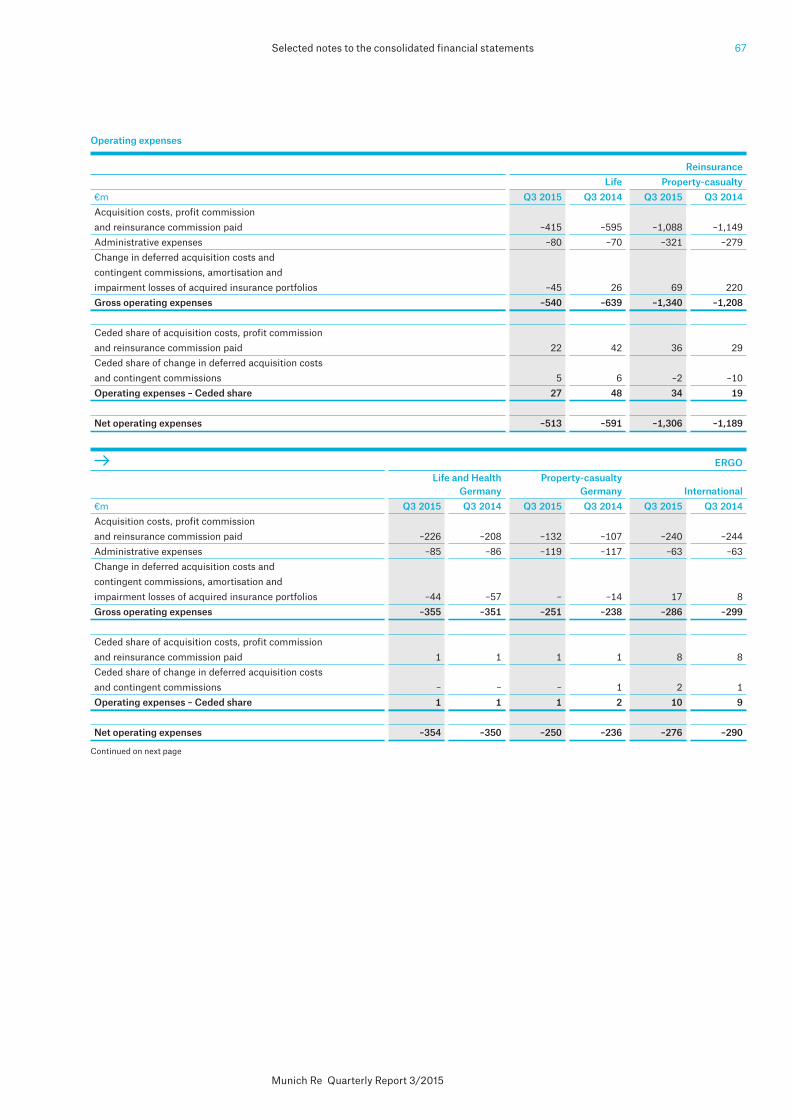
67Selected notes to the consolidated financial statements
Munich Re Quarterly Report 3/2015
ERGO Life and Health Property-casualty Germany Germany International€m Q3 2015 Q3 2014 Q3 2015 Q3 2014 Q3 2015 Q3 2014Acquisition costs, profit commission and reinsurance commission paid –226 –208 –132 –107 –240 –244Administrative expenses –85 –86 –119 –117 –63 –63Change in deferred acquisition costs and contingent commissions, amortisation and impairment losses of acquired insurance portfolios –44 –57 – –14 17 8Gross operating expenses –355 –351 –251 –238 –286 –299
Ceded share of acquisition costs, profit commission and reinsurance commission paid 1 1 1 1 8 8Ceded share of change in deferred acquisition costs and contingent commissions – – – 1 2 1Operating expenses – Ceded share 1 1 1 2 10 9 Net operating expenses –354 –350 –250 –236 –276 –290
Operating expenses
Reinsurance Life Property-casualty€m Q3 2015 Q3 2014 Q3 2015 Q3 2014Acquisition costs, profit commission and reinsurance commission paid –415 –595 –1,088 –1,149Administrative expenses –80 –70 –321 –279Change in deferred acquisition costs and contingent commissions, amortisation and impairment losses of acquired insurance portfolios –45 26 69 220Gross operating expenses –540 –639 –1,340 –1,208
Ceded share of acquisition costs, profit commission and reinsurance commission paid 22 42 36 29Ceded share of change in deferred acquisition costs and contingent commissions 5 6 –2 –10Operating expenses – Ceded share 27 48 34 19 Net operating expenses –513 –591 –1,306 –1,189
Continued on next page
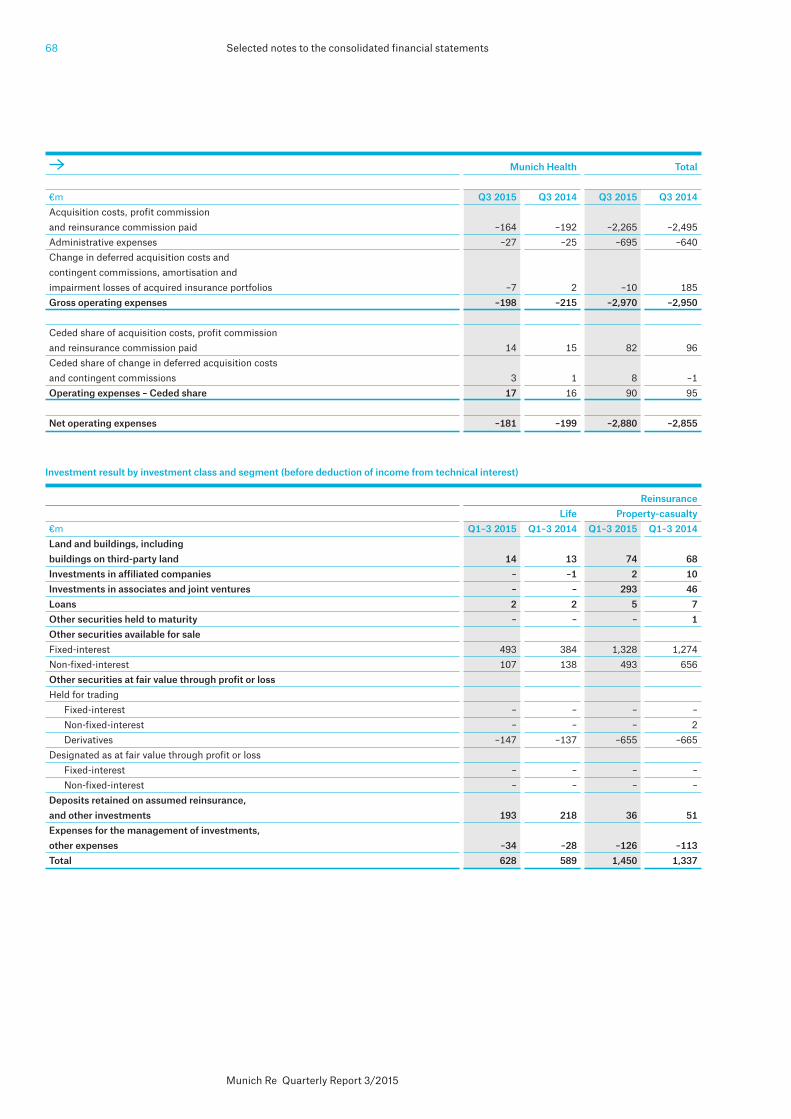
Selected notes to the consolidated financial statements68
Munich Re Quarterly Report 3/2015
Investment result by investment class and segment (before deduction of income from technical interest)
Reinsurance Life Property-casualty€m Q1–3 2015 Q1–3 2014 Q1–3 2015 Q1–3 2014Land and buildings, including buildings on third-party land 14 13 74 68Investments in affiliated companies – –1 2 10Investments in associates and joint ventures – – 293 46Loans 2 2 5 7Other securities held to maturity – – – 1Other securities available for sale Fixed-interest 493 384 1,328 1,274Non-fixed-interest 107 138 493 656Other securities at fair value through profit or loss Held for trading
Fixed-interest – – – –Non-fixed-interest – – – 2Derivatives –147 –137 –655 –665
Designated as at fair value through profit or loss Fixed-interest – – – –Non-fixed-interest – – – –
Deposits retained on assumed reinsurance, and other investments 193 218 36 51Expenses for the management of investments, other expenses –34 –28 –126 –113Total 628 589 1,450 1,337
Munich Health Total
€m Q3 2015 Q3 2014 Q3 2015 Q3 2014Acquisition costs, profit commission and reinsurance commission paid –164 –192 –2,265 –2,495Administrative expenses –27 –25 –695 –640Change in deferred acquisition costs and contingent commissions, amortisation and impairment losses of acquired insurance portfolios –7 2 –10 185Gross operating expenses –198 –215 –2,970 –2,950
Ceded share of acquisition costs, profit commission and reinsurance commission paid 14 15 82 96Ceded share of change in deferred acquisition costs and contingent commissions 3 1 8 –1Operating expenses – Ceded share 17 16 90 95 Net operating expenses –181 –199 –2,880 –2,855

69Selected notes to the consolidated financial statements
Munich Re Quarterly Report 3/2015
ERGO Life and Health Property-casualty Germany Germany International€m Q1–3 2015 Q1–3 2014 Q1–3 2015 Q1–3 2014 Q1–3 2015 Q1–3 2014Land and buildings, including buildings on third-party land 118 144 7 7 3 7Investments in affiliated companies –5 –5 – –5 1 –1Investments in associates and joint ventures 69 14 1 2 3 1Loans 1,566 1,765 16 47 11 12Other securities held to maturity – – – – – –Other securities available for sale Fixed-interest 1,460 1,134 89 97 367 348Non-fixed-interest 157 193 91 81 40 60Other securities at fair value through profit or loss Held for trading
Fixed-interest – – – – – 1Non-fixed-interest – – – – – 1Derivatives –62 277 –23 –39 –15 47
Designated as at fair value through profit or loss Fixed-interest – – – – –9 35Non-fixed-interest – – – – – –
Deposits retained on assumed reinsurance, and other investments –1 5 1 2 9 8Expenses for the management of investments, other expenses –161 –161 –11 –10 –20 –21Total 3,141 3,366 171 182 390 498
Munich Health Total
€m Q1–3 2015 Q1–3 2014 Q1–3 2015 Q1–3 2014Land and buildings, including buildings on third-party land – – 216 239Investments in affiliated companies 10 – 8 –2Investments in associates and joint ventures 9 –10 375 53Loans 1 1 1,601 1,834Other securities held to maturity – – – 1Other securities available for sale Fixed-interest 75 71 3,812 3,308Non-fixed-interest – – 888 1,128Other securities at fair value through profit or loss Held for trading
Fixed-interest – – – 1Non-fixed-interest – – – 3Derivatives – –1 –902 –518
Designated as at fair value through profit or loss Fixed-interest – – –9 35Non-fixed-interest – – – –
Deposits retained on assumed reinsurance, and other investments – 2 238 286Expenses for the management of investments, other expenses –3 –5 –355 –338Total 92 58 5,872 6,030
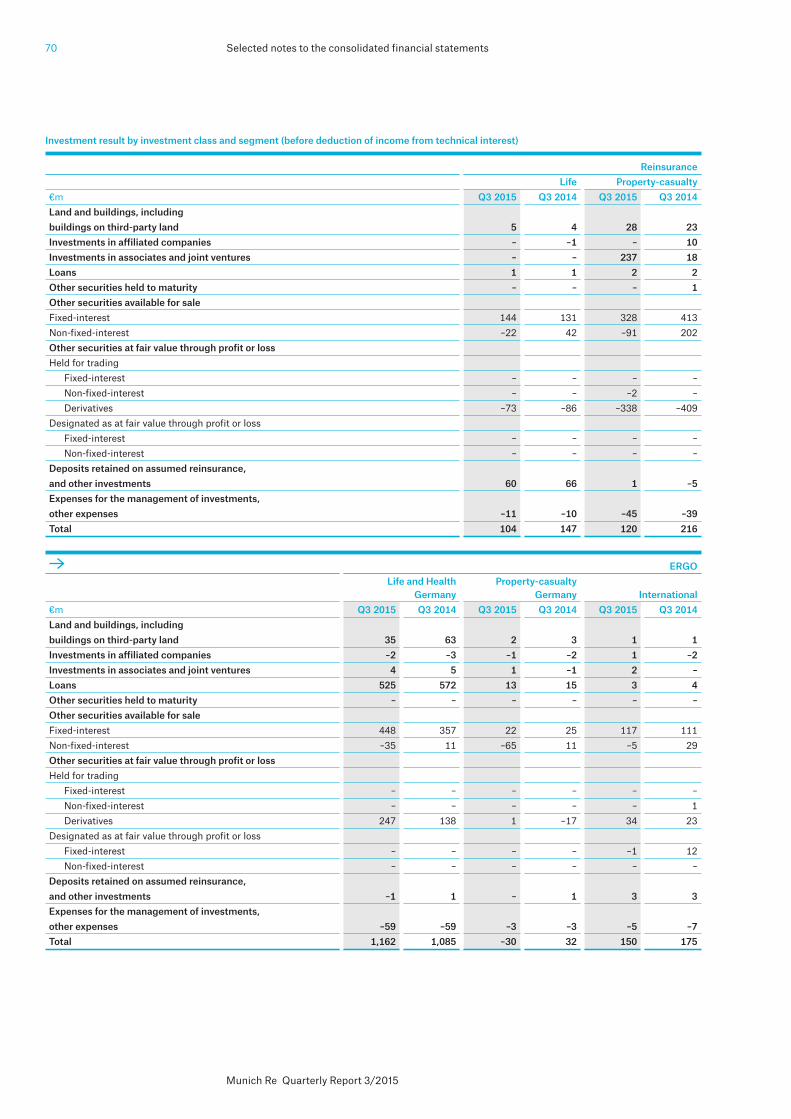
Selected notes to the consolidated financial statements70
Munich Re Quarterly Report 3/2015
Investment result by investment class and segment (before deduction of income from technical interest)
Reinsurance Life Property-casualty€m Q3 2015 Q3 2014 Q3 2015 Q3 2014Land and buildings, including buildings on third-party land 5 4 28 23Investments in affiliated companies – –1 – 10Investments in associates and joint ventures – – 237 18Loans 1 1 2 2Other securities held to maturity – – – 1Other securities available for sale Fixed-interest 144 131 328 413Non-fixed-interest –22 42 –91 202Other securities at fair value through profit or loss Held for trading
Fixed-interest – – – –Non-fixed-interest – – –2 –Derivatives –73 –86 –338 –409
Designated as at fair value through profit or loss Fixed-interest – – – –Non-fixed-interest – – – –
Deposits retained on assumed reinsurance, and other investments 60 66 1 –5Expenses for the management of investments, other expenses –11 –10 –45 –39Total 104 147 120 216
ERGO Life and Health Property-casualty Germany Germany International€m Q3 2015 Q3 2014 Q3 2015 Q3 2014 Q3 2015 Q3 2014Land and buildings, including buildings on third-party land 35 63 2 3 1 1Investments in affiliated companies –2 –3 –1 –2 1 –2Investments in associates and joint ventures 4 5 1 –1 2 –Loans 525 572 13 15 3 4Other securities held to maturity – – – – – –Other securities available for sale Fixed-interest 448 357 22 25 117 111Non-fixed-interest –35 11 –65 11 –5 29Other securities at fair value through profit or loss Held for trading
Fixed-interest – – – – – –Non-fixed-interest – – – – – 1Derivatives 247 138 1 –17 34 23
Designated as at fair value through profit or loss Fixed-interest – – – – –1 12Non-fixed-interest – – – – – –
Deposits retained on assumed reinsurance, and other investments –1 1 – 1 3 3Expenses for the management of investments, other expenses –59 –59 –3 –3 –5 –7Total 1,162 1,085 –30 32 150 175

71Selected notes to the consolidated financial statements
Munich Re Quarterly Report 3/2015
Munich Health Total
€m Q3 2015 Q3 2014 Q3 2015 Q3 2014Land and buildings, including buildings on third-party land – – 71 94Investments in affiliated companies – – –2 2Investments in associates and joint ventures 4 –5 248 17Loans – – 544 594Other securities held to maturity – – – 1Other securities available for sale Fixed-interest 22 22 1,081 1,059Non-fixed-interest – – –218 295Other securities at fair value through profit or loss Held for trading
Fixed-interest – – – –Non-fixed-interest – – –2 1Derivatives – –1 –129 –352
Designated as at fair value through profit or loss Fixed-interest – – –1 12Non-fixed-interest – – – –
Deposits retained on assumed reinsurance, and other investments – 1 63 67Expenses for the management of investments, other expenses –1 –2 –124 –120Total 25 15 1,531 1,670
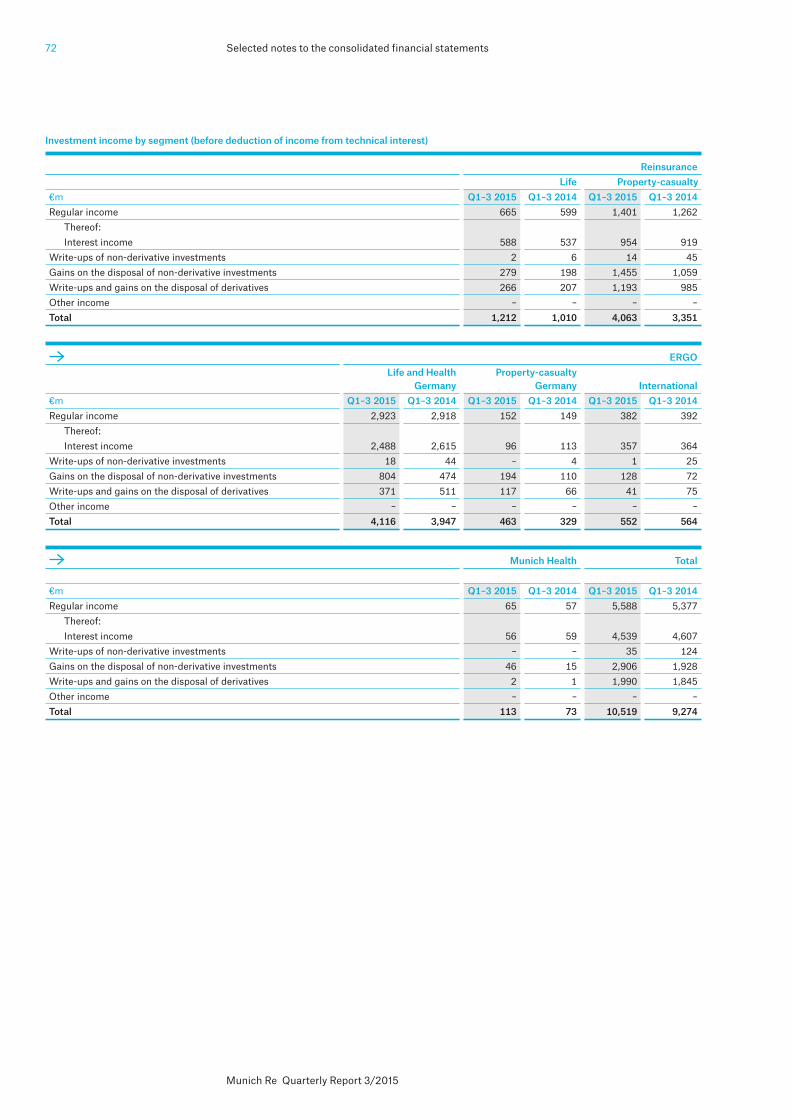
Selected notes to the consolidated financial statements72
Munich Re Quarterly Report 3/2015
Investment income by segment (before deduction of income from technical interest)
Reinsurance Life Property-casualty€m Q1–3 2015 Q1–3 2014 Q1–3 2015 Q1–3 2014Regular income 665 599 1,401 1,262
Thereof: Interest income 588 537 954 919
Write-ups of non-derivative investments 2 6 14 45Gains on the disposal of non-derivative investments 279 198 1,455 1,059Write-ups and gains on the disposal of derivatives 266 207 1,193 985Other income – – – –Total 1,212 1,010 4,063 3,351
Munich Health Total
€m Q1–3 2015 Q1–3 2014 Q1–3 2015 Q1–3 2014Regular income 65 57 5,588 5,377
Thereof: Interest income 56 59 4,539 4,607
Write-ups of non-derivative investments – – 35 124Gains on the disposal of non-derivative investments 46 15 2,906 1,928Write-ups and gains on the disposal of derivatives 2 1 1,990 1,845Other income – – – –Total 113 73 10,519 9,274
ERGO Life and Health Property-casualty Germany Germany International€m Q1–3 2015 Q1–3 2014 Q1–3 2015 Q1–3 2014 Q1–3 2015 Q1–3 2014Regular income 2,923 2,918 152 149 382 392
Thereof: Interest income 2,488 2,615 96 113 357 364
Write-ups of non-derivative investments 18 44 – 4 1 25Gains on the disposal of non-derivative investments 804 474 194 110 128 72Write-ups and gains on the disposal of derivatives 371 511 117 66 41 75Other income – – – – – –Total 4,116 3,947 463 329 552 564
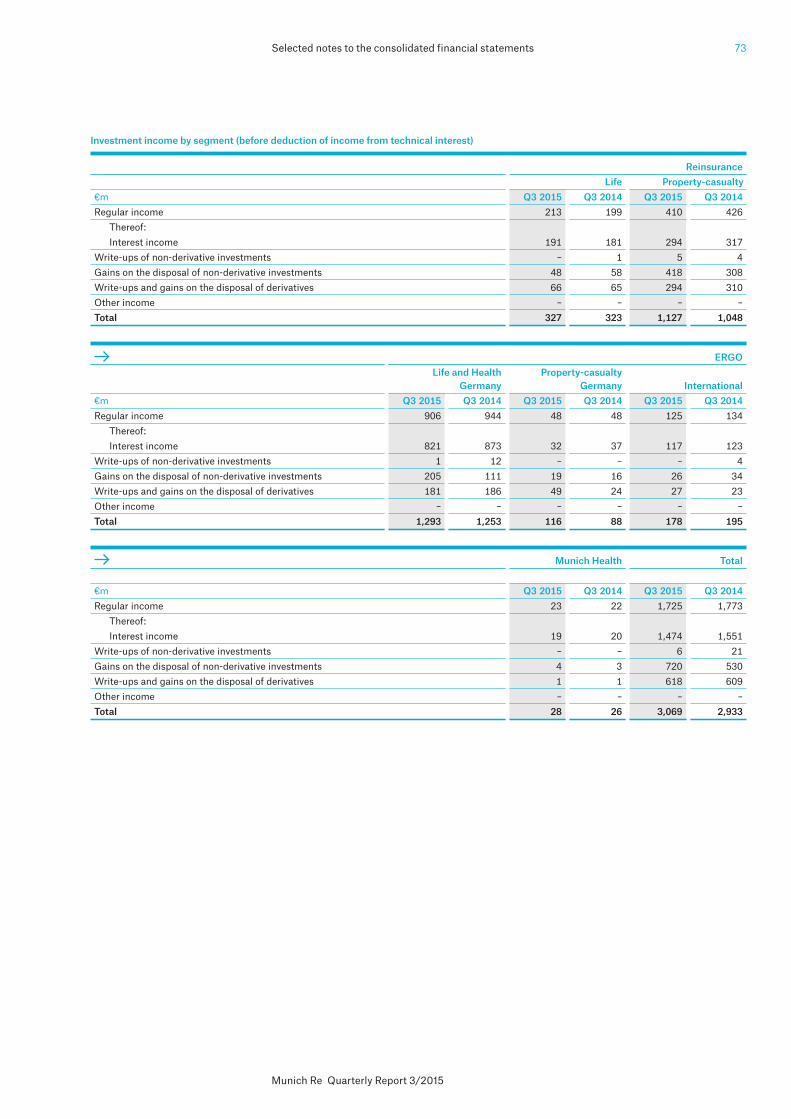
73Selected notes to the consolidated financial statements
Munich Re Quarterly Report 3/2015
Investment income by segment (before deduction of income from technical interest)
Reinsurance Life Property-casualty€m Q3 2015 Q3 2014 Q3 2015 Q3 2014Regular income 213 199 410 426
Thereof: Interest income 191 181 294 317
Write-ups of non-derivative investments – 1 5 4Gains on the disposal of non-derivative investments 48 58 418 308Write-ups and gains on the disposal of derivatives 66 65 294 310Other income – – – –Total 327 323 1,127 1,048
Munich Health Total
€m Q3 2015 Q3 2014 Q3 2015 Q3 2014Regular income 23 22 1,725 1,773
Thereof: Interest income 19 20 1,474 1,551
Write-ups of non-derivative investments – – 6 21Gains on the disposal of non-derivative investments 4 3 720 530Write-ups and gains on the disposal of derivatives 1 1 618 609Other income – – – –Total 28 26 3,069 2,933
ERGO Life and Health Property-casualty Germany Germany International€m Q3 2015 Q3 2014 Q3 2015 Q3 2014 Q3 2015 Q3 2014Regular income 906 944 48 48 125 134
Thereof: Interest income 821 873 32 37 117 123
Write-ups of non-derivative investments 1 12 – – – 4Gains on the disposal of non-derivative investments 205 111 19 16 26 34Write-ups and gains on the disposal of derivatives 181 186 49 24 27 23Other income – – – – – –Total 1,293 1,253 116 88 178 195
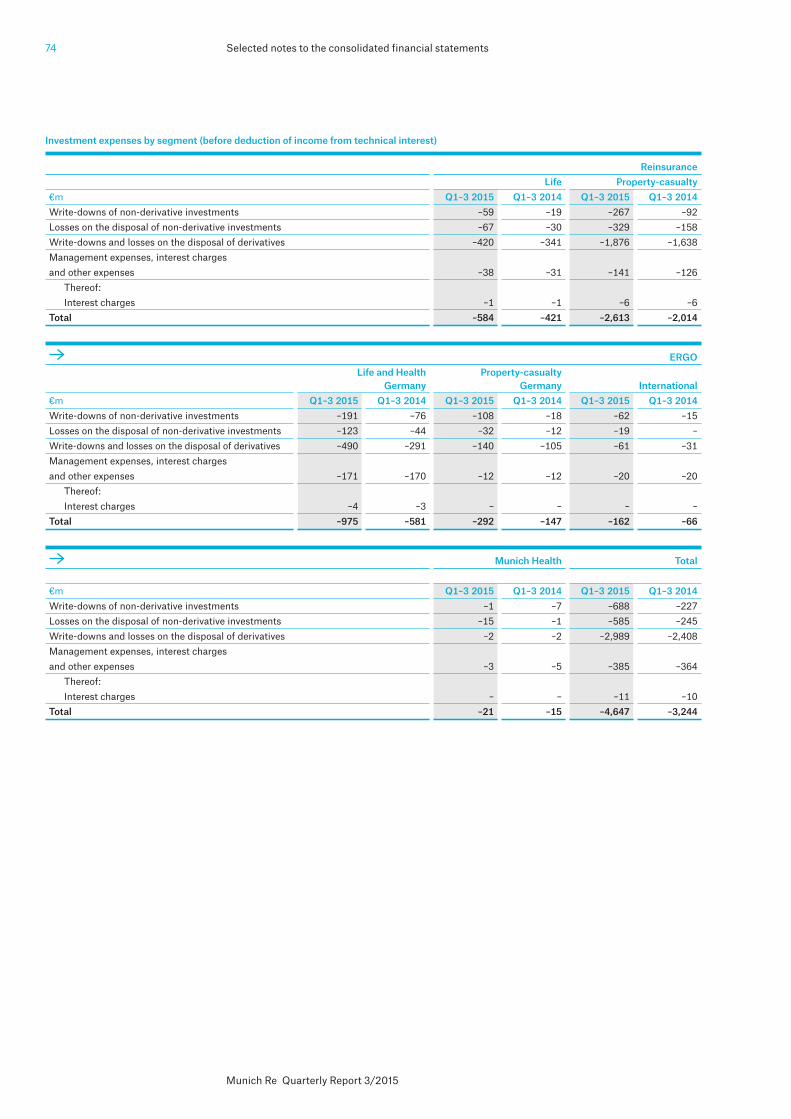
Selected notes to the consolidated financial statements74
Munich Re Quarterly Report 3/2015
Munich Health Total
€m Q1–3 2015 Q1–3 2014 Q1–3 2015 Q1–3 2014Write-downs of non-derivative investments –1 –7 –688 –227Losses on the disposal of non-derivative investments –15 –1 –585 –245Write-downs and losses on the disposal of derivatives –2 –2 –2,989 –2,408Management expenses, interest charges and other expenses –3 –5 –385 –364
Thereof: Interest charges – – –11 –10
Total –21 –15 –4,647 –3,244
Investment expenses by segment (before deduction of income from technical interest)
Reinsurance Life Property-casualty€m Q1–3 2015 Q1–3 2014 Q1–3 2015 Q1–3 2014Write-downs of non-derivative investments –59 –19 –267 –92Losses on the disposal of non-derivative investments –67 –30 –329 –158Write-downs and losses on the disposal of derivatives –420 –341 –1,876 –1,638Management expenses, interest charges and other expenses –38 –31 –141 –126
Thereof: Interest charges –1 –1 –6 –6
Total –584 –421 –2,613 –2,014
ERGO Life and Health Property-casualty Germany Germany International€m Q1–3 2015 Q1–3 2014 Q1–3 2015 Q1–3 2014 Q1–3 2015 Q1–3 2014Write-downs of non-derivative investments –191 –76 –108 –18 –62 –15Losses on the disposal of non-derivative investments –123 –44 –32 –12 –19 –Write-downs and losses on the disposal of derivatives –490 –291 –140 –105 –61 –31Management expenses, interest charges and other expenses –171 –170 –12 –12 –20 –20
Thereof: Interest charges –4 –3 – – – –
Total –975 –581 –292 –147 –162 –66
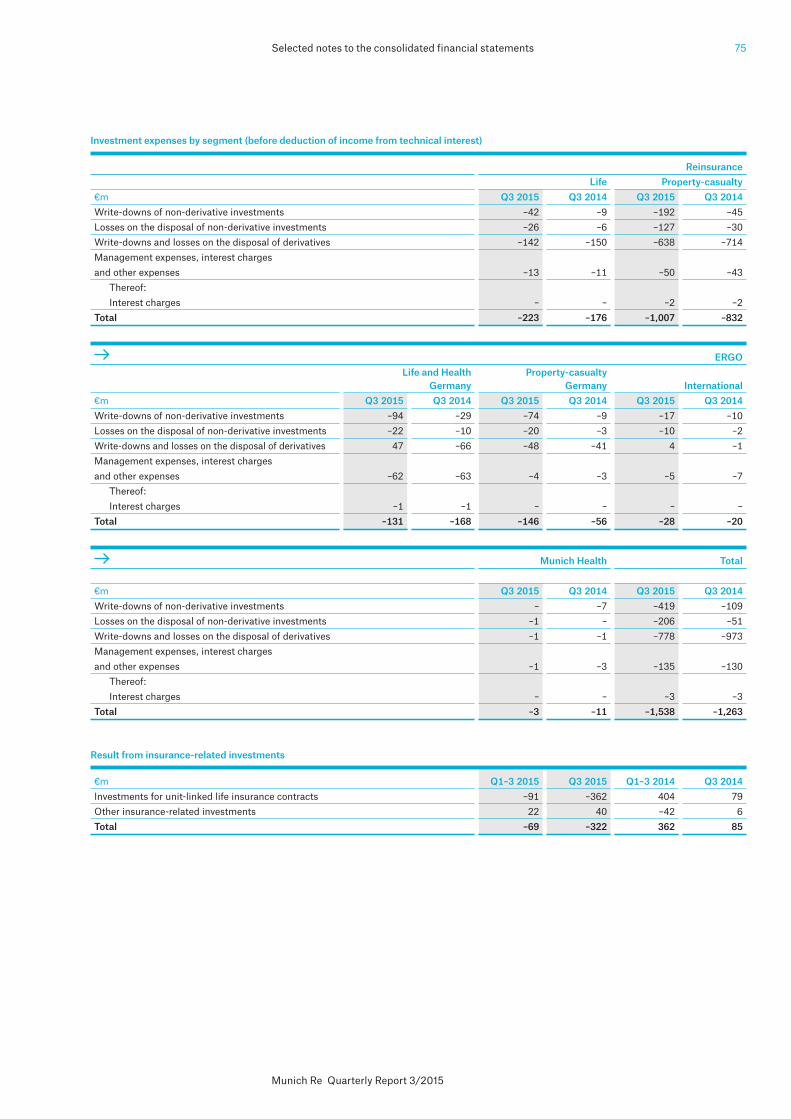
75Selected notes to the consolidated financial statements
Munich Re Quarterly Report 3/2015
Munich Health Total
€m Q3 2015 Q3 2014 Q3 2015 Q3 2014Write-downs of non-derivative investments – –7 –419 –109Losses on the disposal of non-derivative investments –1 – –206 –51Write-downs and losses on the disposal of derivatives –1 –1 –778 –973Management expenses, interest charges and other expenses –1 –3 –135 –130
Thereof: Interest charges – – –3 –3
Total –3 –11 –1,538 –1,263
Investment expenses by segment (before deduction of income from technical interest)
Reinsurance Life Property-casualty€m Q3 2015 Q3 2014 Q3 2015 Q3 2014Write-downs of non-derivative investments –42 –9 –192 –45Losses on the disposal of non-derivative investments –26 –6 –127 –30Write-downs and losses on the disposal of derivatives –142 –150 –638 –714Management expenses, interest charges and other expenses –13 –11 –50 –43
Thereof: Interest charges – – –2 –2
Total –223 –176 –1,007 –832
ERGO Life and Health Property-casualty Germany Germany International€m Q3 2015 Q3 2014 Q3 2015 Q3 2014 Q3 2015 Q3 2014Write-downs of non-derivative investments –94 –29 –74 –9 –17 –10Losses on the disposal of non-derivative investments –22 –10 –20 –3 –10 –2Write-downs and losses on the disposal of derivatives 47 –66 –48 –41 4 –1Management expenses, interest charges and other expenses –62 –63 –4 –3 –5 –7
Thereof: Interest charges –1 –1 – – – –
Total –131 –168 –146 –56 –28 –20
Result from insurance-related investments
€m Q1–3 2015 Q3 2015 Q1–3 2014 Q3 2014Investments for unit-linked life insurance contracts –91 –362 404 79Other insurance-related investments 22 40 –42 6Total –69 –322 362 85
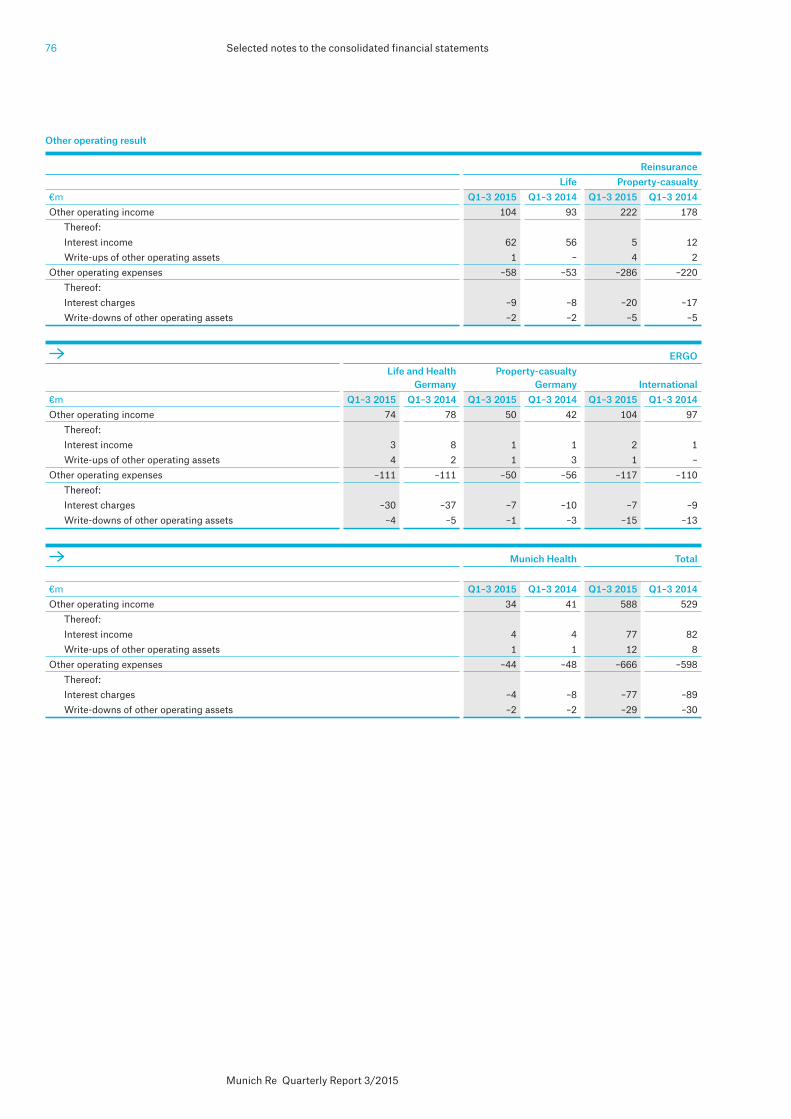
Selected notes to the consolidated financial statements76
Munich Re Quarterly Report 3/2015
Other operating result
Reinsurance Life Property-casualty€m Q1–3 2015 Q1–3 2014 Q1–3 2015 Q1–3 2014Other operating income 104 93 222 178
Thereof: Interest income 62 56 5 12 Write-ups of other operating assets 1 – 4 2
Other operating expenses –58 –53 –286 –220Thereof: Interest charges –9 –8 –20 –17Write-downs of other operating assets –2 –2 –5 –5
Munich Health Total €m Q1–3 2015 Q1–3 2014 Q1–3 2015 Q1–3 2014Other operating income 34 41 588 529
Thereof: Interest income 4 4 77 82Write-ups of other operating assets 1 1 12 8
Other operating expenses –44 –48 –666 –598Thereof: Interest charges –4 –8 –77 –89Write-downs of other operating assets –2 –2 –29 –30
ERGO Life and Health Property-casualty Germany Germany International€m Q1–3 2015 Q1–3 2014 Q1–3 2015 Q1–3 2014 Q1–3 2015 Q1–3 2014Other operating income 74 78 50 42 104 97
Thereof: Interest income 3 8 1 1 2 1 Write-ups of other operating assets 4 2 1 3 1 –
Other operating expenses –111 –111 –50 –56 –117 –110Thereof: Interest charges –30 –37 –7 –10 –7 –9Write-downs of other operating assets –4 –5 –1 –3 –15 –13

77Selected notes to the consolidated financial statements
Munich Re Quarterly Report 3/2015
Other operating income mainly comprises income of €392m (346m) from services rendered, interest and similar income of €77m (83m), income of €45m (44m) from the release/reduction of miscellaneous provisions and provisions for bad and doubtful debts, and income of €24m (23m) from owner-occupied property, some of which is also leased out.
In addition to expenses of €302m (254m) for services rendered, other operating expenses chiefly include interest charges and similar expenses of €77m (89m), other write-downs of €23m (24m), and other tax of €87m (73m). They also contain expenses of €9m (12m) for owner-occupied property, some of which is also leased out.
Other operating result
Reinsurance Life Property-casualty€m Q3 2015 Q3 2014 Q3 2015 Q3 2014Other operating income 35 31 68 60
Thereof: Interest income 23 19 1 5 Write-ups of other operating assets 1 – 1 –
Other operating expenses –18 –18 –90 –80Thereof: Interest charges –3 –3 –6 –6Write-downs of other operating assets –1 –1 –2 –2
Munich Health Total €m Q3 2015 Q3 2014 Q3 2015 Q3 2014Other operating income 9 14 200 170
Thereof: Interest income 1 1 26 28Write-ups of other operating assets – – 4 –
Other operating expenses –17 –19 –228 –197Thereof: Interest charges –1 –3 –25 –30Write-downs of other operating assets –1 –1 –10 –11
ERGO Life and Health Property-casualty Germany Germany International€m Q3 2015 Q3 2014 Q3 2015 Q3 2014 Q3 2015 Q3 2014Other operating income 26 20 22 10 40 35
Thereof: Interest income 1 3 – – – – Write-ups of other operating assets 1 – – – 1 –
Other operating expenses –34 –32 –24 –13 –45 –35Thereof: Interest charges –11 –12 –2 –3 –2 –3Write-downs of other operating assets –1 –1 – – –5 –6

Selected notes to the consolidated financial statements78
Munich Re Quarterly Report 3/2015
ERGO Life and Health Property-casualty Germany Germany International€m Q1–3 2015 Q1–3 2014 Q1–3 2015 Q1–3 2014 Q1–3 2015 Q1–3 2014Other non-operating income 854 385 277 155 29 79Other non-operating expenses –967 –493 –320 –199 –58 –106Impairment losses of goodwill – – – – – –Net finance costs –22 –21 –11 –12 –21 –21
Other non-operating result, impairment losses of goodwill and net finance costs
Reinsurance Life Property-casualty€m Q1–3 2015 Q1–3 2014 Q1–3 2015 Q1–3 2014Other non-operating income 600 370 1,704 813Other non-operating expenses –680 –426 –1,962 –1,041Impairment losses of goodwill – – – –Net finance costs –29 –27 –94 –88
Munich Health Total
€m Q1–3 2015 Q1–3 2014 Q1–3 2015 Q1–3 2014Other non-operating income 19 12 3,483 1,814Other non-operating expenses –19 –16 –4,006 –2,281Impairment losses of goodwill – – – –Net finance costs –1 –1 –178 –170
ERGO Life and Health Property-casualty Germany Germany International€m Q3 2015 Q3 2014 Q3 2015 Q3 2014 Q3 2015 Q3 2014Other non-operating income 237 179 62 77 13 17Other non-operating expenses –266 –218 –81 –88 –15 –20Impairment losses of goodwill – – – – – –Net finance costs –7 –7 –4 –4 –7 –7
Other non-operating result, impairment losses of goodwill and net finance costs
Reinsurance Life Property-casualty€m Q3 2015 Q3 2014 Q3 2015 Q3 2014Other non-operating income 107 120 265 260Other non-operating expenses –113 –122 –306 –330Impairment losses of goodwill – – – –Net finance costs –9 –9 –31 –29
Munich Health Total
€m Q3 2015 Q3 2014 Q3 2015 Q3 2014Other non-operating income 4 3 688 656Other non-operating expenses –4 –5 –785 –783Impairment losses of goodwill – – – –Net finance costs – – –58 –56

79Selected notes to the consolidated financial statements
Munich Re Quarterly Report 3/2015
The other non-operating income and expenses are unrelated to the conclusion, administration or settlement of insurance contracts or the administration of investments.
Besides foreign-currency exchange gains of €3,414m (1,720m), the other non-operating income mainly comprises other non-technical income of €67m (89m).
The other non-operating expenses comprise foreign-currency exchange losses of €3,727m (2,013m), write-downs of €49m (49m) on other intangible assets, and other non-technical expenses of €230m (219m), such as other amounts that cannot be allocated elsewhere and restructuring expenses.
Non-current assets and disposal groups held for sale and sold in the reporting periodIn the first quarter of 2015, Munich Health Holding AG, Munich, sold its shares in the fully consolidated company DKV Luxembourg S.A., Luxembourg. The sales price was in the low double-digit million euro range. The sale had an impact of around €3m on our consolidated result.
In the fourth quarter of 2014, MEAG MUNICH ERGO AssetManagement GmbH sold its shares in its associate PICC Asset Management Company Limited, Shanghai, with economic effect in June 2015. We posted a moderately positive result overall from the disposal of this share, which we accounted for using the equity method.
Related parties
Transactions between Munich Reinsurance Company and subsidiaries that are to be deemed related parties have been eliminated in consolidation and are not disclosed in the notes. Business relations with unconsolidated subsidiaries are of subordinate importance as a whole; this also applies to business relations with associates and joint ventures. Munich Reinsurance Company has established a contractual trust agreement in the form of a two-way trust for its unfunded company pension obligations. The Munich Re pension scheme is considered a related party in accordance with IAS 24. Contributions to the pension scheme are recognised as expenses for defined contribution plans.
No significant transactions were conducted between Board members and Munich Re.
Number of staff
The number of staff employed by the Group as at 30 September 2015 totalled 21,658 (21,899) in Germany and 21,420 (21,417) in other countries.
Number of staff
30.9.2015 31.12.2014Reinsurance 12,029 11,749ERGO 28,531 28,560Munich Health 2,518 3,007Total 43,078 43,316
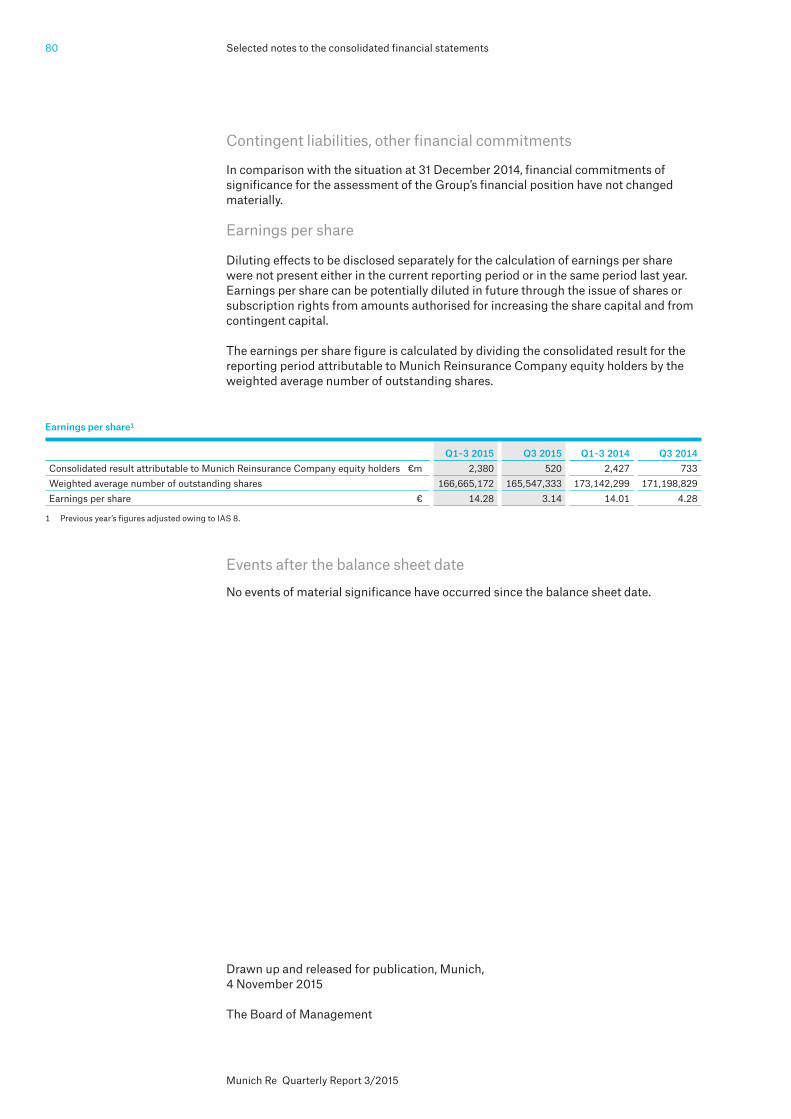
Selected notes to the consolidated financial statements80
Munich Re Quarterly Report 3/2015
Contingent liabilities, other financial commitments
In comparison with the situation at 31 December 2014, financial commitments of significance for the assessment of the Group’s financial position have not changed materially.
Earnings per share
Diluting effects to be disclosed separately for the calculation of earnings per share were not present either in the current reporting period or in the same period last year. Earnings per share can be potentially diluted in future through the issue of shares or subscription rights from amounts authorised for increasing the share capital and from contingent capital.
The earnings per share figure is calculated by dividing the consolidated result for the reporting period attributable to Munich Reinsurance Company equity holders by the weighted average number of outstanding shares.
Events after the balance sheet date
No events of material significance have occurred since the balance sheet date.
Drawn up and released for publication, Munich, 4 November 2015
The Board of Management
1 Previous year’s figures adjusted owing to IAS 8.
Earnings per share1
Q1–3 2015 Q3 2015 Q1–3 2014 Q3 2014Consolidated result attributable to Munich Reinsurance Company equity holders €m 2,380 520 2,427 733Weighted average number of outstanding shares 166,665,172 165,547,333 173,142,299 171,198,829Earnings per share € 14.28 3.14 14.01 4.28
QB_568

© November 2015Münchener Rückversicherungs-GesellschaftKöniginstrasse 107 80802 MünchenGermanywww.munichre.com
www.twitter.com/munichrewww.munichre.com/facebook
Münchener Rückversicherungs-Gesellschaft (Munich Reinsurance Company) is a reinsurance company organised under the laws of Germany. In some countries, including in the United States, Munich Reinsurance Company holds the status of an unauthorised reinsurer. Policies are underwritten by Munich Reinsurance Company or its affiliated insurance and reinsurance subsidiaries. Certain coverages are not available in all jurisdictions. Any description in this document is for general information purposes only and does not constitute an offer to sell or a solicitation of an offer to buy any product.
Responsible for contentFinancial and Regulatory Reporting
Editorial deadline: 3 November 2015Publication date: 5 November 2015
Printed by Kastner & CallweyJahnstrasse 585661 ForstinningGermany
The official German original of this report is also available from the Company. In addition, you can find our annual and interim reports, along with further information about Munich Re and its shares, on the internet at www.munichre.com.
Service for private investorsAlexander RapplTel.: +49 89 38 91-22 55Fax: +49 89 38 91-45 [email protected]
Service for investors and analystsChristian Becker-HussongTel.: +49 89 38 91-39 10Fax: +49 89 38 91-98 [email protected]
Service for mediaJohanna WeberTel.: +49 89 38 91-26 95Fax: +49 89 38 91-35 [email protected]
Quarterly Report 3/2015
Munich Re
© 2015Münchener Rückversicherungs-GesellschaftKöniginstrasse 107, 80802 München, Germany
Order number 302-08584
Important dates 2016
16 March 2016 Balance sheet press conference for 2015 consolidated fi nancial statements
27 April 2016Annual General Meeting
10 May 2016Interim report as at 31 March 2016
9 August 2016Interim report as at 30 June 2016
9 August 2016Half-year press conference
9 November 2016 Interim report as at 30 September 2016