Embed Size (px)
Citation preview

1
May 29, 2013
Quantitative Strategy
Joseph J. Mezrich
1-212-310-4241
Instinet, LLC
1095 Avenue of the Americas
New York, N.Y. 10036

2
The opportunity for quants in a
world of diminished alpha
Tulip Mania to Twitter Media
3
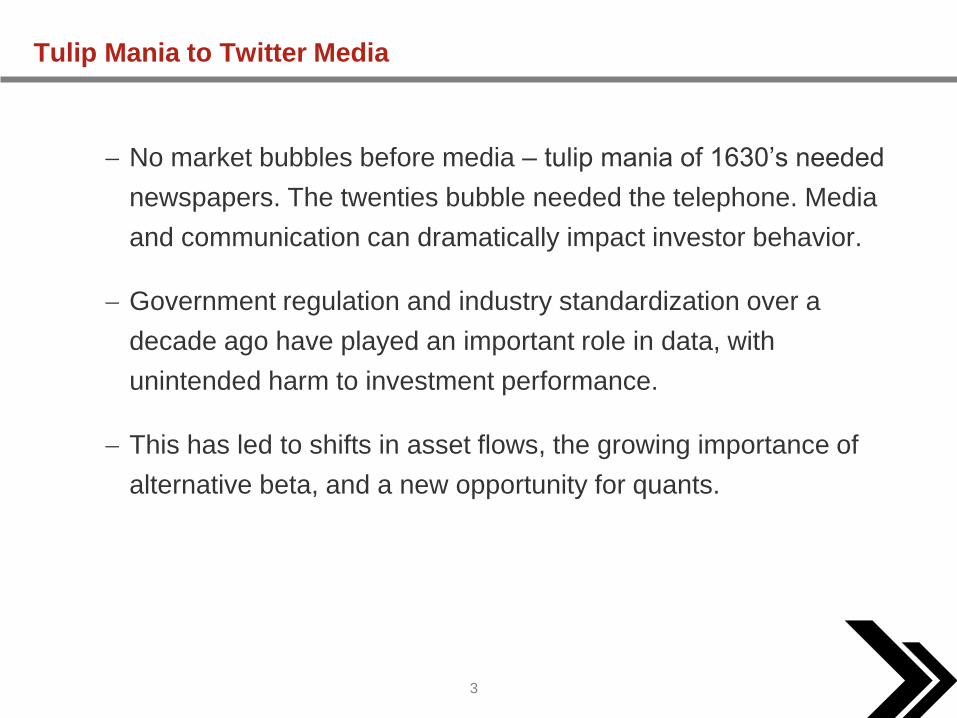
Tulip Mania to Twitter Media
No market bubbles before media – tulip mania of 1630’s needed
newspapers. The twenties bubble needed the telephone. Media
and communication can dramatically impact investor behavior.
Government regulation and industry standardization over a
decade ago have played an important role in data, with
unintended harm to investment performance.
This has led to shifts in asset flows, the growing importance of
alternative beta, and a new opportunity for quants.
4
-900
-800
-700
-600
-500
-400
-300
-200
-100
0
100
200
300
400
500
Ap
r-0
3
Oct
-03
Ap
r-0
4
Oct
-04
Ap
r-0
5
Oct
-05
Ap
r-0
6
Oct
-06
Ap
r-0
7
Oct
-07
Ap
r-0
8
Oct
-08
Ap
r-0
9
Oct
-09
Ap
r-1
0
Oct
-10
Ap
r-1
1
Oct
-11
Ap
r-1
2
Oct
-12
Cu
mu
lati
ve f
un
d f
low
(b
illio
n $
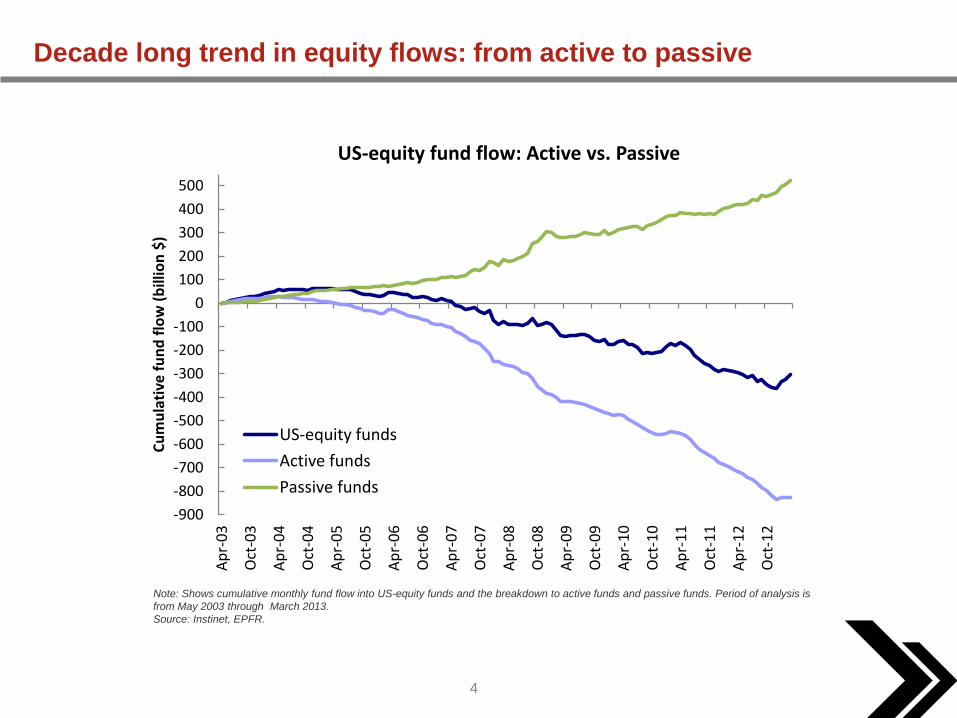
)US-equity fund flow: Active vs. Passive
US-equity funds
Active funds
Passive funds
Decade long trend in equity flows: from active to passive
Note: Shows cumulative monthly fund flow into US-equity funds and the breakdown to active funds and passive funds. Period of analysis is
from May 2003 through March 2013.
Source: Instinet, EPFR.
5
-8
-7
-6
-5
-4
-3
-2
-1
0
1
2
Dec-10 Mar-11 Jun-11 Sep-11 Dec-11 Mar-12 Jun-12 Sep-12 Dec-12 Mar-13
Cu
mu
lati
ve e
xce
ss r
etu
rn (
%)
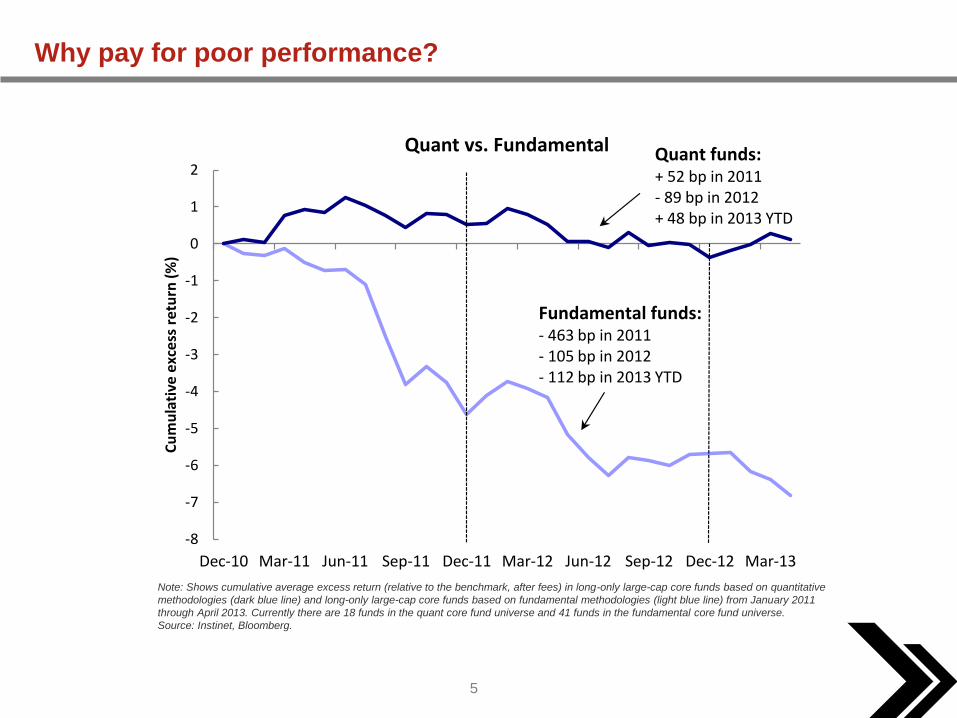
Quant vs. Fundamental Quant funds:+ 52 bp in 2011- 89 bp in 2012+ 48 bp in 2013 YTD
Fundamental funds:- 463 bp in 2011- 105 bp in 2012- 112 bp in 2013 YTD
Why pay for poor performance?
Note: Shows cumulative average excess return (relative to the benchmark, after fees) in long-only large-cap core funds based on quantitative
methodologies (dark blue line) and long-only large-cap core funds based on fundamental methodologies (light blue line) from January 2011
through April 2013. Currently there are 18 funds in the quant core fund universe and 41 funds in the fundamental core fund universe.
Source: Instinet, Bloomberg.
6
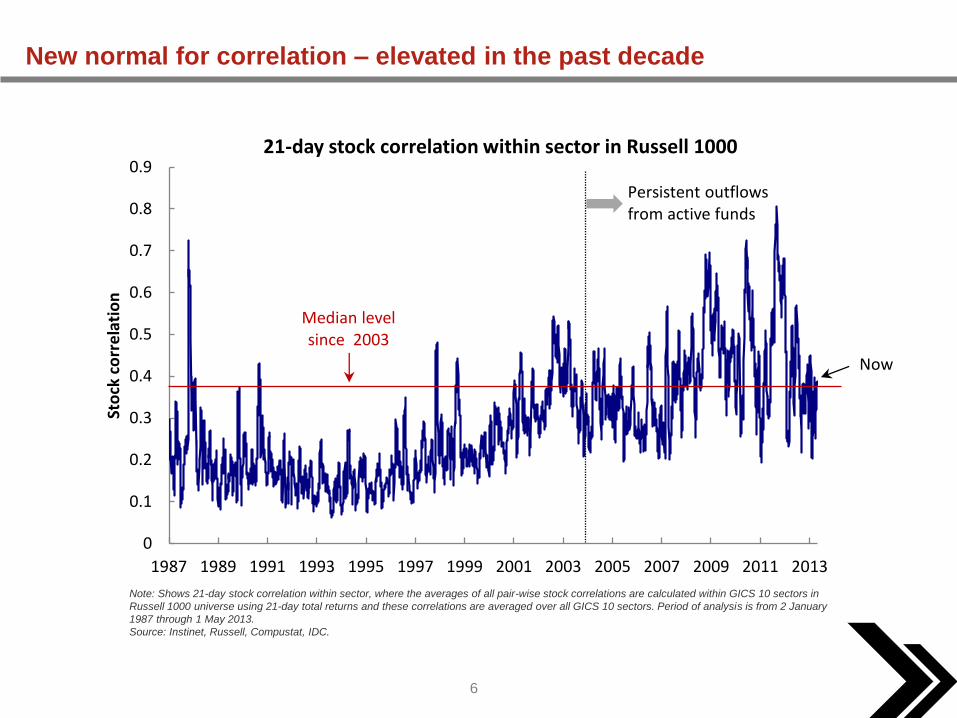
New normal for correlation – elevated in the past decade
Note: Shows 21-day stock correlation within sector, where the averages of all pair-wise stock correlations are calculated within GICS 10 sectors in
Russell 1000 universe using 21-day total returns and these correlations are averaged over all GICS 10 sectors. Period of analysis is from 2 January
1987 through 1 May 2013.
Source: Instinet, Russell, Compustat, IDC.
0
0.1
0.2
0.3
0.4
0.5
0.6
0.7
0.8
0.9
1987 1989 1991 1993 1995 1997 1999 2001 2003 2005 2007 2009 2011 2013
Sto
ck c
orr
ela
tio
n
21-day stock correlation within sector in Russell 1000
Median level since 2003
Persistent outflows from active funds
Now
7
0
0.1
0.2
0.3
0.4
0.5
0.6
0.7
0.8
0.9
0
10
20
30
40
50
60
70
80
901
98
7
19
88
19
89
19
90
19
91
19
92
19
93
19
94
19
95
19
96
19
97
19
98
19
99
20
00
20
01
20
02
20
03
20
04
20
05
20
06
20
07
20
08
20
09
20
10
20
11
20
12
20
13
Stock co
rrelation
with
in secto
r
Vo
lati
lity
of
Ru
ssel
l 10
00
ind
ex (
%)
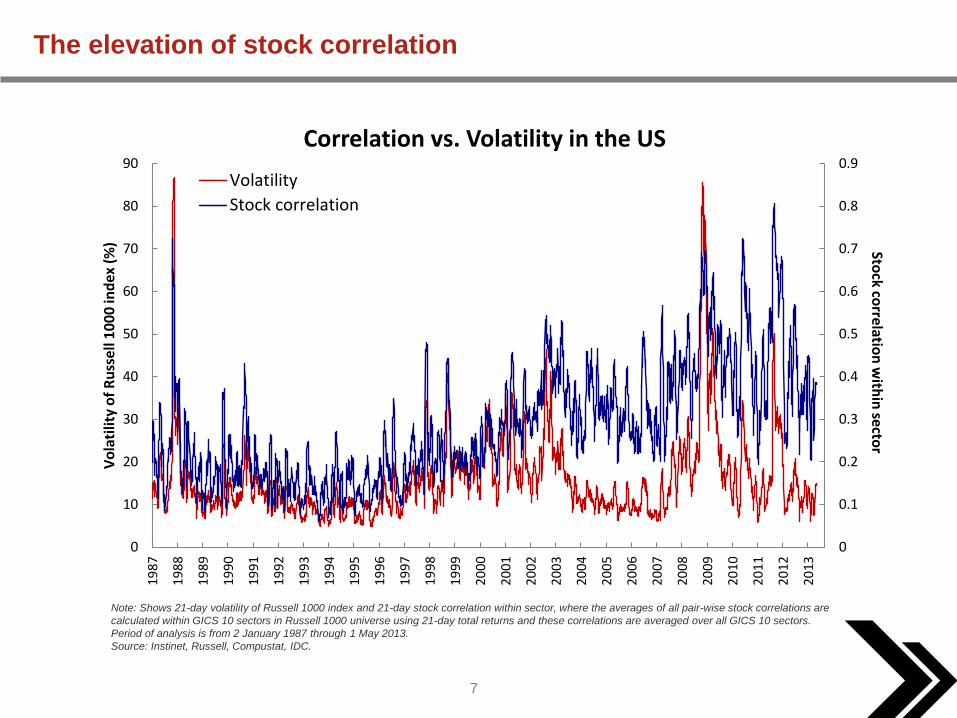
Correlation vs. Volatility in the US
Volatility
Stock correlation
The elevation of stock correlation
Note: Shows 21-day volatility of Russell 1000 index and 21-day stock correlation within sector, where the averages of all pair-wise stock correlations are
calculated within GICS 10 sectors in Russell 1000 universe using 21-day total returns and these correlations are averaged over all GICS 10 sectors.
Period of analysis is from 2 January 1987 through 1 May 2013.
Source: Instinet, Russell, Compustat, IDC.
8
-0.05
0.00
0.05
0.10
0.15
0.20
0.25
0.30
0.35
0.40
0.451
98
7
19
88
19
89
19
90
19
91
19
92
19
93
19
94
19
95
19
96
19
97
19
98
19
99
20
00
20
01
20
02
20
03
20
04
20
05
20
06
20
07
20
08
20
09
20
10
20
11
20
12
20
13
Sto
ck c
orr
elat
ion
-V
ola
tilit
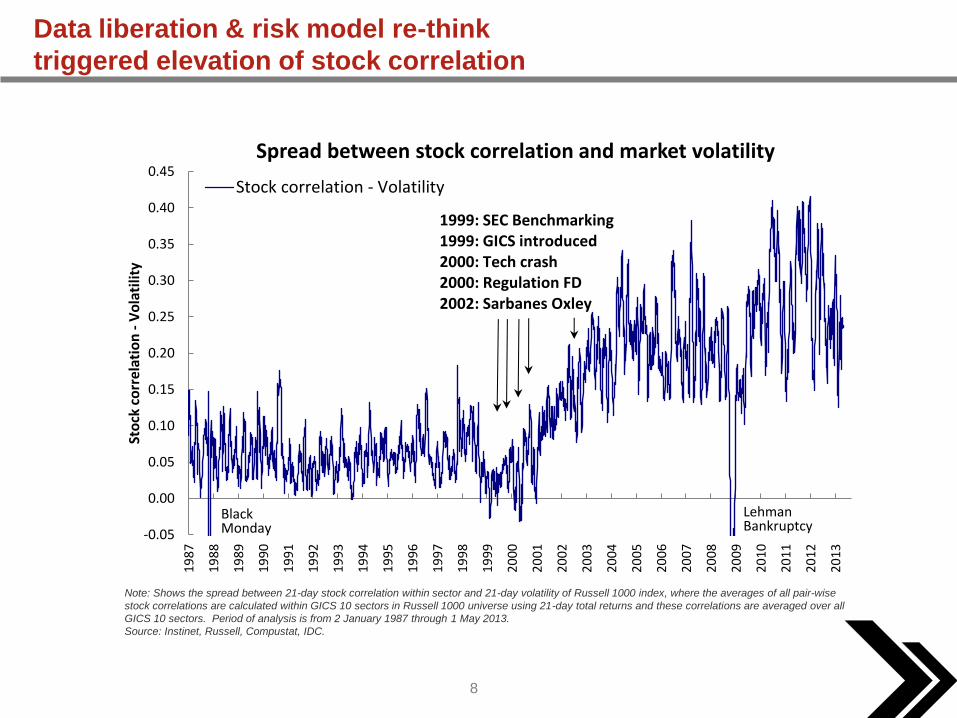
ySpread between stock correlation and market volatility
Stock correlation - Volatility
Lehman Bankruptcy
BlackMonday
1999: SEC Benchmarking1999: GICS introduced2000: Tech crash2000: Regulation FD2002: Sarbanes Oxley
Data liberation & risk model re-think
triggered elevation of stock correlation
Note: Shows the spread between 21-day stock correlation within sector and 21-day volatility of Russell 1000 index, where the averages of all pair-wise
stock correlations are calculated within GICS 10 sectors in Russell 1000 universe using 21-day total returns and these correlations are averaged over all
GICS 10 sectors. Period of analysis is from 2 January 1987 through 1 May 2013.
Source: Instinet, Russell, Compustat, IDC.
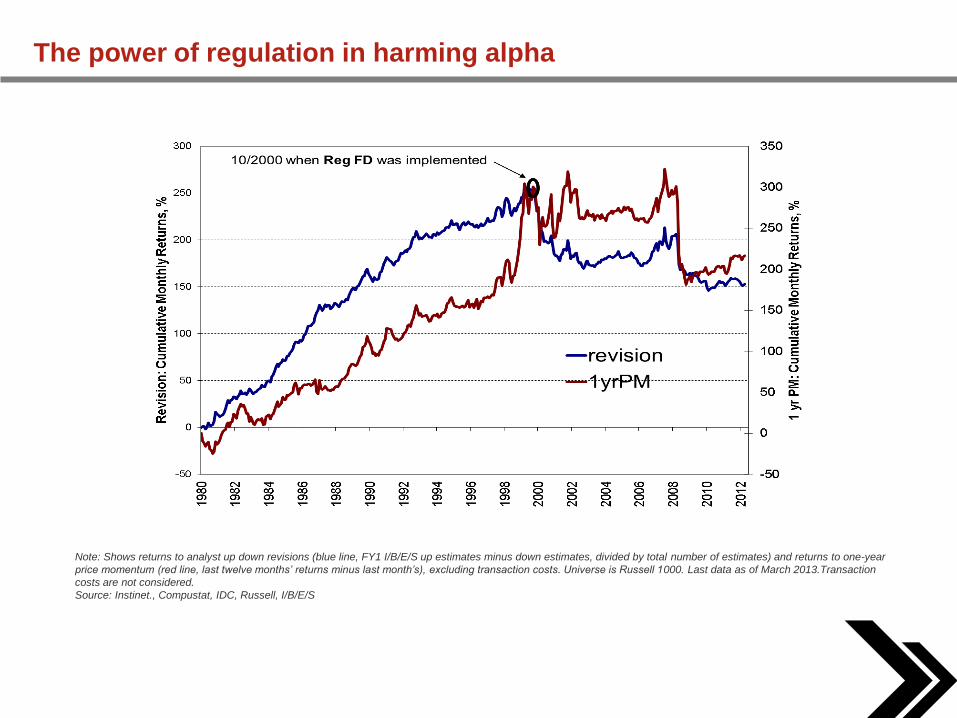
The power of regulation in harming alpha
Note: Shows returns to analyst up down revisions (blue line, FY1 I/B/E/S up estimates minus down estimates, divided by total number of estimates) and returns to one-year
price momentum (red line, last twelve months’ returns minus last month’s), excluding transaction costs. Universe is Russell 1000. Last data as of March 2013.Transaction
costs are not considered.
Source: Instinet., Compustat, IDC, Russell, I/B/E/S
10
0
50
100
150
200
250
300
19
88
19
89
19
90
19
91
19
92
19
93
19
94
19
95
19
96
19
97
19
98
19
99
20
00
20
01
20
02
20
03
20
04
20
05
20
06
20
07
20
08
20
09
20
10
20
11
20
12
Cu
mu
lati
ve r
etu
rn (
%)
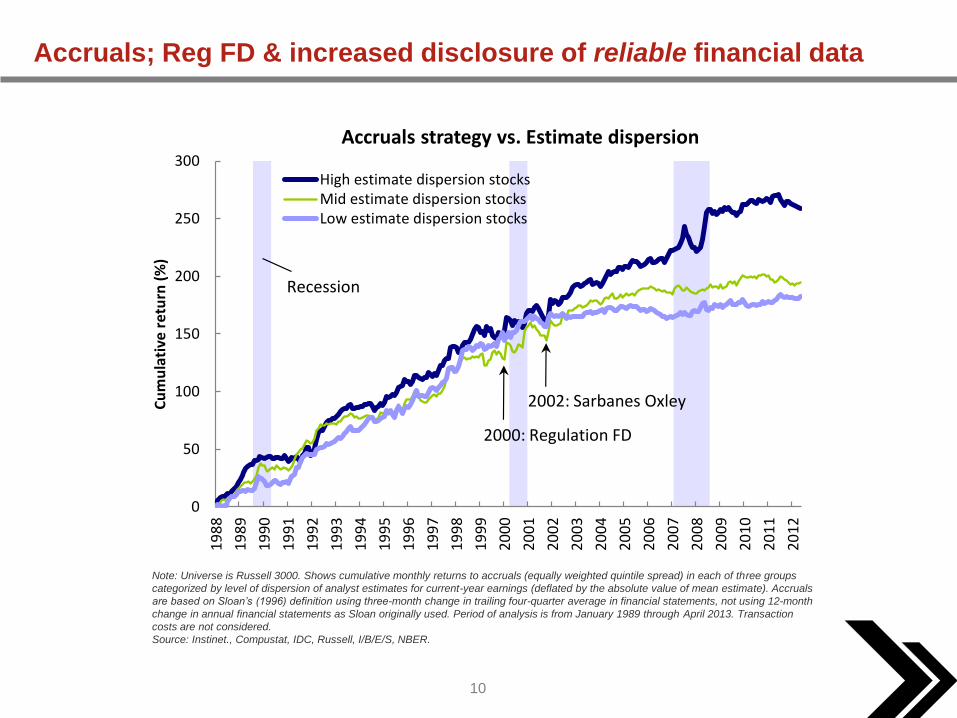
Accruals strategy vs. Estimate dispersion
High estimate dispersion stocksMid estimate dispersion stocksLow estimate dispersion stocks
2000: Regulation FD
Recession
2002: Sarbanes Oxley
Accruals; Reg FD & increased disclosure of reliable financial data
Note: Universe is Russell 3000. Shows cumulative monthly returns to accruals (equally weighted quintile spread) in each of three groups
categorized by level of dispersion of analyst estimates for current-year earnings (deflated by the absolute value of mean estimate). Accruals
are based on Sloan’s (1996) definition using three-month change in trailing four-quarter average in financial statements, not using 12-month
change in annual financial statements as Sloan originally used. Period of analysis is from January 1989 through April 2013. Transaction
costs are not considered.
Source: Instinet., Compustat, IDC, Russell, I/B/E/S, NBER.
11
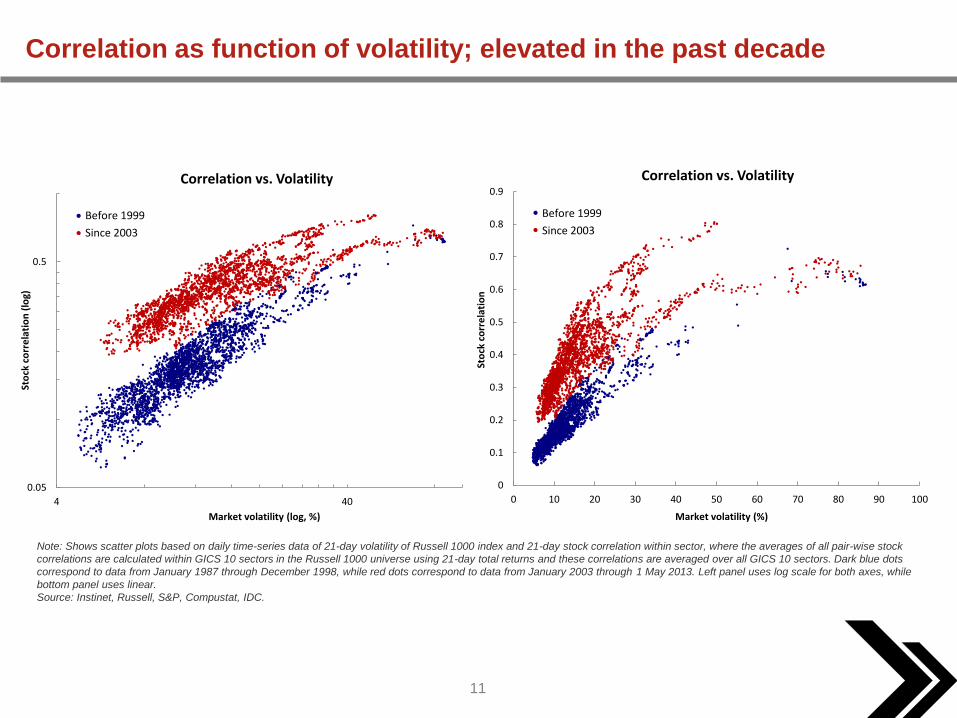
Correlation as function of volatility; elevated in the past decade
Note: Shows scatter plots based on daily time-series data of 21-day volatility of Russell 1000 index and 21-day stock correlation within sector, where the averages of all pair-wise stock
correlations are calculated within GICS 10 sectors in the Russell 1000 universe using 21-day total returns and these correlations are averaged over all GICS 10 sectors. Dark blue dots
correspond to data from January 1987 through December 1998, while red dots correspond to data from January 2003 through 1 May 2013. Left panel uses log scale for both axes, while
bottom panel uses linear.
Source: Instinet, Russell, S&P, Compustat, IDC.
0.05
0.5
4 40
Sto
ck c
orr
ela
tio
n (
log)
Market volatility (log, %)
Correlation vs. Volatility
Before 1999
Since 2003
0
0.1
0.2
0.3
0.4
0.5
0.6
0.7
0.8
0.9
0 10 20 30 40 50 60 70 80 90 100
Sto
ck c
orr
ela
tio
n
Market volatility (%)
Correlation vs. Volatility
Before 1999
Since 2003
12 Joseph Mezrich, 212.310.4241, [email protected]
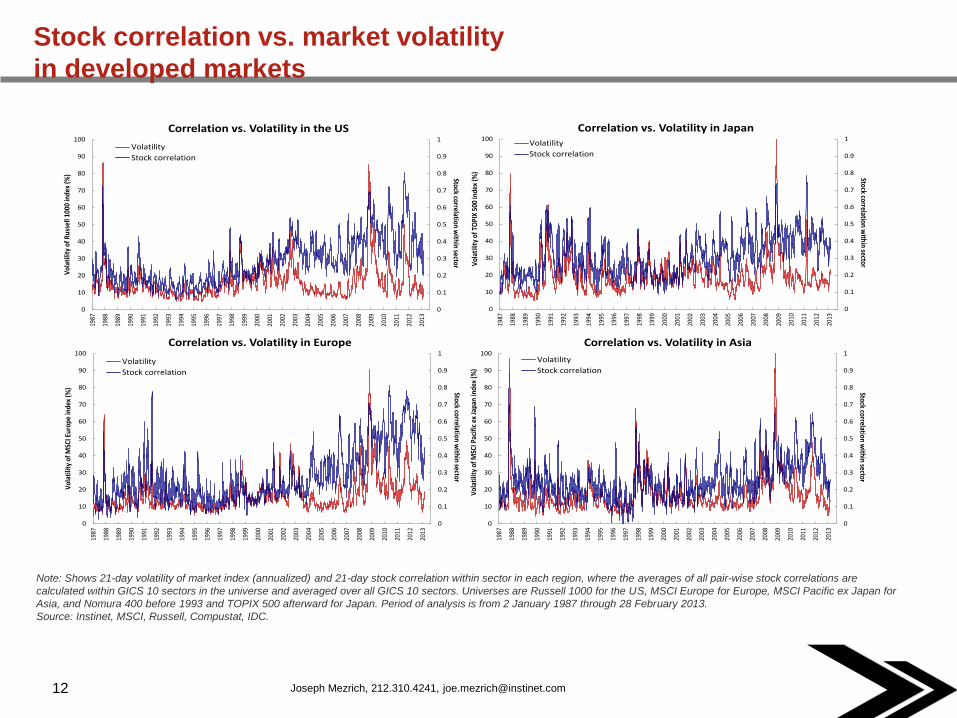
Stock correlation vs. market volatility
in developed markets
Note: Shows 21-day volatility of market index (annualized) and 21-day stock correlation within sector in each region, where the averages of all pair-wise stock correlations are
calculated within GICS 10 sectors in the universe and averaged over all GICS 10 sectors. Universes are Russell 1000 for the US, MSCI Europe for Europe, MSCI Pacific ex Japan for
Asia, and Nomura 400 before 1993 and TOPIX 500 afterward for Japan. Period of analysis is from 2 January 1987 through 28 February 2013.
Source: Instinet, MSCI, Russell, Compustat, IDC.
0
0.1
0.2
0.3
0.4
0.5
0.6
0.7
0.8
0.9
1
0
10
20
30
40
50
60
70
80
90
100
1987
1988
1989
1990
1991
1992
1993
1994
1995
1996
1997
1998
1999
2000
2001
2002
2003
2004
2005
2006
2007
2008
2009
2010
2011
2012
2013
Stock correlation within sector
Vol
atili
ty o
f Rus
sell
1000
inde
x (%
)
Correlation vs. Volatility in the US
Volatility
Stock correlation
0
0.1
0.2
0.3
0.4
0.5
0.6
0.7
0.8
0.9
1
0
10
20
30
40
50
60
70
80
90
100
1987
1988
1989
1990
1991
1992
1993
1994
1995
1996
1997
1998
1999
2000
2001
2002
2003
2004
2005
2006
2007
2008
2009
2010
2011
2012
2013
Stock correlation within sector
Vol
atili
ty o
f MSC
I Eur
ope
inde
x (%
)
Correlation vs. Volatility in Europe
Volatility
Stock correlation
0
0.1
0.2
0.3
0.4
0.5
0.6
0.7
0.8
0.9
1
0
10
20
30
40
50
60
70
80
90
100
1987
1988
1989
1990
1991
1992
1993
1994
1995
1996
1997
1998
1999
2000
2001
2002
2003
2004
2005
2006
2007
2008
2009
2010
2011
2012
2013
Stock correlation within sectorV
olat
ility
of T
OPI
X 50
0 in
dex
(%)
Correlation vs. Volatility in JapanVolatility
Stock correlation
0
0.1
0.2
0.3
0.4
0.5
0.6
0.7
0.8
0.9
1
0
10
20
30
40
50
60
70
80
90
100
1987
1988
1989
1990
1991
1992
1993
1994
1995
1996
1997
1998
1999
2000
2001
2002
2003
2004
2005
2006
2007
2008
2009
2010
2011
2012
2013
Stock correlation within sector
Vol
atili
ty o
f MSC
I Pac
ific
ex
Japa
n in
dex
(%)
Correlation vs. Volatility in Asia
Volatility
Stock correlation
13 Joseph Mezrich, 212.310.4241, [email protected]
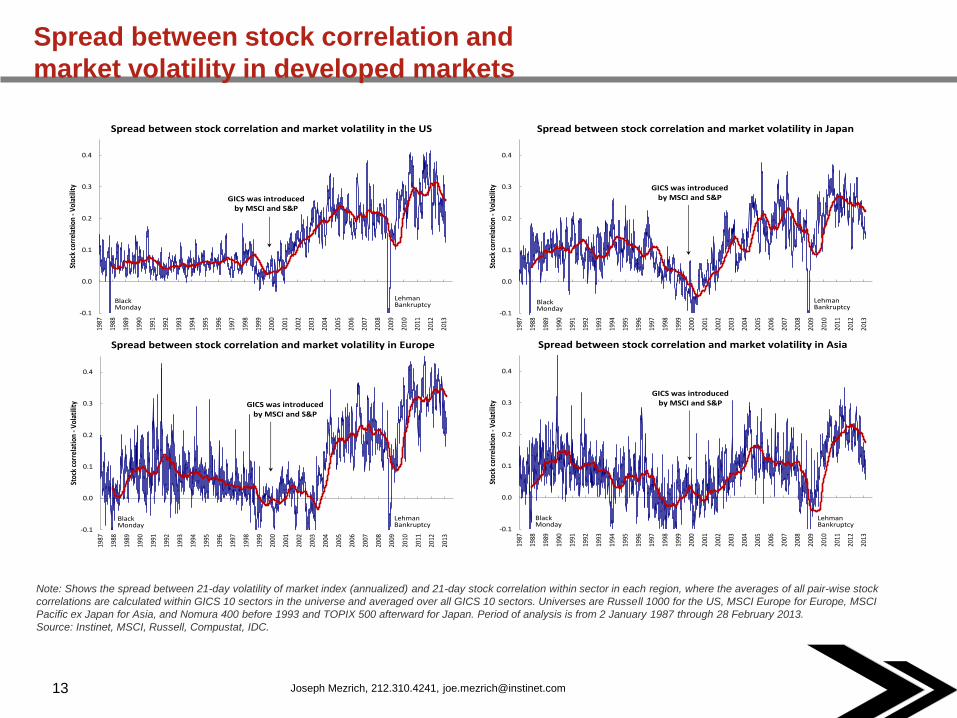
Spread between stock correlation and
market volatility in developed markets
Note: Shows the spread between 21-day volatility of market index (annualized) and 21-day stock correlation within sector in each region, where the averages of all pair-wise stock
correlations are calculated within GICS 10 sectors in the universe and averaged over all GICS 10 sectors. Universes are Russell 1000 for the US, MSCI Europe for Europe, MSCI
Pacific ex Japan for Asia, and Nomura 400 before 1993 and TOPIX 500 afterward for Japan. Period of analysis is from 2 January 1987 through 28 February 2013.
Source: Instinet, MSCI, Russell, Compustat, IDC.
-0.1
0.0
0.1
0.2
0.3
0.4
1987
1988
1989
1990
1991
1992
1993
1994
1995
1996
1997
1998
1999
2000
2001
2002
2003
2004
2005
2006
2007
2008
2009
2010
2011
2012
2013
Stoc
k co
rrel
atio
n -V
olat
ility
Spread between stock correlation and market volatility in the US
Lehman Bankruptcy
BlackMonday
GICS was introducedby MSCI and S&P
Spread between stock correlation and market volatility in the US
-0.1
0.0
0.1
0.2
0.3
0.4
1987
1988
1989
1990
1991
1992
1993
1994
1995
1996
1997
1998
1999
2000
2001
2002
2003
2004
2005
2006
2007
2008
2009
2010
2011
2012
2013
Stoc
k co
rrel
atio
n -V
olat
ility
Spread between stock correlation and market volatility in Europe
Lehman Bankruptcy
BlackMonday
GICS was introducedby MSCI and S&P
Spread between stock correlation and market volatility in Europe
-0.1
0.0
0.1
0.2
0.3
0.4
1987
1988
1989
1990
1991
1992
1993
1994
1995
1996
1997
1998
1999
2000
2001
2002
2003
2004
2005
2006
2007
2008
2009
2010
2011
2012
2013
Stoc
k co
rrel
atio
n -V
olat
ility
Spread between stock correlation and market volatility in Japan
Lehman Bankruptcy
BlackMonday
GICS was introducedby MSCI and S&P
Spread between stock correlation and market volatility in Japan
-0.1
0.0
0.1
0.2
0.3
0.4
1987
1988
1989
1990
1991
1992
1993
1994
1995
1996
1997
1998
1999
2000
2001
2002
2003
2004
2005
2006
2007
2008
2009
2010
2011
2012
2013
Stoc
k co
rrel
atio
n -V
olat
ility
Spread between stock correlation and market volatility in Asia
Lehman Bankruptcy
BlackMonday
GICS was introducedby MSCI and S&P
Spread between stock correlation and market volatility in Asia
14 Joseph Mezrich, 212.310.4241, [email protected]
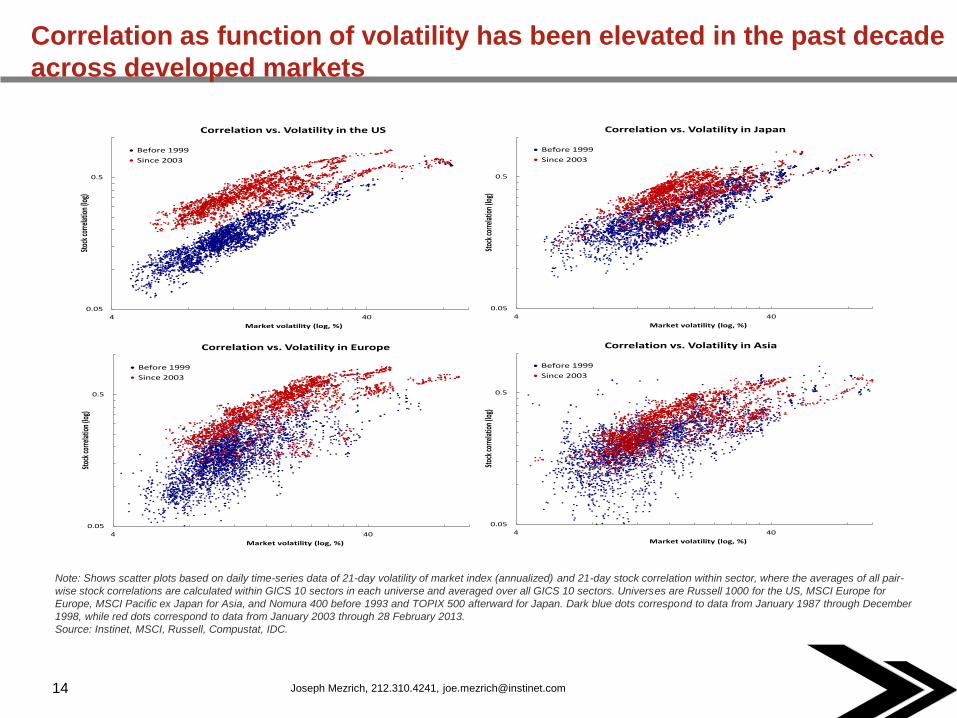
Correlation as function of volatility has been elevated in the past decade
across developed markets
Note: Shows scatter plots based on daily time-series data of 21-day volatility of market index (annualized) and 21-day stock correlation within sector, where the averages of all pair-
wise stock correlations are calculated within GICS 10 sectors in each universe and averaged over all GICS 10 sectors. Universes are Russell 1000 for the US, MSCI Europe for
Europe, MSCI Pacific ex Japan for Asia, and Nomura 400 before 1993 and TOPIX 500 afterward for Japan. Dark blue dots correspond to data from January 1987 through December
1998, while red dots correspond to data from January 2003 through 28 February 2013.
Source: Instinet, MSCI, Russell, Compustat, IDC.
0.05
0.5
4 40
Stoc
k cor
relat
ion
(log)
Market volatility (log, %)
Correlation vs. Volatility in Europe
Before 1999
Since 2003
0.05
0.5
4 40
Stoc
k cor
relat
ion
(log)
Market volatility (log, %)
Correlation vs. Volatility in Japan
Before 1999
Since 2003
0.05
0.5
4 40
Stoc
k cor
relat
ion
(log)
Market volatility (log, %)
Correlation vs. Volatility in the US
Before 1999
Since 2003
0.05
0.5
4 40
Stoc
k cor
relat
ion
(log)
Market volatility (log, %)
Correlation vs. Volatility in Asia
Before 1999
Since 2003
15
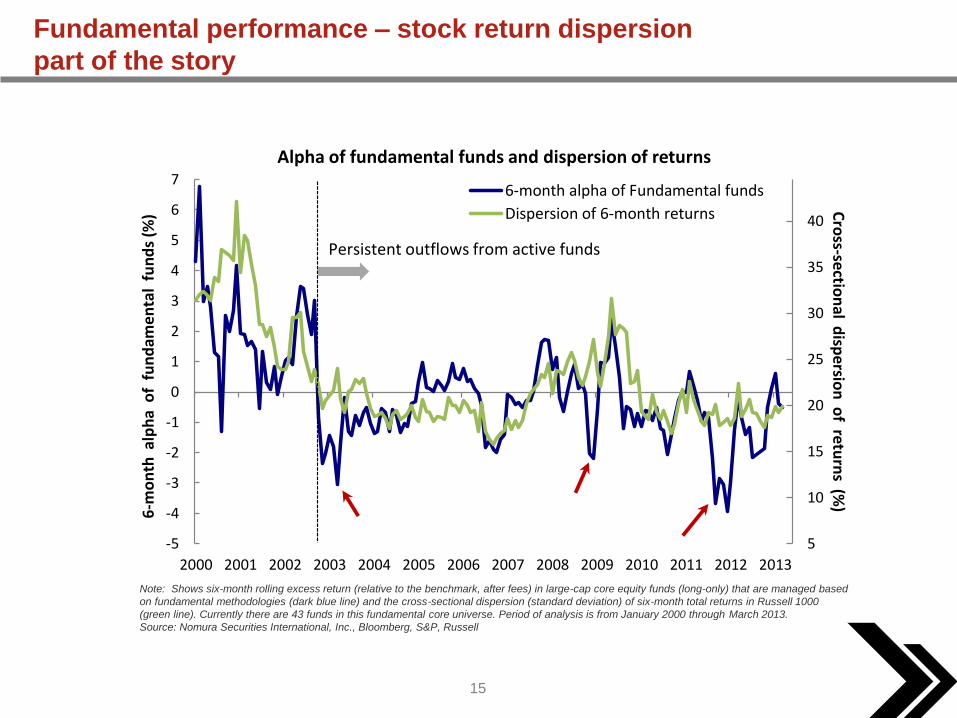
Fundamental performance – stock return dispersion
part of the story
Note: Shows six-month rolling excess return (relative to the benchmark, after fees) in large-cap core equity funds (long-only) that are managed based
on fundamental methodologies (dark blue line) and the cross-sectional dispersion (standard deviation) of six-month total returns in Russell 1000
(green line). Currently there are 43 funds in this fundamental core universe. Period of analysis is from January 2000 through March 2013.
Source: Nomura Securities International, Inc., Bloomberg, S&P, Russell
5
10
15
20
25
30
35
40
-5
-4
-3
-2
-1
0
1
2
3
4
5
6
7
2000 2001 2002 2003 2004 2005 2006 2007 2008 2009 2010 2011 2012 2013
Cro
ss-section
al disp
ersion
of retu
rns (%
)
6-m
on
th a
lph
a o
f f
un
dam
enta
l fu
nd
s (%
)Alpha of fundamental funds and dispersion of returns
6-month alpha of Fundamental funds
Dispersion of 6-month returns
Persistent outflows from active funds
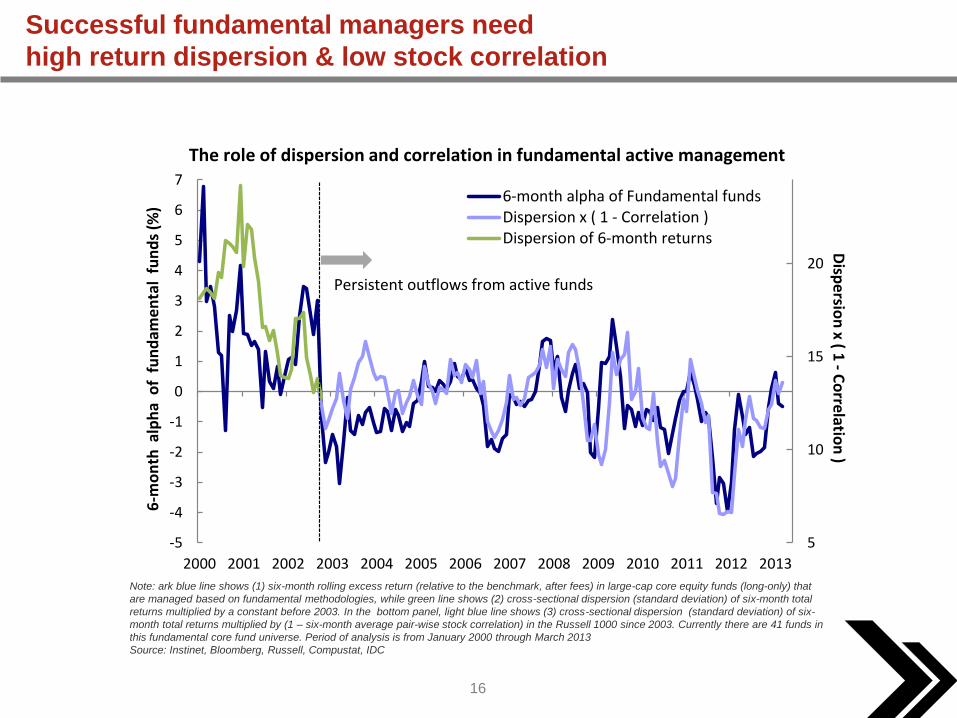
16
Successful fundamental managers need
high return dispersion & low stock correlation
Note: ark blue line shows (1) six-month rolling excess return (relative to the benchmark, after fees) in large-cap core equity funds (long-only) that
are managed based on fundamental methodologies, while green line shows (2) cross-sectional dispersion (standard deviation) of six-month total
returns multiplied by a constant before 2003. In the bottom panel, light blue line shows (3) cross-sectional dispersion (standard deviation) of six-
month total returns multiplied by (1 – six-month average pair-wise stock correlation) in the Russell 1000 since 2003. Currently there are 41 funds in
this fundamental core fund universe. Period of analysis is from January 2000 through March 2013
Source: Instinet, Bloomberg, Russell, Compustat, IDC
5
10
15
20
-5
-4
-3
-2
-1
0
1
2
3
4
5
6
7
2000 2001 2002 2003 2004 2005 2006 2007 2008 2009 2010 2011 2012 2013
Disp
ersio
n x ( 1
-C
orrelatio
n )
6-m
on
th a
lph
a o
f f
un
dam
en
tal
fun
ds
(%)
6-month alpha of Fundamental fundsDispersion x ( 1 - Correlation )Dispersion of 6-month returns
Persistent outflows from active funds
The role of dispersion and correlation in fundamental active management
17
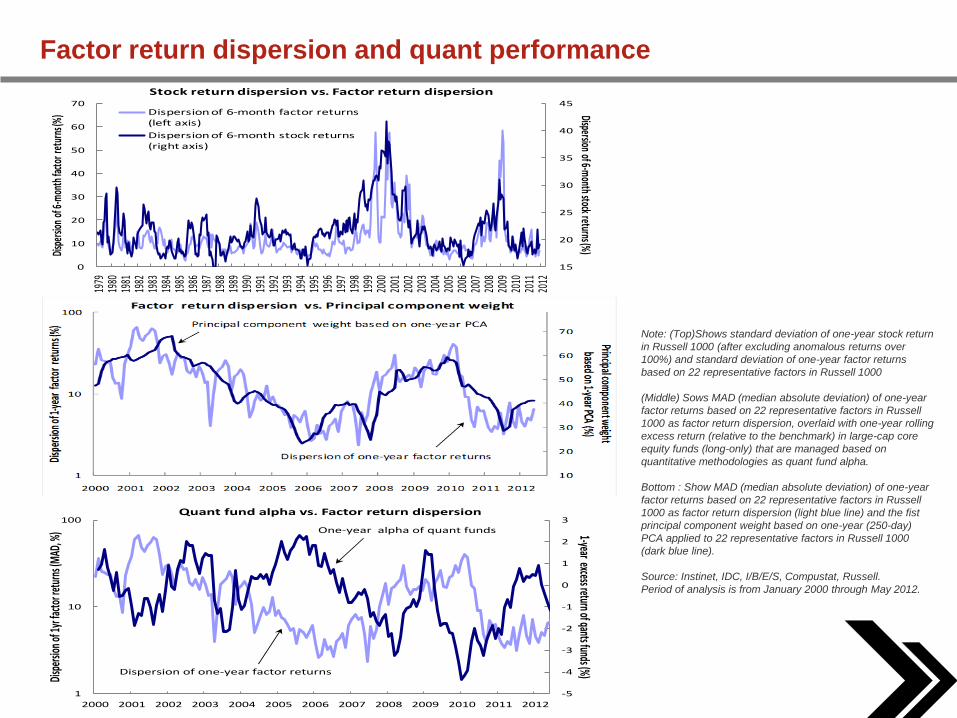
Factor return dispersion and quant performance
Note: (Top)Shows standard deviation of one-year stock return
in Russell 1000 (after excluding anomalous returns over
100%) and standard deviation of one-year factor returns
based on 22 representative factors in Russell 1000
(Middle) Sows MAD (median absolute deviation) of one-year
factor returns based on 22 representative factors in Russell
1000 as factor return dispersion, overlaid with one-year rolling
excess return (relative to the benchmark) in large-cap core
equity funds (long-only) that are managed based on
quantitative methodologies as quant fund alpha.
Bottom : Show MAD (median absolute deviation) of one-year
factor returns based on 22 representative factors in Russell
1000 as factor return dispersion (light blue line) and the fist
principal component weight based on one-year (250-day)
PCA applied to 22 representative factors in Russell 1000
(dark blue line).
Source: Instinet, IDC, I/B/E/S, Compustat, Russell.
Period of analysis is from January 2000 through May 2012.
15
20
25
30
35
40
45
0
10
20
30
40
50
60
7019
7919
8019
8119
8219
8319
8419
8519
8619
8719
8819
8919
9019
9119
9219
9319
9419
9519
9619
9719
9819
9920
0020
0120
0220
0320
0420
0520
0620
0720
0820
0920
1020
1120
12
Dispersion of 6-month stock returns (%)Di
sper
sion
of 6-
mon
th fa
ctor r
etur
ns (%
)
Stock return dispersion vs. Factor return dispersion
Dispersion of 6-month factor returns (left axis)
Dispersion of 6-month stock returns (right axis)
-5
-4
-3
-2
-1
0
1
2
3
1
10
100
2000 2001 2002 2003 2004 2005 2006 2007 2008 2009 2010 2011 2012
1-year excess return of qants funds (%)Disp
ersio
n of 1
yr fa
ctor r
etur
ns (M
AD, %
)
Quant fund alpha vs. Factor return dispersion
One-year alpha of quant funds
Dispersion of one-year factor returns
18
0
0.1
0.2
0.3
0.4
0.5
0.6
0.7
0.8
0.9
0
10
20
30
40
50
60
70
80
901
99
3
19
94
19
95
19
96
19
97
19
98
19
99
20
00
20
01
20
02
20
03
20
04
20
05
20
06
20
07
20
08
20
09
20
10
20
11
20
12
20
13
Factor m
agnitu
de co
rrelation
Wei
ght
of
1st
pri
nci
pal
co
mp
on
ent
(%)
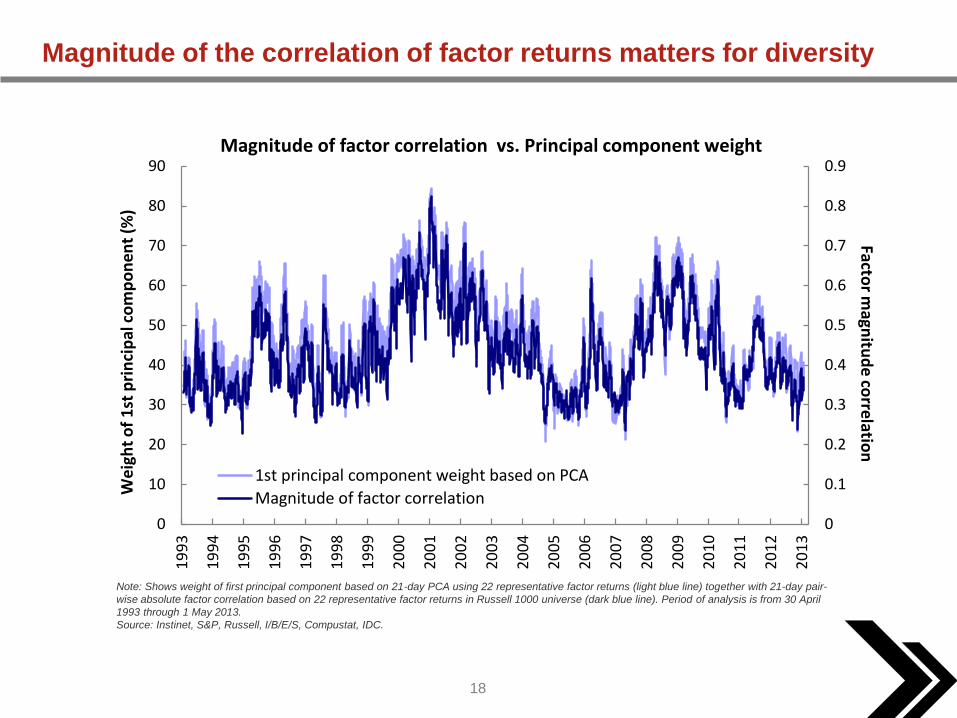
Magnitude of factor correlation vs. Principal component weight
1st principal component weight based on PCA
Magnitude of factor correlation
Magnitude of the correlation of factor returns matters for diversity
Note: Shows weight of first principal component based on 21-day PCA using 22 representative factor returns (light blue line) together with 21-day pair-
wise absolute factor correlation based on 22 representative factor returns in Russell 1000 universe (dark blue line). Period of analysis is from 30 April
1993 through 1 May 2013.
Source: Instinet, S&P, Russell, I/B/E/S, Compustat, IDC.
19
0
0.1
0.2
0.3
0.4
0.5
0.6
0.7
0.8
0.9
19
93
19
94
19
95
19
96
19
97
19
98
19
99
20
00
20
01
20
02
20
03
20
04
20
05
20
06
20
07
20
08
20
09
20
10
20
11
20
12
21
-day
co
rrel
atio
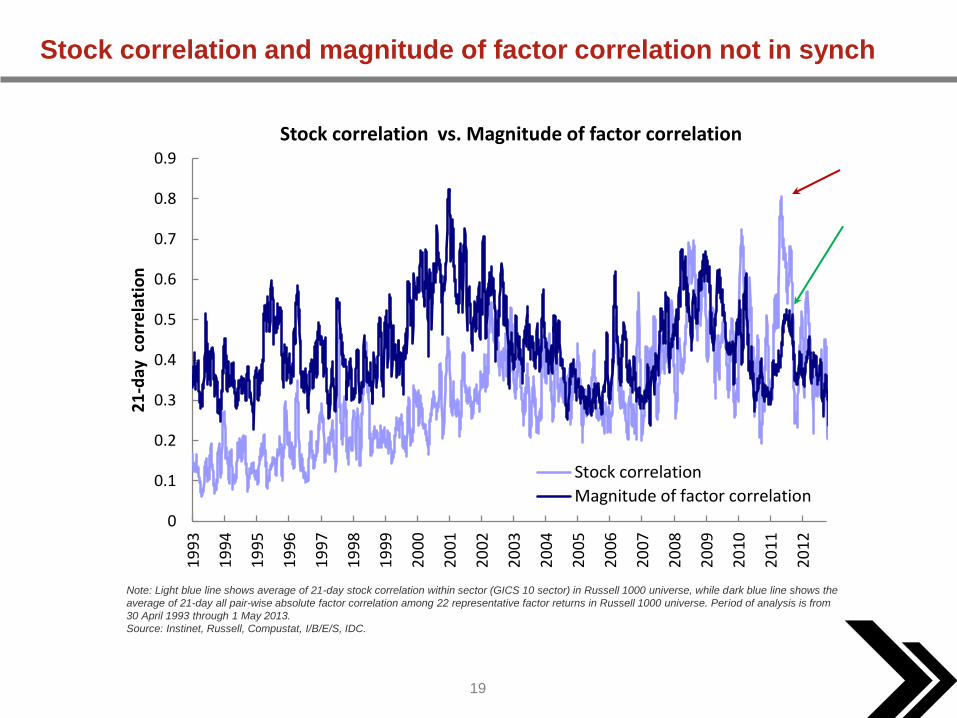
nStock correlation vs. Magnitude of factor correlation
Stock correlation
Magnitude of factor correlation
Stock correlation and magnitude of factor correlation not in synch
Note: Light blue line shows average of 21-day stock correlation within sector (GICS 10 sector) in Russell 1000 universe, while dark blue line shows the
average of 21-day all pair-wise absolute factor correlation among 22 representative factor returns in Russell 1000 universe. Period of analysis is from
30 April 1993 through 1 May 2013.
Source: Instinet, Russell, Compustat, I/B/E/S, IDC.
20
The market has many ways to pay
Fundamental investors & quant investors reap
different payoffs from the market
- Fundamental managers find idiosyncratic
opportunity to accrue alpha
- Quant managers harvest factor premium
21
-5
0
5
10
15
201
98
4
19
85
19
86
19
87
19
88
19
89
19
90
19
91
19
92
19
93
19
94
19
95
19
96
19
97
19
98
19
99
20
00
20
01
20
02
20
03
20
04
20
05
20
06
20
07
20
08
20
09
20
10
20
11
20
12
20
13
5-y
ear
ro
llin
g o
f fa
cto
r re
turn
(%
, an
nu
aliz
ed
)5-year rolling factor premium in the US market
8%
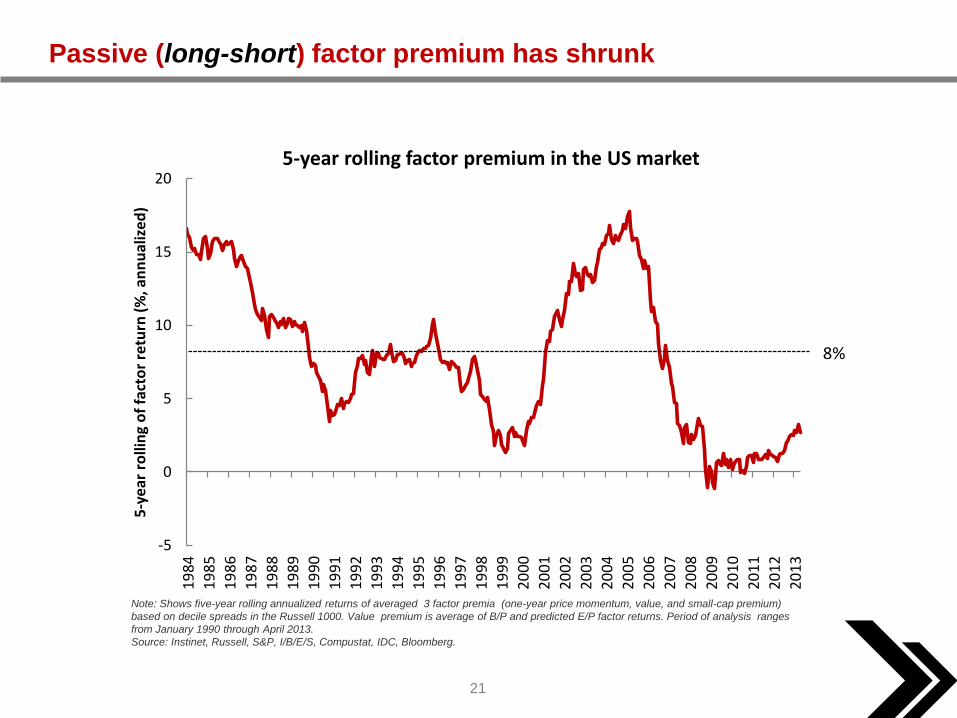
Passive (long-short) factor premium has shrunk
Note: Shows five-year rolling annualized returns of averaged 3 factor premia (one-year price momentum, value, and small-cap premium)
based on decile spreads in the Russell 1000. Value premium is average of B/P and predicted E/P factor returns. Period of analysis ranges
from January 1990 through April 2013.
Source: Instinet, Russell, S&P, I/B/E/S, Compustat, IDC, Bloomberg.
22
-20
-10
0
10
20
30
40
19
84
19
85
19
86
19
87
19
88
19
89
19
91
19
92
19
93
19
94
19
95
19
96
19
98
19
99
20
00
20
01
20
02
20
03
20
05
20
06
20
07
20
08
20
09
20
10
20
12
20
13
5-y
ear
ro
llin
g re
turn
(%
, an
nu
aliz
ed
)5-year rolling factor premium in the US
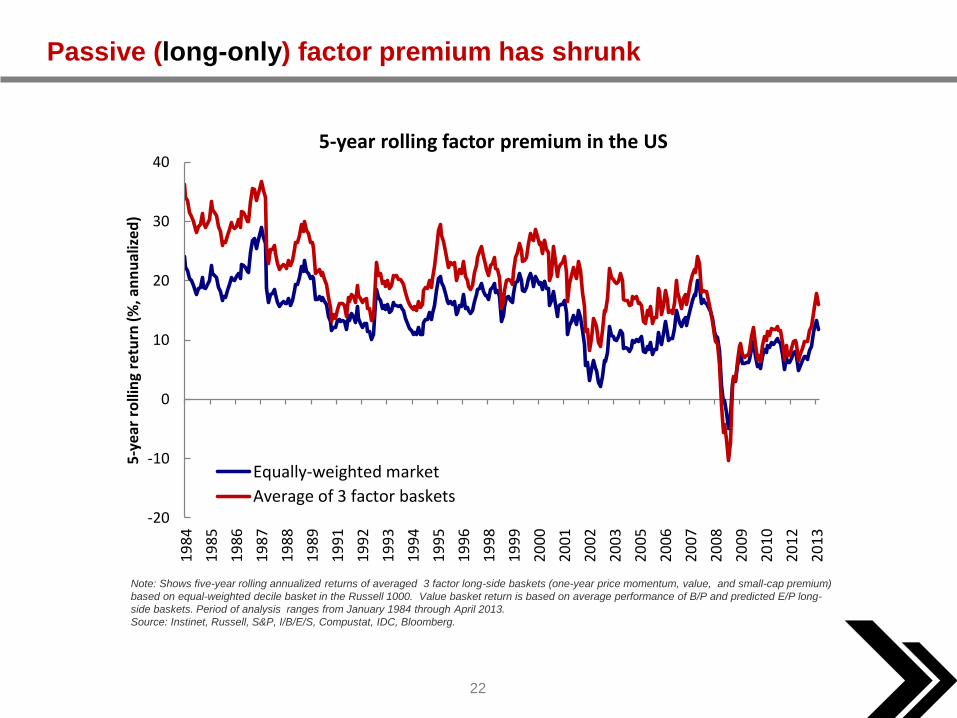
Equally-weighted market
Average of 3 factor baskets
Passive (long-only) factor premium has shrunk
Note: Shows five-year rolling annualized returns of averaged 3 factor long-side baskets (one-year price momentum, value, and small-cap premium)
based on equal-weighted decile basket in the Russell 1000. Value basket return is based on average performance of B/P and predicted E/P long-
side baskets. Period of analysis ranges from January 1984 through April 2013.
Source: Instinet, Russell, S&P, I/B/E/S, Compustat, IDC, Bloomberg.
23
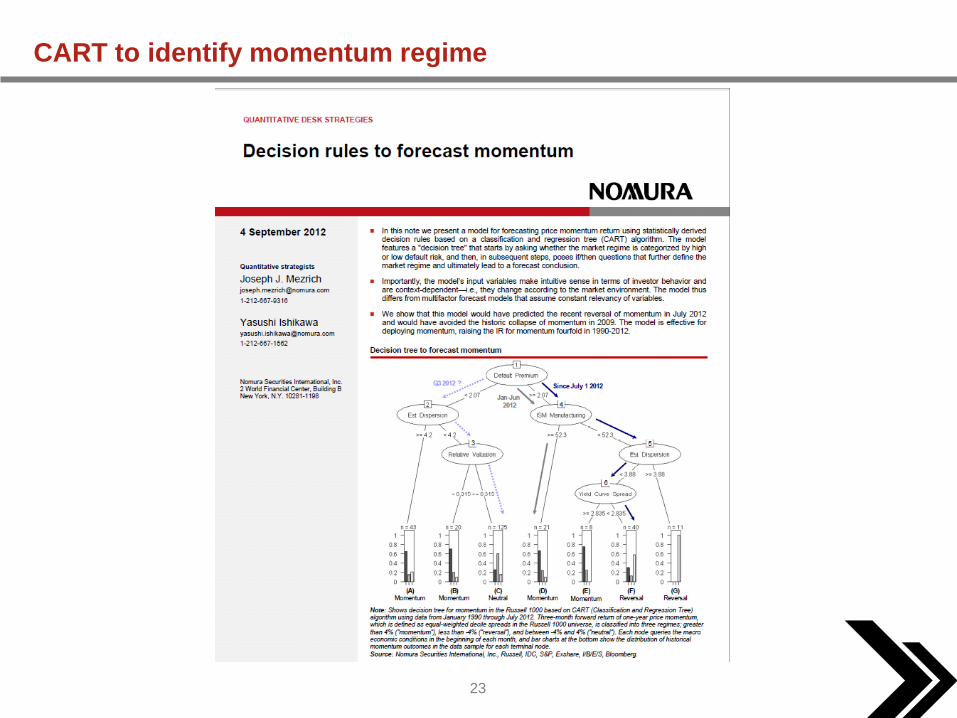
CART to identify momentum regime
24
-50
50
150
250
350
450
550
1990 1992 1994 1996 1998 2000 2002 2004 2006 2008 2010 2012
Cu
mu
lati
ve r
etu
rn (
%)
Factor premia allocation based on CART model
Allocation of factor premiumbased on CART
Equal-weightedfactor premia
(long-only)
Equal-weightedmarket
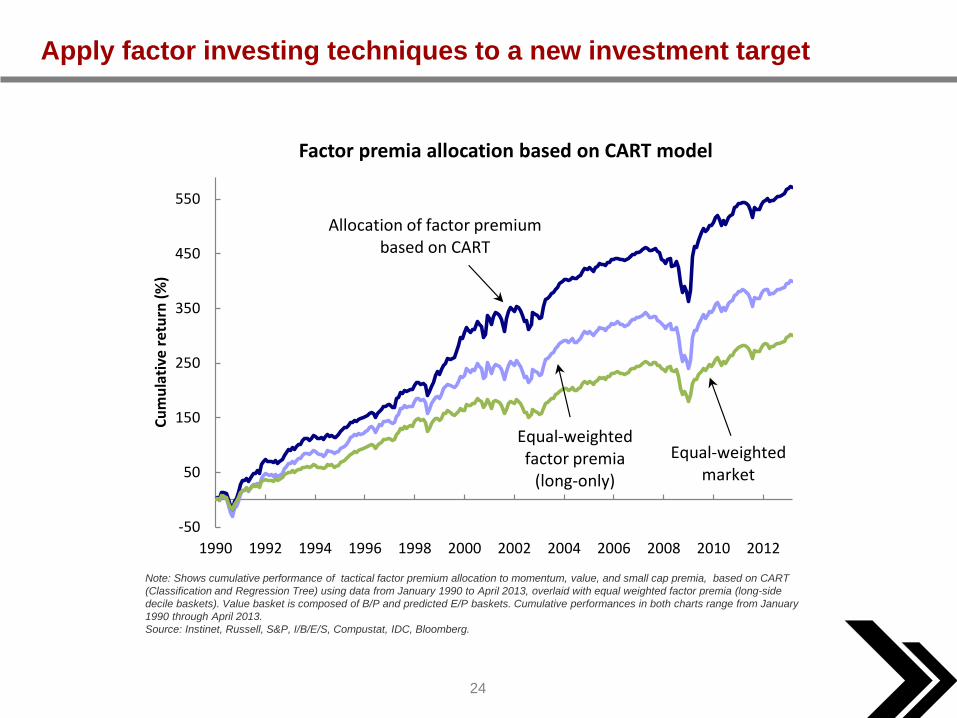
Apply factor investing techniques to a new investment target
Note: Shows cumulative performance of tactical factor premium allocation to momentum, value, and small cap premia, based on CART
(Classification and Regression Tree) using data from January 1990 to April 2013, overlaid with equal weighted factor premia (long-side
decile baskets). Value basket is composed of B/P and predicted E/P baskets. Cumulative performances in both charts range from January
1990 through April 2013.
Source: Instinet, Russell, S&P, I/B/E/S, Compustat, IDC, Bloomberg.
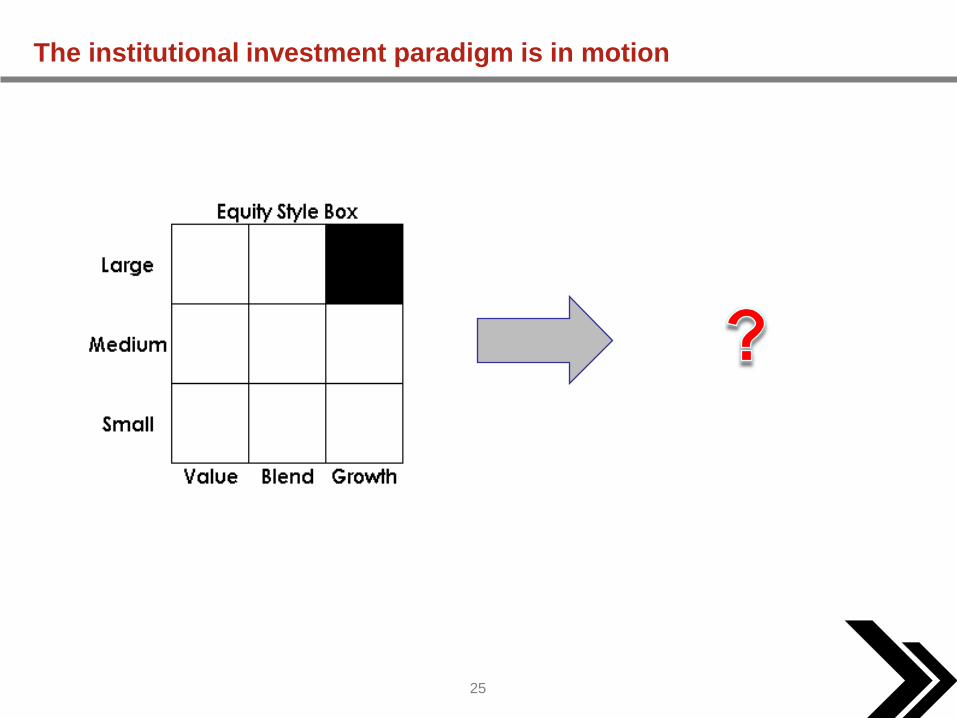
25
The institutional investment paradigm is in motion
26
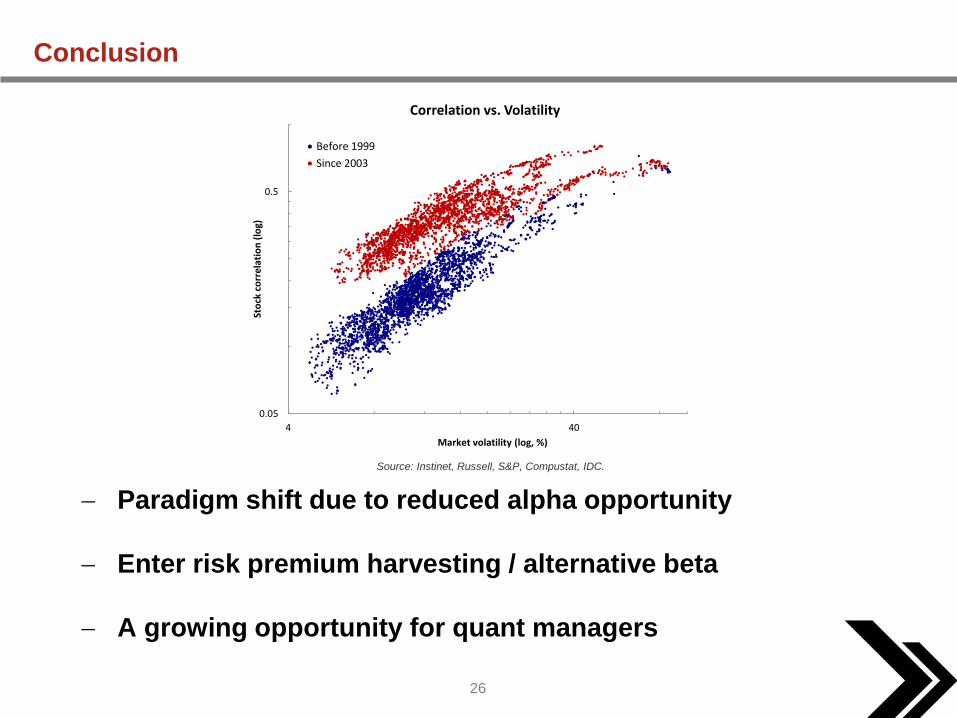
Conclusion
Paradigm shift due to reduced alpha opportunity
Enter risk premium harvesting / alternative beta
A growing opportunity for quant managers
Source: Instinet, Russell, S&P, Compustat, IDC.
0.05
0.5
4 40
Sto
ck c
orr
ela
tio
n (
log)
Market volatility (log, %)
Correlation vs. Volatility
Before 1999
Since 2003
27
Disclaimer
©2013, Instinet Incorporated and its subsidiaries. All rights reserved. INSTINET is a registered trademark in the United States and other countries throughout the world. This material is
provided for informational purposes only and does not constitute an offer, solicitation, or recommendation with respect to the purchase or sale of any security. It does not take into
account the particular investment objectives, financial situation or needs of individual clients. Approved for distribution: in Australia by Instinet Australia Pty Limited (ACN: 131 253 686
AFSL No: 327834), which is regulated by the Australian Securities & Investments Commission; in Canada by Instinet Canada Limited and Instinet Canada Cross Limited, members
IIROC/CIPF; in Europe by Instinet Europe Limited, which is authorized and regulated by the Financial Services Authority; in Hong Kong by Instinet Pacific Limited, which is authorized
and regulated by the Securities and Futures Commission of Hong Kong; in Singapore by Instinet Singapore Services Private Limited, which is regulated by the Monetary Authority of
Singapore, a trading member of The Singapore Exchange Securities Trading Private Limited and a clearing member of The Central Depository (Pte) Limited; and in the US by Instinet,
LLC, member SIPC. For institutional investor use only.