Embed Size (px)
Citation preview
QUANTITATIVE METHODS FOR DETECTING FRAUDULENTAUTOMOBILE BODILY INJURY CLAIMS
Herbert I. Weisberg, Ph.D.Principal
Correlation Research, Inc.61 Pheasant Landing Road
Needham, MA 02192e-mail: [email protected]
Richard A. Derrig, Ph.D.Senior Vice President
Automobile Insurers Bureau of MassachusettsVice President, Research
Insurance Fraud Bureau of Massachusetts101 Arch Street
Boston, MA 02110e-mail: [email protected]
RISQUES Excerpt for Pierre Picard
March 26, 1998
QUANTITATIVE METHODS FOR DETECTING FRAUDULENTAUTOMOBILE BODILY INJURY CLAIMS
ABSTRACT
The paper provides new information with regard to the usefulness of the "red flag" indicators,quantifies the effectiveness of the standard investigative techniques, and explores the ability ofcompanies to use additional investigative techniques in a cost effective manner. The paper refinesthe (ambiguous) depiction of fraud as used in prior studies and makes further progress in refiningthe spectrum of fraud definitions and quantifications.

TABLE OF CONTENTS
I. INTRODUCTION . . . . . . . . . . . . . . . . . . . . . . . . . . . . . . . . . . . . . . . . . . . . . . . . . . . . . . . . . . . . . . . . 2I.1. Background . . . . . . . . . . . . . . . . . . . . . . . . . . . . . . . . . . . . . . . . . . . . . . . . . . . . . . . . 2I.2. Purposes of this Exploratory Study . . . . . . . . . . . . . . . . . . . . . . . . . . . . . . . . . . . . . . 3I.3. Research Design . . . . . . . . . . . . . . . . . . . . . . . . . . . . . . . . . . . . . . . . . . . . . . . . . . . . 3I.4. Classification of Claims . . . . . . . . . . . . . . . . . . . . . . . . . . . . . . . . . . . . . . . . . . . . . . . 4I.5. Comparisons among the Four Coders . . . . . . . . . . . . . . . . . . . . . . . . . . . . . . . . . . . . 6
II. FRAUD INDICATORS . . . . . . . . . . . . . . . . . . . . . . . . . . . . . . . . . . . . . . . . . . . . . . . . . . . . . . . . . . . . 7II.1. Predictors of Claim Adjuster Suspicion . . . . . . . . . . . . . . . . . . . . . . . . . . . . . . . . . . . 7II.2. Predictors of Investigator Suspicion . . . . . . . . . . . . . . . . . . . . . . . . . . . . . . . . . . . . . 8II.3. Predictors of Fraud Vote . . . . . . . . . . . . . . . . . . . . . . . . . . . . . . . . . . . . . . . . . . . . . . 9II.4. Summary of Regression Results . . . . . . . . . . . . . . . . . . . . . . . . . . . . . . . . . . . . . . . 10
III. CLAIM HANDLING . . . . . . . . . . . . . . . . . . . . . . . . . . . . . . . . . . . . . . . . . . . . . . . . . . . . . . . . . . . . . 11III.1. Effective Techniques . . . . . . . . . . . . . . . . . . . . . . . . . . . . . . . . . . . . . . . . . . . . . . . . 12III.2. Adjuster Perspective . . . . . . . . . . . . . . . . . . . . . . . . . . . . . . . . . . . . . . . . . . . . . . . . 14III.3. Investigator Perspective . . . . . . . . . . . . . . . . . . . . . . . . . . . . . . . . . . . . . . . . . . . . . . 15
IV. CONCLUSION . . . . . . . . . . . . . . . . . . . . . . . . . . . . . . . . . . . . . . . . . . . . . . . . . . . . . . . . . . . . . . . . . 17
REFERENCES . . . . . . . . . . . . . . . . . . . . . . . . . . . . . . . . . . . . . . . . . . . . . . . . . . . . . . . . . . . . . . . . . . . . . . . . 19
2
The Auto Insurance Reform Law of 1988 replaced the previous $500 medical damage tort threshold with a $2,0001
one. A short summary of the Weisberg-Derrig 1992 study of post-reform law 1989 claims can be found in "The SystemMisfired," Best's Review, December, 1992. A more complete summary is available in Derrig, Weisberg and Chen(1994).
I. INTRODUCTION
I.1. BackgroundPrivate passenger automobile bodily injury (BI) liability insurance is the largest line of
property-casualty insurance in the United States. This coverage provides indemnification to an injuredaccident victim when the insured driver is legally liable. Compensation is paid in full, up to the policy limits,for the combination of two types of damages. Special damages represent the medical expenses and lost wagesincurred as a result of the injury, while general damages reflect a valuation of the subjective "pain andsuffering" experienced. The amount paid for damages can be litigated, but is ordinarily negotiated betweenthe claimant or her attorney and the claim adjuster.
A number of BI claims can be characterized as fraudulent. The essence of fraud in an auto claim isan attempt to deceive the insurer by misrepresenting some pertinent aspect of the accident, injury, or resultingdamages. Based on our previous research, we have derived a practical definition of fraud as an attempt toobtain compensation for the alleged consequences of an injury that never happened or was unrelated to theaccident. We have also defined build-up as an attempt on the part of the claimant and/or health care providerto inflate the damages for which compensation is being sought. For example, exaggeration of a minor straincan increase the direct medical charges and may also enable the claimant to justify a larger award for thegeneral damages.
Strictly speaking, build-up is a form of fraud. However, this "soft fraud" is treated differently byclaim adjusters because the extent of misrepresentation by a claimant or physician lies on a continuum. Sincethe claimant really was injured, some portion of the payment may be appropriate. For the purpose of thisstudy, we will use the term "fraud" in the narrow sense; i.e., excluding build-up.
Our studies in Massachusetts (Weisberg and Derrig, 1991 & 1992) found that the overall level ofsuspected fraud was in the neighborhood of ten percent (11.8 percent of the 1985-86 claims and 9.1 percentof 1989 claims). However, the percentage of claims that were suspicious (either fraud or build-up) soaredfrom 34.8 percent in 1985-86 to 48.2 percent in 1989. At the same time, insurance premiums for the BI1
coverage increased, with more recent actuarial data showing the need for still higher rates.
In the face of such a crisis, it is natural for the public and insurance regulators to demand strongaction. However, auto insurers confront a dilemma. While fraud or build-up may be suspected, the hardevidence needed to deny the claim or to pursue criminal prosecution can be quite difficult and costly to obtain.Moreover, fair claim settlement statutes impose harsh sanctions for inappropriately resisting a legitimatedemand.
Until recently, about five years ago, insurance companies may have erred on the side of caution,rarely denying claims or even subjecting them to rigorous scrutiny. However, carriers in the last year or two,have instituted additional measures to deal with the fraud problem. Consequently, information about thecost-effectiveness of alternative strategies to identify potentially fraudulent claims could be very useful.
Traditionally, the targeting of claims for special attention has been based on the intuitive judgmentsof claim adjusters and their supervisors. The criteria are based on lists of "fraud indicators" that have evolvedover the years. Currently, there is much interest in the possibility of identifying suspicious claims in a routine,objective and efficient manner based on patterns of fraud indicators. However, this interest is tempered bypractical skepticism about the ability of a computerized "expert system" to duplicate the professional judgmentof an experienced claims handler.
3
I.2. Purposes of this Exploratory StudyThe general purpose of the current study is to explore the potential for reducing unwarranted claim
payments by applying quantitative methods. Toward this end, we set out to:
! Refine our definition of fraud! Explore the potential value of fraud indicators! Derive implications for improved claim handling
With respect to the first goal, discussions with claim adjusters and investigators suggested that withinour narrow definition of fraud, an important distinction would be useful. Some fraudulent claims result fromdeliberate criminal activity, often orchestrated by the leaders of fraud rings. Others occur as the result of anindividual's post hoc realization that an accident can be exploited for personal gain by faking an injury. Wecan designate the former situation as planned fraud and the latter as opportunistic fraud. Most fraud expertsbelieve that opportunistic fraud occurs much more frequently than planned fraud.
In an opportunistic fraud scenario, the accident and the insured driver may look very normal.Suspicion would focus on the claimant, the injury, the medical treatment and the statement of lost wages (ifany). However, a planned fraud typically involves a staged accident, in which both the accident and injuriesare completely fabricated. In this situation, the circumstances of the accident and the behavior of the insureddriver may raise suspicion as well. The optimal approach to suspicious claims by an insurer may depend onthe specific type of fraud suspected and the particular aspects of the claim that appear questionable.
Most insurers utilize lists of fraud indicators as an aid to adjusters. However, the main problem withsuch "red flags" is the lack of specificity. While most fraudulent claims do indeed display several of theindicators, so do a great many legitimate claims. Consequently, simply responding to the existence of a fewindicators can generate many false positives. What is needed are methods to discern patterns of indicatorsthat reliably point to probable fraud.
To our knowledge, there has been no attempt to validate fraud indicators statistically. Consequently,it is possible that only a fraction of the potential value of these indicators is currently being realized.Development of efficient claim screening approaches based on the indicators would enable insurers tooptimize allocation of scarce investigative resources.
When suspicions are aroused, adjusters have at their disposal several techniques to gather additionalpertinent information. Decisions about when to utilize these techniques are largely based on the adjuster'sand/or management's intuitive balancing of costs against benefits. Because this professional judgment isgrounded in extensive practical experience, there may be little room for improvement.
Adjusters seek to deny or at least mitigate claims they have substantial reason to believe arefraudulent. With the advent of the Insurance Fraud Bureau of Massachusetts in May, 1991, the additionalpossibility of a criminal prosecution for filing fraudulent claims became a practical reality rather than atheoretical possibility. It is important, however, to keep in mind the clear distinction between the evidentiarystandards for the civil denial of a claim, preponderance of the evidence, and the criminal prosecution of theclaimant, evidence of criminal intent beyond a reasonable doubt. These differing standards guide thediffering perceptions of fraud by adjusters and investigators that we explore in this study.
I.3. Research DesignThe current study extends the previous studies conducted by the Massachusetts Auto Insurers Bureau
in conjunction with Correlation Research. As part of these studies, a special subset of 387 claims that arosefrom 1989 accidents had already been coded independently by two different adjusters. One coding was basedon the personal injury protection (PIP) claim file and one on the BI claim file corresponding to the sameclaimant and injury. Among the data collected was a judgmental assessment of whether fraud or build-upappeared to be present. Since the current study intended to focus on fraud, it seemed reasonable to capitalizeon this existing information.
4
The complete list of 65 fraud indicators and their variable names is shown in the appendix.2
The coders made a judgmental evaluation of whether the claim file under review contained "elements" of fraud3
or build-up. The elements identified, for example the presence of a fraud indicator, cannot realistically be deemed"evidence" of fraud. Coders designated about ten percent of the subjectively suspected fraud, one percent overall, asworthy of referral for criminal prosecution.
Practical considerations limited the scope of this exploratory investigation to approximately 125claims. Since only 62 of these 387 claims were deemed by at least one of the coders to involve fraud, it wouldhave been inefficient to sample randomly from this group. Therefore, we decided to enrich the sample byincluding all 62 suspect claims along with a random sample of 65 from among the remaining 325 claims.
We recognize that this research design makes generalization to the population of Massachusettsclaims quite complicated. Even for simple summary statistics, such as the average, the use of a stratifiedsample design requires a re-weighting of the observations, and finding the correct weights is not trivial in thissituation. For multivariate models the problem is much more complex, because the criterion forover-sampling was correlated with the outcomes of interest (see Skinner, et.al., 1989). Because we regardedthis study as exploratory, we chose in general to restrict overall population estimates of claim characteristicsto a select few of particular interest. Larger more robust samples could provide the opportunity to refine andvalidate the results presented here as well as allow the use of the more appropriate complex statisticalmodelling techniques.
Our previous studies had all used experienced claim adjusters or managers as the coders. However,from discussions with claims experts we had learned that claim investigators would have a somewhat differentperspective on the nature of fraud. We decided to arrange a parallel coding effort of the same 127 claims bya set of three senior claims professionals and three investigators from the staff of the Massachusetts InsuranceFraud Bureau. Each file was coded by one adjuster and one investigator.
The data collection forms used by the two coding groups were similar but not identical. Both theadjusters and investigators recorded a fraud assessment, opinions about the utility of various investigativetechniques and a judgment regarding the best approach to claim handling. The adjuster form included acomprehensive list of 65 potential fraud indicators culled from published sources and personalcommunications . The adjusters were required to record which of the indicators were present on each claim.2
The adjusters were also asked several questions about the cost versus benefit of additional investigation interms of claim settlement. The investigators were not asked about the presence of fraud indicators nor thecost side of investigative techniques, but were asked to make a judgement about how the claim would havebeen treated by the Insurance Fraud Bureau.
I.4. Classification of ClaimsIn this section we examine the conceptual framework for classifying claims by resolving the overall
assessment of the claim into components that reflect different specific aspects of the claim. The componentsare the accident, claimant, insured driver, injury, medical treatment and lost wages. This resolution isparticularly important because of the two levels of ambiguity in the concept of fraudulent claim revealed byour prior studies. The first level of ambiguity concerns the vagueness of the definition of fraud. In our priorstudy of 1989 bodily injury claims the spectrum of possibilities for quantification of "fraud"ranged from 0.2percent to 48 percent of the claims.
The second level of ambiguity concerns the subjective nature of the adjuster assessment or layperception of criminal fraud. Clearly, the only true objective categorization of fraudulent claims, those withcriminal convictions based on tested evidence of criminal intent to defraud, requires presentation to a3
criminal court of jurisdiction, a relatively rare event in Massachusetts prior to the advent of the Fraud Bureau.Our study sample of 62 claims deemed fraudulent by at least one of the two prior coders, illustrates thetenuous nature of the subjective black or white evaluation through the lack of unanimity of judgment. Only
5
1.8% of the sample claims were independently perceived as fraudulent by both prior coders. We explore morerealistic categorizations of fraudulent claims from several perspectives; we begin by considering the adjusterand investigator classification proportions.
The claim adjusters were instructed to assess the claim as one of the following types:
! Legitimate! Build-up only! Opportunistic fraud! Planned fraud
In addition, coders rated each claim on a ten-point scale of suspicion, both overall and for each of thecomponents described earlier.
Note that the unadjusted percentage breakdown of claims into the categories is not very meaningful,because the sample has been over-weighted toward suspicious claims. In particular, the number of completelylegitimate claims is under-represented. However, it is plausible that within the subset of claims with suspectedfraud, the relative proportion of opportunistic versus planned fraud is roughly correct. Of the 28 claimsdeemed fraudulent by the claim adjusters, about 70 percent were categorized as opportunistic and 30 percentas planned.
The planned fraud claims had the highest overall suspicion score average (8.1), followed byopportunistic fraud (6.4), build-up (3.0) and legitimate (.2). In terms of specific components, the resultscorrespond closely to our expectations. Planned fraud is characterized by a high level of suspicion for allaspects of the claim, except possibly the lost wage claim. The mean overall rankings suggest that the conceptof suspicion score with a range of values can sensibly model the first level of ambiguity of fraud, the rangeof so-called hard and soft fraud.
Opportunistic fraud involves a claimant, injury and treatment that are suspect, but the accident andinsured driver are usually legitimate. The reason why the accident may be suspicious in some claims codedas opportunistic fraud might be the adjuster's belief that the accident could actually have been deliberatelyengineered by the claimant.
For build-up the treatment is somewhat suspicious (5.1) and there may be some uncertainty regardingthe injury (3.1) and claimant (2.7). Our interpretation is that some of the claimed injuries appear soexaggerated as to border on outright fabrication, but the evidence of fraud is relatively weak. From the claimadjustment perspective, drawing the line between build-up and opportunistic fraud is an important but verychallenging exercise.
Investigators in the Massachusetts Insurance Fraud Bureau (IFB) regard criminal prosecution of thefraud perpetrator as their primary objective. Investigators in company SIUs have the dual objectives of denyingor mitigating claims and of preparing appropriate evidence which could lead to criminal prosecution. Thus,we would expect IFB investigators to be less concerned about the degree of misrepresentation involved thanabout the strength of available evidence.
We note first that the concept of build-up was not germane to the investigator view of claims, withonly three claims falling in this category. Nearly all of the claims that the adjusters termed build-up werecoded by the investigators as either opportunistic fraud or legitimate. We believe that investigators viewpadding of claims as a form of fraud, which if provable could lead to prosecution. Of course, investigatorsface the same problem as adjusters, the great difficulty in obtaining conclusive evidence of claim inflation.However, unlike the adjusters, who can attempt to achieve a compromise of the payment amount, investigatorstypically do not consider a continuum of possible responses.
6
Our resolution of the true ambiguity of the black-or-white categorization of fraudulent claims in our prior studies4
by means of the suspicion indexes and the fraud vote measure mirrors the mathematical resolution of ambiguousconcepts through the construction of fuzzy sets. Briefly, fuzzy set theory replaces the usual zero-one, true-false logicby a measurement function with values lying between zero and one. Valuations at the endpoints, zero and one, canbe thought of as sure categorizations while those with values between zero and one "fuzzy." See Ostaszewski (1993)or Derrig and Ostaszewski (1995) for a description of Fuzzy Set Theory and for applications to insurance problems.
I.5. Comparisons among the Four CodersAll the claims in the current study have been reviewed by four independent coders, as described
earlier. Because the IFB investigators did not differentiate between fraud and build-up, it did not seem thattheir definition of fraud was directly comparable to that applied by the three adjuster coders. Therefore, foruse in comparisons with the adjuster opinions we narrowed suspected fraud for the investigators. We reasonedthat an investigator who truly suspected criminal fraud would regard an IFB referral as appropriate. Therefore,only claims for which the investigator recommended referral to the IFB were included in the narrowerdefinition.
There were complex inter-relationships among the designations of fraud by the four independentassessments. These patterns are difficult to summarize succinctly but clearly illustrate the second level ofambiguity of the concept of fraud (perception) discussed above. We infer that categorization of a file in blackor white terms as fraud or not fraud by a single reviewer has only limited validity. Indeed, out of the 127claims, none were coded as fraud by all four coders and only 13 by three of the four coders.
This finding might at first be viewed as disappointing. However, it is unrealistic to expect that aclaim file would ordinarily contain enough evidence to prove fraud. Rather, the file can raise a range ofsuspicion levels that may or may not trigger a judgment of fraud and that may or may not subsequently beconfirmed by in-depth investigation, prosecution and conviction. Thus, the fact that we see more agreementabout suspicion of fraud than about whether to call a claim fraudulent is not really surprising.
The total number of coders able to judge (“vote”) that fraud exists appears to correlate strongly withthe individual suspicion ratings for individual coders. We interpret this vote in favor of fraud as a measureof suspicion that reflects the ambiguity of the perception of available evidence. Because it synthesizes fourindependent ratings, the fraud vote will be explored as a useful overall suspicion measure for purposes ofanalysis within this study. 4
Although an individual fraud assessment may not be reliable, an individual suspicion "score" mightbe more meaningful. For example, suppose we regard a fraud vote of three as indicative of a truly suspiciousclaim. Then a claim scored as zero by an expert reviewer will rarely be suspicious, and a claim coded sevenor higher will be truly suspicious. Thus, an insurer might find it useful to score claims routinely and tochannel a claim for appropriate action based in part on this information.
Translating some of the findings above into population terms, we estimate that the adjusters regard9.3 percent of all claims as highly suspicious (rating of 7+) and the investigators 24.8 percent. Populationestimates for the fraud vote are 3.4 percent with a value of three and 7.8 percent with 2. These results arebroadly consistent with the notion that approximately 10 percent of claims represent (suspected) fraud in ourprior studies. Perhaps 3 or 4 percent of claims are so flagrantly suspicious that most reviewers would agreethat fraud is probable.
7
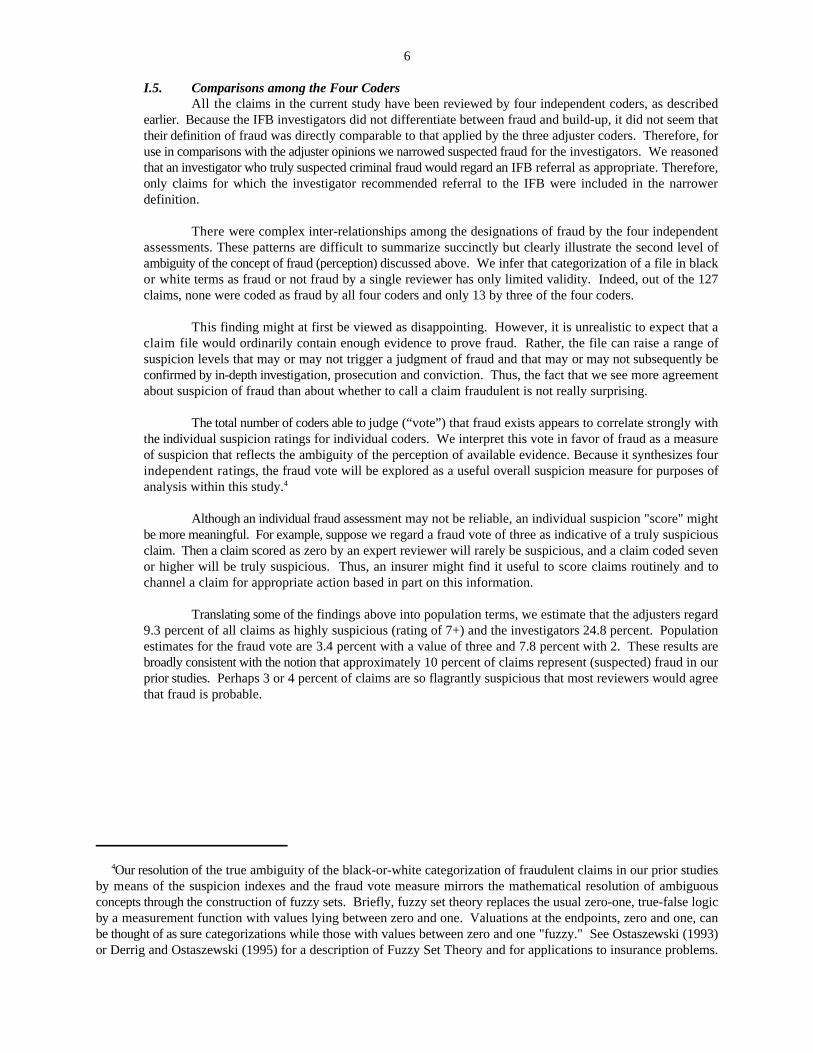
Finally, we can obtain a rough estimate of the population breakdown of claim types if we assume thatthe 387 claims from which our 127 were drawn is representative in terms of claim types. Under thisassumption, we can re-weight the 65 claims that were not deemed fraudulent by either of the coders in priorstudies to adjust for their under-representation by a factor of five (65 of 325) in the stratified sample. Afterre-weighting, the estimated population proportions become:
Table 1Claim Classification
Adjusters InvestigatorsLegitimate 49.1% 59.2%Build-up only 37.5% 2.8%Opportunistic fraud 9.3% 33.1%Planned fraud 4.1% 4.9%
II. FRAUD INDICATORS
In this section we explore the relationships between fraud indicators and degree of suspicion. The mainpurpose is to test the feasibility of developing automatic screening criteria that could assist claims professionals.Because these relationships are based on our non-random sample of claims, the precise values of the parameters mightbe specific to the sample. However, the general patterns ought to be meaningful.
II.1. Predictors of Claim Adjuster Suspicion
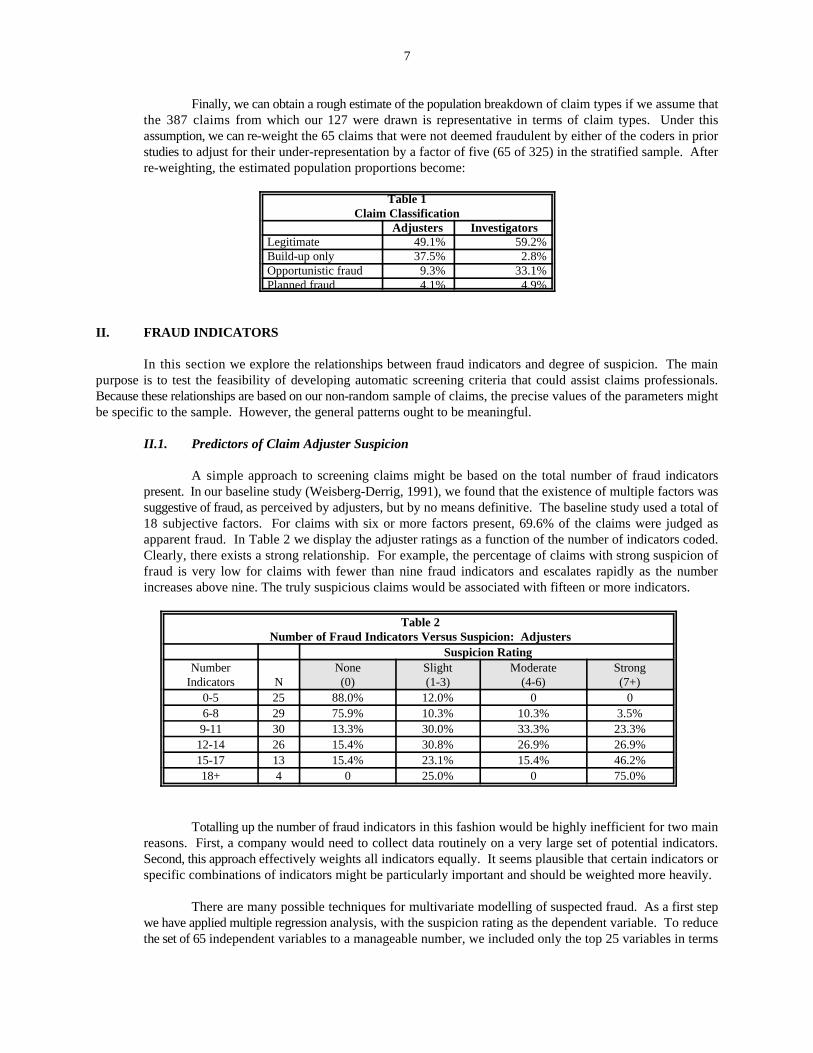
A simple approach to screening claims might be based on the total number of fraud indicatorspresent. In our baseline study (Weisberg-Derrig, 1991), we found that the existence of multiple factors wassuggestive of fraud, as perceived by adjusters, but by no means definitive. The baseline study used a total of18 subjective factors. For claims with six or more factors present, 69.6% of the claims were judged asapparent fraud. In Table 2 we display the adjuster ratings as a function of the number of indicators coded.Clearly, there exists a strong relationship. For example, the percentage of claims with strong suspicion offraud is very low for claims with fewer than nine fraud indicators and escalates rapidly as the numberincreases above nine. The truly suspicious claims would be associated with fifteen or more indicators.
Table 2Number of Fraud Indicators Versus Suspicion: Adjusters
Suspicion RatingNumber None Slight Moderate Strong
Indicators N (0) (1-3) (4-6) (7+)0-5 25 88.0% 12.0% 0 06-8 29 75.9% 10.3% 10.3% 3.5%9-11 30 13.3% 30.0% 33.3% 23.3%
12-14 26 15.4% 30.8% 26.9% 26.9%15-17 13 15.4% 23.1% 15.4% 46.2%18+ 4 0 25.0% 0 75.0%
Totalling up the number of fraud indicators in this fashion would be highly inefficient for two mainreasons. First, a company would need to collect data routinely on a very large set of potential indicators.Second, this approach effectively weights all indicators equally. It seems plausible that certain indicators orspecific combinations of indicators might be particularly important and should be weighted more heavily.
There are many possible techniques for multivariate modelling of suspected fraud. As a first stepwe have applied multiple regression analysis, with the suspicion rating as the dependent variable. To reducethe set of 65 independent variables to a manageable number, we included only the top 25 variables in terms
8
of the simple correlation with the outcome. We then performed all possible regressions for all subsets (up toten indicators) out of these 25 indicators and ranked the resulting models in terms of the value of R .2
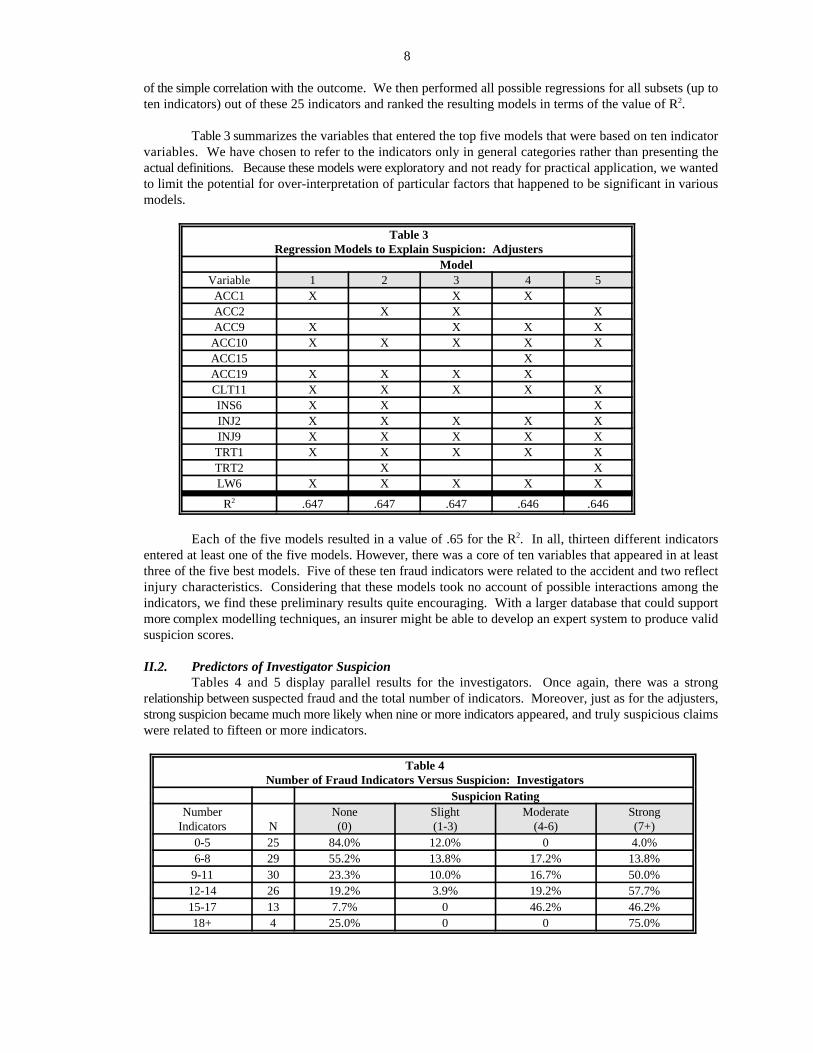
Table 3 summarizes the variables that entered the top five models that were based on ten indicatorvariables. We have chosen to refer to the indicators only in general categories rather than presenting theactual definitions. Because these models were exploratory and not ready for practical application, we wantedto limit the potential for over-interpretation of particular factors that happened to be significant in variousmodels.
Table 3Regression Models to Explain Suspicion: Adjusters
ModelVariable 1 2 3 4 5ACC1 X X XACC2 X X XACC9 X X X X
ACC10 X X X X XACC15 XACC19 X X X XCLT11 X X X X XINS6 X X XINJ2 X X X X XINJ9 X X X X XTRT1 X X X X XTRT2 X XLW6 X X X X X
R .647 .647 .647 .646 .6462
Each of the five models resulted in a value of .65 for the R . In all, thirteen different indicators2
entered at least one of the five models. However, there was a core of ten variables that appeared in at leastthree of the five best models. Five of these ten fraud indicators were related to the accident and two reflectinjury characteristics. Considering that these models took no account of possible interactions among theindicators, we find these preliminary results quite encouraging. With a larger database that could supportmore complex modelling techniques, an insurer might be able to develop an expert system to produce validsuspicion scores.
II.2. Predictors of Investigator SuspicionTables 4 and 5 display parallel results for the investigators. Once again, there was a strong
relationship between suspected fraud and the total number of indicators. Moreover, just as for the adjusters,strong suspicion became much more likely when nine or more indicators appeared, and truly suspicious claimswere related to fifteen or more indicators.
Table 4Number of Fraud Indicators Versus Suspicion: Investigators
Suspicion RatingNumber None Slight Moderate Strong
Indicators N (0) (1-3) (4-6) (7+)0-5 25 84.0% 12.0% 0 4.0%6-8 29 55.2% 13.8% 17.2% 13.8%
9-11 30 23.3% 10.0% 16.7% 50.0%12-14 26 19.2% 3.9% 19.2% 57.7%15-17 13 7.7% 0 46.2% 46.2%18+ 4 25.0% 0 0 75.0%
9
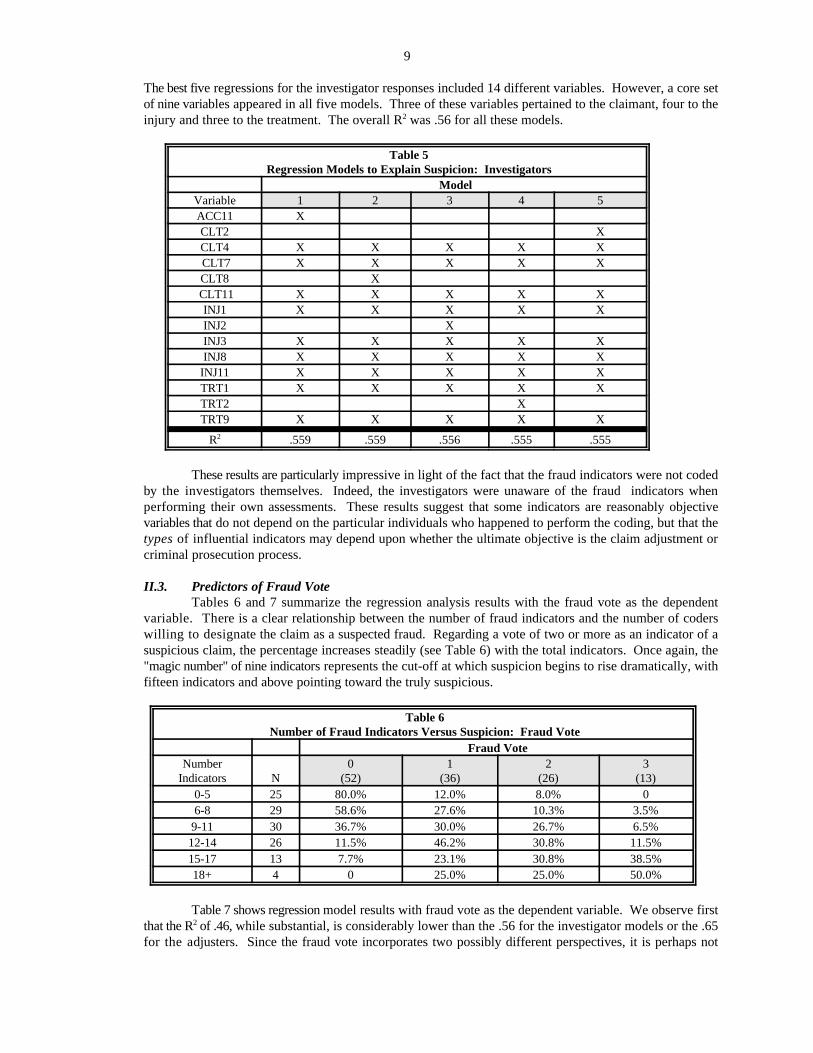
The best five regressions for the investigator responses included 14 different variables. However, a core setof nine variables appeared in all five models. Three of these variables pertained to the claimant, four to theinjury and three to the treatment. The overall R was .56 for all these models.2
Table 5Regression Models to Explain Suspicion: Investigators
ModelVariable 1 2 3 4 5ACC11 XCLT2 XCLT4 X X X X X CLT7 X X X X XCLT8 X
CLT11 X X X X XINJ1 X X X X XINJ2 XINJ3 X X X X XINJ8 X X X X X
INJ11 X X X X XTRT1 X X X X XTRT2 XTRT9 X X X X X
R .559 .559 .556 .555 .5552
These results are particularly impressive in light of the fact that the fraud indicators were not codedby the investigators themselves. Indeed, the investigators were unaware of the fraud indicators whenperforming their own assessments. These results suggest that some indicators are reasonably objectivevariables that do not depend on the particular individuals who happened to perform the coding, but that thetypes of influential indicators may depend upon whether the ultimate objective is the claim adjustment orcriminal prosecution process.
II.3. Predictors of Fraud VoteTables 6 and 7 summarize the regression analysis results with the fraud vote as the dependent
variable. There is a clear relationship between the number of fraud indicators and the number of coderswilling to designate the claim as a suspected fraud. Regarding a vote of two or more as an indicator of asuspicious claim, the percentage increases steadily (see Table 6) with the total indicators. Once again, the"magic number" of nine indicators represents the cut-off at which suspicion begins to rise dramatically, withfifteen indicators and above pointing toward the truly suspicious.
Table 6Number of Fraud Indicators Versus Suspicion: Fraud Vote
Fraud VoteNumber 0 1 2 3
Indicators N (52) (36) (26) (13)0-5 25 80.0% 12.0% 8.0% 06-8 29 58.6% 27.6% 10.3% 3.5%
9-11 30 36.7% 30.0% 26.7% 6.5%12-14 26 11.5% 46.2% 30.8% 11.5%15-17 13 7.7% 23.1% 30.8% 38.5%18+ 4 0 25.0% 25.0% 50.0%
Table 7 shows regression model results with fraud vote as the dependent variable. We observe firstthat the R of .46, while substantial, is considerably lower than the .56 for the investigator models or the .652
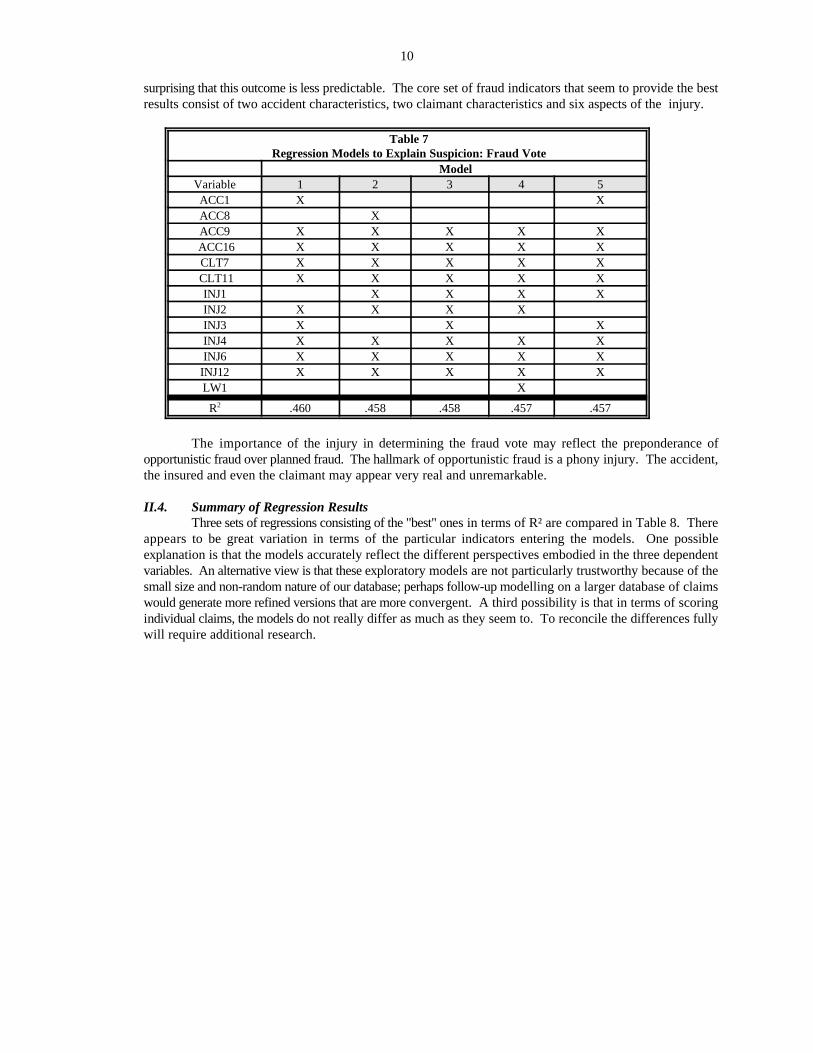
for the adjusters. Since the fraud vote incorporates two possibly different perspectives, it is perhaps not
10
surprising that this outcome is less predictable. The core set of fraud indicators that seem to provide the bestresults consist of two accident characteristics, two claimant characteristics and six aspects of the injury.
Table 7Regression Models to Explain Suspicion: Fraud Vote
ModelVariable 1 2 3 4 5ACC1 X XACC8 XACC9 X X X X X
ACC16 X X X X XCLT7 X X X X X
CLT11 X X X X XINJ1 X X X XINJ2 X X X XINJ3 X X XINJ4 X X X X XINJ6 X X X X X
INJ12 X X X X XLW1 X
R .460 .458 .458 .457 .4572
The importance of the injury in determining the fraud vote may reflect the preponderance ofopportunistic fraud over planned fraud. The hallmark of opportunistic fraud is a phony injury. The accident,the insured and even the claimant may appear very real and unremarkable.
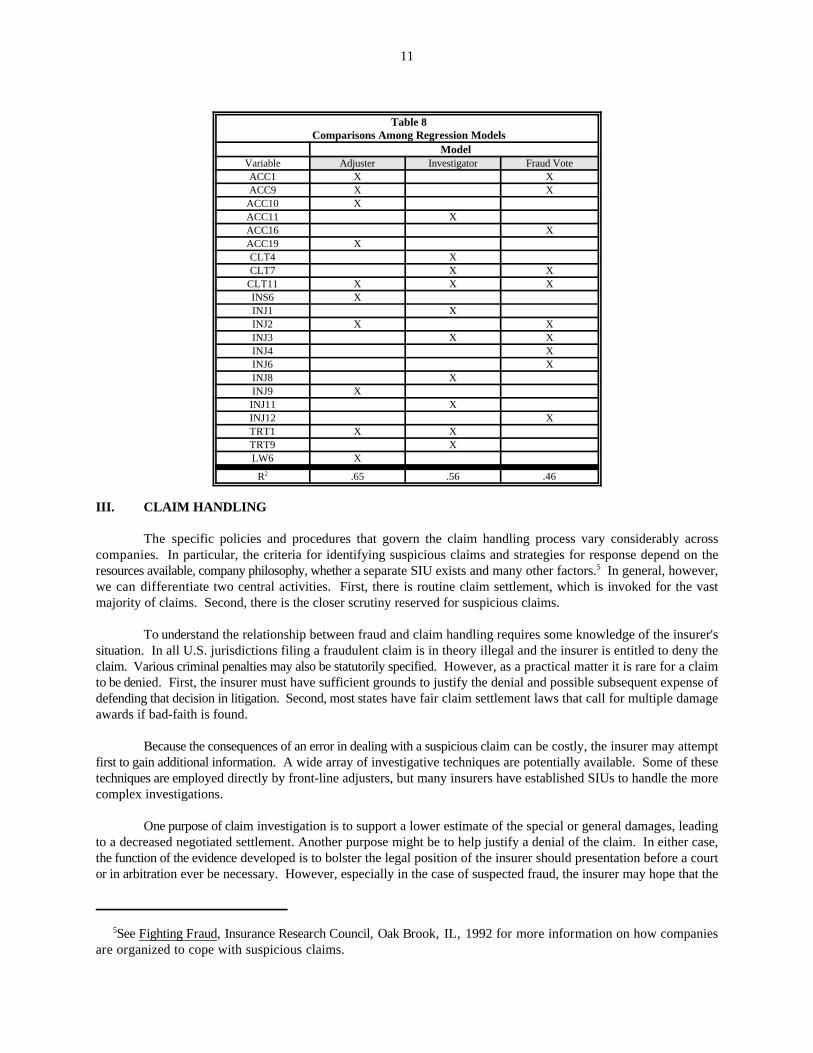
II.4. Summary of Regression ResultsThree sets of regressions consisting of the "best" ones in terms of R² are compared in Table 8. There
appears to be great variation in terms of the particular indicators entering the models. One possibleexplanation is that the models accurately reflect the different perspectives embodied in the three dependentvariables. An alternative view is that these exploratory models are not particularly trustworthy because of thesmall size and non-random nature of our database; perhaps follow-up modelling on a larger database of claimswould generate more refined versions that are more convergent. A third possibility is that in terms of scoringindividual claims, the models do not really differ as much as they seem to. To reconcile the differences fullywill require additional research.
11
See Fighting Fraud, Insurance Research Council, Oak Brook, IL, 1992 for more information on how companies5
are organized to cope with suspicious claims.
Table 8Comparisons Among Regression Models
ModelVariable Adjuster Investigator Fraud VoteACC1 X XACC9 X X
ACC10 XACC11 XACC16 XACC19 XCLT4 XCLT7 X X
CLT11 X X XINS6 XINJ1 XINJ2 X XINJ3 X XINJ4 XINJ6 XINJ8 XINJ9 XINJ11 XINJ12 XTRT1 X XTRT9 XLW6 X
R .65 .56 .462
III. CLAIM HANDLING
The specific policies and procedures that govern the claim handling process vary considerably acrosscompanies. In particular, the criteria for identifying suspicious claims and strategies for response depend on theresources available, company philosophy, whether a separate SIU exists and many other factors. In general, however,5
we can differentiate two central activities. First, there is routine claim settlement, which is invoked for the vastmajority of claims. Second, there is the closer scrutiny reserved for suspicious claims.
To understand the relationship between fraud and claim handling requires some knowledge of the insurer'ssituation. In all U.S. jurisdictions filing a fraudulent claim is in theory illegal and the insurer is entitled to deny theclaim. Various criminal penalties may also be statutorily specified. However, as a practical matter it is rare for a claimto be denied. First, the insurer must have sufficient grounds to justify the denial and possible subsequent expense ofdefending that decision in litigation. Second, most states have fair claim settlement laws that call for multiple damageawards if bad-faith is found.
Because the consequences of an error in dealing with a suspicious claim can be costly, the insurer may attemptfirst to gain additional information. A wide array of investigative techniques are potentially available. Some of thesetechniques are employed directly by front-line adjusters, but many insurers have established SIUs to handle the morecomplex investigations.
One purpose of claim investigation is to support a lower estimate of the special or general damages, leadingto a decreased negotiated settlement. Another purpose might be to help justify a denial of the claim. In either case,the function of the evidence developed is to bolster the legal position of the insurer should presentation before a courtor in arbitration ever be necessary. However, especially in the case of suspected fraud, the insurer may hope that the
12
claim will either be dropped or reduced voluntarily in the face of rigorous investigation.
It seems plausible that reliable information about suspicion of fraud would be helpful to improve decisionsabout individual claims. However, given the constraints under which insurers must operate, it is not clear whethersubstantial reductions in settlement values would result. To explore this issue, we examined claim handling techniquesand the recommendations of the adjusters and investigators for our study sample.
III.1. Effective Techniques
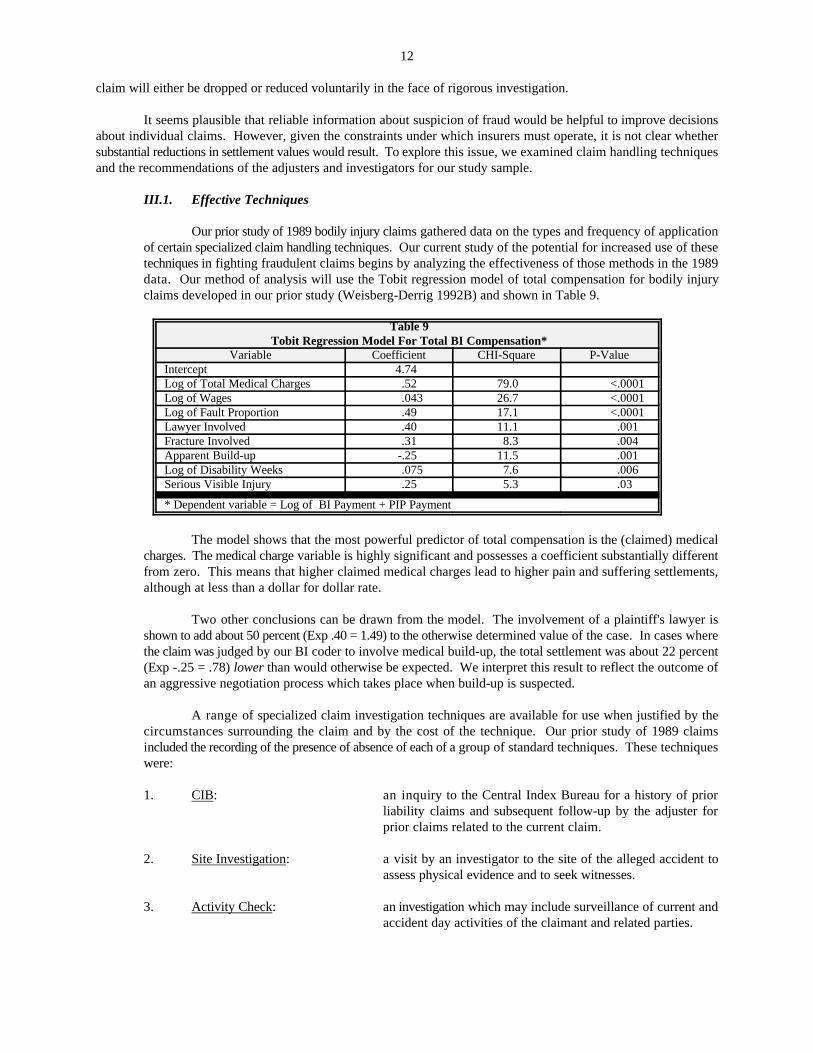
Our prior study of 1989 bodily injury claims gathered data on the types and frequency of applicationof certain specialized claim handling techniques. Our current study of the potential for increased use of thesetechniques in fighting fraudulent claims begins by analyzing the effectiveness of those methods in the 1989data. Our method of analysis will use the Tobit regression model of total compensation for bodily injuryclaims developed in our prior study (Weisberg-Derrig 1992B) and shown in Table 9.
Table 9Tobit Regression Model For Total BI Compensation*
Variable Coefficient CHI-Square P-ValueIntercept 4.74Log of Total Medical Charges .52 79.0 <.0001Log of Wages .043 26.7 <.0001Log of Fault Proportion .49 17.1 <.0001Lawyer Involved .40 11.1 .001Fracture Involved .31 8.3 .004Apparent Build-up -.25 11.5 .001Log of Disability Weeks .075 7.6 .006Serious Visible Injury .25 5.3 .03
* Dependent variable = Log of BI Payment + PIP Payment
The model shows that the most powerful predictor of total compensation is the (claimed) medicalcharges. The medical charge variable is highly significant and possesses a coefficient substantially differentfrom zero. This means that higher claimed medical charges lead to higher pain and suffering settlements,although at less than a dollar for dollar rate.
Two other conclusions can be drawn from the model. The involvement of a plaintiff's lawyer isshown to add about 50 percent (Exp .40 = 1.49) to the otherwise determined value of the case. In cases wherethe claim was judged by our BI coder to involve medical build-up, the total settlement was about 22 percent(Exp -.25 = .78) lower than would otherwise be expected. We interpret this result to reflect the outcome ofan aggressive negotiation process which takes place when build-up is suspected.
A range of specialized claim investigation techniques are available for use when justified by thecircumstances surrounding the claim and by the cost of the technique. Our prior study of 1989 claimsincluded the recording of the presence of absence of each of a group of standard techniques. These techniqueswere:
1. CIB: an inquiry to the Central Index Bureau for a history of priorliability claims and subsequent follow-up by the adjuster forprior claims related to the current claim.
2. Site Investigation: a visit by an investigator to the site of the alleged accident toassess physical evidence and to seek witnesses.
3. Activity Check: an investigation which may include surveillance of current andaccident day activities of the claimant and related parties.

13
4. IME: an independent medical examination which may be ordered toassess injuries and treatment.
5. Examination Under Oath: a sworn statement taken under penalties of perjury to establishthe facts of the case.
6. Special Investigation: any investigation beyond routine claim handling, including butnot limited to those performed by Special Investigation Units("SIU").
7. Alternative Dispute Resolution: the use of any of several alternative dispute resolution ("ADR")techniques including arbitration and mediation.
8. Medical Audits: the review of claimed medical charges by medically trainedprofessionals.
9. Wage Verification: the review of claimed wage loss by verifying various documentsrelating to the claimants earnings.
While the application of each technique will add to the information base for adjusting the claim, thedirect effect on the claim settlement value has not been measured previously.
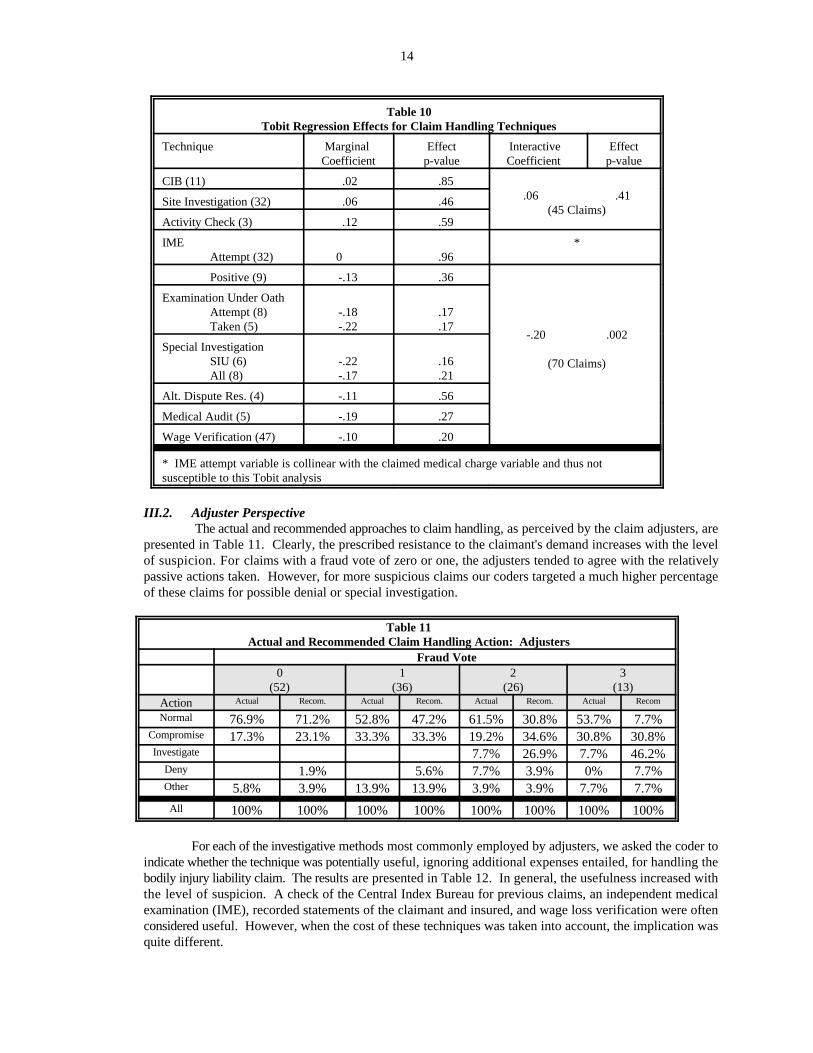
The effect of the specialized claim handling techniques on settlements is measured by adding eachas a variable to the Tobit model of Table 9. The marginal results of adding the techniques one at a time isshown in Table 10. They suggest that some techniques when applied reduce the total compensation whileothers do not. Unfortunately, the small size of our sample (176 claims) and the rarity of some of the claimshandling methods (as little as 3 in 176) do not permit reliable one-variable marginal effect analysis.
Grouping similarly effective methods together allows the conclusion that the combined effect ofindependent medical exams with positive (failure to confirm the alleged injury or treatment) findings,examinations under oath, special investigations, medical audits and wage verifications is a significant 18percent (Exp -.20 = .82) reduction in the total settlement. Little or no significant claim amount effect isshown by using the CIB data on prior claims, site investigations, or activity checks. The mere attempt toobtain an independent medical examination is also effective but cannot be shown as such by this analysis.Specialized claim handling techniques clearly are having a desirable effect on claim amounts. The questionremains whether more aggressive use of the effective techniques will produce better results. The data fromthe current study is analyzed next.
14
Table 10Tobit Regression Effects for Claim Handling Techniques
Technique Marginal Effect Interactive EffectCoefficient p-value Coefficient p-value
CIB (11) .02 .85.06 .41
(45 Claims)Site Investigation (32) .06 .46
Activity Check (3) .12 .59
IME *Attempt (32) 0 .96
Positive (9) -.13 .36
-.20 .002
(70 Claims)
Examination Under OathAttempt (8) -.18 .17Taken (5) -.22 .17
Special InvestigationSIU (6) -.22 .16All (8) -.17 .21
Alt. Dispute Res. (4) -.11 .56
Medical Audit (5) -.19 .27
Wage Verification (47) -.10 .20
* IME attempt variable is collinear with the claimed medical charge variable and thus notsusceptible to this Tobit analysis
III.2. Adjuster Perspective The actual and recommended approaches to claim handling, as perceived by the claim adjusters, are
presented in Table 11. Clearly, the prescribed resistance to the claimant's demand increases with the levelof suspicion. For claims with a fraud vote of zero or one, the adjusters tended to agree with the relativelypassive actions taken. However, for more suspicious claims our coders targeted a much higher percentageof these claims for possible denial or special investigation.
Table 11Actual and Recommended Claim Handling Action: Adjusters
Fraud Vote0 1 2 3
(52) (36) (26) (13)Action Actual Recom. Actual Recom. Actual Recom. Actual Recom
Normal 76.9% 71.2% 52.8% 47.2% 61.5% 30.8% 53.7% 7.7%Compromise 17.3% 23.1% 33.3% 33.3% 19.2% 34.6% 30.8% 30.8%Investigate 7.7% 26.9% 7.7% 46.2%
Deny 1.9% 5.6% 7.7% 3.9% 0% 7.7%Other 5.8% 3.9% 13.9% 13.9% 3.9% 3.9% 7.7% 7.7%
All 100% 100% 100% 100% 100% 100% 100% 100%
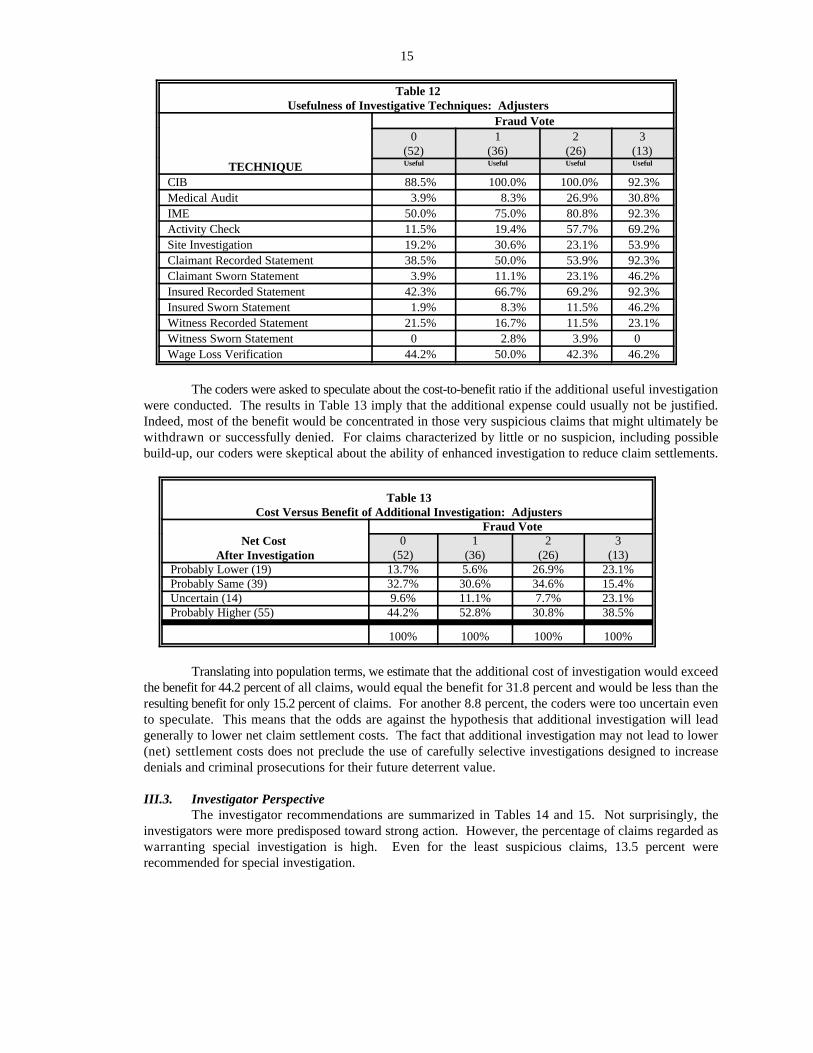
For each of the investigative methods most commonly employed by adjusters, we asked the coder toindicate whether the technique was potentially useful, ignoring additional expenses entailed, for handling thebodily injury liability claim. The results are presented in Table 12. In general, the usefulness increased withthe level of suspicion. A check of the Central Index Bureau for previous claims, an independent medicalexamination (IME), recorded statements of the claimant and insured, and wage loss verification were oftenconsidered useful. However, when the cost of these techniques was taken into account, the implication wasquite different.
15
Table 12Usefulness of Investigative Techniques: Adjusters
Fraud Vote0 1 2 3
(52) (36) (26) (13)TECHNIQUE Useful Useful Useful Useful
CIB 88.5% 100.0% 100.0% 92.3%Medical Audit 3.9% 8.3% 26.9% 30.8%IME 50.0% 75.0% 80.8% 92.3%Activity Check 11.5% 19.4% 57.7% 69.2%Site Investigation 19.2% 30.6% 23.1% 53.9%Claimant Recorded Statement 38.5% 50.0% 53.9% 92.3%Claimant Sworn Statement 3.9% 11.1% 23.1% 46.2%Insured Recorded Statement 42.3% 66.7% 69.2% 92.3%Insured Sworn Statement 1.9% 8.3% 11.5% 46.2%Witness Recorded Statement 21.5% 16.7% 11.5% 23.1%Witness Sworn Statement 0 2.8% 3.9% 0Wage Loss Verification 44.2% 50.0% 42.3% 46.2%
The coders were asked to speculate about the cost-to-benefit ratio if the additional useful investigationwere conducted. The results in Table 13 imply that the additional expense could usually not be justified.Indeed, most of the benefit would be concentrated in those very suspicious claims that might ultimately bewithdrawn or successfully denied. For claims characterized by little or no suspicion, including possiblebuild-up, our coders were skeptical about the ability of enhanced investigation to reduce claim settlements.
Table 13Cost Versus Benefit of Additional Investigation: Adjusters
Fraud VoteNet Cost
After Investigation0 1 2 3
(52) (36) (26) (13)Probably Lower (19) 13.7% 5.6% 26.9% 23.1%Probably Same (39) 32.7% 30.6% 34.6% 15.4%Uncertain (14) 9.6% 11.1% 7.7% 23.1%Probably Higher (55) 44.2% 52.8% 30.8% 38.5%
100% 100% 100% 100%
Translating into population terms, we estimate that the additional cost of investigation would exceedthe benefit for 44.2 percent of all claims, would equal the benefit for 31.8 percent and would be less than theresulting benefit for only 15.2 percent of claims. For another 8.8 percent, the coders were too uncertain evento speculate. This means that the odds are against the hypothesis that additional investigation will leadgenerally to lower net claim settlement costs. The fact that additional investigation may not lead to lower(net) settlement costs does not preclude the use of carefully selective investigations designed to increasedenials and criminal prosecutions for their future deterrent value.
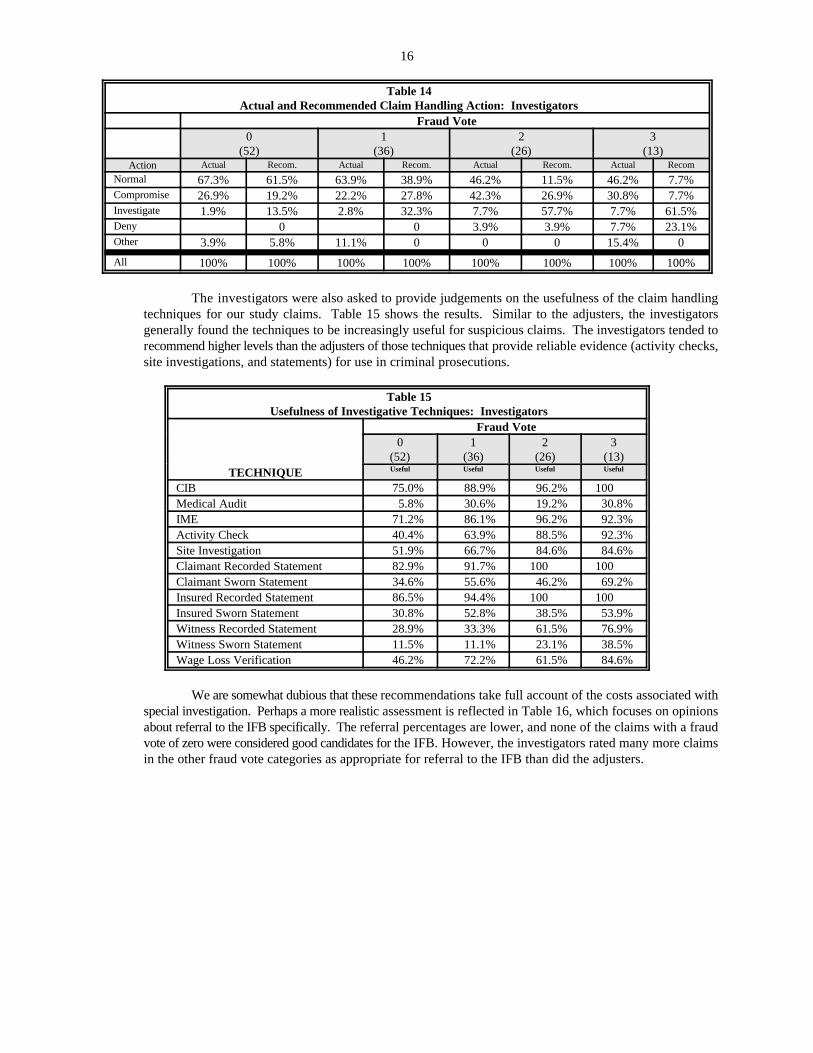
III.3. Investigator PerspectiveThe investigator recommendations are summarized in Tables 14 and 15. Not surprisingly, the
investigators were more predisposed toward strong action. However, the percentage of claims regarded aswarranting special investigation is high. Even for the least suspicious claims, 13.5 percent wererecommended for special investigation.
16
Table 14Actual and Recommended Claim Handling Action: Investigators
Fraud Vote0 1 2 3
(52) (36) (26) (13)Action Actual Recom. Actual Recom. Actual Recom. Actual Recom
Normal 67.3% 61.5% 63.9% 38.9% 46.2% 11.5% 46.2% 7.7%Compromise 26.9% 19.2% 22.2% 27.8% 42.3% 26.9% 30.8% 7.7%Investigate 1.9% 13.5% 2.8% 32.3% 7.7% 57.7% 7.7% 61.5%Deny 0 0 3.9% 3.9% 7.7% 23.1%Other 3.9% 5.8% 11.1% 0 0 0 15.4% 0
All 100% 100% 100% 100% 100% 100% 100% 100%
The investigators were also asked to provide judgements on the usefulness of the claim handlingtechniques for our study claims. Table 15 shows the results. Similar to the adjusters, the investigatorsgenerally found the techniques to be increasingly useful for suspicious claims. The investigators tended torecommend higher levels than the adjusters of those techniques that provide reliable evidence (activity checks,site investigations, and statements) for use in criminal prosecutions.
Table 15Usefulness of Investigative Techniques: Investigators
Fraud Vote0 1 2 3
(52) (36) (26) (13)TECHNIQUE Useful Useful Useful Useful
CIB 75.0% 88.9% 96.2% 100Medical Audit 5.8% 30.6% 19.2% 30.8%IME 71.2% 86.1% 96.2% 92.3%Activity Check 40.4% 63.9% 88.5% 92.3%Site Investigation 51.9% 66.7% 84.6% 84.6%Claimant Recorded Statement 82.9% 91.7% 100 100Claimant Sworn Statement 34.6% 55.6% 46.2% 69.2%Insured Recorded Statement 86.5% 94.4% 100 100Insured Sworn Statement 30.8% 52.8% 38.5% 53.9%Witness Recorded Statement 28.9% 33.3% 61.5% 76.9%Witness Sworn Statement 11.5% 11.1% 23.1% 38.5%Wage Loss Verification 46.2% 72.2% 61.5% 84.6%
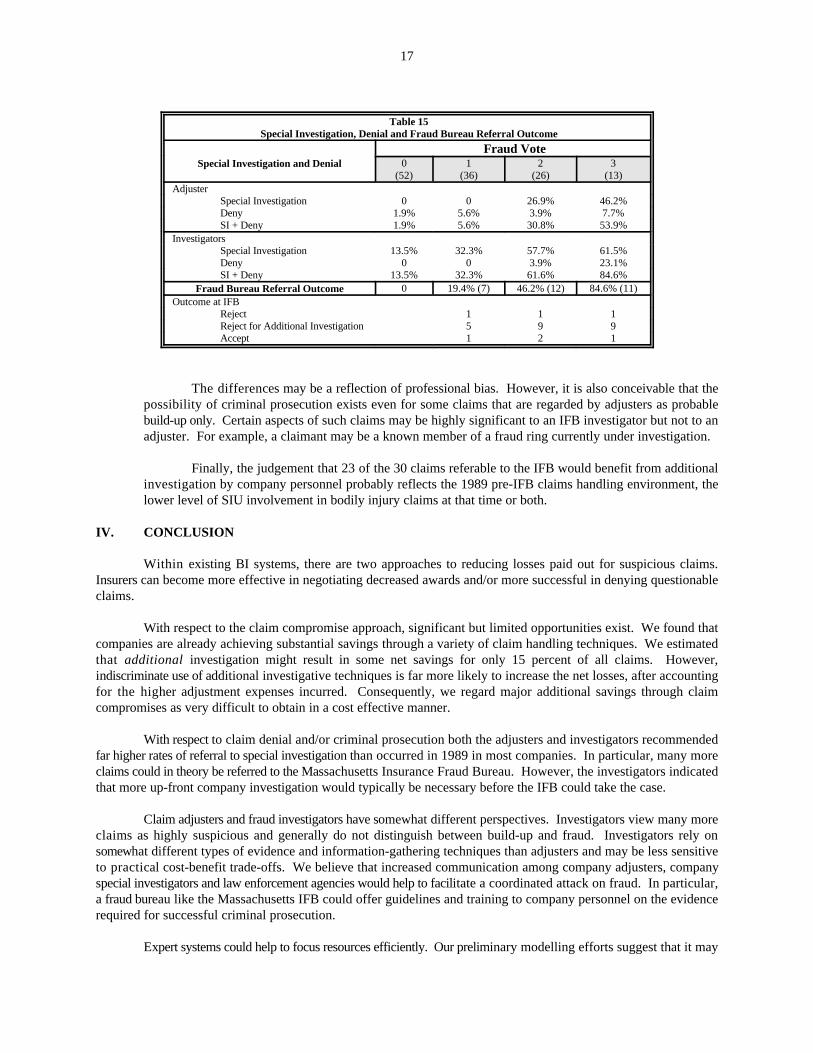
We are somewhat dubious that these recommendations take full account of the costs associated withspecial investigation. Perhaps a more realistic assessment is reflected in Table 16, which focuses on opinionsabout referral to the IFB specifically. The referral percentages are lower, and none of the claims with a fraudvote of zero were considered good candidates for the IFB. However, the investigators rated many more claimsin the other fraud vote categories as appropriate for referral to the IFB than did the adjusters.
17
Table 15Special Investigation, Denial and Fraud Bureau Referral Outcome
Fraud VoteSpecial Investigation and Denial 0 1 2 3
(52) (36) (26) (13)Adjuster
Special Investigation 0 0 26.9% 46.2%Deny 1.9% 5.6% 3.9% 7.7%SI + Deny 1.9% 5.6% 30.8% 53.9%
InvestigatorsSpecial Investigation 13.5% 32.3% 57.7% 61.5%Deny 0 0 3.9% 23.1%SI + Deny 13.5% 32.3% 61.6% 84.6%
Fraud Bureau Referral Outcome 0 19.4% (7) 46.2% (12) 84.6% (11)Outcome at IFB
Reject 1 1 1Reject for Additional Investigation 5 9 9Accept 1 2 1
The differences may be a reflection of professional bias. However, it is also conceivable that thepossibility of criminal prosecution exists even for some claims that are regarded by adjusters as probablebuild-up only. Certain aspects of such claims may be highly significant to an IFB investigator but not to anadjuster. For example, a claimant may be a known member of a fraud ring currently under investigation.
Finally, the judgement that 23 of the 30 claims referable to the IFB would benefit from additionalinvestigation by company personnel probably reflects the 1989 pre-IFB claims handling environment, thelower level of SIU involvement in bodily injury claims at that time or both.
IV. CONCLUSION
Within existing BI systems, there are two approaches to reducing losses paid out for suspicious claims.Insurers can become more effective in negotiating decreased awards and/or more successful in denying questionableclaims.
With respect to the claim compromise approach, significant but limited opportunities exist. We found thatcompanies are already achieving substantial savings through a variety of claim handling techniques. We estimatedthat additional investigation might result in some net savings for only 15 percent of all claims. However,indiscriminate use of additional investigative techniques is far more likely to increase the net losses, after accountingfor the higher adjustment expenses incurred. Consequently, we regard major additional savings through claimcompromises as very difficult to obtain in a cost effective manner.
With respect to claim denial and/or criminal prosecution both the adjusters and investigators recommendedfar higher rates of referral to special investigation than occurred in 1989 in most companies. In particular, many moreclaims could in theory be referred to the Massachusetts Insurance Fraud Bureau. However, the investigators indicatedthat more up-front company investigation would typically be necessary before the IFB could take the case.
Claim adjusters and fraud investigators have somewhat different perspectives. Investigators view many moreclaims as highly suspicious and generally do not distinguish between build-up and fraud. Investigators rely onsomewhat different types of evidence and information-gathering techniques than adjusters and may be less sensitiveto practical cost-benefit trade-offs. We believe that increased communication among company adjusters, companyspecial investigators and law enforcement agencies would help to facilitate a coordinated attack on fraud. In particular,a fraud bureau like the Massachusetts IFB could offer guidelines and training to company personnel on the evidencerequired for successful criminal prosecution.
Expert systems could help to focus resources efficiently. Our preliminary modelling efforts suggest that it may
18
be possible to screen claims automatically based on so-called fraud indicators. Claims that appear clearly legitimatecould be expedited, and those that rise above a pre-determined threshold of suspicion could be considered for specialinvestigation or outright denial. To construct and operate such a system, a company would need to collect data onrelevant fraud indicators for all claims and track the results of claim handling, a costly enterprise. However, theresulting database on claim characteristics and outcomes would provide the basis for identifying specific patterns ofsuspicion, for refining the identification process through continual analysis of the results, and for evaluating theeffectiveness of cost-containment initiatives.
While enhanced investigation selectively applied would be of great value in individual cases, we arepessimistic that this approach can solve the fraud problem. It is simply unrealistic to expect that more than a fewpercent of claims could ever be denied or discouraged under our current system. In our opinion, making a major dentin build-up and most opportunistic fraud will require more fundamental changes.
At present, insurers believe that attempts to resist or sharply compromise claims entail substantial risks.Litigation is expensive and courts may impose harsh bad-faith penalties on top of large demands for general damages.Unless these perceived risks can be reduced, either through changes in the tort system itself or changes in bad faithpenalties, insurers will remain understandably reluctant to confront claimants except in the most flagrant situations.
We have suggested elsewhere that one solution lies in eliminating the economic incentives that now encourageabuse. For example, a strong no-fault law could remove for most minor injuries the general damage pot-of-gold.Alternatively, pain and suffering awards for soft-tissue injuries could be limited by statute. Severing the connectionbetween the volume of medical treatment and inordinate financial gain is the key to containing claim costs. For manysubjectively diagnosed injuries, medical treatment expenses are largely at the discretion of the claimant and provider,and no longer represent a valid measure of injury severity.
Regulators can play a critical role in facilitating solutions by recognizing that insurers are presently caughtbetween the competing pressures of fair claim practices and cost containment. Fraud cannot be pursued aggressivelywithout incurring certain expenses and risks. Regulators can encourage innovation by providing incentives that rewardexperimentation to find viable answers.
19
REFERENCES
Derrig, Richard A., and Krzystof M. Ostaszewski, 1995, “Fuzzy Techniques in Pattern Recognition in Risk and ClaimClassification”, Journal of Risk and Insurance, 62:447-483.
Derrig, Richard A., Weisberg, Herbert I. and Chen, Xiu, 1994, Behavioral Factors and Lotteries Under No-Fault witha Monetary Threshold: A Study of Massachusetts Automobile Claims, Journal of Risk & Insurance, 61:245-275.
Insurance Research Council, 1992, "Fighting Fraud," Wheaton, Illinois.
Ostaszewski, Krzystof M., 1993, Fuzzy Set Methods in Actuarial Science, Society of Actuaries, Schaumburg, IL.
Skinner, C.J., D. Holt and T.M.F. Smith, 1989, Analysis of Complex Surveys, New York, John Wiley & Sons.
Weisberg, Herbert I. and Richard A. Derrig, 1991, "Fraud and Automobile Insurance: A Report on the Baseline Studyof Bodily Injury Claims in Massachusetts," Journal of Insurance Regulation, 9: 427-541.
Weisberg, Herbert I. and Richard A. Derrig, 1992A, "Massachusetts Automobile Bodily Injury Tort Reform," Journalof Insurance Regulation, 10: 384-440.
Weisberg, Herbert I. and Richard A. Derrig, 1992B, "Compensation for Automobile Injuries Under No-Fault with aMonetary Threshold: A Study of Massachusetts Claims," AIB Filing for 1993 Private Passenger AutomobileRates, DOI Docket G92-21, pp. 28-94.
Weisberg, Herbert I. and Richard A. Derrig, 1992C, "The System Misfired," Best's Review, December: 37-40 and 87.
APPENDIX
QUANTITATIVE METHODS FOR DETECTING FRAUDULENTAUTOMOBILE BODILY INJURY CLAIMS
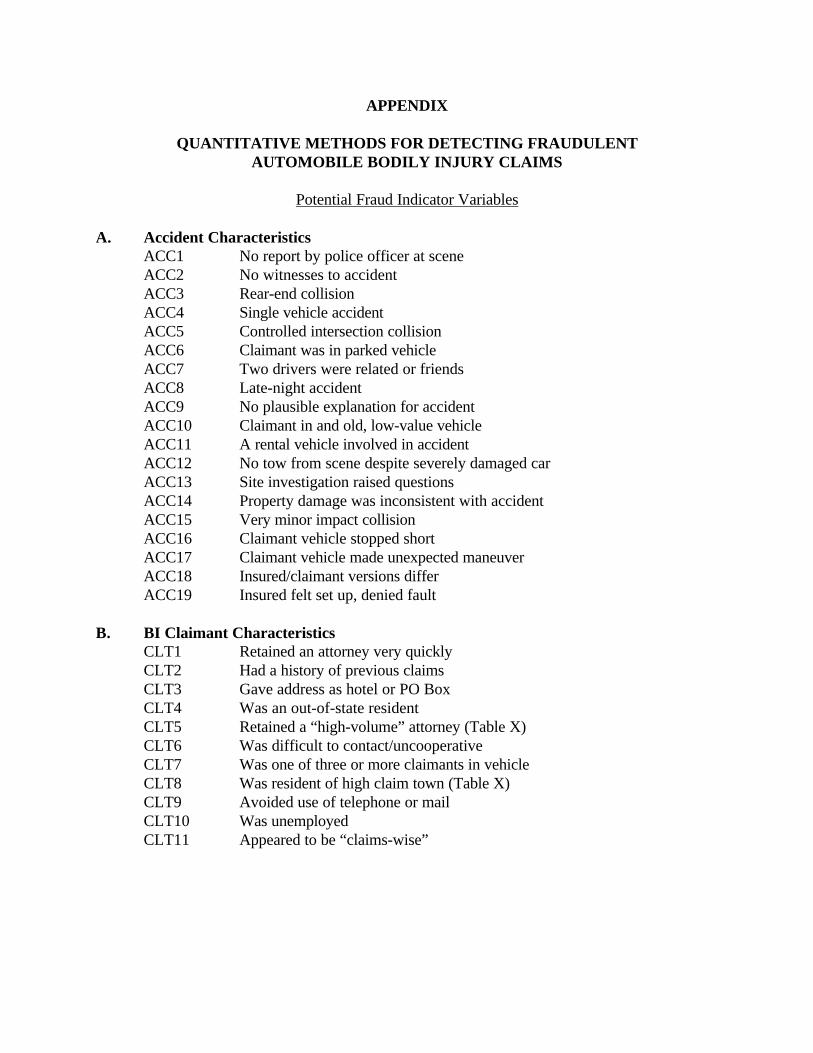
Potential Fraud Indicator Variables
A. Accident CharacteristicsACC1 No report by police officer at sceneACC2 No witnesses to accidentACC3 Rear-end collisionACC4 Single vehicle accidentACC5 Controlled intersection collisionACC6 Claimant was in parked vehicleACC7 Two drivers were related or friendsACC8 Late-night accidentACC9 No plausible explanation for accidentACC10 Claimant in and old, low-value vehicleACC11 A rental vehicle involved in accidentACC12 No tow from scene despite severely damaged carACC13 Site investigation raised questionsACC14 Property damage was inconsistent with accidentACC15 Very minor impact collisionACC16 Claimant vehicle stopped shortACC17 Claimant vehicle made unexpected maneuverACC18 Insured/claimant versions differACC19 Insured felt set up, denied fault
B. BI Claimant CharacteristicsCLT1 Retained an attorney very quicklyCLT2 Had a history of previous claimsCLT3 Gave address as hotel or PO BoxCLT4 Was an out-of-state residentCLT5 Retained a “high-volume” attorney (Table X)CLT6 Was difficult to contact/uncooperativeCLT7 Was one of three or more claimants in vehicleCLT8 Was resident of high claim town (Table X)CLT9 Avoided use of telephone or mailCLT10 Was unemployedCLT11 Appeared to be “claims-wise”
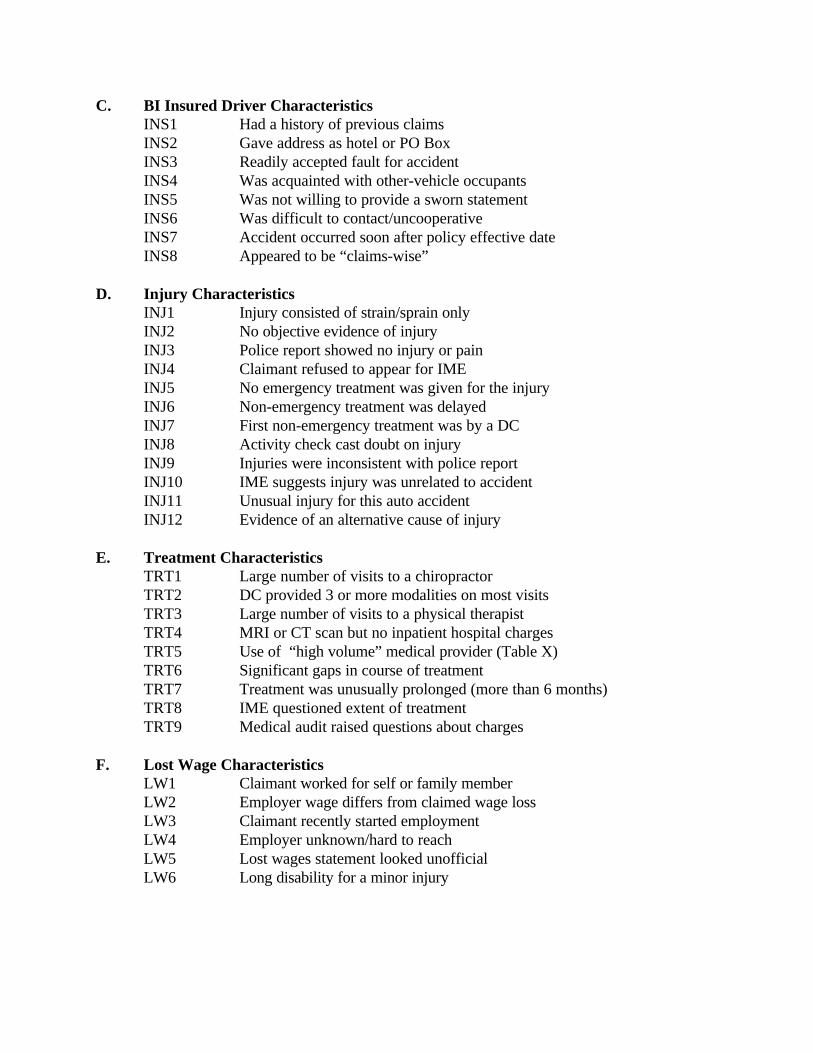
C. BI Insured Driver Characteristics INS1 Had a history of previous claims
INS2 Gave address as hotel or PO BoxINS3 Readily accepted fault for accidentINS4 Was acquainted with other-vehicle occupantsINS5 Was not willing to provide a sworn statementINS6 Was difficult to contact/uncooperativeINS7 Accident occurred soon after policy effective dateINS8 Appeared to be “claims-wise”
D. Injury CharacteristicsINJ1 Injury consisted of strain/sprain onlyINJ2 No objective evidence of injuryINJ3 Police report showed no injury or painINJ4 Claimant refused to appear for IMEINJ5 No emergency treatment was given for the injuryINJ6 Non-emergency treatment was delayedINJ7 First non-emergency treatment was by a DCINJ8 Activity check cast doubt on injuryINJ9 Injuries were inconsistent with police reportINJ10 IME suggests injury was unrelated to accidentINJ11 Unusual injury for this auto accidentINJ12 Evidence of an alternative cause of injury
E. Treatment CharacteristicsTRT1 Large number of visits to a chiropractorTRT2 DC provided 3 or more modalities on most visitsTRT3 Large number of visits to a physical therapistTRT4 MRI or CT scan but no inpatient hospital chargesTRT5 Use of “high volume” medical provider (Table X)TRT6 Significant gaps in course of treatmentTRT7 Treatment was unusually prolonged (more than 6 months)TRT8 IME questioned extent of treatmentTRT9 Medical audit raised questions about charges
F. Lost Wage CharacteristicsLW1 Claimant worked for self or family memberLW2 Employer wage differs from claimed wage lossLW3 Claimant recently started employmentLW4 Employer unknown/hard to reachLW5 Lost wages statement looked unofficialLW6 Long disability for a minor injury


![Abstract arXiv:1411.6721v1 [cs.CR] 25 Nov 2014 · Detecting fraudulent activity in a cloud using privacy-friendly data aggregates Marc Solanasa, Julio Hernandez-Castrob, Debojyoti](https://img.dokumen.tips/doc/110x75/5f182c95b1e62d26d11ca28e/abstract-arxiv14116721v1-cscr-25-nov-2014-detecting-fraudulent-activity-in.jpg)


![Detecting Fraudulent Personalities in Networks of Online ...dchau/papers/auction_fraud_pkdd...eBay test data [2]. The feature values can be extracted from the profiles and transaction](https://img.dokumen.tips/doc/110x75/6024f6e707817865af6c6e93/detecting-fraudulent-personalities-in-networks-of-online-dchaupapersauctionfraudpkdd.jpg)