Embed Size (px)
Citation preview

QUANTITATIVE DATA
chapter 4
(NUMERICAL)

Slide 4- 2
Categorical variablesCategorical variables(also called “qua“quallitative”itative”)Data that are NOT numerical or…Data that are numbers, but makes makes no sense to take an averageno sense to take an averagesuch as…
phone number… student ID number…
zip code… etc.

Slide 4- 3
Numerical variablesNumerical variables(also called “qua“quantntitative”itative”)makes sense to averagemakes sense to averagetwo types:
discrete & continuousdiscrete & continuous
Slide 4- 4
Discrete Discrete (numerical)(numerical)List-able set of values
usually countscounts of itemsexample: number of students in a class
grades on a test
price of gas (per gallon)

Slide 4- 5
ContinuousContinuous (numerical) (numerical) data can take on any values any values in the
domain of the variable usually measurementsmeasurements of somethingexamples: - thickness of cell phones
- temperature- amount of time you’ve been alive
(NO LIMIT to number of decimal places for possible values)
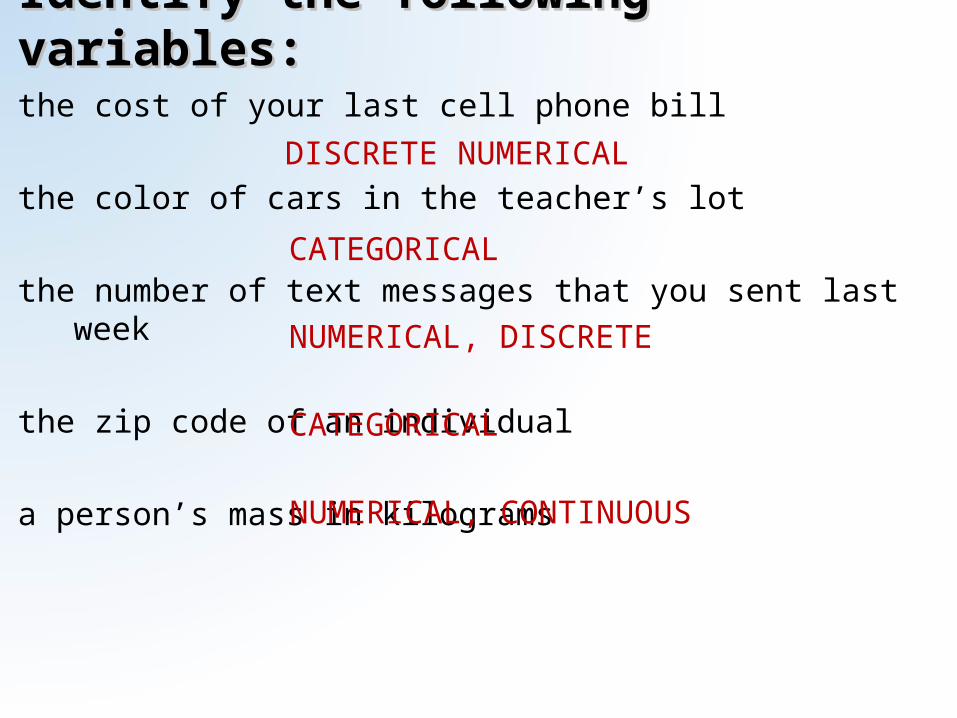
Identify the following variables:Identify the following variables:the cost of your last cell phone bill
the color of cars in the teacher’s lot
the number of text messages that you sent last week
the zip code of an individual
a person’s mass in kilograms
DISCRETE NUMERICAL
NUMERICAL, DISCRETE
NUMERICAL, CONTINUOUS
CATEGORICAL
CATEGORICAL

DotplotsDotplots
1.0 2.0 3.0 4.0Number
Pick a "random" number Dot Plot
Dot plots work well for relatively small relatively small data sets (50 or less)(50 or less)
Dot plots work well for relatively small relatively small data sets (50 or less)(50 or less)
MPG15 20 25 30 35 40 45 50
Highway MPG Dot Plot

Slide 4- 8
What’s wrong with this picture?!!What’s wrong with this picture?!!
Too much data Too much data for a dot plotfor a dot plot!!
FYGPA0.0 0.5 1.0 1.5 2.0 2.5 3.0 3.5 4.0 4.5
SATGPA Dot Plot
Co
un
t
20
40
60
80
100
120
140
FYGPA0.0 0.5 1.0 1.5 2.0 2.5 3.0 3.5 4.0 4.5
SATGPA Histogram
The histogram works The histogram works much better!much better!

DOTPLOT of test scores
Test155 60 65 70 75 80 85 90 95 100 105
Pre-AP Algebra II Dot Plot

How to read a HISTOGRAM
12345678
Test155 60 65 70 75 80 85 90 95 100 105
Pre-AP Algebra II Histogram
2 test scores were≥100 but <105
3 test scores were≥65 but <70

Slide 4- 11
Changing a histogram’s BIN WIDTH
0 5 10 15 20 25 30 35hair_length (inches)
AP Statistics Classes at McNeil High School, 2011-12 Dot Plot
5
10
15
20
25
30
0 5 10 15 20 25 30 35hair_length (inches)
AP Statistics Classes at McNeil High School, 2011-12 Histogram
bin width = 0.5bin width = 0.5
5
10
15
20
25
30
0 5 10 15 20 25 30 35hair_length (inches)
AP Statistics Classes at McNeil High School, 2011-12 Histogram
bin width = 1.0bin width = 1.0
5
10
15
20
25
30
0 5 10 15 20 25 30 35hair_length (inches)
AP Statistics Classes at McNeil High School, 2011-12 Histogram
bin width = 2.0bin width = 2.0
10
20
30
40
50
60
0 5 10 15 20 25 30 35hair_length (inches)
AP Statistics Classes at McNeil High School, 2011-12 Histogram
bin width = 5.0bin width = 5.0

HISTOGRAM vs BAR GRAPHS
12345678
Test155 60 65 70 75 80 85 90 95 100 105
Pre-AP Algebra II Histogram
HISTOGRAMSare for NUMERICAL data
BAR GRAPHS are for CATEGORICAL data

Spread Spread (min & max values)(min & max values)
CUSSCUSS and and BSBSCenter Center (modes)(modes)
Unusual Features Unusual Features (gaps, possible outliers)(gaps, possible outliers)
Shape Shape (symmetric? skewed? uniform?)(symmetric? skewed? uniform?)
and and Be SpecificBe Specific!!
(describing distributions)(describing distributions)

Slide 4- 14
A A unimodalunimodal histogram…histogram…
Co
un
t
20
40
60
80
100
120
140
FYGPA0.0 0.5 1.0 1.5 2.0 2.5 3.0 3.5 4.0 4.5
SATGPA Histogram

Slide 4- 15
A A bimodalbimodal histogram has two apparent peaks:histogram has two apparent peaks:
Slide 4- 16
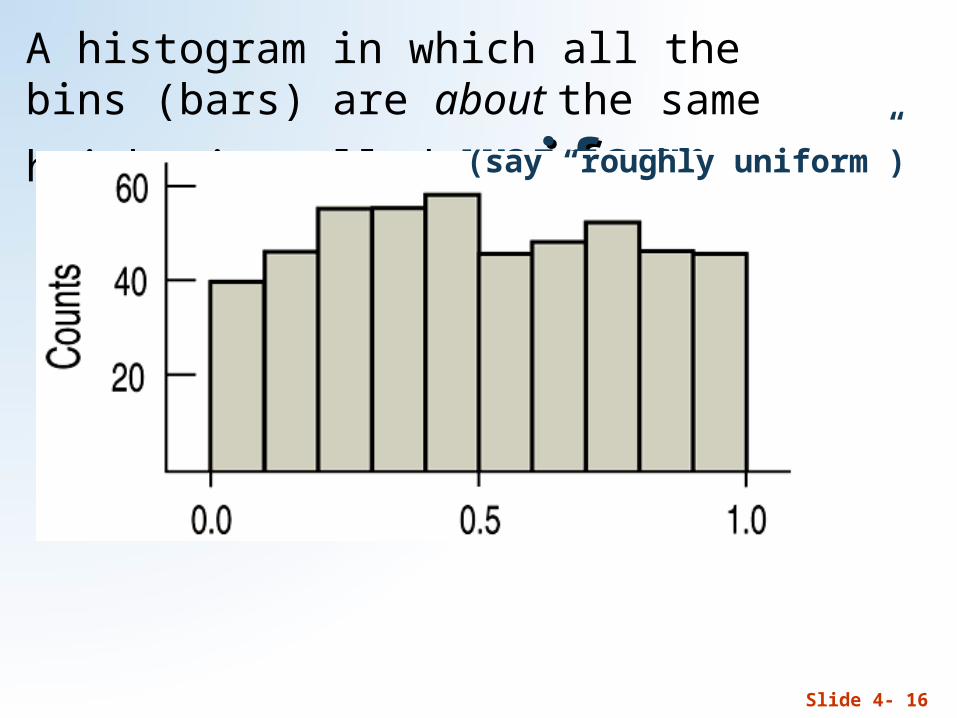
A histogram in which all the bins (bars) are
about the same height is called uniformuniform..(say “roughly uniform”)

Slide 4- 17
ShapeShapeIs the histogram symmetricsymmetric?
ALWAYSALWAYS say “approximatelyapproximately symmetric” or “roughlyroughly symmetric”(unless it truly is perfectlyperfectly symmetric)

Slide 4- 18
Skewed to the left/rightSkewed to the left/rightThe thinner ends of a distribution are called tailstails.
Skewed to the left Skewed to the right(to the lower “numbers”) (to the higher “numbers”)

Slide 4- 19
Anything Unusual? Anything Unusual? The following histogram has possiblepossible outliers outliers—
there are three cities in the leftmost bin:
It’s a good idea to say It’s a good idea to say “possible” outliers. “possible” outliers. Next time we will learn Next time we will learn how to test for outliers.how to test for outliers.
It’s a good idea to say It’s a good idea to say “possible” outliers. “possible” outliers. Next time we will learn Next time we will learn how to test for outliers.how to test for outliers.

Slide 4- 20
CUSSing & BS-ing practiceCUSSing & BS-ing practice
Co
un
t
5
10
15
20
25
30
Quiz30 40 50 60 70 80 90 100 110
Collection 1 Histogram• Center: This distribution of quiz scores appears to have two modes, one at around 55, and another at around 80.
• Shape: The shape is bimodal, and around each mode the shape is roughly symmetric.
• Spread: The spread is from the mid-30’s to the mid-90’s.
• Unusual features: There is a gap in the lower 40’s, with a possible outlier in the mid 30’s.

Slide 4- 21
more CUSSing & BS-ing…more CUSSing & BS-ing…
Co
un
t
5
10
15
20
25
30
Grades60 70 80 90 100
Collection 1 Histogram• Center: This distribution of grades has a single mode at around 100.
• Shape: The shape is unimodal and skewed to the left (to the lower grades)
• Spread: The spread is from the mid-50’s to about 100.
• Unusual features: There is a gap from the upper 50’s to the upper 60’s, with a possible outlier in the mid 50’s.
this does NOT mean this does NOT mean that someone had a that someone had a grade of above 100.grade of above 100.(more likely, a lot of 98’s (more likely, a lot of 98’s and/or 99’s)and/or 99’s)
this does NOT mean this does NOT mean that someone had a that someone had a grade of above 100.grade of above 100.(more likely, a lot of 98’s (more likely, a lot of 98’s and/or 99’s)and/or 99’s)

Slide 4- 22
Comparing DistributionsComparing Distributions
CompareCompare the following distributions of ages for female and male heart attack patients.

Slide 4- 23
Comparing DistributionsComparing DistributionsBe sure to use language of Be sure to use language of
comparisoncomparison..•Center:Center: This distribution of ages for females has a higher center (at around 78) than the distribution for male patients (around 62).•Shape:Shape: Both distributions are unimodal. The distribution for males is nearly symmetric, while the distribution for females is slightly skewed to the lower ages.

Slide 4- 24
Comparing DistributionsComparing Distributions• Spread:Spread: Both distributions
have similar spreads: females from around 30 – 100, and males from about 24 – 96. Overall, the distribution for female ages is slightly higher than that for male ages.
• (There are no unusual unusual featuresfeatures)
• YOU MUST USE YOU MUST USE COMPLETE COMPLETE SENTENCES!!!SENTENCES!!!

STEM PLOTS

U.S. Presidents – Stem & Leaf PlotU.S. Presidents – Stem & Leaf PlotMake a stem & leaf plot of age of…Make a stem & leaf plot of age of…

U.S. PresidentsU.S. Presidents
meansage 43 at inaugurationage 46 at death
6*
43

U.S. PresidentsU.S. Presidents
(looks like a histogram!)(looks like a histogram!)

Slide 4- 29
Horsepower of cars reviewed by Consumer Reports:
(not always necessary (not always necessary to use split stems)to use split stems)

Slide 4- 30
Use stemplotsstemplots for small to fairly small to fairly moderatemoderate sizes of data (25 – 100)
Try to use graph paper graph paper (or make sure make sure that your numbers line upline up)
(this is okay…)(this is okay…) (this is NOT)(this is NOT)