Embed Size (px)
Citation preview
lable at ScienceDirect
Energy 111 (2016) 295e305
Contents lists avai
Energy
journal homepage: www.elsevier .com/locate/energy
Quantifying climate change impacts on hydropower generation andimplications on electric grid greenhouse gas emissions and operation
Brian Tarroja a, *, Amir AghaKouchak a, b, Scott Samuelsen a, c
a Advanced Power and Energy Program, University of California e Irvine, University of California Irvine, Engineering Laboratory Facility, Irvine, CA,92697-3550, USAb Department of Civil and Environmental Engineering, University of California e Irvine, University of California Irvine, Engineering Gateway Building, SuiteE4130, Irvine, CA, 92697-2175, USAc Department of Mechanical and Aerospace Engineering, University of California e Irvine, University of California Irvine, Engineering Gateway Building,Suite E4230, Irvine, CA, 92697-2175, USA
a r t i c l e i n f o
Article history:Received 13 October 2015Received in revised form5 May 2016Accepted 31 May 2016
Keywords:HydropowerHydroelectricityClimate changeGreenhouse gas emissionsElectric grid
* Corresponding author.E-mail address: [email protected] (B. Tarroja).
http://dx.doi.org/10.1016/j.energy.2016.05.1310360-5442/© 2016 Elsevier Ltd. All rights reserved.
a b s t r a c t
Here we translate the impacts of climate change on hydropower generation, and discuss implications ongreenhouse gas (GHG) emissions and operation in California. We integrate a model of major surface-water reservoirs with an electric grid dispatch model, and perturb it by projected runoff based onrepresentative concentration pathways (RCP4.5 and RCP8.5). Results show that climate change andvariability is expected to decrease the average annual hydropower generation by 3.1% under RCP4.5, buthave negligible impact under the RCP8.5. Model simulations indicate more inflow, caused by more futureextremes, in the future that does not necessarily translate to more energy production because ofreservoir spillage of water. While overall volume of future available water for energy production may besimilar or higher, the delivery of this volume is expected to be significantly more variable in the futureclimate than the historical average, which has many implications for hydropower generation. Our resultsshow that the expected changes in future climate leads to increases in grid GHG emissions, load-following capacity, fuel usage, and costs for the RCP4.5 due to generation shortfall, and very slight in-creases in the same metrics for the RCP8.5 case due to variability causing decreased efficiencies in load-following power plants.
© 2016 Elsevier Ltd. All rights reserved.
1. Introduction
Concerns over the impacts of climate change on the physical andeconomic environments have driven the development anddeployment of a wide range of advanced technologies. Electrifica-tion has been determined to fulfill a key role in the decarbonizationof many services [1] and therefore many of the advanced technol-ogies have been centered of providing carbon free electricity. Thishas driven the deployment of renewable resources such as windand solar power in many areas, with many states in the U.S.deploying renewable portfolio standards [2]. California in particularhas very aggressive renewable portfolio standards, with a 50% goalby 2030 [3].
Managing the integration of renewable resources for carbonreduction on the electric grid requires the use of dispatchable
generation. In many regions, hydropower fulfills a significantportion of this role on the electric grid. Hydropower generation isideal for providing dispatchable generation due to a number ofcharacteristics over other resources which can provide these ser-vices such as natural gas combined cycle plants. These include butare not limited to:
� No need for fuel input in the conventional sense to providegeneration, compared to fossil fuel input requirements for dis-patchable thermal power plants.
� No efficiency penalties or emissions increases when operating atpart load or during ramping and start up events.
� Ability to ramp and start up over very short timescales� No greenhouse gas emissions in operation while performinggrid services.
Climate change and variability, however, is expected to impactprecipitation and runoff in many regions which serve as the inflowsto surface reservoirs at hydropower plants. These impacts include

B. Tarroja et al. / Energy 111 (2016) 295e305296
but are not limited to changing the timing of runoff and the overallmagnitude of precipitation and runoff which affects the overallpotential contribution of hydropower to the electric generationportfolio. These impacts can jeopardize the ability of hydropower toperform load-balancing services for the electric grid. To compen-sate for the shortfall in these services, other resources may need tooperate and be dispatched to keep the electric load balanced,especially with more renewable resources on the grid. These otherresources may not have the same advantages as hydropower,especially with respect to greenhouse gas emissions.
Depending on the severity of these impacts, they need to betaken into account for the planning of strategies for emissionsreduction. This study seeks to provide an example of one methodfor accounting for hydropower generation under future climatesimulations, and the corresponding impacts on emissions and griddesign. This has been achieved by combining a water reservoirnetwork model with a detailed grid resource dispatch model,forced with inflows simulated from climate model projections.
2. Background
The effects of climate change and variability on precipitation,temperature and runoff have been studied extensively in theliterature over the last decade [4e6]. In the western United States,the observed increase in droughts and heatwaves [7], shifts inrunoff timing [8] and substantial increase in anthropogenic waterdemand [9] have raised concerns on climate impacts on energyproduction. Many studies have examined how climate change for agiven region impacts surface runoff and hydropower generation[10]. The primary gap in the literature is a translation of these ef-fects to grid operation and emissions impacts by coupling theseresults with the constraints of the electricity system. This studyaims to address this important research gap. Current studies in theliterature which have examined hydropower in the context ofclimate change are described as follows.
Hamlet [11] performed a study which examined the projectedeffects of climate change on energy supply and demand in thePacific Northwest region of the U.S, a large component of which ishydropower. This study incorporated climate scenarios for2010e2039, 2030e2059, and 2070e2099 to examine changes inannual and seasonal hydropower generation, as well as changes inelectricity demand due to cooling loads and used the ColSimmodelto simulate hydropower reservoir operations in 20 reservoirs in thestate. This study found that annual hydropower production in theColombia River Basin was reduced by 2.0e3.4% by 2040, and2.6e3.2% by 2080 with the largest reductions occurring in thesummer during the times of peak air conditioning loads.
Kao [12]examined the impact of climate change on 132 federalhydropower plants in the U.S. for 18 different study areas across thecountry ranging from the pacific northwest to the southeast. Thisstudy used the United States Geographical Survey (USGS) Water-Watch runoff to provide observational runoff data, and used acombination of global climatemodels, regional climatemodels, andhydrologic models for each region along with climate scenariosfrom the Intergovernmental Panel on Climate Change AssessmentReport 4 (IPCC AR4) reports. This study, however, did not take intoaccount the constraints of reservoir operation and made pro-jections primarily based on runoff volume. It was found that in thePacific Northwest regions, average annual hydropower generationincreases by 1.7% over 2010e2024 and by 3.3% over 2025e2039,but did not account for operational issues at the reservoir level.Hydropower in the Western Power Administration, SouthwestPower Administration, and Southeastern Power Administrationregions were also projected to increase overall, but with highvariability.
Madani [10] investigated the impact of climate change on highelevation hydropower in California for 137 high elevation hydro-power plants using an Energy-Based Hydropower OptimizationModel (EBHOM) and dry, wet, and temperature warming onlyclimate scenarios. The EBHOMmethodology optimizes hydropowergeneration revenue based on on-peak and off-peak pricing withinthe constraints of reservoir capacity. This study predicted areduction of 19.7% in hydropower generation for the dry climatescenario, an increase in 5.8% for thewet scenarios, and a decrease of1.3% for the temperature warming only cases relative to the1985e1998 levels.
Vicuna [13]also examined the impacts of climate change on highelevation hydropower in California, particularly in the SierraNevada region. This study examined a hydroelectric system con-sisting of 11 hydropower reservoirs operated by the SacramentoMunicipal Utility District using climate change data from fourglobal climate models (GCMs) and emissions scenarios. This studypredicted hydropower generation to be reduced by 10% for two ofthe climate change scenarios, but increased by similar levels for theother climate change scenarios.
Other studies have also been performed. Wang [14] examinedthe vulnerability of hydropower generation to climate change inChina, Schaefli [15] examined impacts of climate change on hy-dropower in the Swiss Alps. Mimikou [16] performed one of thefirst studies on this topic for a multipurpose reservoir in Greece andRobinson [17] also performed one of the first studies on this topicfor systems in the southeast U.S. The topic of climate change im-pacts on hydropower have been discussed in many papersregarding the future role of hydropower in a climate affected sys-tem [18e20].
Overall, the topic of climate change impacts on hydropower hasbeen examined for many regions from awide range of perspectivessuch as generation and hydropower plant revenue. While there aremany studies on the topic, a key aspect that is currently missingfrom the literature on this topic is the implications of changes inhydropower generation on the electricity system, greenhouse gasemissions, and electricity system operation.
Translating the impacts of climate change affected runoff onhydropower generation to electricity system emissions and oper-ation impacts requires coupling of climate models and reservoirmodels with a detailed electric system dispatch model. This studyintegrates these types of models to provide insight into the impactsof climate change on hydropower generation and the electricitysystem, and their implications for carbon reduction strategies forthe electricity system.
3. Approach
3.1. Electric grid modeling
The electric grid is modeled using the Holistic Grid ResourceIntegration and Deployment (HiGRID)model [21], developed by theUniversity of California, Irvine. The HiGRID model is a large scale,integrated model of the electricity system which captures changesin technical and economic aspects of the system including but notlimited to grid resource dispatch, grid resource operation, green-house gas and criteria pollutant emissions, and the levelized cost ofelectricity due to a wide variety of perturbations.
This model has been used to examine perturbations such asincreased variable renewable penetration [21], electrification andgrid-integration of light-duty transportation through plug-in ve-hicles [22,23], and increased water infrastructure-related electricloads due to the reliance on alternative water supply measures tosecure water resource supplies under climate change [24]. For thisparticular study, the perturbation of hydropower generation in a

B. Tarroja et al. / Energy 111 (2016) 295e305 297
future climate is studied.Hydropower generation in the HiGRID model is determined
using the model developed by Eichman [25], which takes into ac-count the generation profiles of different types of hydropower,including:
� Run-of-the-river: Non-dispatchable hydropower generationconsisting of turbines placed in running streams.
� Conventional: Dispatchable hydropower generation consistingof an upper reservoir and turbines placed at the bottom of agravity head. Typically on-stream.
� Pumped: Dispatchable hydropower generation consisting ofboth an upper and lower reservoir with turbines placed at thebottom of a gravity head, which can generate or store electricitydepending on need. Note that not all pumped hydropowerplants are on-stream, some are isolated from natural rivernetworks.
The inflow inputs to the relevant hydropower modules aredescribed in the following section. More details on the HiGRIDmodel and the hydropower module specifically are available fromEichman [21].
3.2. Water reservoir modeling
This study utilizes the water reservoir networkmodel employedby Tarroja [24] for the network of major surface reservoirs in Cal-ifornia (see also [26e28]). This model utilizes temporally resolvedinflow and demand profiles for individual reservoirs with rules forthe release and storage of water which have been calibrated fromhistorical data for a 10-year period from 2000 to 2010. This 10-yearperiod is the baseline case which is perturbed to represent othercases such as climate change.
The water reservoir model takes into account 13 major reser-voirs which provide both water resources and electric power toCalifornia through the use of hydropower. More detail on themodeldevelopment and details are provided by Tarroja [24]. All of thesereservoirs are based on in-stream hydropower, and this does notinclude off-stream pumped hydropower reservoirs. In addition,each reservoir has a minimum fill level below which it can nolonger produce any electric power or electric grid ancillary services.In this study, we use the dead pool reservoir level as the minimum,which represents the capacity where the height of the water levelfalls below the intake structures for the hydropower plants. Belowthis level, water cannot be extracted from the reservoir usinggravity. For this model, minimum fill levels fromUC Davis [29] wereused with the exception of Lake Mead, which uses the physicalminimum fill level based on the height of the lowest intake to thehydropower plant as described by the National Park Service [30],and San Luis, which uses a level specified by the U.S. Bureau ofReclamation [31].
The reservoirs included in the model, along with their totalwater storage capacities, hydropower capacities, and minimum filllevels are presented in Table 1. Note that for Lake Mead, whichsupplies power to California, Nevada, and Arizona, the total ca-pacity devoted to California is set at 55.8%, as determined by theCEC for 2014 [32].
It is important to note that this list of reservoirs does not includeall of the surface reservoirs which provide hydropower to Califor-nia, but this system of reservoirs is selected to be representative ofthe overall trends of hydropower generation in the state. Thesereservoirs are geographically diverse with each located in differentwatersheds which allow capturing of the influence of climatechange on precipitation and runoff in different regions across thestate. Additionally, these surface reservoirs are also the major
reservoirs monitored by the California Department of Water Re-sources for water capacity.
To translate the impacts of climate change on inflows andreservoir levels to that on the entire hydropower generation profileof California, two steps are taken. First, the set of major reservoirslisted is modeled as representing the aggregate behavior of largeon-stream hydropower plants, or “conventional hydro” in theHiGRID model. This means that the percentage changes in thegeneration profile of the listed reservoirs is taken to be the per-centage changes in the generation profile of the all large hydro-power reservoirs in the state. Second, the total percentage changesin overall inflow due to climate change is applied as percentagechanges in the inflow input into the simulation module for the run-of-the-river hydropower.
Combined, both of these steps will capture the trends ofclimate-change impacted inflows on hydropower generation andmore importantly, their impact on electric system operation.
3.3. Reservoir inflows under climate change
The impacts of climate change on reservoir inflows have beendetermined using CMIP5 model simulations of the future climate[33]. The simulations include two Representative ConcentrationPathway scenarios (RCP): RCP 4.5 and RCP 8.5. These two RCPsrepresent moderate and strong radiative forcing conditions for theIPCC 5th Assessment Report (IPCC 2013). We have used modelsimulations downscaled and bias corrected by the Scripps Institutefor Oceanography [34e36]. The simulations used is based on anaverage of the outputs from 10 climate models: (Access1, Can-ESM2, CCSM4, CESM1-BGC, CMCC-CMS, CNRM-CM5, GFDL-CM3,HadGEM2-CC, HadGem2-ES, and MIROC5). Variable InfiltrationCapacity (VIC) Model is then used to obtain hydrology projectionand river flow estimation [4]. In this study, the projection period isselected as 2040e2050, and the difference in reservoir inflowsbetween future simulations and the baseline period of 2000e2010was applied as a modification to actual reservoir inflow data ob-tained from DWR [37] and USGS [38]. The model simulations arebased on the ensemble mean of the above climate models.
It is also important to note that for this study, the demand forwater from the reservoirs considered remains constant as that inthe baseline case. The impacts of potential additional demand forwater in California due to climate change are not considered here toisolate the impact of climate change on reservoir inflows and theneed for more precise demand predictions.
3.4. Scenarios
For this study, three primary scenarios are considered from theperspective of water inflows:
� STA refers to “Standard” reservoir inflow profiles which followhistorical trends for the reservoirs in question, but with year2050 population.
� RCP 4.5 refers to reservoir inflow profiles modified by the futurerunoff simulations for the reservoirs considered for the RCP 4.5from the Intergovermental Panel on Climate Change AssessmentReport 5 (IPCC AR5), using the years of 2040e2050. Populationis set at the year 2050 level.
� RCP 8.5 refers to reservoir inflow profiles modified by the futurerunoff simulations for the reservoirs considered for the RCP 8.5from the Intergovermental Panel on Climate Change AssessmentReport 5 (IPCC AR5), using the years of 2040e2050. Populationis set at the year 2050 level.
The latter two cases are compared to the former to examine the
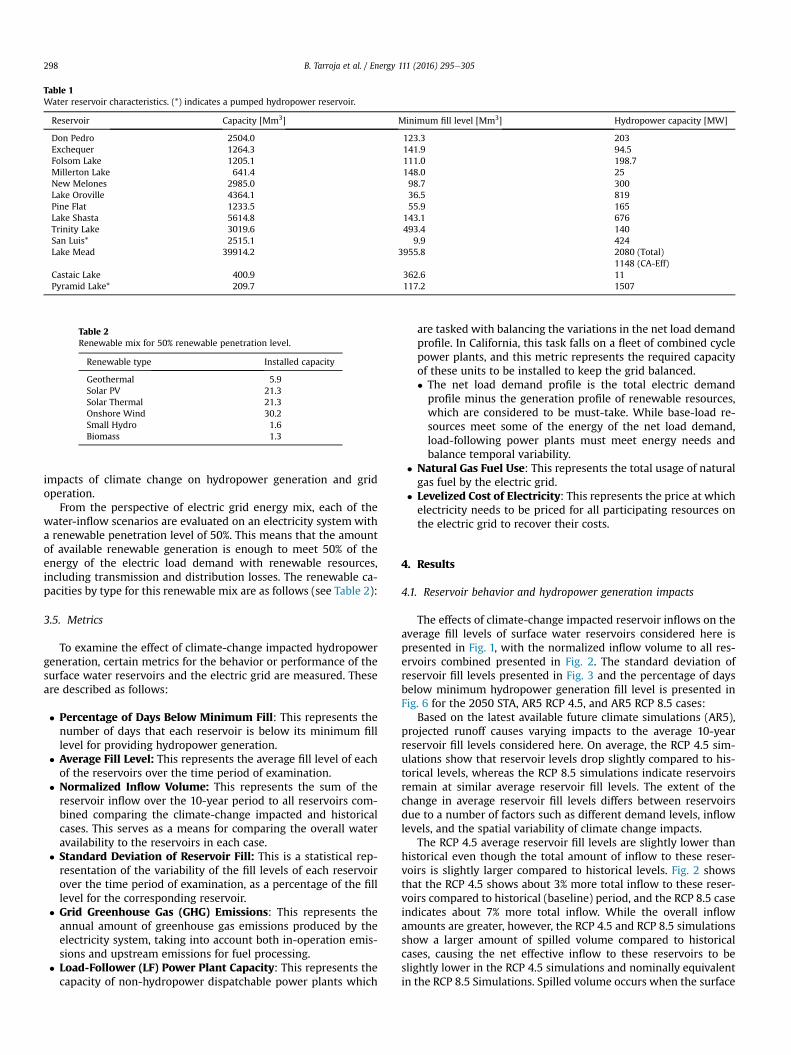
Table 1Water reservoir characteristics. (*) indicates a pumped hydropower reservoir.
Reservoir Capacity [Mm3] Minimum fill level [Mm3] Hydropower capacity [MW]
Don Pedro 2504.0 123.3 203Exchequer 1264.3 141.9 94.5Folsom Lake 1205.1 111.0 198.7Millerton Lake 641.4 148.0 25New Melones 2985.0 98.7 300Lake Oroville 4364.1 36.5 819Pine Flat 1233.5 55.9 165Lake Shasta 5614.8 143.1 676Trinity Lake 3019.6 493.4 140San Luis* 2515.1 9.9 424Lake Mead 39914.2 3955.8 2080 (Total)
1148 (CA-Eff)Castaic Lake 400.9 362.6 11Pyramid Lake* 209.7 117.2 1507
Table 2Renewable mix for 50% renewable penetration level.
Renewable type Installed capacity
Geothermal 5.9Solar PV 21.3Solar Thermal 21.3Onshore Wind 30.2Small Hydro 1.6Biomass 1.3
B. Tarroja et al. / Energy 111 (2016) 295e305298
impacts of climate change on hydropower generation and gridoperation.
From the perspective of electric grid energy mix, each of thewater-inflow scenarios are evaluated on an electricity system witha renewable penetration level of 50%. This means that the amountof available renewable generation is enough to meet 50% of theenergy of the electric load demand with renewable resources,including transmission and distribution losses. The renewable ca-pacities by type for this renewable mix are as follows (see Table 2):
3.5. Metrics
To examine the effect of climate-change impacted hydropowergeneration, certain metrics for the behavior or performance of thesurface water reservoirs and the electric grid are measured. Theseare described as follows:
� Percentage of Days Below Minimum Fill: This represents thenumber of days that each reservoir is below its minimum filllevel for providing hydropower generation.
� Average Fill Level: This represents the average fill level of eachof the reservoirs over the time period of examination.
� Normalized Inflow Volume: This represents the sum of thereservoir inflow over the 10-year period to all reservoirs com-bined comparing the climate-change impacted and historicalcases. This serves as a means for comparing the overall wateravailability to the reservoirs in each case.
� Standard Deviation of Reservoir Fill: This is a statistical rep-resentation of the variability of the fill levels of each reservoirover the time period of examination, as a percentage of the filllevel for the corresponding reservoir.
� Grid Greenhouse Gas (GHG) Emissions: This represents theannual amount of greenhouse gas emissions produced by theelectricity system, taking into account both in-operation emis-sions and upstream emissions for fuel processing.
� Load-Follower (LF) Power Plant Capacity: This represents thecapacity of non-hydropower dispatchable power plants which
are tasked with balancing the variations in the net load demandprofile. In California, this task falls on a fleet of combined cyclepower plants, and this metric represents the required capacityof these units to be installed to keep the grid balanced.� The net load demand profile is the total electric demandprofile minus the generation profile of renewable resources,which are considered to be must-take. While base-load re-sources meet some of the energy of the net load demand,load-following power plants must meet energy needs andbalance temporal variability.
� Natural Gas Fuel Use: This represents the total usage of naturalgas fuel by the electric grid.
� Levelized Cost of Electricity: This represents the price at whichelectricity needs to be priced for all participating resources onthe electric grid to recover their costs.
4. Results
4.1. Reservoir behavior and hydropower generation impacts
The effects of climate-change impacted reservoir inflows on theaverage fill levels of surface water reservoirs considered here ispresented in Fig. 1, with the normalized inflow volume to all res-ervoirs combined presented in Fig. 2. The standard deviation ofreservoir fill levels presented in Fig. 3 and the percentage of daysbelow minimum hydropower generation fill level is presented inFig. 6 for the 2050 STA, AR5 RCP 4.5, and AR5 RCP 8.5 cases:
Based on the latest available future climate simulations (AR5),projected runoff causes varying impacts to the average 10-yearreservoir fill levels considered here. On average, the RCP 4.5 sim-ulations show that reservoir levels drop slightly compared to his-torical levels, whereas the RCP 8.5 simulations indicate reservoirsremain at similar average reservoir fill levels. The extent of thechange in average reservoir fill levels differs between reservoirsdue to a number of factors such as different demand levels, inflowlevels, and the spatial variability of climate change impacts.
The RCP 4.5 average reservoir fill levels are slightly lower thanhistorical even though the total amount of inflow to these reser-voirs is slightly larger compared to historical levels. Fig. 2 showsthat the RCP 4.5 shows about 3% more total inflow to these reser-voirs compared to historical (baseline) period, and the RCP 8.5 caseindicates about 7% more total inflow. While the overall inflowamounts are greater, however, the RCP 4.5 and RCP 8.5 simulationsshow a larger amount of spilled volume compared to historicalcases, causing the net effective inflow to these reservoirs to beslightly lower in the RCP 4.5 simulations and nominally equivalentin the RCP 8.5 Simulations. Spilled volume occurs when the surface
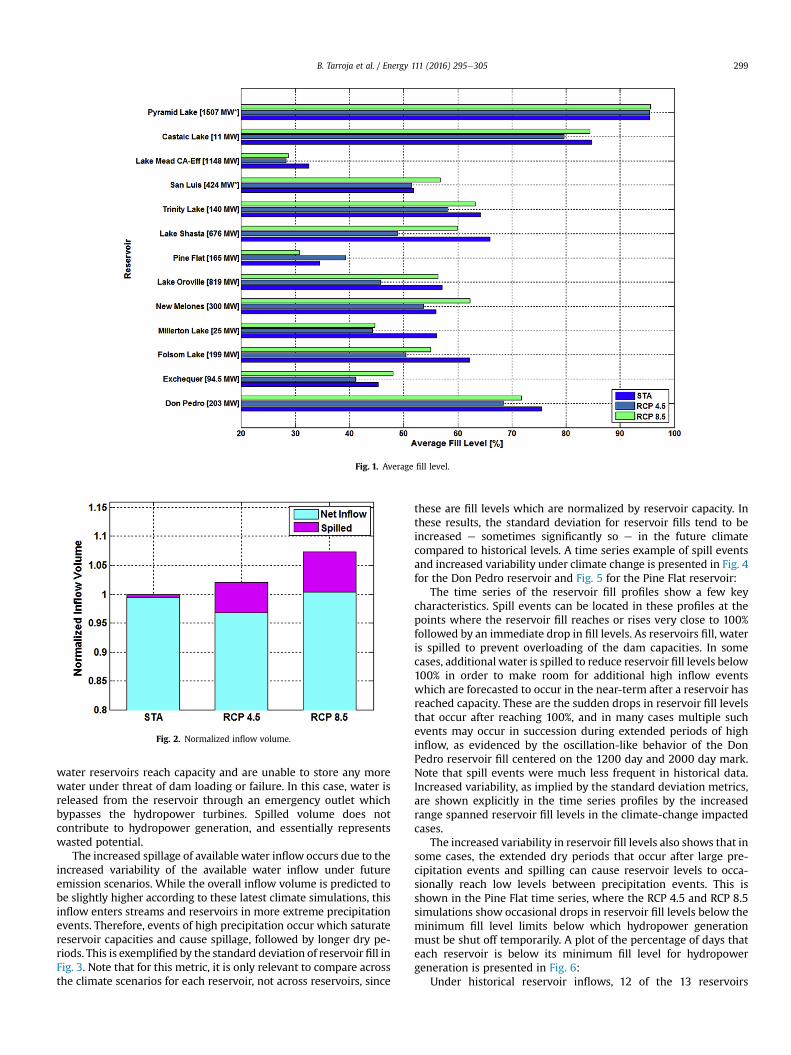
Fig. 1. Average fill level.
Fig. 2. Normalized inflow volume.
B. Tarroja et al. / Energy 111 (2016) 295e305 299
water reservoirs reach capacity and are unable to store any morewater under threat of dam loading or failure. In this case, water isreleased from the reservoir through an emergency outlet whichbypasses the hydropower turbines. Spilled volume does notcontribute to hydropower generation, and essentially representswasted potential.
The increased spillage of available water inflow occurs due to theincreased variability of the available water inflow under futureemission scenarios. While the overall inflow volume is predicted tobe slightly higher according to these latest climate simulations, thisinflow enters streams and reservoirs in more extreme precipitationevents. Therefore, events of high precipitation occur which saturatereservoir capacities and cause spillage, followed by longer dry pe-riods. This is exemplified by the standard deviation of reservoir fill inFig. 3. Note that for this metric, it is only relevant to compare acrossthe climate scenarios for each reservoir, not across reservoirs, since
these are fill levels which are normalized by reservoir capacity. Inthese results, the standard deviation for reservoir fills tend to beincreased e sometimes significantly so e in the future climatecompared to historical levels. A time series example of spill eventsand increased variability under climate change is presented in Fig. 4for the Don Pedro reservoir and Fig. 5 for the Pine Flat reservoir:
The time series of the reservoir fill profiles show a few keycharacteristics. Spill events can be located in these profiles at thepoints where the reservoir fill reaches or rises very close to 100%followed by an immediate drop in fill levels. As reservoirs fill, wateris spilled to prevent overloading of the dam capacities. In somecases, additional water is spilled to reduce reservoir fill levels below100% in order to make room for additional high inflow eventswhich are forecasted to occur in the near-term after a reservoir hasreached capacity. These are the sudden drops in reservoir fill levelsthat occur after reaching 100%, and in many cases multiple suchevents may occur in succession during extended periods of highinflow, as evidenced by the oscillation-like behavior of the DonPedro reservoir fill centered on the 1200 day and 2000 day mark.Note that spill events were much less frequent in historical data.Increased variability, as implied by the standard deviation metrics,are shown explicitly in the time series profiles by the increasedrange spanned reservoir fill levels in the climate-change impactedcases.
The increased variability in reservoir fill levels also shows that insome cases, the extended dry periods that occur after large pre-cipitation events and spilling can cause reservoir levels to occa-sionally reach low levels between precipitation events. This isshown in the Pine Flat time series, where the RCP 4.5 and RCP 8.5simulations show occasional drops in reservoir fill levels below theminimum fill level limits below which hydropower generationmust be shut off temporarily. A plot of the percentage of days thateach reservoir is below its minimum fill level for hydropowergeneration is presented in Fig. 6:
Under historical reservoir inflows, 12 of the 13 reservoirs
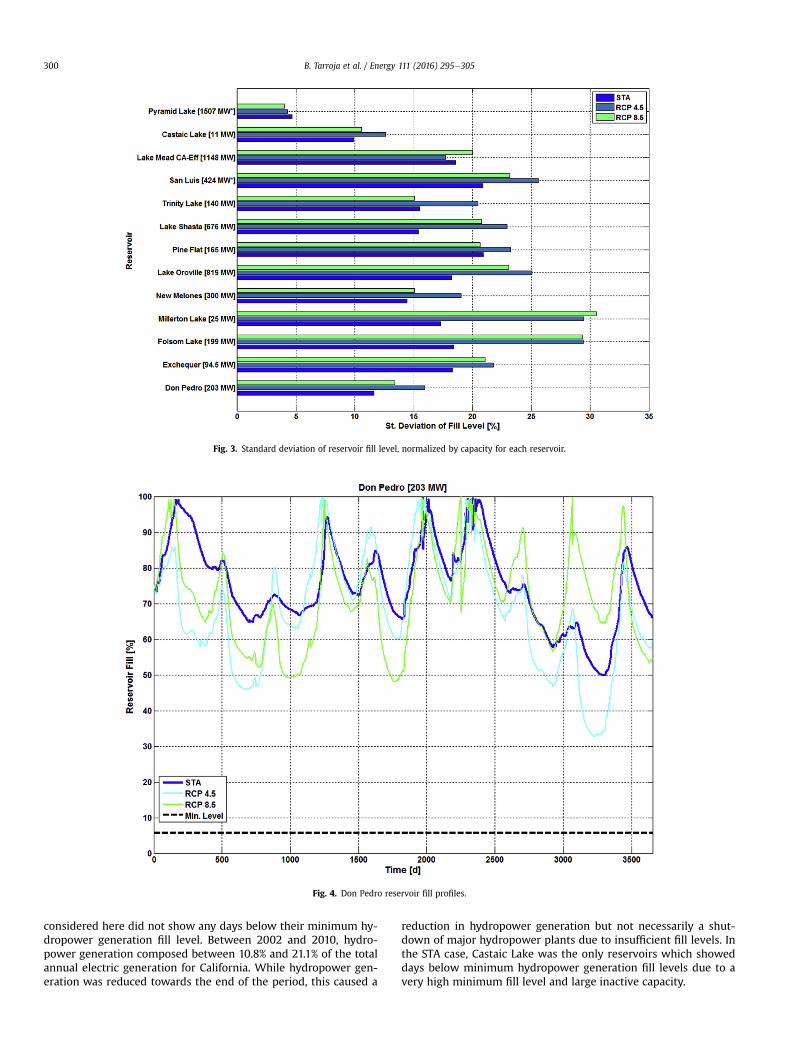
Fig. 3. Standard deviation of reservoir fill level, normalized by capacity for each reservoir.
Fig. 4. Don Pedro reservoir fill profiles.
B. Tarroja et al. / Energy 111 (2016) 295e305300
considered here did not show any days below their minimum hy-dropower generation fill level. Between 2002 and 2010, hydro-power generation composed between 10.8% and 21.1% of the totalannual electric generation for California. While hydropower gen-eration was reduced towards the end of the period, this caused a
reduction in hydropower generation but not necessarily a shut-down of major hydropower plants due to insufficient fill levels. Inthe STA case, Castaic Lake was the only reservoirs which showeddays below minimum hydropower generation fill levels due to avery high minimum fill level and large inactive capacity.
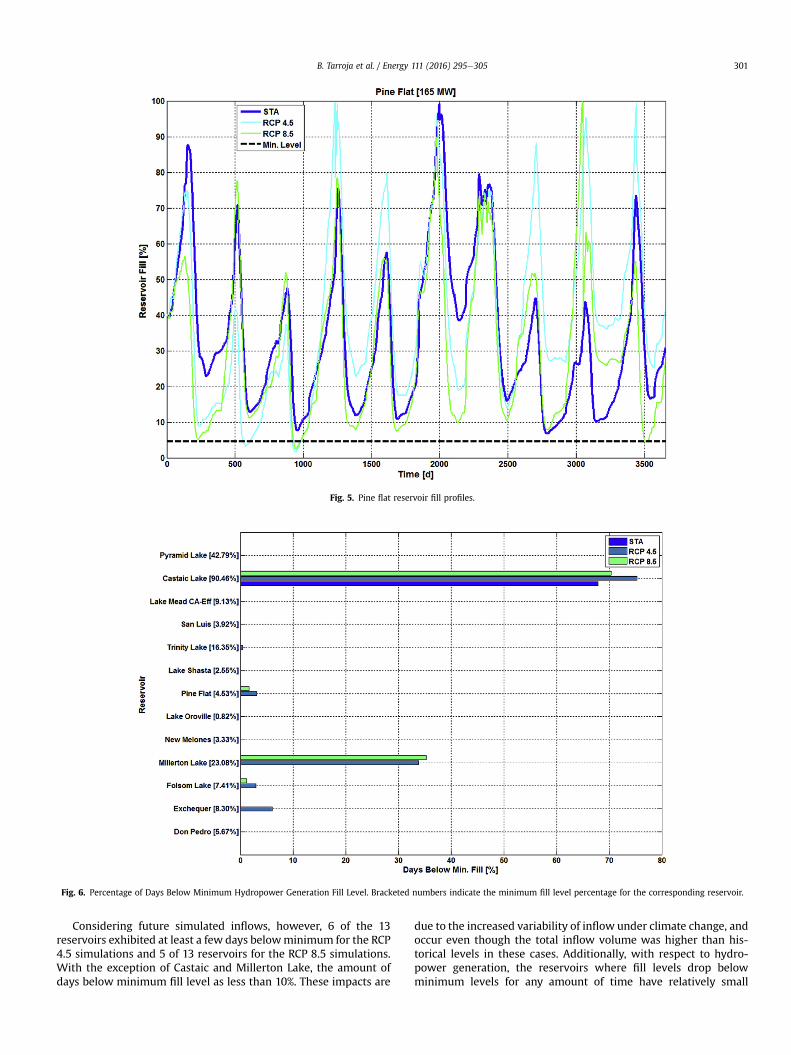
Fig. 5. Pine flat reservoir fill profiles.
Fig. 6. Percentage of Days Below Minimum Hydropower Generation Fill Level. Bracketed numbers indicate the minimum fill level percentage for the corresponding reservoir.
B. Tarroja et al. / Energy 111 (2016) 295e305 301
Considering future simulated inflows, however, 6 of the 13reservoirs exhibited at least a few days belowminimum for the RCP4.5 simulations and 5 of 13 reservoirs for the RCP 8.5 simulations.With the exception of Castaic and Millerton Lake, the amount ofdays below minimum fill level as less than 10%. These impacts are
due to the increased variability of inflow under climate change, andoccur even though the total inflow volume was higher than his-torical levels in these cases. Additionally, with respect to hydro-power generation, the reservoirs where fill levels drop belowminimum levels for any amount of time have relatively small
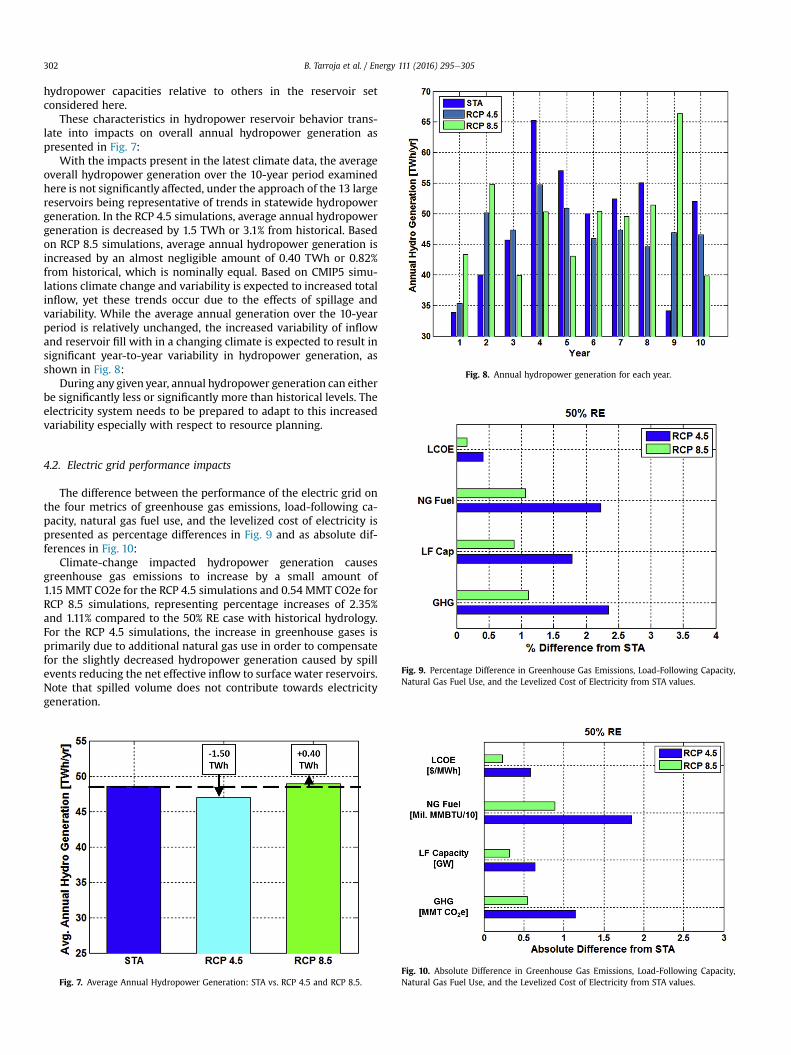
Fig. 8. Annual hydropower generation for each year.
B. Tarroja et al. / Energy 111 (2016) 295e305302
hydropower capacities relative to others in the reservoir setconsidered here.
These characteristics in hydropower reservoir behavior trans-late into impacts on overall annual hydropower generation aspresented in Fig. 7:
With the impacts present in the latest climate data, the averageoverall hydropower generation over the 10-year period examinedhere is not significantly affected, under the approach of the 13 largereservoirs being representative of trends in statewide hydropowergeneration. In the RCP 4.5 simulations, average annual hydropowergeneration is decreased by 1.5 TWh or 3.1% from historical. Basedon RCP 8.5 simulations, average annual hydropower generation isincreased by an almost negligible amount of 0.40 TWh or 0.82%from historical, which is nominally equal. Based on CMIP5 simu-lations climate change and variability is expected to increased totalinflow, yet these trends occur due to the effects of spillage andvariability. While the average annual generation over the 10-yearperiod is relatively unchanged, the increased variability of inflowand reservoir fill with in a changing climate is expected to result insignificant year-to-year variability in hydropower generation, asshown in Fig. 8:
During any given year, annual hydropower generation can eitherbe significantly less or significantly more than historical levels. Theelectricity system needs to be prepared to adapt to this increasedvariability especially with respect to resource planning.
Fig. 9. Percentage Difference in Greenhouse Gas Emissions, Load-Following Capacity,Natural Gas Fuel Use, and the Levelized Cost of Electricity from STA values.
4.2. Electric grid performance impacts
The difference between the performance of the electric grid onthe four metrics of greenhouse gas emissions, load-following ca-pacity, natural gas fuel use, and the levelized cost of electricity ispresented as percentage differences in Fig. 9 and as absolute dif-ferences in Fig. 10:
Climate-change impacted hydropower generation causesgreenhouse gas emissions to increase by a small amount of1.15 MMT CO2e for the RCP 4.5 simulations and 0.54 MMT CO2e forRCP 8.5 simulations, representing percentage increases of 2.35%and 1.11% compared to the 50% RE case with historical hydrology.For the RCP 4.5 simulations, the increase in greenhouse gases isprimarily due to additional natural gas use in order to compensatefor the slightly decreased hydropower generation caused by spillevents reducing the net effective inflow to surface water reservoirs.Note that spilled volume does not contribute towards electricitygeneration.
Fig. 7. Average Annual Hydropower Generation: STA vs. RCP 4.5 and RCP 8.5.Fig. 10. Absolute Difference in Greenhouse Gas Emissions, Load-Following Capacity,Natural Gas Fuel Use, and the Levelized Cost of Electricity from STA values.
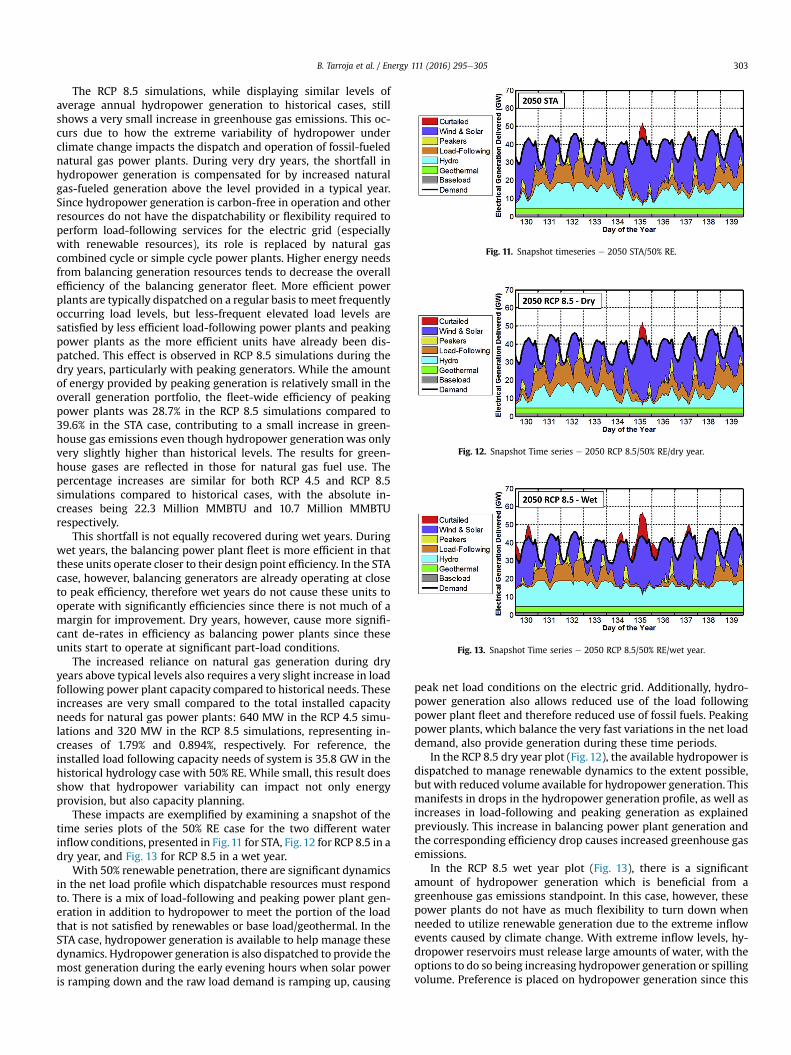
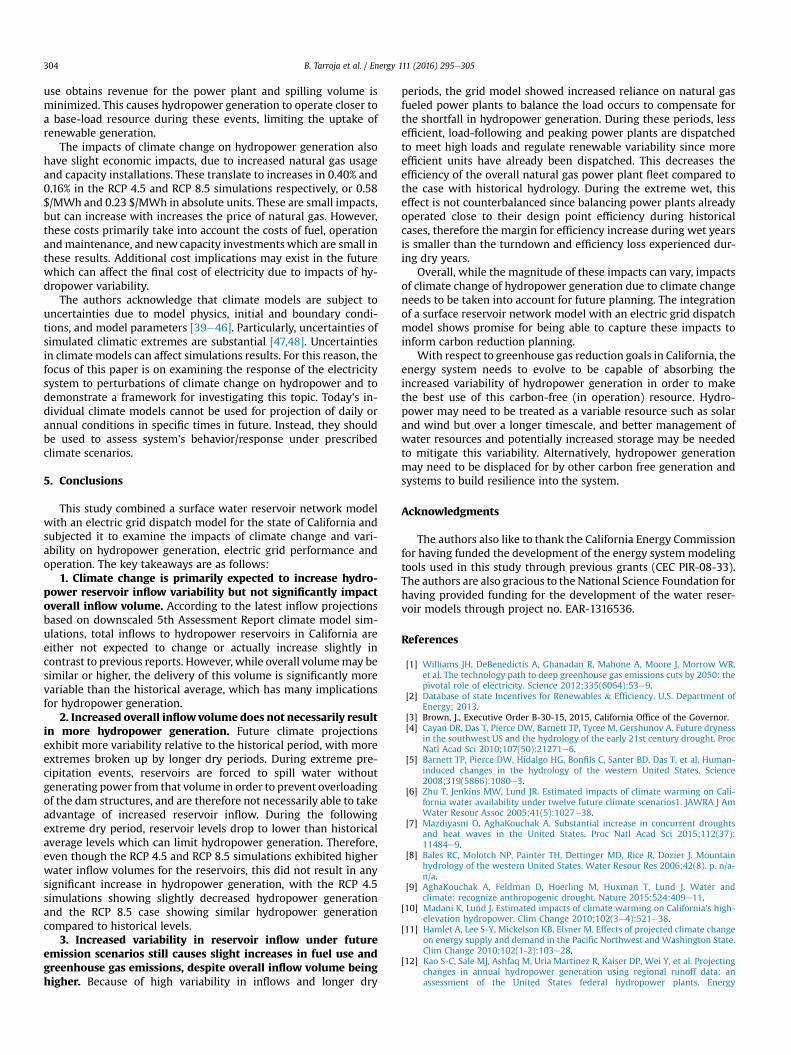
Fig. 11. Snapshot timeseries e 2050 STA/50% RE.
Fig. 12. Snapshot Time series e 2050 RCP 8.5/50% RE/dry year.
Fig. 13. Snapshot Time series e 2050 RCP 8.5/50% RE/wet year.
B. Tarroja et al. / Energy 111 (2016) 295e305 303
The RCP 8.5 simulations, while displaying similar levels ofaverage annual hydropower generation to historical cases, stillshows a very small increase in greenhouse gas emissions. This oc-curs due to how the extreme variability of hydropower underclimate change impacts the dispatch and operation of fossil-fuelednatural gas power plants. During very dry years, the shortfall inhydropower generation is compensated for by increased naturalgas-fueled generation above the level provided in a typical year.Since hydropower generation is carbon-free in operation and otherresources do not have the dispatchability or flexibility required toperform load-following services for the electric grid (especiallywith renewable resources), its role is replaced by natural gascombined cycle or simple cycle power plants. Higher energy needsfrom balancing generation resources tends to decrease the overallefficiency of the balancing generator fleet. More efficient powerplants are typically dispatched on a regular basis to meet frequentlyoccurring load levels, but less-frequent elevated load levels aresatisfied by less efficient load-following power plants and peakingpower plants as the more efficient units have already been dis-patched. This effect is observed in RCP 8.5 simulations during thedry years, particularly with peaking generators. While the amountof energy provided by peaking generation is relatively small in theoverall generation portfolio, the fleet-wide efficiency of peakingpower plants was 28.7% in the RCP 8.5 simulations compared to39.6% in the STA case, contributing to a small increase in green-house gas emissions even though hydropower generationwas onlyvery slightly higher than historical levels. The results for green-house gases are reflected in those for natural gas fuel use. Thepercentage increases are similar for both RCP 4.5 and RCP 8.5simulations compared to historical cases, with the absolute in-creases being 22.3 Million MMBTU and 10.7 Million MMBTUrespectively.
This shortfall is not equally recovered during wet years. Duringwet years, the balancing power plant fleet is more efficient in thatthese units operate closer to their design point efficiency. In the STAcase, however, balancing generators are already operating at closeto peak efficiency, therefore wet years do not cause these units tooperate with significantly efficiencies since there is not much of amargin for improvement. Dry years, however, cause more signifi-cant de-rates in efficiency as balancing power plants since theseunits start to operate at significant part-load conditions.
The increased reliance on natural gas generation during dryyears above typical levels also requires a very slight increase in loadfollowing power plant capacity compared to historical needs. Theseincreases are very small compared to the total installed capacityneeds for natural gas power plants: 640 MW in the RCP 4.5 simu-lations and 320 MW in the RCP 8.5 simulations, representing in-creases of 1.79% and 0.894%, respectively. For reference, theinstalled load following capacity needs of system is 35.8 GW in thehistorical hydrology case with 50% RE. While small, this result doesshow that hydropower variability can impact not only energyprovision, but also capacity planning.
These impacts are exemplified by examining a snapshot of thetime series plots of the 50% RE case for the two different waterinflow conditions, presented in Fig.11 for STA, Fig.12 for RCP 8.5 in adry year, and Fig. 13 for RCP 8.5 in a wet year.
With 50% renewable penetration, there are significant dynamicsin the net load profile which dispatchable resources must respondto. There is a mix of load-following and peaking power plant gen-eration in addition to hydropower to meet the portion of the loadthat is not satisfied by renewables or base load/geothermal. In theSTA case, hydropower generation is available to help manage thesedynamics. Hydropower generation is also dispatched to provide themost generation during the early evening hours when solar poweris ramping down and the raw load demand is ramping up, causing
peak net load conditions on the electric grid. Additionally, hydro-power generation also allows reduced use of the load followingpower plant fleet and therefore reduced use of fossil fuels. Peakingpower plants, which balance the very fast variations in the net loaddemand, also provide generation during these time periods.
In the RCP 8.5 dry year plot (Fig. 12), the available hydropower isdispatched to manage renewable dynamics to the extent possible,but with reduced volume available for hydropower generation. Thismanifests in drops in the hydropower generation profile, as well asincreases in load-following and peaking generation as explainedpreviously. This increase in balancing power plant generation andthe corresponding efficiency drop causes increased greenhouse gasemissions.
In the RCP 8.5 wet year plot (Fig. 13), there is a significantamount of hydropower generation which is beneficial from agreenhouse gas emissions standpoint. In this case, however, thesepower plants do not have as much flexibility to turn down whenneeded to utilize renewable generation due to the extreme inflowevents caused by climate change. With extreme inflow levels, hy-dropower reservoirs must release large amounts of water, with theoptions to do so being increasing hydropower generation or spillingvolume. Preference is placed on hydropower generation since this
B. Tarroja et al. / Energy 111 (2016) 295e305304
use obtains revenue for the power plant and spilling volume isminimized. This causes hydropower generation to operate closer toa base-load resource during these events, limiting the uptake ofrenewable generation.
The impacts of climate change on hydropower generation alsohave slight economic impacts, due to increased natural gas usageand capacity installations. These translate to increases in 0.40% and0.16% in the RCP 4.5 and RCP 8.5 simulations respectively, or 0.58$/MWh and 0.23 $/MWh in absolute units. These are small impacts,but can increase with increases the price of natural gas. However,these costs primarily take into account the costs of fuel, operationandmaintenance, and new capacity investments which are small inthese results. Additional cost implications may exist in the futurewhich can affect the final cost of electricity due to impacts of hy-dropower variability.
The authors acknowledge that climate models are subject touncertainties due to model physics, initial and boundary condi-tions, and model parameters [39e46]. Particularly, uncertainties ofsimulated climatic extremes are substantial [47,48]. Uncertaintiesin climate models can affect simulations results. For this reason, thefocus of this paper is on examining the response of the electricitysystem to perturbations of climate change on hydropower and todemonstrate a framework for investigating this topic. Today's in-dividual climate models cannot be used for projection of daily orannual conditions in specific times in future. Instead, they shouldbe used to assess system's behavior/response under prescribedclimate scenarios.
5. Conclusions
This study combined a surface water reservoir network modelwith an electric grid dispatch model for the state of California andsubjected it to examine the impacts of climate change and vari-ability on hydropower generation, electric grid performance andoperation. The key takeaways are as follows:
1. Climate change is primarily expected to increase hydro-power reservoir inflow variability but not significantly impactoverall inflow volume. According to the latest inflow projectionsbased on downscaled 5th Assessment Report climate model sim-ulations, total inflows to hydropower reservoirs in California areeither not expected to change or actually increase slightly incontrast to previous reports. However, while overall volumemay besimilar or higher, the delivery of this volume is significantly morevariable than the historical average, which has many implicationsfor hydropower generation.
2. Increased overall inflow volume does not necessarily resultin more hydropower generation. Future climate projectionsexhibit more variability relative to the historical period, with moreextremes broken up by longer dry periods. During extreme pre-cipitation events, reservoirs are forced to spill water withoutgenerating power from that volume in order to prevent overloadingof the dam structures, and are therefore not necessarily able to takeadvantage of increased reservoir inflow. During the followingextreme dry period, reservoir levels drop to lower than historicalaverage levels which can limit hydropower generation. Therefore,even though the RCP 4.5 and RCP 8.5 simulations exhibited higherwater inflow volumes for the reservoirs, this did not result in anysignificant increase in hydropower generation, with the RCP 4.5simulations showing slightly decreased hydropower generationand the RCP 8.5 case showing similar hydropower generationcompared to historical levels.
3. Increased variability in reservoir inflow under futureemission scenarios still causes slight increases in fuel use andgreenhouse gas emissions, despite overall inflow volume beinghigher. Because of high variability in inflows and longer dry
periods, the grid model showed increased reliance on natural gasfueled power plants to balance the load occurs to compensate forthe shortfall in hydropower generation. During these periods, lessefficient, load-following and peaking power plants are dispatchedto meet high loads and regulate renewable variability since moreefficient units have already been dispatched. This decreases theefficiency of the overall natural gas power plant fleet compared tothe case with historical hydrology. During the extreme wet, thiseffect is not counterbalanced since balancing power plants alreadyoperated close to their design point efficiency during historicalcases, therefore the margin for efficiency increase during wet yearsis smaller than the turndown and efficiency loss experienced dur-ing dry years.
Overall, while the magnitude of these impacts can vary, impactsof climate change of hydropower generation due to climate changeneeds to be taken into account for future planning. The integrationof a surface reservoir network model with an electric grid dispatchmodel shows promise for being able to capture these impacts toinform carbon reduction planning.
With respect to greenhouse gas reduction goals in California, theenergy system needs to evolve to be capable of absorbing theincreased variability of hydropower generation in order to makethe best use of this carbon-free (in operation) resource. Hydro-power may need to be treated as a variable resource such as solarand wind but over a longer timescale, and better management ofwater resources and potentially increased storage may be neededto mitigate this variability. Alternatively, hydropower generationmay need to be displaced for by other carbon free generation andsystems to build resilience into the system.
Acknowledgments
The authors also like to thank the California Energy Commissionfor having funded the development of the energy systemmodelingtools used in this study through previous grants (CEC PIR-08-33).The authors are also gracious to the National Science Foundation forhaving provided funding for the development of the water reser-voir models through project no. EAR-1316536.
References
[1] Williams JH, DeBenedictis A, Ghanadan R, Mahone A, Moore J, Morrow WR,et al. The technology path to deep greenhouse gas emissions cuts by 2050: thepivotal role of electricity. Science 2012;335(6064):53e9.
[2] Database of state Incentives for Renewables & Efficiency. U.S. Department ofEnergy; 2013.
[3] Brown, J., Executive Order B-30-15, 2015, California Office of the Governor.[4] Cayan DR, Das T, Pierce DW, Barnett TP, Tyree M, Gershunov A. Future dryness
in the southwest US and the hydrology of the early 21st century drought. ProcNatl Acad Sci 2010;107(50):21271e6.
[5] Barnett TP, Pierce DW, Hidalgo HG, Bonfils C, Santer BD, Das T, et al. Human-induced changes in the hydrology of the western United States. Science2008;319(5866):1080e3.
[6] Zhu T, Jenkins MW, Lund JR. Estimated impacts of climate warming on Cali-fornia water availability under twelve future climate scenarios1. JAWRA J AmWater Resour Assoc 2005;41(5):1027e38.
[7] Mazdiyasni O, AghaKouchak A. Substantial increase in concurrent droughtsand heat waves in the United States. Proc Natl Acad Sci 2015;112(37):11484e9.
[8] Bales RC, Molotch NP, Painter TH, Dettinger MD, Rice R, Dozier J. Mountainhydrology of the western United States. Water Resour Res 2006;42(8). p. n/a-n/a.
[9] AghaKouchak A, Feldman D, Hoerling M, Huxman T, Lund J. Water andclimate: recognize anthropogenic drought. Nature 2015;524:409e11.
[10] Madani K, Lund J. Estimated impacts of climate warming on California's high-elevation hydropower. Clim Change 2010;102(3e4):521e38.
[11] Hamlet A, Lee S-Y, Mickelson KB, Elsner M. Effects of projected climate changeon energy supply and demand in the Pacific Northwest and Washington State.Clim Change 2010;102(1-2):103e28.
[12] Kao S-C, Sale MJ, Ashfaq M, Uria Martinez R, Kaiser DP, Wei Y, et al. Projectingchanges in annual hydropower generation using regional runoff data: anassessment of the United States federal hydropower plants. Energy
B. Tarroja et al. / Energy 111 (2016) 295e305 305
2015;80(0):239e50.[13] Vicuna S, Leonardson R, Hanemann MW, Dale LL, Dracup JA. Climate change
impacts on high elevation hydropower generation in California's SierraNevada: a case study in the Upper American River. Clim Change 2008;87(1):123e37.
[14] Wang B, Liang X-J, Zhang H, Wang L, Wei Y-M. Vulnerability of hydropowergeneration to climate change in China: results based on Grey forecastingmodel. Energy Policy 2014;65(0):701e7.
[15] Schaefli B, Hingray B, Musy A. Climate change and hydropower production inthe Swiss Alps: quantification of potential impacts and related modellinguncertainties. Hydrol Earth Syst Sci 2007;11(3):1191e205.
[16] Mimikou MA, Baltas EA. Climate change impacts on the reliability of hydro-electric energy production. Hydrological Sci J 1997;42(5):661e78.
[17] Robinson PJ. Climate change and hydropower generation. Int J Climatol1997;17(9):983e96.
[18] Gaudard L, Romerio F. The future of hydropower in Europe: interconnectingclimate, markets and policies. Environ Sci Policy 2014;37(0):172e81.
[19] Bahadori A, Zahedi G, Zendehboudi S. An overview of Australia's hydropowerenergy: status and future prospects. Renew Sustain Energy Rev 2013;20(0):565e9.
[20] Jager HI, Efroymson RA, Opperman JJ, Kelly MR. Spatial design principles forsustainable hydropower development in river basins. Renew Sustain EnergyRev 2015;45(0):808e16.
[21] Eichman JD, Mueller F, Tarroja B, Schell LS, Samuelsen S. Exploration of theintegration of renewable resources into California's electric system using theHolistic Grid Resource Integration and Deployment (HiGRID) tool. Energy2013;50(1):353e63.
[22] Tarroja B, Eichman JD, Zhang L, Brown TM, Samuelsen S. The effectiveness ofplug-in hybrid electric vehicles and renewable power in support of holisticenvironmental goals: part 1 e evaluation of aggregate energy and greenhousegas performance. J Power Sources 2014;257(0):461e70.
[23] Tarroja B, Shaffer B, Samuelsen S. The importance of grid integration forachievable greenhouse gas emissions reductions from alternative vehicletechnologies. Energy 2015;87:504e19.
[24] Tarroja B, AghaKouchak A, Sobhani R, Feldman D, Jiang S, Samuelsen S.Evaluating options for balancing the watereelectricity nexus in California:part 2dgreenhouse gas and renewable energy utilization impacts. Sci TotalEnviron 2014;497e498(0):711e24.
[25] Chang MK, Eichman JD, Mueller F, Samuelsen S. Buffering intermittentrenewable power with hydroelectric generation: a case study in California.Appl Energy 2013;112:1e11.
[26] van Beek LPH, Wada Y, Bierkens MFP. Global monthly water stress: 1. Waterbalance and water availability. Water Resour Res 2011;47(7) [p. n/a-n/a].
[27] Haddeland I, Skaugen T, Lettenmaier DP. Anthropogenic impacts on conti-nental surface water fluxes. Geophys Res Lett 2006;33(8) [p. n/a-n/a].
[28] Hanasaki N, Kanae S, Oki T. A reservoir operation scheme for global riverrouting models. J Hydrol 2006;327(1e2):22e41.
[29] CALVIN Project Appendix H: Infrastructure. UC Davis; 2001.[30] Storage Capacity of Lake Mead. 2010 [cited 2015 September 21].[31] San Luis Reservoir Low Point Improvement Project Final Appraisal Report. U.S.
Bureau of Reclamation; 2006.[32] Facts on California's Use of Hydroelectricity. California Energy Commission;
2014.[33] Taylor KE, Stouffer RJ, Meehl GA. An overview of CMIP5 and the experiment
design. Bull Am Meteorological Soc 2012;93(4):485e98.[34] Pierce DW, Cayan DR, Maurer EP, Abatzoglou JT, Hegewisch KC. Improved bias
correction techniques for hydrological simulations of climate change. JHydrometeorol 2015;16(6):2421e42.
[35] Pierce DW, Cayan DR, Thrasher BL. Statistical downscaling using localizedconstructed analogs (LOCA). J Hydrometeorol 2014;15(6):2558e85.
[36] Pierce DW, Cayan DR, Das T, Maurer EP, Miller NL, Bao Y, et al. The key role ofheavy precipitation events in climate model disagreements of future annualprecipitation changes in California. J Clim 2013;26(16):5879e96.
[37] California Data Exchange Center. California Department of Water Resources;2013.
[38] National Water Information system: Web Interface. U.S. Geological Survey;2013.
[39] Wehner M. Methods of projecting future changes in extremes. In:AghaKouchak A, et al., editors. Extremes in a Changing Climate. Netherlands:Springer; 2013. p. 223e37.
[40] Brekke L, Barsugli J. Uncertainties in projections of future changes in ex-tremes. In: Extremes in a Changing Climate. Springer; 2013.
[41] Feddema J, Oleson K, Bonan G, Mearns L, Washington W, Meehl G, et al. Acomparison of a GCM response to historical anthropogenic land cover changeand model sensitivity to uncertainty in present-day land cover representa-tions. Clim Dyn 2005;25(6):581e609.
[42] Mehran A, AghaKouchak A, Phillips TJ. Evaluation of CMIP5 continental pre-cipitation simulations relative to satellite-based gauge-adjusted observations.J Geophys Res Atmos 2014;119(4). p. 2013JD021152.
[43] Sillmann J, Kharin VV, Zhang X, Zwiers FW, Bronaugh D. Climate extremesindices in the CMIP5 multimodel ensemble: part 1. Model evaluation in thepresent climate. J Geophys Res Atmos 2013;118(4):1716e33.
[44] Pascale S, Lucarini V, Feng X, Porporato A, Hasson SU. Analysis of rainfallseasonality from observations and climate models. arXiv 2014.
[45] Cayan DR, Maurer EP, Dettinger MD, Tyree M, Hayhoe K. Climate changescenarios for the California region. Clim Change 2008;87(1):21e42.
[46] Brekke LD, Dettinger MD, Maurer EP, Anderson M. Significance of modelcredibility in estimating climate projection distributions for regional hydro-climatological risk assessments. Clim Change 2008;89(3-4):371e94.
[47] AghaKouchak A, Easterling D, Hsu K, Schubert S, Sorooshian S. Extremes in aChanging Climate. Netherlands, Dordrecht: Springer; 2013.
[48] Zengchao H, AghaKouchak A, Phillips TJ. Changes in concurrent monthlyprecipitation and temperature extremes. Environ Res Lett 2013;8.