Embed Size (px)
Citation preview
Bioresource Technology xxx (2014) xxx–xxx
Contents lists available at ScienceDirect
Bioresource Technology
journal homepage: www.elsevier .com/locate /bior tech
Quantification method of N2O emission from full-scale biologicalnutrient removal wastewater treatment plant by laboratory batchreactor analysis
http://dx.doi.org/10.1016/j.biortech.2014.03.0210960-8524/� 2014 Elsevier Ltd. All rights reserved.
⇑ Corresponding author at: Department of Environmental Science & Biotechnol-ogy, Hallym University, Chuncheon, Gangwon 200-702, Republic of Korea. Tel.: +8233 248 2154; fax: +82 33 256 3420.
E-mail address: [email protected] (D.-J. Kim).
Please cite this article in press as: Lim, Y., Kim, D.-J. Quantification method of N2O emission from full-scale biological nutrient removal wasttreatment plant by laboratory batch reactor analysis. Bioresour. Technol. (2014), http://dx.doi.org/10.1016/j.biortech.2014.03.021
Yesul Lim a, Dong-Jin Kim a,b,⇑a Department of Environmental Science & Biotechnology, Hallym University, Chuncheon, Gangwon 200-702, Republic of Koreab Institute of Energy & Environment, Hallym University, Chuncheon, Gangwon 200-702, Republic of Korea
h i g h l i g h t s
� Lab-scale batch reactor was devised for N2O emission quantification from BNR WWTP.� The batch reactor simulated clarifiers, anaerobic, anoxic and aerobic basins.� 95% of N2O emission came from aerobic basin.� N2O emission factor was 0.8%.� The method is simple and economical for N2O quantification.
a r t i c l e i n f o
Article history:Received 2 January 2014Received in revised form 27 February 2014Accepted 5 March 2014Available online xxxx
Keywords:Nitrous oxideEmission factorWastewater treatment plantBatch reactorBiological nutrient removal
a b s t r a c t
This study proposes a simplified method for the quantification of N2O emission from a biological nutrientremoval wastewater treatment plant (WWTP). The method incorporates a laboratory-scale batch reactorwhich had almost the same operational (wastewater and sludge flow rates) condition of a unit operation/process of the WWTP. Cumulative N2O emissions from the batch reactor at the corresponding hydraulicretention times of the full-scale units (primary and secondary clarifiers, pre-anoxic, anaerobic, anoxic andaerobic basins) were used for the quantification of N2O emission. The analysis showed that the aerobicbasin emitted 95% of the total emission and the emission factor (yield) reached 0.8% based on the influentnitrogen load. The method successfully estimated N2O emission from the WWTP and it has shownadvantages in measurement time and cost over the direct field measurement (floating chamber) method.
� 2014 Elsevier Ltd. All rights reserved.
1. Introduction
Nitrous oxide (N2O) is one of the major greenhouse gases andwastewater treatment plants (WWTPs) are an important sourceof N2O which is produced during wastewater nitrification anddenitrification (Kampschreur et al., 2009; Tallec et al., 2008; Wrageet al., 2001). An accurate quantification method is needed for thepreparation of the N2O emission report from WWTPs and to devel-op and/or assess a WWTP process which reduces N2O emission.Intergovernmental Panel on Climate Change (IPCC) proposed asimple tool based on a fixed emission factor from input nitrogenload to quantify N2O emission from WWTPs (IPCC, 2006). However,
the IPCC guideline does not consider specific designs andoperational conditions of the WWTP. N2O emission surveys fromlaboratory-scale and full-scale WWTPs showed a huge variationdepending on not only the design and operational conditions ofthe WWTP, but also the measurement/quantification methods(Ahn et al., 2010; Foley et al., 2010; Kampschreur et al., 2009).
N2O emission can be calculated by measuring N2O concentra-tion in the off-gas and the total gas flow rate of the laboratory-scaleand full-scale WWTPs that are fully covered (Daelman et al., 2013).Otherwise, N2O emission from the open-surface WWTPs, which ismost common of the cases, can be measured by the floating cham-ber method that captures N2O flux from the surface of WWTPs.However, this method is hampered by the inaccuracy caused bythe uneven gas distribution (channeling) from the surface of aera-tion basin (Ahn et al., 2010; Casey, 2009). Furthermore, the floatingchamber method cannot be used for the surface aerated system.
ewater
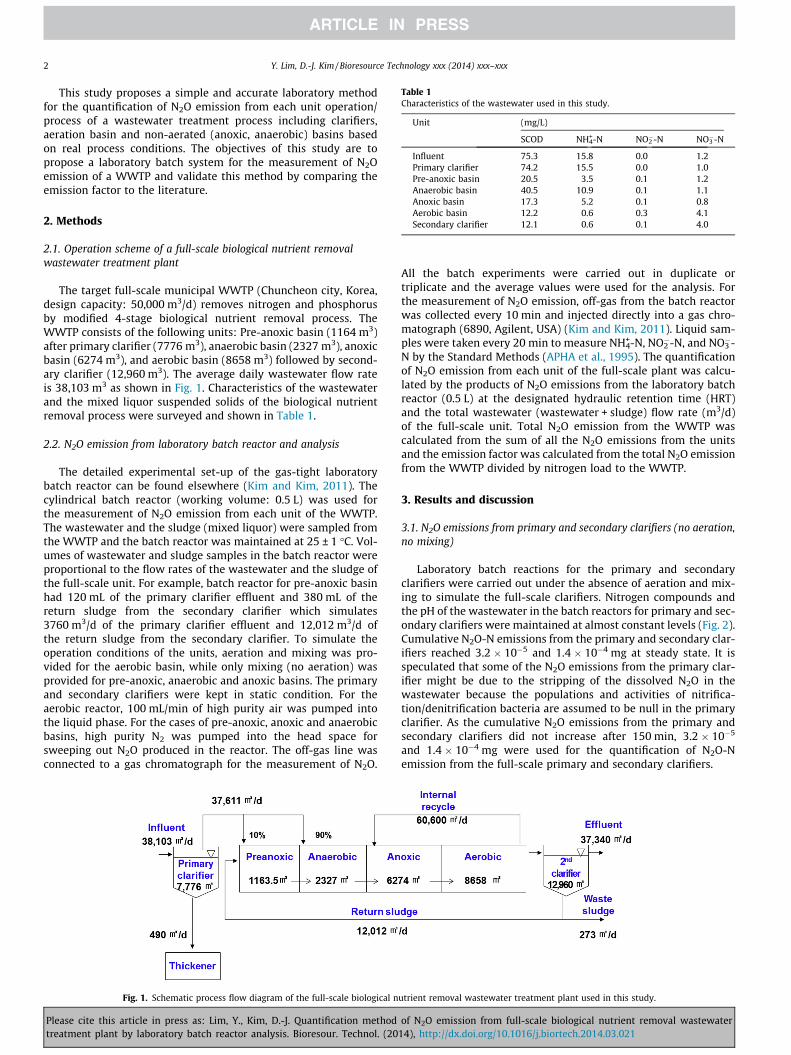
Table 1Characteristics of the wastewater used in this study.
Unit (mg/L)
SCOD NH4+-N NO2
�-N NO3�-N
Influent 75.3 15.8 0.0 1.2Primary clarifier 74.2 15.5 0.0 1.0Pre-anoxic basin 20.5 3.5 0.1 1.2Anaerobic basin 40.5 10.9 0.1 1.1Anoxic basin 17.3 5.2 0.1 0.8Aerobic basin 12.2 0.6 0.3 4.1Secondary clarifier 12.1 0.6 0.1 4.0
2 Y. Lim, D.-J. Kim / Bioresource Technology xxx (2014) xxx–xxx
This study proposes a simple and accurate laboratory methodfor the quantification of N2O emission from each unit operation/process of a wastewater treatment process including clarifiers,aeration basin and non-aerated (anoxic, anaerobic) basins basedon real process conditions. The objectives of this study are topropose a laboratory batch system for the measurement of N2Oemission of a WWTP and validate this method by comparing theemission factor to the literature.
2. Methods
2.1. Operation scheme of a full-scale biological nutrient removalwastewater treatment plant
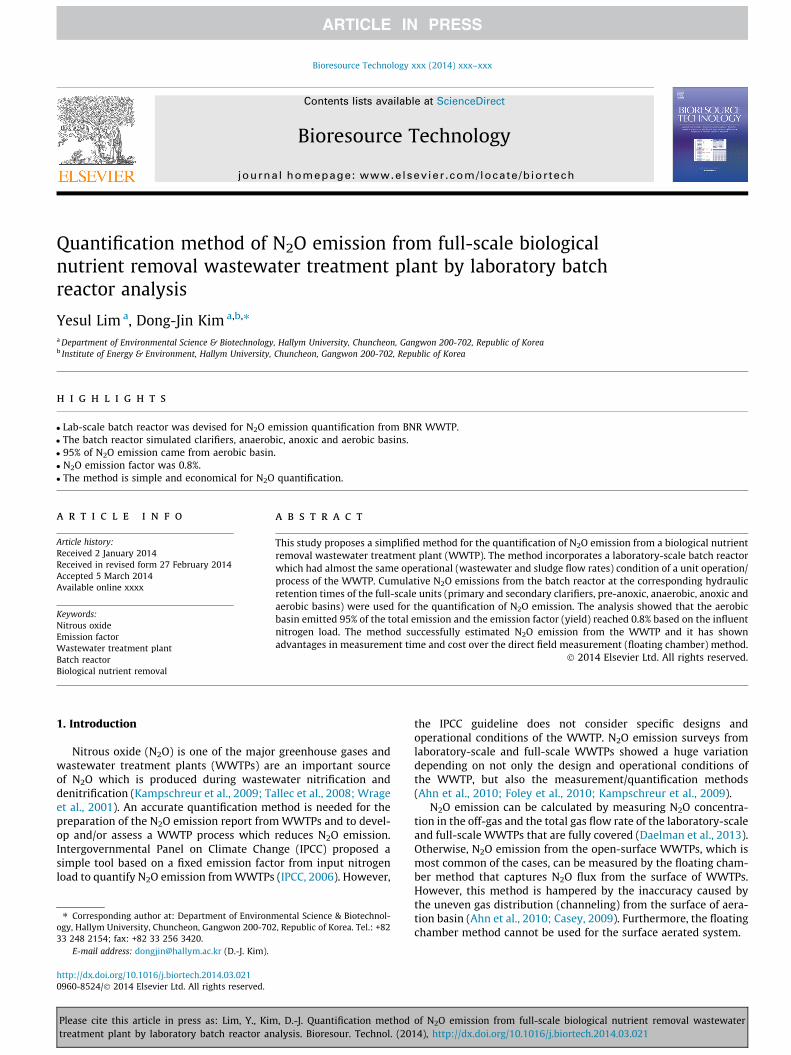
The target full-scale municipal WWTP (Chuncheon city, Korea,design capacity: 50,000 m3/d) removes nitrogen and phosphorusby modified 4-stage biological nutrient removal process. TheWWTP consists of the following units: Pre-anoxic basin (1164 m3)after primary clarifier (7776 m3), anaerobic basin (2327 m3), anoxicbasin (6274 m3), and aerobic basin (8658 m3) followed by second-ary clarifier (12,960 m3). The average daily wastewater flow rateis 38,103 m3 as shown in Fig. 1. Characteristics of the wastewaterand the mixed liquor suspended solids of the biological nutrientremoval process were surveyed and shown in Table 1.
2.2. N2O emission from laboratory batch reactor and analysis
The detailed experimental set-up of the gas-tight laboratorybatch reactor can be found elsewhere (Kim and Kim, 2011). Thecylindrical batch reactor (working volume: 0.5 L) was used forthe measurement of N2O emission from each unit of the WWTP.The wastewater and the sludge (mixed liquor) were sampled fromthe WWTP and the batch reactor was maintained at 25 ± 1 �C. Vol-umes of wastewater and sludge samples in the batch reactor wereproportional to the flow rates of the wastewater and the sludge ofthe full-scale unit. For example, batch reactor for pre-anoxic basinhad 120 mL of the primary clarifier effluent and 380 mL of thereturn sludge from the secondary clarifier which simulates3760 m3/d of the primary clarifier effluent and 12,012 m3/d ofthe return sludge from the secondary clarifier. To simulate theoperation conditions of the units, aeration and mixing was pro-vided for the aerobic basin, while only mixing (no aeration) wasprovided for pre-anoxic, anaerobic and anoxic basins. The primaryand secondary clarifiers were kept in static condition. For theaerobic reactor, 100 mL/min of high purity air was pumped intothe liquid phase. For the cases of pre-anoxic, anoxic and anaerobicbasins, high purity N2 was pumped into the head space forsweeping out N2O produced in the reactor. The off-gas line wasconnected to a gas chromatograph for the measurement of N2O.
Fig. 1. Schematic process flow diagram of the full-scale biological n
Please cite this article in press as: Lim, Y., Kim, D.-J. Quantification methodtreatment plant by laboratory batch reactor analysis. Bioresour. Technol. (20
All the batch experiments were carried out in duplicate ortriplicate and the average values were used for the analysis. Forthe measurement of N2O emission, off-gas from the batch reactorwas collected every 10 min and injected directly into a gas chro-matograph (6890, Agilent, USA) (Kim and Kim, 2011). Liquid sam-ples were taken every 20 min to measure NH4
+-N, NO2�-N, and NO3
�-N by the Standard Methods (APHA et al., 1995). The quantificationof N2O emission from each unit of the full-scale plant was calcu-lated by the products of N2O emissions from the laboratory batchreactor (0.5 L) at the designated hydraulic retention time (HRT)and the total wastewater (wastewater + sludge) flow rate (m3/d)of the full-scale unit. Total N2O emission from the WWTP wascalculated from the sum of all the N2O emissions from the unitsand the emission factor was calculated from the total N2O emissionfrom the WWTP divided by nitrogen load to the WWTP.
3. Results and discussion
3.1. N2O emissions from primary and secondary clarifiers (no aeration,no mixing)
Laboratory batch reactions for the primary and secondaryclarifiers were carried out under the absence of aeration and mix-ing to simulate the full-scale clarifiers. Nitrogen compounds andthe pH of the wastewater in the batch reactors for primary and sec-ondary clarifiers were maintained at almost constant levels (Fig. 2).Cumulative N2O-N emissions from the primary and secondary clar-ifiers reached 3.2 � 10�5 and 1.4 � 10�4 mg at steady state. It isspeculated that some of the N2O emissions from the primary clar-ifier might be due to the stripping of the dissolved N2O in thewastewater because the populations and activities of nitrifica-tion/denitrification bacteria are assumed to be null in the primaryclarifier. As the cumulative N2O emissions from the primary andsecondary clarifiers did not increase after 150 min, 3.2 � 10�5
and 1.4 � 10�4 mg were used for the quantification of N2O-Nemission from the full-scale primary and secondary clarifiers.
utrient removal wastewater treatment plant used in this study.
of N2O emission from full-scale biological nutrient removal wastewater14), http://dx.doi.org/10.1016/j.biortech.2014.03.021
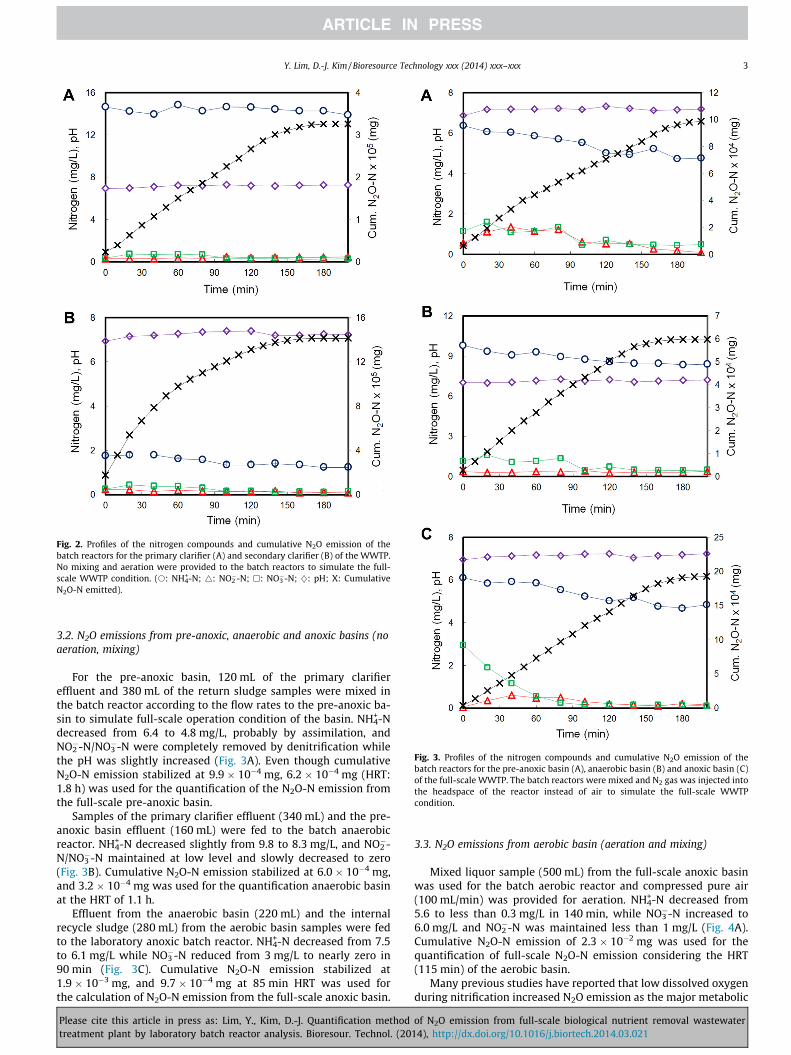
Fig. 2. Profiles of the nitrogen compounds and cumulative N2O emission of thebatch reactors for the primary clarifier (A) and secondary clarifier (B) of the WWTP.No mixing and aeration were provided to the batch reactors to simulate the full-scale WWTP condition. (s: NH4
+-N; 4: NO2�-N; h: NO3
�-N; }: pH; X: CumulativeN2O-N emitted).
Fig. 3. Profiles of the nitrogen compounds and cumulative N2O emission of thebatch reactors for the pre-anoxic basin (A), anaerobic basin (B) and anoxic basin (C)of the full-scale WWTP. The batch reactors were mixed and N2 gas was injected intothe headspace of the reactor instead of air to simulate the full-scale WWTPcondition.
Y. Lim, D.-J. Kim / Bioresource Technology xxx (2014) xxx–xxx 3
3.2. N2O emissions from pre-anoxic, anaerobic and anoxic basins (noaeration, mixing)
For the pre-anoxic basin, 120 mL of the primary clarifiereffluent and 380 mL of the return sludge samples were mixed inthe batch reactor according to the flow rates to the pre-anoxic ba-sin to simulate full-scale operation condition of the basin. NH4
+-Ndecreased from 6.4 to 4.8 mg/L, probably by assimilation, andNO2�-N/NO3
�-N were completely removed by denitrification whilethe pH was slightly increased (Fig. 3A). Even though cumulativeN2O-N emission stabilized at 9.9 � 10�4 mg, 6.2 � 10�4 mg (HRT:1.8 h) was used for the quantification of the N2O-N emission fromthe full-scale pre-anoxic basin.
Samples of the primary clarifier effluent (340 mL) and the pre-anoxic basin effluent (160 mL) were fed to the batch anaerobicreactor. NH4
+-N decreased slightly from 9.8 to 8.3 mg/L, and NO2�-
N/NO3�-N maintained at low level and slowly decreased to zero
(Fig. 3B). Cumulative N2O-N emission stabilized at 6.0 � 10�4 mg,and 3.2 � 10�4 mg was used for the quantification anaerobic basinat the HRT of 1.1 h.
Effluent from the anaerobic basin (220 mL) and the internalrecycle sludge (280 mL) from the aerobic basin samples were fedto the laboratory anoxic batch reactor. NH4
+-N decreased from 7.5to 6.1 mg/L while NO3
�-N reduced from 3 mg/L to nearly zero in90 min (Fig. 3C). Cumulative N2O-N emission stabilized at1.9 � 10�3 mg, and 9.7 � 10�4 mg at 85 min HRT was used forthe calculation of N2O-N emission from the full-scale anoxic basin.
Please cite this article in press as: Lim, Y., Kim, D.-J. Quantification methodtreatment plant by laboratory batch reactor analysis. Bioresour. Technol. (20
3.3. N2O emissions from aerobic basin (aeration and mixing)
Mixed liquor sample (500 mL) from the full-scale anoxic basinwas used for the batch aerobic reactor and compressed pure air(100 mL/min) was provided for aeration. NH4
+-N decreased from5.6 to less than 0.3 mg/L in 140 min, while NO3
�-N increased to6.0 mg/L and NO2
�-N was maintained less than 1 mg/L (Fig. 4A).Cumulative N2O-N emission of 2.3 � 10�2 mg was used for thequantification of full-scale N2O-N emission considering the HRT(115 min) of the aerobic basin.
Many previous studies have reported that low dissolved oxygenduring nitrification increased N2O emission as the major metabolic
of N2O emission from full-scale biological nutrient removal wastewater14), http://dx.doi.org/10.1016/j.biortech.2014.03.021
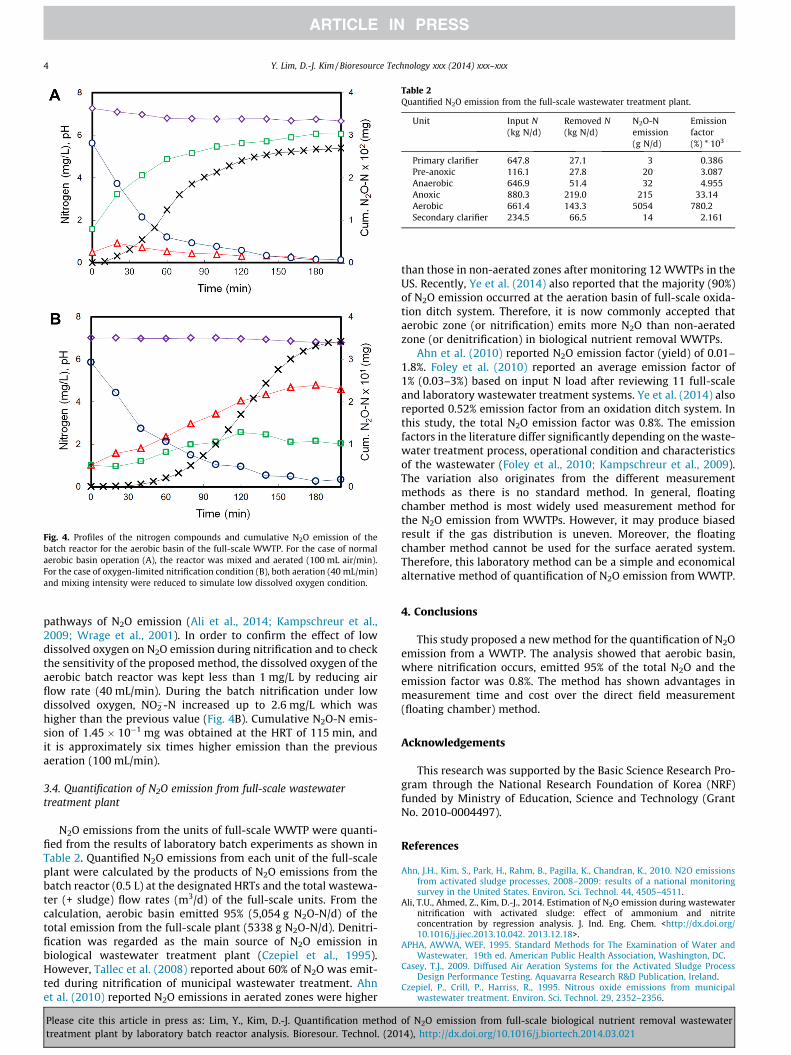
Table 2Quantified N2O emission from the full-scale wastewater treatment plant.
Unit Input N(kg N/d)
Removed N(kg N/d)
N2O-Nemission(g N/d)
Emissionfactor(%) * 103
Primary clarifier 647.8 27.1 3 0.386Pre-anoxic 116.1 27.8 20 3.087Anaerobic 646.9 51.4 32 4.955Anoxic 880.3 219.0 215 33.14Aerobic 661.4 143.3 5054 780.2Secondary clarifier 234.5 66.5 14 2.161
Fig. 4. Profiles of the nitrogen compounds and cumulative N2O emission of thebatch reactor for the aerobic basin of the full-scale WWTP. For the case of normalaerobic basin operation (A), the reactor was mixed and aerated (100 mL air/min).For the case of oxygen-limited nitrification condition (B), both aeration (40 mL/min)and mixing intensity were reduced to simulate low dissolved oxygen condition.
4 Y. Lim, D.-J. Kim / Bioresource Technology xxx (2014) xxx–xxx
pathways of N2O emission (Ali et al., 2014; Kampschreur et al.,2009; Wrage et al., 2001). In order to confirm the effect of lowdissolved oxygen on N2O emission during nitrification and to checkthe sensitivity of the proposed method, the dissolved oxygen of theaerobic batch reactor was kept less than 1 mg/L by reducing airflow rate (40 mL/min). During the batch nitrification under lowdissolved oxygen, NO2
�-N increased up to 2.6 mg/L which washigher than the previous value (Fig. 4B). Cumulative N2O-N emis-sion of 1.45 � 10�1 mg was obtained at the HRT of 115 min, andit is approximately six times higher emission than the previousaeration (100 mL/min).
3.4. Quantification of N2O emission from full-scale wastewatertreatment plant
N2O emissions from the units of full-scale WWTP were quanti-fied from the results of laboratory batch experiments as shown inTable 2. Quantified N2O emissions from each unit of the full-scaleplant were calculated by the products of N2O emissions from thebatch reactor (0.5 L) at the designated HRTs and the total wastewa-ter (+ sludge) flow rates (m3/d) of the full-scale units. From thecalculation, aerobic basin emitted 95% (5,054 g N2O-N/d) of thetotal emission from the full-scale plant (5338 g N2O-N/d). Denitri-fication was regarded as the main source of N2O emission inbiological wastewater treatment plant (Czepiel et al., 1995).However, Tallec et al. (2008) reported about 60% of N2O was emit-ted during nitrification of municipal wastewater treatment. Ahnet al. (2010) reported N2O emissions in aerated zones were higher
Please cite this article in press as: Lim, Y., Kim, D.-J. Quantification methodtreatment plant by laboratory batch reactor analysis. Bioresour. Technol. (20
than those in non-aerated zones after monitoring 12 WWTPs in theUS. Recently, Ye et al. (2014) also reported that the majority (90%)of N2O emission occurred at the aeration basin of full-scale oxida-tion ditch system. Therefore, it is now commonly accepted thataerobic zone (or nitrification) emits more N2O than non-aeratedzone (or denitrification) in biological nutrient removal WWTPs.
Ahn et al. (2010) reported N2O emission factor (yield) of 0.01–1.8%. Foley et al. (2010) reported an average emission factor of1% (0.03–3%) based on input N load after reviewing 11 full-scaleand laboratory wastewater treatment systems. Ye et al. (2014) alsoreported 0.52% emission factor from an oxidation ditch system. Inthis study, the total N2O emission factor was 0.8%. The emissionfactors in the literature differ significantly depending on the waste-water treatment process, operational condition and characteristicsof the wastewater (Foley et al., 2010; Kampschreur et al., 2009).The variation also originates from the different measurementmethods as there is no standard method. In general, floatingchamber method is most widely used measurement method forthe N2O emission from WWTPs. However, it may produce biasedresult if the gas distribution is uneven. Moreover, the floatingchamber method cannot be used for the surface aerated system.Therefore, this laboratory method can be a simple and economicalalternative method of quantification of N2O emission from WWTP.
4. Conclusions
This study proposed a new method for the quantification of N2Oemission from a WWTP. The analysis showed that aerobic basin,where nitrification occurs, emitted 95% of the total N2O and theemission factor was 0.8%. The method has shown advantages inmeasurement time and cost over the direct field measurement(floating chamber) method.
Acknowledgements
This research was supported by the Basic Science Research Pro-gram through the National Research Foundation of Korea (NRF)funded by Ministry of Education, Science and Technology (GrantNo. 2010-0004497).
References
Ahn, J.H., Kim, S., Park, H., Rahm, B., Pagilla, K., Chandran, K., 2010. N2O emissionsfrom activated sludge processes, 2008–2009: results of a national monitoringsurvey in the United States. Environ. Sci. Technol. 44, 4505–4511.
Ali, T.U., Ahmed, Z., Kim, D.-J., 2014. Estimation of N2O emission during wastewaternitrification with activated sludge: effect of ammonium and nitriteconcentration by regression analysis. J. Ind. Eng. Chem. <http://dx.doi.org/10.1016/j.jiec.2013.10.042. 2013.12.18>.
APHA, AWWA, WEF, 1995. Standard Methods for The Examination of Water andWastewater, 19th ed. American Public Health Association, Washington, DC.
Casey, T.J., 2009. Diffused Air Aeration Systems for the Activated Sludge ProcessDesign Performance Testing. Aquavarra Research R&D Publication, Ireland.
Czepiel, P., Crill, P., Harriss, R., 1995. Nitrous oxide emissions from municipalwastewater treatment. Environ. Sci. Technol. 29, 2352–2356.
of N2O emission from full-scale biological nutrient removal wastewater14), http://dx.doi.org/10.1016/j.biortech.2014.03.021

Y. Lim, D.-J. Kim / Bioresource Technology xxx (2014) xxx–xxx 5
Daelman, M.R.J., van Voorthuizen, E.M., van Dongen, L.G.J.M., Volcke, E.I.P., vanLoosdrecht, M.C.M., 2013. Methane and nitrous oxide emissions from municipalwastewater treatment – results from a long-term study. Water Sci. Technol. 67,2350–2355.
Foley, J., de Haas, D., Yuan, Z., Lant, P., 2010. Nitrous oxide generation in full-scalebiological nutrient removal wastewater treatment plants. Water Res. 44, 831–844.
IPCC, 2006. Wastewater treatment and discharge. 2006 IPCC Guidelines for NationalGreenhouse Gas Inventories, vol. 5. IPCC, Japan.
Kampschreur, M.J., Temmink, H., Kleerebezem, R., Jetten, M.S.M., van Loosdrecht,M.C.M., 2009. Nitrous oxide emission during wastewater treatment. Water Res.43, 4093–4103.
Please cite this article in press as: Lim, Y., Kim, D.-J. Quantification methodtreatment plant by laboratory batch reactor analysis. Bioresour. Technol. (20
Kim, D.-J., Kim, Y., 2011. Effect of ammonium concentration on the estimation ofN2O under oxygen-limited autotrophic wastewater nitrification. J. Microbiol.Biotechnol. 21, 988–994.
Tallec, G., Garnier, J., Billen, G., Gousailles, M., 2008. Nitrous oxide emissions fromdenitrifying activated sludge of urban wastewater treatment plants, underanoxia and low oxygenation. Bioresour. Technol. 99, 2200–2209.
Wrage, N., Velthof, G.L., van Beusichem, M.L., Oenema, M., 2001. Role of nitrifierdnitrification in the production of nitrous oxide. Soil Biol. Biochem. 33, 1723–1732.
Ye, L., Ni, B.-J., Law, Y., Byers, C., Yuan, Z., 2014. A novel methodology to quantifynitrous oxide emissions from full-scale wastewater treatment systems withsurface aerators. Water Res. 48, 257–268.
of N2O emission from full-scale biological nutrient removal wastewater14), http://dx.doi.org/10.1016/j.biortech.2014.03.021


