Embed Size (px)
Citation preview
NDTMA 2015 Annual Conference
Quality Management & Strategic Planning
Key Performance Indicators John Cristman Director of Corporate Quality X-‐Ray Industries, Inc. Troy, Michigan
Golden Nugget Hotel, Las Vegas, NV February 10-13, 2015
NDTMA 2015 Annual Conference
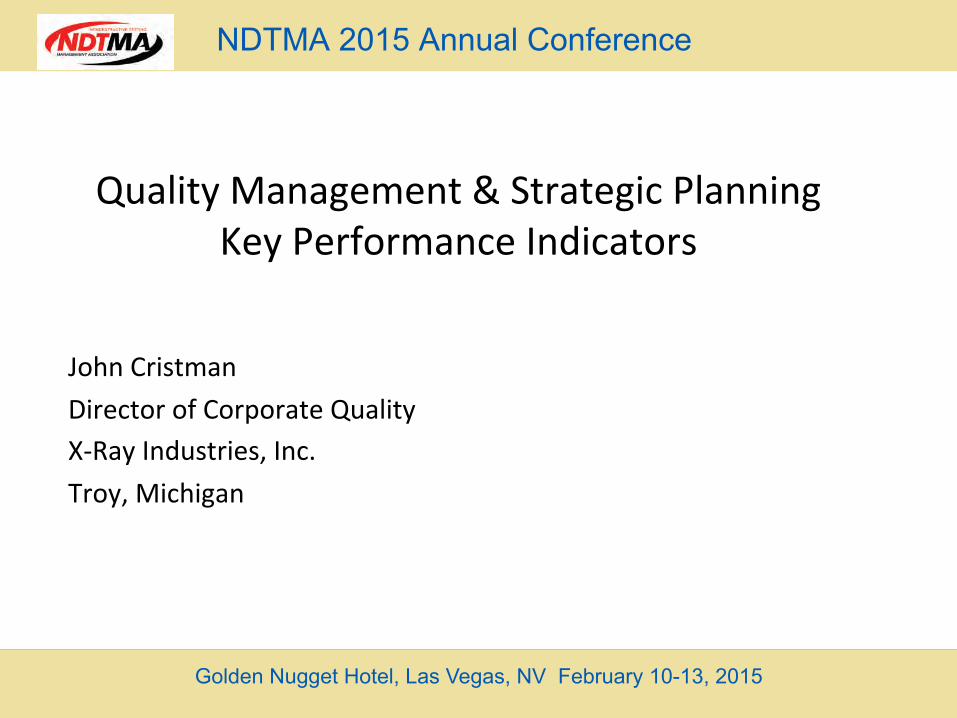
Why it’s important to choose the right KPI’s
Golden Nugget Hotel, Las Vegas, NV February 10-13, 2015
Ø There are several reasons why measurement of performance is necessary and why there should be an organized approach to it.
v Performance measures indicate the degree of accomplishment of objectives and, therefore, quantify progress toward the accomplishment of goals.
v Performance measures are needed to monitor the continuous improvement process, which is central to the changes required to become competitive.
v Measures of individual, team, and business unit performance are required for periodic performance reviews by management.
NDTMA 2015 Annual Conference
Why it’s important to choose the right KPI’s
Golden Nugget Hotel, Las Vegas, NV February 10-13, 2015
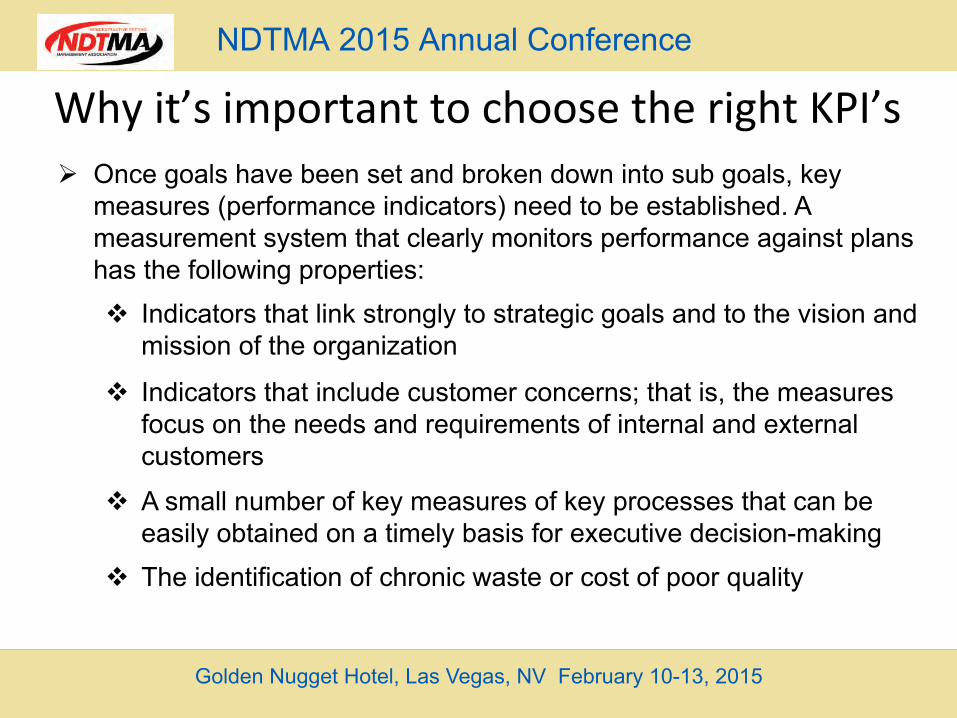
Ø Once goals have been set and broken down into sub goals, key measures (performance indicators) need to be established. A measurement system that clearly monitors performance against plans has the following properties: v Indicators that link strongly to strategic goals and to the vision and
mission of the organization
v Indicators that include customer concerns; that is, the measures focus on the needs and requirements of internal and external customers
v A small number of key measures of key processes that can be easily obtained on a timely basis for executive decision-making
v The identification of chronic waste or cost of poor quality
NDTMA 2015 Annual Conference
Golden Nugget Hotel, Las Vegas, NV February 10-13, 2015
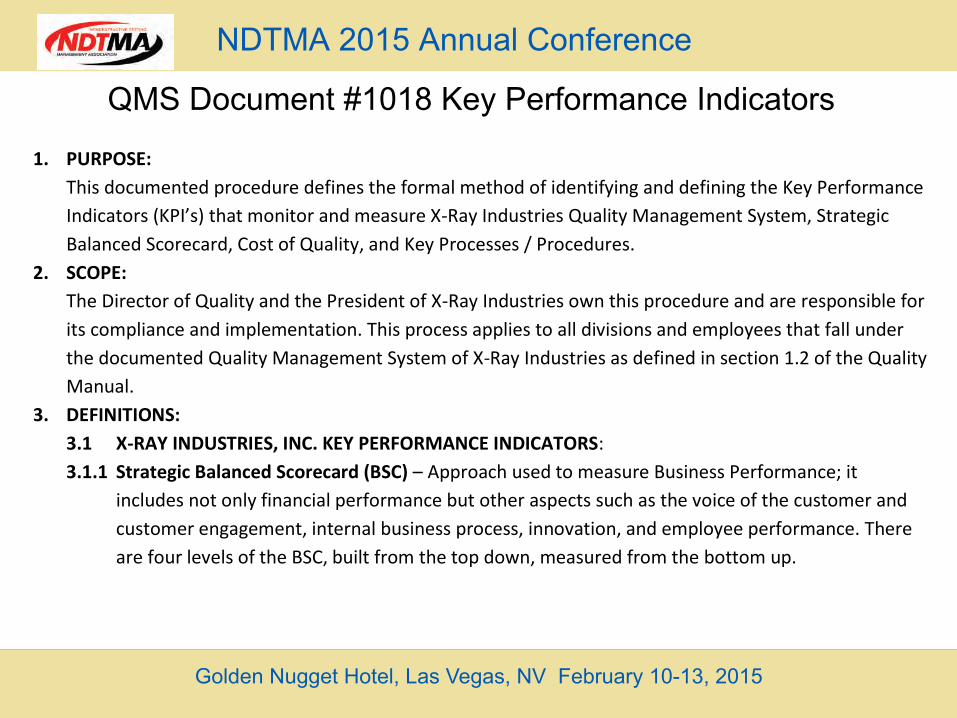
1. PURPOSE: This documented procedure defines the formal method of identifying and defining the Key Performance Indicators (KPI’s) that monitor and measure X-‐Ray Industries Quality Management System, Strategic Balanced Scorecard, Cost of Quality, and Key Processes / Procedures.
2. SCOPE: The Director of Quality and the President of X-‐Ray Industries own this procedure and are responsible for its compliance and implementation. This process applies to all divisions and employees that fall under the documented Quality Management System of X-‐Ray Industries as defined in section 1.2 of the Quality Manual.
3. DEFINITIONS: 3.1 X-‐RAY INDUSTRIES, INC. KEY PERFORMANCE INDICATORS: 3.1.1 Strategic Balanced Scorecard (BSC) – Approach used to measure Business Performance; it
includes not only financial performance but other aspects such as the voice of the customer and customer engagement, internal business process, innovation, and employee performance. There are four levels of the BSC, built from the top down, measured from the bottom up.
QMS Document #1018 Key Performance Indicators
NDTMA 2015 Annual Conference
Golden Nugget Hotel, Las Vegas, NV February 10-13, 2015
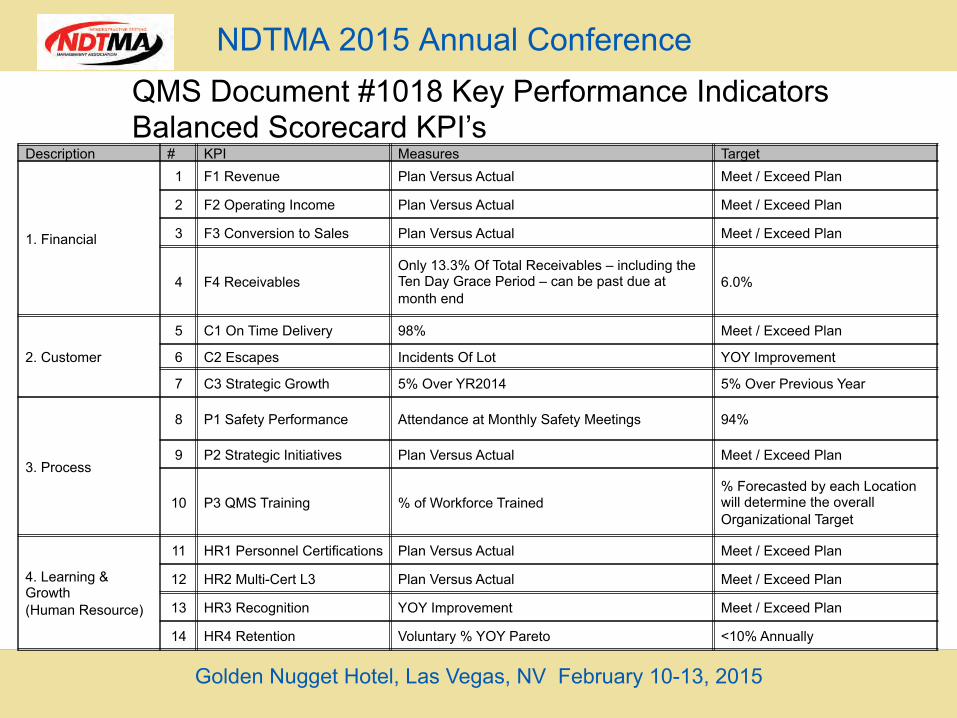
QMS Document #1018 Key Performance Indicators Balanced Scorecard KPI’s
Description # KPI Measures Target
1. Financial
1 F1 Revenue Plan Versus Actual Meet / Exceed Plan
2 F2 Operating Income Plan Versus Actual Meet / Exceed Plan
3 F3 Conversion to Sales Plan Versus Actual Meet / Exceed Plan
4 F4 Receivables Only 13.3% Of Total Receivables – including the Ten Day Grace Period – can be past due at month end
6.0%
2. Customer
5 C1 On Time Delivery 98% Meet / Exceed Plan
6 C2 Escapes Incidents Of Lot YOY Improvement
7 C3 Strategic Growth 5% Over YR2014 5% Over Previous Year
3. Process
8 P1 Safety Performance Attendance at Monthly Safety Meetings 94%
9 P2 Strategic Initiatives Plan Versus Actual Meet / Exceed Plan
10 P3 QMS Training % of Workforce Trained % Forecasted by each Location will determine the overall Organizational Target
4. Learning & Growth (Human Resource)
11 HR1 Personnel Certifications Plan Versus Actual Meet / Exceed Plan
12 HR2 Multi-Cert L3 Plan Versus Actual Meet / Exceed Plan
13 HR3 Recognition YOY Improvement Meet / Exceed Plan
14 HR4 Retention Voluntary % YOY Pareto <10% Annually

NDTMA 2015 Annual Conference
Golden Nugget Hotel, Las Vegas, NV February 10-13, 2015
3.1.2 Cost of Poor Quality (COPQ) – For the purpose of this controlled procedure the COPQ is defined as the costs from services not conforming to customer requirements, internal and external process failures resulting in waste rework, travel costs, and corrective actions. Corrective / Preventive actions such as first, second or third party audits are not included in these costs. Failure costs are broke down into the following categories.
KPI Description # Description Of Failure Cost Collection
Certification Errors 15 A nonconformance to a certification resulting in a re-print of that particular certification. Location Burden Rate x ¼ HR
Scrap Film 16 A nonconformance to a film shot resulting in a re-shot. (Excludes Tests Shots) Price of Film + $2.38
Escapes 17 Product that reaches customer that has not been inspected to customer written requirements
Material Costs, Burden Rate, Travel Expenses any other costs that may be accrued due to the Escape
Corrective Actions 18 Steps that are taken to eliminate the causes of existing nonconformities in order to prevent recurrence
Material Costs, Burden Rate, Travel Expenses any other costs that may be accrued due to the CA
Deficiency Reports 19 A nonconformance to a Customer P.O. in regards to flow-down requirements Location Burden Rate x ¼ HR
18 Month Nadcap Merit 20 As Defined In PRI’s NOP 008 Procedure As Defined In PRI’s NOP 008 Procedure
24 Month Nadcap Merit 21 As Defined In PRI’s NOP 008 Procedure As Defined In PRI’s NOP 008 Procedure
QMS Document #1018 Key Performance Indicators
NDTMA 2015 Annual Conference
Golden Nugget Hotel, Las Vegas, NV February 10-13, 2015
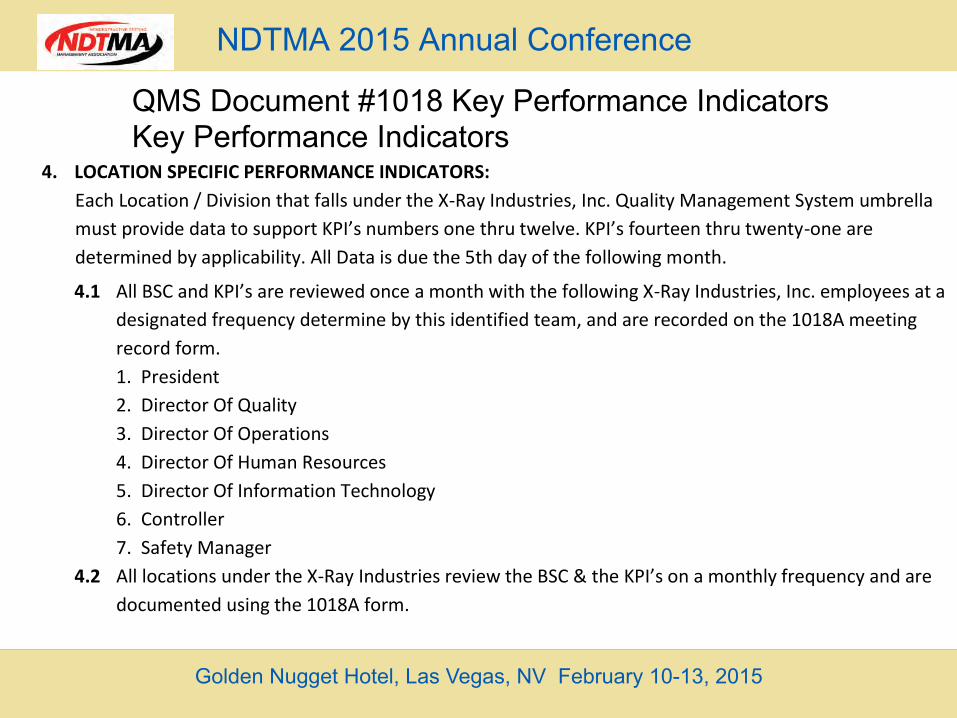
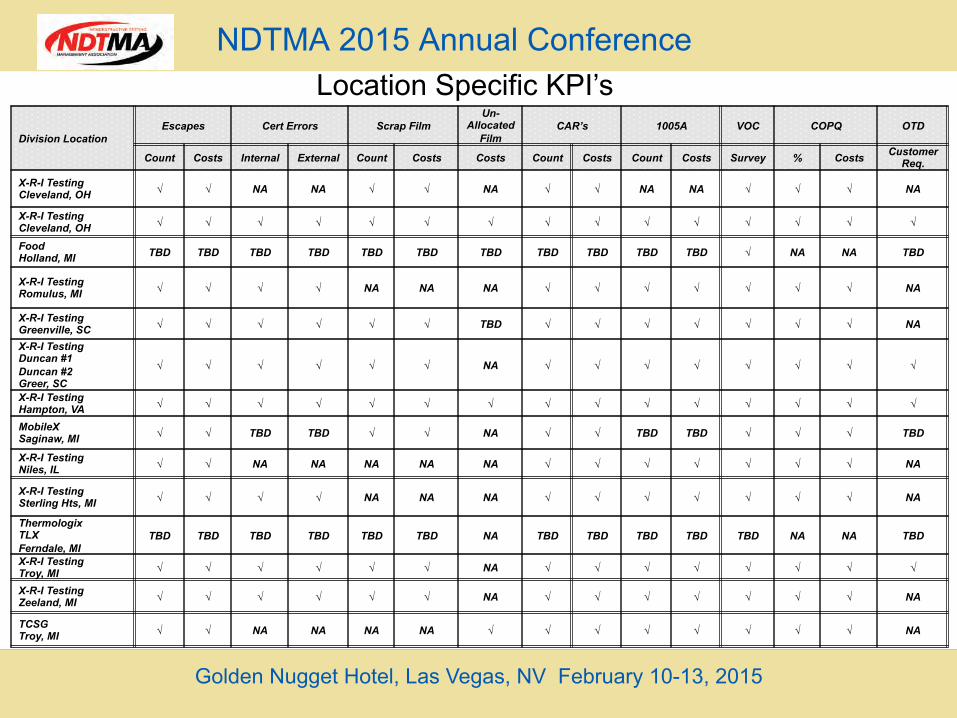
4. LOCATION SPECIFIC PERFORMANCE INDICATORS: Each Location / Division that falls under the X-‐Ray Industries, Inc. Quality Management System umbrella must provide data to support KPI’s numbers one thru twelve. KPI’s fourteen thru twenty-‐one are determined by applicability. All Data is due the 5th day of the following month.
4.1 All BSC and KPI’s are reviewed once a month with the following X-‐Ray Industries, Inc. employees at a designated frequency determine by this identified team, and are recorded on the 1018A meeting record form. 1. President 2. Director Of Quality 3. Director Of Operations 4. Director Of Human Resources 5. Director Of Information Technology 6. Controller 7. Safety Manager
4.2 All locations under the X-‐Ray Industries review the BSC & the KPI’s on a monthly frequency and are documented using the 1018A form.
QMS Document #1018 Key Performance Indicators Key Performance Indicators
NDTMA 2015 Annual Conference
Golden Nugget Hotel, Las Vegas, NV February 10-13, 2015
Location Specific KPI’s Division Location
Escapes Cert Errors Scrap Film Un-
Allocated Film
CAR’s 1005A VOC COPQ OTD
Count Costs Internal External Count Costs Costs Count Costs Count Costs Survey % Costs Customer Req.
X-R-I Testing Cleveland, OH √ √ NA NA √ √ NA √ √ NA NA √ √ √ NA
X-R-I Testing Cleveland, OH √ √ √ √ √ √ √ √ √ √ √ √ √ √ √
Food Holland, MI TBD TBD TBD TBD TBD TBD TBD TBD TBD TBD TBD √ NA NA TBD
X-R-I Testing Romulus, MI √ √ √ √ NA NA NA √ √ √ √ √ √ √ NA
X-R-I Testing Greenville, SC √ √ √ √ √ √ TBD √ √ √ √ √ √ √ NA
X-R-I Testing Duncan #1 Duncan #2 Greer, SC
√ √ √ √ √ √ NA √ √ √ √ √ √ √ √
X-R-I Testing Hampton, VA √ √ √ √ √ √ √ √ √ √ √ √ √ √ √
MobileX Saginaw, MI √ √ TBD TBD √ √ NA √ √ TBD TBD √ √ √ TBD
X-R-I Testing Niles, IL √ √ NA NA NA NA NA √ √ √ √ √ √ √ NA
X-R-I Testing Sterling Hts, MI √ √ √ √ NA NA NA √ √ √ √ √ √ √ NA
Thermologix TLX Ferndale, MI
TBD TBD TBD TBD TBD TBD NA TBD TBD TBD TBD TBD NA NA TBD
X-R-I Testing Troy, MI √ √ √ √ √ √ NA √ √ √ √ √ √ √ √
X-R-I Testing Zeeland, MI √ √ √ √ √ √ NA √ √ √ √ √ √ √ NA
TCSG Troy, MI √ √ NA NA NA NA √ √ √ √ √ √ √ √ NA
NDTMA 2015 Annual Conference
Quality Management & Strategic Planning Key Performance Indicators
Ø Balanced Scorecard (BSC) The concept behind a Balanced Scorecard is to translate Strategic Planning into an actionable model to monitor and measure an organizations performance as it relates to their strategic business planning.
Golden Nugget Hotel, Las Vegas, NV February 10-13, 2015
NDTMA 2015 Annual Conference
Golden Nugget Hotel, Las Vegas, NV February 10-13, 2015
Financial Metrics Forecast Actual B/(W) Status Financial Metrics Forecast Actual B/(W) Status Financial Metrics Forecast Actual B/(W) Status Financial Metrics Forecast Actual B/(W) Status Financial Metrics Forecast Actual B/(W) Status
F1 -‐ Revenue F1 -‐ Revenue F1 -‐ Revenue F1 -‐ Revenue F1 -‐ Revenue
F2 -‐ Op Income F2 -‐ Op Income F2 -‐ O Income F2 -‐ Op Income F2 -‐ Op Income
F3 -‐ Conversion F3 -‐ Conversion F3 -‐ Conversion F3 -‐ Conversion F3 -‐ Conversion
F4 -‐ Receivables F4 -‐ Receivables F4 -‐ Receivables F4 -‐ Receivables F4 -‐ Receivables
Champion: Champion: Champion: Champion: Champion:
Target Date: Target Date: Target Date: Target Date: Target Date:
Champion: Champion: Champion: Champion: Champion:
Target Date: Target Date: Target Date: Target Date: Target Date:
Champion: Champion: Champion: Champion: Champion:
Target Date: Target Date: Target Date: Target Date: Target Date:
Champion: Champion: Champion: Champion: Champion:
Target Date: Target Date: Target Date: Target Date: Target Date:
Champion: Champion: Champion: Champion: Champion:
Target Date: Target Date: Target Date: Target Date: Target Date:
Champion: Champion: Champion: Champion: Champion:
Target Date: Target Date: Target Date: Target Date: Target Date:
Champion: Champion: Champion: Champion: Champion:
Target Date: Target Date: Target Date: Target Date: Target Date:
Descripton: Descripton:
Champion: Champion: Champion: Champion: Champion:
Target Date: Target Date: Target Date: Target Date: Target Date:
Descripton: Descripton:
Champion: Champion: Champion: Champion:
Target Date: Target Date: Target Date: Target Date:
Descripton: Descripton:
Champion: Champion: Champion: Champion:
Target Date: Target Date: Target Date: Target Date:
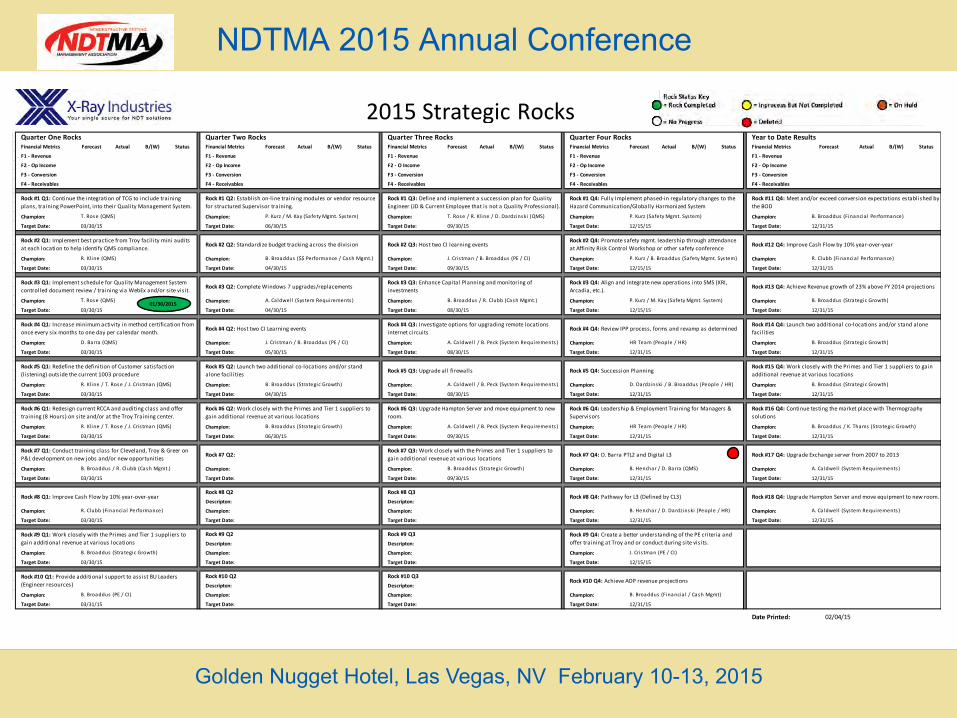
Date Printed: 02/04/15
B. Broaddus (PE / CI) B. Broaddus (Financia l / Cash Mgmt)
03/31/15 12/31/15
Rock #10 Q1: Provide additional support to assist BU Leaders (Engineer resources)
Rock #10 Q2 Rock #10 Q3Rock #10 Q4: Achieve AOP revenue projections
B. Broaddus (Strategic Growth) J. Cris tman (PE / CI)
03/30/15 12/15/15
Rock #9 Q1: Work closely with the Primes and Tier 1 suppliers to gain additional revenue at various locations
Rock #9 Q2 Rock #9 Q3 Rock #9 Q4: Create a better understanding of the PE criteria and offer training at Troy and or conduct during site visits.
R. Clubb (Financia l Performance) B. Henchar / D. Dardzinski (People / HR) A. Ca ldwel l (System Requirements)
03/30/15 12/31/15 12/31/15
Rock #8 Q1: Improve Cash Flow by 10% year-‐over-‐yearRock #8 Q2 Rock #8 Q3
Rock #8 Q4: Pathway for L3 (Defined by CL3) Rock #18 Q4: Upgrade Hampton Server and move equipment to new room.
B. Broaddus / R. Clubb (Cash Mgmt.) B. Broaddus (Strategic Growth) B. Henchar / D. Barra (QMS) A. Ca ldwel l (System Requirements)
03/30/15 09/30/15 12/31/15 12/31/15
03/30/15 06/30/15 09/30/15 12/31/15 12/31/15
Rock #7 Q1: Conduct training class for Cleveland, Troy & Greer on P&L development on new jobs and/or new opportunities Rock #7 Q2:
Rock #7 Q3: Work closely with the Primes and Tier 1 suppliers to gain additional revenue at various locations Rock #7 Q4: D. Barra PTL2 and Digital L3 Rock #17 Q4: Upgrade Exchange server from 2007 to 2013
Rock #6 Q1: Redesign current RCCA and auditing class and offer training (8 Hours) on site and/or at the Troy Training center.
Rock #6 Q2: Work closely with the Primes and Tier 1 suppliers to gain additional revenue at various locations
Rock #6 Q3: Upgrade Hampton Server and move equipment to new room.
Rock #6 Q4: Leadership & Employment Training for Managers & Supervisors
Rock #16 Q4: Continue testing the market place with Thermography solutions
R. Kl ine / T. Rose / J. Cris tman (QMS) B. Broaddus (Strategic Growth) A. Ca ldwel l / B. Peck (System Requirements) HR Team (People / HR) B. Broaddus / K. Thams (Strategic Growth)
R. Kl ine / T. Rose / J. Cris tman (QMS) B. Broaddus (Strategic Growth) A. Ca ldwel l / B. Peck (System Requirements) D. Dardzinski / B. Broaddus (People / HR) B. Broaddus (Strategic Growth)
03/30/15 04/30/15 08/30/15 12/31/15 12/31/15
03/30/15 05/30/15 08/30/15 12/31/15 12/31/15
Rock #5 Q1: Redefine the definition of Customer satisfaction (l istening) outside the current 1003 procedure
Rock #5 Q2: Launch two additional co-‐locations and/or stand alone facil ities Rock #5 Q3: Upgrade all firewalls Rock #5 Q4: Succession Planning
Rock #15 Q4: Work closely with the Primes and Tier 1 suppliers to gain additional revenue at various locations
Rock #4 Q1: Increase minimum activity in method certification from once every six months to one day per calendar month. Rock #4 Q2: Host two CI Learning events
Rock #4 Q3: Investigate options for upgrading remote locations internet circuits Rock #4 Q4: Review IPP process, forms and revamp as determined
Rock #14 Q4: Launch two additional co-‐locations and/or stand alone facil ities
D. Barra (QMS) J. Cris tman / B. Broaddus (PE / CI) A. Ca ldwel l / B. Peck (System Requirements) HR Team (People / HR) B. Broaddus (Strategic Growth)
T. Rose (QMS) A. Ca ldwel l (System Requirements) B. Broaddus / R. Clubb (Cash Mgmt.) P. Kurz / M. Kay (Safety Mgmt. System) B. Broaddus (Strategic Growth)
03/30/15 04/30/15 08/30/15 12/15/15 12/31/15
03/30/15 04/30/15 09/30/15 12/15/15 12/31/15
Rock #3 Q1: Implement schedule for Quality Management System controlled document review / training via WebEx and/or site visit. Rock #3 Q2: Complete Windows 7 upgrades/replacements
Rock #3 Q3: Enhance Capital Planning and monitoring of investments
Rock #3 Q4: Align and integrate new operations into SMS (XRI, Arcadia, etc.). Rock #13 Q4: Achieve Revenue growth of 23% above FY 2014 projections
Rock #2 Q1: Implement best practice from Troy facil ity mini audits at each location to help identify QMS compliance. Rock #2 Q2: Standardize budget tracking across the division Rock #2 Q3: Host two CI learning events
Rock #2 Q4: Promote safety mgmt. leadership through attendance at Affinity Risk Control Workshop or other safety conference Rock #12 Q4: Improve Cash Flow by 10% year-‐over-‐year
R. Kl ine (QMS) B. Broaddus ($$ Performance / Cash Mgmt.) J. Cris tman / B. Broaddus (PE / CI) P. Kurz / B. Broaddus (Safety Mgmt. System) R. Clubb (Financia l Performance)
T. Rose (QMS) P. Kurz / M. Kay (Safety Mgmt. System) T. Rose / R. Kl ine / D. Dardzinski (QMS) P. Kurz (Safety Mgmt. System) B. Broaddus (Financia l Performance)
03/30/15 06/30/15 09/30/15 12/15/15 12/31/15
Quarter One Rocks Quarter Two Rocks Quarter Three Rocks Quarter Four Rocks Year to Date Results
Rock #1 Q1: Continue the integration of TCG to include training plans, training PowerPoint, into their Quality Management System.
Rock #1 Q2: Establish on-‐line training modules or vendor resource for structured Supervisor training.
Rock #1 Q3: Define and implement a succession plan for Quality Engineer (JD & Current Employee that is not a Quality Professional).
Rock #1 Q4: Fully Implement phased-‐in regulatory changes to the Hazard Communication/Globally Harmonized System
Rock #11 Q4: Meet and/or exceed conversion expectations established by the BOD
2015 Strategic Rocks
01/30/2015
NDTMA 2015 Annual Conference
Golden Nugget Hotel, Las Vegas, NV February 10-13, 2015
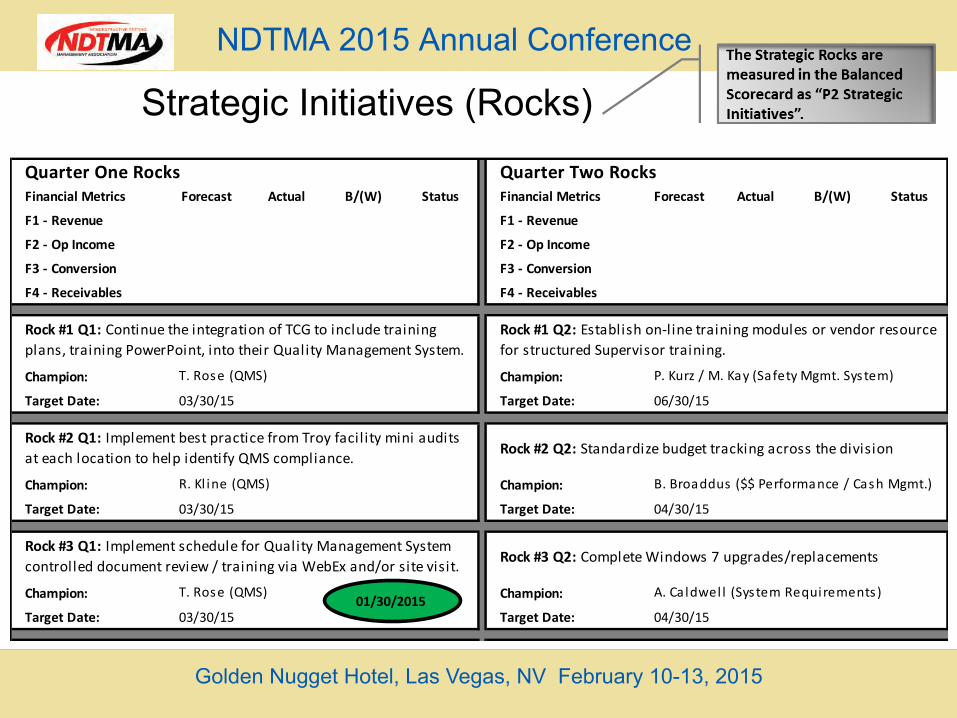
Strategic Initiatives (Rocks)
Financial Metrics Forecast Actual B/(W) Status Financial Metrics Forecast Actual B/(W) Status
F1 -‐ Revenue F1 -‐ Revenue
F2 -‐ Op Income F2 -‐ Op Income
F3 -‐ Conversion F3 -‐ Conversion
F4 -‐ Receivables F4 -‐ Receivables
Champion: Champion:
Target Date: Target Date:
Champion: Champion:
Target Date: Target Date:
Champion: Champion:
Target Date: Target Date:
T. Rose (QMS) A. Ca ldwel l (System Requirements)
03/30/15 04/30/15
03/30/15 04/30/15
Rock #3 Q1: Implement schedule for Quality Management System controlled document review / training via WebEx and/or site visit. Rock #3 Q2: Complete Windows 7 upgrades/replacements
Rock #2 Q1: Implement best practice from Troy facil ity mini audits at each location to help identify QMS compliance. Rock #2 Q2: Standardize budget tracking across the division
R. Kl ine (QMS) B. Broaddus ($$ Performance / Cash Mgmt.)
T. Rose (QMS) P. Kurz / M. Kay (Safety Mgmt. System)
03/30/15 06/30/15
Quarter One Rocks Quarter Two Rocks
Rock #1 Q1: Continue the integration of TCG to include training plans, training PowerPoint, into their Quality Management System.
Rock #1 Q2: Establish on-‐line training modules or vendor resource for structured Supervisor training.
2015 Strategic Rocks
01/30/2015
NDTMA 2015 Annual Conference
Golden Nugget Hotel, Las Vegas, NV February 10-13, 2015
Forecast Forecast Forecast ForecastActual Actual Actual ActualB/(W) B/(W) B/(W) B/(W)
Target Overall Target TargetActual Actual Actual $0
B/(W) B/(W) B/(W)
Target Overall Target TargetActual Actual ActualB/(W) B/(W) B/(W)
Target Target Target TargetActual Actual Actual ActualB/(W) B/(W) B/(W) B/(W)
F1 Revenue F2 Operating Income F3 Conversion F4 Receivables
C1 -‐ On Time Delivery C2 -‐ Escapes C3 -‐ Strategic Growth
P1 -‐ Safety Performance P2 -‐ Strategic Initiatives P3 -‐ Engagement Of QMS
Yellow = Close To TargetRed= ≤ To Target
HR1 -‐ Personnel Certifications HR2 -‐ Multi-‐Cert L3 HR3 -‐ Recognition HR4 -‐ Retention
Dash Board KeyGreen = ≥ To Target
1. Leadership2. Strategic Planning
2. Strategic Planning3. Customer Focus
2. Strategic Planning5. Workforce Focus
4. Measurement Analysis & Knowledge Management6. Operations Focus
7. Results7.1 Service and Process Results, 7.2 Customer Results, 7.3 Workforce Results,
7.4 Leadership & Governance Results, 7.5 Financial & Market Results
Performance ExcellenceCriteria
There are Four Levels of the Balanced Scorecard
Financial
Process
Customer
Learning &
Growth
2
3
4
Leading IndicatorTo Process
Leading IndicatorTo Customer
Leading IndicatorTo Financial
1
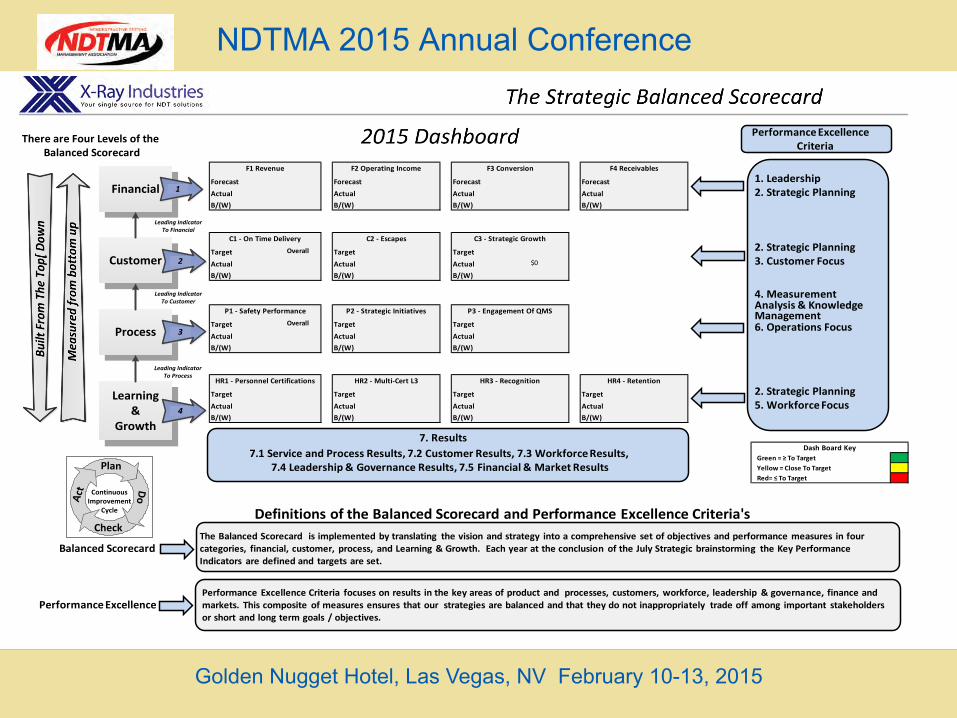
The Balanced Scorecard is implemented by translating the vision and strategy into a comprehensive set of objectives and performance measures in fourcategories, financial, customer, process, and Learning & Growth. Each year at the conclusion of the July Strategic brainstorming the Key Performance Indicators are defined and targets are set.
Performance Excellence Criteria focuses on results in the key areas of product and processes, customers, workforce, leadership & governance, finance and markets. This composite of measures ensures that our strategies are balanced and that they do not inappropriately trade off among important stakeholders or short and long term goals / objectives.
Balanced Scorecard
Performance Excellence
Definitions of the Balanced Scorecard and Performance Excellence Criteria's
Plan
Act
Check
DoContinuousImprovement
Cycle
NDTMA 2015 Annual Conference
Golden Nugget Hotel, Las Vegas, NV February 10-13, 2015
The Strategic Balanced Scorecard
7 -‐ Results
Performance Excellence Criteria
1 – Leadership2 – Strategic Planning
3 – Customer Focus
4-‐ Measurement Analysis & Knowledge Management6 – Operations Focus
5 – Workforce Focus
Financial
Process
Customer
Learning &
Growth
2
3
4
Leading IndicatorTo Process
Leading IndicatorTo Customer
Leading IndicatorTo Financial
1
F3 Conversion
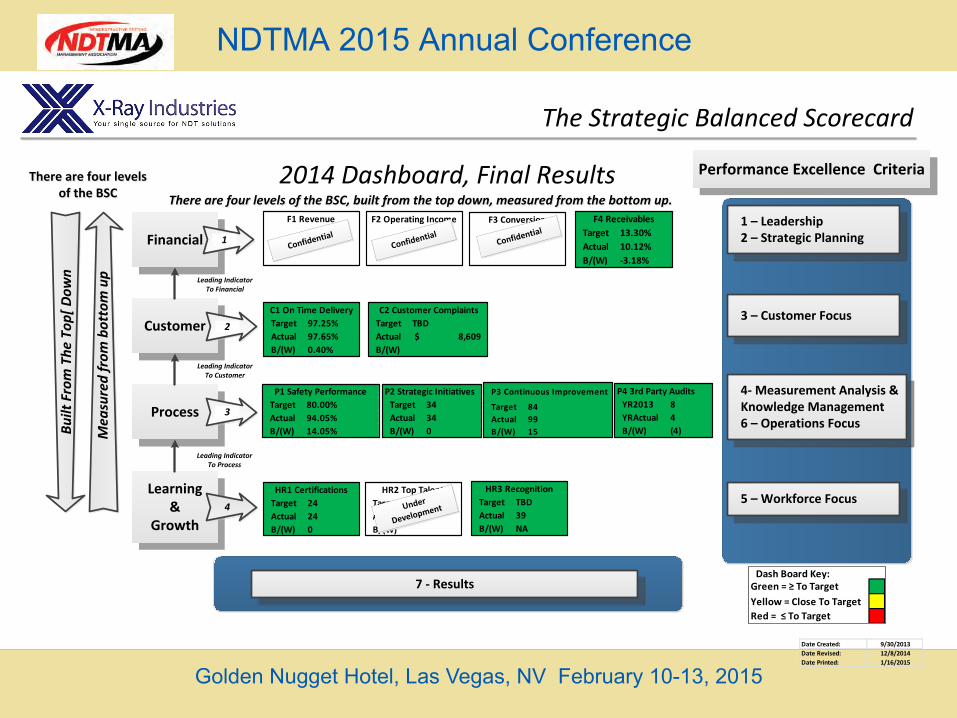
2014 Dashboard, Final ResultsThere are four levels of the BSC
There are four levels of the BSC
Mea
sured from
bottom up
There are four levels of the BSC, built from the top down, measured from the bottom up.There are four levels of the BSC, built from the top down, measured from the bottom up.
Built From The
Top
[ Dow
n
Date Created: 9/30/2013Date Revised: 12/8/2014Date Printed: 1/16/2015
F2 Operating Income
Green = ≥ To TargetYellow = Close To TargetRed = ≤ To Target
Dash Board Key:
Confidential Confid
ential
TargetActualB/(W)
HR2 Top Talent
Under
Development
TargetActualB/(W)
F4 Receivables13.30%10.12%-‐3.18%
TargetActualB/(W)
C2 Customer ComplaintsTBD $ 8,609
TargetActualB/(W)
P1 Safety Performance80.00%94.05%14.05%
TargetActualB/(W)
P2 Strategic Initiatives34 34 0
TargetActualB/(W)
HR1 Certifications24 24 0
TargetActualB/(W)
C1 On Time Delivery97.25%97.65%0.40%
TargetActualB/(W)
84 99 15
P3 Continuous Improvement
TargetActualB/(W)
HR3 RecognitionTBD39 NA
YR2013YRActualB/(W)
P4 3rd Party Audits8 4 (4)
F1 Revenue
Confidential
NDTMA 2015 Annual Conference
Golden Nugget Hotel, Las Vegas, NV February 10-13, 2015
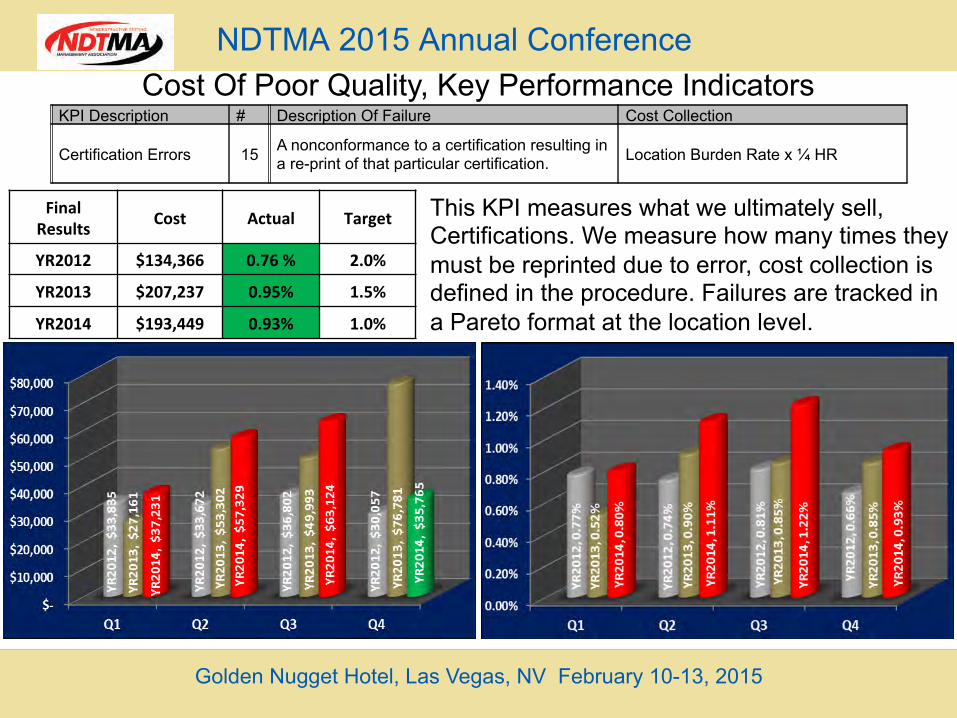
KPI Description # Description Of Failure Cost Collection
Certification Errors 15 A nonconformance to a certification resulting in a re-print of that particular certification. Location Burden Rate x ¼ HR
Cost Of Poor Quality, Key Performance Indicators
Final Results Cost Actual Target
YR2012 $134,366 0.76 % 2.0%
YR2013 $207,237 0.95% 1.5%
YR2014 $193,449 0.93% 1.0%
This KPI measures what we ultimately sell, Certifications. We measure how many times they must be reprinted due to error, cost collection is defined in the procedure. Failures are tracked in a Pareto format at the location level.
NDTMA 2015 Annual Conference
Golden Nugget Hotel, Las Vegas, NV February 10-13, 2015
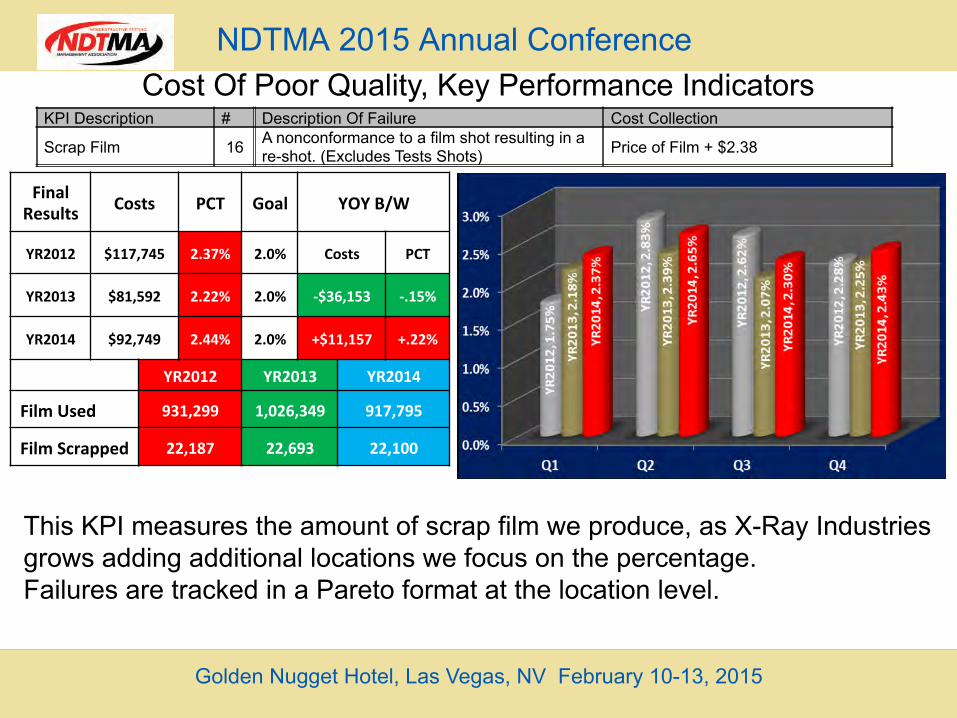
Cost Of Poor Quality, Key Performance Indicators KPI Description # Description Of Failure Cost Collection
Scrap Film 16 A nonconformance to a film shot resulting in a re-shot. (Excludes Tests Shots) Price of Film + $2.38
Final Results Costs PCT Goal YOY B/W
YR2012 $117,745 2.37% 2.0% Costs PCT
YR2013 $81,592 2.22% 2.0% -‐$36,153 -‐.15%
YR2014 $92,749 2.44% 2.0% +$11,157 +.22%
YR2012 YR2013 YR2014
Film Used 931,299 1,026,349 917,795
Film Scrapped 22,187 22,693 22,100
This KPI measures the amount of scrap film we produce, as X-Ray Industries grows adding additional locations we focus on the percentage. Failures are tracked in a Pareto format at the location level.
NDTMA 2015 Annual Conference
Golden Nugget Hotel, Las Vegas, NV February 10-13, 2015
Cost Of Poor Quality, Key Performance Indicators
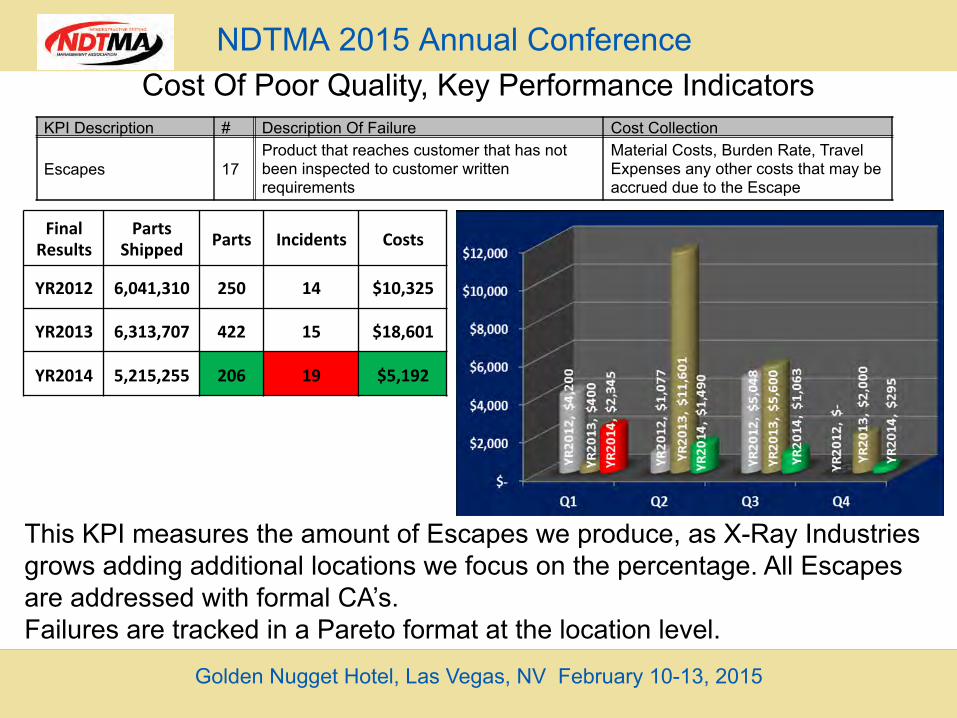
This KPI measures the amount of Escapes we produce, as X-Ray Industries grows adding additional locations we focus on the percentage. All Escapes are addressed with formal CA’s. Failures are tracked in a Pareto format at the location level.
KPI Description # Description Of Failure Cost Collection
Escapes 17 Product that reaches customer that has not been inspected to customer written requirements
Material Costs, Burden Rate, Travel Expenses any other costs that may be accrued due to the Escape
Final Results
Parts Shipped Parts Incidents Costs
YR2012 6,041,310 250 14 $10,325
YR2013 6,313,707 422 15 $18,601
YR2014 5,215,255 206 19 $5,192
NDTMA 2015 Annual Conference
Golden Nugget Hotel, Las Vegas, NV February 10-13, 2015
Cost Of Poor Quality, Key Performance Indicators
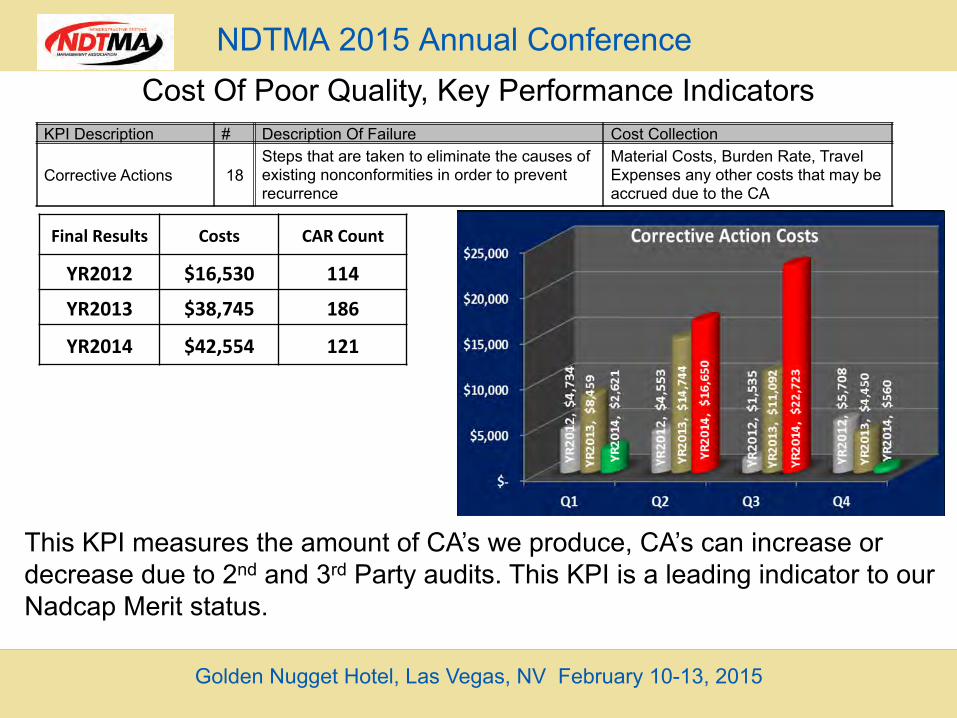
This KPI measures the amount of CA’s we produce, CA’s can increase or decrease due to 2nd and 3rd Party audits. This KPI is a leading indicator to our Nadcap Merit status.
KPI Description # Description Of Failure Cost Collection
Corrective Actions 18 Steps that are taken to eliminate the causes of existing nonconformities in order to prevent recurrence
Material Costs, Burden Rate, Travel Expenses any other costs that may be accrued due to the CA
Final Results Costs CAR Count
YR2012 $16,530 114
YR2013 $38,745 186
YR2014 $42,554 121

NDTMA 2015 Annual Conference
Golden Nugget Hotel, Las Vegas, NV February 10-13, 2015
Cost Of Poor Quality, Key Performance Indicators KPI Description # Description Of Failure Cost Collection
Deficiency Reports 19 A nonconformance to a Customer P.O. in regards to flow-down requirements Location Burden Rate x ¼ HR
Final Results Costs No. YOY B/W
YR2012 $15,580 2,332 Costs No.
YR2013 $24,363 2,743 +$,8,783 +411
YR2014 $27,884 3,437 +$3,521 +694
Division Costs 1005A Count
Cleveland, OH $10,996 1,443
Greenville, SC $588 80
Greer, SC $168 23
Troy, MI $14,875 1,724
Zeeland, MI $1,109 167
Note: This KPI is a flow-down during contract review. Here we measure correct customer requirements as it relates to the product we are to inspect.
Deficiency reporting is addressed in 1001 Contract review procedure.
NDTMA 2015 Annual Conference
Golden Nugget Hotel, Las Vegas, NV February 10-13, 2015
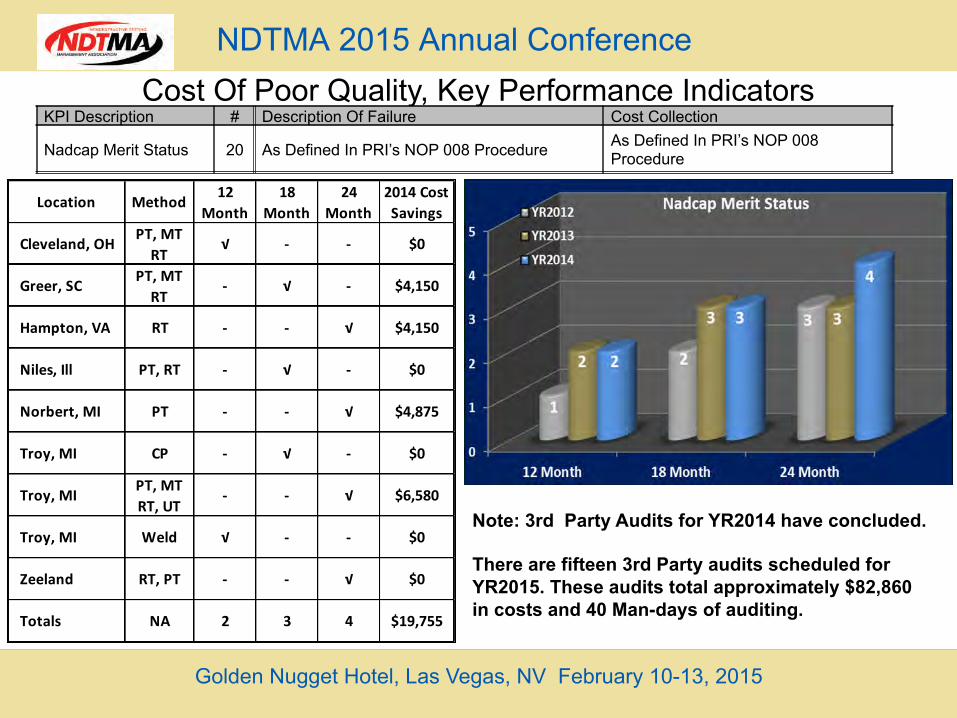
Cost Of Poor Quality, Key Performance Indicators KPI Description # Description Of Failure Cost Collection
Nadcap Merit Status 20 As Defined In PRI’s NOP 008 Procedure As Defined In PRI’s NOP 008 Procedure
Note: 3rd Party Audits for YR2014 have concluded. There are fifteen 3rd Party audits scheduled for YR2015. These audits total approximately $82,860 in costs and 40 Man-days of auditing.
Location Method 12 Month
18 Month
24 Month
2014 Cost Savings
Cleveland, OH PT, MTRT
√ -‐ -‐ $0
Greer, SC PT, MTRT
-‐ √ -‐ $4,150
Hampton, VA RT -‐ -‐ √ $4,150
Niles, Ill PT, RT -‐ √ -‐ $0
Norbert, MI PT -‐ -‐ √ $4,875
Troy, MI CP -‐ √ -‐ $0
Troy, MI PT, MTRT, UT
-‐ -‐ √ $6,580
Troy, MI Weld √ -‐ -‐ $0
Zeeland RT, PT -‐ -‐ √ $0
Totals NA 2 3 4 $19,755

NDTMA 2015 Annual Conference
Golden Nugget Hotel, Las Vegas, NV February 10-13, 2015
Questions?
NDTMA 2015 Annual Conference
Thank you for your participation in the NDTMA
2015 Annual Conference
Golden Nugget Hotel, Las Vegas, NV February 10-13, 2015


![History qualitymanagement en_130301 [alleen-lezen] dome 2 2409 15.30 uur](https://img.dokumen.tips/doc/110x75/5593ed2d1a28ab583b8b4594/history-qualitymanagement-en130301-alleen-lezen-dome-2-2409-1530-uur.jpg)