Embed Size (px)
Citation preview
1
"Quality of Elementary Education among the tribal children of Meghalaya" an analytical study
PROJECT REPORT SUBMITTED TO THE NATIONAL COUNCIL OF EDUCATIONAL RESEARCH AND TRAINING
NEW DELHI
DR. RITA RANI TALUKDAR ASSOCIATE PROFESSOR
DEPARTMENT OF PSYCHOLOGY GAUHATI UNIVERSITY,GUWAHATI, ASSAM
2013

2
"Quality of Elementary Education among the tribal
children of Meghalaya" an analytical study
PROJECT REPORT SUBMITTED TO THE NATIONAL COUNCIL OF EDUCATIONAL RESEARCH AND TRAINING
NEW DELHI
DR. RITA RANI TALUKDAR ASSOCIATE PROFESSOR
DEPARTMENT OF PSYCHOLOGY GAUHATI UNIVERSITY,GUWAHATI, ASSAM
2013

3
Preface As a nation, we are committed to providing free and compulsory education to all students up to the age of fourteen. Unfortunately, even after more than five decades of independence the goal continues to elude us on account of our failure to enroll and retain all children in the educational system. Education is a process as well as a produce. To create good product out of education it must be consistent with the qualitative method of methodologies. This study focuses on improving the quality of education of the tribal children in the rural areas of Meghalaya. If educational facilities are to be fully utilized by the target population, the need to develop a qualitative school programmed with adequate human and material resources is paramount; only then can appropriate outcomes be ensured. The researcher is grateful to several individuals and institutions for directly or indirectly inspiring in the conception and execution of this study. Ms. Nidawan Pynhun Langki Pakma, the Research Investigator supported and cooperated with me to complete this project. I am extremely thankful to all the principals of all the 15 schools of Meghalaya and also the Assistant teachers for helping me in the collection of the relevant data (i) contained in various documents of yester years stacked in remote almirahs (ii) through administration of lengthy test and questionnaires to the pupils (iii) through filling up of school and teacher questionnaires. For the free and frank expression of their viewpoints which shows their trust and confidence in the researcher; for their help and cooperation in the collection of cent percent record in record time of one and a half year, and last but not the least, for their cordial hospitality. I cannot adequately thank them. In the analysis of the results of the study, the statistician Dr. J.P Goel of North Eastern Hills University offered useful suggestion. I am very thankful to him for the same. I am highly thankful to the Librarian of National Council of Education Research and Training, Shillong, North Eastern Hills University, state Central Library, Shillong for providing facilities of studying in their libraries.

4
CONTENTS
CHAPTER-I INTRODUCTION 6-14
Definition- Education 10
Elementary Education 12 Quality of Education 12
CHAPTER-II REVIEW OF LITERATURE 16-26
CHAPTER-III OBJECTIVES OF THE STUDY 28
CHAPTER-IV RESEARCH METHODOLOGY 30-33
CHAPTER-V RESULTS, ANALYSIS AND DISCUSSION 35-71
CHAPTER-VI LIMITATION, SUGGESTION AND CONCLUSION 73-76
CHAPTER-VII RESUME 78-81
BIBLIOGRAPHY 82-87
ANNEXURE 88

5
CHAPTER-1
INTRODUCTION
6
CHAPTER -1
INTRODUCTION Education of the masses is one of the most crucial concern of democratic, socialistic countries. It is so because of the Indispensable nature of education in modern society which is increasingly becoming more scientific and technological. Further education opens up to the individual the central experiences of a culture thus personal growth economic advancement and social effectiveness- all are appreciably enhanced by education which is indispensable for success in a competitive society. It would not be exaggeration to say that education has become a sine qua non of useful existence in modern technical and democratic societies. Rather it has become the life-line of both the individual and the society. Education is so far as it is basic to the full enjoyment of the right and responsibilities of an individual, rightly considered as the very embodiment of social justice. It is regarded not only as an end in itself but also as a means in the long range perspective of bringing about social equality and quality education. The Indian constitution identifies for social consideration contains ethnic minority groups, traditionally referred to as tribes or tribal as Scheduled tribes (STs) who constitute around eight percent of the total population of the country. Most of the tribal communities have their own language different from the language spoken in the state where they are located. The tribal language in India belongs to all major language families and which the Austric, the Dravidian, Tibeto-chinese and Indo-European families are the dominant ones. One of the distinguishing features of ST's is that the majority of them live in scattered habitations located in interior, remote and inaccessible hilly and forest areas of the country. Though tribal constitute a majority in several states and union territories and sizeable population in others in particular, Mizoram constitute an overwhelm majority 94.75 percent and Meghalaya 85.53 percent. Meghalaya, one of the several north eastern states is a far and small state in India inhabited by van-vasis (tribal), it is called the Scotland of the East. The nature is open and the weather is very charming. The state of Meghalaya came into existence on 21st January, 1972. Although a white paper was bought out by the education department in 1988, there has been no attempt to frame a clear out policy on education. The constitution amendment of 1976 placed education in the concurrent list of the constitution of India. This has been brought about a sharing of
7
responsibilities between the central and the state government. More importantly for a resource poor state like Meghalaya this has meant a welcome infusion of funds from the central government. The state will therefore, frame its policy within the broad parameters of the national policy on the education 1986 (NPE 1986) and share the responsibilities and function as partners with the central government in the implementation of the objective of the NPE 1986. The national policy on education (NPE) was adopted by the parliament in May 1986. It was modified in 1992 based on the recommendation of the committee set up at the request of the Central Advisory Board of Education. The framework of the NPE 1986 was and only a few modifications were incorporated in what is now called the "National Policy on Education 1986- Revised policy formulation". The state has a predominantly rural population. However the rural continue to suffer from under-development especially in the field of education. The high dropout rate has been a major of concern to the state government as well as central government. The reasons are varied and accountable, for the phenomenon of varying degrees. The government of India has introduced the midday meal programme in the primary schools of the country in the year 1995 and has extended its coverage up to upper primary school in the educational backward blocks with effect from 1st October 2007. The programme is being implemented in the state and there have been many problems of logistic etc. A recent evaluation was carried out by NEHU (North Eastern Hills University) has found that enrollment and retention has improved as result of the midday meal. Therefore Meghalaya has taken various steps to improve the educational system, this results in Meghalaya which is not only an exotic tourist destination but an educational destination as well. The free and compulsory education till the age of fourteen adds to the educational development and increasing literacy rate of the state. The literacy rate of Meghalaya which is 63.31 percent (approximately) as according to the 2001 census show the newly emerging educational development of the state making it an educational, destination not only for the students of North-east but from anywhere in the country. Improving the performance of the elementary school education is the most important challenge in elementary education. This is because of the fact that they play an important role in the educational system. Although efforts have been made to improve the quality of the teacher yet little has been achieved in this
8
regard. When we talk about the materials they teach, their teaching skills and motivation level, it is felt that much is to be done. Therefore some broad strategies have been taken up for the development and strengthening of the teacher's education by setting up teacher education institute. Education especially at the elementary level has always remained a matter of concern for the government of India since independence. From the historical stand point various reports have been prepared to make elementary education available to the masses through educational programmes of universal enrolment, universal retention and universal success. But then in the most part of the country even universal enrolment at the elementary level has still remained a major concern. In most part of North Eastern India, That is largely inhabited by the scheduled tribes, it is not an issue. But very poor holding capacity of the schools and entry at later levels of education in this region questions the quality of education provided at the basic education level. Further it is a fact that the ultimate goal of education is not universal enrolment and retention but to improve the quality of human-life participate effectively in the developmental activities and pursue higher education. All these are related to the quality education imparted at the primary and upper primary levels. On the quality front however. unfortunately there exist confusion in so far as the precise meaning of the word quality of education is concerned. Generally the phrase "the quality of education" implies standard and efficiency. It includes availability of teachers, quality of instruction, syllabi and curricula, test issues, examination system etc. With this perspective one cannot refer to the quality of education without looking into the availability of all those attributes of education. It is a fact that majority of schools in rural areas are found in building which cannot cope with extreme weather conditions and seriously reduce the working days. There are cases where school functions without teacher and where trained teacher are scarce particularly women teachers. The point which is being put forward is that these conditions have close link with quality. In fact they are internal to education. It will be disastrous to think that a good system can be taught without equipments, without good classroom atmosphere and without adopting activity-based instruction for which the teachers need proper motivation and well-planned in-service training programme. It implies that a reasonable good classroom atmosphere, qualified teachers trained in activity methods with good motivation are must and foremost conditions to improve the quality of education. The content of syllabus and curriculum will closely follow them.
9
The question also arises when we talk about the quality of education in concern with the academic test. Are intervention that focus directly on improving test scores for students which are already in schools are explicitly rewarding for doing well on tests? may be in the form of scholarship etc. Perhaps the most interesting case is the one in between. Intervention that purport to improve the quality of learning experience but for which no evidence exist that they actually do improve learning then the intervention that improve the health of the school children, incentives for teacher and blackboards and other school inputs. If these programmes affect attendance, it is only because school quality goes up. In such cases, we expect an improvement in test scores among those who were already in school. The quality of teacher in these schools often leaves much to be desired. Or it could the case that the children do not learn because they do not want to. While the goals of universal literacy and enrolment are laudable in themselves, the achievement in these areas would remain hollow without ensuring quality education, in order to make them more responsive to the learning needs of individuals and the development needs of different socio-economic sectors, continuous to be major challenge. The challenge of providing quality education at the elementary level involves improvements in the preparation, motivation and development of teachers, the quality of textbooks and of infrastructural facilities. It also involves making education relevant to society's needs and strengthening the management and institutional capacity of educational institutions especially at the state, district and local level. Improving the quality of textbook is crucial as they are the main instructional aids in elementary schools and are the only reading material foremost students. The quality of infrastructural facilities (particularly toilets for girls) equipment and support services also have a signiifcant impact on enrolment and retention. In this context, the main challenge is to provide a classroom for every teachers in the primary and upper primary schools and a separate room for the headmaster in upper primary schools along with playground facilities and clean toilets. Although one third of the expenditure approved under DEEP is earmarked for the construction of building etc; there are substantial number of primary schhols without these facilities. The main thrust is the tenth year plan should be to ascertain that all the primary schools have pucca building with all supporting infrastructure facilities. A large number of children drop out of the schools because of the reason relating to the school environment. These includes attitude of the

10
teachers, irrelevant curriculum, substandard and uninteresting teaching, teacher absents, corporal punishment, poor school infrastructure, inability to cope with pace of learning, lack of parental support in the case of first generation learners, maladjustment etc. Girls form the majority of the dropouts in all categories. The National Family Health Survey II (NHPS-II) conducted in 1998-99also observed that main reason for students dropping out include their not being interested in studies. The Sarva Sikshsa Abhiyan (SSA) aims to support (i) strengthening the preschool component in ICDS by need based training of Anganwadi sevikas, provision of learning materials etc (ii) setting up balwadis as pre-school centers in uncovered areas (iii) building advocacy on the importance of the early child development (iv) organizing training programmes for community leaders (v) providing for intensive planning for ECCE (vi) development of materials (vii) promoting convergence between the school and the ECCE. Therefore, education is an end in itself. It is something which people value because it opens new horizons extend freedom and create opportunities. It is not just a fundamental right but also an enabling right. DEFINITION EDUCATION: The word education has a wide connotation. Therefore it is difficult to give one definite meaning of the term education. The reason is that education is an abstract entity and its concept is dynamic. Education deals with ever-growing men in ever-growing society. Its concept therefore can never be static. It must continuously grow and change. The word education comes from the Latin word "educare", "to bring up" or "to nourish". According to this view the child is to be brought up according to certain aims and ends in view. There is yet another Latin word "educere" which means "to lead out" or "to draw out". According to this view, the main purpose of this education is to lead out or to draw out rather than to put in. Education therefore means growth or development. Mahatma Gandhi defined education as "By education I mean an all round drawing out of the best in child and mans Body, mind and spirit". Education therefore not only means acquisition of knowledge or experience but it also means the development of habit attitudes and skills which help a man to lead a useful and worthwhile life. The meaning of education has been interpreted by various educational thinkers which can be classified into two main categories:-
11
(i) Narrow meaning : Education in narrow sense is a planned, organized and formalized process. It is imparted at a particular place like school or college, for a definite time and by definite persons. The curriculum is formed where the teachers made deliberate efforts to inculcate values, attitude and produce literate man. Hence, education is a purposeful activity, deliberately planned with a definite purpose. Education is regarded synonymous with instruction. (ii) Wider meaning: Education in a wider sense includes all influence in life. It is not related to schooling alone but includes each and every experience that influences an individual and modifies his behavior. Here education is a life-long process there is no time limit for the purpose. It includes all our experiences. In this broad sense, life is education and education is life. It influences an individual throughout his life. The dictionary of education (ed.good) defines education as the aggregate of all the process which a person develops like ability, attributes and other forms of behavior of practical value in the society in which he lives, the social process by which the people are subjected to the influence of a selected and controlled environment so that they may obtain social competence and optimum individual development. In the words of Swami Vivekananda "Education is the manifestation of perfection already in man". Education enlightens the minds of the individuals. It eliminates prejudice and superstition and bigotry. It removes the darkness of ignorance from the human minds and the best things out of the individuals. It helps in the development of intelligence, aptitudes, abilities, capacitance and personality as a whole in a healthy manner. It brings individuals of a family, community society very close to each other. It assists to prepare a plan for future progress and healthy prosperity of all. It encourages to live and let live other peacefully and happily. Every child should be educated compulsorily. More specially education develops abilities, attitudes and other form of behavior, which are valuable in the society in which the individuals live that is, the form of behavior installed by education should be useful to the individual and the society. Education therefore, must be as initiation into worthwhile activities or modes of thought and conduct. Thus, it must involve not only rational thought process but also worthwhile things for the balanced development of an individual and the improvement of the human lot. It places educational institutions firmly in a relationship with wider social institutions.

12
Education is only the image and reflection of the society. It imitates and reproduces the letter in abbreviated form, it does not create it. E.Durkheim, suicide, 1897. ELEMENTARY EDUCATION : Elementary education is considered as the branch of edcational pyramid - super structure of system .It is the elementary education which lays strong foundation for the child's physical. Intellectual, emotional and social development. Dr. Kothari rightly said "The destiny of India is being shaped in its class room". Thus there is no denying the fact that the nations strength rest on the strong foundation of the primary education or elementary education. It is elementary education which helps in the eradication of adult illiteracy and makes the most significant contribution to the efficient functioning of our democracy. Normally, elementary education begins with the initiation of a child into a formal school. In other words, the beginning for formal education is called the elementary education. It refers to the first form of five years of schooling. In most states it includes class I-V covering children in the age group of 5-10 years. Elementary education covers the primary (6-11 years) and upper primary (11-14 years) age groups. In most Indian states, this translates into the successful completion of prescribes educational requirement till class VII. The essence of goal is for every 14 year old to have acquired foundation skills such as the ability to read and write with fluency, numeracy, comprehension, analysis, reasoning and social skills such as team work. Equally, elementary education should instill in children. Courage, curiosity, independence, resourcefulness, resilience, patience and understanding. While this is recognized by Indian policy documents in practice, the formal elementary education system is always accused of not developing this skills in children. QUALITY OF EDUCATION The quality of learning activities has traditionally been defined in terms of the inputs to a programme, institution or system preferably, measures of outputs (especially levels of learning achievement and graduation rates) used as substitutes for or at least complement the input measures. The definition and
13
analysis of learning quality depends exclusively on input-output measures. Quality is central to education. Quality is important because it constitutes the soul and life of education. Education without quality has no meaning because it cannot respond to the social demands. It depends upon two basic things: (i) Redesigning the system in terms of content and teaching methods (ii) providing basic values in the curriculum. It may be noted that the Kothari Commission (1964-66) emphasized the need to raise the efficiency of the system by revamping it. Quantitative expansion will be of value only if it is supported by quality improvement programmes and value oriented education. The quality of education is indicative of the extent to which educational objectives are realized. It has been succinctly put in the national policy on education as "access with success". Undoubtedly, the educational outcome is the result of interactive effects of the process and the context of education. The context covers such variables as the community, developmental characteristics of the learners, curriculum and learning material, availability of physical facilities etc. Important inputs is professional competency level of the teacher. These input in themselves, though important from the point of view of quality of education in the school system do not ensure the quality. The quality of education depends upon the manner in which inputs are operated to match learner characteristics and instructional objectives. In other words, process is the key of quality of education. The process generates conducive organizational climate in a school, and socio emotional and intellectual climates in the classroom. Learning and achievement depends on these. Another dimension of the quality of education refers to the level of learning quality of children. In schools with reasonable quality of education all children learn and achieve to their potential. The quality of education, therefore can be defined as the process of building and operating the learning environment in the schools to stimulate learning of all children to their potential. The input indicators of the quality of education are the access including school buildings, supplies, teachers, curriculum and teaching. The output indicators are learning and achievement of pupils in terms of knowledge, skills and attitude. ASHA is an NGO working on a project called Asha Tribal Child Education. ASHA, spread in ten remote villages of Purulia, West Bengal, aims at increasing
14
education level among the less privileged tribal and backward children. It also reduces dropouts among the children by building a bridge between weak elementary education infrastructure and secondary education in this locality. Adams 1998 said that the precise meaning of education quality and the path to improvement of quality are often left unexplained. Examined within context, education quality apparently may refer to inputs. (numbers of teacher, amount of teacher training, number of textbooks etc) process (amount of direct instructional time, extent of active learning), outputs (test scores and graduation rates) and outcomes (performance in subsequent employment) . Additionally, quality education may imply simply the attaining of specified targets and objectives. More comprehensive views are also found, an interpretation of quality may be based on an institution's or program’s reputation, the extent to which schooling has influenced change in student's knowledge, attitudes, values and behavior, or a complete theory or ideology of acquisition and application of learning.
15
CHAPTER-2
REVIEW OF LITERATURE
16
CHAPTER -2
REVIEW OF LITERATURE
According to the annual status of Educational Reports (ASER) the largest annual survey of rural children done by a voluntary organization called PRATHAM, among children in government school is standard V, the ability to do mathematical division problems has actually declined from 41% to 36%. While government might take credit for increasing elementary school enrolment by almost 60 million between 2003-2009. It is yet to take any concrete step to access the quality of education being passed on the future citizens of the country. Moreover around 50 percent of children in class V in village government schools cannot read a passage prescribed for their friends in class I elsewhere. There is also a shortage of 1.2 million teachers at the elementary level alone. But when it comes to the allocating funds; teachers training has fared poorly. Only 25 percent of the total 11th plan outlay has been allocated in the budget from 2007 for strengthening the teachers training institutes. V.Krishnamacharyulu (2006) study enrolment and retention his data suggests that in 1995-96 almost 109 million children were enrolled in primary schools, up from 94 million in1991. But school attendance was often irregular, and dropout rates high. About 33 million were out school in 1995. With a view to improve the quality of education through audio visual techniques the government of Andhra Pradesh introduced the audio-visual scheme in 1986-87 to equip the primary schools with TV's and VCP's and RCCP's. While appreciating the scheme the government of India included the scheme in the centrally sponsored schemes and sanctioned 75% funds on TV's and 100% funds on RCCP from 1989-90. The government has provided18,008 TV's and 48,485 RCCP's to primary schools. Further, the government of AP has supplied audio cassettes to 19,158 schools and sanctioned Rs. 600 towards the maintenance of AV equipments to12763 schools. Further the government of AP has also supplied a package of video cassettes containing curricular programmers’. The main objectives are to increase enrolment in primary schools to make instruction attractive and reduce the dropout rates and to increase the environment conducive to obtain better participation of students. By 1993 the number of classrooms required for the age cohort had
17
grown to almost 2.65 million. Under OBB 1,50,000 classrooms were constructed by 1993-94 (MHRD 1995). The data suggest that while progress is being made in providing classrooms the supply is far beyond the expected level. As a result in many states classrooms are not available. According to All India Educational Survey in AP 3055 primary schools ie 6.21% in the state do not have in the classroom for instructional purpose. According to MHRD, Dept of Education, government of India 1989 at upper primary level GER stood at 34.55 state like Meghalaya recorded 61.66 ratio. According to Acharya Ramamurthi report states that drop out rate between classes I – VIII was 60.70% for boys and 70.05% for girls and 71.5% for ST boys and 78.43% for ST girls (universalization of primary education of rural girls in India, Usha Nayan NIEPA). A study in West Bengal in Mathematics achievement level made at the end of grade 4 in 15 districts found that about 20% of the students secured the minimum expected score (Roy Mitra and Ray, 1995). In another study conducted in 22 states under primary education curriculum renewal projects, Dave and other reported that the average grade 4 achievements was 35% in language, 32% mathematics, 34% in social studies and 32% in science compared with a pass mode of 35% for all subjects. NCERT (Shukla, 1994) found that boys average grade by achievement score in 1991 was 41.1% correct and girls 45.6% correct. Boys outperformed girls in arithmetic’s in 12 states, while girls outperformed boys in 4 states. In 15 states boys outperformed girls in word knowledge and in no state did girls out performed boys. The 1993 study of random sample of grade 4 and 5 students in low literacy districts in 8 states in Arithmatic and in all states in language. But in half of the states the average gender gap in achievement was less than 10% of a standard deviation and in all states it was less than 20% of standard deviation. International evidence shows that educational gaps narrow for two principal reasons: Enrolment gaps as the education expands to provide access to all and achievement gaps close when the education system targets intervention selectively (World Bank Documents, 1996). Children from poor households score lower on achievement test than do children from economically rich families. In all states achievement was higher for children’s with a higher socio-economic status. The gap in achievement between the highest and lowest quartile by socio-economic status (SES) is on an average about one-third of the standard deviation (The World Bank Report 1996).
18
The 1991 survey indicates the achievement score of SC’s and ST’s is slightly lower in all the achievement when compared to non-backward caste students. 38.5% for ST students compared with average for all students of 40.6% (Shukla 1994). The dropout rate of children’s coming from poor families is on an average 4 times higher than that of the children’s coming from rich families (NCAER 1994). This gap is too large in rural areas than in urban areas. (The World Bank Report, 1996) Andhra Pradesh, village pilot project (K.S Rao, members of the parliament, Lok sabha). The pilot project in the village of Andhra Pradesh focused on Vocational training and enhancing of skills to enable self employment. School buildings were developed with provision of audio-visual equipments. In order to increase enrolment and attendance of students mid-day meal programme were implemented. Study tours were also organized for students. Nagaland: (Communication of education from Parimal Bardhan, delegation of the European Commission, New Delhi and Nagaland, Human development report 2004) To enhance the process of universalisation of elementary education and quality and upgradation, the government of Nagaland introduce the Nagaland Communitization of public institution and service Act in 2002. Under this act, responsibility of managing the school both administrative and financial was given to the Village Education Committee (VEC). The VEC had the power to deduct the salaries of teachers in case of long absenteeism. The VEC was also responsible for universal enrolment and retention of children upto the age of 14 years. Since the communitisation in septmber 2002, there has been an increase in the enrolment rate for example in the village of Rushoma in Kohima, the enrolment in government primary schools at Thephezou from 20 in 2002 to 53 in 2003 and in Ruso Bawe from 37 in 2002 to 73 in 2003. A four country study by Filp in the early 1980's of Argentina, Bolivia, Chile and Columbia (Myers, 1992) showed lower age at enrolment of children with pre school education for each country except Bolivia. The study population comprises 2545 children. A study by Nimnicht of Columbia's Promesa (Myers, 1992) showed a large positive impact on enrolment. A study in the integrated child development scheme (ICDS) in Haryana by Chaturvedi in 1987 showed an increase in enrolment at the right age (Myer, 1992).
19
Anima Rani (2008) studied the midday programme and initiate as means of acheiving primary education of satisfactory quality for all the school children below the age of 14 by increasing enrolment, improving attendance and retention and simultaneously improving the nutritional status. This paper attempts to investigate some of this aspects based on primary data collected from Khurda district of Orissa. Data was colected from the school as well as from a sample of household of school children. The investigation includes a study of the organizational structure of programme and also examines the cooked meals and dry ration variants. Ajanta Brahma (2007) studied quality issues in elementary education against backdrop along with universal enrolment and universal retention Universal acheivement has been stressed by the NPE 86. since then many schemes/interventions were launched countrywide in order to address obstacles put forth on the path of quality education like review of curriculum, reorientation of teacher training program, supply of teaching aid, midday meal, TLM grant etc. Although due to the strategies adopted on these areas have succeeded to some extent improvement of enrolment, reduction of dropout and gender gap, but in regards to quality education the progress seems to be not yet satisfactory in case of socially disadvantaged group of children. Therefore this paper has pondered over various constraints of ST children on quality education and have put forth some suggestions for overcoming those short-comings. Jean Breze and Aparajita Goyal(2003) suggests that school meals have made a promising start around the country. Yet quality issues need urgent attention if midday meal programme are to realize their full potential. Improve midday meal programmes could have a major impact on school attendance, child nutrition and social quality. Midday meals in schools of tribal areas in the state of Maharastra studied by Sunita Chugh (2008) found that 8.1 million children in Maharastra are being served the cooked meal regularly in the working days of the session and the improvement in the attendance also implies that midday meal is one of the most significant incentives for children to attend the school regularly. The samples were collected from twelve schools from 4 districts and nine blocks were also selected. Schools were identified in consultation with the state departments on the basis of the good practices followed in the implementation of mid day scheme. One out of the twelve schools was for boys only and the remaining are co-educational. Out of 12 schools seven were upto upper primary level whereas five schools were upto primary level only.
20
According to the Planning Commission tenth five year plan assumed that enrolment at the primary level (Grade I to V) increased from 19.16 million in 1950-51 to 113.61 million in 1999-2000. The percentage share of girls in total enrolment both at the primary and upper primary level has increased consistently. A study of Mona Sedwal and Sangeeta (2008) that dropout rates have been decreasing over a number of years for SC and ST and has been particularly noticeable since 2001. Exception to this positive trend includes the case of ST boys, as well as a total dropout rates amongst ST at the elementary level in 2003-2004. A study of DPEP by Reddy (2000) reveals that due to an insufficient and irregular supply of incentives some parents spent their small incomes on children's books, stationery and fees. So in spite of the government spending huge amount on incentives, the intended target group often does not receive the benefits of it. Some educational incentives are also being misused and not reaching the beneficiaries. This is partly due to the lack of awareness among Scheduled tribes’ parents about the nature, quality, quantity and mechanism involved in the distribution of the incentives. Naidu (1999) conducted a study to explore the impacts of midday meal programme in four states of South India: Tamil Nadu, Karnataka, Kerela and Andhra Pradesh. The midday meal scheme is the main attraction for ST students in Tamil Nadu and is noted as the main incentives for large scale enrolment in primary schools. Dreze and Goyal, (2003) studied a positive perception of the impact of midday meals. A large majority of teachers, for instance felt that midday meal boosted pupil enrolment and enhances interest in studies. L.N Bhagat and Ashok Oraon studied a number of programmes that have been initiated to achieve the goal universalisation of elementary education in India. This paper attempts to examine the actions taken and status achieved relating to school education in India. The challenges also look in to the remedies offered. Admitting that providing resources for educating the masses is biggest challenge, the study emphasizes the need for better access through improved quality and providing incentives for enrolment and attendance. The enrolment has significantly increased and the dropout rate has declined. Jeffery H. Marshall 2007 used detailed data on schools, teachers and class rooms to explain students’ achievement growth in rural Guatemala. Several variables that have received little attention in previous studies- including the number of
21
school days, teacher content knowledge are robust predictors of achievement. A series of decompositions by student ethnicity and type of school shed some additional light on important questions in the Guatemala context and beyond by identifying specific mechanism that help to explain a persistent indigenous student test score gap. Mullens, et al.(1996) studies the teacher content knowledge based on an exit exam, their overall score on a battery of performance tests or their responses to items included on primary level students exam (Santibanez, 2006). In each case higher levels of teacher knowledge predict more student achievement. Ranjan and Panda (2008) studied the effectiveness of village education committee on promoting UEE. The paper deals with functioning of village education committees set up by the government for improving quality of elementary education. The case study carried out in a tribal district of Orissa found it functionally effective. The results showed that all VEC members were involved in the construction of school building for primary school effectively. About 96.67% of VEC were trying their best for improvement of school environment, 90% of them were working satisfactorily for improving the school garden and plantation and 93.33% of VEC were working for development of TLM adequately and for its effective use. About 90% of VECs were working for adequacy of care of other school material to the best of their capacities. Thus care and management work for the VEC's were quite adequate and appropriate. The VECs also organized different activities in the school, enrolment drive meticulously, also maintain cordial relations with PTA and supervised work of the school system with intent for regular attendance for teachers. According to the planning commission report in its chapter 3 (Ninth year plan) about elementary education in Maharastra state, the state of economy in Maharastra will permit the state to not only quantitatively expand primary education but also make qualitative inputs as compared to Madhya Pradesh. A survey of the five year plan facilitates the understanding of the evolution of primary education in the rural areas. The scheme of free milk supply to the pupils of primary schools designed to improve their health. The scheme of merit scholarship also benefitted the students. The midday meal attracts more children to schools and also prevents absenteeism and dropout. To improve attendance of girls in schools of scheduled areas the plan provided for free supply of textbooks. slates, uniforms etc. During the fourth plan, the enrolment of students also, slightly increased and the decision of introducing subject wise teaching too. During the sixth plan a scheme for the construction of quarters for primary

22
teachers posted in tribal areas was also taken up. To achieve the target of universalisation of primary education by the year 2000, the appointment of primary teachers is done by the Zilla Parishad. Under this scheme, one teacher is to be appointed having an enrolment of 40 students .Several schemes for qualitative improvement are also prepared by the Directorate of Education and send to the Zilla Parishad for implementation. The Deputy Director of Education (primary) of the Zilla Parishad is responsible for the fixing of inspections of primary schools. All bright and deserving students in the rural areas are awarded scholarships by the state government through the Zilla Parishad. Social and rural research institute (2005) estimated that about 6.9% of the total children in the 6-13 groups were out of school and out of them 2.1% accounted dropout and 4.8% for never enrolled children, a bulk of whom apparently belonged to the poorer segments of rural households. Although SSA was launched in November 2000, only three states in the North East (Assam, Mizoram and Nagaland) could start it in 2001-02. By 2004-05, Meghalaya, Sikkim, Tripura, Arunachal Pradesh and Manipur had also started the programme. During the tenth plan, a composite centrally sponsored scheme (CSS) of "Quality improvement in schools" was introduced by converging the following five existing schemes: (i) Improving of science education in schools (ii) Promotion of Yoga in schools (iii) Environmental orientation to school education (iv) National population education project (v) International Science Olympiads. The results of learning achievement (Math, Languages, Environmental Studies, Science and Social Science) surveys conducted by NCERT and also by independent agencies (Annual Status of Education Report, 2005) highlight poor quality of learning. Therefore SSA attempt to strengthen a range of inputs that impact on quality viz recruitment of 7.95 lakh additional teachers to improve the pupil teacher ratio (PTR) from 44 to 40:1 at primary level, regular annual in service training of teachers for a period of 20 days, curriculum renewal and textbook development free distribution of textbooks for primary and upper primary classes to about 6.69 crores SCs and STSs. According to the Ministry of Human Resources and Development (2007) the average school attendance was around 70% of the enrolment in 2004-2005. In states, like UP and Bihar, the average attendance was as low as 57% and 42% respectively. One third of the teachers in MP, 25% in Bihar and 20% in UP do not attend schools. According to Alfred T. Kisubi, repeatation rates at primary level in

23
Uganda appear to have declined significantly for both boys and girls. Dropout rates show similar trends to boys and girls through grade 4. According to Amartya Sen's, Pratichi Research team (2005) the study shows that midday meal has made positive intervention in universalisation of primary education by increasing enrolment and attendance. The increase has been more marked with respect to girls and children belonging to SC/ST categories. The study also points out that midday meal scheme has contributed to reduction in teacher absenteeism and narrowing of social distances. According to UNICEF (2005) states that the introduction of menu based midday meal has positively impacted enrolment and attendance of children. It has been contributed to social equity, as children sit together and share a common meal irrespective of caste and class. It has further contributed to gender equality in that it has provided employment to women. Samaj Pragati Sahyog (2005) undertook a survey in 70 most backward villages. The findings show that there was a 15% increase in enrolment which was more marked in the case of SC and ST children (43%). CORD (2005) surveyed 12 MCD schools- School children in all schools were receiving food, impact of attendance more likely on girls who often come to school without breakfast. Farzana Afridi (2005) implementation of the programme is improving but a lot more needs to be done. The new initiative of 'Suruchi Bhojan' is more attractive than the earlier "Daliya" programme. Dr. Rama Naik (2005) has reported sharp rise in enrolment particularly in rural areas. The programme has had an impact on teacher absenteeism, 64% schools stated that teacher absenteeism has been reduced. NCERT (2005) learning achievement of students at the end of class 5 has inferred that children covered under midday meal have higher achievement level then those who were not covered under it. NIPC (2006-06): Midday meal improved the school attendance in majority of the schools and reduced the absenteeism. It has fostered a sense of sharing and fraternity and paved the way for social equity. NIPC (2007) school environment indicated marked improvement in enrolment pattern of children in primary school. Midday meal scheme undoubtedly resulted in increased school attendance and facilitated in retention of children in school for a longer period. The scheme has played a crucial role in reducing drop-out, especially among girls. Parents viewed that the midday meal has reduced the burden of providing one time meal to their children and

24
considered it as a great support to their families. Teachers opined that midday meal aided in active learning of children which indirectly improved their academic performance. The scheme has played a significant role in bringing social equity. According to the 6th All India Education survey 1993-94, there are 6.37 lakh primary and upper primary rural schools out of which only 44% have water supply facility 19% have urinals and 8% have laboratory facilities. Only 19% have separate urinals and 4% have laboratory facilities for girls. In the course of SSA implementation, a nationwide survey of 5th grade student achievement in mathematics and language was undertaken in 2002 to serve as a base line for measuring improved learning outcomes under the project. The result was better for language than for mathematics and slightly better for boys than for girls. Large differences were found across the states and districts as indicated by the high standard deviations. G G Wankhede and Sengupta (2005): This paper deals with decentralization of educational administration in West Bengal, India. It gives specific emphasis on studying educational committee formed with the community members at village level for looking after the management of primary schools in concerned localities. For the purpose of this study primary data have been collected from four village education committees. The data provides information on the formation, structure and functioning of village education committee. The findings contradict the ideology on the basis of which these committees are formed. The paper ends with an attempt to explore certain future paths of action. NCERT (2003): The overall average performance of students in Environmental Studies, Mathematics, Language was 50.30%, 46.51% and 58.57% respectively. Students’ achievement was better at language than Environmental studies which in turn was better than in mathematics. In all the states except in Bihar, Manipur and West Bengal, the achievement in Language was better than Environmental studies followed by Mathematics. The nationwide average achievement in decreasing order was language (58.59%), environmental studies (50.30%) and maths (46.51%). Habib Khan, Syed Dawood Shah (1999): Student demonstrated high performance in Science and Urdu whereas their performance was low in Mathematics. In Science and Urdu the performance of girls was significantly higher than that of boys whereas in math boys had an edge over girls. Multi Donor support unit (1995) found that schools in a mixed setting or with female teachers in rural areas would be conducive to increasing the student
25
performance as students taught by female teachers scored 64 as against 55 by students taught by male teachers. Charagh Din Arif, Saima Chaudhury and Uzma Gilani (1999) found out that students in all grades (3-5) obtained lowest marks in social studies. Students of grade 4 obtained lower scores in mathematics and Urdu than grade children. Research team of Bureau of Curriculum development and extension services (1999): Rural boys scored better than girls in Mathematics and social studies, while rural girls scored better in science. The sample was drawn from ten boys and ten girls’ schools from Manshera district. Eight students from each school were selected for testing on the basis of stratified sapling. Sangeeta Goyal (2007): This paper presents findings from a study of learning outcomes in grade 4 and 5 of government private aided and private unaided schools in Rajasthan. Approximately 6000 students were tested in 200 schools in three tests- two language tests and one test in mathematics. The survey also collected information on student, family background and school characteristics. The survey results showed that overall learning result were low absolutely and relatively in government school. The average percentage correct scores in government schools ranged from 40-50 percentage points a quarter to a fifth below the average scores in private schools. Anuradha Kumar (2004): Two major initiative has been taken during the eighth plan are the DPEP and the midday meal programme with a view to addressing the problem of equality access retention and quality at primary state. During the seventh plan, the enrolment of girls and children of ST and SC have shown an increase at the primary stage. The dropout rates have also shown a declining trend. H.D Dwarkanath (2002): The UP government has launched a special campaign to ensure admission of the entire eligible child population to primary schools. A similar campaign named "School Chalo Abhiyan" had been launched at the beginning of the academic session last year too, which paid dividends. According to state education department officials, while the rate of dropouts during earlier year was about 50%, last year the ratio came down to 28%. The launching of the campaign formally, the Chief Minister said to ensure free education to all, the government has decided to provide free textbooks to every student upto class 5. Till last year this facility was available only to girls and children belonging to SC and ST. In all 1.6 crore children would benefit from the free textbook scheme and this would entail an expenditure of Rs 50 crores to exchange.
26
HINDU (2001): As 35% of students in elementary and middle schools quit studies every year in Tamil Nadu, the centre has come up with a Rs. 300 crore package for the state to reduce dropout. Under its new SSA campaign (Education for All Scheme) the centre has already released the funds for the Tamil Nadu government to improve the quality of education and infrastructure in schools. According to school education department officials here, the government would use the funds to upgrade primary schools, middle schools where ever necessary and recruit teachers. As of now there are about 37000 primary and middle schools in the state. Then report of steering committee of the government on "Empowering the ST" (2001) draws our attention to the fact that there has been overall increase in the enrolment ratio of ST children in the primary and middle level school between 1990-91 and 1999-2000. It also revealed that the female literacy rate among the ST has increased substantially from 4.85% in 1971 to 18.91% in 1991. However it should be remembered that a person is technically considered literate if he/she possess elementary skills in reading, writing and arithmetic.
27
CHAPTER -3
OBJECTIVES OF THE STUDY
28
CHAPTER -3
OBJECTIVES OF THE STUDY
The present investigation aims at attaining the following objectives:
(i) To examine the status and quality of the physical infrastructure facilities in schools and analyze their relationship with students enrolment, retention and absenteeism and achievement.
(ii) To examine the status of teachers training across sex, locality and community.
(iii) To study student teacher ratio across locality. (iv) To investigate the quality of human resources in the context of
absenteeism, classroom transaction and achievement of learners. (v) To find out the existing in service training facilities for professional
growth and policy governing transfer of teachers. (vi) To examine delivery systems of educational incentives- such as midday
meals, free textbooks, free uniform, scholarships and other incentives and their relationship with the demand for education.
29
CHAPTER -4
RESEARCH METHODOLOGY
30
CHAPTER -4
RESEARCH METHODOLOGY
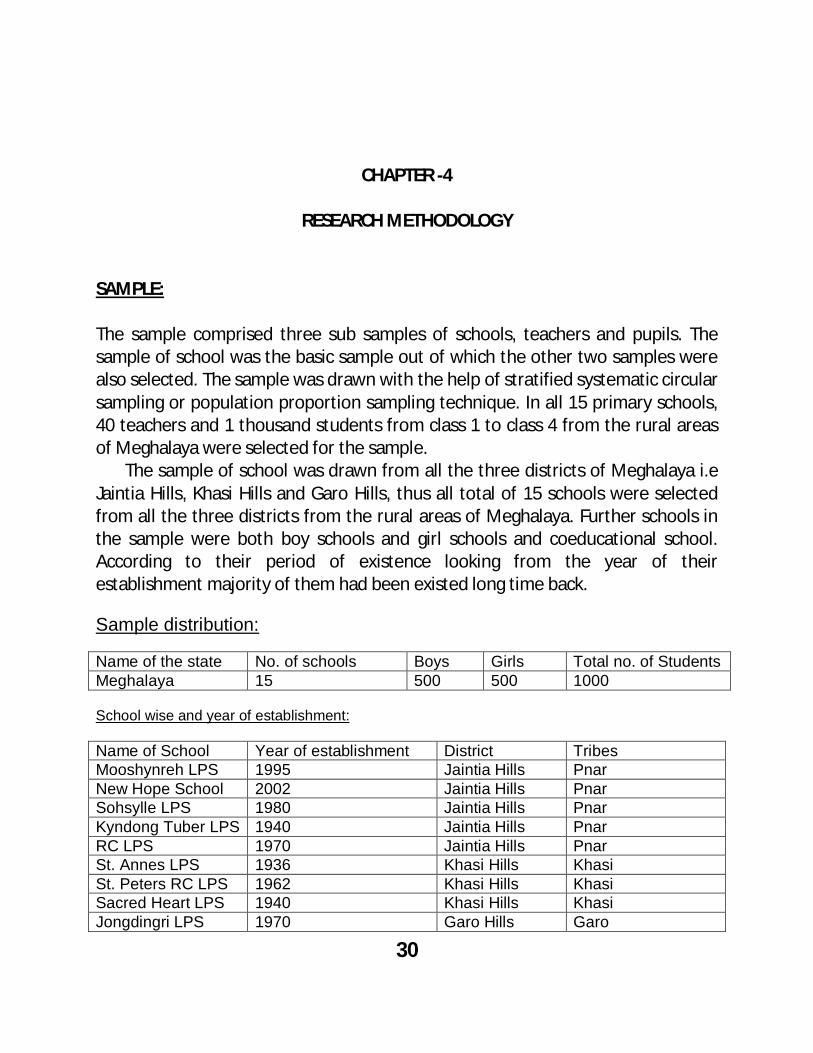
SAMPLE: The sample comprised three sub samples of schools, teachers and pupils. The sample of school was the basic sample out of which the other two samples were also selected. The sample was drawn with the help of stratified systematic circular sampling or population proportion sampling technique. In all 15 primary schools, 40 teachers and 1 thousand students from class 1 to class 4 from the rural areas of Meghalaya were selected for the sample. The sample of school was drawn from all the three districts of Meghalaya i.e Jaintia Hills, Khasi Hills and Garo Hills, thus all total of 15 schools were selected from all the three districts from the rural areas of Meghalaya. Further schools in the sample were both boy schools and girl schools and coeducational school. According to their period of existence looking from the year of their establishment majority of them had been existed long time back. Sample distribution: Name of the state No. of schools Boys Girls Total no. of Students Meghalaya 15 500 500 1000 School wise and year of establishment: Name of School Year of establishment District Tribes Mooshynreh LPS 1995 Jaintia Hills Pnar New Hope School 2002 Jaintia Hills Pnar Sohsylle LPS 1980 Jaintia Hills Pnar Kyndong Tuber LPS 1940 Jaintia Hills Pnar RC LPS 1970 Jaintia Hills Pnar St. Annes LPS 1936 Khasi Hills Khasi St. Peters RC LPS 1962 Khasi Hills Khasi Sacred Heart LPS 1940 Khasi Hills Khasi Jongdingri LPS 1970 Garo Hills Garo
31
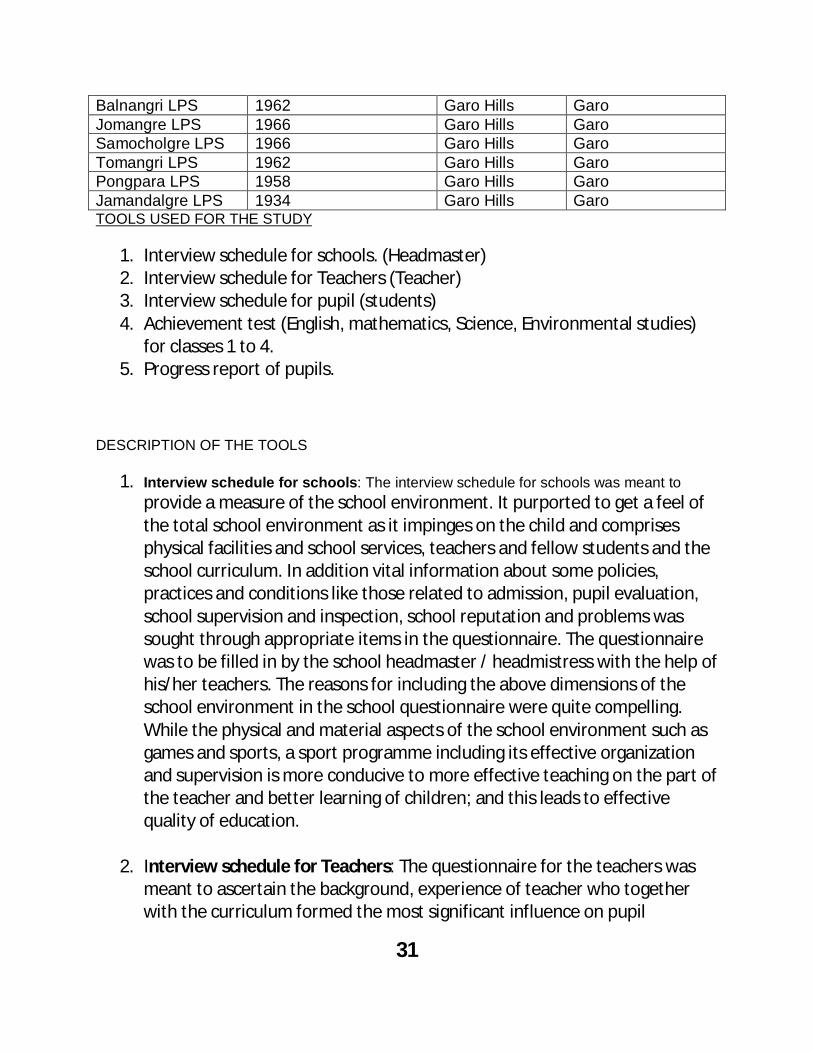
Balnangri LPS 1962 Garo Hills Garo Jomangre LPS 1966 Garo Hills Garo Samocholgre LPS 1966 Garo Hills Garo Tomangri LPS 1962 Garo Hills Garo Pongpara LPS 1958 Garo Hills Garo Jamandalgre LPS 1934 Garo Hills Garo TOOLS USED FOR THE STUDY
1. Interview schedule for schools. (Headmaster) 2. Interview schedule for Teachers (Teacher) 3. Interview schedule for pupil (students) 4. Achievement test (English, mathematics, Science, Environmental studies)
for classes 1 to 4. 5. Progress report of pupils.
DESCRIPTION OF THE TOOLS
1. Interview schedule for schools: The interview schedule for schools was meant to provide a measure of the school environment. It purported to get a feel of the total school environment as it impinges on the child and comprises physical facilities and school services, teachers and fellow students and the school curriculum. In addition vital information about some policies, practices and conditions like those related to admission, pupil evaluation, school supervision and inspection, school reputation and problems was sought through appropriate items in the questionnaire. The questionnaire was to be filled in by the school headmaster / headmistress with the help of his/her teachers. The reasons for including the above dimensions of the school environment in the school questionnaire were quite compelling. While the physical and material aspects of the school environment such as games and sports, a sport programme including its effective organization and supervision is more conducive to more effective teaching on the part of the teacher and better learning of children; and this leads to effective quality of education.
2. Interview schedule for Teachers: The questionnaire for the teachers was
meant to ascertain the background, experience of teacher who together with the curriculum formed the most significant influence on pupil

32
achievement thereby determining the actual quality of education in them. The questionnaire was to be filled in by the teachers of all the 15 sample schools. The items in the questionnaire related to the teachers professional training, use of suitable method, opinion about special programme needed for the education of the tribal children.
3. Interview schedule for pupil: The pupil questionnaire was meant chiefly to
find out the extent and quality of educational inputs related to the pupil and his family. These inputs are very significant because ultimately it was the pupil himself who has to utilize the available educational opportunities and it is his family and home which largely determine his capacity to profit from educational experiences. Besides these, the questionnaire was also meant to find out the influence to which pupils are exposed and which have a powerful effects on their behavior, attitudes, aspirations and motivations. The questionnaire was to be filled by the pupils. The items in the questionnaire related to the teacher's family, home environment and personal attribute viz. parental education, occupation and income etc.
4. The achievement Test (NCERT):The fact of modern life are such that the intellectual skills which involve reading, writing and calculation have become basic requirements for personal independence, productive work, intelligent, civics participation and wise consumption while these skills are not the only outcomes of education; they are a major consciously developed and very important part of it. The achievement test in English, Mathematics , Science and environmental studies was based on the syllabus for class 1 to 4 compiled by NCERT and comprised of eight questions with 40 minutes to complete and has a full marks of 40. The statistical measures used in the analysis of the data were percentage, mean, SD and T values. There were hundred percent responses in respect to all the questionnaires (interview schedule for school, teachers, pupils and achievement test) responses were obtained through these questionnaire and office records. The quality of elementary education imparted to the tribal children of Meghalaya in the rural areas can be measured by analyzing the results of achievement test and their performance in school examination.
33
VALIDITY AND RELIBILTY OF THE TOOLS: The questions for three questionnaire were prepared on the basis of research findings about different factors which are related to them and which help the realization and utilization in the quality of elementary education. They were also verified as a significant by the headmaster and teacher who were consulted before finalizing the questionnaire. The reliability of the questionnaire reponses were ensured by cross checking the information supplied by the heads, the teacher and the students. These tests which are based on the prescribed syllabus were shown to couple of teachers whose opinion were considered in finalizing them.
34
CHAPTER -5
RESULTS, ANALYSIS AND DISSCUSSION

35
CHAPTER -5
RESULTS, ANALYSIS AND DISCUSSION
As indicated earlier data were gathered based on the interview schedule for school, teachers, and pupils and from the achievement test of the pupils to ensure their quality of education the variables under the study includes physical and academic structure, enrolment and attendance of the students, retention of students, attendance of teachers, teacher’s training, development of teaching learning material, and incentives schemes. There were hundred percent returns for the school and teachers and pupils’s questionnaires, which were distributed and collected personally. There was also cent percent return for achievement test they are all administered on a single day in their respective schools. The data so collected were subjected to analysis according to a set plan in outlining which two things are kept in mind:
The variables understanding level. The tools used in data collection.
36
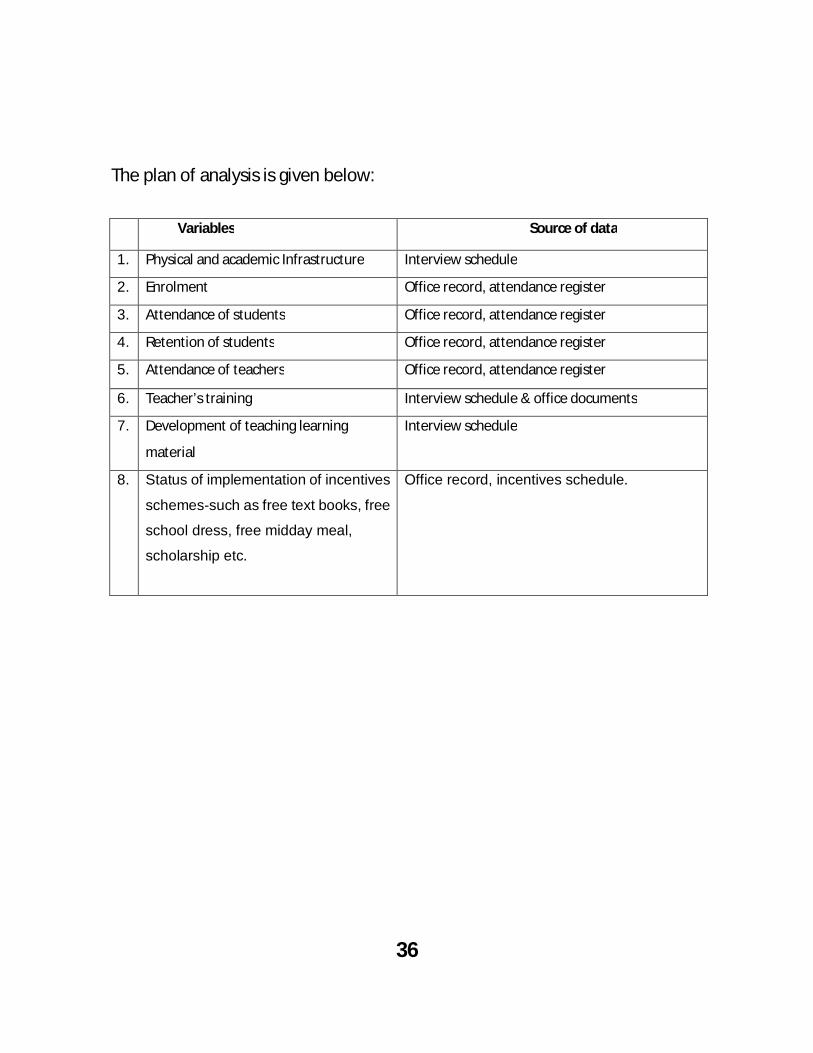
The plan of analysis is given below:
Variables Source of data
1. Physical and academic Infrastructure Interview schedule
2. Enrolment Office record, attendance register
3. Attendance of students Office record, attendance register
4. Retention of students Office record, attendance register
5. Attendance of teachers Office record, attendance register
6. Teacher’s training Interview schedule & office documents
7. Development of teaching learning
material
Interview schedule
8. Status of implementation of incentives
schemes-such as free text books, free
school dress, free midday meal,
scholarship etc.
Office record, incentives schedule.
37
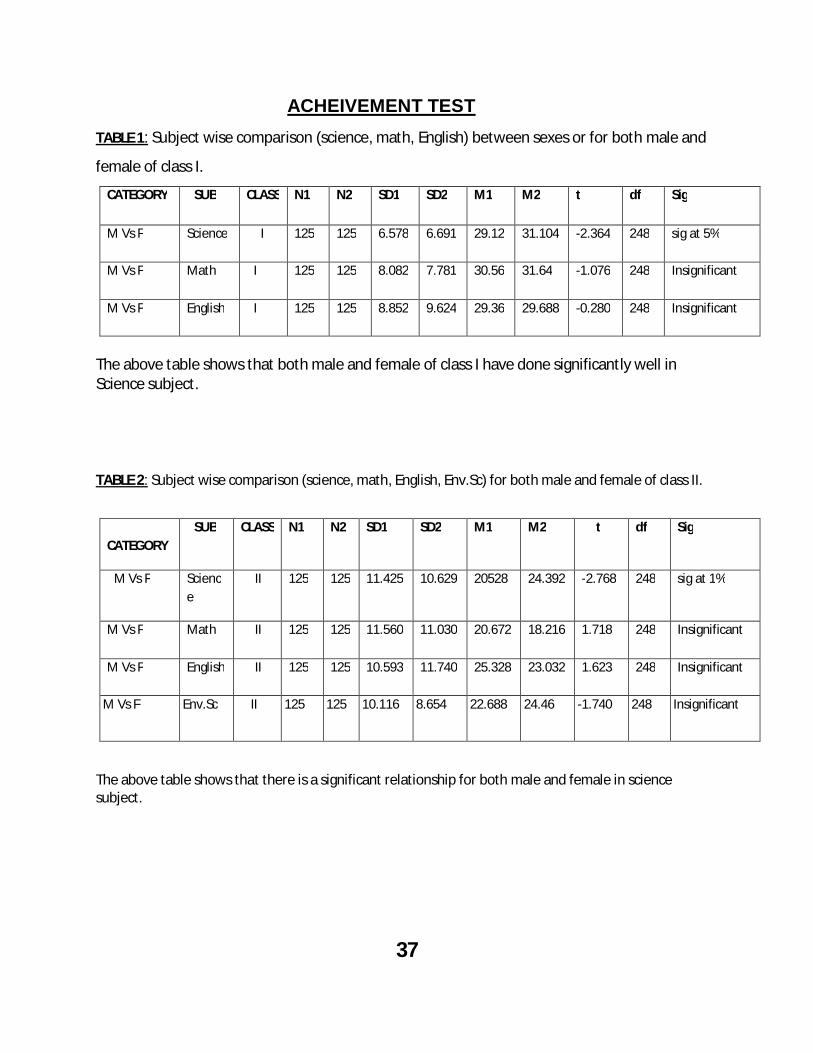
ACHEIVEMENT TEST TABLE 1: Subject wise comparison (science, math, English) between sexes or for both male and
female of class I. CATEGORY SUB CLASS N1 N2 SD1 SD2 M1 M2 t df Sig
M Vs F Science I 125 125 6.578 6.691 29.12 31.104 -2.364 248 sig at 5%
M Vs F Math I 125 125 8.082 7.781 30.56 31.64 -1.076 248 Insignificant
M Vs F English I 125 125 8.852 9.624 29.36 29.688 -0.280 248 Insignificant
The above table shows that both male and female of class I have done significantly well in Science subject. TABLE 2: Subject wise comparison (science, math, English, Env.Sc) for both male and female of class II.
CATEGORY
SUB CLASS N1 N2 SD1 SD2 M1 M2 t df Sig
M Vs F Science
II 125 125 11.425 10.629 20528 24.392 -2.768 248 sig at 1%
M Vs F Math II 125 125 11.560 11.030 20.672 18.216 1.718 248 Insignificant
M Vs F English II 125 125 10.593 11.740 25.328 23.032 1.623 248 Insignificant
M Vs F Env.Sc II 125 125 10.116 8.654 22.688 24.46 -1.740 248 Insignificant
The above table shows that there is a significant relationship for both male and female in science subject.

38
TABLE 3: Subject-wise comparison (Science, Math, English, Env. Sc) For both male and female of class III.
CATEGORY SUB CLASS N1 N2 SD1 SD2 M1 M2 t df Sig
M Vs F Science III 125 125 8.217 7.497 18.528 24.392 -5.895 248 sig at 1%
M Vs F Math III 125 125 10.093 8.591 18.384 18.08 0.256 248 Insig
M Vs F English III 125 125 8.036 8.852 22.848 22.976 -0.120 248 Insig
M Vs F Env. Sc III 125 125 8.668 8.128 27.232 27.656 -0.399 248 Insig
The above table shows a significant relationship for both male and female in science subject.
TABLE 4: Subject-wise comparison (Science, Math, English, Env. Sc) For both male and female of class IV.
CATEGORY SUB CLASS N1 N2 SD1 SD2 M1 M2 t df Sig
M Vs F Science IV 125 125 10.153 8.942 23.224 28.432 -4.304 248 sig at 1%
M Vs F Math IV 125 125 11.279 11.343 20.872 21.92 -0.732 248 Insig
M Vs F English IV 125 125 7.570 7.839 29.072 27.12 -0.049 248 Insig
M Vs F Env. Sc IV 125 125 10.093 9.246 25.376 24.264 0.908 248 Insig
The above table revealed a significant relationship for both male and female in science subject.

39
TABLE 5: Science subject comparison with English and Math subjects for both male and female of class I.
CATEGORY SUB CLASS N1 N2 SD1 SD2 M1 M2 t df Sig
Male Science VsMath
I 125 125 6.578 8.082 29.12 30.56 -1.545 248 Insig
Male Science Vs English
I 125 125 6.578 8.852 29.12 29.36 -0.243 248 Insig
Female Science Vs Math
I 125 125 6.691 7.781 31.104 31.64 -0.584 248 Insig
Female Science Vs English
I 125 125 6.691 9.624 31.104 29.688 1.351 248 Insig
The above table shows that there is no significant relationship when science subject is compared with the other subjects i.e. English and Math.
TABLE 6: Science subject comparison with Math, English and Env. Sc subjects for both male and female of class II.
CATEGORY SUB
CLASS N1 N2 SD1 SD2 M1 M2 t df Sig
Male Science Vs
Math
II 125 125 11.425 11.560 20.528 20.672 -0.099 248 Insig
Male Science Vs
English
II 125 125 11.425 10.593 20.528 25.328 -3.445 248 sig at 1%
Female Science Vs
Env.Sc
II 125 125 11.425 20.528 22.688 -1.583 248 Insig
The above table shows that there is a significant relationship among male student only between science and English at 1% of confidence level.

40
TABLE 7: Math subject comparison with English and Env. S for male of class II.
CATEGORY SUB
CLASS N1 N2 SD1 SD2 M1 M2 t df Sig
Male Math
Vs
English
II 125 125 11.560 10.593 20.672 25.328 -3.320 248 sig at 1%
Male Math
Vs
Env.Sc
II 125 125 11.560 10.116 20.672 22.688 -1.467 248 Insig
The above table shows significant relationship of Math and English subjects for male students of class II.
TABLE 8: Science subject comparison with Math, English and Env. S subjects for both male and female of class II.
CATEGORY SUB
CLASS N1 N2 SD1 SD2 M1 M2 t df Sig
Female Science Vs
Math
II 125 125 10.629 11.030 24.392 18.216 248 4.508 sig at 1%
Female Science Vs
English
II 125 125 10.629 11.740 24.392 23.032 248 0.960 Insig
Female Science Vs
Env.Sc
II 125 125 10.629 8.654 24.392 24.76 240 -0.300 Insig
41
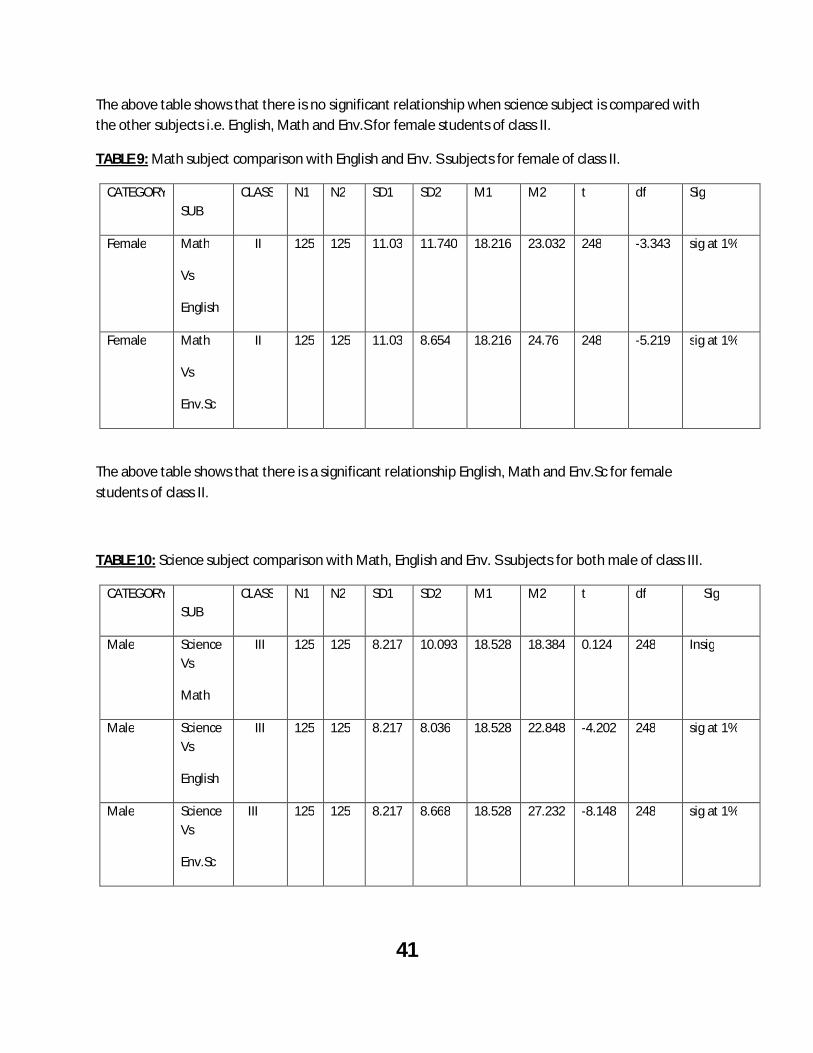
The above table shows that there is no significant relationship when science subject is compared with the other subjects i.e. English, Math and Env.S for female students of class II.
TABLE 9: Math subject comparison with English and Env. S subjects for female of class II.
CATEGORY SUB
CLASS N1 N2 SD1 SD2 M1 M2 t df Sig
Female Math
Vs
English
II 125 125 11.03 11.740 18.216 23.032 248 -3.343 sig at 1%
Female Math
Vs
Env.Sc
II 125 125 11.03 8.654 18.216 24.76 248 -5.219 sig at 1%
The above table shows that there is a significant relationship English, Math and Env.Sc for female students of class II.
TABLE 10: Science subject comparison with Math, English and Env. S subjects for both male of class III.
CATEGORY SUB
CLASS N1 N2 SD1 SD2 M1 M2 t df Sig
Male Science Vs
Math
III 125 125 8.217 10.093 18.528 18.384 0.124 248 Insig
Male Science Vs
English
III 125 125 8.217 8.036 18.528 22.848 -4.202 248 sig at 1%
Male Science Vs
Env.Sc
III 125 125 8.217 8.668 18.528 27.232 -8.148 248 sig at 1%
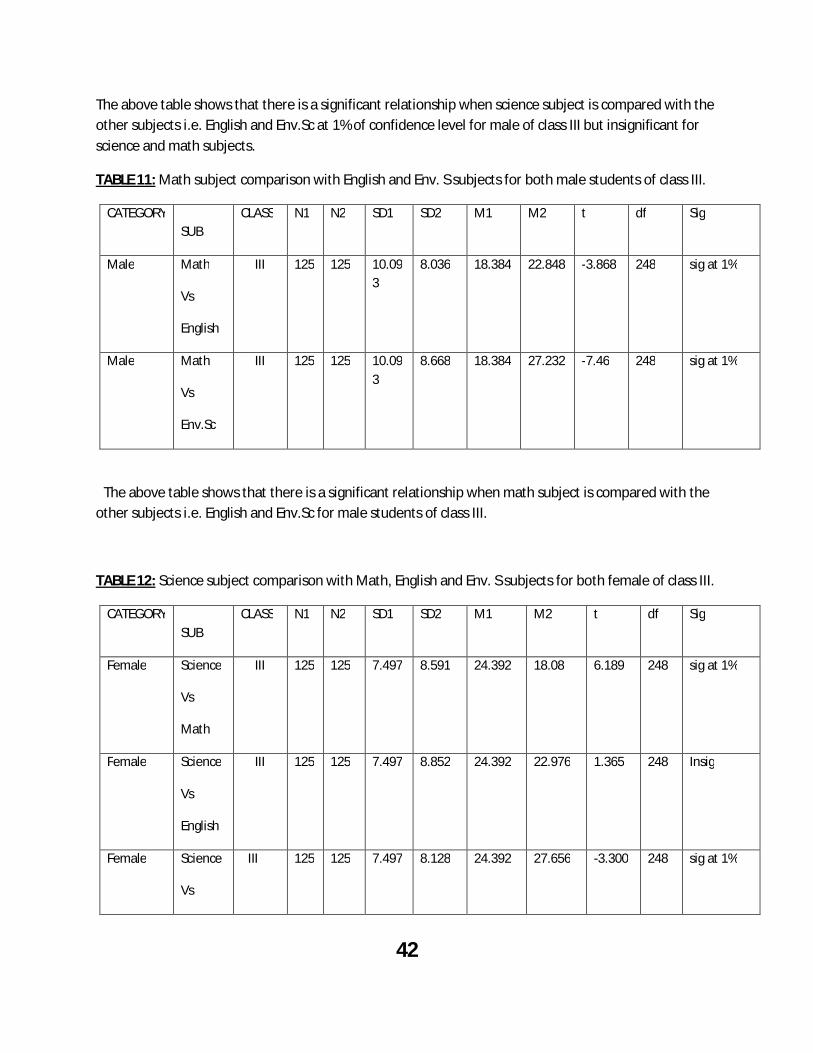
42
The above table shows that there is a significant relationship when science subject is compared with the other subjects i.e. English and Env.Sc at 1% of confidence level for male of class III but insignificant for science and math subjects.
TABLE 11: Math subject comparison with English and Env. S subjects for both male students of class III.
CATEGORY SUB
CLASS N1 N2 SD1 SD2 M1 M2 t df Sig
Male Math
Vs
English
III 125 125 10.093
8.036 18.384 22.848 -3.868 248 sig at 1%
Male Math
Vs
Env.Sc
III 125 125 10.093
8.668 18.384 27.232 -7.46 248 sig at 1%
The above table shows that there is a significant relationship when math subject is compared with the other subjects i.e. English and Env.Sc for male students of class III.
TABLE 12: Science subject comparison with Math, English and Env. S subjects for both female of class III.
CATEGORY SUB
CLASS N1 N2 SD1 SD2 M1 M2 t df Sig
Female Science
Vs
Math
III 125 125 7.497 8.591 24.392 18.08 6.189 248 sig at 1%
Female Science
Vs
English
III 125 125 7.497 8.852 24.392 22.976 1.365 248 Insig
Female Science
Vs
III 125 125 7.497 8.128 24.392 27.656 -3.300 248 sig at 1%

43
Env.Sc
The above table shows that there is significant relationship when science subject is compared with the other subjects i.e. Math and Env.Sc for female students whereas insignificant with English subject.
TABLE 13: Math subject comparison with English and Env. S subjects for female of class III.
CATEGORY SUB
CLASS N1 N2 SD1 SD2 M1 M2 t df Sig
Female Math
Vs
English
III 125 125 8.591 8.852 18.08 22.976 -4.438 248 sig at 1%
Female Math
Vs
Env.Sc
III 125 125 8.591 8.128 18.08 27.656 -9.053 248 sig at 1%
The above table shows that there is a significant relationship at 1% degree of confidence level with both English and Env. Sc when comparison was made with Math subject.
TABLE 14: Science subject comparison with Math, English and Env. Sc subjects for both male students of class IV.
CATEGORY SUB
CLASS N1 N2 SD1 SD2 M1 M2 t df Sig
Male Science
Vs
Math
IV 125 125 10.153
11.279 23.224 20.872 1.733 248 Insig
Male Science
Vs
English
IV 125 125 10.153
7.570 23.224 27.072 -3.397 248 sig at 1%
44
Male Science
Vs
Env.Sc
IV 125 125 10.153
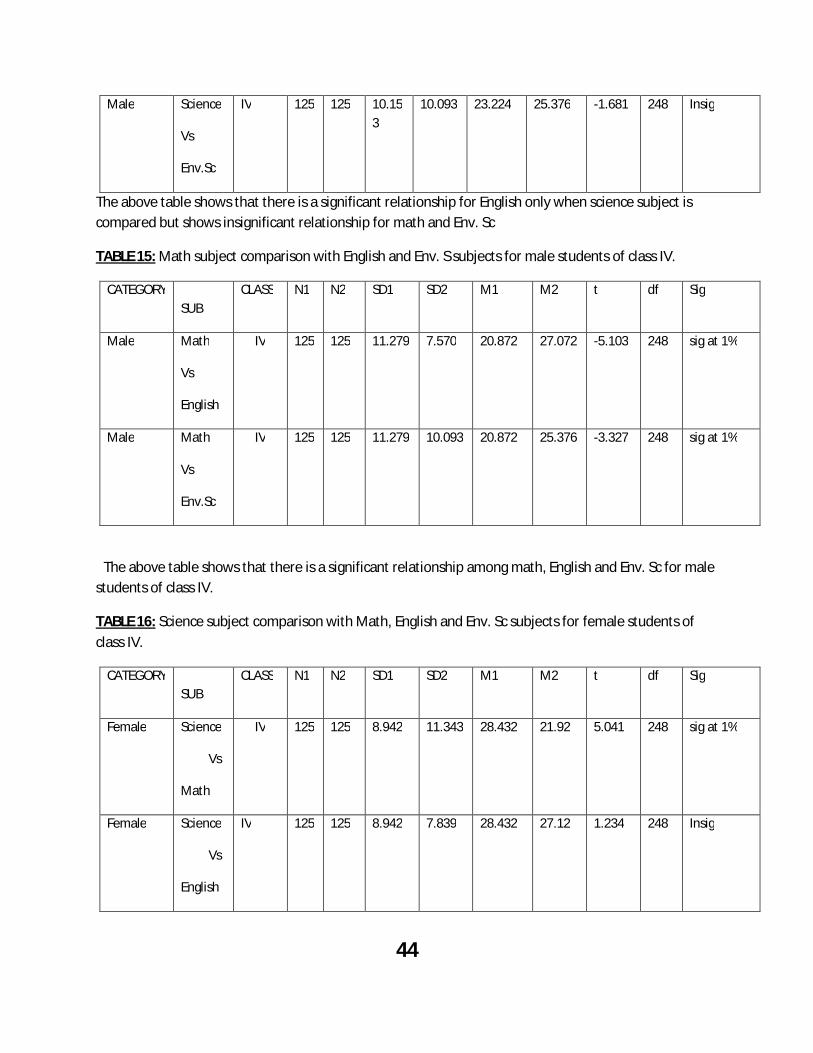
10.093 23.224 25.376 -1.681 248 Insig
The above table shows that there is a significant relationship for English only when science subject is compared but shows insignificant relationship for math and Env. Sc
TABLE 15: Math subject comparison with English and Env. S subjects for male students of class IV.
CATEGORY SUB
CLASS N1 N2 SD1 SD2 M1 M2 t df Sig
Male Math
Vs
English
IV 125 125 11.279 7.570 20.872 27.072 -5.103 248 sig at 1%
Male Math
Vs
Env.Sc
IV 125 125 11.279 10.093 20.872 25.376 -3.327 248 sig at 1%
The above table shows that there is a significant relationship among math, English and Env. Sc for male students of class IV.
TABLE 16: Science subject comparison with Math, English and Env. Sc subjects for female students of class IV.
CATEGORY SUB
CLASS N1 N2 SD1 SD2 M1 M2 t df Sig
Female Science
Vs
Math
IV 125 125 8.942 11.343 28.432 21.92 5.041 248 sig at 1%
Female Science
Vs
English
IV 125 125 8.942 7.839 28.432 27.12 1.234 248 Insig
45
Female Science
Vs
Env.Sc
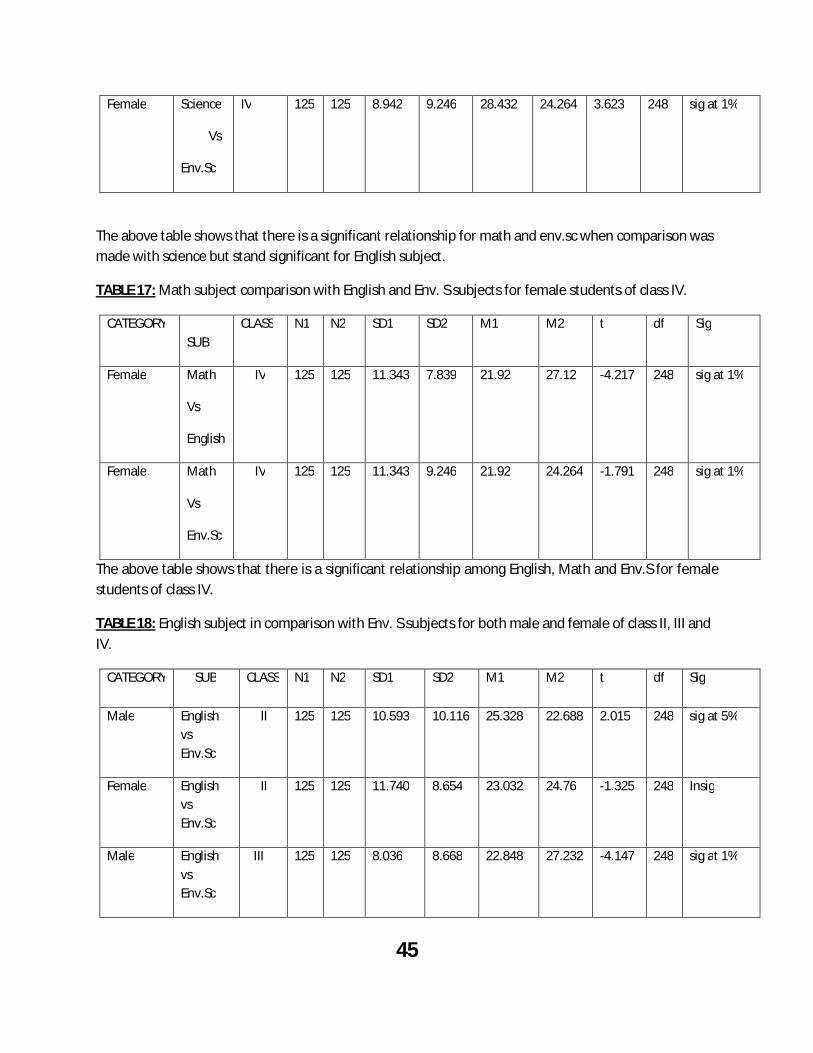
IV 125 125 8.942 9.246 28.432 24.264 3.623 248 sig at 1%
The above table shows that there is a significant relationship for math and env.sc when comparison was made with science but stand significant for English subject.
TABLE 17: Math subject comparison with English and Env. S subjects for female students of class IV.
CATEGORY SUB
CLASS N1 N2 SD1 SD2 M1 M2 t df Sig
Female Math
Vs
English
IV 125 125 11.343 7.839 21.92 27.12 -4.217 248 sig at 1%
Female Math
Vs
Env.Sc
IV 125 125 11.343 9.246 21.92 24.264 -1.791 248 sig at 1%
The above table shows that there is a significant relationship among English, Math and Env.S for female students of class IV.
TABLE 18: English subject in comparison with Env. S subjects for both male and female of class II, III and IV.
CATEGORY SUB CLASS N1 N2 SD1 SD2 M1 M2 t df Sig
Male English vs Env.Sc
II 125 125 10.593 10.116 25.328 22.688 2.015 248 sig at 5%
Female English vs Env.Sc
II 125 125 11.740 8.654 23.032 24.76 -1.325 248 Insig
Male English vs Env.Sc
III 125 125 8.036 8.668 22.848 27.232 -4.147 248 sig at 1%
46
Female
English vs Env.Sc
III
125
125
8.852
8.128
22.976
27.656 -4.354
248
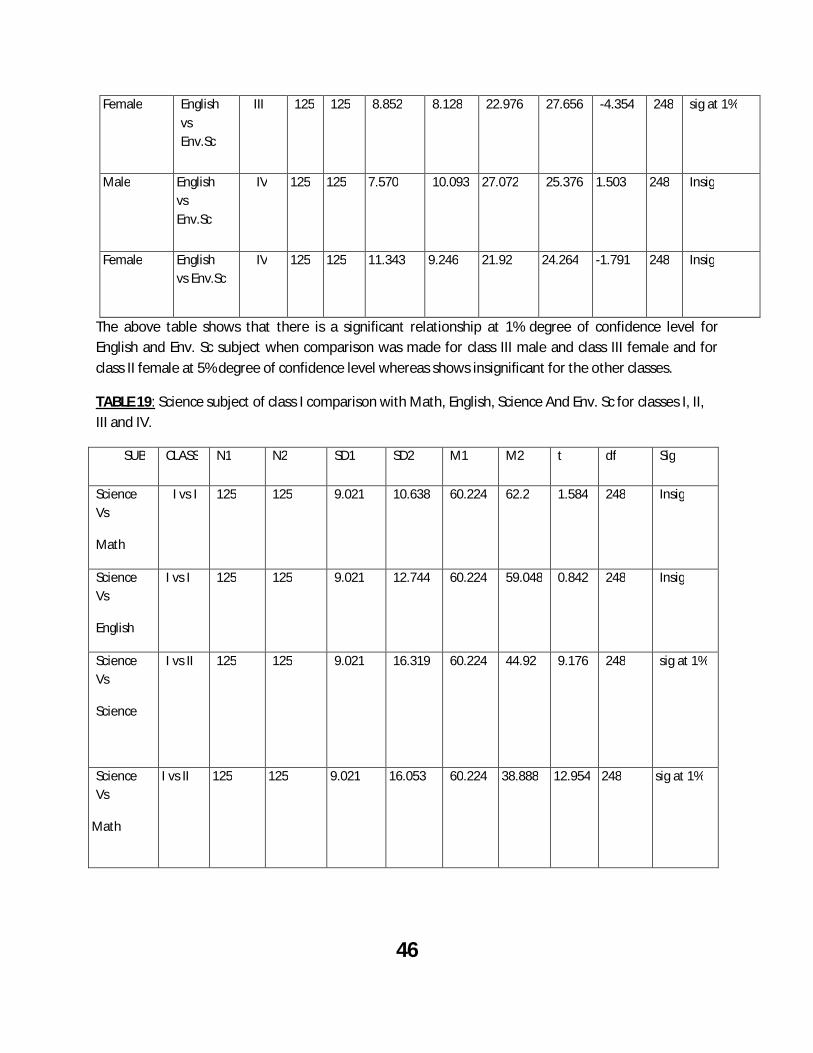
sig at 1%
Male English vs Env.Sc
IV 125 125 7.570 10.093 27.072 25.376
1.503 248 Insig
Female English vs Env.Sc
IV 125 125 11.343 9.246 21.92 24.264 -1.791 248 Insig
The above table shows that there is a significant relationship at 1% degree of confidence level for English and Env. Sc subject when comparison was made for class III male and class III female and for class II female at 5% degree of confidence level whereas shows insignificant for the other classes.
TABLE 19: Science subject of class I comparison with Math, English, Science And Env. Sc for classes I, II, III and IV.
SUB CLASS N1 N2 SD1 SD2 M1 M2 t df Sig
Science Vs
Math
I vs I 125 125 9.021 10.638 60.224 62.2 1.584 248 Insig
Science Vs
English
I vs I 125 125 9.021 12.744 60.224 59.048 0.842 248 Insig
Science Vs
Science
I vs II 125 125 9.021 16.319 60.224 44.92 9.176 248 sig at 1%
Science Vs
Math
I vs II 125 125 9.021 16.053 60.224 38.888 12.954 248 sig at 1%
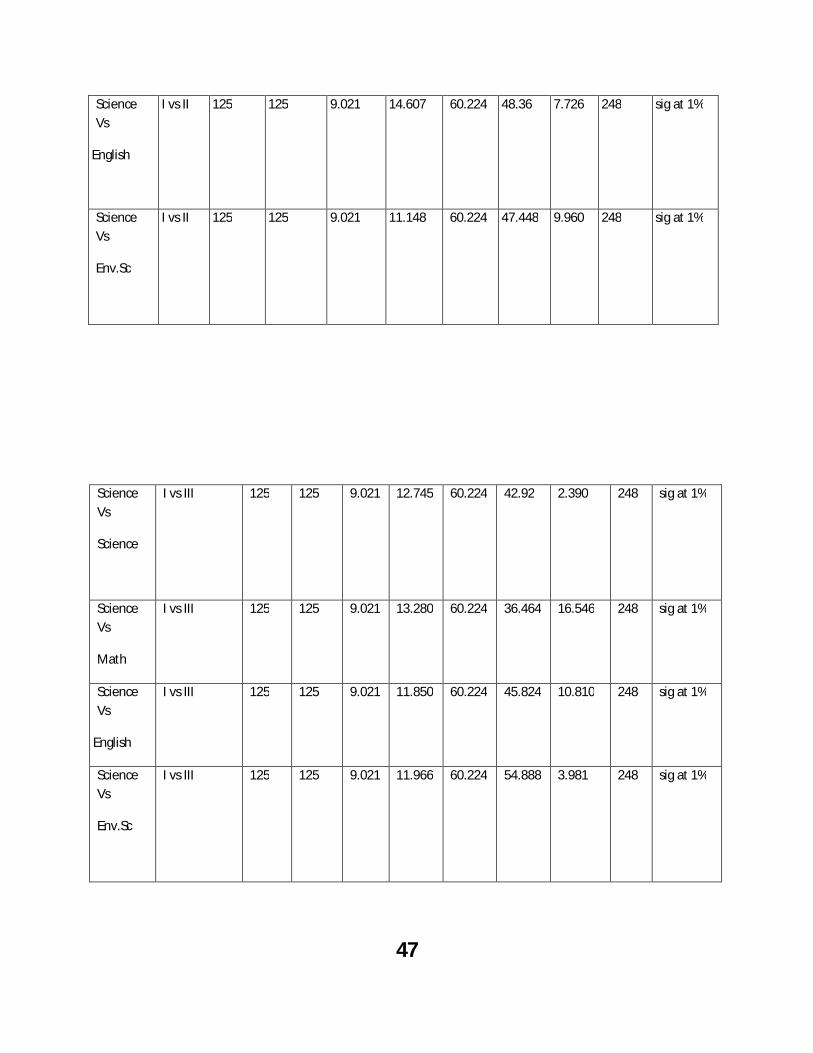
47
Science Vs
English
I vs II 125 125 9.021 14.607 60.224 48.36 7.726 248 sig at 1%
Science Vs
Env.Sc
I vs II 125 125 9.021 11.148 60.224 47.448 9.960 248 sig at 1%
Science Vs
Science
I vs III 125 125 9.021 12.745 60.224 42.92 2.390 248 sig at 1%
Science Vs
Math
I vs III 125 125 9.021 13.280 60.224 36.464 16.546 248 sig at 1%
Science Vs
English
I vs III 125 125 9.021 11.850 60.224 45.824 10.810 248 sig at 1%
Science Vs
Env.Sc
I vs III 125 125 9.021 11.966 60.224 54.888 3.981 248 sig at 1%

48
Science Vs
Science
I vs IV 125 125 9.021 13.260 60.224 51.656 5.973 248 sig at 1%
Science Vs
Math
I vs IV 125 125 9.021 18.079 60.224 42.792 9.646 248 sig at 1%
Science Vs
English
I vs IV 125 125 9.021 10.839 60.224 54.192 4.782 248 sig at 1%
Science Vs
Env.Sc
I vs IV 125 125 9.021
14.199
60.224
49.64 7.034 248 sig at 1%
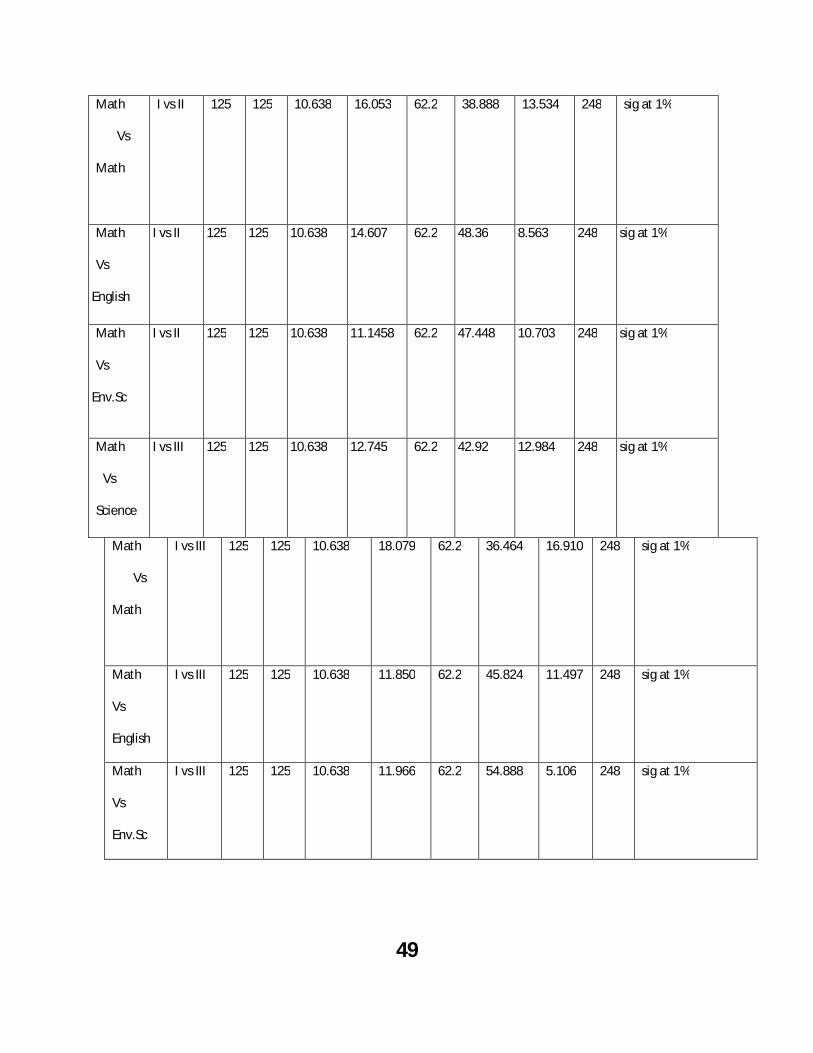
The above table shows that there exist a significant relationship at 1% level of confidence for classes II, III and IV when science is compared with Math, English and Science and Env.Sc whereas of remain insignificant for class I when comparison is made. TABLE 20: Math subject of class I comparison with English, Science, Math, Env.Sc of classes I, II, III, IV.
SUB CLASS N1 N2 SD1 SD2 M1 M2 t df Sig
Math
Vs
English
I vs I 125 125 10.638 12.744 62.2 59.048 2.123 248 sig at 5%
Math
Vs
Science
I vs II 125 125 10.638 16.319 62.2 44.92 9.917 248 sig at 1%
49
Math
Vs
Math
I vs II 125 125 10.638 16.053 62.2 38.888 13.534 248 sig at 1%
Math
Vs
English
I vs II 125 125 10.638 14.607 62.2 48.36 8.563 248 sig at 1%
Math
Vs
Env.Sc
I vs II 125 125 10.638 11.1458 62.2 47.448 10.703 248 sig at 1%
Math
Vs
Science
I vs III 125 125 10.638 12.745 62.2 42.92 12.984 248 sig at 1%
Math
Vs
Math
I vs III 125 125 10.638 18.079 62.2 36.464 16.910 248 sig at 1%
Math
Vs
English
I vs III 125 125 10.638 11.850 62.2 45.824 11.497 248 sig at 1%
Math
Vs
Env.Sc
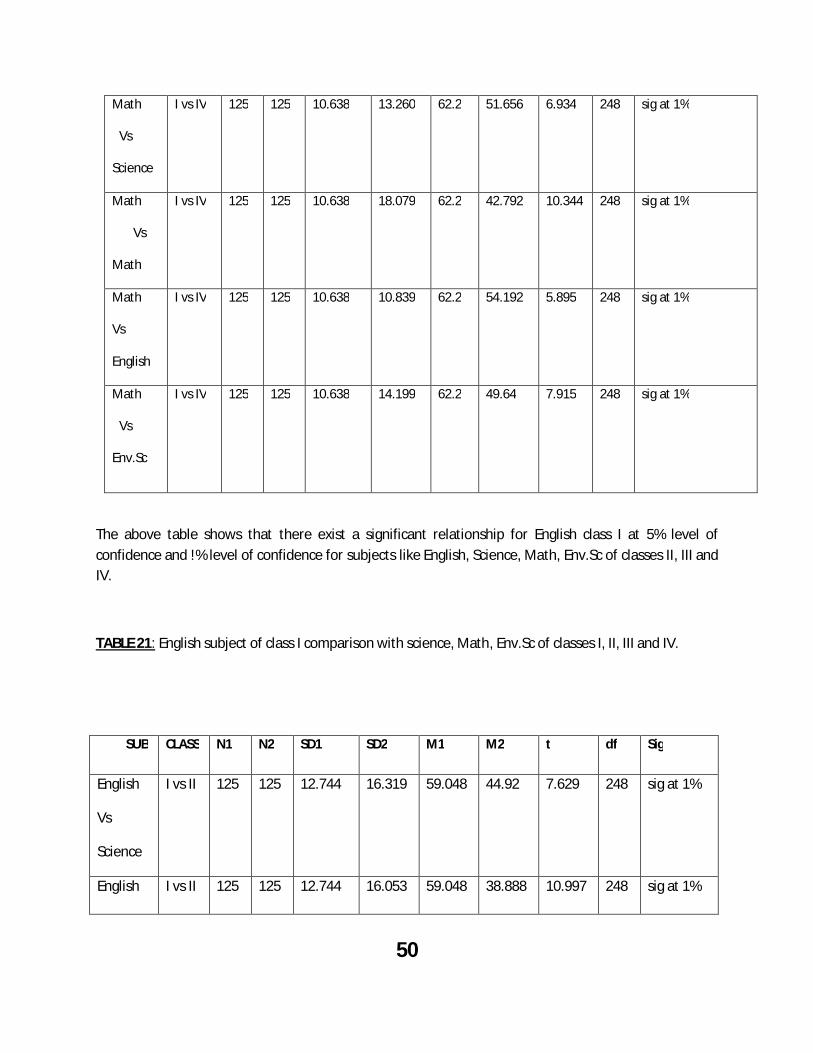
I vs III 125 125 10.638 11.966 62.2 54.888 5.106 248 sig at 1%
50
Math
Vs
Science
I vs IV 125 125 10.638 13.260 62.2 51.656 6.934 248 sig at 1%
Math
Vs
Math
I vs IV 125 125 10.638 18.079 62.2 42.792 10.344 248 sig at 1%
Math
Vs
English
I vs IV 125 125 10.638 10.839 62.2 54.192 5.895 248 sig at 1%
Math
Vs
Env.Sc
I vs IV 125 125 10.638 14.199 62.2 49.64 7.915 248 sig at 1%
The above table shows that there exist a significant relationship for English class I at 5% level of confidence and !% level of confidence for subjects like English, Science, Math, Env.Sc of classes II, III and IV.
TABLE 21: English subject of class I comparison with science, Math, Env.Sc of classes I, II, III and IV.
SUB CLASS N1 N2 SD1 SD2 M1 M2 t df Sig
English
Vs
Science
I vs II 125 125 12.744 16.319 59.048 44.92 7.629 248 sig at 1%
English I vs II 125 125 12.744 16.053 59.048 38.888 10.997 248 sig at 1%
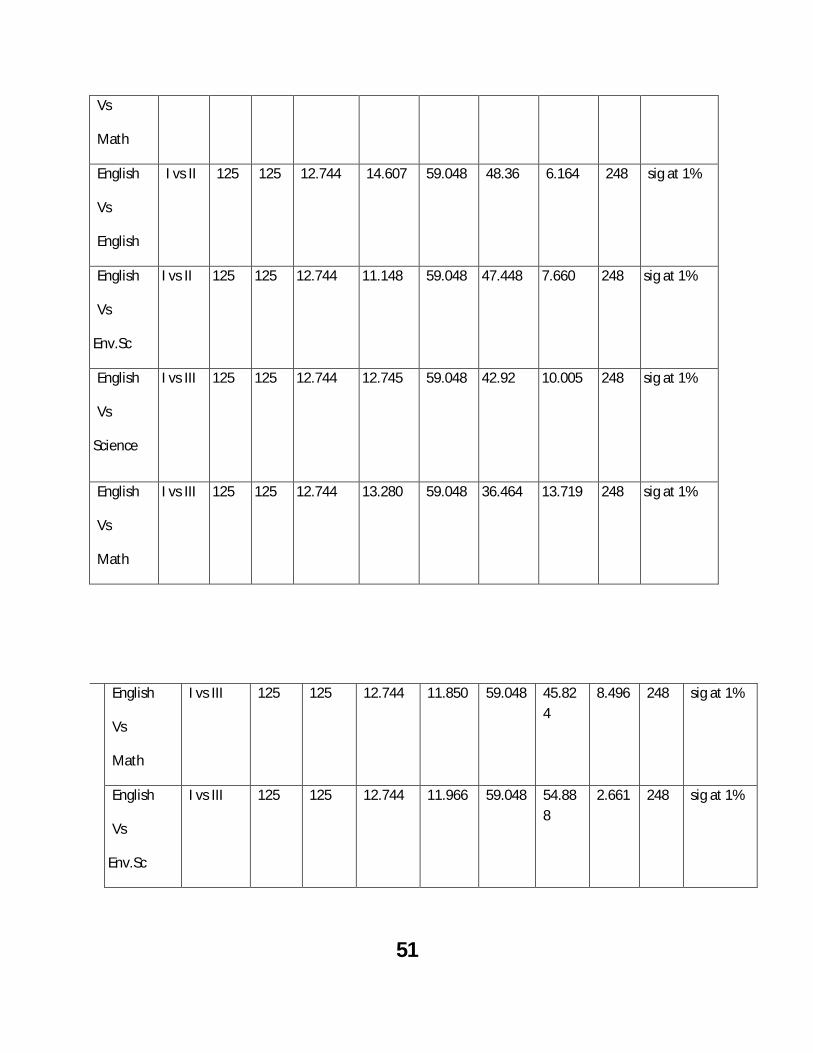
51
Vs
Math
English
Vs
English
I vs II 125 125 12.744 14.607 59.048 48.36 6.164
248 sig at 1%
English
Vs
Env.Sc
I vs II 125 125 12.744 11.148 59.048 47.448 7.660 248 sig at 1%
English
Vs
Science
I vs III 125 125 12.744 12.745 59.048 42.92 10.005 248 sig at 1%
English
Vs
Math
I vs III 125 125 12.744 13.280 59.048 36.464 13.719 248 sig at 1%
English
Vs
Math
I vs III 125 125 12.744 11.850 59.048 45.824
8.496 248 sig at 1%
English
Vs
Env.Sc
I vs III 125 125 12.744 11.966 59.048 54.888
2.661 248 sig at 1%
52
English
Vs
Science
I vs IV 125 125 12.744 13.260 59.048 51.656
4.494 248 sig at 1%
English
Vs
Math
I vs IV 125 125 12.744 18.079 59.048 42.792
8.217 248 sig at 1%
English
Vs
English
I vs IV 125 125 12.744 10.839 59.048 54.192
3.245 248 sig at 1%
English
Vs
Env.Sc
I vs IV 125 125 12.744 14.199 59.048 49.64 5.513 248 sig at 1%
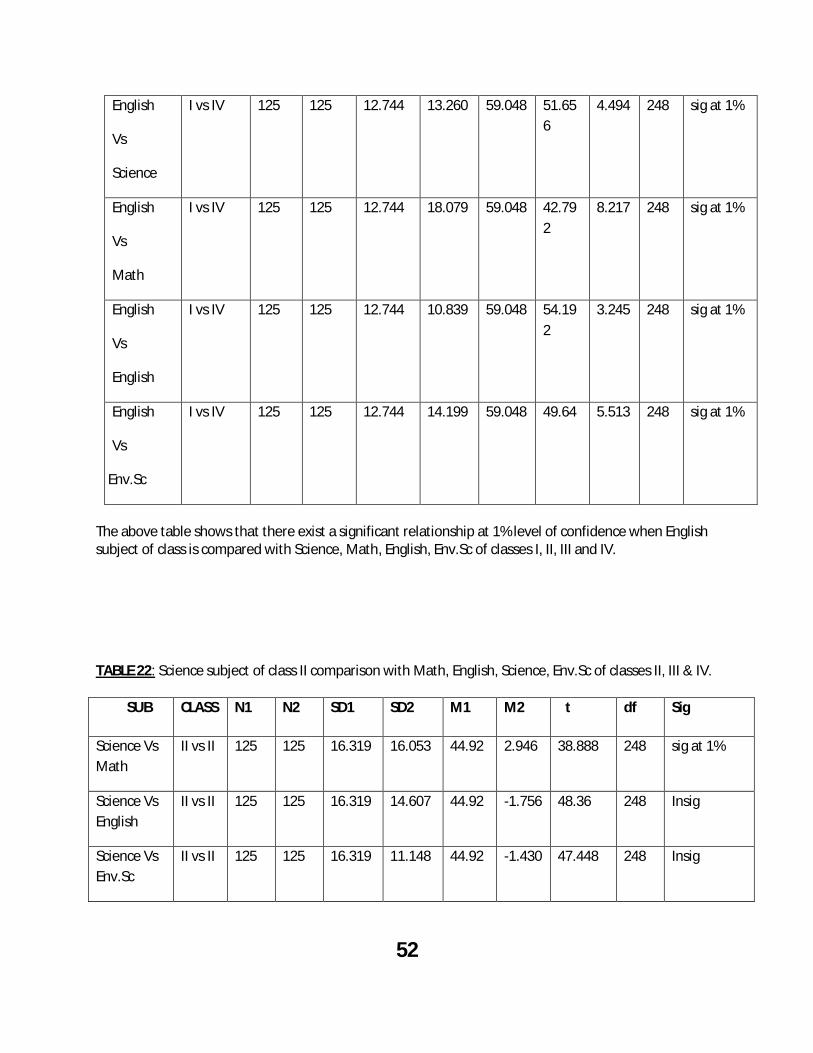
The above table shows that there exist a significant relationship at 1% level of confidence when English subject of class is compared with Science, Math, English, Env.Sc of classes I, II, III and IV.
TABLE 22: Science subject of class II comparison with Math, English, Science, Env.Sc of classes II, III & IV. SUB CLASS N1 N2 SD1 SD2 M1 M2 t df Sig
Science Vs Math
II vs II 125 125 16.319 16.053 44.92 2.946 38.888 248 sig at 1%
Science Vs English
II vs II 125 125 16.319 14.607 44.92 -1.756 48.36 248 Insig
Science Vs Env.Sc
II vs II 125 125 16.319 11.148 44.92 -1.430 47.448 248 Insig
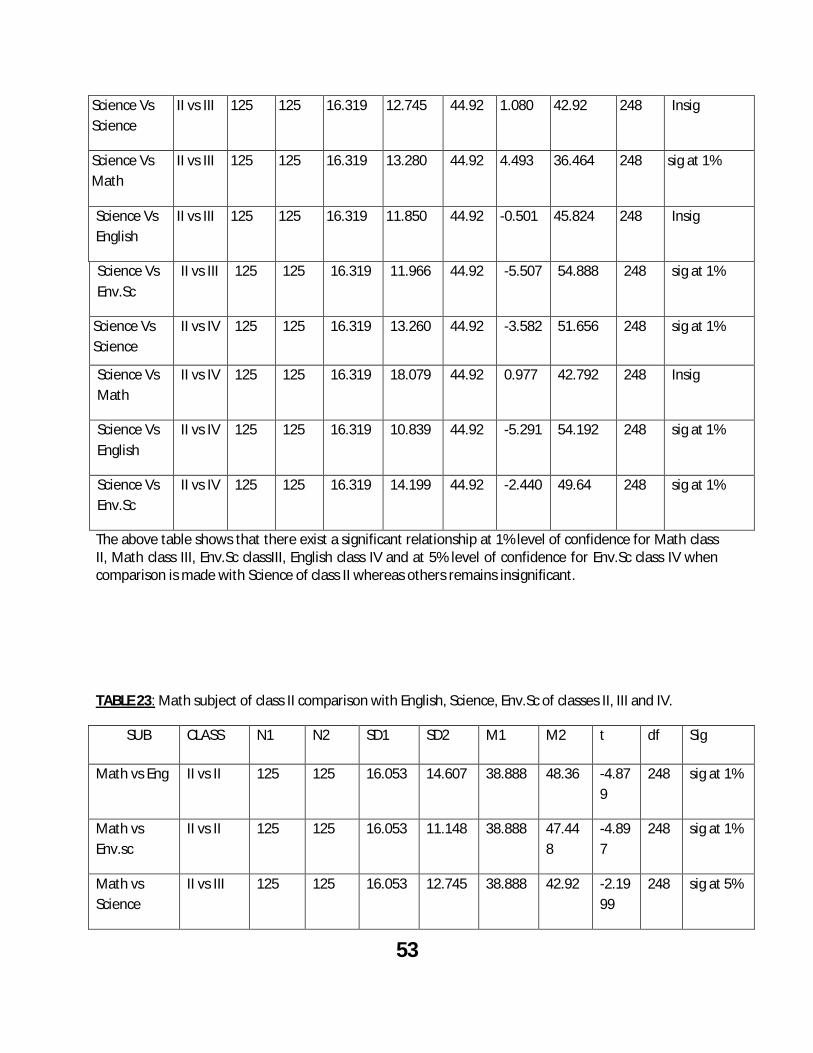
53
Science Vs Science
II vs III 125 125 16.319 12.745 44.92 1.080 42.92 248 Insig
Science Vs Math
II vs III 125 125 16.319 13.280 44.92 4.493 36.464 248 sig at 1%
Science Vs English
II vs III 125 125 16.319 11.850 44.92 -0.501 45.824 248 Insig
Science Vs Env.Sc
II vs III 125 125 16.319 11.966 44.92 -5.507 54.888 248 sig at 1%
Science Vs Science
II vs IV 125 125 16.319 13.260 44.92 -3.582 51.656 248 sig at 1%
Science Vs Math
II vs IV 125 125 16.319 18.079 44.92 0.977 42.792 248 Insig
Science Vs English
II vs IV 125 125 16.319 10.839 44.92 -5.291 54.192 248 sig at 1%
Science Vs Env.Sc
II vs IV 125 125 16.319 14.199 44.92 -2.440 49.64 248 sig at 1%
The above table shows that there exist a significant relationship at 1% level of confidence for Math class II, Math class III, Env.Sc classIII, English class IV and at 5% level of confidence for Env.Sc class IV when comparison is made with Science of class II whereas others remains insignificant. TABLE 23: Math subject of class II comparison with English, Science, Env.Sc of classes II, III and IV.
SUB CLASS N1 N2 SD1 SD2 M1 M2 t df Sig
Math vs Eng II vs II 125 125 16.053 14.607 38.888 48.36 -4.879
248 sig at 1%
Math vs Env.sc
II vs II 125 125 16.053 11.148 38.888 47.448
-4.897
248 sig at 1%
Math vs Science
II vs III 125 125 16.053 12.745 38.888 42.92 -2.1999
248 sig at 5%
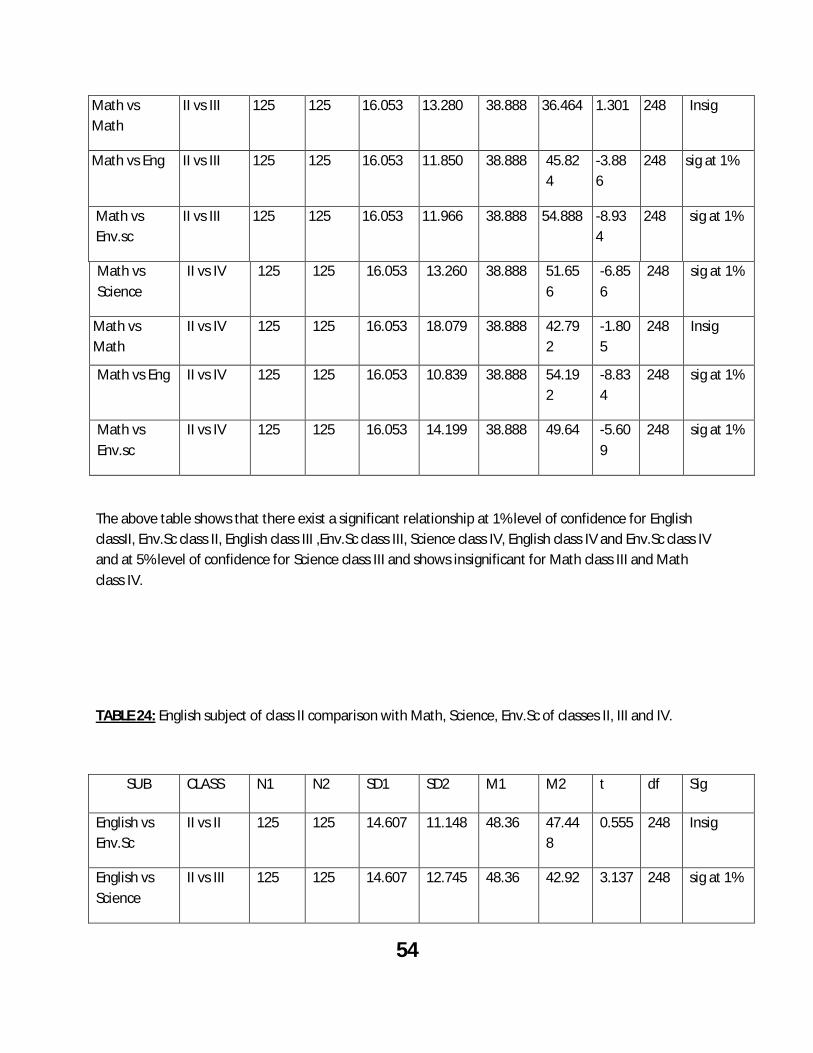
54
Math vs Math
II vs III 125 125 16.053 13.280 38.888 36.464 1.301 248 Insig
Math vs Eng II vs III 125 125 16.053 11.850 38.888 45.824
-3.886
248 sig at 1%
Math vs Env.sc
II vs III 125 125 16.053 11.966 38.888 54.888 -8.934
248 sig at 1%
Math vs Science
II vs IV 125 125 16.053 13.260 38.888 51.656
-6.856
248 sig at 1%
Math vs Math
II vs IV 125 125 16.053 18.079 38.888 42.792
-1.805
248 Insig
Math vs Eng II vs IV 125 125 16.053 10.839 38.888 54.192
-8.834
248 sig at 1%
Math vs Env.sc
II vs IV 125 125 16.053 14.199 38.888 49.64 -5.609
248 sig at 1%
The above table shows that there exist a significant relationship at 1% level of confidence for English classII, Env.Sc class II, English class III ,Env.Sc class III, Science class IV, English class IV and Env.Sc class IV and at 5% level of confidence for Science class III and shows insignificant for Math class III and Math class IV.
TABLE 24: English subject of class II comparison with Math, Science, Env.Sc of classes II, III and IV.
SUB CLASS N1 N2 SD1 SD2 M1 M2 t df Sig
English vs Env.Sc
II vs II 125 125 14.607 11.148 48.36 47.448
0.555 248 Insig
English vs Science
II vs III 125 125 14.607 12.745 48.36 42.92 3.137 248 sig at 1%
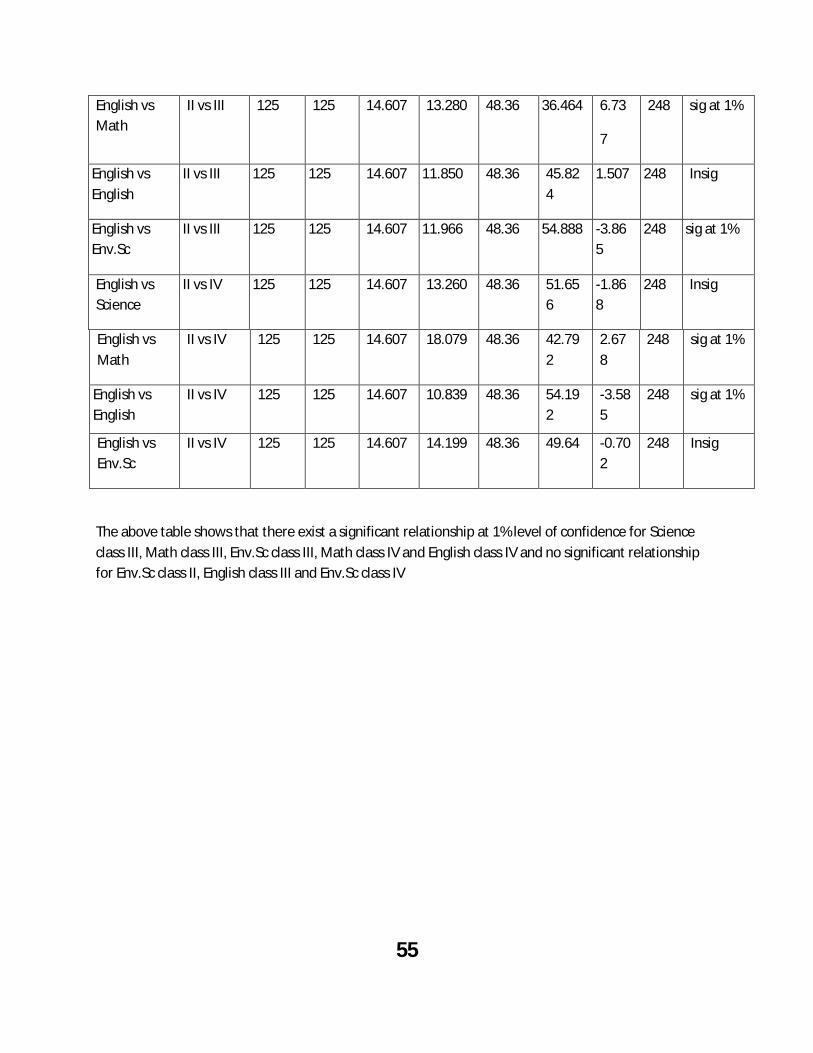
55
English vs Math
II vs III 125 125 14.607 13.280 48.36 36.464 6.73
7
248 sig at 1%
English vs English
II vs III 125 125 14.607 11.850 48.36 45.824
1.507 248 Insig
English vs Env.Sc
II vs III 125 125 14.607 11.966 48.36 54.888 -3.865
248 sig at 1%
English vs Science
II vs IV 125 125 14.607 13.260 48.36 51.656
-1.868
248 Insig
English vs Math
II vs IV 125 125 14.607 18.079 48.36 42.792
2.678
248 sig at 1%
English vs English
II vs IV 125 125 14.607 10.839 48.36 54.192
-3.585
248 sig at 1%
English vs Env.Sc
II vs IV 125 125 14.607 14.199 48.36 49.64 -0.702
248 Insig
The above table shows that there exist a significant relationship at 1% level of confidence for Science class III, Math class III, Env.Sc class III, Math class IV and English class IV and no significant relationship for Env.Sc class II, English class III and Env.Sc class IV
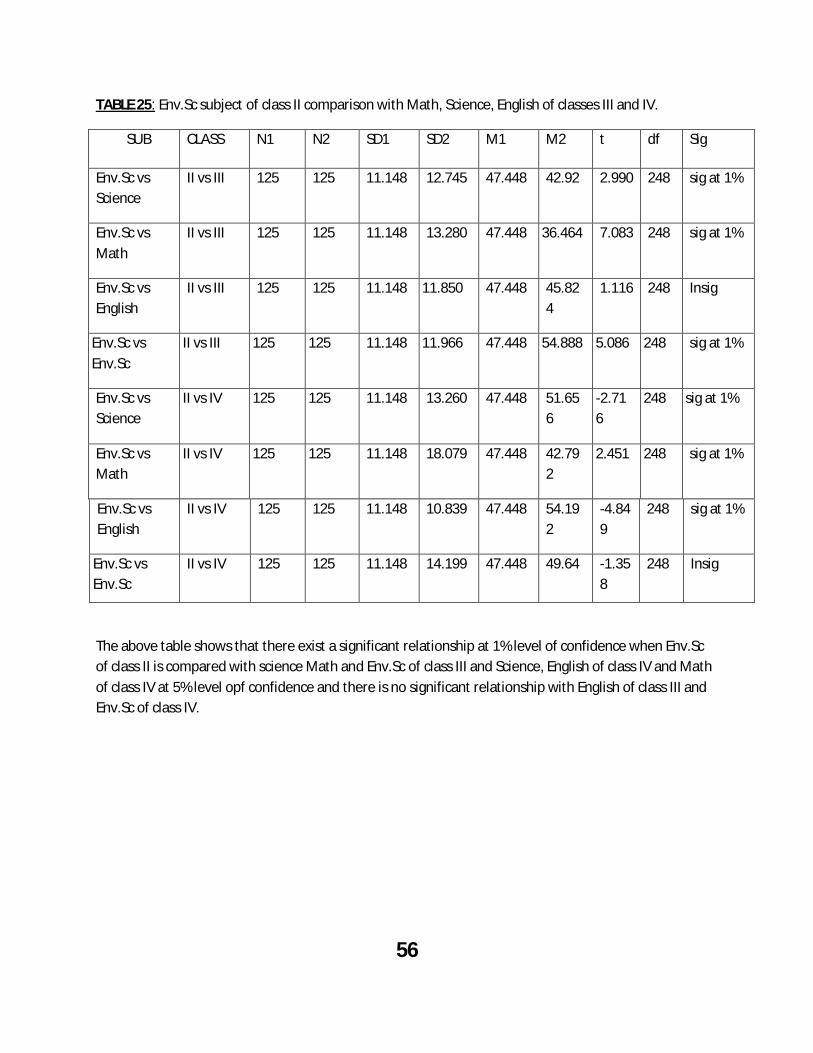
56
TABLE 25: Env.Sc subject of class II comparison with Math, Science, English of classes III and IV.
SUB CLASS N1 N2 SD1 SD2 M1 M2 t df Sig
Env.Sc vs Science
II vs III 125 125 11.148 12.745 47.448 42.92 2.990 248 sig at 1%
Env.Sc vs Math
II vs III 125 125 11.148 13.280 47.448 36.464 7.083 248 sig at 1%
Env.Sc vs English
II vs III 125 125 11.148 11.850 47.448 45.824
1.116 248 Insig
Env.Sc vs Env.Sc
II vs III 125 125 11.148 11.966 47.448 54.888 5.086 248 sig at 1%
Env.Sc vs Science
II vs IV 125 125 11.148 13.260 47.448 51.656
-2.716
248 sig at 1%
Env.Sc vs Math
II vs IV 125 125 11.148 18.079 47.448 42.792
2.451 248 sig at 1%
Env.Sc vs English
II vs IV 125 125 11.148 10.839 47.448 54.192
-4.849
248 sig at 1%
Env.Sc vs Env.Sc
II vs IV 125 125 11.148 14.199 47.448 49.64 -1.358
248 Insig
The above table shows that there exist a significant relationship at 1% level of confidence when Env.Sc of class II is compared with science Math and Env.Sc of class III and Science, English of class IV and Math of class IV at 5% level opf confidence and there is no significant relationship with English of class III and Env.Sc of class IV.
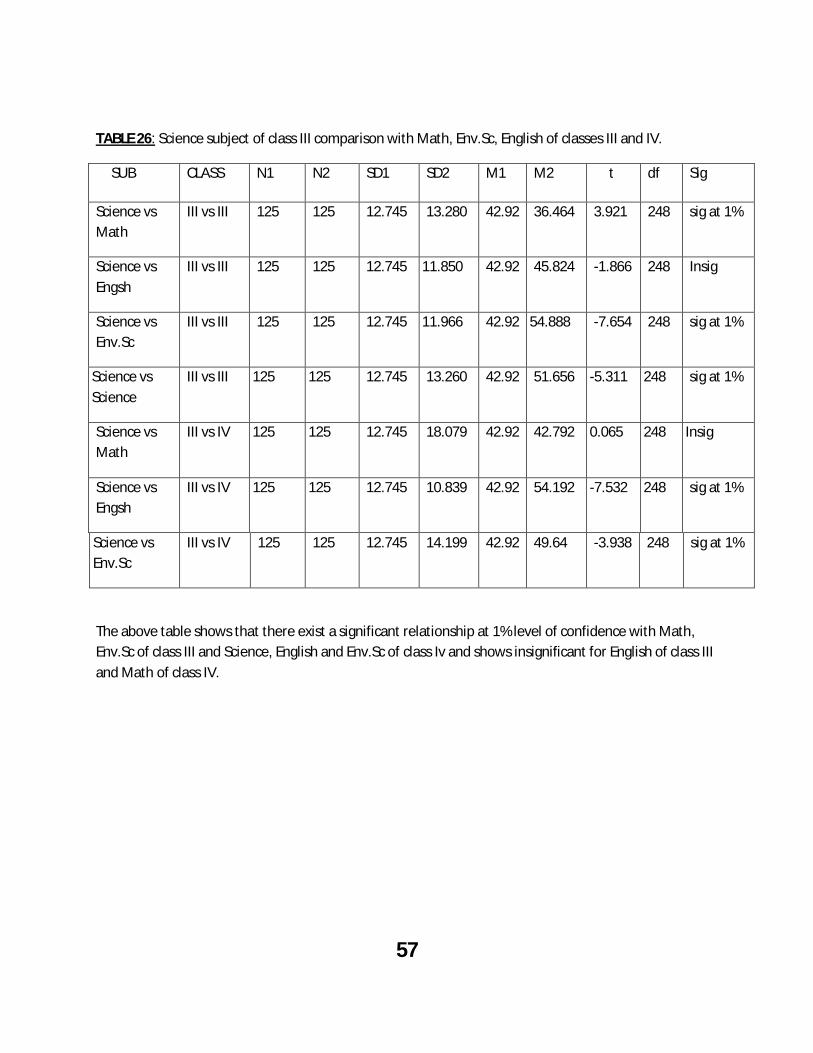
57
TABLE 26: Science subject of class III comparison with Math, Env.Sc, English of classes III and IV.
SUB CLASS N1 N2 SD1 SD2 M1 M2 t df Sig
Science vs Math
III vs III 125 125 12.745 13.280 42.92 36.464 3.921 248 sig at 1%
Science vs Engsh
III vs III 125 125 12.745 11.850 42.92 45.824 -1.866 248 Insig
Science vs Env.Sc
III vs III 125 125 12.745 11.966 42.92 54.888 -7.654 248 sig at 1%
Science vs Science
III vs III 125 125 12.745 13.260 42.92 51.656 -5.311 248 sig at 1%
Science vs Math
III vs IV 125 125 12.745 18.079 42.92 42.792 0.065 248 Insig
Science vs Engsh
III vs IV 125 125 12.745 10.839 42.92 54.192 -7.532 248 sig at 1%
Science vs Env.Sc
III vs IV 125 125 12.745 14.199 42.92 49.64 -3.938 248 sig at 1%
The above table shows that there exist a significant relationship at 1% level of confidence with Math, Env.Sc of class III and Science, English and Env.Sc of class Iv and shows insignificant for English of class III and Math of class IV.
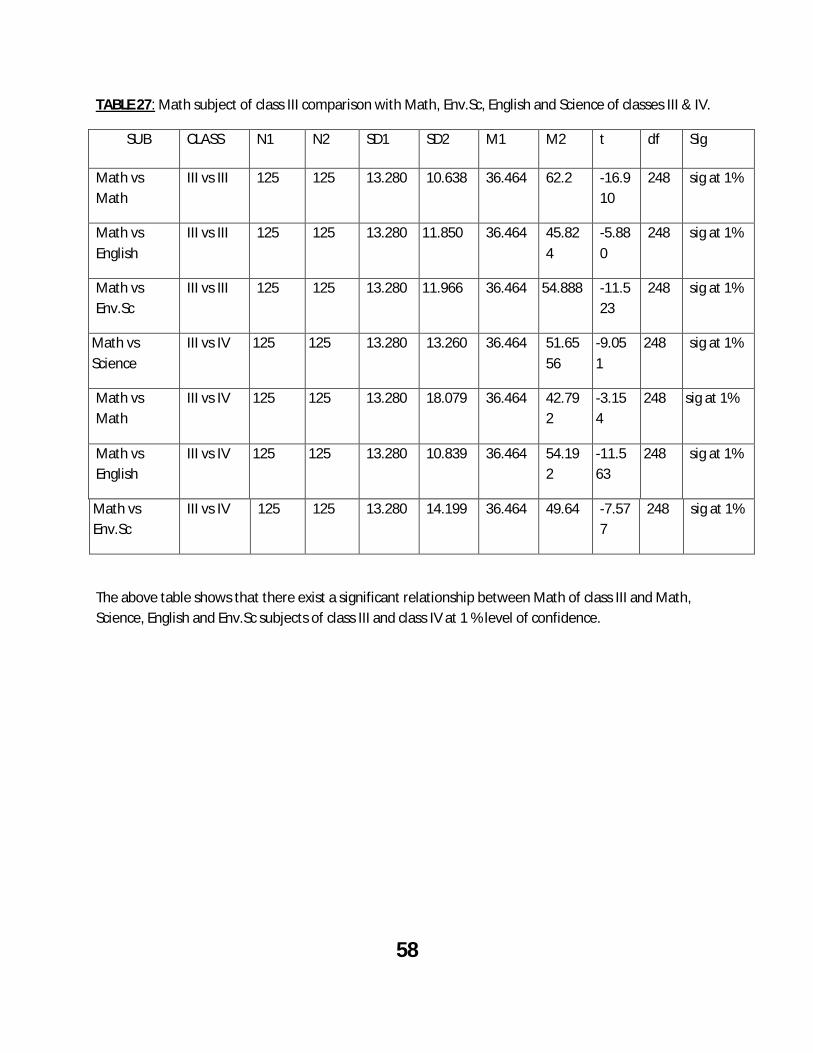
58
TABLE 27: Math subject of class III comparison with Math, Env.Sc, English and Science of classes III & IV.
SUB CLASS N1 N2 SD1 SD2 M1 M2 t df Sig
Math vs Math
III vs III 125 125 13.280 10.638 36.464 62.2 -16.910
248 sig at 1%
Math vs English
III vs III 125 125 13.280 11.850 36.464 45.824
-5.880
248 sig at 1%
Math vs Env.Sc
III vs III 125 125 13.280 11.966 36.464 54.888 -11.523
248 sig at 1%
Math vs Science
III vs IV 125 125 13.280 13.260 36.464 51.6556
-9.051
248 sig at 1%
Math vs Math
III vs IV 125 125 13.280 18.079 36.464 42.792
-3.154
248 sig at 1%
Math vs English
III vs IV 125 125 13.280 10.839 36.464 54.192
-11.563
248 sig at 1%
Math vs Env.Sc
III vs IV 125 125 13.280 14.199 36.464 49.64 -7.577
248 sig at 1%
The above table shows that there exist a significant relationship between Math of class III and Math, Science, English and Env.Sc subjects of class III and class IV at 1 % level of confidence.

59
TABLE 28: English subject of class III comparison with Math, Env.Sc, English and Science of classes III & IV.
SUB CLASS N1 N2 SD1 SD2 M1 M2 t df Sig
English vs Env.Sc
III vs III 125 125 11.850 11.966 45.824 54.888
-6.018
248 sig at 1%
English vs Env.Sc
III vs IV 125 125 11.850 13.260 45.824 51.6556
-3.667
248 sig at 1%
English vs Env.Sc
III vs IV 125 125 11.850 18.079 45.824 42.792
1.568 248 Insig
English vs Env.Sc
III vs IV 125 125 11.850 10.839 45.824 54.192
-5.826
248 sig at 1%
English vs Env.Sc
III vs IV 125 125 11.850 14.199 45.824 49.64 -2.307
248 sig at 5%
The above table revealed a significant relationship at 1% level of confidence for Env.Sc of class III and science, English of class IV and at 5% level of confidence for English of class IV and insignificant for Math of class IV.
TABLE 29: Env.Sc subject of class III comparison with Math, Env.Sc, English and Science of classes IV.
SUB CLASS N1 N2 SD1 SD2 M1 M2 t df Sig
Env.Sc vs Science
III vs IV 125 125 11.966 13.260 54.888 51.656
2.023 248 sig at 5%
Env.Sc vs Math
III vs IV 125 125 11.966 18.079 54.888 42.792
6.238 248 sig at 1%
Env.Sc vs English
III vs IV 125 125 11.966 10.839 54.888 54.192
0.482 248 Insig
Env.Sc vs Env.Sc
III vs IV 125 125 11.966 14.199 54.888 49.64 3.160 248 sig at 1%
The above table revealed a significant co-relation at 5% level of confidence between Env.Sc of class III and Science of class IV and at 1% level of confidence for Math and Env.Sc of class IV whereras for English of class IV it shows an insignificant co-relation.
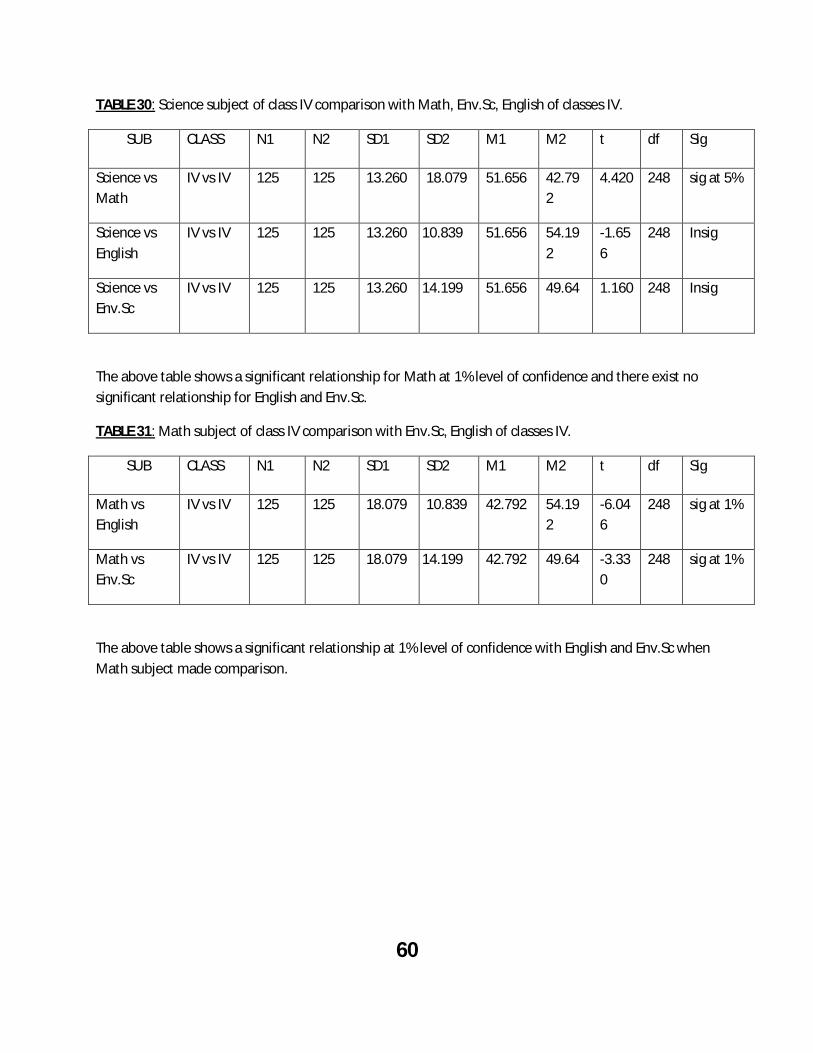
60
TABLE 30: Science subject of class IV comparison with Math, Env.Sc, English of classes IV.
SUB CLASS N1 N2 SD1 SD2 M1 M2 t df Sig
Science vs Math
IV vs IV 125 125 13.260 18.079 51.656 42.792
4.420 248 sig at 5%
Science vs English
IV vs IV 125 125 13.260 10.839 51.656 54.192
-1.656
248 Insig
Science vs Env.Sc
IV vs IV 125 125 13.260 14.199 51.656 49.64 1.160 248 Insig
The above table shows a significant relationship for Math at 1% level of confidence and there exist no significant relationship for English and Env.Sc.
TABLE 31: Math subject of class IV comparison with Env.Sc, English of classes IV.
SUB CLASS N1 N2 SD1 SD2 M1 M2 t df Sig
Math vs English
IV vs IV 125 125 18.079 10.839 42.792 54.192
-6.046
248 sig at 1%
Math vs Env.Sc
IV vs IV 125 125 18.079 14.199 42.792 49.64 -3.330
248 sig at 1%
The above table shows a significant relationship at 1% level of confidence with English and Env.Sc when Math subject made comparison.

61
PART I (School interview schedule)
Table 1.1: Type of schools
Type of School No. of Reponses Percentage
Only Boys School 1 6.67
Only Girls School 0 0.00
Co-educational School 14 93.33
Total 15 100.00
The above table shows that out of the fifteen schools in which data were collected 93.33 % were students from co-educational schools and 6.67% were from the boys school, none are from the girls school. Table 1.2: Type of school management
Management of School No. of Reponses Percentage
Government School 10 66.67
Private School 1 6.67
Municipal School 0 0
Others 4 26.67
Total 15 100.00
The above table shows that 66.67% of the fifteen schools were managed by government 6.67% are private schools and 26.67% falls under other category (eg- managed by trust or society)
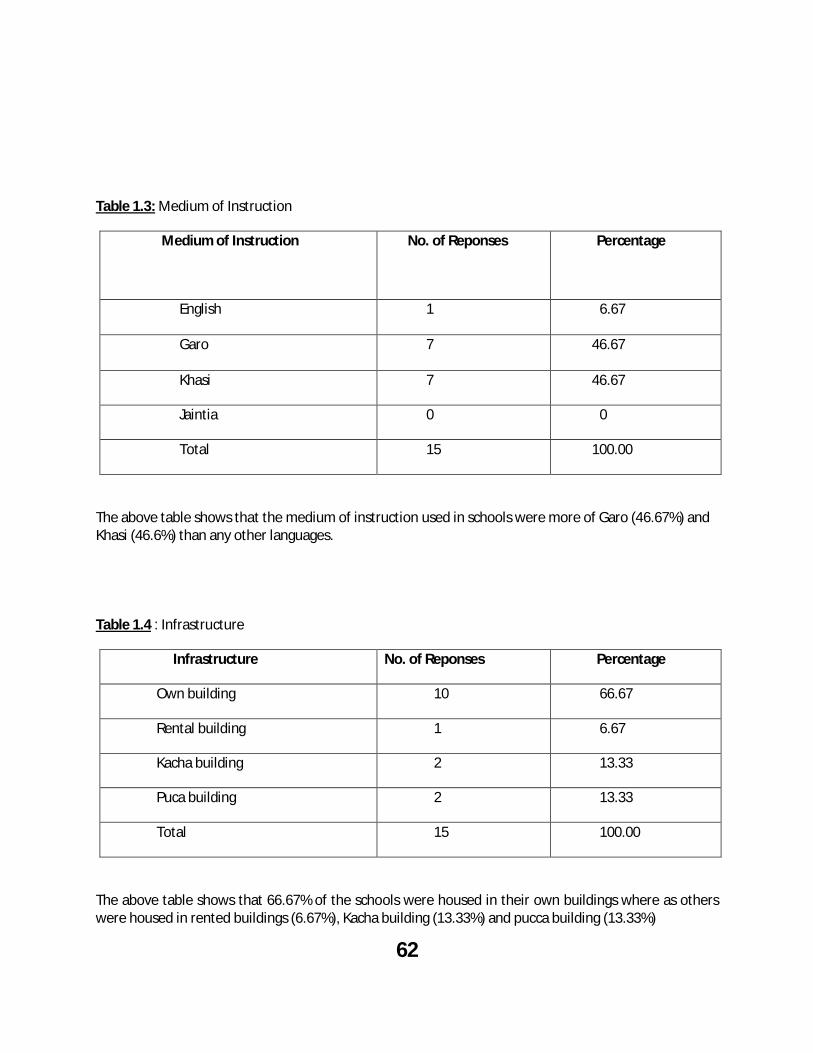
62
Table 1.3: Medium of Instruction
Medium of Instruction
No. of Reponses Percentage
English 1 6.67
Garo 7 46.67
Khasi 7 46.67
Jaintia 0 0
Total 15 100.00
The above table shows that the medium of instruction used in schools were more of Garo (46.67%) and Khasi (46.6%) than any other languages. Table 1.4 : Infrastructure
Infrastructure No. of Reponses Percentage
Own building 10 66.67
Rental building 1 6.67
Kacha building 2 13.33
Puca building 2 13.33
Total 15 100.00
The above table shows that 66.67% of the schools were housed in their own buildings where as others were housed in rented buildings (6.67%), Kacha building (13.33%) and pucca building (13.33%)

63
Table 1.5: Total no. of tribal students in the year 2006-07 and 2008 and drop-out
No. No. Percentage
Name of the school 2006-07 2008 Total dropout 2006-07 2008 Total dropout
Mooshynreh 120 140 0 7.08 7.83 0.00
New Hope 35 80 0 2.07 4.47 0.00
Sohasylle 135 130 5 7.97 7.27 4.85
Kyndong Tuber 140 146 0 8.26 8.16 0.00
R.C 134 110 24 7.91 6.15 23.30
St. Ann’s 130 200 0 7.67 11.18 0.00
St. Pete’s 131 180 0 7.73 10.06 0.00
Sacred Heart Boys 200 179 21 11.81 10.01 20.39
Jengdikgri 79 84 0 4.66 4.70 0.00
Balnangri 130 133 0 7.67 7.43 0.00
Jomangre 40 30 10 2.36 1.68 9.71
Somancholgre 131 120 11 7.73 6.71 10.68
Jomangri 104 102 2 6.14 5.70 1.94
Bongpara 145 118 27 8.56 6.60 26.21
Jamangdalgre 40 37 3 2.36 2.07 2.91
1694 1789 103 100.00 100.00 100.00
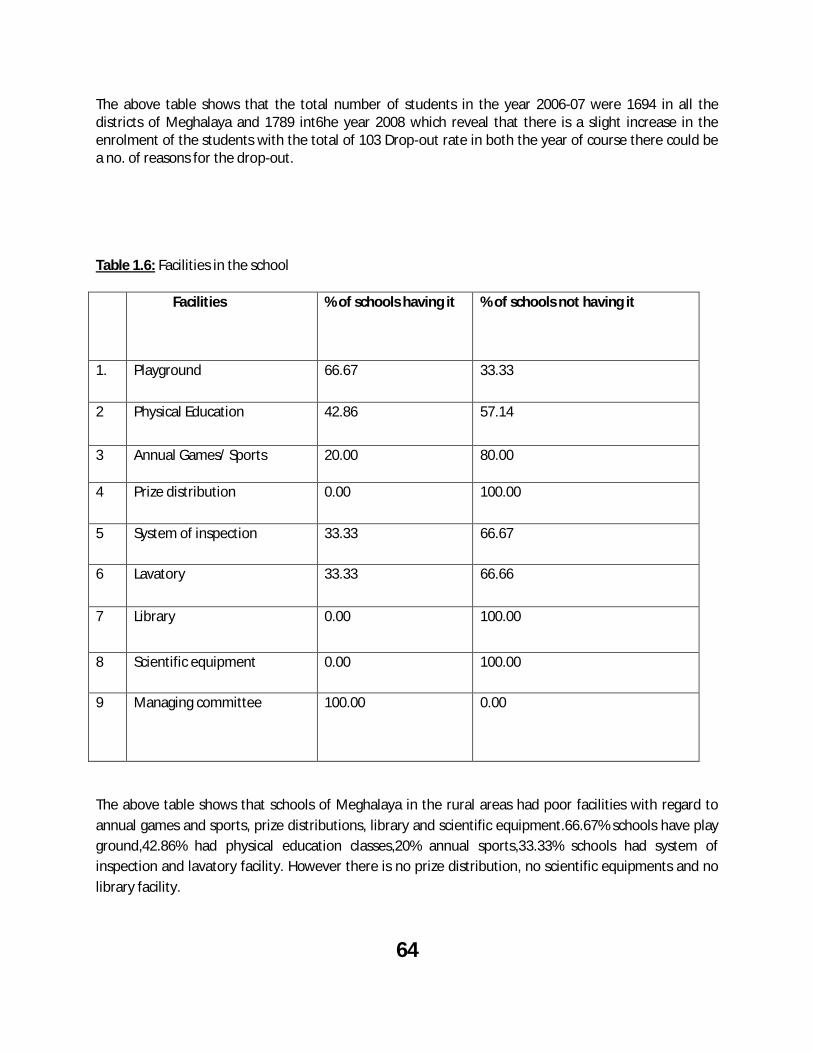
64
The above table shows that the total number of students in the year 2006-07 were 1694 in all the districts of Meghalaya and 1789 int6he year 2008 which reveal that there is a slight increase in the enrolment of the students with the total of 103 Drop-out rate in both the year of course there could be a no. of reasons for the drop-out. Table 1.6: Facilities in the school
Facilities
% of schools having it % of schools not having it
1. Playground 66.67 33.33
2 Physical Education 42.86 57.14
3 Annual Games/ Sports 20.00 80.00
4 Prize distribution 0.00 100.00
5 System of inspection 33.33 66.67
6 Lavatory 33.33 66.66
7 Library 0.00 100.00
8 Scientific equipment 0.00 100.00
9 Managing committee 100.00 0.00
The above table shows that schools of Meghalaya in the rural areas had poor facilities with regard to annual games and sports, prize distributions, library and scientific equipment.66.67% schools have play ground,42.86% had physical education classes,20% annual sports,33.33% schools had system of inspection and lavatory facility. However there is no prize distribution, no scientific equipments and no library facility.
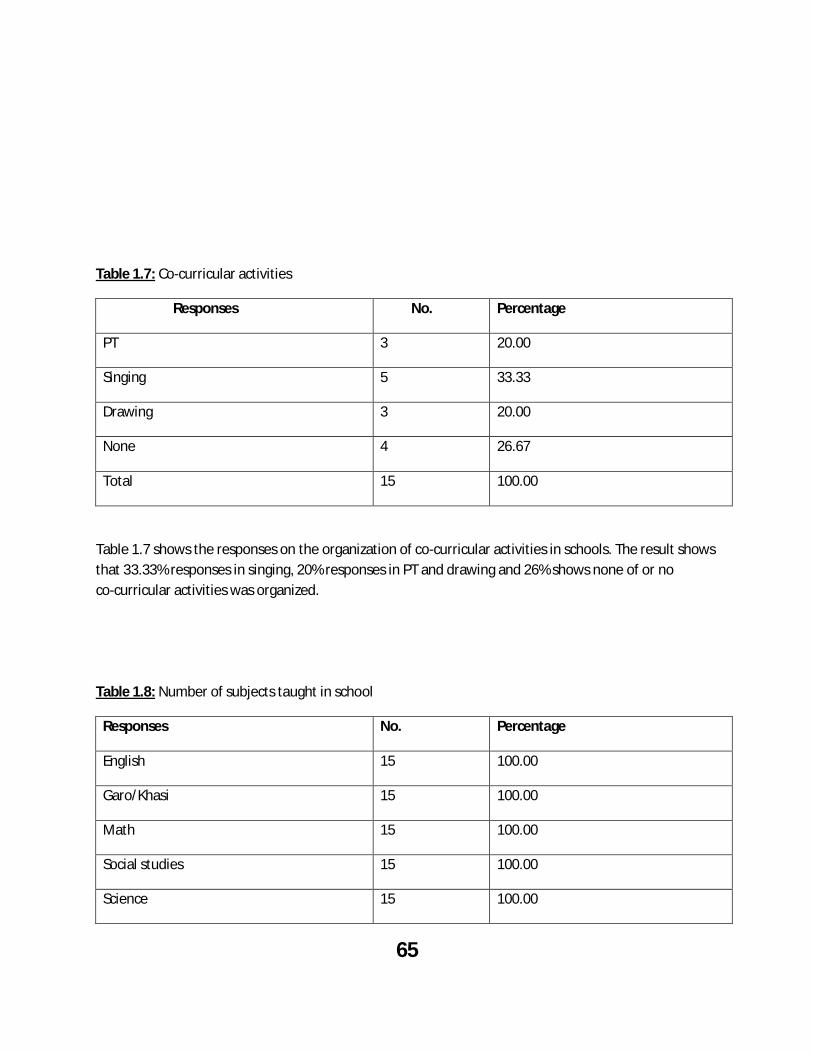
65
Table 1.7: Co-curricular activities
Responses No. Percentage
PT 3 20.00
Singing 5 33.33
Drawing 3 20.00
None 4 26.67
Total 15 100.00
Table 1.7 shows the responses on the organization of co-curricular activities in schools. The result shows that 33.33% responses in singing, 20% responses in PT and drawing and 26% shows none of or no co-curricular activities was organized.
Table 1.8: Number of subjects taught in school
Responses No. Percentage
English 15 100.00
Garo/Khasi 15 100.00
Math 15 100.00
Social studies 15 100.00
Science 15 100.00
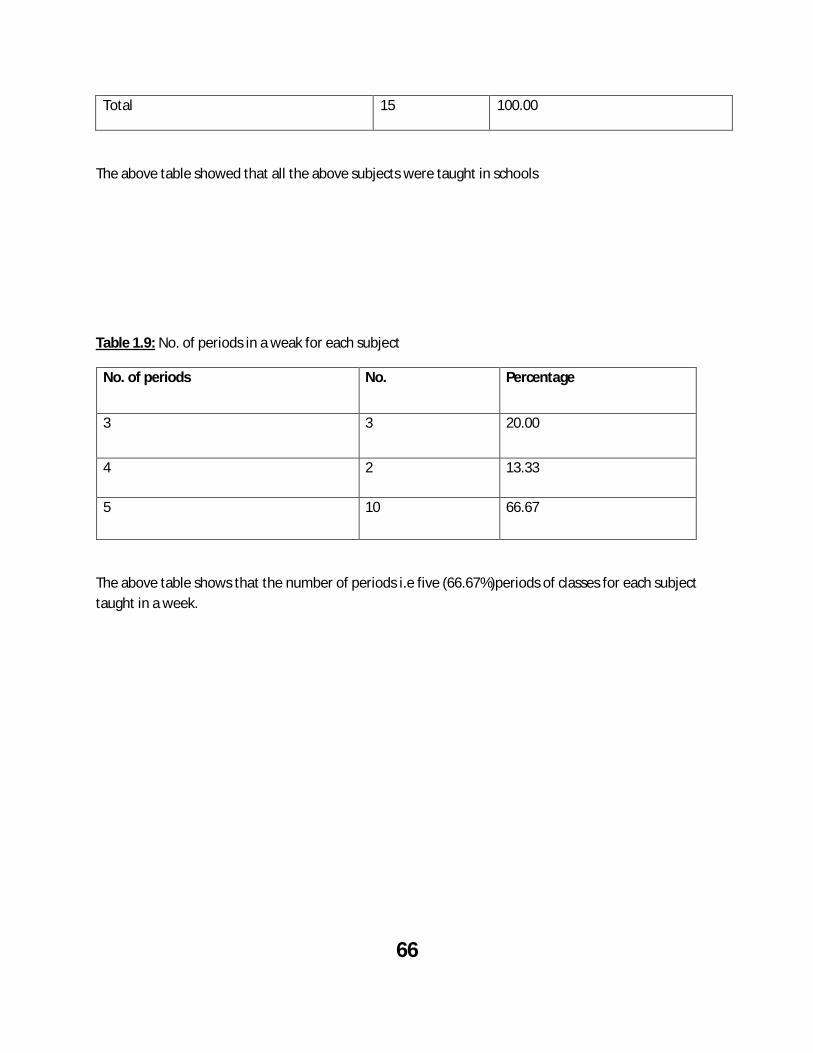
66
Total 15 100.00
The above table showed that all the above subjects were taught in schools
Table 1.9: No. of periods in a weak for each subject
No. of periods No. Percentage
3 3 20.00
4 2 13.33
5 10 66.67
The above table shows that the number of periods i.e five (66.67%)periods of classes for each subject taught in a week.
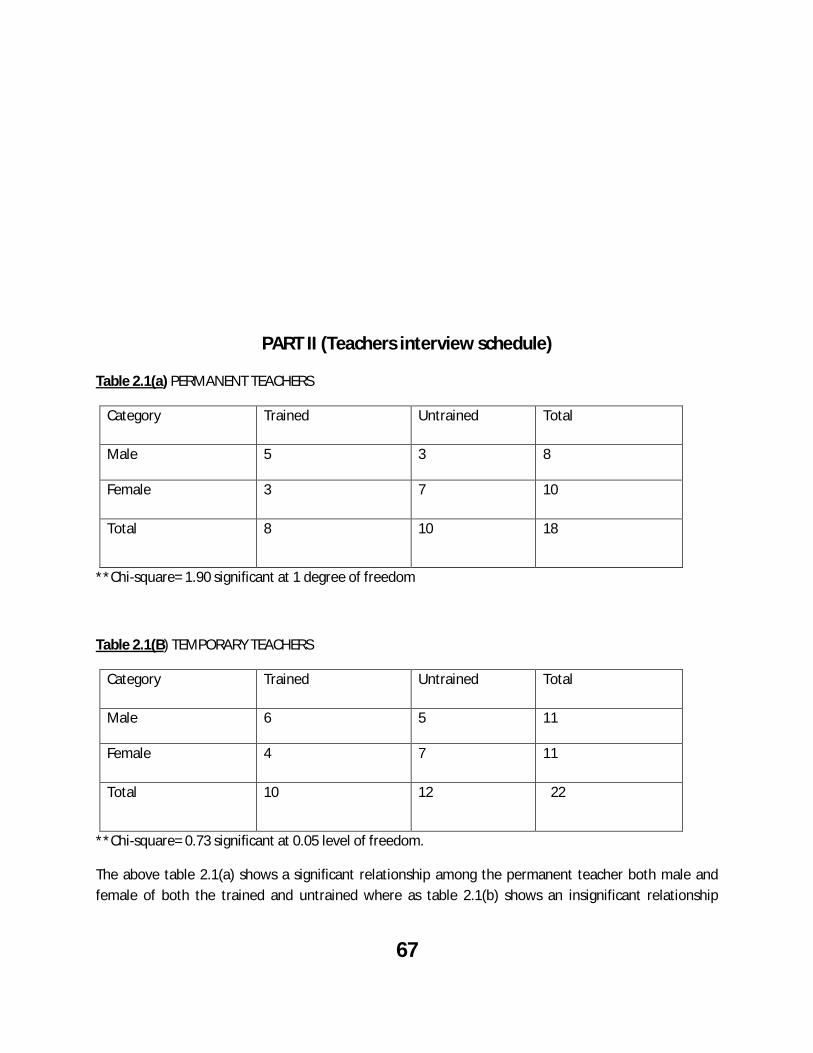
67
PART II (Teachers interview schedule)
Table 2.1(a) PERMANENT TEACHERS
Category Trained Untrained Total
Male 5 3 8
Female 3 7 10
Total 8 10 18
**Chi-square= 1.90 significant at 1 degree of freedom
Table 2.1(B) TEMPORARY TEACHERS
Category Trained Untrained Total
Male 6 5 11
Female 4 7 11
Total 10 12 22
**Chi-square= 0.73 significant at 0.05 level of freedom.
The above table 2.1(a) shows a significant relationship among the permanent teacher both male and female of both the trained and untrained where as table 2.1(b) shows an insignificant relationship
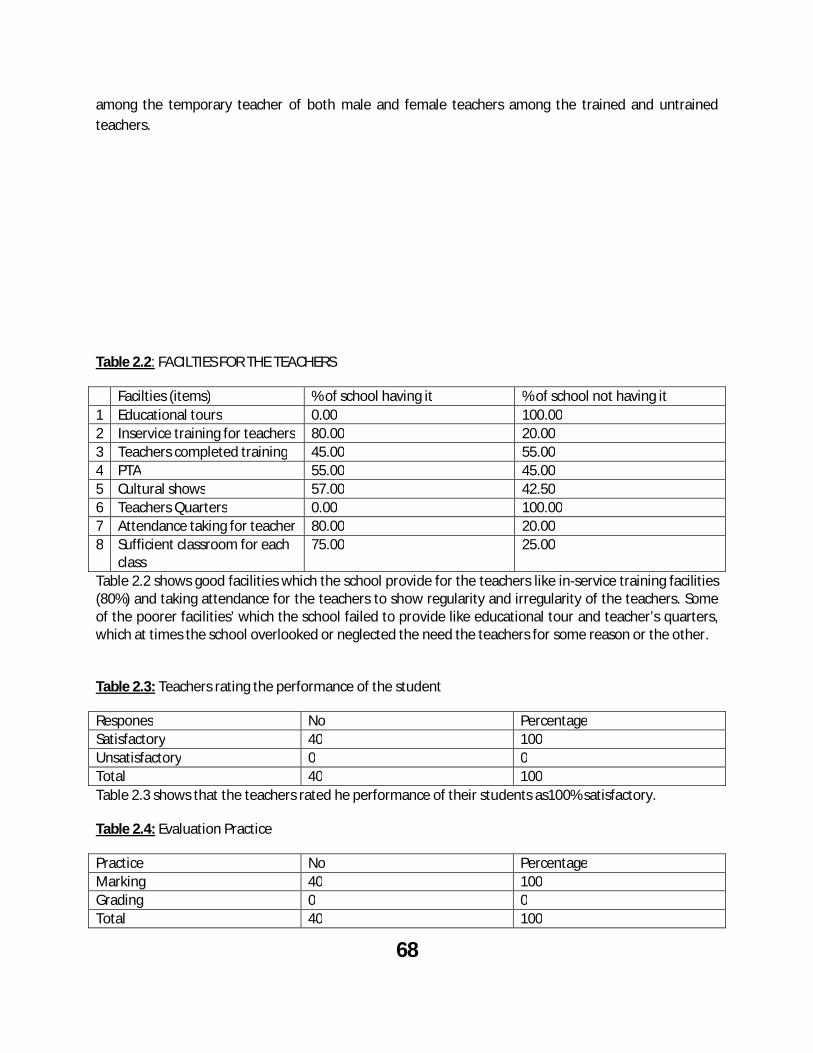
68
among the temporary teacher of both male and female teachers among the trained and untrained teachers.
Table 2.2: FACILTIES FOR THE TEACHERS
Facilties (items) % of school having it % of school not having it 1 Educational tours 0.00 100.00 2 Inservice training for teachers 80.00 20.00 3 Teachers completed training 45.00 55.00 4 PTA 55.00 45.00 5 Cultural shows 57.00 42.50 6 Teachers Quarters 0.00 100.00 7 Attendance taking for teacher 80.00 20.00 8 Sufficient classroom for each
class 75.00 25.00
Table 2.2 shows good facilities which the school provide for the teachers like in-service training facilities (80%) and taking attendance for the teachers to show regularity and irregularity of the teachers. Some of the poorer facilities’ which the school failed to provide like educational tour and teacher’s quarters, which at times the school overlooked or neglected the need the teachers for some reason or the other.
Table 2.3: Teachers rating the performance of the student
Respones No Percentage Satisfactory 40 100 Unsatisfactory 0 0 Total 40 100 Table 2.3 shows that the teachers rated he performance of their students as100% satisfactory.
Table 2.4: Evaluation Practice
Practice No Percentage Marking 40 100 Grading 0 0 Total 40 100
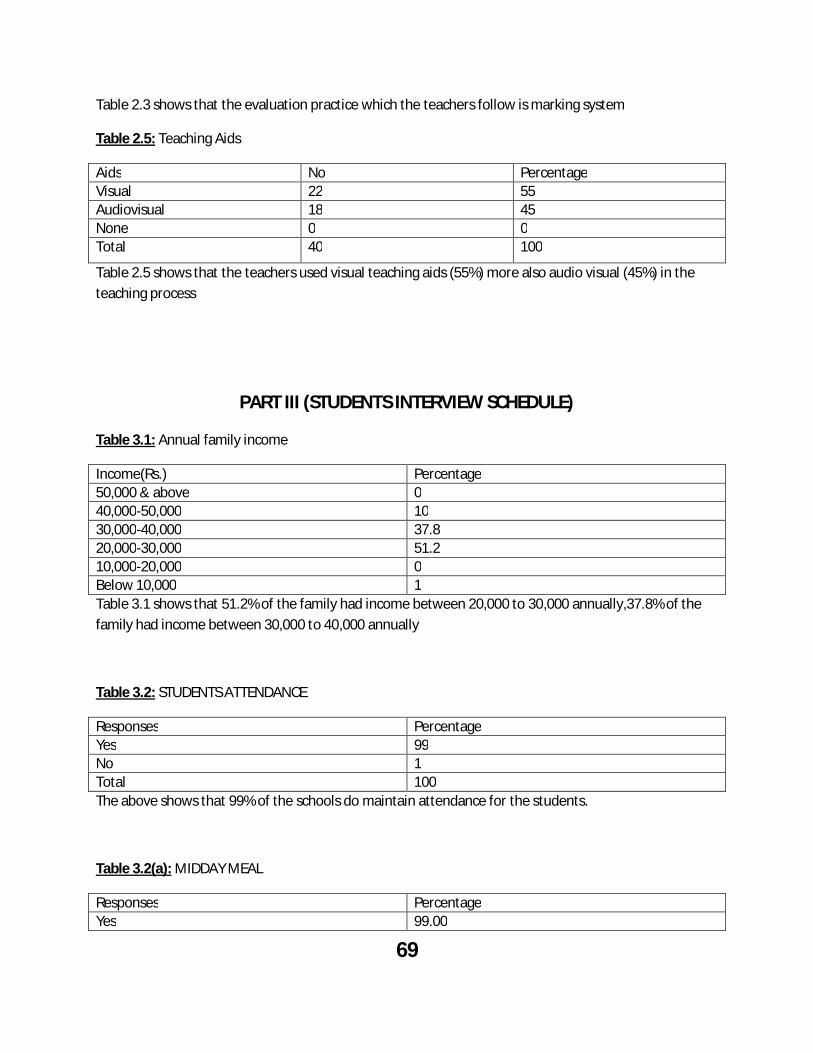
69
Table 2.3 shows that the evaluation practice which the teachers follow is marking system
Table 2.5: Teaching Aids
Aids No Percentage Visual 22 55 Audiovisual 18 45 None 0 0 Total 40 100
Table 2.5 shows that the teachers used visual teaching aids (55%) more also audio visual (45%) in the teaching process
PART III (STUDENTS INTERVIEW SCHEDULE)
Table 3.1: Annual family income
Income(Rs.) Percentage 50,000 & above 0 40,000-50,000 10 30,000-40,000 37.8 20,000-30,000 51.2 10,000-20,000 0 Below 10,000 1 Table 3.1 shows that 51.2% of the family had income between 20,000 to 30,000 annually,37.8% of the family had income between 30,000 to 40,000 annually
Table 3.2: STUDENTS ATTENDANCE
Responses Percentage Yes 99 No 1 Total 100 The above shows that 99% of the schools do maintain attendance for the students.
Table 3.2(a): MIDDAY MEAL
Responses Percentage Yes 99.00
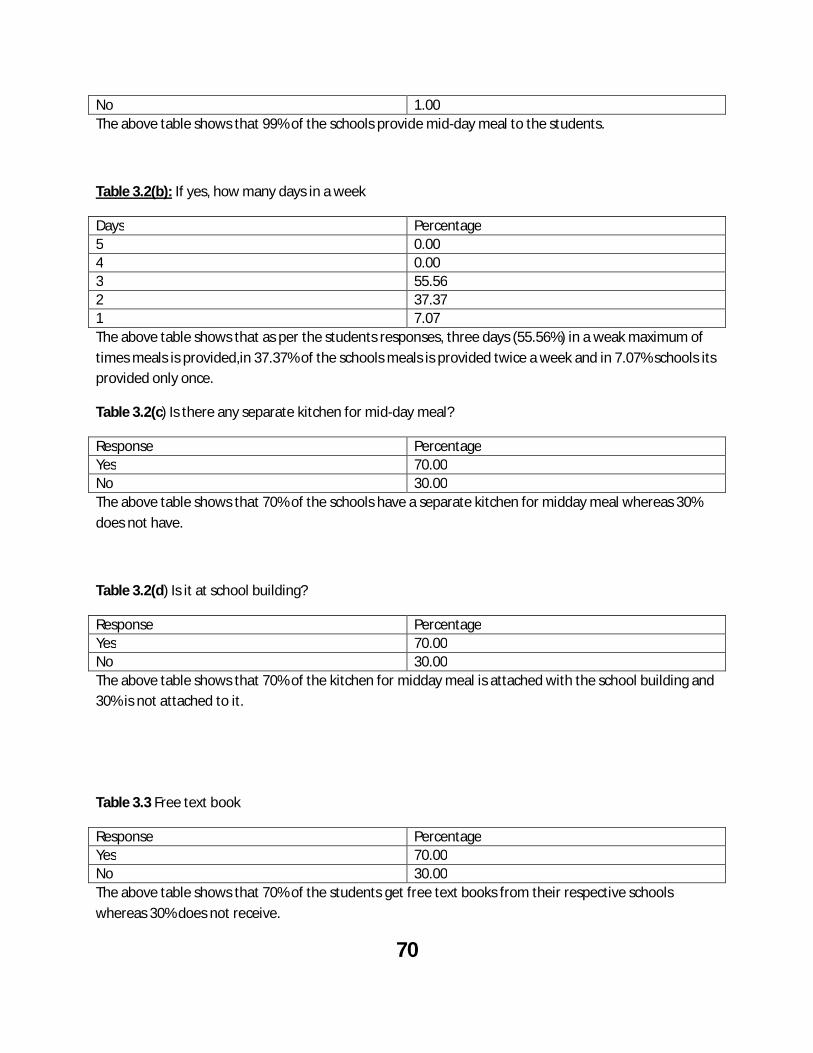
70
No 1.00 The above table shows that 99% of the schools provide mid-day meal to the students.
Table 3.2(b): If yes, how many days in a week
Days Percentage 5 0.00 4 0.00 3 55.56 2 37.37 1 7.07 The above table shows that as per the students responses, three days (55.56%) in a weak maximum of times meals is provided,in 37.37% of the schools meals is provided twice a week and in 7.07% schools its provided only once.
Table 3.2(c) Is there any separate kitchen for mid-day meal?
Response Percentage Yes 70.00 No 30.00 The above table shows that 70% of the schools have a separate kitchen for midday meal whereas 30% does not have.
Table 3.2(d) Is it at school building?
Response Percentage Yes 70.00 No 30.00 The above table shows that 70% of the kitchen for midday meal is attached with the school building and 30% is not attached to it.
Table 3.3 Free text book
Response Percentage Yes 70.00 No 30.00 The above table shows that 70% of the students get free text books from their respective schools whereas 30% does not receive.

71
Table 3.4(a) Is School Uniform
Response Percentage Yes 90.00 No 10.00 The above table shows that 90% of the schools have school uniform.
Table 3.4(b) Is it supplied by?
Response Percentage Government 0 Purchased by self 100.00 The above table shows that 100% of the students have to purchase their own uniform.
Table 3.5 Scholarship
Response Percentage Yes 0 No 100.00 The above table shows that the students do not receive or avail any scholarships.
Table 3.6(a) Educational Tours/Picnics
Response Percentage Yes 38 No 62 The above table shows that 62% of the schools used to take students for educational tours and picnics.
Table 3.6(b) Educational Tours/Picnics are--
Response Percentage Regular 0 Irregular 100 The above table shows that these educational tours / picnics are on an irregular basis.
72
CHAPTER-6
LIMITATION, SUGGESTION AND CONCLUSION
73
LIMITATION OF THE STUDY
1. The schools were not equally distributed while collecting the sample. 2. The sample size has been reduced from 2000 to 1000 only.
SUGGESTION FOR FUTURE RESEARCH:
1. Similar studies on a larger size sample can be replicated. 2. Intensive studies devoting themselves exclusively to a single dimension
such as provision of educational facilities, their utilization, school, teacher, family and pupil inputs can be undertaken.
3. Studies of that socio psychological process both in the home and at school would really be very useful.
4. Case of high achieving primary schools in the rural areas of Meghalaya should be made to find factors responsible for their success.
5. Researches of a developmental type, experimenting with different types of programmes compensatory, remedial, enrichment, guidance, teacher-orientation, parental education, and curriculum renewal and so on-which will help in increasing the educational attainment and personality development of the tribal children in Meghalaya, should be undertaken on a priority basis.
6. Also essential is research on the socio economic and environmental conditions, life style, values and attitudes of the tribal student's parents in Meghalaya and the child-rearing practices which impinge on the education of their children.
CONCLUSION: The study has attempted to find out the elementary education among tribal children of Meghalaya with the help of different variables taken under study. The achievement test was the main attribute to find the quality of education; hence it proved to be successful as the student performed well in all the subjects and outstanding in science. Thus free access to primary education without adequate supporting facilities and services had generated into a costly affair which was beyond the means of many tribal parents of Meghalaya who were living below the poverty line as indicated by the interview schedule data that most of them were farmers and laborers but this does not prevent them for sending their children to school. It may also be seen that in recent years there has been an
74
increase in the enrolment of the children in school and also the attendance of the children. The present study has revealed that though the schools have more of temporary teachers than the permanent teachers, still the quality of education is found to be better because of their dedication and willingness to serve. Parental love, encouragement, help and also aspiration also contributes towards the education of children and for their children to attend school. To improve more and more and make better quality of elementary education in the rural areas, some specific measures should also be undertaken i.e. to develop more individualized, thematic and sequential type of instructional materials with many more illustrations, visual and auditory experiences and scope for practical experiences also by making greater use of play activity, practical and project methods in teaching and using more observation, discussion, inductive and inquiry approaches and visits and excursion so as to make first hand and more permanent learning more possible. Put more emphasis on learning in the school than on assigning homework of a written nature for which most of these children do not get the necessary time, place and parental help. To also improve the system of evaluation i.e. the teaching learning process rather than to certify achievement, using more of a developmental, diagnostic and informal type of evaluation and making greater use of oral, practical and situational test, observational techniques and maintenance of different types of records of students’ progress, also making greater provision and ensuring more frequent organization of co-curricular activities of all types including games, sports and drama in which these children take more interest, also ensuring greater pupil participation in them. Special programme for the in service education of the teachers in the rural areas should be organized every now and then to enable them to acquire the necessary knowledge and understanding about the background, characteristics and problems of rural children and do develop necessary techniques for tailoring instructions to their needs. Above all such programmes should change the teacher's perceptions about rural children in a more positive direction. School supervision and inspection should be considerably strengthened in the rural areas. Headmaster should be required to do less of teaching work and more of supervisory work of which they should they keep regular records which can be checked occasionally by the school inspectors. The inspectors should also pay more visits to the rural schools and give necessary guidance to the harassed
75
school headmaster and teachers. For this it may be necessary to decrease the school: inspector ratio which can be done by appointing more inspectors. Above all, parent education and community involvement are pre-requisites for the optimum functioning of the school and the success of its pupils. Adult education should therefore become a must in all the rural areas of Meghalaya, further parent-teacher association (PTA) should be organized which should hold frequent meetings and organized programmes of mutual help and co-operation to further the cause and quality of education and development of tribal children in the rural areas. To further the improvement of quality of elementary education in the rural areas among the tribal children in Meghalaya, enrichment programmes of studies, discussion, visitations, excursions and creative work should be provided all through the school for exposing these children to extra school and out of school experiences which will broaden their perspective and deepen their love and appreciation for life. More extra programme in mathematics, language, social studies etc should organized for the weak students after school hours. More qualified experienced, enthusiastic and committed teacher should be appointed in the rural areas. In order to enhance the learning achievement of the pupils strategies in increasing the opportunity to learning time spent in school with teacher present and providing instruction and in doing homework and also to improve classroom atmosphere with good teaching aids such as textbooks, libraries, workbooks and classroom instructional materials. Since the teachers’ attendance is a strong prediction of students learning, strategies that most closely linked teacher's salary, motivation and in-service training programme of teachers. According to the National policy on Education 1986, the following measures will be taken urgently to bring the schedule tribes at par with other. (1) Priority will be accorded to opening of schools in tribal areas. The construction of school building will be under taken in these areas on a priority basis under the normal funds for education, as well as under the Jawaharlal Rozgar Yojana, Tribal welfare Schemes etc. (2) The socio-cultural milieu of the ST has its distinctive characteristics in many cases, their own spoken languages. These underline the need to develop the curricula and device instructional materials in tribal languages at the initial stages with arrangements for switching over to the regional language.

76
(3) Educated and promising schedule tribe youths will be encouraged trained to take up teaching in tribal areas. (4) Residential schools, including Ashram schools, will be established on a large scale. (5) Incentives Schemes will be formulated for the schedule tribes, keeping in view their special needs and life style. Scholarship for higher education will emphasize technical, professional and paraprofessional courses. Special remedial courses and other programmes to remove psycho-social impediments will be provided to improve their performance in various courses. (6) The curriculum at all stages of education will be designed to create an awareness of the rich cultural identity of the tribal people as also of their enormous creative talent.

77
CHAPTER 7
RESUME
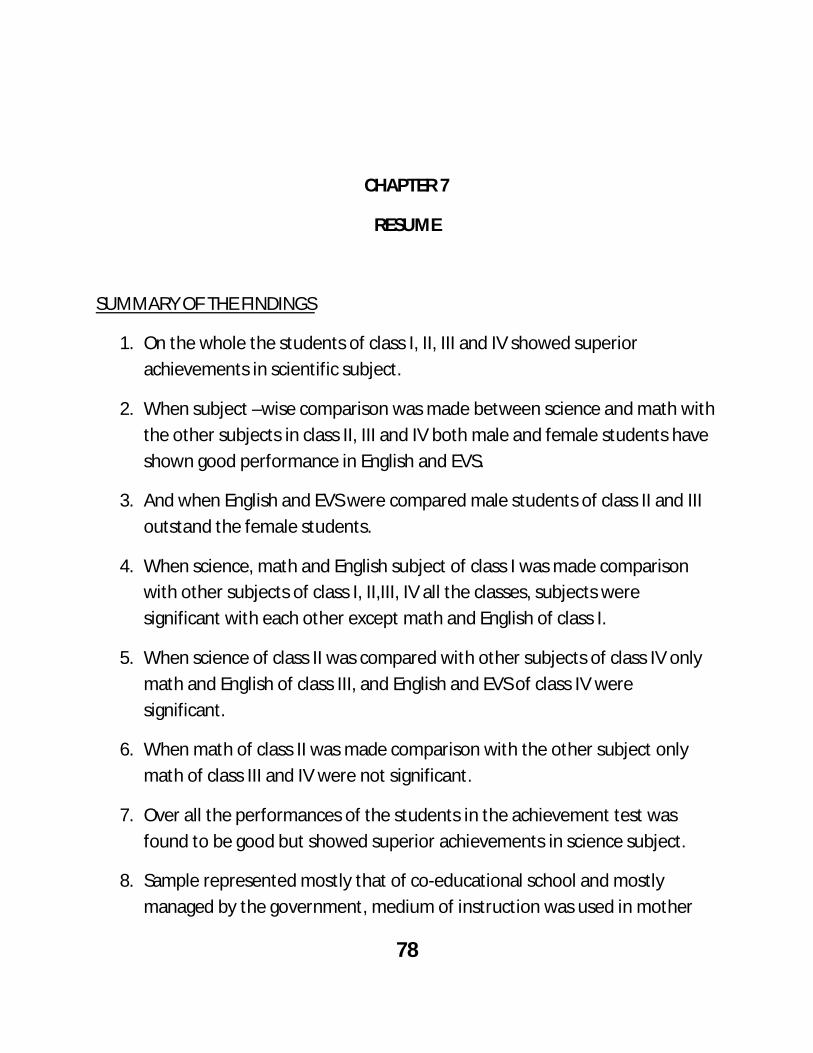
78
CHAPTER 7
RESUME
SUMMARY OF THE FINDINGS
1. On the whole the students of class I, II, III and IV showed superior achievements in scientific subject.
2. When subject –wise comparison was made between science and math with the other subjects in class II, III and IV both male and female students have shown good performance in English and EVS.
3. And when English and EVS were compared male students of class II and III outstand the female students.
4. When science, math and English subject of class I was made comparison with other subjects of class I, II,III, IV all the classes, subjects were significant with each other except math and English of class I.
5. When science of class II was compared with other subjects of class IV only math and English of class III, and English and EVS of class IV were significant.
6. When math of class II was made comparison with the other subject only math of class III and IV were not significant.
7. Over all the performances of the students in the achievement test was found to be good but showed superior achievements in science subject.
8. Sample represented mostly that of co-educational school and mostly managed by the government, medium of instruction was used in mother
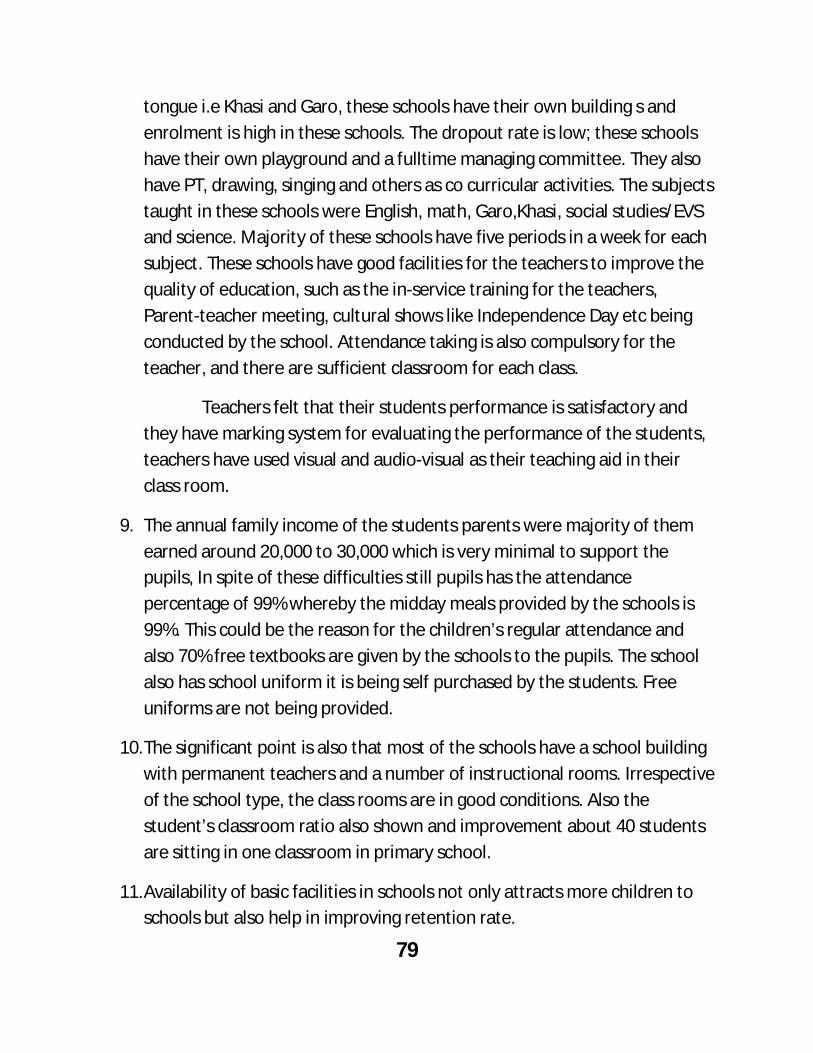
79
tongue i.e Khasi and Garo, these schools have their own building s and enrolment is high in these schools. The dropout rate is low; these schools have their own playground and a fulltime managing committee. They also have PT, drawing, singing and others as co curricular activities. The subjects taught in these schools were English, math, Garo,Khasi, social studies/EVS and science. Majority of these schools have five periods in a week for each subject. These schools have good facilities for the teachers to improve the quality of education, such as the in-service training for the teachers, Parent-teacher meeting, cultural shows like Independence Day etc being conducted by the school. Attendance taking is also compulsory for the teacher, and there are sufficient classroom for each class.
Teachers felt that their students performance is satisfactory and they have marking system for evaluating the performance of the students, teachers have used visual and audio-visual as their teaching aid in their class room.
9. The annual family income of the students parents were majority of them earned around 20,000 to 30,000 which is very minimal to support the pupils, In spite of these difficulties still pupils has the attendance percentage of 99% whereby the midday meals provided by the schools is 99%. This could be the reason for the children’s regular attendance and also 70% free textbooks are given by the schools to the pupils. The school also has school uniform it is being self purchased by the students. Free uniforms are not being provided.
10. The significant point is also that most of the schools have a school building with permanent teachers and a number of instructional rooms. Irrespective of the school type, the class rooms are in good conditions. Also the student’s classroom ratio also shown and improvement about 40 students are sitting in one classroom in primary school.
11. Availability of basic facilities in schools not only attracts more children to schools but also help in improving retention rate.

80
12. Providing nutritious meal to all children under the midday meal scheme is one of the ambitious programmes of the governments, availability of the kitchen shed in school also proves the quality of education.
13. Learner achievement is considered as one of the important indicators of qualities of education. Results of the achievements show significant.
14. Most of these schools, female teachers are found more in number. This is true of all school types. There are more temporary teachers than the permanent teachers in these schools.
15. The formation of Parent-Teacher Association (PTA) in schools shows efforts directed towards bringing about changes at the primary school level.
16. The principals play role in school management by performing day-to-day administrative functions and routine work and maintenance of the school. These include conducting school assembly and keeping track of the teacher’s attendance etc.
17. The supervision officer supervises and inspects all schools in their jurisdiction. This function includes making at least 3 to 4 school visits, one of which is a daylong thorough school inspection while the other 2 to 3 are unscheduled surprise visits to monitor the functioning of the school.
18. Some schools have separate toilet facilities for girls and boys and these are extremely important factors in enrolment and attendance for a qualitative education atmosphere. Lack of toilets has severe ramification for type learning process.
19. The issue of uniforms needs a closure look by the government to determine the quality of education. As most of these schools have school uniform but they are not free. It is actually a burden for the poor families to purchase these uniforms. The government should really think to provide free uniform.

81
20. Teaching aids are available in these schools but we really don’t know how many of these schools uses them is the question to all of us. As we found in large rural classrooms that did not have electricity warranting a questioning of their pertinence.
21. Students were performing well in their subjects, the instructional activities that witnessed were largely drill based procedures where the teacher either sing a song or taught the children to repeat an oral dictation/spelling after her when student participation was solicited it was largely to give a rote answer to a question, to read out the text from the text book. Eg. Recitation of Khasi, Garo and English without any mistake. Denote that it ensures improvement in the achievement level of all students of a school.
22. Students in these class rooms were definitely given an opportunity to read and write Garo, Khasi and English without any mistake and often instructions were mostly in mother tongue.
82
BIBLIOGRAPHY
The Shllong Times, Shillong, Thursday Aug 26, 2010 by R.C Mishra.
Govt. of Andhra Pradesh (various years) Annual plan, Hyderabad:
Ministry of Finance.
MRHD (1995) Development of Education in India 1993-94.
MRHD (1989): Selected educational statistics.
NIEPA, General education in India.
NCERT (1997) Sixth All Indiia Educational Survey, New Delhi.
Govt. of India, Acharya Ramamurthy Committee report.
World Bank, June 28, 1996, Document.
Govt. of India (1986) National pilcy on Education 1986, New Delhi
Andhra Pradesh, village Pilot project: K.S Rao, member of the
parliament Loksabha.
Nagaland: Communication of educating, Parimal Bardhan, delegation
of European commission, New Delhi and Nagaland Human
Development Report 2004.
The World Bank (19970 Primary education in India, New Delhi, Allied
Publisher limited.
Myers, R.G (1992) Early childhood development Programs in Latin
America: toward definition of a investment strategy, Report No.32 The
World Bank.
Anima Rani (2008): An emprical study of the Midday Meal programme

83
in Khurda, Orissa, Vol.43 No.25 pg 46-45.
Ajanta brahma (2007): Quality in Elementary education with special
reference to ST children of Assam, Directorate of SCERT,Assam.
Jean dreze and Parajita goyal (2003) : The future midday meal vol.20,
on.6. India's National Magazine, The Hindu.
Suchi Grover + Nishu Harpett Singh (200): The quality of primary
education: A case study of Madurai and Villupuarm districts in Tami
lNadu, India.
Ved Prakash (1993): School education in rural areas India, published
and printed by K.M rai, Mittal for Mittal publication, New Delhi
N.K Jangira (1993) Qulaity primary education for rural sector, Mittal
publication, New Delhi
ASHA: Tribal child education, Association for India's development.
Sunita chugh (2008) : The govt. primary school Midday Meal Schem,
Dept. of Comparative Education and International Cooperation,
National University of educational Planning and Administration, New
Delhi.
Planning Commission vol 2, ch2. Elementary Education, Tenth Five
Year Plan 2002-07.
Dreze, J, Goyal, A (2003): The future of Midday Meal: Economic and
political weekly, 1Nov 2003, pg 4673-4683.
Naidu, T.S (1999) Strategic Planning for the future development of the
tribes in India. Puducherry centre for future studies, Pondicherry
University.
Reddy, P.S (2000) District Primary Education a programme in Andhra
Pradesh. A social assessment study among the tribal groups. Report
84
under by DPEP, Govt. of Andhra Pradesh, Tirupati: Department of
Anthropology, Sri Venkateswara University.
Mona Sedwal and Sangeeta Kamat (2008): Education and social
equity with a special focus n SC and ST in elementary education:
create pathways to success, Research Monograph No. 19 National
University of Educational Planning and Administration NUEPA, funded
by DFID
L.N Bhagat and Ashok Oraon: Education for sustainable development:
A tudy of action, achievement and challenges with reference to school
education in India.
Jeffery H. Marshal (2007) School Quality and learning gains in rual
areas Gautemala.
Mullens J.E, R.J et al (1986). The contribution of training and subject
mattr knowledge to teaching effectiveness. A multiplied analysis of
longitudinal evidence from Belize. Imperative education Review, 40,
139-157.
Santibazaar, L (2006) why we should care if teacher get A's: Teacher
test scores and achievement in Mexico. Economics of education
Review, 25, 510-520.
Ranjan kumar Das and B.N Panda (2008)Effectiveness of village
education committee on promoting VEE-A case study.
Government of Maharastra, Performance Budget 1999-2000, School
eduction.
Government of Maharastra, Ninth Five Year Plan 1999-2000, Bombay
1997, pg 303-308
Inamdar N.R, Educational Administration of the Zilla Parishads in
85
Maharastra (Bombay).
Planning commission Report Ch- III Maharastra, Background of
Elementary Education.
Mid-Term Approval of the Tenth Five Year, 2005, Planning
Commission, New Delhi.
NCERT (2004-05): Learning Achievement at Elementary Level, New
Delhi, Department of Education Movement & Evaluation.
Social and Rural research institute (2005) New Delhi.
Eleventh Five Year Plan education.
MHRD (2007) PPT presentation in th steering committee meeting held
in the planning commission.
Alfred T Kusubi (2008) Critique and analysis of universal primary
education (UPE) in Uganda in general suggestion for improvement in
particular local areas presented at the Houston Texas Busoga
Twegaite, Annual international convention May 22-26th, University of
Wisconsin, Oshkosh college of Education and Human services.
Amartya Sen's Practical team (20050: Cooked Midday meal
programme in West Bengal- "A study of Birbhum district".
UNICEF (2005) "Situation Analysis od Midday Meal Programme in
Rajasthan" University of Rajasthan.
Samaj Pragati sahyog (2005) "Midday Meal in Madhya Pradesh".
Anurrudha De, Claire Narnha, Meera Samson, CORD (2005)"midday
Meal Scheme in Delhi"- A functioning programme.
Dr. Rama naik (2005) "Report on Akshawa Dasoha Scheme of
Karnataka" University of Dharwad.
Annual Report (2007) Midday Meal scheme in Madhya Pradesh- a
86
study by Mationa; Institute of Public co-operation and child
development, Indore
6th All India Education survey (1993-94).
School water supply, sanitation and hygiene education, India
Development of drinking water supply, Ministry of Rural Development,
Govt. of India, New Delhi (2004)
Research team of Bureau of Curriculum Development ad Extension
services, WFP (1999) Learning Achievement of Grade 3 to 5 children
in rural Primary Schools of District of Mansehrs NWFF sponsors by
UNESCO, Islamabad.
S.M Aizaz (2002): Learning achievement in primary school of
Pakistan. A quest for quality education, UNESCO, Islamabad, Ministry
of education, Govt. of Pakistan.
Sangeeta Goyal (2007): Learning achievement in India. A study of
Primary education in Rajasthan, South Asian Human development,
The Work Bank.
Adams. D 1998 Defining educational quality: Educational planning,
11(2):3-18.
Anurudha Kumar (2004): Progressi Education, One India and One
people/eldoc/n20/sept04oio.pdf
H.D Dwarkanath 1/10/2002: Policies and Programmes to improve
school education in rural India- A critical evaluation social action
/eldoc/aoo/SOA10.pdf
HINDU 2001- UP campaign for chool enrolment.
MHRD: Enrolment and dropout amongst students- Annual report
2003-2004, Govt. of India, NOO.30

87
Durkheim E, 1950, Suicide: A study in sociology: translated by John. A.
Spaulding and George Simpson, Gencoe, Fress press.
The report of Steering Committee of the govt. (2001): Empowering the
scheduled tribes.