Embed Size (px)
Citation preview
Quality Indicators in colonoscopy
Prof Matt Rutter
University Hospital of North Tees
UK

Possible conflicts of interest
• Nil
Matt Rutter
Overview
• Compelling evidence of the importance of quality in screening
• 10 minutes – Relevance of Quality Indicators – How to set colonoscopy Quality Indicators – Examples - issues with Quality Indicators & how to resolve
them
– Quality indicators also known as: • Quality measures • Performance measures • Key performance indicators (KPIs)

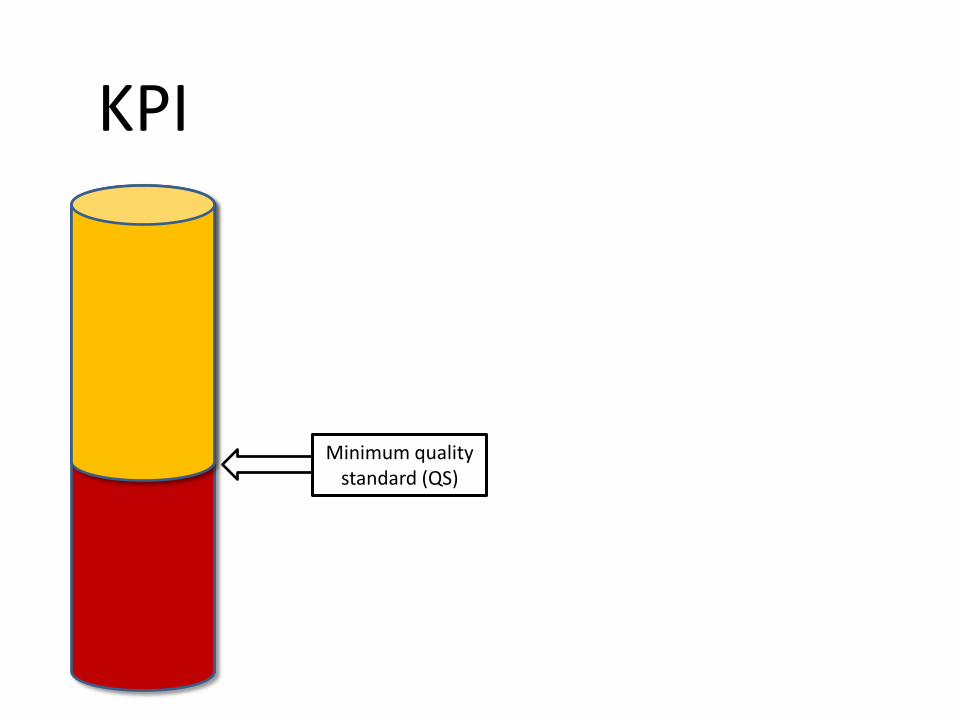
What is a Key Performance Indicator?
A measurement used to assess performance of a service/aspect of a service
• Part of the quality control cycle (Set Measure Act Repeat) • Early warning system – identifies potential problems
• KPIs help keep a balanced eye on all aspects of a service
– Determine areas (domains) to be assessed
• KPIs should be: – Relevant to that domain – Objective & reproducible - Define KPI carefully – Practical & timely to measure
• Only measure things worth measuring

KPI
KPI
Minimum quality standard (QS)
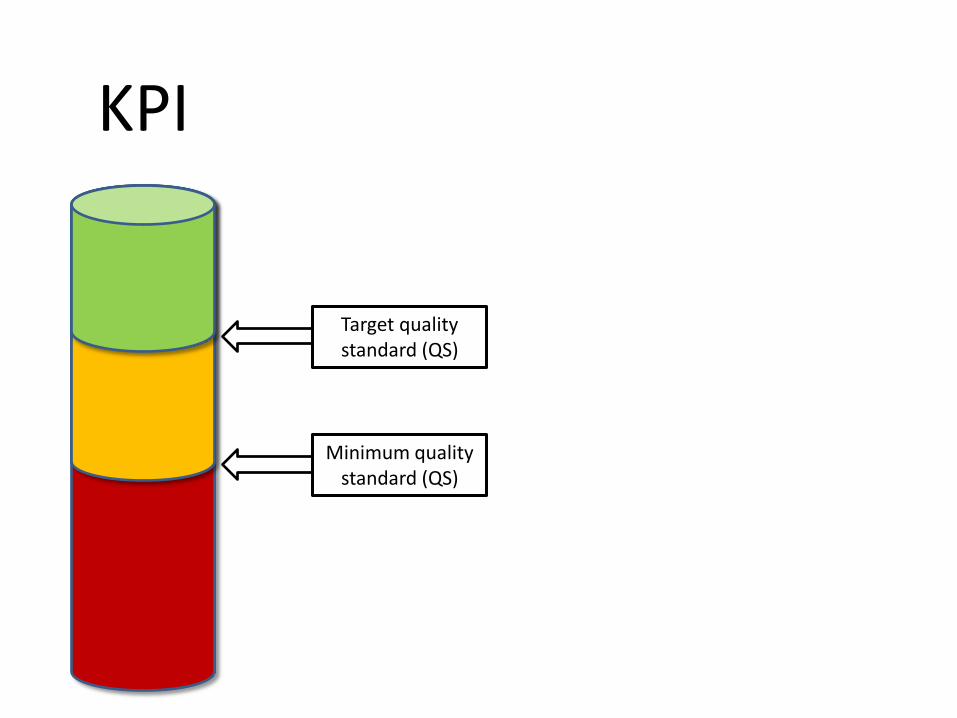
KPI
Minimum quality standard (QS)
Target quality standard (QS)
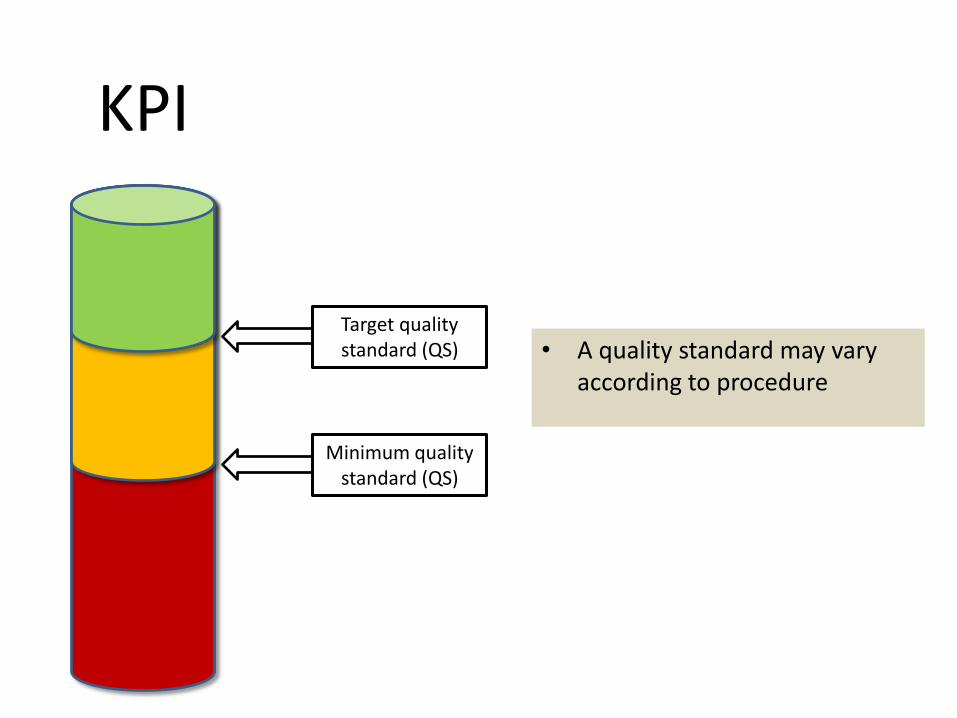
KPI
Minimum quality standard (QS)
Target quality standard (QS) • A quality standard may vary
according to procedure

What to measure
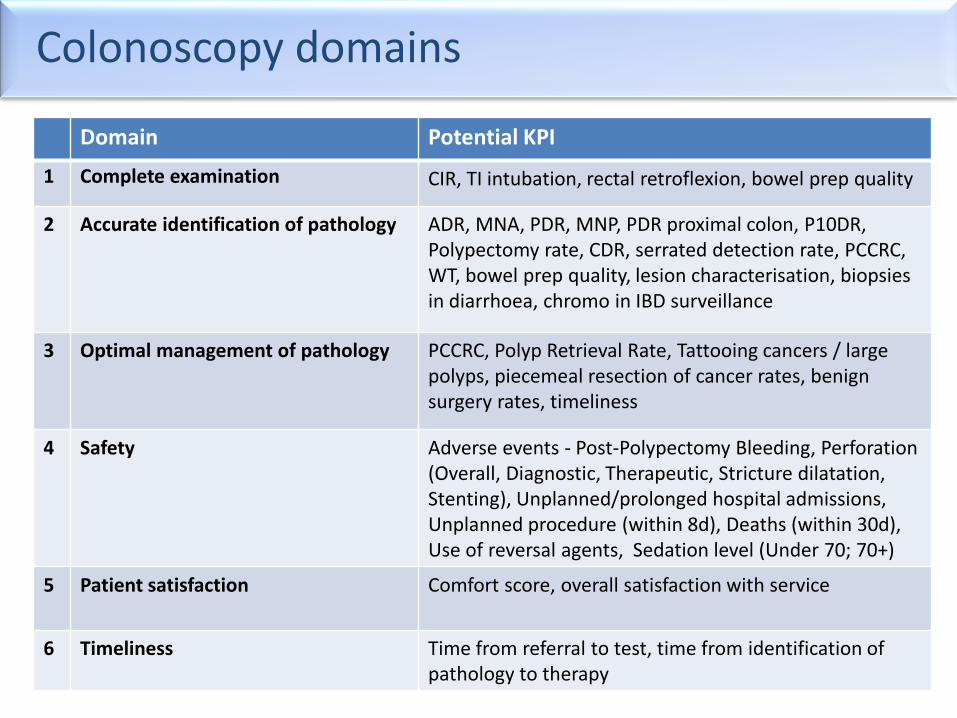
Colonoscopy domains
Domain Potential KPI
1 Complete examination CIR, TI intubation, rectal retroflexion, bowel prep quality
2 Accurate identification of pathology ADR, MNA, PDR, MNP, PDR proximal colon, P10DR, Polypectomy rate, CDR, serrated detection rate, PCCRC, WT, bowel prep quality, lesion characterisation, biopsies in diarrhoea, chromo in IBD surveillance
3 Optimal management of pathology PCCRC, Polyp Retrieval Rate, Tattooing cancers / large polyps, piecemeal resection of cancer rates, benign surgery rates, timeliness
4 Safety Adverse events - Post-Polypectomy Bleeding, Perforation (Overall, Diagnostic, Therapeutic, Stricture dilatation, Stenting), Unplanned/prolonged hospital admissions, Unplanned procedure (within 8d), Deaths (within 30d), Use of reversal agents, Sedation level (Under 70; 70+)
5 Patient satisfaction Comfort score, overall satisfaction with service
6 Timeliness Time from referral to test, time from identification of pathology to therapy
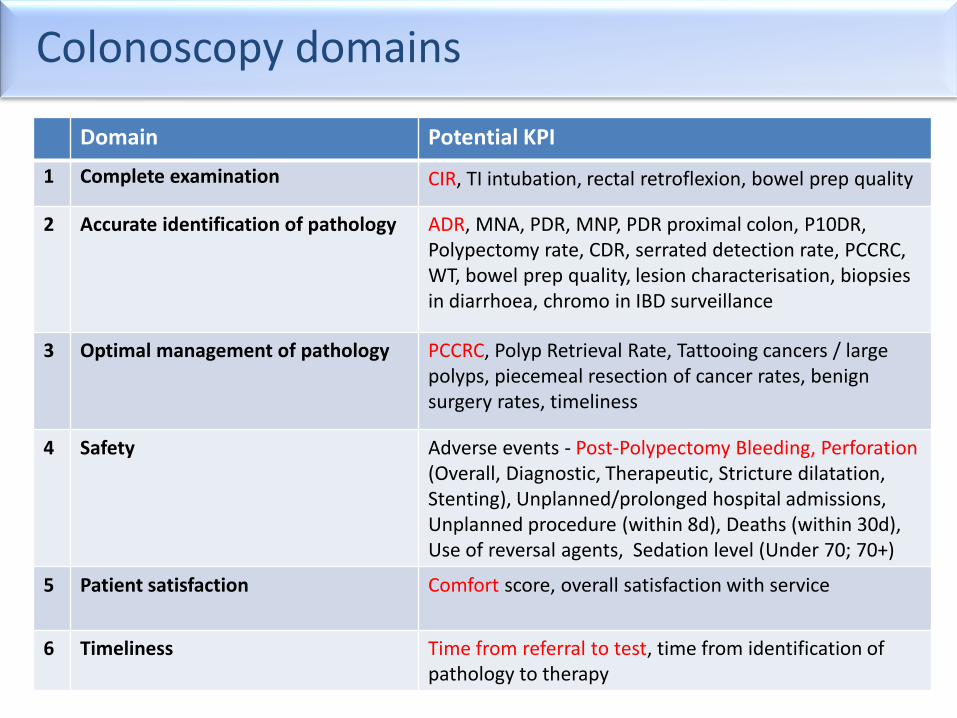
Example Domain: Complete Examination
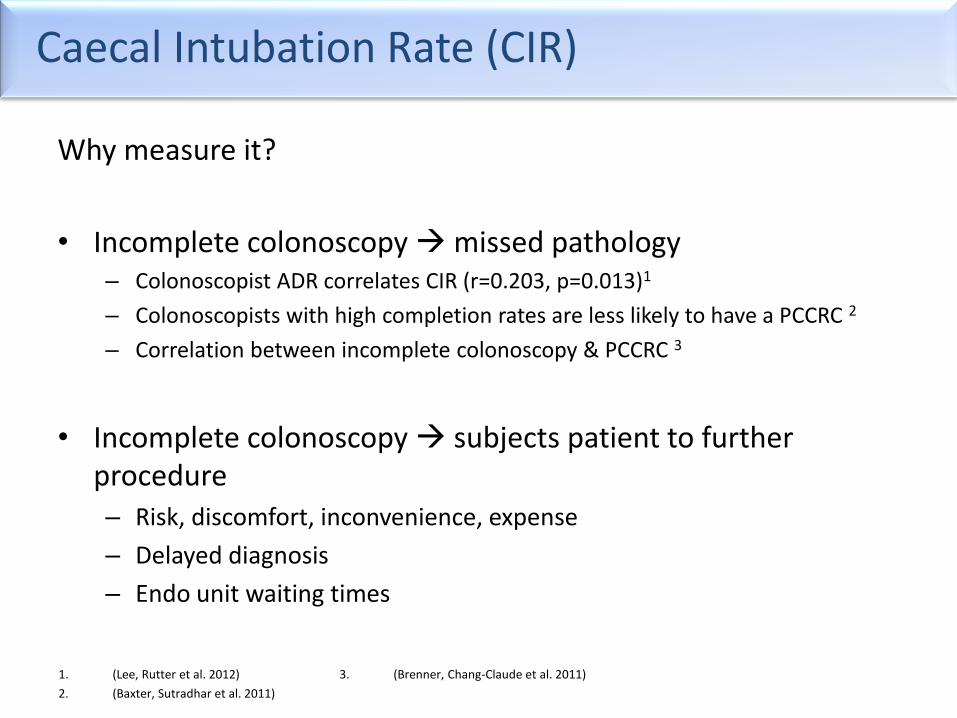
Caecal Intubation Rate (CIR)
Why measure it?
• Incomplete colonoscopy missed pathology – Colonoscopist ADR correlates CIR (r=0.203, p=0.013)1
– Colonoscopists with high completion rates are less likely to have a PCCRC 2
– Correlation between incomplete colonoscopy & PCCRC 3
• Incomplete colonoscopy subjects patient to further procedure – Risk, discomfort, inconvenience, expense
– Delayed diagnosis
– Endo unit waiting times
1. (Lee, Rutter et al. 2012)
2. (Baxter, Sutradhar et al. 2011)
3. (Brenner, Chang-Claude et al. 2011)
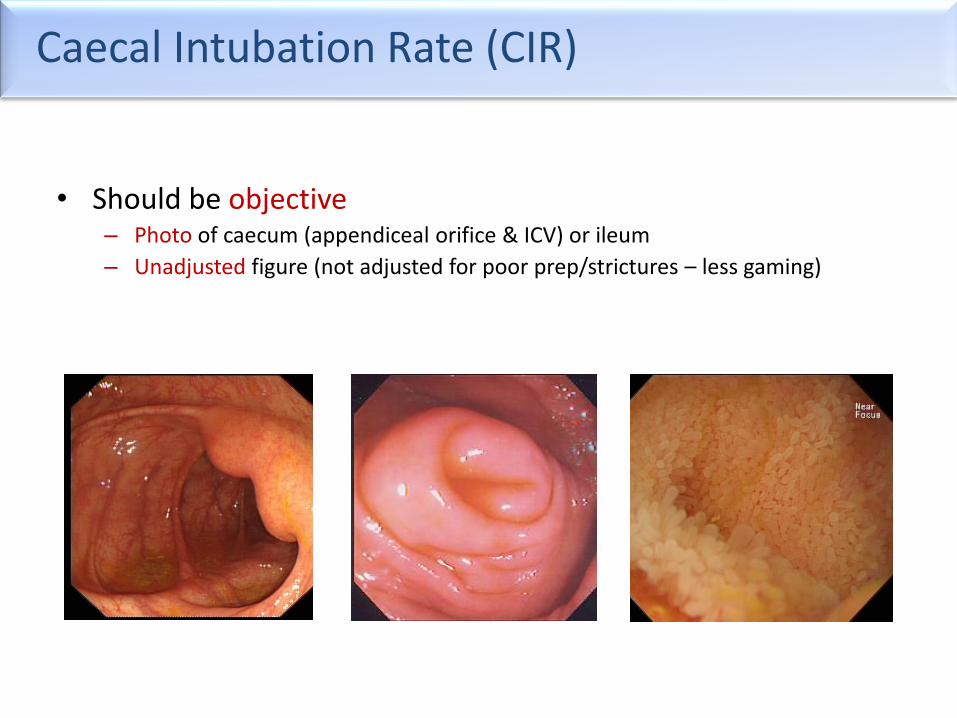
Caecal Intubation Rate (CIR)
• Should be objective – Photo of caecum (appendiceal orifice & ICV) or ileum
– Unadjusted figure (not adjusted for poor prep/strictures – less gaming)
Example Domain: Safety
An example – post-polypectomy bleeding (PPB)
• Most frequent complication of polypectomy
• Rates of 0.26 to 6.1% 2-4
• Why the 20-fold variation?
1. (Rutter, Nickerson et al. 2013)
2. (Gavin, Valori et al. 2012)
3. (Rosen, Bub et al. 1993)
4. (Nelson, McQuaid et al. 2002)
5. (Cotton, Eisen et al. 2010)
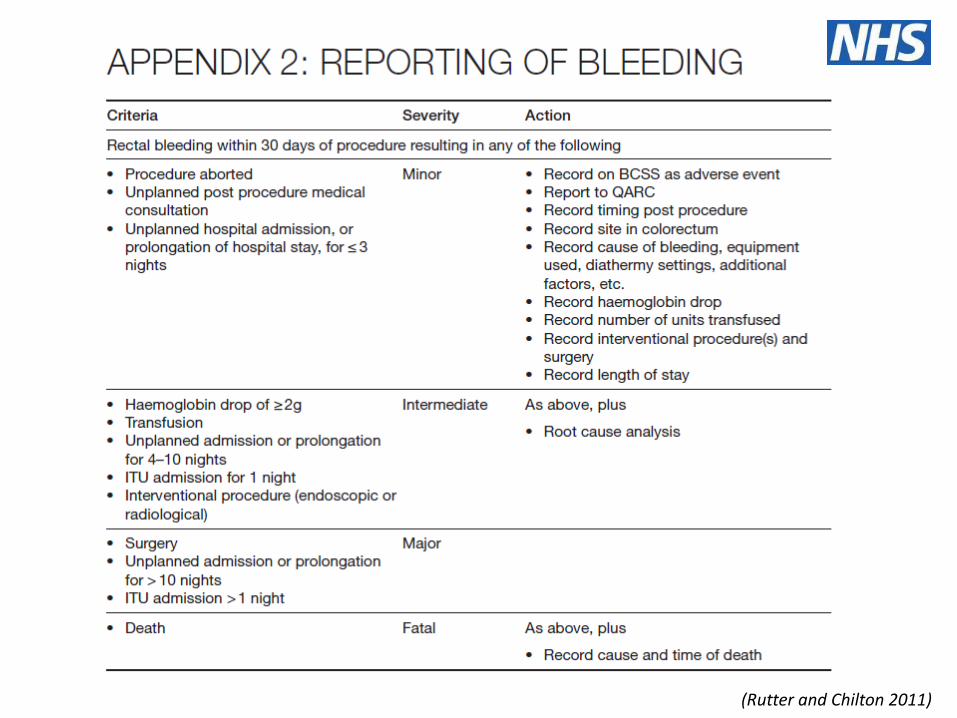
6. (Rutter and Chilton 2011)
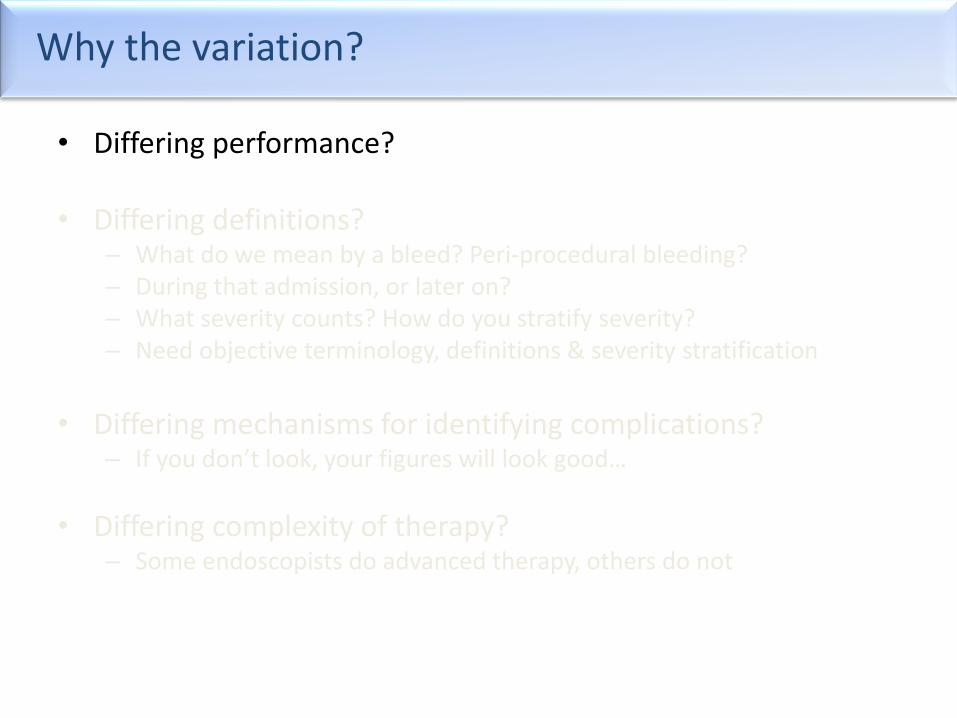
Why the variation?
• Differing performance?
• Differing definitions? – What do we mean by a bleed? Peri-procedural bleeding? – During that admission, or later on? – What severity counts? How do you stratify severity? – Need objective terminology, definitions & severity stratification
• Differing mechanisms for identifying complications?
– If you don’t look, your figures will look good…
• Differing complexity of therapy? – Some endoscopists do advanced therapy, others do not
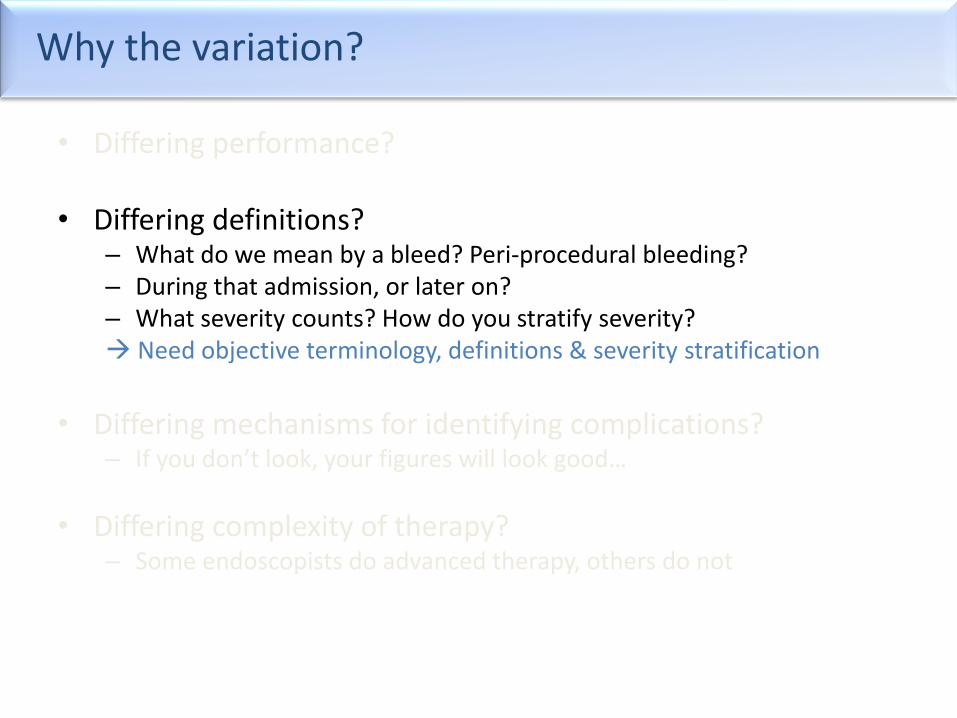
Why the variation?
• Differing performance?
• Differing definitions? – What do we mean by a bleed? Peri-procedural bleeding? – During that admission, or later on? – What severity counts? How do you stratify severity? Need objective terminology, definitions & severity stratification
• Differing mechanisms for identifying complications?
– If you don’t look, your figures will look good…
• Differing complexity of therapy? – Some endoscopists do advanced therapy, others do not
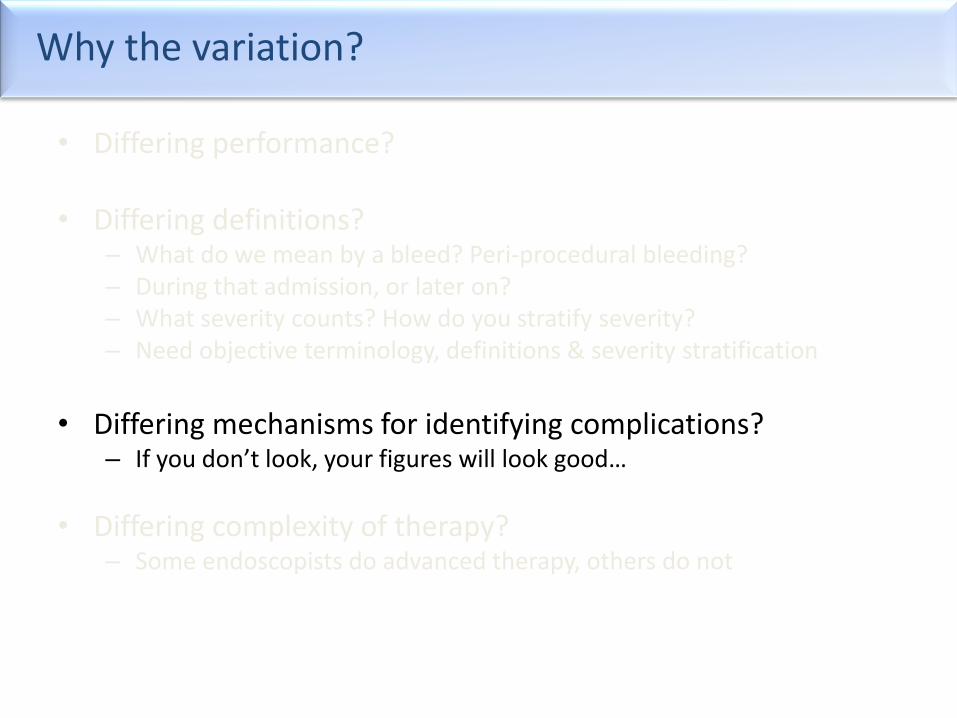
Why the variation?
• Differing performance?
• Differing definitions? – What do we mean by a bleed? Peri-procedural bleeding? – During that admission, or later on? – What severity counts? How do you stratify severity? – Need objective terminology, definitions & severity stratification
• Differing mechanisms for identifying complications?
– If you don’t look, your figures will look good…
• Differing complexity of therapy? – Some endoscopists do advanced therapy, others do not
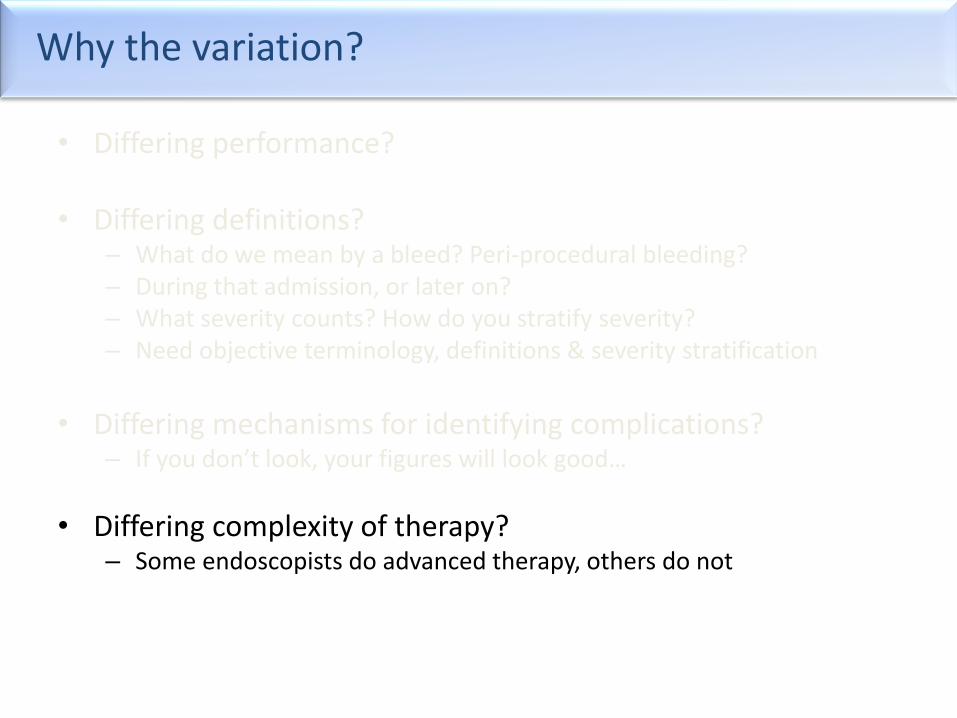
Why the variation?
• Differing performance?
• Differing definitions? – What do we mean by a bleed? Peri-procedural bleeding? – During that admission, or later on? – What severity counts? How do you stratify severity? – Need objective terminology, definitions & severity stratification
• Differing mechanisms for identifying complications?
– If you don’t look, your figures will look good…
• Differing complexity of therapy? – Some endoscopists do advanced therapy, others do not
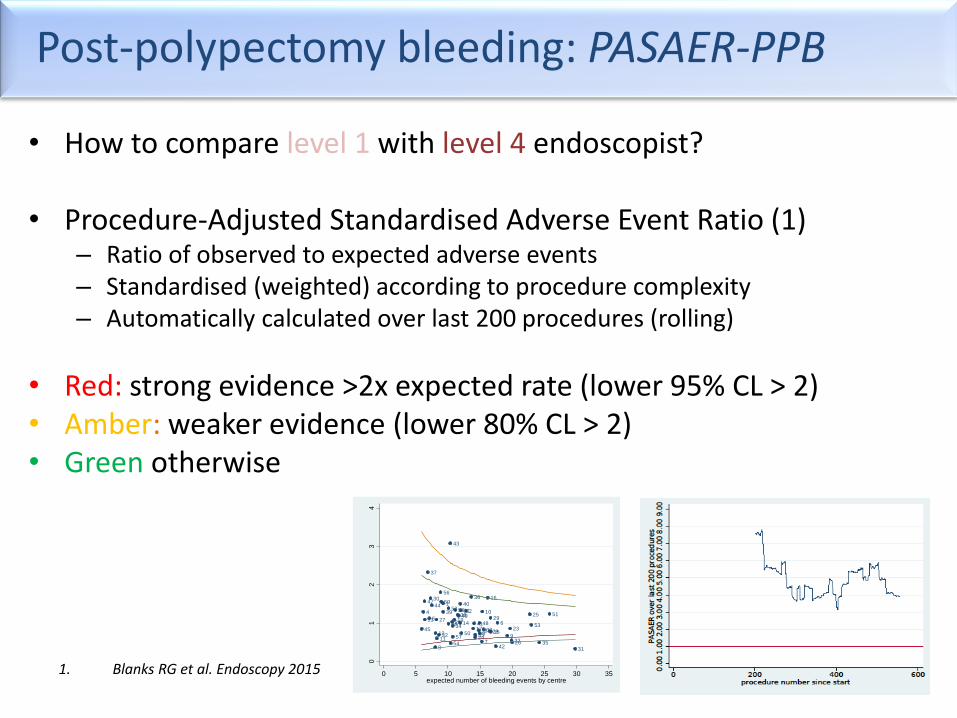
Post-polypectomy bleeding: PASAER-PPB
• How to compare level 1 with level 4 endoscopist?
• Procedure-Adjusted Standardised Adverse Event Ratio (1) – Ratio of observed to expected adverse events – Standardised (weighted) according to procedure complexity – Automatically calculated over last 200 procedures (rolling)
• Red: strong evidence >2x expected rate (lower 95% CL > 2) • Amber: weaker evidence (lower 80% CL > 2) • Green otherwise
1. Blanks RG et al. Endoscopy 2015
1
2
3
4
56
78
9
10
1112
1314
15
16
1718
19
20
21
22
23
24
25
2627
28
29
30
31
3233
34
35
36
37
3839
40
41
42
43
44
4546
47
48
49
50
5152
53
54
55
56
57
58
59
01
23
4
PA
SA
ER
0 5 10 15 20 25 30 35expected number of bleeding events by centre
How to monitor performance for rare events
• Need to ensure figures reflect performance, rather than confounders
• Often better suited to qualitative review – look at each case

The practicalities
Principles
• Standardised & objective KPIs
• Ideally centralised – benchmarking very powerful
• Ethos = open & supportive
– Share with key people – endoscopist & QA team
– Clear processes for what to do when figures are low

Does QA work?
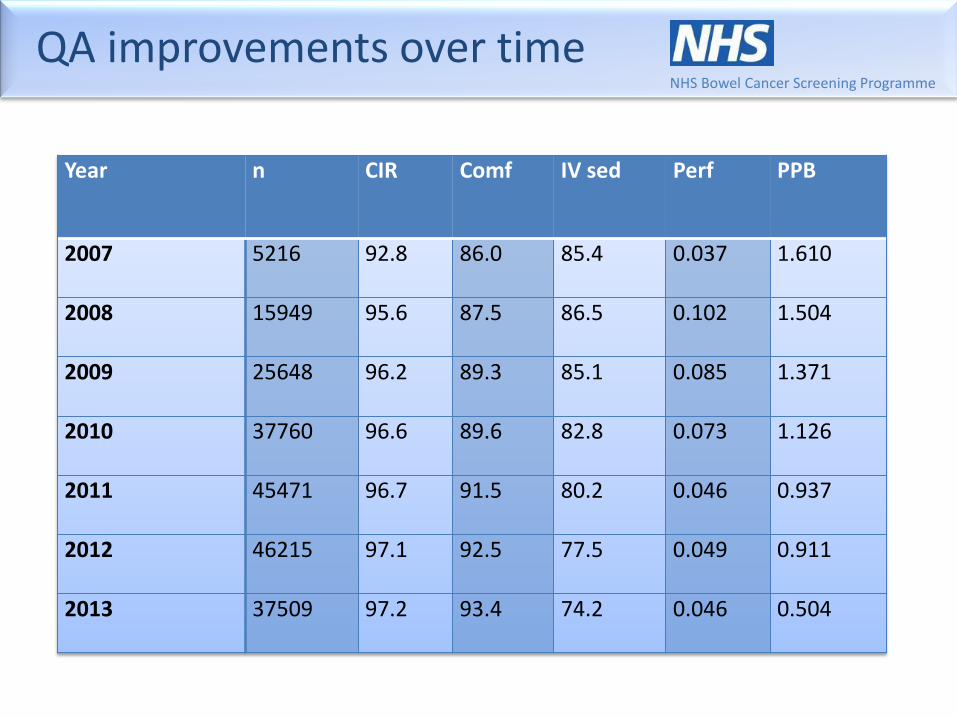
QA improvements over time NHS Bowel Cancer Screening Programme
Year n CIR Comf IV sed Perf PPB
2007 5216 92.8 86.0 85.4 0.037 1.610
2008 15949 95.6 87.5 86.5 0.102 1.504
2009 25648 96.2 89.3 85.1 0.085 1.371
2010 37760 96.6 89.6 82.8 0.073 1.126
2011 45471 96.7 91.5 80.2 0.046 0.937
2012 46215 97.1 92.5 77.5 0.049 0.911
2013 37509 97.2 93.4 74.2 0.046 0.504
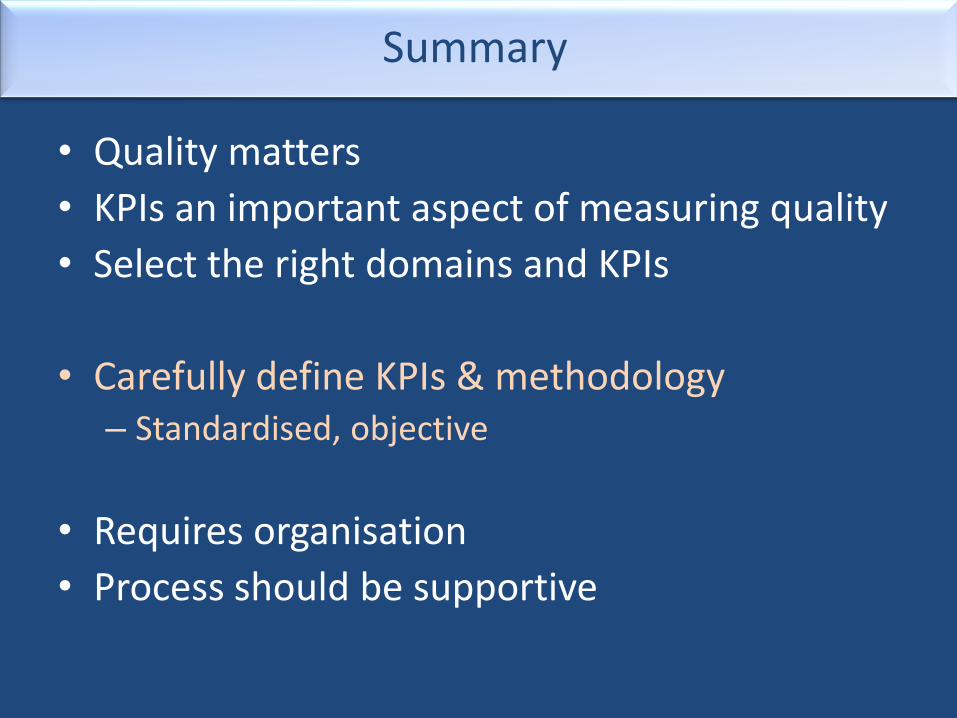
Summary
• Quality matters
• KPIs an important aspect of measuring quality
• Select the right domains and KPIs
• Carefully define KPIs & methodology – Standardised, objective
• Requires organisation
• Process should be supportive

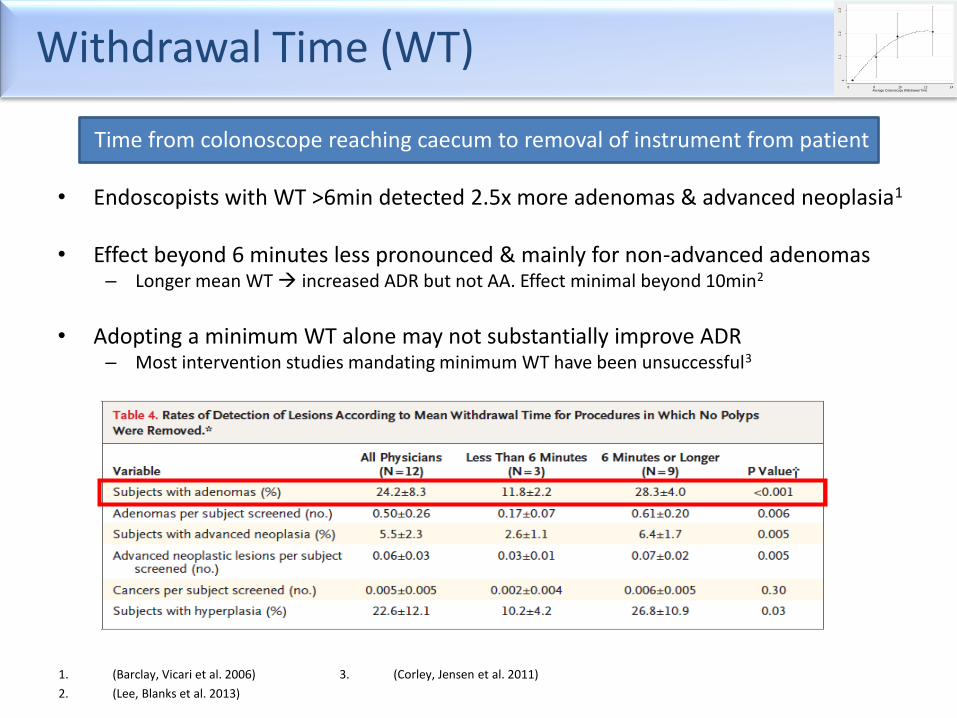
Withdrawal Time (WT)
Time from colonoscope reaching caecum to removal of instrument from patient
• Endoscopists with WT >6min detected 2.5x more adenomas & advanced neoplasia1
• Effect beyond 6 minutes less pronounced & mainly for non-advanced adenomas
– Longer mean WT increased ADR but not AA. Effect minimal beyond 10min2
• Adopting a minimum WT alone may not substantially improve ADR
– Most intervention studies mandating minimum WT have been unsuccessful3
1. (Barclay, Vicari et al. 2006)
2. (Lee, Blanks et al. 2013)
3. (Corley, Jensen et al. 2011)
11.1
1.2
1.3
Od
ds R
atio fo
r d
ete
ctin
g a
den
om
a a
bo
ve b
ase le
vel
6 8 10 12 14Average Colonoscopy Withdrawal Time
Patient Satisfaction
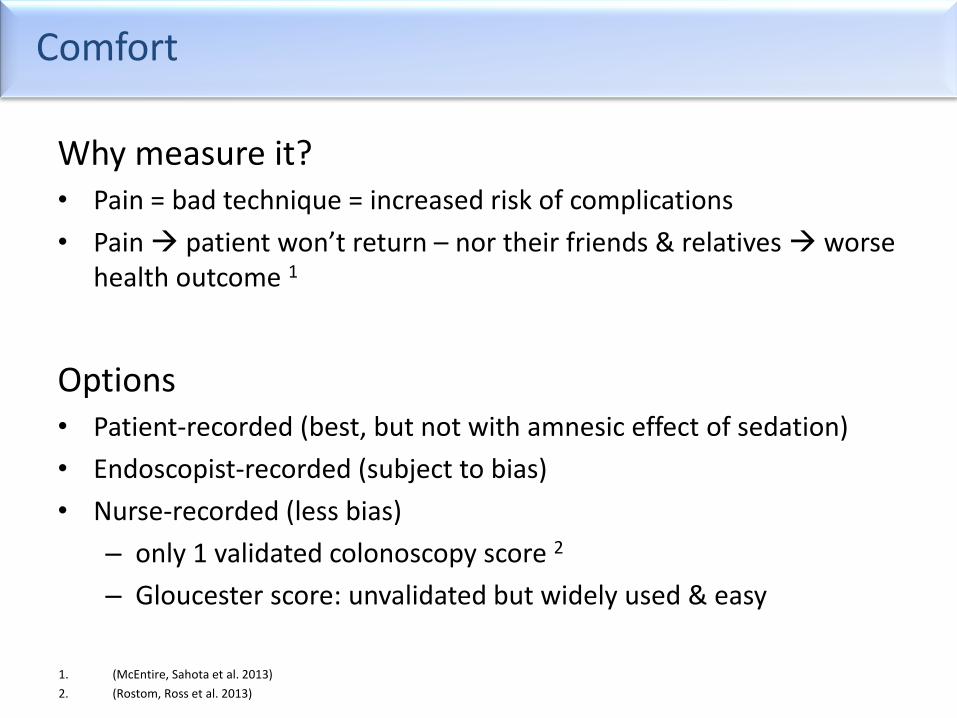
Comfort
Why measure it? • Pain = bad technique = increased risk of complications
• Pain patient won’t return – nor their friends & relatives worse health outcome 1
Options • Patient-recorded (best, but not with amnesic effect of sedation)
• Endoscopist-recorded (subject to bias)
• Nurse-recorded (less bias)
– only 1 validated colonoscopy score 2
– Gloucester score: unvalidated but widely used & easy
1. (McEntire, Sahota et al. 2013)
2. (Rostom, Ross et al. 2013)
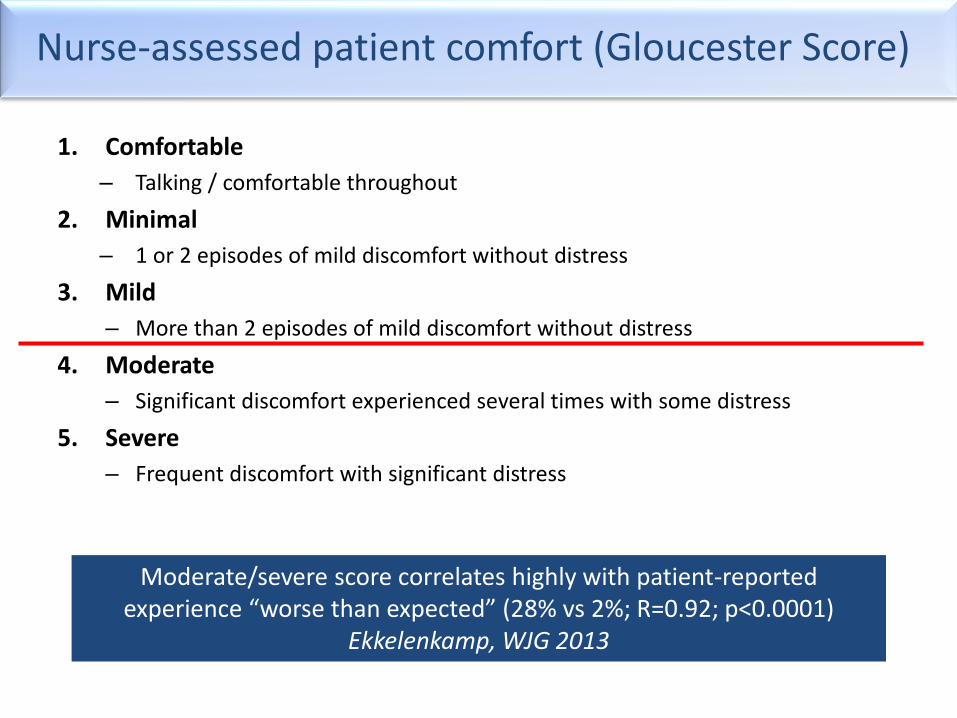
Nurse-assessed patient comfort (Gloucester Score)
1. Comfortable
– Talking / comfortable throughout
2. Minimal
– 1 or 2 episodes of mild discomfort without distress
3. Mild
– More than 2 episodes of mild discomfort without distress
4. Moderate
– Significant discomfort experienced several times with some distress
5. Severe
– Frequent discomfort with significant distress
Moderate/severe score correlates highly with patient-reported
experience “worse than expected” (28% vs 2%; R=0.92; p<0.0001) Ekkelenkamp, WJG 2013

Quantity, not Quality?
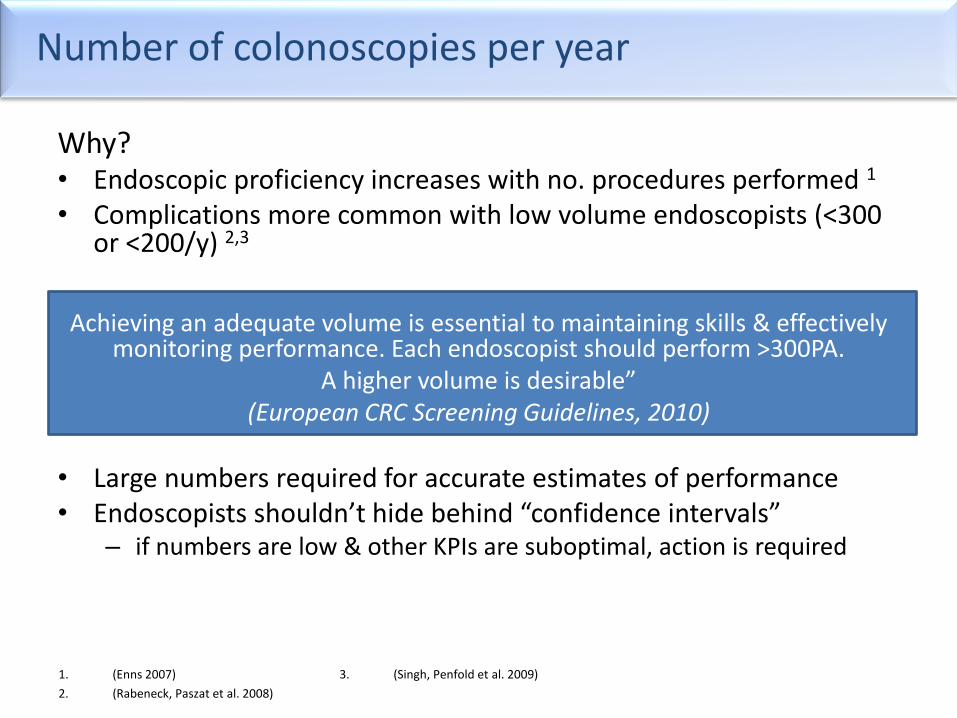
Number of colonoscopies per year
Why? • Endoscopic proficiency increases with no. procedures performed 1 • Complications more common with low volume endoscopists (<300
or <200/y) 2,3
Achieving an adequate volume is essential to maintaining skills & effectively monitoring performance. Each endoscopist should perform >300PA.
A higher volume is desirable” (European CRC Screening Guidelines, 2010)
• Large numbers required for accurate estimates of performance • Endoscopists shouldn’t hide behind “confidence intervals”
– if numbers are low & other KPIs are suboptimal, action is required
1. (Enns 2007)
2. (Rabeneck, Paszat et al. 2008)
3. (Singh, Penfold et al. 2009)

English NHS colonoscopy
10 years ago
CIR 77% more objective – 57%
Bowles, Gut 2004
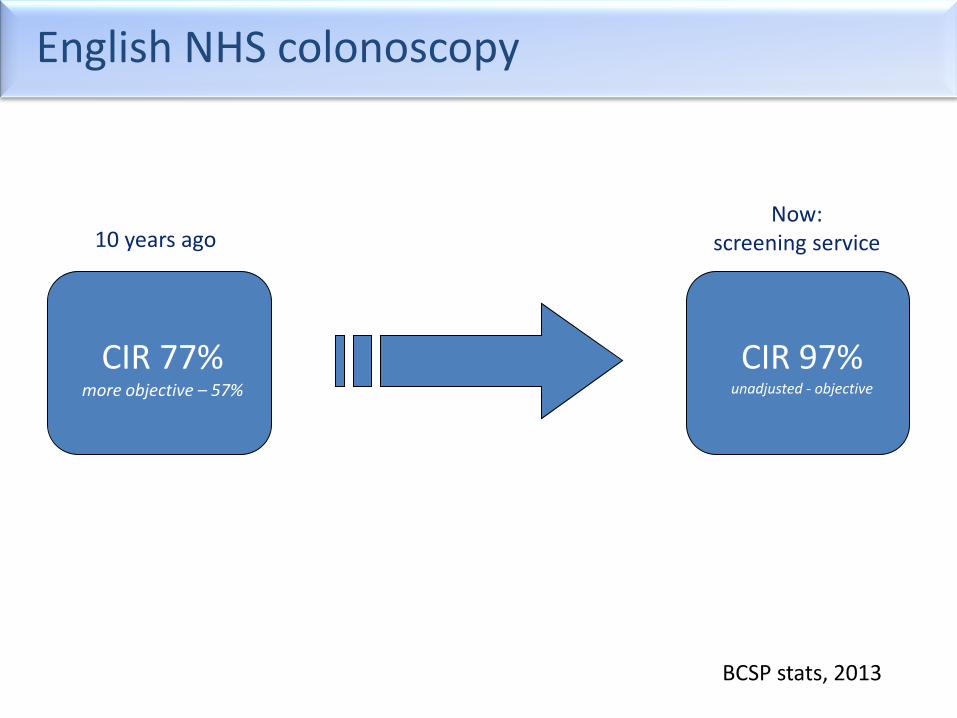
English NHS colonoscopy
CIR 77% more objective – 57%
CIR 97% unadjusted - objective
10 years ago Now:
screening service
BCSP stats, 2013

Screening Quality Assurance
• 58 screening centres
• Must be JAG-accredited
• Dataset web-entered during procedure by screening nurse onto single national database
• Open QA data
• Updated daily
• National benchmark
• Regional QA leads oversee
NHS Bowel Cancer Screening Programme
Notes
• ESGE QIC work • Why use KPIs (quality ethos etc – ESGE paper) • Make sure I use QM or KPI throughout • Give some examples of QS – e.g. 95% for CIR • What are the issues/down-sides – inc gaming, time, cost, missing the point • How to monitor (ESGE paper – centralise etc) • What can be done if KPIs suboptimal • Cover fact that ADRs can rarely be compared due to different populations (PCCRC rate irony?) • • The proposed title of your talk is “Quality indicators in colonoscopy” in Session 4: Screening
programs and guidelines which is currently scheduled to start at 4.40 pm. The talk should be 10 minutes in length. A preliminary program is attached, please note that this is not finalized, we hope to complete and circulate it to the membership within ten days.
• The audience is international and very well informed, so speakers should directly address key issues with the group.
• Should you have any questions or comments about the proposal please feel free to get in touch directly with Professor Kuipers, email: [email protected] or the secretariat.
• After the talks, all speakers of the respective session are asked to take a seat at the chairman’s table on the stage. The session will end with discussion and speakers are encouraged to respond to questions from the audience.
Name of presenter
Accurate Identification of Pathology
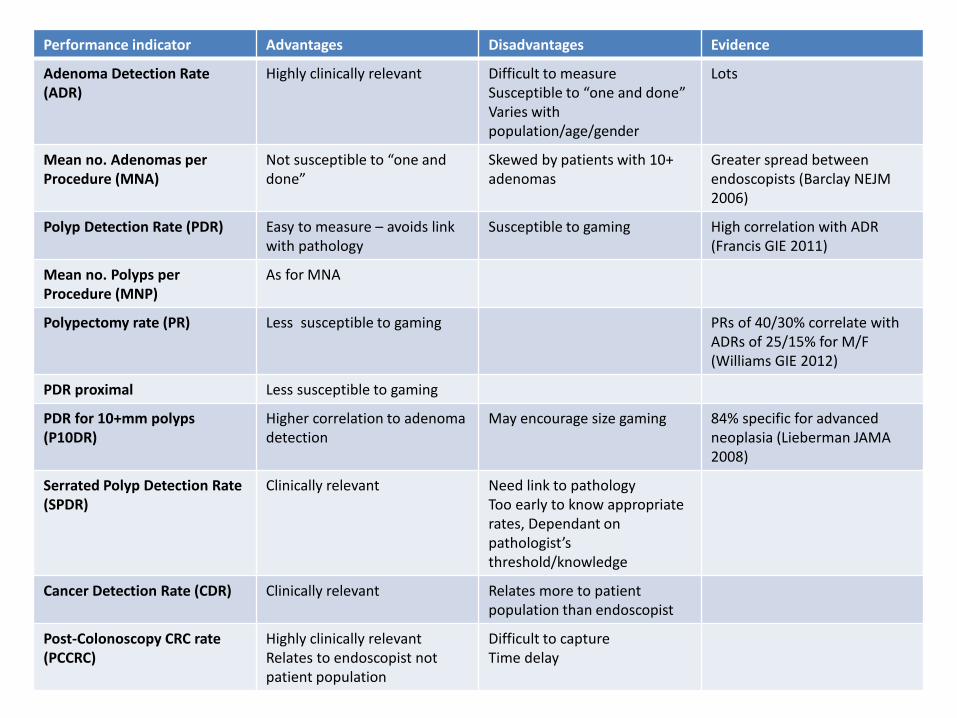
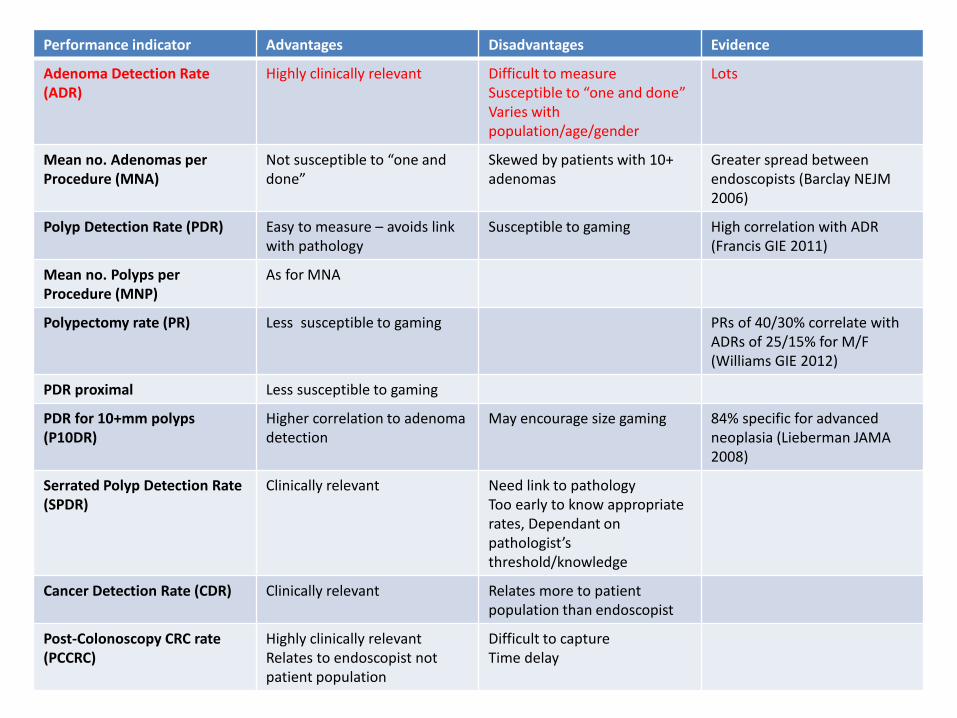
Performance indicator Advantages Disadvantages Evidence
Adenoma Detection Rate (ADR)
Highly clinically relevant Difficult to measure Susceptible to “one and done” Varies with population/age/gender
Lots
Mean no. Adenomas per Procedure (MNA)
Not susceptible to “one and done”
Skewed by patients with 10+ adenomas
Greater spread between endoscopists (Barclay NEJM 2006)
Polyp Detection Rate (PDR) Easy to measure – avoids link with pathology
Susceptible to gaming High correlation with ADR (Francis GIE 2011)
Mean no. Polyps per Procedure (MNP)
As for MNA
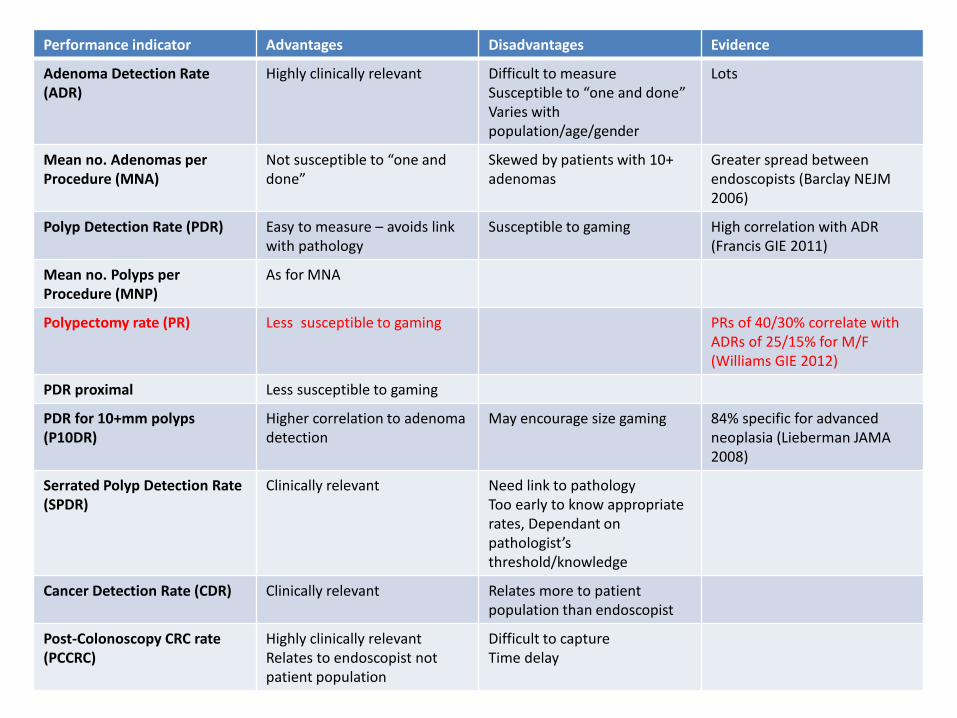
Polypectomy rate (PR)
Less susceptible to gaming
PRs of 40/30% correlate with ADRs of 25/15% for M/F (Williams GIE 2012)
PDR proximal Less susceptible to gaming
PDR for 10+mm polyps (P10DR)
Higher correlation to adenoma detection
May encourage size gaming 84% specific for advanced neoplasia (Lieberman JAMA 2008)
Serrated Polyp Detection Rate (SPDR)
Clinically relevant Need link to pathology Too early to know appropriate rates, Dependant on pathologist’s threshold/knowledge
Cancer Detection Rate (CDR) Clinically relevant
Relates more to patient population than endoscopist
Post-Colonoscopy CRC rate (PCCRC)
Highly clinically relevant Relates to endoscopist not patient population
Difficult to capture Time delay
Performance indicator Advantages Disadvantages Evidence
Adenoma Detection Rate (ADR)
Highly clinically relevant Difficult to measure Susceptible to “one and done” Varies with population/age/gender
Lots
Mean no. Adenomas per Procedure (MNA)
Not susceptible to “one and done”
Skewed by patients with 10+ adenomas
Greater spread between endoscopists (Barclay NEJM 2006)
Polyp Detection Rate (PDR) Easy to measure – avoids link with pathology
Susceptible to gaming High correlation with ADR (Francis GIE 2011)
Mean no. Polyps per Procedure (MNP)
As for MNA
Polypectomy rate (PR)
Less susceptible to gaming
PRs of 40/30% correlate with ADRs of 25/15% for M/F (Williams GIE 2012)
PDR proximal Less susceptible to gaming
PDR for 10+mm polyps (P10DR)
Higher correlation to adenoma detection
May encourage size gaming 84% specific for advanced neoplasia (Lieberman JAMA 2008)
Serrated Polyp Detection Rate (SPDR)
Clinically relevant Need link to pathology Too early to know appropriate rates, Dependant on pathologist’s threshold/knowledge
Cancer Detection Rate (CDR) Clinically relevant
Relates more to patient population than endoscopist
Post-Colonoscopy CRC rate (PCCRC)
Highly clinically relevant Relates to endoscopist not patient population
Difficult to capture Time delay

How do you know the quality of a service?

You don’t, unless you measure it