Embed Size (px)
DESCRIPTION
Quality Control Assurance and Reliability Projectss
Citation preview

QUALITY CIRCLE ASSIGNMENT
How to Improve Quality of Teaching In Mechanical Engineering
Department
Prepared by
Shanker R 2011A4PS322P
Divyanshu Jain 2011A4PS238P
Abhiram Patankar 2011B3A4493P
ME F443: Quality Control Assurance and Reliability

INTRODUCTION
Quality Circle is a voluntary, informal group of people who work on similar tasks or share an area of responsibility and try to improve the quality of work life & environment. These are related especially to the quality of output or services in order to improve the performance of the organization / department and motivate and enrich the work of employees. This group carries on continuously as a part of organization-wide control activities, self and mutual developments and control and improvement within the workplace utilizing quality control techniques with all the members participating. Generally six to twelve volunteers from the same work area make up a circle. The members receive training in problem solving, statistical quality control and group processes. Quality Circle generally recommends solutions for quality and services which may be implemented by the management. Thus Quality Circle is not merely a suggestion system or a quality control group but extends beyond that because its activities are more comprehensive.
HISTORY OF QUALITY CIRCLES
Quality circles were thus conceived in Japan by 1961 under the leadership of Dr. Kaoru Ishikawa, then an engineering Professor in Japanese prestigious Tokyo University. Dr. Ishikawa was earlier concentrating on “Book Reading Circles” helping the workers to get theoretical knowledge about quality control. He under the sponsorship of the Japanese Union of Scientists and Engineers (JUSE) structured the theories of behavioral scientists such as Maslow, Herzberg, Mc.Greger, to the quality science introduced by Dr. Deming and Dr. Juran. Thus the first quality circle was registered with JUSE during May 1962. By June, 1962, there were three circles registered with the JUSE. That of August 1969 there were 24,000
quality circles registered with the membership of 2,80,000 and the number was increasing by 700 to 1000 each month, By mid-1972, the Japanese
estimated that the total quality circles had reached 5,00,000 with a membership of about 5 million.
It has been seen now that the concept of quality control circles was evolved and adopted in Japan as a result of compulsion of circumstances prevailing at the time. Much of the success of the Japanese industry today can be ascribed to their adopting of the quality circle concept in a big way through the efforts of the JUSE. To quote one single instance of the miraculous story of the Japanese industry, in 1960, Japan was unable to sell a single car abroad, but by 1974, they were exporting 2.5 million cars a year and by 1979 that figure had doubled.
Simultaneously, awareness of the impact of quality circles in improving the total performance of any organization has been growing in the rest of the world too. Countries which are close to Japan like Taiwan and Korea were the first to follow the Japanese example in practicing this philosophy and reaping rich benefits. Quality circles soon spread in many other countries such as Norway, Sweden, Brazil, Canada, France, U.K., Singapore, Korea, Taiwan, Malaysia, Argentina and Holland. Of late, a number of countries the world over were showing keen interest in this philosophy, and it was seen that there was a participation of delegates from USSR and China at the International Convention on Quality Control Circles in Tokyo, 1985.
QUALITY CIRCLES IN INDIA
Quality circle activity was brought to India by the Bharat Heavy Electricals Ltd. (BHEL) - Ramachandrapuram unit in Hyderabad. QC was

started in its plant with five circles, in 1981. Now, this movement in BHEL has grown to 1,629 circles as of 30 June 1990, spread over its plants at Bhopal, Hyderabad, Hardwar, Tiruchi, and Bangalore. It is estimated that about 370 companies, almost equally divided between public and private enterprises, are practicing QC movement.
Presently, at national level quality circles in India have gradually spread to
chemical, pharmaceutical and other 74 processing plants including even the more traditional jute and textile industries. Typical examples of companies are BASF, Hindustan Antibiotics, Durgapur Steel Plant, Crompton Greaves, JK Jute Mills, National Textile Corporation, Shriram Fibers, etc. There are several other companies successfully operating QCs in India both in the public and private sectors. Air India, Indian airlines, Apollo Hospitals in Chennai, State Road Transport Corporations of Andhra Pradesh and Kerala, South Eastern Railways, Bank of Baroda, State Bank of India, etc. are some of the service sector organizations joining the fraternity of quality circles implementing organizations in India. Quality Circles in India have also been reported from certain families and rural area projects.
Growth of quality circle in India

Quality Circle Forum of India (QCFI) is recognized as the institution representing The Quality Circle Movement in India and has represented the country in several international forums. On 31st December 1982 the Quality Circle Forum of India was registered as a non-profit and non-political organization. The organization has successfully implemented Quality concepts under the TQM umbrella across several industry verticals that have experienced a phenomenal enhancement of their work processes and productivity after implementation of Quality concept tools.
IMPROVING THE QUALITY OF EDUCATION IN MECHANICAL DEPARTMENT
Our basic approach for addressing the issue at hand involved the following steps.
1. Defining a set of parameters for defining the quality of education in the mechanical engineering department in BITS Pilani
2. Identifying a set of problems associated3. Classification of selected problems4. Selection of a few important problems
5. Defining and analyzing the selected problems (Using fishbone diagrams and Pareto charts)
6. Proposing solutions to the selected problems
STRUCTURE OF THE TEAM
The structure of a quality circle can be divided into four classes
1. Executive CommitteeIt consists of members from the top management who are involved with the top level decision making body of the organization.
2. FacilitatorFacilitator acts as the mediator between the quality circle members and the top management. The facilitator takes direction from the executive committee and co-ordinates the activities of the circle meetings.
3. Leader4. Members
For implementing the quality circle in BITS Pilani, the executive committee could include the administrative authorities of BITS. The role of facilitator could be played by one of the faculties in the Mechanical Engineering Department. The members of the quality circle are the students in the department and one of them is selected by the group as the leader.
PARAMETERS FOR QUALITY OF TEACHING
The following parameters were considered for defining the quality of education in the department.
1. Student-faculty interactionThis is a measure of how good the communication is between the students and the faculty members
2. Qualification and experience of faculty3. Curriculum design
This evaluates how up to date and relevant the curriculum is with respect to the current scenario
4. Evaluation process

This is a measure of how good the evaluation system is in the department. This includes factors like uniformity of components, focus on understanding etc.
5. Practical componentThis is a measure of the emphasis given on practical application of the theoretical knowledge gained in the subjects. This includes lab components, workshop projects etc.
6. Quality of researchThis is defined by the standard of research activities, number of publications, patents etc.
7. InfrastructureThis includes the condition of labs, workshop and the quality of the equipment present
8. Industrial exposureThis involves the amount of industrial exposure received by the students. It can be measured by industrial visits, internship opportunities, and industrial projects being carried out by students
9. Research exposureThis includes the knowledge and involvement of the students in the research activities being carried out in the department.
10. Flexibility to studentsThe flexibility given to the students to pursue their interests
IDENTIFICATION OF PROBLEMS
After identifying the parameters which define the quality of education, the next step was to evaluate the department based on these parameters and identify some of the problems associated with it. The members of the quality circle had a brainstorming session regarding this and identified a list of ten problems. They are as follows.

i. Out of date labs and workshopii. Lack of industrial exposure apart from PS programiii. Non-visibility of research in the departmentiv. Minimal publications by studentsv. Old curriculum, new avenues of research missed outvi. Non-uniformity in evaluation components
vii. Less practical components, lack of good project workviii. Clash in important electives, many electives are not offered
ix. Poor implementation of feedback by institute and studentsx. Communication gap between students and faculty
The next step involved the classification of these problems, selecting a few important ones to address and detailed analysis of the selected problems.
STRATIFICATION OF IDENTIFIED PROBLEMS
We classified the selected problems into three sections based on who should be responsible for analyzing them and implementing the solutions. The three sections are as follows.
Solution lies with students: Some of the problems can be identified and addressed by the
students and can be solved with the help of some good initiative from their part. Some of the problems which fall into this category are Research visibility, Good publications, Project work, Communication gap with faculty and proper use of feedback system to address their concerns.
Solution lies with department: Solution of some of the problems lies in the hands of the
Mechanical Engineering department. Examples are problems with
Industrial exposure, Research visibility, Good publications, Old curriculum, Evaluation uniformity, Practical components, Clash in electives and offering electives.
Solution lies with management: Some problems need the attention of the top management. They
are out of date infrastructure, Clash in electives, Poor implementation of feedback etc.
SELECTION OF PROBLEMS
Our next step involved selecting a few out of all the listed problems. We took feedback from other students in the department regarding which set of problems they found important to be addressed and analyzed in detail. We then used their feedback to shorten the list of problems. Then the quality circle members had a voting session to decide on the final set of problems. We selected a total of four problems to be analyzed. The selected problems are
1. Lack of industrial exposure
2. Non-visibility of research in the department
3. Old curriculum
4. Clash in electives, many electives not offered
DEFINING THE PROBLEMS
The selected problems were then defined in a few statements so that the efforts to solve these problems can be channeled in the right direction.
Problem 1:

Students lack in industrial exposure which leads to unawareness of modern techniques used in industry and the working of professional organizations.
Problem 2:
Research work by the department faculty is largely not visible to the students and this has a negative effect on the choices available to the students as well as motivation.
Problem 3:
Curriculum design is based on age old concepts and practices and lacks a modern flavor of current technologies.
Problem 4:
Many of the electives are not offered and those which are offered are not available to the students due to clashes in the timetable.
PROBLEM 1: INDUSTRIAL EXPOSURE
Lack of industrial exposure was an important problem identified through the selection procedure. Students apart from the PS program do not get the opportunity for much industrial experience. There are minimal to zero industrial visits organized by the department which is a major cause for practical unawareness amongst the students.
Causes:
Four stakeholders were identified-
1. Students1.1 Lack of Initiative: There is a lack of initiative from the students’ side. Students do not come up with ideas for increasing the practical component in the learning procedure.

1.2 Lack of Interest: There is a lack of interest for these activities amongst the students. Students are mostly busy in other extra-curricular activities which leaves no time to focus on practical learning in the core subjects.
2. Faculty2.1 High Workload: Teachers are caught up in administrative or other workload from the department which leaves no time to focus on such components in their curriculum.2.2 Less Industrial Tie-ups: Faculty has minimal contact with people in industries and hence are unable to proceed with such initiatives even if they are willing to do so.2.3 Focus on Theory: Teachers emphasize more on theoretical aspects of the subject in the courses rather than developing a practical understanding.
3. Mechanical Engineering AssociationMechanical Engineering Association has not been very involved or interested in organizing industrial activities for the students. There is a lack of initiative on one hand and a lack of funds on the other. There are limited options when it comes to budget allocation for the association.
4. Head of the Department4.1 Administrative Workload4.2 Communication Gap
Cause and Effect Diagram:

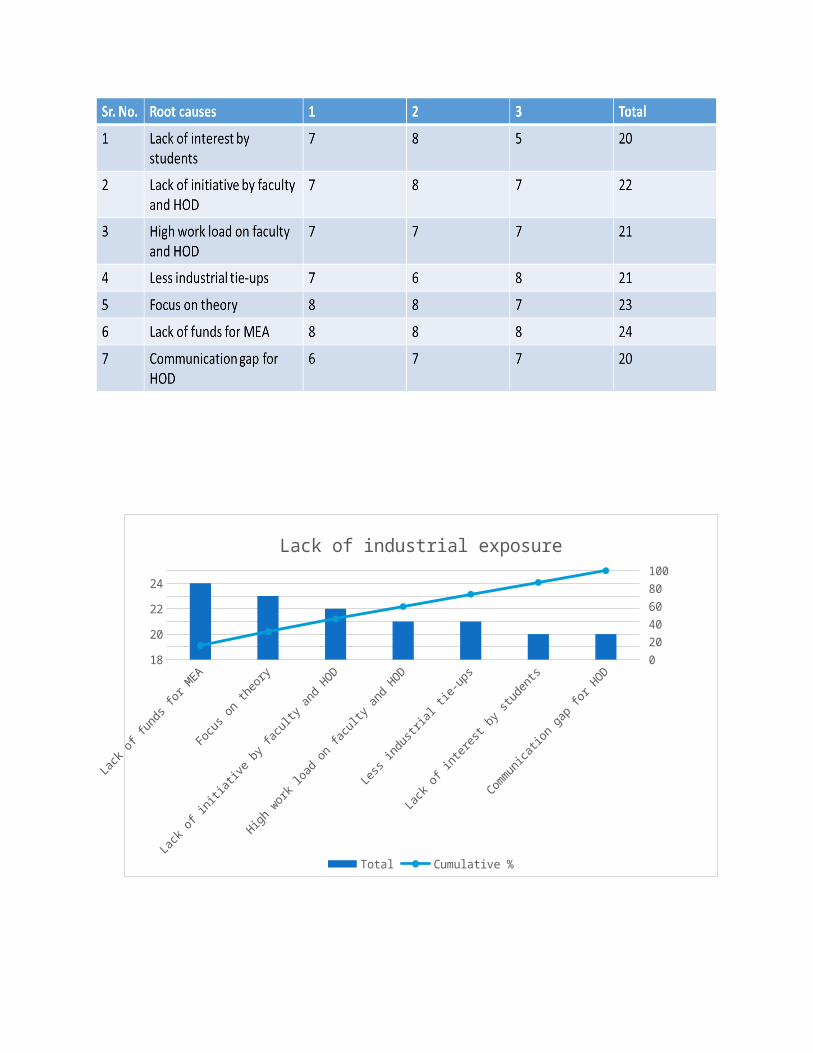
Pareto Chart:
Each member of the Quality Circle rated each cause out of 10. These ratings were used to generate a Pareto chart for each problem.

Lack
of fu
nds f
or M
EA
Focu
s on t
heor
y
Lack
of in
itiati
ve by
facu
lty an
d HOD
High wor
k loa
d on fa
culty
and H
OD
Less
industr
ial ti
e-ups
Lack
of in
teres
t by s
tuden
ts
Commun
icatio
n gap fo
r HOD
18
20
22
24
020406080100
Lack of industrial exposure
Total Cumulative %
The Pareto chart helps to identify the key cause(s) regarding a particular problem. In this case lack of funds for MEA is identified as the most important cause.
Proposed Solutions:
• Mechanical Engineering Association can play an important role.
• A fixed amount of fund should be allocated to MEA every year to organize industrial visits in power-plants, steel plants etc.
• Industrial case studies should be made part of the evaluation components by the faculty to motivate students.
• A faculty should be made in-charge of industrial tie-ups to facilitate learning for the students.

PROBLEM 2: RESEARCH VISIBILITY
Research visibility is a major issue at hand. Students are not aware of the research work being done by the faculty or the research centers in the department. Students working on their own research are also working on their own without any coordination with other students who might be pursuing some related field.
Causes:
Three stakeholders were identified-
1. Students1.1 Communication Gap: There is a communication gap between the students and the faculty. Students do not approach the faculty with their queries and doubts or research proposals.1.2 Extra-curricular Focus: Students focus more on their club, department or association activities which leads to a lack of interest in academic research activities.
2. Faculty2.1 Non-Maintenance of Faculty Homepage: The faculty homepage at the BITS website is outdated and recent research activities of the faculty are not put up on the page. This makes it difficult for the student to gauge which faculty to contact.2.2 Selection Procedure for Projects: Faculty does not select the students for project work, rather whichever student approaches the faculty gets an SOP under the teacher. This results in early filling of the slots available under many teachers.
3. Research Centers3.1 Non-Transparent Functioning: Most of the students are unaware of the research centers in BITS such as CRIS, CREED etc. The
working procedure of these centers is unknown and the functioning is largely non-transparent.3.2 Lack of Public Website: There is no website of these centers where students can go and check out the latest projects and activities going on in these centers.
Cause and Effect Diagram:
Pareto Chart:
Each member of the Quality the circle rated each cause out of 10. These ratings were used to generate a Pareto chart for each problem.

05
10152025
020406080100
Non-visisbility of Research
Total Cumulative %

Pareto chart helped us to identify that communication gap and the functioning of the research centers are the two main causes to the problem.
Proposed Solutions:
• Research centers should increase their visibility by opening public websites.
• Proper recruitment process should be established for these research centers by the faculty in-charge.
• Faculty in the mechanical department should take presentations explaining their research area and current requirements.
PROBLEM 3: OLD CURRICULUM
One of the major problems identified regarding the department is its old curriculum. The curriculum is more focused towards theory and not the practical applications, and in many courses the curriculum (and the issued textbooks) is outdated and lacks practical application of the old theory in today’s industries.
Causes:
Four stakeholders were identified-

1. Students1.1 Lack of Experience: Students often have no knowledge regarding how outdated the curriculum is or if the course includes application of theory in modern industries. Students also may not be aware of the new innovations taking place in the industry that may not be a part of the curriculum.1.2 Lack of Feedback: Students fail to communicate with the faculty regarding the changes required (if identified) in the curriculum.
2. Senate The senate finalizes the change in curriculum for any course. The lack of student representation in the senate leads to the unawareness of students regarding the procedure to change curriculums.
3. Faculty3.1 High Workload & Focus on Research: Often a faculty has to teach multiple subjects and also carry out project work leading to high work load. This may hinder the faculty from updating the curriculum regularly.3.2 Less Industrial Interaction: The faculty may have less industrial interactions and thus end up making the curriculum theoretical rather than practical.
4. Head of Department4.1: Administrative Workload4.2 Communication Gap: There is a communication gap between the students and the HOD due lack of regular interaction. This reduces the feedback the faculty members get from the student regarding the curriculum.
Cause and Effect Diagram:

Pareto Chart:
Each member of the Quality Circle rated each cause out of 10. These ratings were used to generate a Pareto chart for each problem.

Lack
of fe
edba
ck sy
stem in
senate
Admini
strati
ve w
orklo
ad on
HOD
Commun
icatio
n gap
Lack
of fe
edba
ck fr
om st
uden
ts
Resist
ance
to ch
ange i
n sen
ate
Lack
of ex
perien
ce of
stud
ents
Focu
s on p
erso
nal r
esea
rch b
y fac
ulty
Lack
of aw
aren
ess b
y fac
ulty
0
5
10
15
20
25
30
0102030405060708090100
Old curriculum
Total Cumulative %
The Pareto chart helps to identify the key cause(s) regarding a particular problem. In this case lack of feedback system in the senate is identified as the most important cause.
Proposed Solutions:
• Senate has an important role to play in changing the curriculum.
• Student representation is inadequate which results in improper feedback. This should be rectified by engaging student representative from each department.
• A curriculum committee for the mechanical department should be set-up which will review the curriculum every year and suggest changes.

• The committee should comprise of faculty as well as student representation to reduce the communication gap.
PROBLEM 4: ELECTIVE CLASH AND UNAVAILABILITY
This is probably the major issue for every student at BITS. Most of the electives offered to the students often clash other electives or other CDCs (dual-degree). This largely reduces the amount of electives the students can choose from. Also many electives like aerodynamics are offered in IITs but are not offered at BITS.
Causes:
4 stakeholders were identified-
1. Students1.1 Lack of Experience: The students are often unaware regarding the problems faced during registration of electives (particularly for the 1st
time in 3rd year).1.2 Lack of Communication: Students fail to communicate the problems faced during the selection of electives to the faculty or ID.
2. Faculty2.1 High Workload2.2 lack of inter-departmental interaction: There are clashes between electives offered by different departments due to lack of inter departmental interaction.2.3 Lack of Experts on Some Subjects: Some electives are not being offered due to lack of experts on subject. Lack of experts also leads to same faculty teaching multiple electives leading to further clashes.
3. ID3.1 Lack of feedback ID gets from faculty and students regarding clashes.3.2 Improper Communication Channel: ID is not able to communicate

to all the departments at the same time to help reduce the clashes in electives and resolve the issue.
4. ARCD4.1 Lack of coordination between ARCD and ID
Cause and Effect Diagram:
Pareto Chart:
Each member of the Quality the circle rated each cause out of 10. These ratings were used to generate a Pareto chart for each problem.

Inter
depar
tmen
tal cl
ashes
Impr
oper
communic
ation
chan
nel a
cros
s dep
artm
ents
Lack
of fe
edba
ck fo
r ID
Lack
of ex
perien
ce by
stud
ents
Lack
of ex
perts
on su
bjects
Commun
icatio
n gap
Lack
of co
-ordina
tion be
twee
n ARCD an
d ID
0
5
10
15
20
25
30
0102030405060708090100
Clash of important electives
Total cumulative %

Pareto chart helped us to identify that interdepartmental clashes and improper communication channel across departments are the two main causes to the problem.
Proposed Solutions:
• Instruction Division should set-up a proper communication channel across the departments to reduce inter-departmental clashes in timetable.
• Departmental electives should be made sure to not clash with each other by communicating with Instruction Division.
• New faculty recruitments should be made according to specializations in subjects which are not currently being offered to students.
CONCLUSION:
Quality circle meetings help in inculcating the values of team work and participative decision making. Some important problems were identified and were discussed with intense brainstorming sessions. Productive solutions were come up with and some of them can be implemented very shortly with support from the department and collaboration with students.
REFERENCES:
Mitra, Amitava. Fundamentals of quality control and improvement. John Wiley & Sons, 2012.
Gaikwad, Vishal V., and Anita V. Gaikwad. "Quality Circle as an Effective Management Tool: A Case Study of Indira College of

Engineering and Management Library." Proceeding of International Conference on Academic Libraries. 2009.
http://asq.org/learn-about-quality/cause-analysis-tools/overview/ pareto.html
http://www.mindtools.com/pages/article/newTMC_03.htm http://asq.org/learn-about-quality/cause-analysis-tools/overview/
fishbone.html http://www.qcfi.in/