Embed Size (px)
Citation preview
International Journal of Current Engineering and Technology E-ISSN 2277 – 4106, P-ISSN 2347 – 5161 ©2015 INPRESSCO®, All Rights Reserved Available at http://inpressco.com/category/ijcet
Case Study
61| International Journal of Current Engineering and Technology, Vol.5, No.1 (Feb 2015)
Quality Circle Implementation in Industry in India-A Case Study
Narender Kumar!* !Gateway Institute of Engineering and Technoloigy, Sonepat, Haryana, India Accepted 05 Jan 2015, Available online 01 Feb 2015, Vol.5, No.1 (Feb 2015)
Abstract Quality Circle is a team of employees of various relevant departments which emphasis on providing opportunities of reducing in house or customer complaints in Final Inspection Department through effective analysis of Final Inspection data which results in cost reduction through achieving zero defect or defect free manufacturing in all aspects of organization. The methodology gives platform and opportunity to individuals to identify scope of improvements which result in ease, effective and efficient work and work culture. There are several steps to implement quality circle methodology to achieve the desired results. Quality Tools such as Pareto chart, line and arrows diagrams are used for improvement in any organization in which Pareto Diagram is studied as a prime source to identify and selecting problem for improvement in any industry. Quality Circle Methodology can be applied to any industrial culture more than one time to a process until it reaches to its optimum capacity reduce quality cost in any of the industrial process.. The implementation of Quality Circle Methodology helps in achieving efficient production by analysis of data of various products and processes. It involves improvement in process through the process of finding route cause and implement corrective and preventive action to any process. It also improves the quality through reduction of PPM to certain level in a process and improves the quality standard through provide proper system to final inspection area which results achieving zero defect level in certain defects. Although this approach uses existing quality management system and problem solving tools, its application is to provide more thorough approach to improve work conditions, reducing or eliminate waste or non-value added work during any job change over or regular production.
Keywords: Quality Circle, PPM etc. 1. Introduction
1 Maintenance is undertaken to preserve the proper functioning of a physical system so that it will continue to do what it was designated to do. Its function and performance characteristics not only take account of output, unit cost and effectiveness of using energy, but also such factors as end product quality, process control, comfort enhancement and protection of the employed personnel, compliance with environment protection regulations, structural integrity and even physical appearance of the productive system. Maintenance is often wrongly regarded as a cost centre, since the costs are visible, while the benefits are difficult to estimate. (Gray, G. R. S. A. M., 1993)
2. Background to the Study (K. Ganapathy et al 1994, S K Dey et al 1997) 2.1 Definition Quality Circle is a small group of 6 to 12 employees doing similar work who voluntarily meet together on a *Corresponding author: Narender Kumar
regular basis to identify improvements in their respective work areas.
2.2 Philosophy
Quality Circle is a people – building philosophy, which provides self-motivation and improves work environment. It represents a philosophy of managing people specially those at the grass root level.
2.3 Concept
The concept of Quality Circle is primarily based upon recognition of value of the worker as a human being, as someone who willingly put efforts to improve the job, his wisdom, intelligence, experience, attitude and feelings.
2.4 Objective
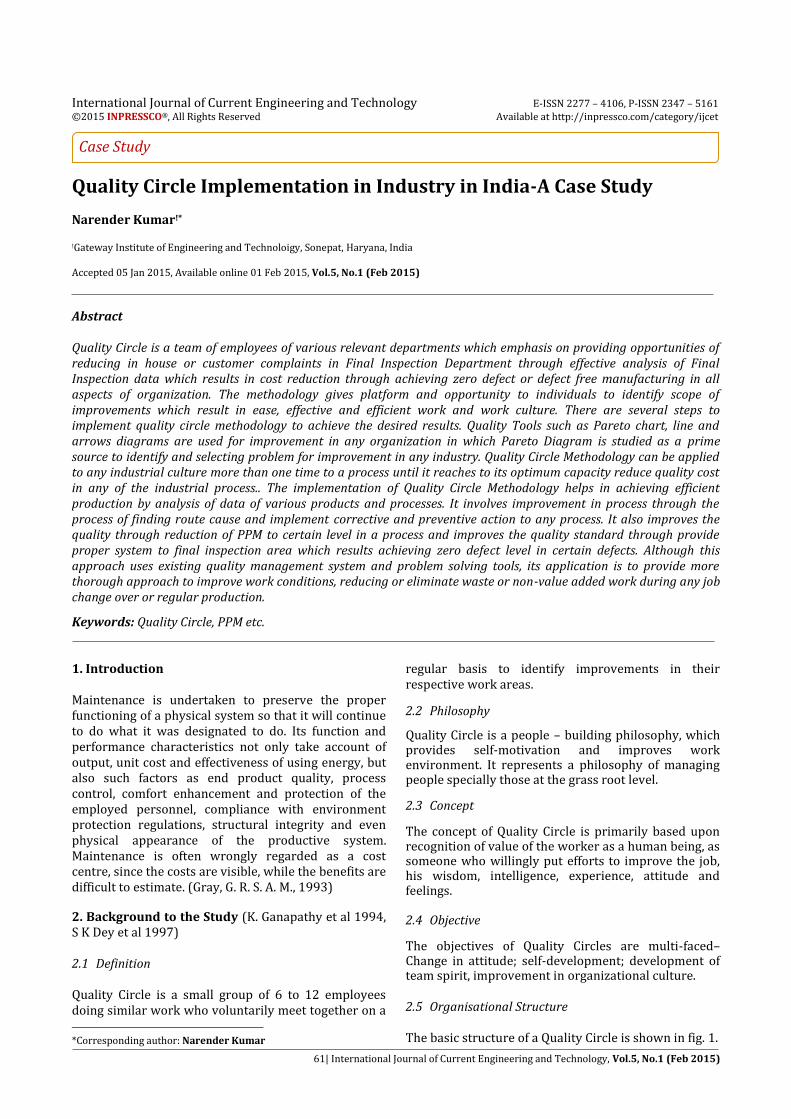
The objectives of Quality Circles are multi-faced– Change in attitude; self-development; development of team spirit, improvement in organizational culture. 2.5 Organisational Structure The basic structure of a Quality Circle is shown in fig. 1.
Narender Kumar Quality Circle Implementation in Industry in India-A Case Study
62| International Journal of Current Engineering and Technology, Vol.5, No.1 (Feb 2015)
Fig.1 Organisational Structure of a Quality Circle 2.6 Launching Quality Circles The launching of Quality Circles involves the following steps: Expose middle level executives to the concept.
Explain the concept to the employees and invite
them to volunteer as members of Quality Circles.
Nominate senior officers as facilitators.
Form a steering committee.
Arrange trainings
A meeting should be fixed preferably one hour a
week for the Quality Circle to meet.
Formally inaugurate the circle.
Arrange necessary facilities for the Quality Circle
meeting and its operation.
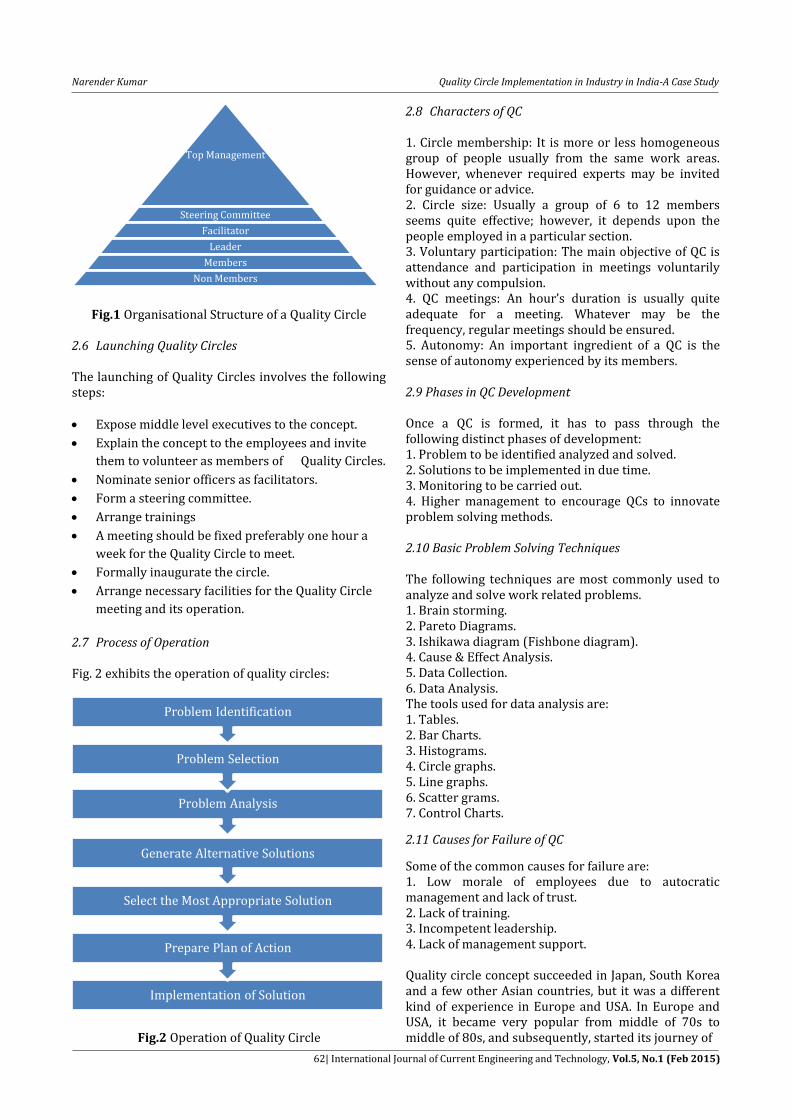
2.7 Process of Operation Fig. 2 exhibits the operation of quality circles:
Fig.2 Operation of Quality Circle
2.8 Characters of QC 1. Circle membership: It is more or less homogeneous group of people usually from the same work areas. However, whenever required experts may be invited for guidance or advice. 2. Circle size: Usually a group of 6 to 12 members seems quite effective; however, it depends upon the people employed in a particular section. 3. Voluntary participation: The main objective of QC is attendance and participation in meetings voluntarily without any compulsion. 4. QC meetings: An hour’s duration is usually quite adequate for a meeting. Whatever may be the frequency, regular meetings should be ensured. 5. Autonomy: An important ingredient of a QC is the sense of autonomy experienced by its members. 2.9 Phases in QC Development Once a QC is formed, it has to pass through the following distinct phases of development: 1. Problem to be identified analyzed and solved. 2. Solutions to be implemented in due time. 3. Monitoring to be carried out. 4. Higher management to encourage QCs to innovate problem solving methods. 2.10 Basic Problem Solving Techniques The following techniques are most commonly used to analyze and solve work related problems. 1. Brain storming. 2. Pareto Diagrams. 3. Ishikawa diagram (Fishbone diagram). 4. Cause & Effect Analysis. 5. Data Collection. 6. Data Analysis. The tools used for data analysis are: 1. Tables. 2. Bar Charts. 3. Histograms. 4. Circle graphs. 5. Line graphs. 6. Scatter grams. 7. Control Charts.
2.11 Causes for Failure of QC
Some of the common causes for failure are: 1. Low morale of employees due to autocratic management and lack of trust. 2. Lack of training. 3. Incompetent leadership. 4. Lack of management support. Quality circle concept succeeded in Japan, South Korea and a few other Asian countries, but it was a different kind of experience in Europe and USA. In Europe and USA, it became very popular from middle of 70s to middle of 80s, and subsequently, started its journey of
Top Management
Steering Committee
Facilitator
Leader
Members
Non Members
Implementation of Solution
Prepare Plan of Action
Select the Most Appropriate Solution
Generate Alternative Solutions
Problem Analysis
Problem Selection
Problem Identification
Narender Kumar Quality Circle Implementation in Industry in India-A Case Study
63| International Journal of Current Engineering and Technology, Vol.5, No.1 (Feb 2015)
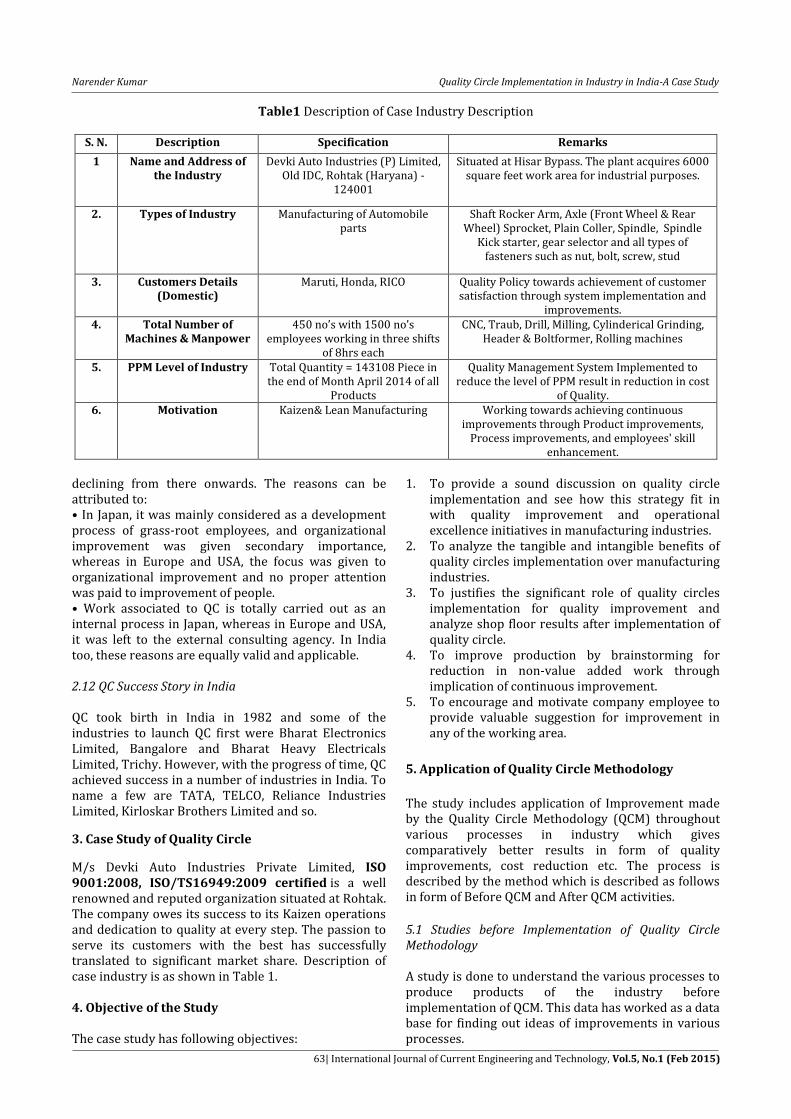
Table1 Description of Case Industry Description
S. N. Description Specification Remarks
1 Name and Address of the Industry
Devki Auto Industries (P) Limited, Old IDC, Rohtak (Haryana) -
124001
Situated at Hisar Bypass. The plant acquires 6000 square feet work area for industrial purposes.
2. Types of Industry Manufacturing of Automobile parts
Shaft Rocker Arm, Axle (Front Wheel & Rear Wheel) Sprocket, Plain Coller, Spindle, Spindle
Kick starter, gear selector and all types of fasteners such as nut, bolt, screw, stud
3. Customers Details (Domestic)
Maruti, Honda, RICO Quality Policy towards achievement of customer satisfaction through system implementation and
improvements. 4. Total Number of
Machines & Manpower 450 no’s with 1500 no’s
employees working in three shifts of 8hrs each
CNC, Traub, Drill, Milling, Cylinderical Grinding, Header & Boltformer, Rolling machines
5. PPM Level of Industry Total Quantity = 143108 Piece in the end of Month April 2014 of all
Products
Quality Management System Implemented to reduce the level of PPM result in reduction in cost
of Quality. 6. Motivation Kaizen& Lean Manufacturing Working towards achieving continuous
improvements through Product improvements, Process improvements, and employees' skill
enhancement.
declining from there onwards. The reasons can be attributed to: • In Japan, it was mainly considered as a development process of grass-root employees, and organizational improvement was given secondary importance, whereas in Europe and USA, the focus was given to organizational improvement and no proper attention was paid to improvement of people. • Work associated to QC is totally carried out as an internal process in Japan, whereas in Europe and USA, it was left to the external consulting agency. In India too, these reasons are equally valid and applicable. 2.12 QC Success Story in India QC took birth in India in 1982 and some of the industries to launch QC first were Bharat Electronics Limited, Bangalore and Bharat Heavy Electricals Limited, Trichy. However, with the progress of time, QC achieved success in a number of industries in India. To name a few are TATA, TELCO, Reliance Industries Limited, Kirloskar Brothers Limited and so.
3. Case Study of Quality Circle
M/s Devki Auto Industries Private Limited, ISO 9001:2008, ISO/TS16949:2009 certified is a well renowned and reputed organization situated at Rohtak. The company owes its success to its Kaizen operations and dedication to quality at every step. The passion to serve its customers with the best has successfully translated to significant market share. Description of case industry is as shown in Table 1. 4. Objective of the Study The case study has following objectives:
1. To provide a sound discussion on quality circle implementation and see how this strategy fit in with quality improvement and operational excellence initiatives in manufacturing industries.
2. To analyze the tangible and intangible benefits of quality circles implementation over manufacturing industries.
3. To justifies the significant role of quality circles implementation for quality improvement and analyze shop floor results after implementation of quality circle.
4. To improve production by brainstorming for reduction in non-value added work through implication of continuous improvement.
5. To encourage and motivate company employee to provide valuable suggestion for improvement in any of the working area.
5. Application of Quality Circle Methodology
The study includes application of Improvement made by the Quality Circle Methodology (QCM) throughout various processes in industry which gives comparatively better results in form of quality improvements, cost reduction etc. The process is described by the method which is described as follows in form of Before QCM and After QCM activities.
5.1 Studies before Implementation of Quality Circle Methodology A study is done to understand the various processes to produce products of the industry before implementation of QCM. This data has worked as a data base for finding out ideas of improvements in various processes.
Narender Kumar Quality Circle Implementation in Industry in India-A Case Study
64| International Journal of Current Engineering and Technology, Vol.5, No.1 (Feb 2015)
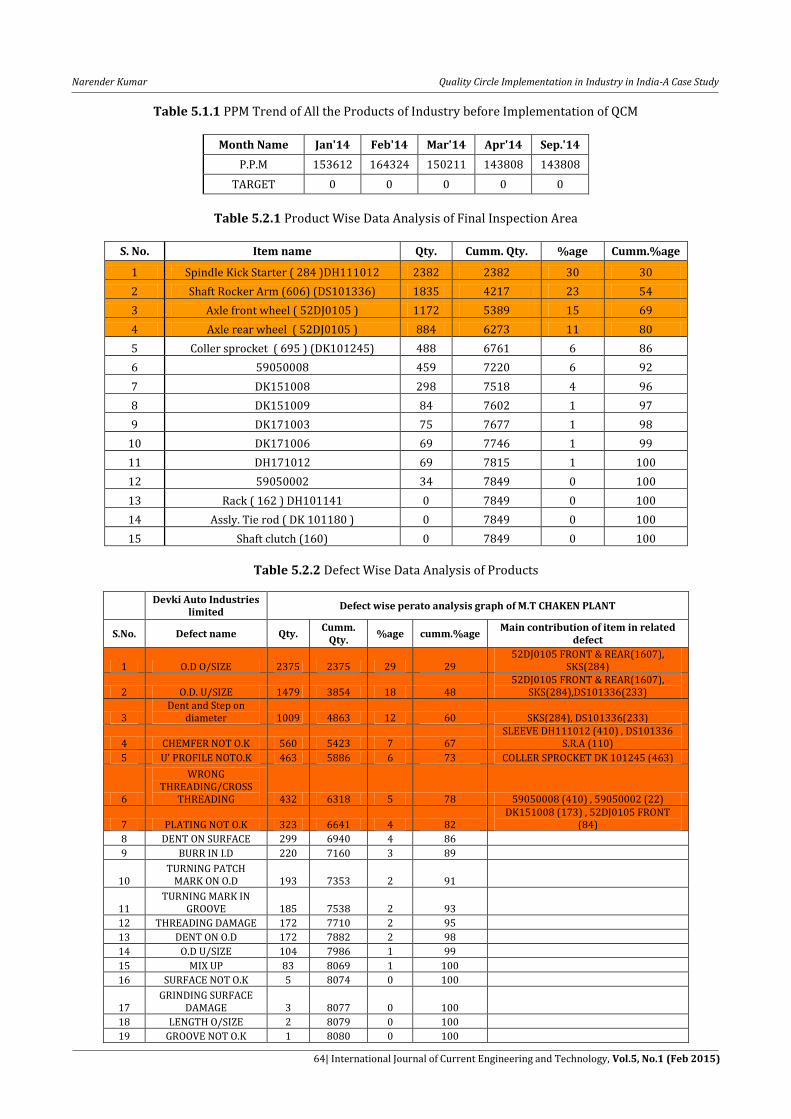
Table 5.1.1 PPM Trend of All the Products of Industry before Implementation of QCM
Month Name Jan'14 Feb'14 Mar'14 Apr'14 Sep.'14
P.P.M 153612 164324 150211 143808 143808
TARGET 0 0 0 0 0
Table 5.2.1 Product Wise Data Analysis of Final Inspection Area
S. No. Item name Qty. Cumm. Qty. %age Cumm.%age
1 Spindle Kick Starter ( 284 )DH111012 2382 2382 30 30
2 Shaft Rocker Arm (606) (DS101336) 1835 4217 23 54
3 Axle front wheel ( 52DJ0105 ) 1172 5389 15 69
4 Axle rear wheel ( 52DJ0105 ) 884 6273 11 80
5 Coller sprocket ( 695 ) (DK101245) 488 6761 6 86
6 59050008 459 7220 6 92
7 DK151008 298 7518 4 96
8 DK151009 84 7602 1 97
9 DK171003 75 7677 1 98
10 DK171006 69 7746 1 99
11 DH171012 69 7815 1 100
12 59050002 34 7849 0 100
13 Rack ( 162 ) DH101141 0 7849 0 100
14 Assly. Tie rod ( DK 101180 ) 0 7849 0 100
15 Shaft clutch (160) 0 7849 0 100
Table 5.2.2 Defect Wise Data Analysis of Products
Devki Auto Industries limited
Defect wise perato analysis graph of M.T CHAKEN PLANT
S.No. Defect name Qty. Cumm.
Qty. %age cumm.%age
Main contribution of item in related defect
1 O.D O/SIZE 2375 2375 29 29 52DJ0105 FRONT & REAR(1607),
SKS(284)
2 O.D. U/SIZE 1479 3854 18 48 52DJ0105 FRONT & REAR(1607),
SKS(284),DS101336(233)
3 Dent and Step on
diameter 1009 4863 12 60 SKS(284), DS101336(233)
4 CHEMFER NOT O.K 560 5423 7 67 SLEEVE DH111012 (410) , DS101336
S.R.A (110)
5 U' PROFILE NOTO.K 463 5886 6 73 COLLER SPROCKET DK 101245 (463)
6
WRONG THREADING/CROSS
THREADING 432 6318 5 78 59050008 (410) , 59050002 (22)
7 PLATING NOT O.K 323 6641 4 82 DK151008 (173) , 52DJ0105 FRONT
(84)
8 DENT ON SURFACE 299 6940 4 86 9 BURR IN I.D 220 7160 3 89
10 TURNING PATCH
MARK ON O.D 193 7353 2 91
11 TURNING MARK IN
GROOVE 185 7538 2 93 12 THREADING DAMAGE 172 7710 2 95 13 DENT ON O.D 172 7882 2 98 14 O.D U/SIZE 104 7986 1 99 15 MIX UP 83 8069 1 100 16 SURFACE NOT O.K 5 8074 0 100
17 GRINDING SURFACE
DAMAGE 3 8077 0 100 18 LENGTH O/SIZE 2 8079 0 100 19 GROOVE NOT O.K 1 8080 0 100
Narender Kumar Quality Circle Implementation in Industry in India-A Case Study
65| International Journal of Current Engineering and Technology, Vol.5, No.1 (Feb 2015)
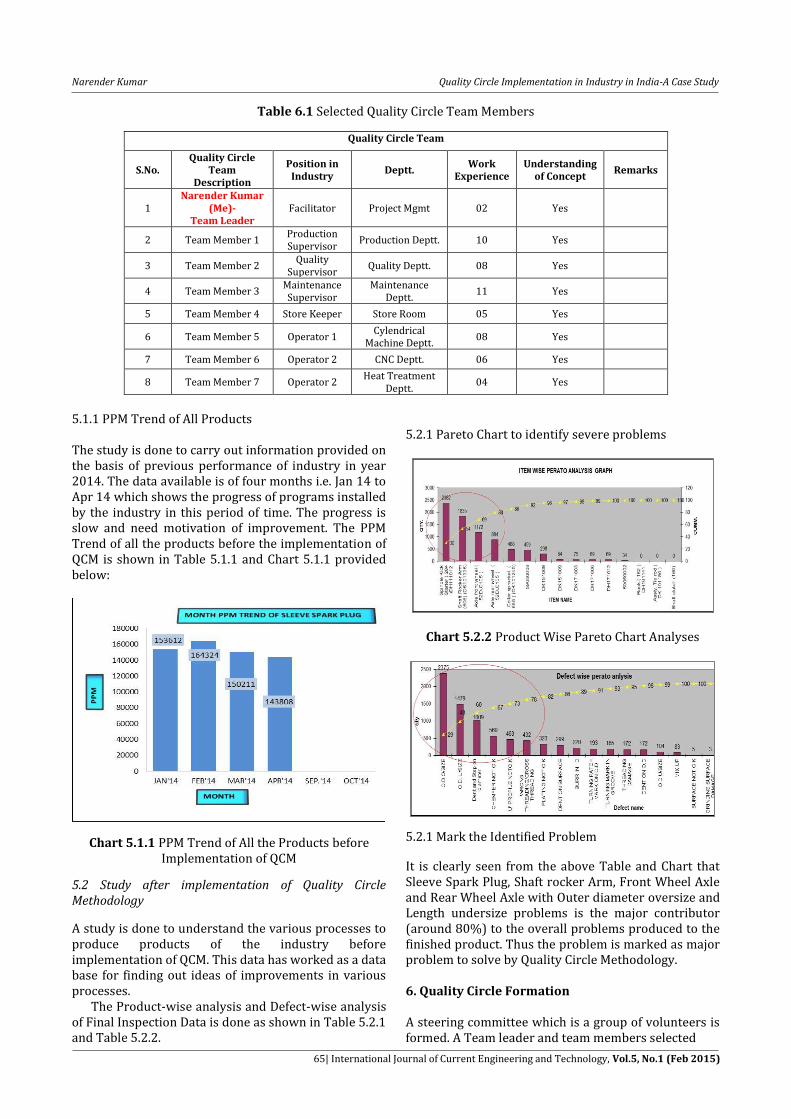
Table 6.1 Selected Quality Circle Team Members
Quality Circle Team
S.No. Quality Circle
Team Description
Position in Industry
Deptt. Work
Experience Understanding
of Concept Remarks
1 Narender Kumar
(Me)- Team Leader
Facilitator Project Mgmt 02 Yes
2 Team Member 1 Production Supervisor
Production Deptt. 10 Yes
3 Team Member 2 Quality
Supervisor Quality Deptt. 08 Yes
4 Team Member 3 Maintenance Supervisor
Maintenance Deptt.
11 Yes
5 Team Member 4 Store Keeper Store Room 05 Yes
6 Team Member 5 Operator 1 Cylendrical
Machine Deptt. 08 Yes
7 Team Member 6 Operator 2 CNC Deptt. 06 Yes
8 Team Member 7 Operator 2 Heat Treatment
Deptt. 04 Yes
5.1.1 PPM Trend of All Products The study is done to carry out information provided on the basis of previous performance of industry in year 2014. The data available is of four months i.e. Jan 14 to Apr 14 which shows the progress of programs installed by the industry in this period of time. The progress is slow and need motivation of improvement. The PPM Trend of all the products before the implementation of QCM is shown in Table 5.1.1 and Chart 5.1.1 provided below:
Chart 5.1.1 PPM Trend of All the Products before Implementation of QCM
5.2 Study after implementation of Quality Circle Methodology
A study is done to understand the various processes to produce products of the industry before implementation of QCM. This data has worked as a data base for finding out ideas of improvements in various processes. The Product-wise analysis and Defect-wise analysis of Final Inspection Data is done as shown in Table 5.2.1 and Table 5.2.2.
5.2.1 Pareto Chart to identify severe problems
Chart 5.2.2 Product Wise Pareto Chart Analyses
5.2.1 Mark the Identified Problem
It is clearly seen from the above Table and Chart that Sleeve Spark Plug, Shaft rocker Arm, Front Wheel Axle and Rear Wheel Axle with Outer diameter oversize and Length undersize problems is the major contributor (around 80%) to the overall problems produced to the finished product. Thus the problem is marked as major problem to solve by Quality Circle Methodology. 6. Quality Circle Formation A steering committee which is a group of volunteers is formed. A Team leader and team members selected
Narender Kumar Quality Circle Implementation in Industry in India-A Case Study
66| International Journal of Current Engineering and Technology, Vol.5, No.1 (Feb 2015)
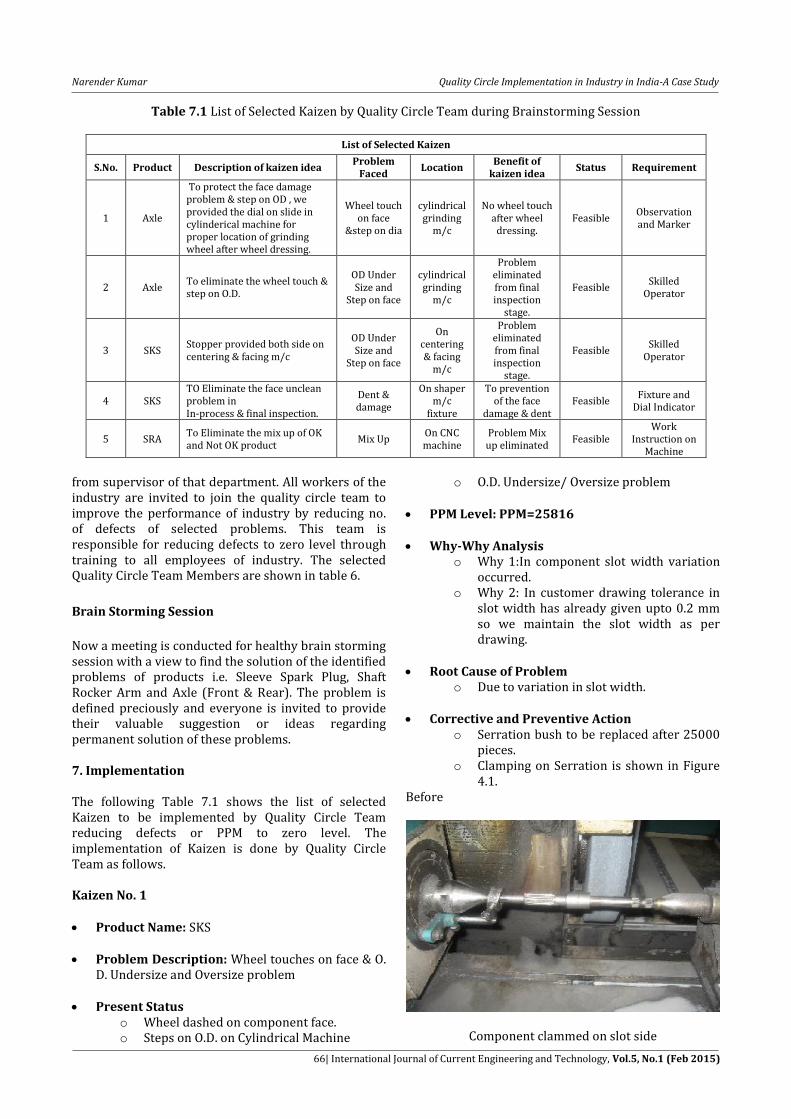
Table 7.1 List of Selected Kaizen by Quality Circle Team during Brainstorming Session
List of Selected Kaizen
S.No. Product Description of kaizen idea Problem
Faced Location
Benefit of kaizen idea
Status Requirement
1 Axle
To protect the face damage problem & step on OD , we provided the dial on slide in cylinderical machine for proper location of grinding wheel after wheel dressing.
Wheel touch on face
&step on dia
cylindrical grinding
m/c
No wheel touch after wheel
dressing. Feasible
Observation and Marker
2 Axle To eliminate the wheel touch & step on O.D.
OD Under Size and
Step on face
cylindrical grinding
m/c
Problem eliminated from final inspection
stage.
Feasible Skilled
Operator
3 SKS Stopper provided both side on centering & facing m/c
OD Under Size and
Step on face
On centering & facing
m/c
Problem eliminated from final inspection
stage.
Feasible Skilled
Operator
4 SKS TO Eliminate the face unclean problem in In-process & final inspection.
Dent & damage
On shaper m/c
fixture
To prevention of the face
damage & dent Feasible
Fixture and Dial Indicator
5 SRA To Eliminate the mix up of OK and Not OK product
Mix Up On CNC machine
Problem Mix up eliminated
Feasible Work
Instruction on Machine
from supervisor of that department. All workers of the industry are invited to join the quality circle team to improve the performance of industry by reducing no. of defects of selected problems. This team is responsible for reducing defects to zero level through training to all employees of industry. The selected Quality Circle Team Members are shown in table 6.
Brain Storming Session
Now a meeting is conducted for healthy brain storming session with a view to find the solution of the identified problems of products i.e. Sleeve Spark Plug, Shaft Rocker Arm and Axle (Front & Rear). The problem is defined preciously and everyone is invited to provide their valuable suggestion or ideas regarding permanent solution of these problems. 7. Implementation The following Table 7.1 shows the list of selected Kaizen to be implemented by Quality Circle Team reducing defects or PPM to zero level. The implementation of Kaizen is done by Quality Circle Team as follows. Kaizen No. 1 Product Name: SKS
Problem Description: Wheel touches on face & O.
D. Undersize and Oversize problem
Present Status o Wheel dashed on component face. o Steps on O.D. on Cylindrical Machine
o O.D. Undersize/ Oversize problem
PPM Level: PPM=25816
Why-Why Analysis o Why 1:In component slot width variation
occurred. o Why 2: In customer drawing tolerance in
slot width has already given upto 0.2 mm so we maintain the slot width as per drawing.
Root Cause of Problem
o Due to variation in slot width.
Corrective and Preventive Action o Serration bush to be replaced after 25000
pieces. o Clamping on Serration is shown in Figure
4.1. Before
Component clammed on slot side
Narender Kumar Quality Circle Implementation in Industry in India-A Case Study
67| International Journal of Current Engineering and Technology, Vol.5, No.1 (Feb 2015)
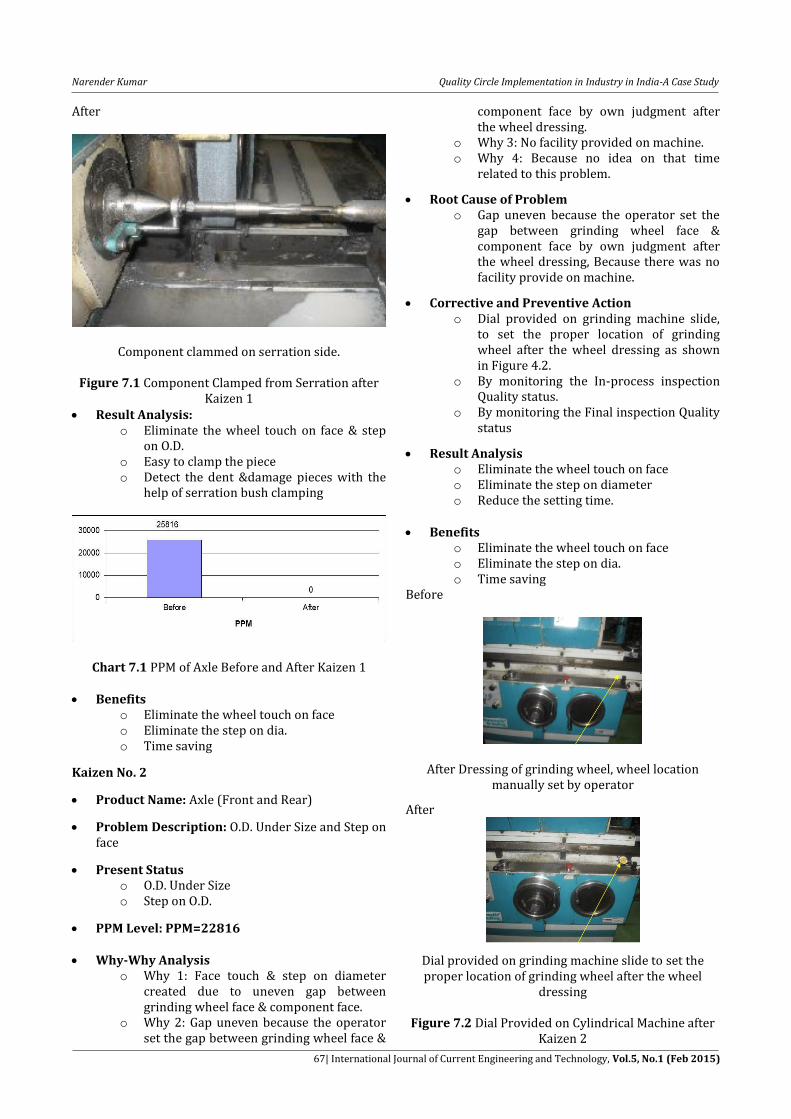
After
Component clammed on serration side.
Figure 7.1 Component Clamped from Serration after Kaizen 1
Result Analysis: o Eliminate the wheel touch on face & step
on O.D. o Easy to clamp the piece o Detect the dent &damage pieces with the
help of serration bush clamping
Chart 7.1 PPM of Axle Before and After Kaizen 1
Benefits o Eliminate the wheel touch on face o Eliminate the step on dia. o Time saving
Kaizen No. 2
Product Name: Axle (Front and Rear)
Problem Description: O.D. Under Size and Step on face
Present Status o O.D. Under Size o Step on O.D.
PPM Level: PPM=22816
Why-Why Analysis o Why 1: Face touch & step on diameter
created due to uneven gap between grinding wheel face & component face.
o Why 2: Gap uneven because the operator set the gap between grinding wheel face &
component face by own judgment after the wheel dressing.
o Why 3: No facility provided on machine. o Why 4: Because no idea on that time
related to this problem.
Root Cause of Problem o Gap uneven because the operator set the
gap between grinding wheel face & component face by own judgment after the wheel dressing, Because there was no facility provide on machine.
Corrective and Preventive Action o Dial provided on grinding machine slide,
to set the proper location of grinding wheel after the wheel dressing as shown in Figure 4.2.
o By monitoring the In-process inspection Quality status.
o By monitoring the Final inspection Quality status
Result Analysis o Eliminate the wheel touch on face o Eliminate the step on diameter o Reduce the setting time.
Benefits
o Eliminate the wheel touch on face o Eliminate the step on dia. o Time saving
Before
After Dressing of grinding wheel, wheel location manually set by operator
After
Dial provided on grinding machine slide to set the proper location of grinding wheel after the wheel
dressing
Figure 7.2 Dial Provided on Cylindrical Machine after Kaizen 2
Narender Kumar Quality Circle Implementation in Industry in India-A Case Study
68| International Journal of Current Engineering and Technology, Vol.5, No.1 (Feb 2015)
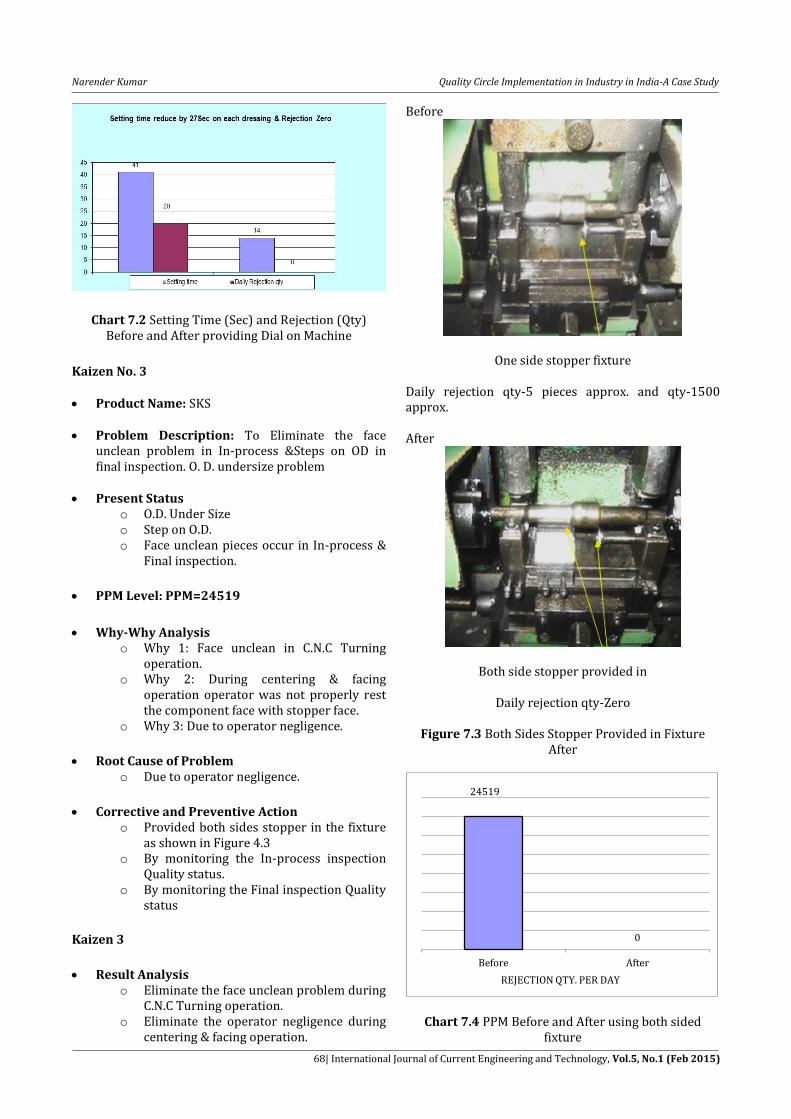
Chart 7.2 Setting Time (Sec) and Rejection (Qty) Before and After providing Dial on Machine
Kaizen No. 3 Product Name: SKS
Problem Description: To Eliminate the face
unclean problem in In-process &Steps on OD in final inspection. O. D. undersize problem
Present Status o O.D. Under Size o Step on O.D. o Face unclean pieces occur in In-process &
Final inspection.
PPM Level: PPM=24519
Why-Why Analysis
o Why 1: Face unclean in C.N.C Turning operation.
o Why 2: During centering & facing operation operator was not properly rest the component face with stopper face.
o Why 3: Due to operator negligence.
Root Cause of Problem
o Due to operator negligence.
Corrective and Preventive Action
o Provided both sides stopper in the fixture as shown in Figure 4.3
o By monitoring the In-process inspection Quality status.
o By monitoring the Final inspection Quality status
Kaizen 3
Result Analysis
o Eliminate the face unclean problem during C.N.C Turning operation.
o Eliminate the operator negligence during centering & facing operation.
Before
One side stopper fixture Daily rejection qty-5 pieces approx. and qty-1500 approx. After
Both side stopper provided in
Daily rejection qty-Zero
Figure 7.3 Both Sides Stopper Provided in Fixture After
Chart 7.4 PPM Before and After using both sided fixture
24519
0
Before After
REJECTION QTY. PER DAY
Narender Kumar Quality Circle Implementation in Industry in India-A Case Study
69| International Journal of Current Engineering and Technology, Vol.5, No.1 (Feb 2015)
Benefits o Component face rest properly with
stopper face. o No chances of failure by operator during
centering & facing operation. o Unclean problem eliminate during CNC
operation.
Kaizen No. 4
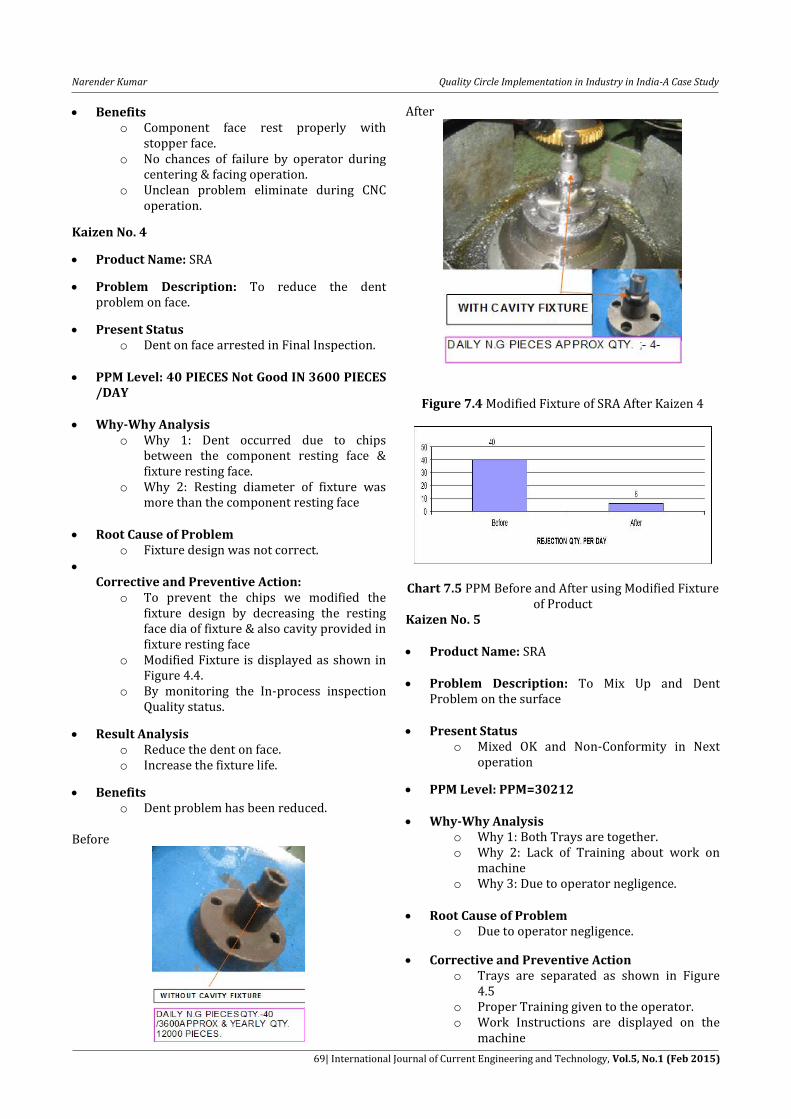
Product Name: SRA
Problem Description: To reduce the dent problem on face.
Present Status o Dent on face arrested in Final Inspection.
PPM Level: 40 PIECES Not Good IN 3600 PIECES
/DAY
Why-Why Analysis o Why 1: Dent occurred due to chips
between the component resting face & fixture resting face.
o Why 2: Resting diameter of fixture was more than the component resting face
Root Cause of Problem
o Fixture design was not correct.
Corrective and Preventive Action: o To prevent the chips we modified the
fixture design by decreasing the resting face dia of fixture & also cavity provided in fixture resting face
o Modified Fixture is displayed as shown in Figure 4.4.
o By monitoring the In-process inspection Quality status.
Result Analysis o Reduce the dent on face. o Increase the fixture life.
Benefits o Dent problem has been reduced.
Before
After
Figure 7.4 Modified Fixture of SRA After Kaizen 4
Chart 7.5 PPM Before and After using Modified Fixture
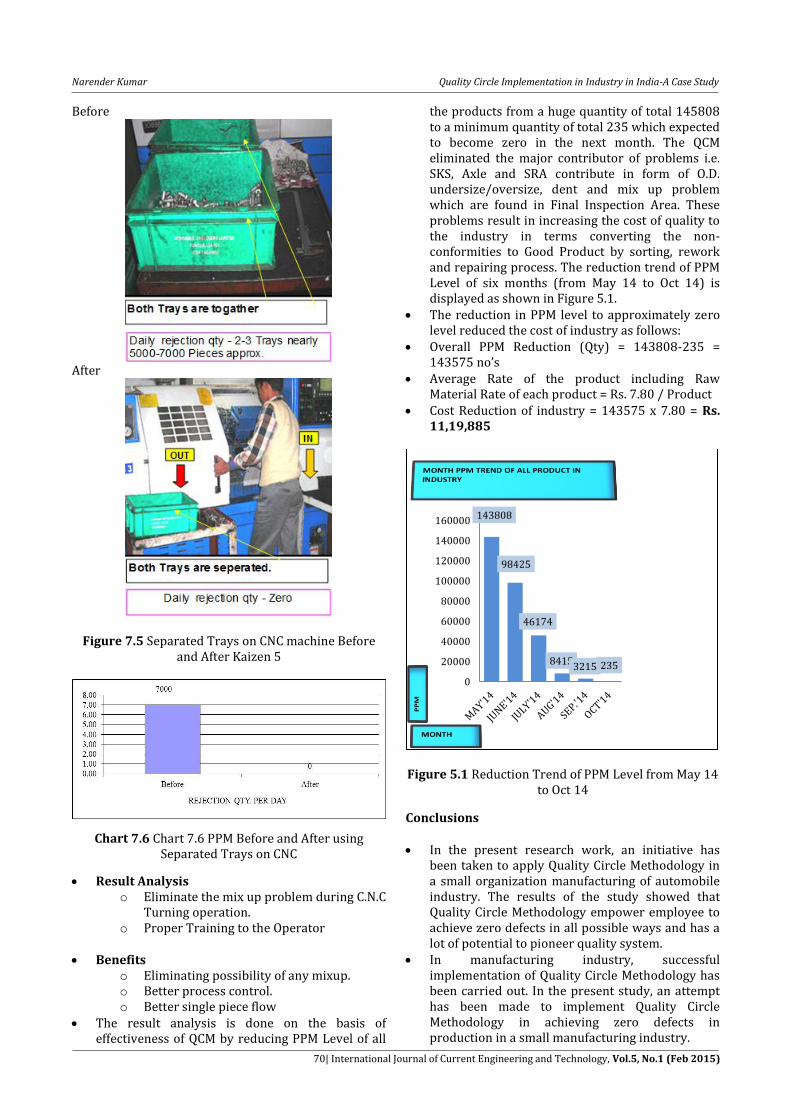
of Product Kaizen No. 5 Product Name: SRA
Problem Description: To Mix Up and Dent
Problem on the surface
Present Status o Mixed OK and Non-Conformity in Next
operation
PPM Level: PPM=30212
Why-Why Analysis o Why 1: Both Trays are together. o Why 2: Lack of Training about work on
machine o Why 3: Due to operator negligence.
Root Cause of Problem
o Due to operator negligence.
Corrective and Preventive Action o Trays are separated as shown in Figure
4.5 o Proper Training given to the operator. o Work Instructions are displayed on the
machine
Narender Kumar Quality Circle Implementation in Industry in India-A Case Study
70| International Journal of Current Engineering and Technology, Vol.5, No.1 (Feb 2015)
Before
After
Figure 7.5 Separated Trays on CNC machine Before and After Kaizen 5
Chart 7.6 Chart 7.6 PPM Before and After using Separated Trays on CNC
Result Analysis o Eliminate the mix up problem during C.N.C
Turning operation. o Proper Training to the Operator
Benefits
o Eliminating possibility of any mixup. o Better process control. o Better single piece flow
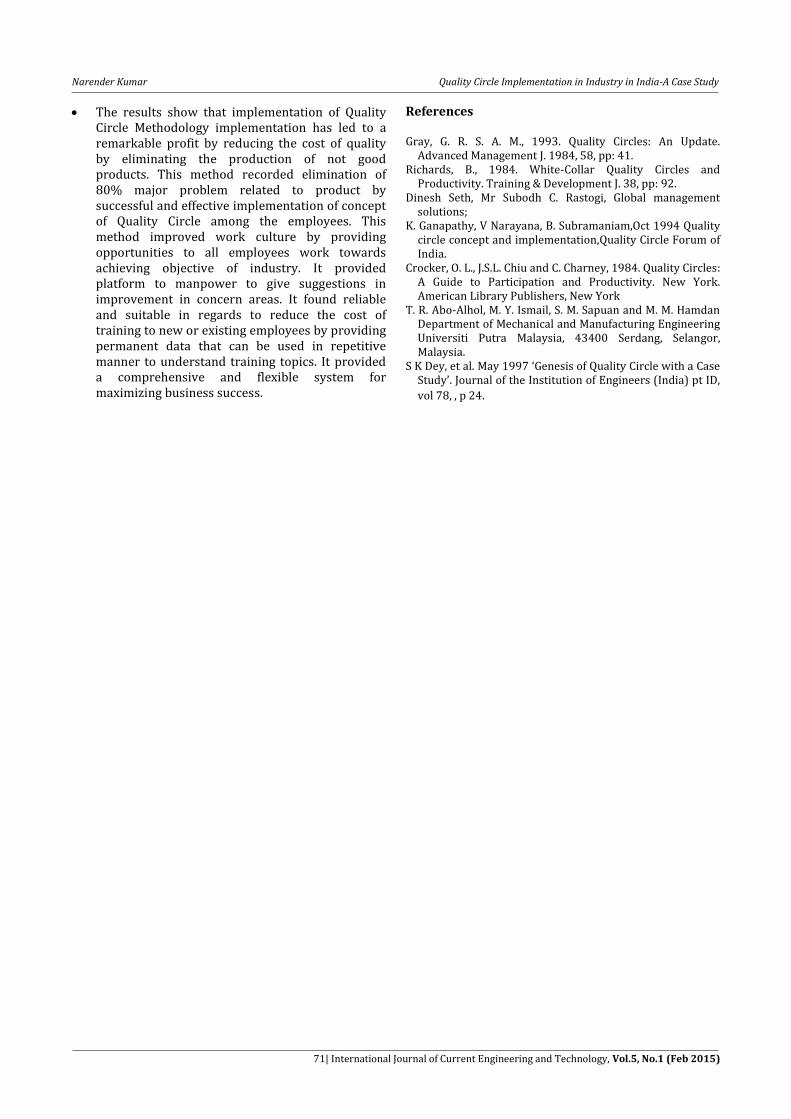
The result analysis is done on the basis of effectiveness of QCM by reducing PPM Level of all
the products from a huge quantity of total 145808 to a minimum quantity of total 235 which expected to become zero in the next month. The QCM eliminated the major contributor of problems i.e. SKS, Axle and SRA contribute in form of O.D. undersize/oversize, dent and mix up problem which are found in Final Inspection Area. These problems result in increasing the cost of quality to the industry in terms converting the non-conformities to Good Product by sorting, rework and repairing process. The reduction trend of PPM Level of six months (from May 14 to Oct 14) is displayed as shown in Figure 5.1.
The reduction in PPM level to approximately zero level reduced the cost of industry as follows:
Overall PPM Reduction (Qty) = 143808-235 = 143575 no’s
Average Rate of the product including Raw Material Rate of each product = Rs. 7.80 / Product
Cost Reduction of industry = 143575 x 7.80 = Rs. 11,19,885
Figure 5.1 Reduction Trend of PPM Level from May 14
to Oct 14
Conclusions In the present research work, an initiative has
been taken to apply Quality Circle Methodology in a small organization manufacturing of automobile industry. The results of the study showed that Quality Circle Methodology empower employee to achieve zero defects in all possible ways and has a lot of potential to pioneer quality system.
In manufacturing industry, successful implementation of Quality Circle Methodology has been carried out. In the present study, an attempt has been made to implement Quality Circle Methodology in achieving zero defects in production in a small manufacturing industry.
143808
98425
46174
8415 3215 235
0
20000
40000
60000
80000
100000
120000
140000
160000
Narender Kumar Quality Circle Implementation in Industry in India-A Case Study
71| International Journal of Current Engineering and Technology, Vol.5, No.1 (Feb 2015)
The results show that implementation of Quality Circle Methodology implementation has led to a remarkable profit by reducing the cost of quality by eliminating the production of not good products. This method recorded elimination of 80% major problem related to product by successful and effective implementation of concept of Quality Circle among the employees. This method improved work culture by providing opportunities to all employees work towards achieving objective of industry. It provided platform to manpower to give suggestions in improvement in concern areas. It found reliable and suitable in regards to reduce the cost of training to new or existing employees by providing permanent data that can be used in repetitive manner to understand training topics. It provided a comprehensive and flexible system for maximizing business success.
References Gray, G. R. S. A. M., 1993. Quality Circles: An Update.
Advanced Management J. 1984, 58, pp: 41. Richards, B., 1984. White-Collar Quality Circles and
Productivity. Training & Development J. 38, pp: 92. Dinesh Seth, Mr Subodh C. Rastogi, Global management
solutions; K. Ganapathy, V Narayana, B. Subramaniam,Oct 1994 Quality
circle concept and implementation,Quality Circle Forum of India.
Crocker, O. L., J.S.L. Chiu and C. Charney, 1984. Quality Circles: A Guide to Participation and Productivity. New York. American Library Publishers, New York
T. R. Abo-Alhol, M. Y. Ismail, S. M. Sapuan and M. M. Hamdan Department of Mechanical and Manufacturing Engineering Universiti Putra Malaysia, 43400 Serdang, Selangor, Malaysia.
S K Dey, et al. May 1997 ‘Genesis of Quality Circle with a Case Study’. Journal of the Institution of Engineers (India) pt ID,
vol 78, , p 24.