Embed Size (px)
Citation preview
1
Department of Physics, Chemistry and Biology Master’s Thesis
Qualitative and Quantitative Analysis of Biodiesel Deposits Formed on a Hot Metal Surface
Emilie Westberg
Master’s Thesis conducted at Exova AB
Linköping
2012-06-20
LITH-IFM-A-EX—13/2753—SE
Linköping University Department of Physics, Chemistry and Biology
581 83 Linköping
1
Department of Physics, Chemistry and Biology Master’s Thesis
Qualitative and Quantitative Analysis of Biodiesel Deposits Formed on a Hot Metal Surface
Emilie Westberg
Master’s Thesis conducted at Exova AB
2013-06-20
Supervisors Rickard Jansson, Exova AB Hans Karlsson, Exova AB
Robert Gustavsson, IFM, Linköping University
Examiner Carl-Fredrik Mandenius
i
Presentationsdatum
2013-06-14
Publiceringsdatum (elektronisk version)
Institution och avdelning
Department of Physics, Chemistry and
Biology, IFM
Linköping University
URL för elektronisk version
http://urn.kb.se/resolve?urn=urn:nbn:se:liu:diva-2753
Publikationens titel
Qualitative and Quantitative Analysis of Biodiesel Deposits Formed on a Hot Metal Surface
Författare Emilie Westberg
Sammanfattning - Abstract This thesis aims to investigate the formation of deposits from thermally degraded biodiesel on a hot metal surface under the
influence of sodium or copper contaminations. Biodiesel or Fatty Acid Methyl Esters (FAMEs) is a widely utilized biofuel
with the potential to replace fossil fuels, however, issues regarding the thermal and oxidative stability prevent the progress of
biodiesel for utilization as vehicle fuel. The thermal degradation of biodiesel causes formation of deposits often occurring in
the fuel injectors, which could result in reduced engine efficiency, increased emissions and engine wear. However, still have
no standard method for evaluation of a fuels’ tendency to form deposits been developed. In this study biodiesel deposits have
been formed on aluminum test tubes utilizing a Hot Liquid Process Simulator (HLPS), an instrument based on the principle
of the Jet Fuel Thermal Oxidation Tester (JFTOT). Quantitative and qualitative analyses have been made utilizing an array of
techniques including Scanning Electron Microscopy (SEM), Gas Chromatography Mass Spectrometry (GCMS) and
Attenuated Total Reflectance Fourier Transform Infrared Spectrometry (ATR-FTIR). A multi-factorial trial investigating the
effects of sodium hydroxide and copper contaminations at trace levels and the impact of a paraffin inhibitor copolymer additive
on three different FAME products, two derived from rapeseed oil and one from waste cooking oil as well as a biodiesel blend
with mineral diesel, was conducted.
The results exhibited that FAMEs are the major precursor to deposit formation in diesel fuel. The SEM analyses exploited the
nature of FAME deposits forming porous structures on hot metal surfaces. Sodium hydroxide proved to participate in the
deposit formation by forming carboxylic salts. However, the copper contamination exhibited no enhancing effect on the
deposits, possibly due to interference of the blank oil in which copper was received. The paraffin inhibitor functioning as a
crystal modifier had significant reducing effect on the deposit formation for all biodiesel samples except for the FAME product
derived from waste cooking oil. Further studies are needed in order to investigate the influence of glycerin and water residues
to the biodiesel deposit formation. Mechanisms involving oxidative or thermal peroxide formation, polymerization and
disintegration have been suggested as degradation pathways for biodiesel. The involvement of oxidation intermediates,
peroxides, was confirmed by the experiments performed in this thesis. However, the mechanisms of biodiesel deposit
formation are complex and hard to study as the deposits are seemingly insoluble. Nevertheless, ATR-FTIR in combination
with JFTOT-processing has potential as standard method for evaluation of deposit forming tendencies of biodiesel.
Nyckelord
Fatty Acid Methyl Ester (FAME), Biodiesel deposits, SEM/EDS, ATR-FTIR, GCMS
Språk
Svenska
X Annat (ange nedan)
Engelska
Antal sidor
70
Typ av publikation
Licentiatavhandling
X Examensarbete
C-uppsats
D-uppsats
Rapport
Annat (ange nedan)
ISBN (licentiatavhandling) - ISRN LITH-IFM-A-EX—13/2753—SE
Serietitel (licentiatavhandling) - Serienummer/ISSN (licentiatavhandling) -
i
ABSTRACT This thesis aims to investigate the formation of deposits from thermally degraded biodiesel on a hot metal surface under the influence of sodium or copper contaminations. Biodiesel or Fatty Acid Methyl Esters (FAMEs) is a widely utilized biofuel with the potential to replace fossil fuels, however, issues regarding the thermal and oxidative stability prevent the progress of biodiesel for utilization as vehicle fuel. The thermal degradation of biodiesel causes formation of deposits often occurring in the fuel injectors, which could result in reduced engine efficiency, increased emissions and engine wear. However, still have no standard method for evaluation of a fuels’ tendency to form deposits been developed. In this study biodiesel deposits have been formed on aluminum test tubes utilizing a Hot Liquid Process Simulator (HLPS), an instrument based on the principle of the Jet Fuel Thermal Oxidation Tester (JFTOT). Quantitative and qualitative analyses have been made utilizing an array of techniques including Scanning Electron Microscopy (SEM), Gas Chromatography Mass Spectrometry (GCMS) and Attenuated Total Reflectance Fourier Transform Infrared Spectrometry (ATR-FTIR). A multi-factorial trial investigating the effects of sodium hydroxide and copper contaminations at trace levels and the impact of a paraffin inhibitor copolymer additive on three different FAME products, two derived from rapeseed oil and one from waste cooking oil as well as a biodiesel blend with mineral diesel, was conducted. The results exhibited that FAMEs are the major precursor to deposit formation in diesel fuel. The SEM analyses exploited the nature of FAME deposits forming porous structures on hot metal surfaces. Sodium hydroxide proved to participate in the deposit formation by forming carboxylic salts. However, the copper contamination exhibited no enhancing effect on the deposits, possibly due to interference of the blank oil in which copper was received. The paraffin inhibitor functioning as a crystal modifier had significant reducing effect on the deposit formation for all biodiesel samples except for the FAME product derived from waste cooking oil. Further studies are needed in order to investigate the influence of glycerin and water residues to the biodiesel deposit formation. Mechanisms involving oxidative or thermal peroxide formation, polymerization and disintegration have been suggested as degradation pathways for biodiesel. The involvement of oxidation intermediates, peroxides, was confirmed by the experiments performed in this thesis. However, the mechanisms of biodiesel deposit formation are complex and hard to study as the deposits are seemingly insoluble. Nevertheless, ATR-FTIR in combination with JFTOT-processing has potential as standard method for evaluation of deposit forming tendencies of biodiesel.
ii
Abbreviation and Definitions AAS Atomic Absorption Spectroscopy Additive A substance added to the fuel to alter or improve its properties ASTM American Society for Testing and Materials; organization responsible for development and publication of technical standards for materials, products, systems and services ATR-FTIR Attenuated Total Reflectance - Fourier Transform Infrared Spectrometry pDSC Pressure Differential Scanning Calorimetry ED-XRF Energy Dispersive X-Ray Fluorescence EN European Standards; Technical standards developed by European Committee for
Standardization ISO International standard FAME Fatty Acid Methyl Ester GC-FID Gas Chromatography with Flame Ionization Detector GCMS Gas Chromatography with Mass Spectrometer GPC Gel Permeation Chromatography HLPS Hot Liquid Process Simulator HPLC High Performance Liquid Chromatography ICP-OES Inductively Coupled Plasma – Optical Emission Spectrum OSI-IP Oxidation Stability Index – Induction Point SAE Society of Automotive Engineers SEM/EDS Scanning Electron Microscopy/Energy Dispersive Spectroscopy THF Tetrahydrofuran UV-DAD Ultra Violet Light – Diode Array Detector
iii
Table of Contents 1 Introduction ..................................................................................................................................... 1
1.1 Thesis objectives...................................................................................................................... 1 1.2 Approach ................................................................................................................................. 2
2 Theory .............................................................................................................................................. 3 2.1 Background - Biodiesel ............................................................................................................ 3 2.2 Biodiesel Production Techniques ............................................................................................ 3 2.3 Properties of Biodiesel ............................................................................................................ 7 2.4 Biodiesel Degradation and Deposition .................................................................................... 9
2.4.1 Oxidative Degradation ..................................................................................................... 9 2.4.2 Thermal Degradation..................................................................................................... 10
2.5 Deposit Control Additives ...................................................................................................... 12 2.6 Techniques for Biodiesel Analysis ......................................................................................... 13 2.7 Techniques for Biodiesel Deposit Analysis ............................................................................ 14
2.7.1 Hot Liquid Process Simulator (HLPS) ............................................................................. 14 2.7.2 Scanning Electron Microscopy (SEM) and Energy Dispersive X-ray Spectroscopy (EDS) 15
3 Materials and Methods ................................................................................................................. 17 3.1 Biodiesel Samples .................................................................................................................. 17 3.2 Qualitative Analyses of Biodiesel .......................................................................................... 17
3.2.1 FAME Content and Composition with GC-FID and FTIR ................................................ 18 3.2.2 Oxidation Stability with Rancimat ................................................................................. 19 3.2.3 Contents of Elements with ICP-OES, ED-XRF and AAS .................................................. 19 3.2.4 Water content by Karl Fischer Titration ........................................................................ 19 3.2.5 Peroxide Number by Titration ....................................................................................... 20 3.2.6 Reaction Onset Temperatures with pDSC ..................................................................... 20
3.3 Polymerization Studies .......................................................................................................... 21 3.4 Experimental Design .............................................................................................................. 21 3.5 Formation of Biodiesel Deposits with HLPS .......................................................................... 21 3.6 Qualitative Analyses of Deposits ........................................................................................... 22
3.6.1 Characterization with SEM ............................................................................................ 22 3.6.2 Characterization with ATR-FTIR ..................................................................................... 23 3.6.3 Characterization with GCMS ......................................................................................... 23
3.7 Quantitative Analyses of Biodiesel Deposits ......................................................................... 23 4 Results and Discussion .................................................................................................................. 25
4.1 Qualitative Analyses of Biodiesel .......................................................................................... 25 4.1.1 Comparisons of Unused and Processed Samples .......................................................... 26
4.2 Deposit Characterization ....................................................................................................... 30 4.2.1 SEM Characterization .................................................................................................... 30 4.2.2 FTIR Characterization .................................................................................................... 33 4.2.3 GCMS Characterization ................................................................................................. 37
4.3 Quantitative Analysis of Deposits ......................................................................................... 39 4.4 Statistical Evaluation ............................................................................................................. 41 4.5 Polymerization Studies .......................................................................................................... 43
4.5.1 Effects of Paraffin Inhibitor Additive ............................................................................. 44 4.6 Influence of Water................................................................................................................. 46
5 Conclusions .................................................................................................................................... 47 6 Future Perspectives ....................................................................................................................... 49 7 Acknowledgements ....................................................................................................................... 50 8 References ..................................................................................................................................... 51
iv
List of Figures Figure 1: Schematic image of a fuel injector, circled areas displays where biodiesel deposits are usually found, based on reference [10]. .............................................................................................................. 1 Figure 2: Transesterification of triglycerides with methanol based on reference [19]. ......................... 4 Figure 3: General base-catalyzed esterification based on reference [19]. ............................................. 4 Figure 4: Formation of sodium salt by the reaction of a fatty acid with sodium hydroxide, based on reference [20]. ......................................................................................................................................... 5 Figure 5: Typical process for biodiesel production through base-catalyzed transesterification, based on reference [21]. ......................................................................................................................................... 5 Figure 6: Acid-catalyzed esterification, based on reference [19] ............................................................ 6 Figure 7: Simplified illustration of the Esterfip-H process, based on reference [69]. ............................. 6 Figure 8: Ester hydrolysis based on [28]. ................................................................................................ 8 Figure 9: Examples of long chain hydrocarbons suggested to be formed by peroxide reactions [20]. .. 9 Figure 10: Mechanism for oxygen incorporation and dimerization of polyunsaturated fatty acids [20]. ............................................................................................................................................................... 10 Figure 11: Diels-Alder reaction of Linolenic acid [41]. .......................................................................... 11 Figure 12: Illustration of general ene-mechanism, the R-chains represent alkyl, ester or carboxyl acids, based on reference [42]. ....................................................................................................................... 11 Figure 13: Thermal degradation of fatty acids, based on reference [43]. ............................................ 11 Figure 14: Aldol-condensation of an aldehyde and ketones, based on reference [20]. ....................... 12 Figure 15: A: Bytulated Hydroxytoluene, BHT, B: butylated hydroxyanisole, BHA, C: General structure of Polyisobutylene mono succinimides, common detergent-dispersant additive, n=1-5, based on reference [31]. ....................................................................................................................................... 12 Figure 16: Illustration of mechanism of copolymer additives functioning as corrosion inhibitors, based on reference [31]. .................................................................................................................................. 12 Figure 17: Illustration of assembled oxidation stability measurement apparatus. .............................. 14 Figure 18: Illustration of the Hot Liquid Process Simulator to the left, heater tube housing to the right from the Hot Liquid Process Simulator User’s manual (Alcor Petroleum Instruments Inc., Westbury, New York, United States of America). ................................................................................................... 15 Figure 19: Temperature profiles of the aluminium test tube when subjected to 220 °C and 300°C, respectively. .......................................................................................................................................... 15 Figure 20: HLPS-apparatus available at Exova. ..................................................................................... 22 Figure 21: ASTM color rating scale utilized for deposit quantification in this study............................. 24 Figure 22: Particle area analysis of manually selected region with Piced Cora, the circled area exhibits the value for the calculated percentage of pixels originating from deposits. ...................................... 24 Figure 23: Graph exhibiting the ester composition, from C8:0 to C24:1, of each biodiesel sample. ... 26 Figure 24: Comparison between ester compositions of unused and processed samples from biodiesel B. ............................................................................................................................................................ 27 Figure 25: Change of FAME content for Fuel D (B7) between unused and processed samples at 300 °C. ............................................................................................................................................................... 28 Figure 26: Graph exhibiting the decrease in peroxide content from before and after HLPS runs 300 °C and 220 °C. ............................................................................................................................................ 29 Figure 27: Change of water content before and after HLPS runs at 300°C. .......................................... 29 Figure 28: SEM-image assemblage of test tubes exposed to 300°C. .................................................... 30 Figure 29: SEM/EDS-analysis of deposits from biodiesel B, formed at 300°C and contaminated with sodium hydroxide. ................................................................................................................................. 31 Figure 30: SEM/EDS-analysis of deposits from biodiesel B, formed at 300°C without contamination or additive. ................................................................................................................................................. 31 Figure 31: SEM image assemblage of test tubes exposed to 220 °C. .................................................... 32 Figure 32: SEM/EDS analysis of copper particle on deposit from fuel D with additive contaminated with copper and processed at 300 °C. ........................................................................................................... 33
v
Figure 33: SEM/EDS analysis of deposits from fuel A processed at 300 °C. .......................................... 33 Figure 34: ATR-FTIR spectra of unused fuel A contaminated with NaOH and the deposits derived from the same sample. .................................................................................................................................. 34 Figure 35: ATR-FTIR specta of unused fuel B contaminated with NaOH and the deposits derived from the same sample. .................................................................................................................................. 35 Figure 36: ATR-FTIR spectra of unused fuel D contaminated with NaOH and the deposits derived from the same sample. .................................................................................................................................. 35 Figure 37: ATR-FTIR spectra of unused fuel B and the deposits derived from the same sample with and without contamination with sodium hydroxide. .................................................................................. 36 Figure 38: ATR-FTIR spectra of unused fuel B and the deposits derived from the same sample with and without contamination of copper. ........................................................................................................ 36 Figure 39: GCMS results of deposits from fuel B contaminated with sodium hydroxide. The large peak at approximately 15.5 min originates from BHT (0.025 %), antioxidant from the solvent THF............ 37 Figure 40: GCMS results of deposits from fuel D contaminated with sodium hydroxide. .................... 38 Figure 41: 18-Crown-6 (IUPAC name: 1,4,7,10,13,16-Hexaoxacyclooctadecane) (left) and example of long hydroxyethoxy chain (right) as presumed by GCMS. .................................................................... 38 Figure 42: GCMS results of deposits from fuel C contaminated with sodium hydroxide. .................... 39 Figure 43: Correlations between length and coverage, color and coverage and mass and coverage, where coverage is defined as the percentage of test tube surface being covered by particles in a SEM image. .................................................................................................................................................... 40 Figure 44: Image exploiting an example of test tubes with various amounts of deposits, the upper side of the tubes is to the right. The test tubes on the picture are randomly selected and ordered. ......... 40 Figure 45: Minitab results and residual plots for ANOVA analysis over deposit mass. ........................ 41 Figure 46: Minitab results and residual plots for ANOVA analysis for deposit coverage, defined as the percentage of test tube surface being covered by particles in a SEM image. ...................................... 41 Figure 47: Interaction plot of fuel (the biodiesel and B7 samples), temperature (-1=220°C and 1=300°C), additive (-1=without, 1=with) and contamination (-1=copper, 0= none, 1= sodium hydroxide) for deposit coverage, defined as percentage of SEM-images consisting of deposits. ............................... 42 Figure 48: Interaction plot of fuel, temperature, additive and contamination for test tube color according to the ASTM color rating scale. ............................................................................................. 43 Figure 49: GPC results of fuel C with sodium hydroxide and additive, before and after HLPS run at 300°C. Notice ghost peaks being present in the blank run. The molecular weight is estimated through comparison to polystyrene calibration standards at 3400, 1250 and 580 Da. ..................................... 44 Figure 50: Diagram displaying the influence of contamination and additive in all fuels. ..................... 45 Figure 51: Graph from pDSC temperature gradient analysis exhibiting fuel A with and without paraffin inhibitor additive. .................................................................................................................................. 45 Figure 52: ATR-FTIR spectra deposits form fuel C contaminated with sodium hydroxide, and deposits from fuel C with both sodium hydroxide and the paraffin inhibitor additive. ...................................... 46 Figure 53: SEM images of fuel A, fuel A with sodium hydroxide and fuel A with addition of water. ... 46 Figure 54: Simplified illustration of a GC with FID detector, The flow splitter enables a controlled distribution of sample volume entering the column by directing the flow not straight at the column entrance resulting in an optimized resolution. ....................................................................................... V Figure 55: Illustration of ATR-FTIR principle. .......................................................................................... VI Figure 56: ATR-FTIR instrument available at the Exova facilities. .......................................................... VI Figure 57: AAS instrument available at Exova facilities. ....................................................................... VII Figure 58: Graphs exhibiting the changes of metal concentrations in biodiesel A after addition of copper from before and after HLPS runs.......................................................................................................... VIII
vi
List of Tables Table 1: Table exhibiting a few selected generally applicable specifications and requirements for biodiesel and petroleum diesel according to European standards. ........................................................ 7 Table 2: Parameters affecting biodiesel deposit formation. ................................................................... 8 Table 3: Designations and descriptions of the biodiesel samples utilized in this study. ...................... 17 Table 4: Parameter settings for the GC-FID. ......................................................................................... 18 Table 5: Factors and levels included in the statistical analysis, the additive was considered a block factor in the experimental design. ................................................................................................................... 21 Table 6: Parameter settings for the HLPS system. ................................................................................ 22 Table 7: Parameter settings for the GCMS-analyses. ............................................................................ 23 Table 8: Results from the quality analysis of the three biodiesels and the biodiesel blend, the numbers within parentheses are requirements for the biodiesel blend. ............................................................ 25 Table 9: Comparison of acid values (in mg KOH/g biodiesel) before and after HLPS-runs at 300°C. ... 28 Table 10: Experimental design, coverage is defined as percentage of pixels in a SEM image consisting of deposits. ............................................................................................................................................... I Table 11: List of emission wavelengths for different elements assayed for ICP-OES. .......................... VII
Appendices Appendix A: Test tube deposits raw data Appendix B: IR band assignments Appendix C: Statistical evaluation of interactions with balanced ANOVA and F-test Appendix D: Principles of Common Techniques for Biodiesel Analysis Appendix E: ICP-OES analysis of processed and unused sample
1
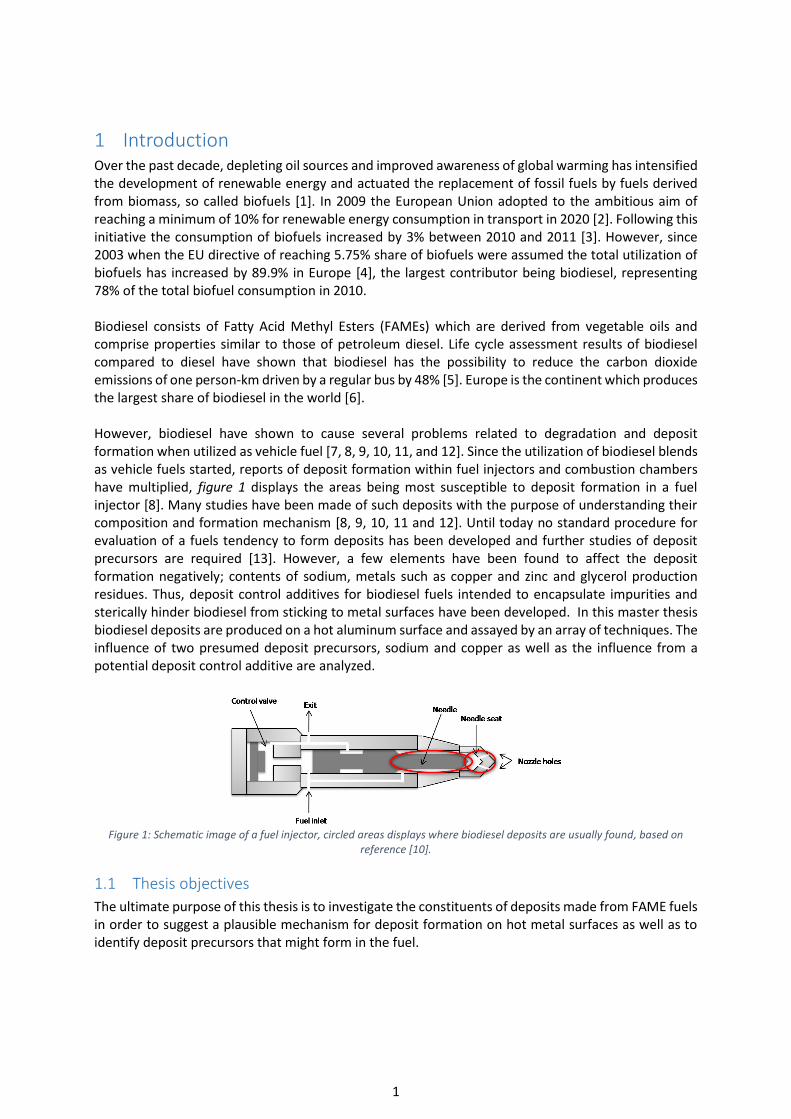
1 Introduction Over the past decade, depleting oil sources and improved awareness of global warming has intensified the development of renewable energy and actuated the replacement of fossil fuels by fuels derived from biomass, so called biofuels [1]. In 2009 the European Union adopted to the ambitious aim of reaching a minimum of 10% for renewable energy consumption in transport in 2020 [2]. Following this initiative the consumption of biofuels increased by 3% between 2010 and 2011 [3]. However, since 2003 when the EU directive of reaching 5.75% share of biofuels were assumed the total utilization of biofuels has increased by 89.9% in Europe [4], the largest contributor being biodiesel, representing 78% of the total biofuel consumption in 2010. Biodiesel consists of Fatty Acid Methyl Esters (FAMEs) which are derived from vegetable oils and comprise properties similar to those of petroleum diesel. Life cycle assessment results of biodiesel compared to diesel have shown that biodiesel has the possibility to reduce the carbon dioxide emissions of one person-km driven by a regular bus by 48% [5]. Europe is the continent which produces the largest share of biodiesel in the world [6]. However, biodiesel have shown to cause several problems related to degradation and deposit formation when utilized as vehicle fuel [7, 8, 9, 10, 11, and 12]. Since the utilization of biodiesel blends as vehicle fuels started, reports of deposit formation within fuel injectors and combustion chambers have multiplied, figure 1 displays the areas being most susceptible to deposit formation in a fuel injector [8]. Many studies have been made of such deposits with the purpose of understanding their composition and formation mechanism [8, 9, 10, 11 and 12]. Until today no standard procedure for evaluation of a fuels tendency to form deposits has been developed and further studies of deposit precursors are required [13]. However, a few elements have been found to affect the deposit formation negatively; contents of sodium, metals such as copper and zinc and glycerol production residues. Thus, deposit control additives for biodiesel fuels intended to encapsulate impurities and sterically hinder biodiesel from sticking to metal surfaces have been developed. In this master thesis biodiesel deposits are produced on a hot aluminum surface and assayed by an array of techniques. The influence of two presumed deposit precursors, sodium and copper as well as the influence from a potential deposit control additive are analyzed.
Figure 1: Schematic image of a fuel injector, circled areas displays where biodiesel deposits are usually found, based on
reference [10].
1.1 Thesis objectives
The ultimate purpose of this thesis is to investigate the constituents of deposits made from FAME fuels in order to suggest a plausible mechanism for deposit formation on hot metal surfaces as well as to identify deposit precursors that might form in the fuel.
2
The thesis objectives are: To prove whether or not contaminations of low concentrations of deposit precursors, sodium and copper affect the propensity of biodiesel to form deposits when subjected to two different high temperatures. To examine what effect the addition of a paraffin inhibitor has on deposit formation. To investigate if and to what degree polymers of FAME molecules are formed during thermal stress. Shortage of time was the major limiting factor during the project which resulted in exclusion of interesting elements from the factorial trial, e g. contaminations by zinc and iron. The studies do not include any diesel fuel containing multi-additives as being utilized in the field generally which would be a parameter of interest. Also no environmental aspects of the diesel fuels are considered in this master thesis.
1.2 Approach
In order to obtain insight to the production, utilization as well as analyses of biodiesel fuels a literature study based on present studies and standard specifications for biodiesel fuels and analysis methods was conducted. Former studies on biodiesel deposits facilitated the decisions of which contaminations, sort of additive and techniques would be utilized. However, some experimental settings were tested before the actual trials were performed. A plan to achieve the thesis objectives by qualitative and quantitative evaluations of biodiesel deposits was established with regards to the available equipment and time. The formation of biodiesel deposits were performed on a Hot Liquid Process Simulator (HLPS) described in section 2.7.1. Unused biodiesel samples and samples passed through the HLPS were stored and qualitatively analyzed to gain understanding of what happens to the fuel during thermal stress. The deposits were analyzed both quantitatively and qualitatively. The quantitative analyses were intended to generate comparative data appropriate for statistical analysis of effects from influencing factors while the qualitative analyses were utilized for characterization of deposits. A multi-factorial trial was planned and executed with the aim of providing significant results for the analysis of affecting contaminants as well as interaction between the additive and contaminants. Three Swedish biodiesel producers and one Swedish producer of mineral diesel (middle distillate derived from raw oil) were contacted and asked to participate in the study by assisting with biodiesel and diesel samples. Furthermore, a large producer of chemicals was asked to test the influence of an oil paraffin inhibitor additive, presumed to function as a deposit control additive, on deposit formation from biodiesel. For the qualitative evaluation of deposits and biodiesel samples a wide range of techniques were utilized, including Scanning Emission Microscopy (SEM), Attenuated Total Reflectance Fourier Transform Infrared spectrometry (ATR-FTIR), and Gas Chromatography with Mass spectrometry (GCMS) and Flame Ionization Detector (GC-FID). Polymerization was studied by Gel Permeation Chromatography (GPC) of biodiesel samples. Further literature studies were conducted for interpretation of the results which was performed near the end of the project. Conclusions of the results were drawn as all results had been evaluated and compared.
3
2 Theory This section will convey general information about biodiesel, conventional production techniques, biodiesel analysis as well as discoveries from previous investigations of biodiesel degradation and deposit formation. This part will provide a background to the remaining sections concerning the experiments performed in this study.
2.1 Background - Biodiesel
In 1892 Rudolph Diesel invented the first diesel engine with the intension of running it on vegetable oils [14]. After having demonstrated a compression ignition engine operated on peanut oil at the World Exhibition in Paris, Rudolph Diesel was soon to predict vegetable oil to become a fuel as widely used as diesel. However, in 1940 large petroleum reservoirs were found and Diesel’s ideas fell into oblivion until the 1970s when new political views reintroduced the interest of vegetable oils as vehicle fuels to the scientists. However, raw vegetable oils showed poor results when tested in diesel engines, giving rise to fuel coking in the injector and sticking to the piston ring. Only when the viscosity and the density had been lowered by processing the raw vegetable oils with the addition of methanol or ethanol an applicable biodiesel were obtained. Today a biodiesel fuel is defined as a mixture of mono-alkyl esters of long chain fatty acids, often comprising between 8-24 carbon atoms, which are generally produced from vegetable oils or animal fats [15]. Biodiesel can be used in diesel engines without any changes of the engine [16]. However, in long run utilization of biodiesel the maintenance problems related to inter alia injector coking remains and therefore biodiesel is mainly utilized in blends with petroleum diesel resulting in an almost unchanged engine performance and fuel consumption while the positive environmental effects are immense [14]. As a renewable fuel biodiesel combustion has low impact on the global CO2 emission and when blended with petroleum diesel the emissions of NOx compounds are decreased. In addition the biodiesel contributes with lubricating properties to the diesel fuel. In order to ensure high quality and thereby functionality as vehicle fuel, standard specifications for biodiesel have been established in a variety of countries over the world. ASTM D 6751, American biodiesel standard and EN 14214, European biodiesel standard, being somewhat stricter than the American standard, are most commonly utilized [17] Generally a designation comprising a number exhibiting the biodiesel content in percent is utilized; eg. B100 comprises 100% biodiesel while B20 comprises 20% biodiesel. In Sweden B5 is most commonly utilized as vehicle fuel while B7 is the maximum biodiesel blend for utilization in diesel engines according to EN 590:2009 diesel standard [18].
2.2 Biodiesel Production Techniques
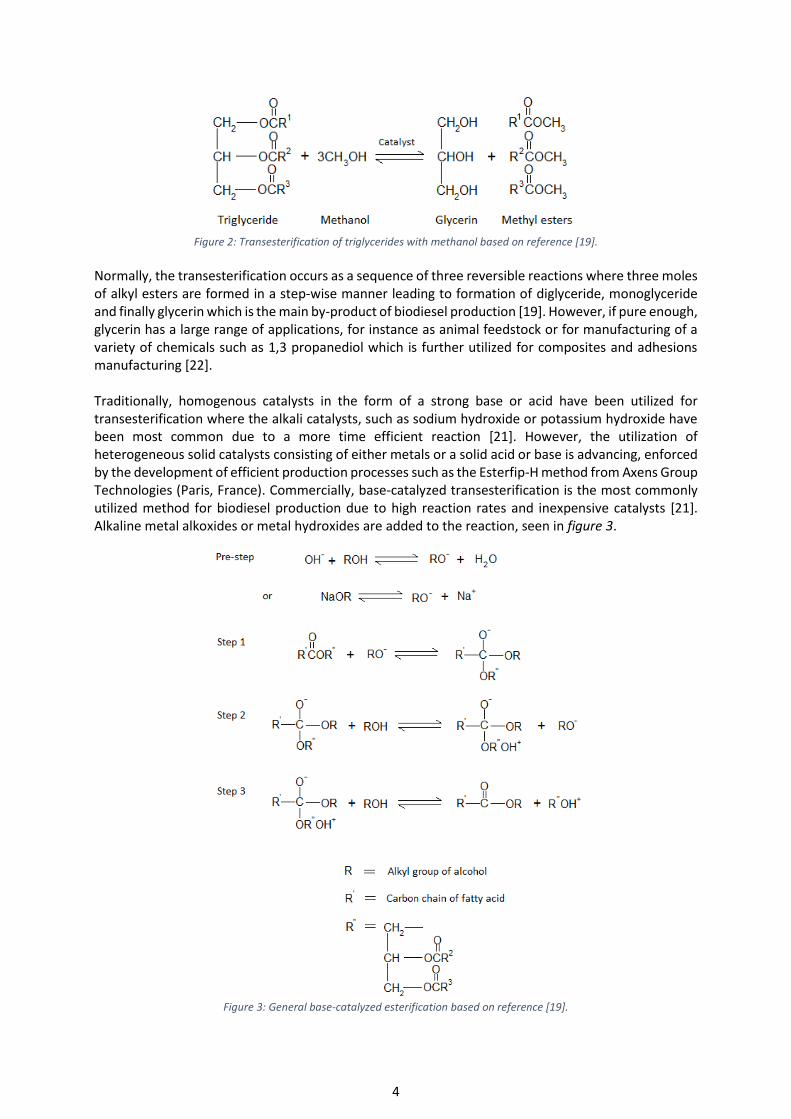
Biodiesel is produced through transesterification of triacylglycerides by the reaction of an alcohol and carboxyl group [19]. Usually methanol is utilized to form FAME molecules, the reaction is then called methanolysis (figure 2). The reaction is reversible and consequently a catalyst and excess of methanol is required to drive the reaction towards completion [19, 20 and 21].
4
Figure 2: Transesterification of triglycerides with methanol based on reference [19].
Normally, the transesterification occurs as a sequence of three reversible reactions where three moles of alkyl esters are formed in a step-wise manner leading to formation of diglyceride, monoglyceride and finally glycerin which is the main by-product of biodiesel production [19]. However, if pure enough, glycerin has a large range of applications, for instance as animal feedstock or for manufacturing of a variety of chemicals such as 1,3 propanediol which is further utilized for composites and adhesions manufacturing [22]. Traditionally, homogenous catalysts in the form of a strong base or acid have been utilized for transesterification where the alkali catalysts, such as sodium hydroxide or potassium hydroxide have been most common due to a more time efficient reaction [21]. However, the utilization of heterogeneous solid catalysts consisting of either metals or a solid acid or base is advancing, enforced by the development of efficient production processes such as the Esterfip-H method from Axens Group Technologies (Paris, France). Commercially, base-catalyzed transesterification is the most commonly utilized method for biodiesel production due to high reaction rates and inexpensive catalysts [21]. Alkaline metal alkoxides or metal hydroxides are added to the reaction, seen in figure 3.
Figure 3: General base-catalyzed esterification based on reference [19].
5
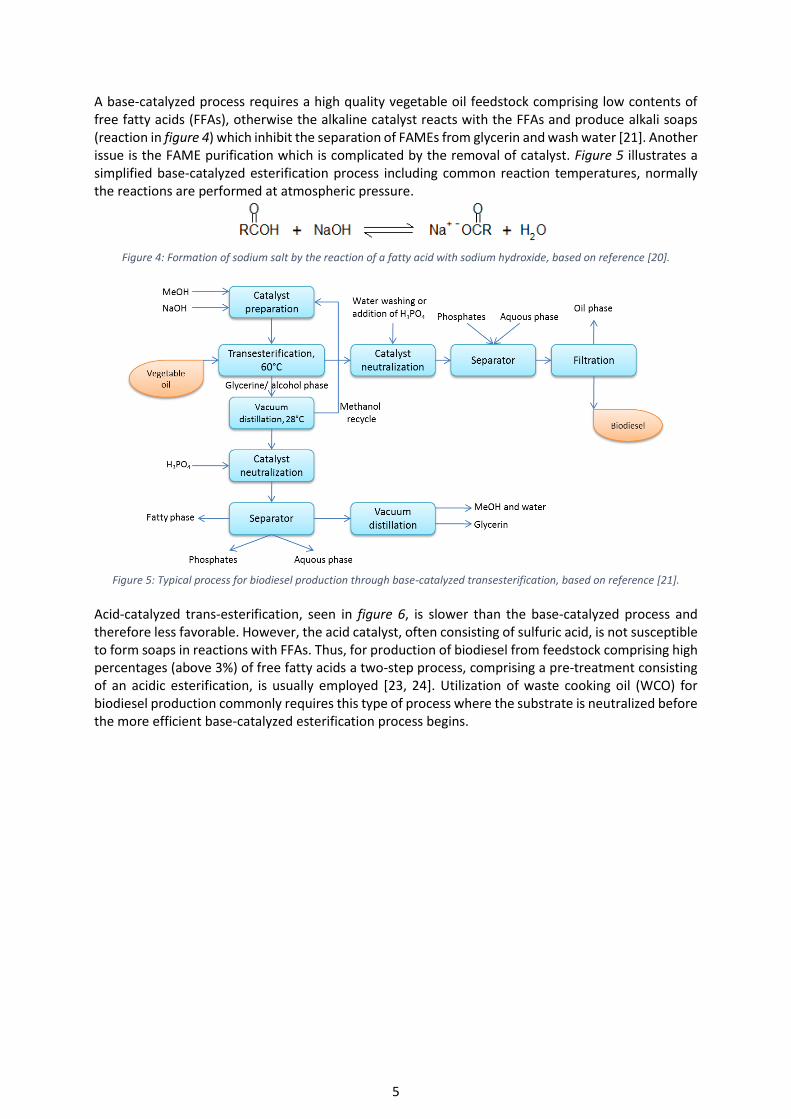
A base-catalyzed process requires a high quality vegetable oil feedstock comprising low contents of free fatty acids (FFAs), otherwise the alkaline catalyst reacts with the FFAs and produce alkali soaps (reaction in figure 4) which inhibit the separation of FAMEs from glycerin and wash water [21]. Another issue is the FAME purification which is complicated by the removal of catalyst. Figure 5 illustrates a simplified base-catalyzed esterification process including common reaction temperatures, normally the reactions are performed at atmospheric pressure.
Figure 4: Formation of sodium salt by the reaction of a fatty acid with sodium hydroxide, based on reference [20].
Figure 5: Typical process for biodiesel production through base-catalyzed transesterification, based on reference [21].
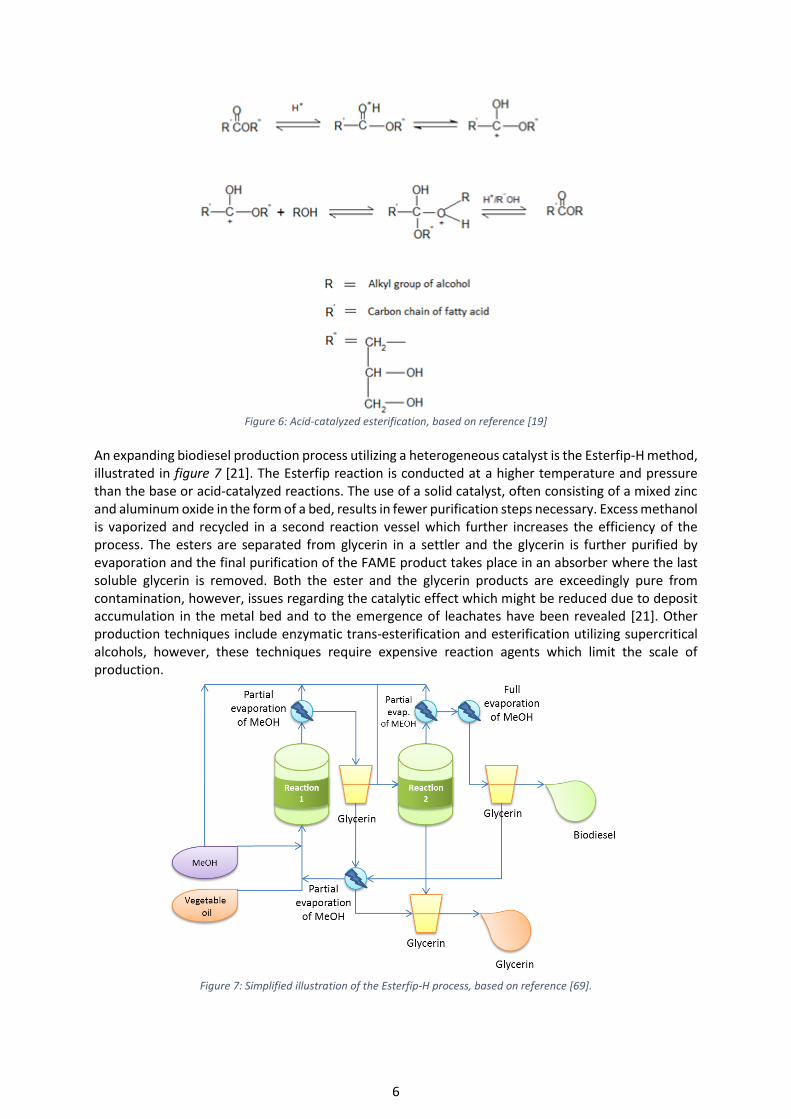
Acid-catalyzed trans-esterification, seen in figure 6, is slower than the base-catalyzed process and therefore less favorable. However, the acid catalyst, often consisting of sulfuric acid, is not susceptible to form soaps in reactions with FFAs. Thus, for production of biodiesel from feedstock comprising high percentages (above 3%) of free fatty acids a two-step process, comprising a pre-treatment consisting of an acidic esterification, is usually employed [23, 24]. Utilization of waste cooking oil (WCO) for biodiesel production commonly requires this type of process where the substrate is neutralized before the more efficient base-catalyzed esterification process begins.
6
Figure 6: Acid-catalyzed esterification, based on reference [19]
An expanding biodiesel production process utilizing a heterogeneous catalyst is the Esterfip-H method, illustrated in figure 7 [21]. The Esterfip reaction is conducted at a higher temperature and pressure than the base or acid-catalyzed reactions. The use of a solid catalyst, often consisting of a mixed zinc and aluminum oxide in the form of a bed, results in fewer purification steps necessary. Excess methanol is vaporized and recycled in a second reaction vessel which further increases the efficiency of the process. The esters are separated from glycerin in a settler and the glycerin is further purified by evaporation and the final purification of the FAME product takes place in an absorber where the last soluble glycerin is removed. Both the ester and the glycerin products are exceedingly pure from contamination, however, issues regarding the catalytic effect which might be reduced due to deposit accumulation in the metal bed and to the emergence of leachates have been revealed [21]. Other production techniques include enzymatic trans-esterification and esterification utilizing supercritical alcohols, however, these techniques require expensive reaction agents which limit the scale of production.
Figure 7: Simplified illustration of the Esterfip-H process, based on reference [69].
7
Reactors for biodiesel production are characterized as either batch or continuous reactors. Biodiesel is traditionally produced utilizing batch processing techniques; however, continuous processes offer high production capacities and low operational costs, therefore many manufacturers decide to switch to continuous facilities [21]. Feedstock utilized for biodiesel are generally oils from energy crops, such as rapeseed, soya or palm. In Europe, over 90% of the produced biodiesel is derived from rapeseed oil [6]. However, recent studies show that FAME could be commercially produced from inedible parts of plants or algae which are referred to as a second- or third-generation biofuel, although large-scale production is not expected until 2020 [25].
2.3 Properties of Biodiesel
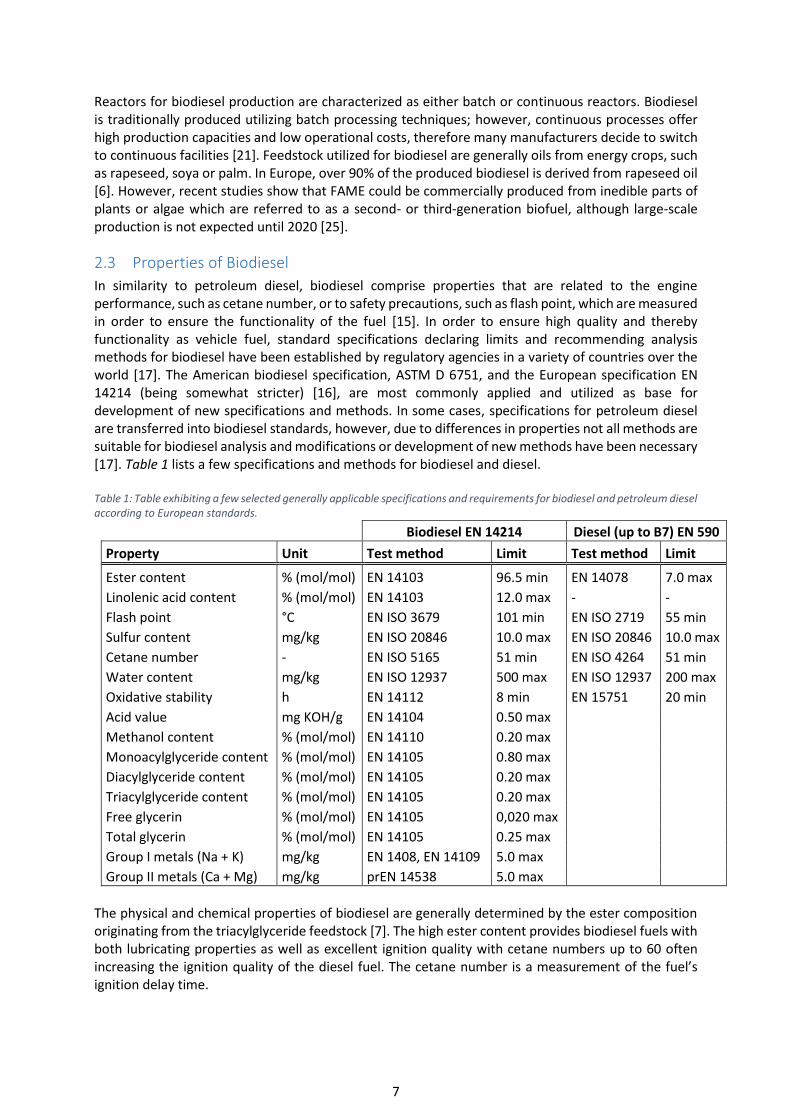
In similarity to petroleum diesel, biodiesel comprise properties that are related to the engine performance, such as cetane number, or to safety precautions, such as flash point, which are measured in order to ensure the functionality of the fuel [15]. In order to ensure high quality and thereby functionality as vehicle fuel, standard specifications declaring limits and recommending analysis methods for biodiesel have been established by regulatory agencies in a variety of countries over the world [17]. The American biodiesel specification, ASTM D 6751, and the European specification EN 14214 (being somewhat stricter) [16], are most commonly applied and utilized as base for development of new specifications and methods. In some cases, specifications for petroleum diesel are transferred into biodiesel standards, however, due to differences in properties not all methods are suitable for biodiesel analysis and modifications or development of new methods have been necessary [17]. Table 1 lists a few specifications and methods for biodiesel and diesel. Table 1: Table exhibiting a few selected generally applicable specifications and requirements for biodiesel and petroleum diesel according to European standards.
Biodiesel EN 14214 Diesel (up to B7) EN 590
Property Unit Test method Limit Test method Limit
Ester content % (mol/mol) EN 14103 96.5 min EN 14078 7.0 max
Linolenic acid content % (mol/mol) EN 14103 12.0 max - -
Flash point °C EN ISO 3679 101 min EN ISO 2719 55 min
Sulfur content mg/kg EN ISO 20846 10.0 max EN ISO 20846 10.0 max
Cetane number - EN ISO 5165 51 min EN ISO 4264 51 min
Water content mg/kg EN ISO 12937 500 max EN ISO 12937 200 max
Oxidative stability h EN 14112 8 min EN 15751 20 min
Acid value mg KOH/g EN 14104 0.50 max
Methanol content % (mol/mol) EN 14110 0.20 max
Monoacylglyceride content % (mol/mol) EN 14105 0.80 max
Diacylglyceride content % (mol/mol) EN 14105 0.20 max
Triacylglyceride content % (mol/mol) EN 14105 0.20 max
Free glycerin % (mol/mol) EN 14105 0,020 max
Total glycerin % (mol/mol) EN 14105 0.25 max
Group I metals (Na + K) mg/kg EN 1408, EN 14109 5.0 max
Group II metals (Ca + Mg) mg/kg prEN 14538 5.0 max
The physical and chemical properties of biodiesel are generally determined by the ester composition originating from the triacylglyceride feedstock [7]. The high ester content provides biodiesel fuels with both lubricating properties as well as excellent ignition quality with cetane numbers up to 60 often increasing the ignition quality of the diesel fuel. The cetane number is a measurement of the fuel’s ignition delay time.
8
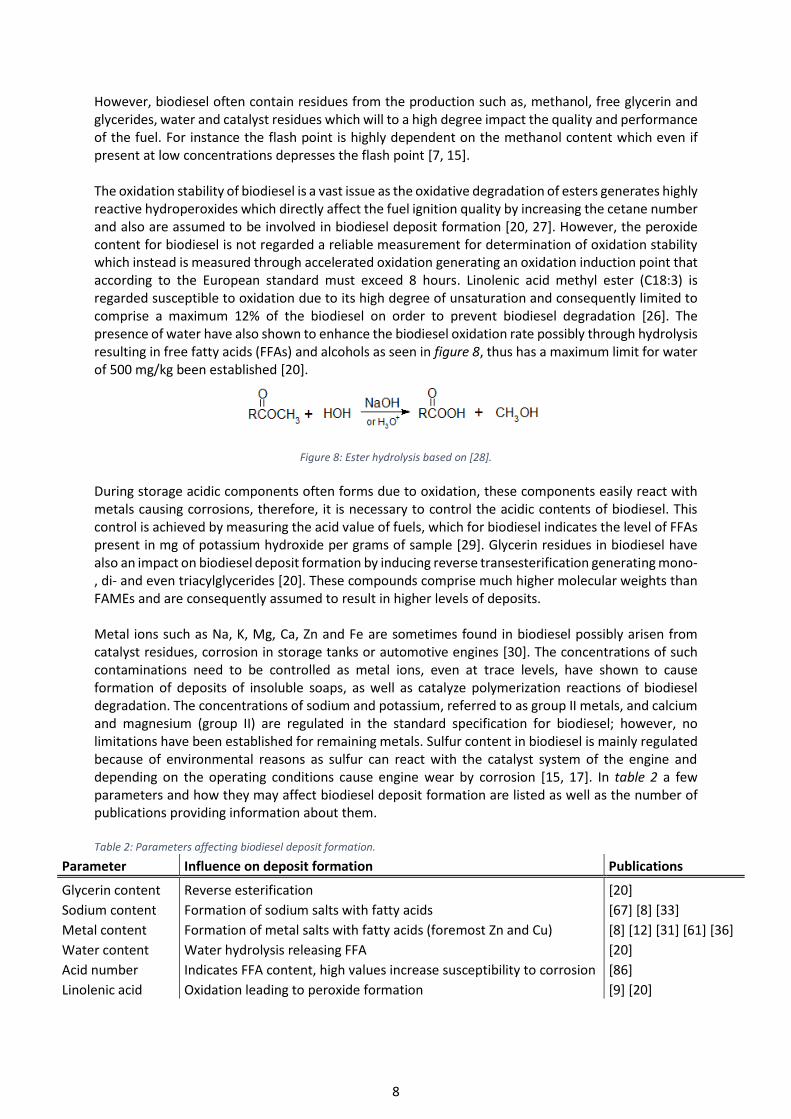
However, biodiesel often contain residues from the production such as, methanol, free glycerin and glycerides, water and catalyst residues which will to a high degree impact the quality and performance of the fuel. For instance the flash point is highly dependent on the methanol content which even if present at low concentrations depresses the flash point [7, 15]. The oxidation stability of biodiesel is a vast issue as the oxidative degradation of esters generates highly reactive hydroperoxides which directly affect the fuel ignition quality by increasing the cetane number and also are assumed to be involved in biodiesel deposit formation [20, 27]. However, the peroxide content for biodiesel is not regarded a reliable measurement for determination of oxidation stability which instead is measured through accelerated oxidation generating an oxidation induction point that according to the European standard must exceed 8 hours. Linolenic acid methyl ester (C18:3) is regarded susceptible to oxidation due to its high degree of unsaturation and consequently limited to comprise a maximum 12% of the biodiesel on order to prevent biodiesel degradation [26]. The presence of water have also shown to enhance the biodiesel oxidation rate possibly through hydrolysis resulting in free fatty acids (FFAs) and alcohols as seen in figure 8, thus has a maximum limit for water of 500 mg/kg been established [20].
Figure 8: Ester hydrolysis based on [28].
During storage acidic components often forms due to oxidation, these components easily react with metals causing corrosions, therefore, it is necessary to control the acidic contents of biodiesel. This control is achieved by measuring the acid value of fuels, which for biodiesel indicates the level of FFAs present in mg of potassium hydroxide per grams of sample [29]. Glycerin residues in biodiesel have also an impact on biodiesel deposit formation by inducing reverse transesterification generating mono-, di- and even triacylglycerides [20]. These compounds comprise much higher molecular weights than FAMEs and are consequently assumed to result in higher levels of deposits. Metal ions such as Na, K, Mg, Ca, Zn and Fe are sometimes found in biodiesel possibly arisen from catalyst residues, corrosion in storage tanks or automotive engines [30]. The concentrations of such contaminations need to be controlled as metal ions, even at trace levels, have shown to cause formation of deposits of insoluble soaps, as well as catalyze polymerization reactions of biodiesel degradation. The concentrations of sodium and potassium, referred to as group II metals, and calcium and magnesium (group II) are regulated in the standard specification for biodiesel; however, no limitations have been established for remaining metals. Sulfur content in biodiesel is mainly regulated because of environmental reasons as sulfur can react with the catalyst system of the engine and depending on the operating conditions cause engine wear by corrosion [15, 17]. In table 2 a few parameters and how they may affect biodiesel deposit formation are listed as well as the number of publications providing information about them. Table 2: Parameters affecting biodiesel deposit formation.
Parameter Influence on deposit formation Publications
Glycerin content Reverse esterification [20]
Sodium content Formation of sodium salts with fatty acids [67] [8] [33]
Metal content Formation of metal salts with fatty acids (foremost Zn and Cu) [8] [12] [31] [61] [36]
Water content Water hydrolysis releasing FFA [20]
Acid number Indicates FFA content, high values increase susceptibility to corrosion [86]
Linolenic acid Oxidation leading to peroxide formation [9] [20]
9
2.4 Biodiesel Degradation and Deposition
The diesel engine industry has long been struggling with the problem of deposit formation in injectors and fuel filters and the increasing utilization of biodiesel has heightened the issue. As the appearance of deposits has not correlated with any particular engine type or geographical area researchers are convinced that deposit precursors originates from the fuel [13]. Water contamination, additives, dirt, metals or glycerin residues in the fuel and biodiesel degradation are all examples of suggested causes to deposit formation. However, the extreme conditions in the rapidly evolved diesel engines often consisting of highly efficient common rail systems comprising multiple injectors and employing fuel recirculation are also of importance for the deposit formation [12]. During injection the pressure in the combustion chamber may rise up to 300 MPa (approximately 43500 psi) along with a temperature increase of approximately 100°C inducing thermal stress even to the fuel that is not entering the combustion chamber. Biodiesel deposits are most prominent around the nozzle hole of the injector and within the injector body where the fuel pressure is released. These biodiesel deposits disturbs the injector dynamics and could affect the spray pattern into the combustion chamber, consequently decreasing the combustion efficiency immensely, resulting in increased emissions of smoke and soot [13]. The fuel deposits are commonly divided into soft metal carboxylate soap deposits and hard polymeric lacquers where carboxylate salt deposits are the most prevalent group while the hard lacquers are more difficult to remove [12]. However, both sorts of deposits are presumed to arise from oxidative or thermal degradation of FAMEs which are not combusted [12, 35 and 36].
2.4.1 Oxidative Degradation
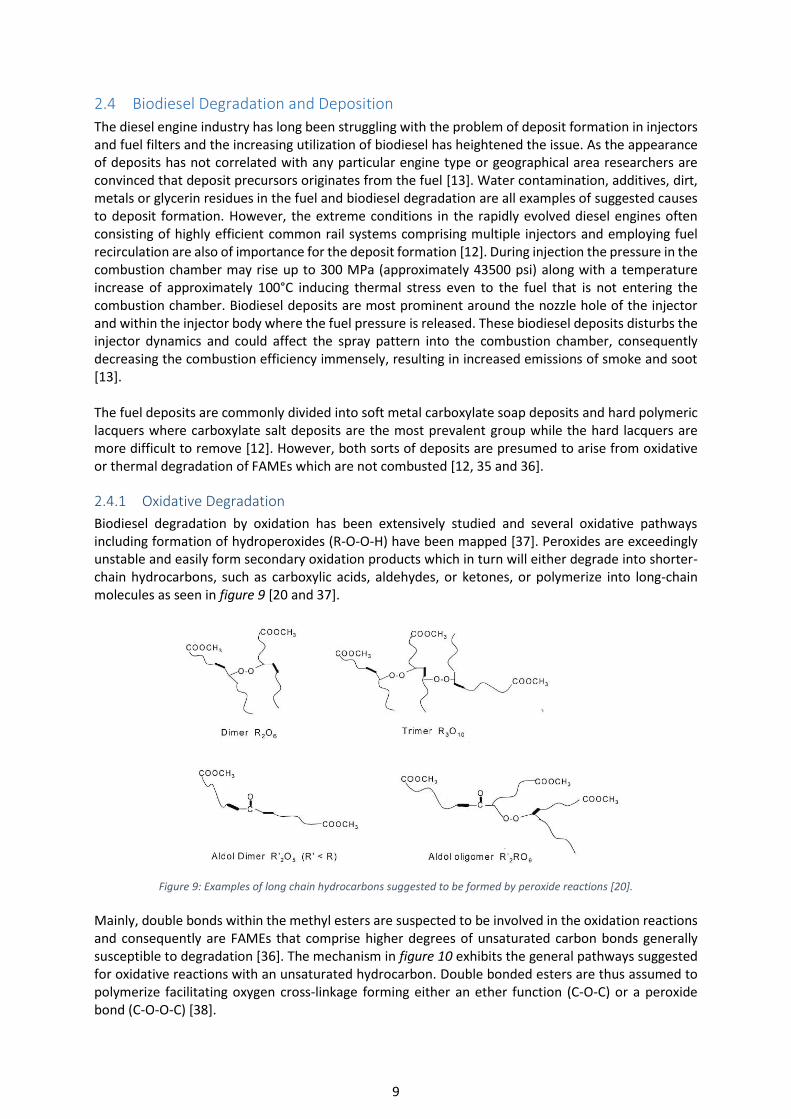
Biodiesel degradation by oxidation has been extensively studied and several oxidative pathways including formation of hydroperoxides (R-O-O-H) have been mapped [37]. Peroxides are exceedingly unstable and easily form secondary oxidation products which in turn will either degrade into shorter-chain hydrocarbons, such as carboxylic acids, aldehydes, or ketones, or polymerize into long-chain molecules as seen in figure 9 [20 and 37].
Figure 9: Examples of long chain hydrocarbons suggested to be formed by peroxide reactions [20].
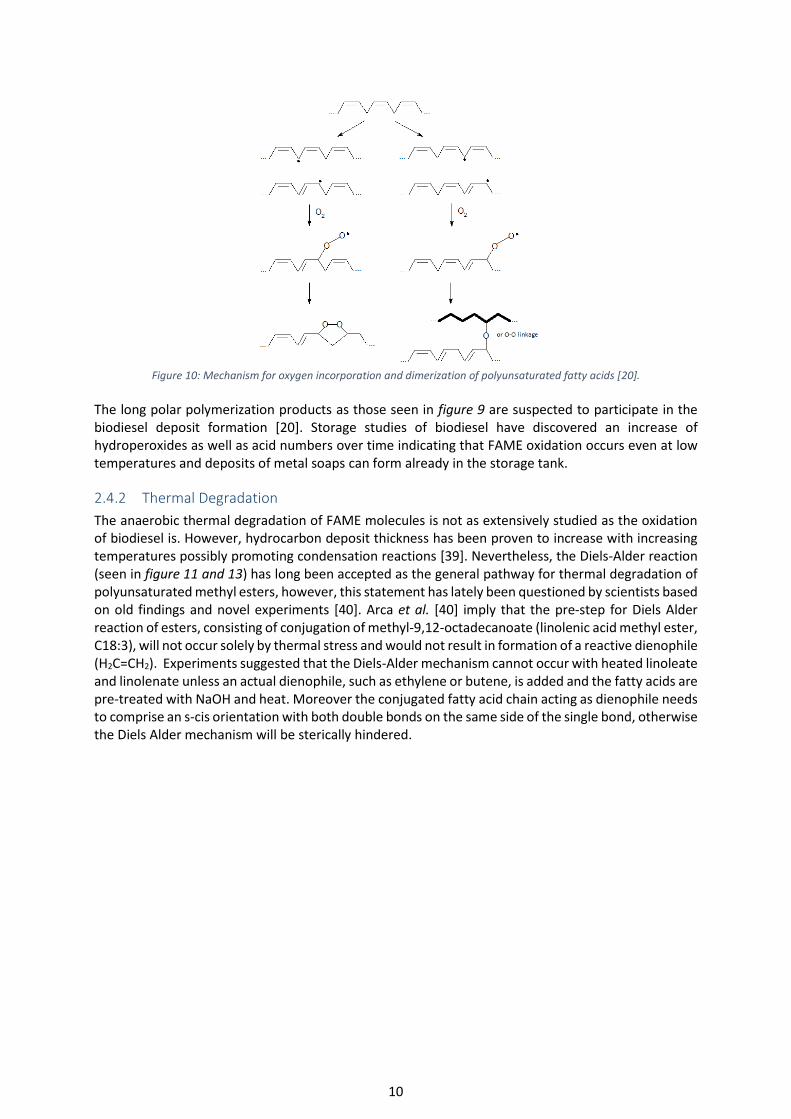
Mainly, double bonds within the methyl esters are suspected to be involved in the oxidation reactions and consequently are FAMEs that comprise higher degrees of unsaturated carbon bonds generally susceptible to degradation [36]. The mechanism in figure 10 exhibits the general pathways suggested for oxidative reactions with an unsaturated hydrocarbon. Double bonded esters are thus assumed to polymerize facilitating oxygen cross-linkage forming either an ether function (C-O-C) or a peroxide bond (C-O-O-C) [38].
10
Figure 10: Mechanism for oxygen incorporation and dimerization of polyunsaturated fatty acids [20].
The long polar polymerization products as those seen in figure 9 are suspected to participate in the biodiesel deposit formation [20]. Storage studies of biodiesel have discovered an increase of hydroperoxides as well as acid numbers over time indicating that FAME oxidation occurs even at low temperatures and deposits of metal soaps can form already in the storage tank.
2.4.2 Thermal Degradation
The anaerobic thermal degradation of FAME molecules is not as extensively studied as the oxidation of biodiesel is. However, hydrocarbon deposit thickness has been proven to increase with increasing temperatures possibly promoting condensation reactions [39]. Nevertheless, the Diels-Alder reaction (seen in figure 11 and 13) has long been accepted as the general pathway for thermal degradation of polyunsaturated methyl esters, however, this statement has lately been questioned by scientists based on old findings and novel experiments [40]. Arca et al. [40] imply that the pre-step for Diels Alder reaction of esters, consisting of conjugation of methyl-9,12-octadecanoate (linolenic acid methyl ester, C18:3), will not occur solely by thermal stress and would not result in formation of a reactive dienophile (H2C=CH2). Experiments suggested that the Diels-Alder mechanism cannot occur with heated linoleate and linolenate unless an actual dienophile, such as ethylene or butene, is added and the fatty acids are pre-treated with NaOH and heat. Moreover the conjugated fatty acid chain acting as dienophile needs to comprise an s-cis orientation with both double bonds on the same side of the single bond, otherwise the Diels Alder mechanism will be sterically hindered.
11
Figure 11: Diels-Alder reaction of Linolenic acid [41].
Arca et al. [40] suggest two polymerization mechanisms induced by thermal stress to be plausible. Either high temperatures cause radical reactions giving rise to intramolecular hydrogen transfers yielding long and highly reactive hydrocarbons or a traditional ene-reaction occurs, as illustrated in figure 12.
Figure 12: Illustration of general ene-mechanism, the R-chains represent alkyl, ester or carboxyl acids, based on reference
[42].
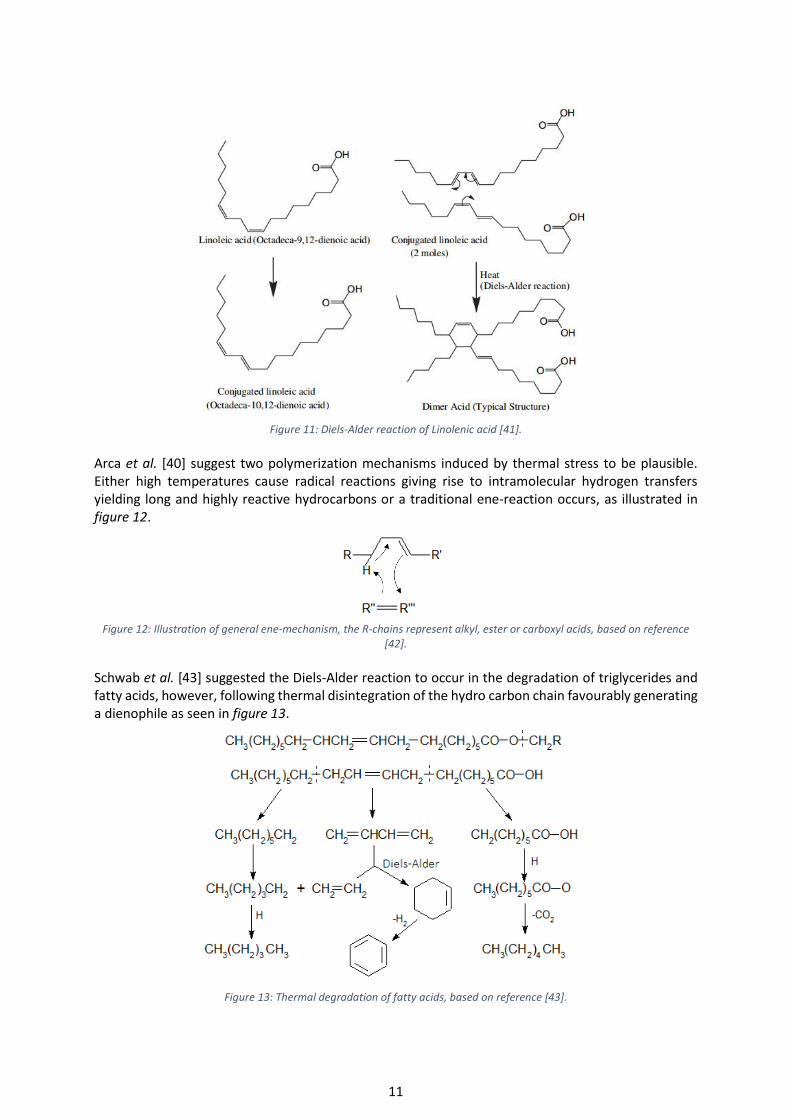
Schwab et al. [43] suggested the Diels-Alder reaction to occur in the degradation of triglycerides and fatty acids, however, following thermal disintegration of the hydro carbon chain favourably generating a dienophile as seen in figure 13.
Figure 13: Thermal degradation of fatty acids, based on reference [43].
12
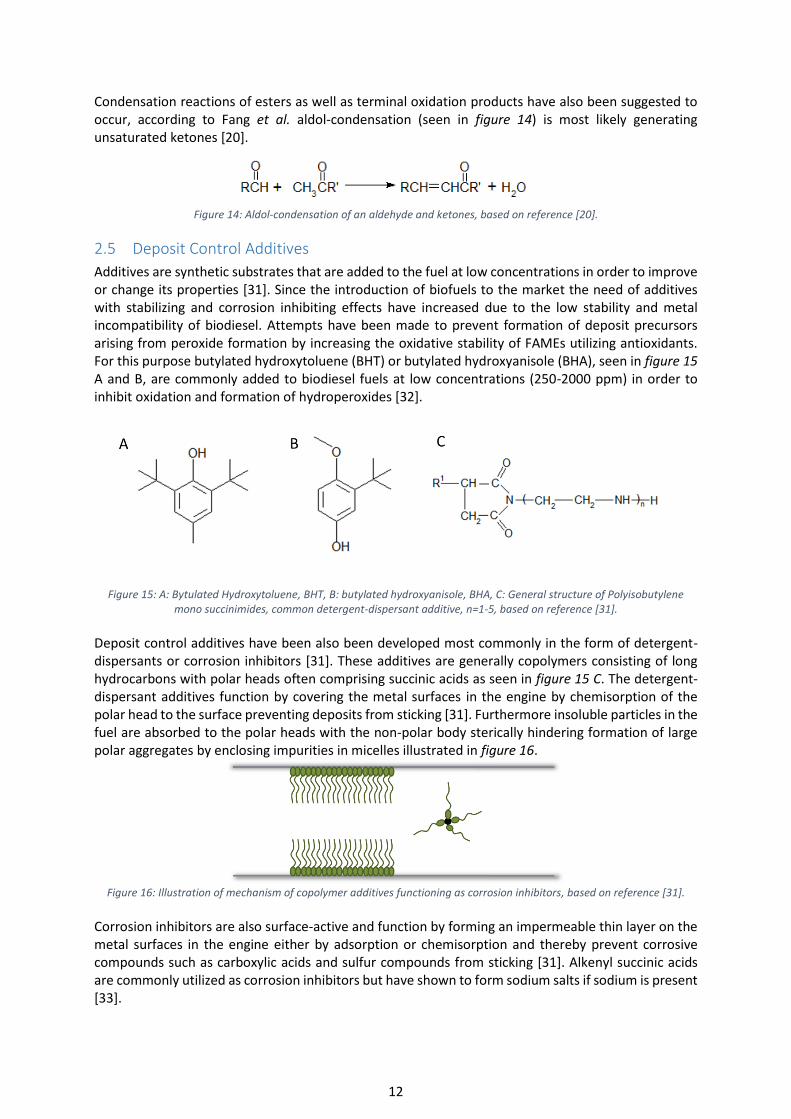
Condensation reactions of esters as well as terminal oxidation products have also been suggested to occur, according to Fang et al. aldol-condensation (seen in figure 14) is most likely generating unsaturated ketones [20].
Figure 14: Aldol-condensation of an aldehyde and ketones, based on reference [20].
2.5 Deposit Control Additives
Additives are synthetic substrates that are added to the fuel at low concentrations in order to improve or change its properties [31]. Since the introduction of biofuels to the market the need of additives with stabilizing and corrosion inhibiting effects have increased due to the low stability and metal incompatibility of biodiesel. Attempts have been made to prevent formation of deposit precursors arising from peroxide formation by increasing the oxidative stability of FAMEs utilizing antioxidants. For this purpose butylated hydroxytoluene (BHT) or butylated hydroxyanisole (BHA), seen in figure 15 A and B, are commonly added to biodiesel fuels at low concentrations (250-2000 ppm) in order to inhibit oxidation and formation of hydroperoxides [32].
Figure 15: A: Bytulated Hydroxytoluene, BHT, B: butylated hydroxyanisole, BHA, C: General structure of Polyisobutylene mono succinimides, common detergent-dispersant additive, n=1-5, based on reference [31].
Deposit control additives have been also been developed most commonly in the form of detergent-dispersants or corrosion inhibitors [31]. These additives are generally copolymers consisting of long hydrocarbons with polar heads often comprising succinic acids as seen in figure 15 C. The detergent-dispersant additives function by covering the metal surfaces in the engine by chemisorption of the polar head to the surface preventing deposits from sticking [31]. Furthermore insoluble particles in the fuel are absorbed to the polar heads with the non-polar body sterically hindering formation of large polar aggregates by enclosing impurities in micelles illustrated in figure 16.
Figure 16: Illustration of mechanism of copolymer additives functioning as corrosion inhibitors, based on reference [31].
Corrosion inhibitors are also surface-active and function by forming an impermeable thin layer on the metal surfaces in the engine either by adsorption or chemisorption and thereby prevent corrosive compounds such as carboxylic acids and sulfur compounds from sticking [31]. Alkenyl succinic acids are commonly utilized as corrosion inhibitors but have shown to form sodium salts if sodium is present [33].
13
Polar/non-polar copolymers are also utilized as pour point depressants or wax inhibitors in crude oil functioning by co-crystallization of paraffins, forming large complexes, with the non-polar part and sterically hindering further crystallization [34]. This type of additive might also be effective for minimizing formation of biodiesel deposits, however, no studies have yet been conducted for this purpose.
2.6 Techniques for Biodiesel Analysis
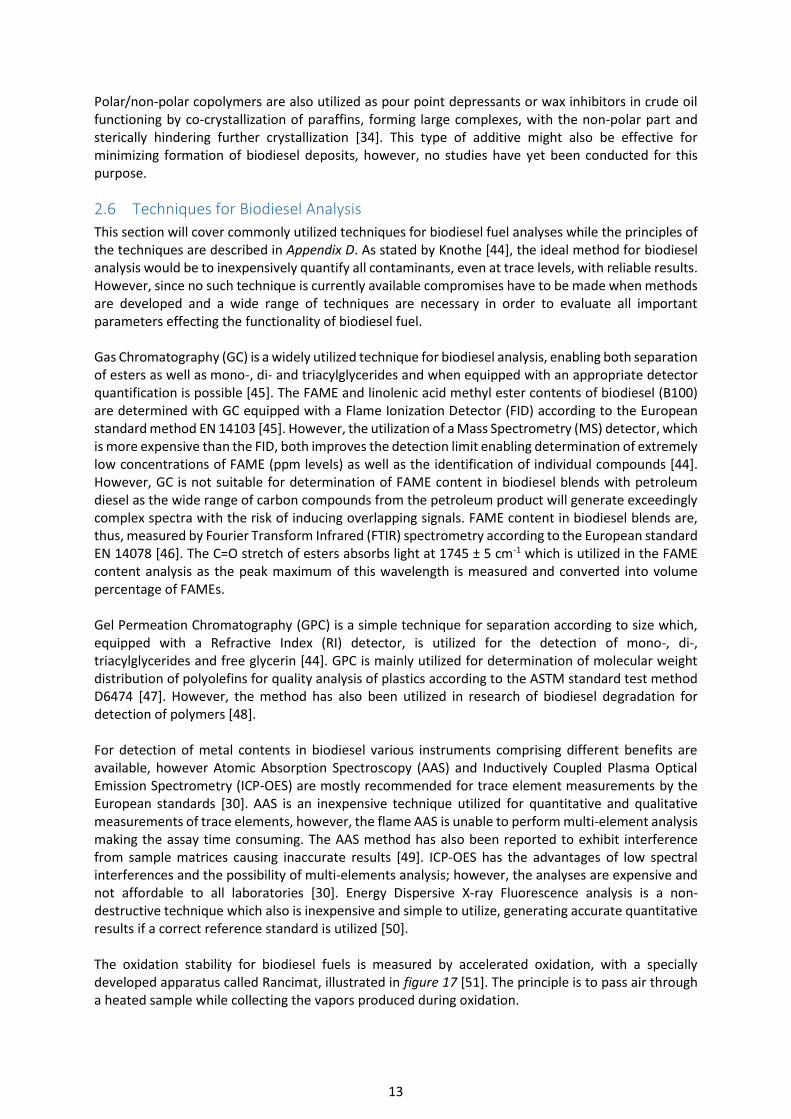
This section will cover commonly utilized techniques for biodiesel fuel analyses while the principles of the techniques are described in Appendix D. As stated by Knothe [44], the ideal method for biodiesel analysis would be to inexpensively quantify all contaminants, even at trace levels, with reliable results. However, since no such technique is currently available compromises have to be made when methods are developed and a wide range of techniques are necessary in order to evaluate all important parameters effecting the functionality of biodiesel fuel. Gas Chromatography (GC) is a widely utilized technique for biodiesel analysis, enabling both separation of esters as well as mono-, di- and triacylglycerides and when equipped with an appropriate detector quantification is possible [45]. The FAME and linolenic acid methyl ester contents of biodiesel (B100) are determined with GC equipped with a Flame Ionization Detector (FID) according to the European standard method EN 14103 [45]. However, the utilization of a Mass Spectrometry (MS) detector, which is more expensive than the FID, both improves the detection limit enabling determination of extremely low concentrations of FAME (ppm levels) as well as the identification of individual compounds [44]. However, GC is not suitable for determination of FAME content in biodiesel blends with petroleum diesel as the wide range of carbon compounds from the petroleum product will generate exceedingly complex spectra with the risk of inducing overlapping signals. FAME content in biodiesel blends are, thus, measured by Fourier Transform Infrared (FTIR) spectrometry according to the European standard EN 14078 [46]. The C=O stretch of esters absorbs light at 1745 ± 5 cm-1 which is utilized in the FAME content analysis as the peak maximum of this wavelength is measured and converted into volume percentage of FAMEs. Gel Permeation Chromatography (GPC) is a simple technique for separation according to size which, equipped with a Refractive Index (RI) detector, is utilized for the detection of mono-, di-, triacylglycerides and free glycerin [44]. GPC is mainly utilized for determination of molecular weight distribution of polyolefins for quality analysis of plastics according to the ASTM standard test method D6474 [47]. However, the method has also been utilized in research of biodiesel degradation for detection of polymers [48]. For detection of metal contents in biodiesel various instruments comprising different benefits are available, however Atomic Absorption Spectroscopy (AAS) and Inductively Coupled Plasma Optical Emission Spectrometry (ICP-OES) are mostly recommended for trace element measurements by the European standards [30]. AAS is an inexpensive technique utilized for quantitative and qualitative measurements of trace elements, however, the flame AAS is unable to perform multi-element analysis making the assay time consuming. The AAS method has also been reported to exhibit interference from sample matrices causing inaccurate results [49]. ICP-OES has the advantages of low spectral interferences and the possibility of multi-elements analysis; however, the analyses are expensive and not affordable to all laboratories [30]. Energy Dispersive X-ray Fluorescence analysis is a non-destructive technique which also is inexpensive and simple to utilize, generating accurate quantitative results if a correct reference standard is utilized [50]. The oxidation stability for biodiesel fuels is measured by accelerated oxidation, with a specially developed apparatus called Rancimat, illustrated in figure 17 [51]. The principle is to pass air through a heated sample while collecting the vapors produced during oxidation.
14
The stream of air carries the oxidation products into a flask containing distilled water as well as an electrode which measures the conductivity. A rapid increase in conductivity induced by the increase of volatile carboxylic acids in the water generates an Induction Point (IP), expressed in hours, which indicates the oxidation resistance of the sample. This method will however not make allowances for biodiesel deposit formation as the heavy acids that may form during oxidation are not transferred to the water.
Figure 17: Illustration of assembled oxidation stability measurement apparatus.
The oxidation induction time for lubricating oils is measured by pressurized Differential Scanning Calorimetry (pDSC) according to the standard method ASTM D6186 [52]. However, research has been made in order to exploit the possibilities of utilizing pDSC for biodiesel oxidation time measurements as well [53]. As pDSC measures the exothermal effects directly in the sample this technique enables detection of oxidation products that when formed in Rancimat would remain in the liquid phase and therefore stay undetected.
2.7 Techniques for Biodiesel Deposit Analysis
Biodiesel deposits have been studied by many groups of scientists [13, 20 and 20]. Generally, the deposits are formed by simulating the conditions of an in-field diesel engine either by utilization of an actual engine or specially designed instruments [13]. A suitable apparatus for studies of deposit formations is the Jet Fuel Thermal Oxidation Tester (JFTOT) which normally is utilized for determination of oxidative stability of jet fuels according to ASTM D3241 [39]. The principal of the technique is merely to pass the fuel sample through a heater tube housing containing a test tube (usually steel or aluminum) which is heated electronically. The degree of deposits is then evaluated visually. Furthermore, ellipsometry and Scanning Electron Microscopy (SEM) can be been utilized for determination of deposit thickness in analyses of jet fuel deposits [72].
2.7.1 Hot Liquid Process Simulator (HLPS)
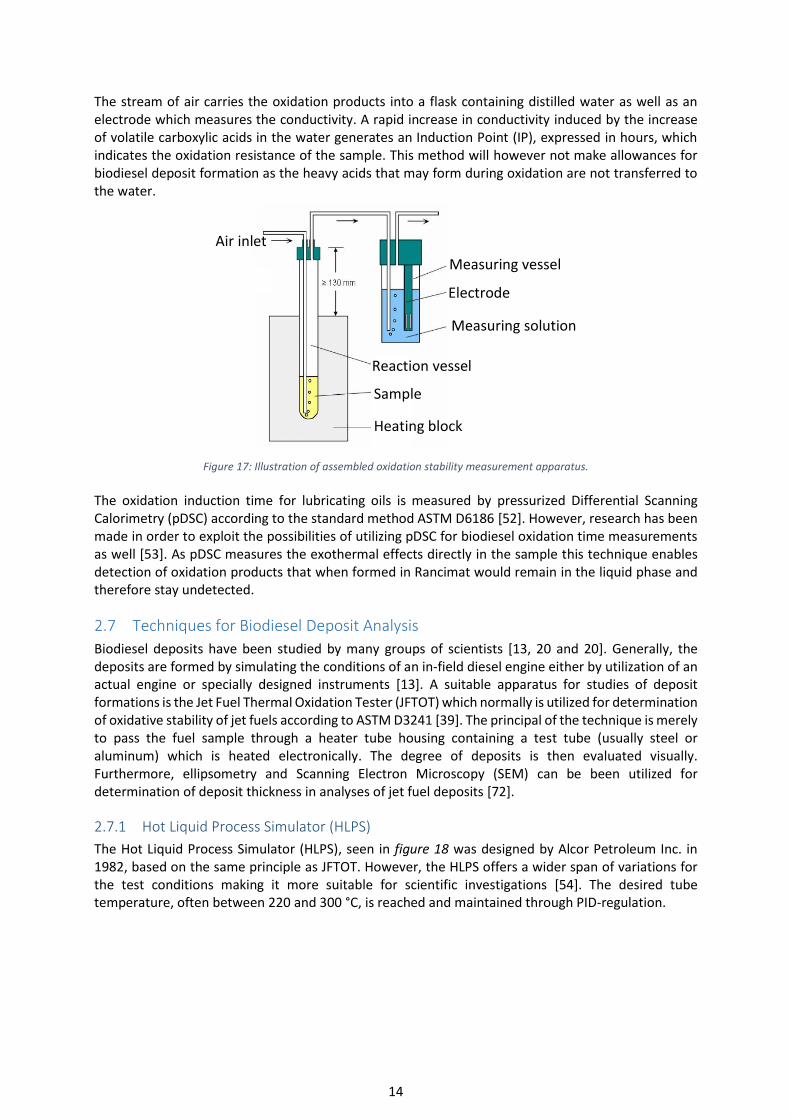
The Hot Liquid Process Simulator (HLPS), seen in figure 18 was designed by Alcor Petroleum Inc. in 1982, based on the same principle as JFTOT. However, the HLPS offers a wider span of variations for the test conditions making it more suitable for scientific investigations [54]. The desired tube temperature, often between 220 and 300 °C, is reached and maintained through PID-regulation.
Measuring vessel
Electrode
Measuring solution
Heating block
Sample
Reaction vessel
Air inlet
15
Figure 18: Illustration of the Hot Liquid Process Simulator to the left, heater tube housing to the right from the Hot Liquid
Process Simulator User’s manual (Alcor Petroleum Instruments Inc., Westbury, New York, United States of America).
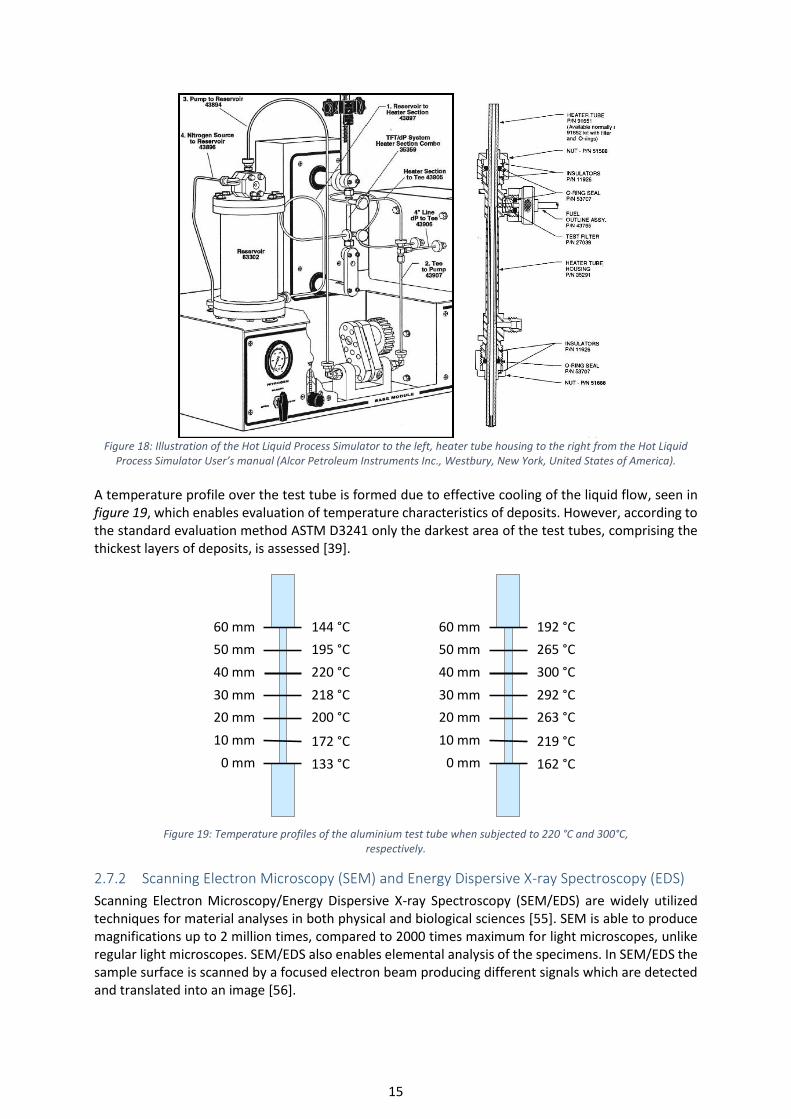
A temperature profile over the test tube is formed due to effective cooling of the liquid flow, seen in figure 19, which enables evaluation of temperature characteristics of deposits. However, according to the standard evaluation method ASTM D3241 only the darkest area of the test tubes, comprising the thickest layers of deposits, is assessed [39].
2.7.2 Scanning Electron Microscopy (SEM) and Energy Dispersive X-ray Spectroscopy (EDS)
Scanning Electron Microscopy/Energy Dispersive X-ray Spectroscopy (SEM/EDS) are widely utilized techniques for material analyses in both physical and biological sciences [55]. SEM is able to produce magnifications up to 2 million times, compared to 2000 times maximum for light microscopes, unlike regular light microscopes. SEM/EDS also enables elemental analysis of the specimens. In SEM/EDS the sample surface is scanned by a focused electron beam producing different signals which are detected and translated into an image [56].
144 °C
195 °C
220 °C
218 °C
200 °C
172 °C
133 °C
60 mm
50 mm
40 mm
30 mm
20 mm
10 mm
0 mm
192 °C
265 °C
300 °C
292 °C
263 °C
219 °C
162 °C
60 mm
50 mm
40 mm
30 mm
20 mm
10 mm
0 mm
Figure 19: Temperature profiles of the aluminium test tube when subjected to 220 °C and 300°C, respectively.

16
Secondary electrons, emitted from the outermost atoms of the surface, backscattered electrons (electrons returning from the sample), and X-rays are detected and analyzed with SEM and EDS. The secondary electrons produce a high resolution image depending on the diminutive diameter of the electron beam and surface structure affecting the image contrast. Thus, the detection of secondary electrons is vital in order to obtain high quality images. Backscattered electrons are emitted from atoms deeper in the sample resulting in lower resolution images. However, the detection of backscattered electrons enables exposure of different chemical phases in the sample as the contrast in the image depends on the size of the atom nucleus from which the electron is backscattered. The SEM analyses are dependent on samples comprising conductive properties, otherwise the samples might charge and cause deviations in the electron beam. Therefore biological samples with low conductivity often need to be coated with a conductive material such as gold or carbon. The X-ray emissions, originating from shell transitions induced by atom interactions with the electron beam, are detected with EDS. The emitted X-rays enables elemental analysis as the energy of the X-rays differs between elements. The sampling depth is 1-2 microns and the method allows both qualitative and quantitative analysis, however for accurate quantitative analysis the instrument needs to be calibrated with adequate standards.
17
3 Materials and Methods This section will introduce the samples and explain the experimental details of all methods utilized in this study. The laboratory process was conducted through a laboratory plan where deposits were formed by HLPS-runs. Both unused and processed samples were collected from each run for further analysis of FAME content, sodium and copper content, polymerized ester content and peroxide content, all in extent of time. As the double bonded esters were suspected to degrade in a higher extent than saturated FAMEs measuring the ester composition was priority. The deposits were analyzed by SEM and ATR-FTIR before the deposits were solved with tetrahydrofuran (THF) and analyzed with GCMS. Further studies of polymerized ester products were conducted with GPC. All samples were prepared immediately prior to the HLPS runs, however, the additive had to be preheated to 60°C for 30 minutes before mixing into preheated sample in order to receive a proper mixture.
3.1 Biodiesel Samples
All biodiesel samples utilized in this study were produced in Sweden and supplied without addition of additives. Two rapeseed methyl esters (RME), from large-scale producers, one FAME-product derived from waste cocking oil (WCO) from a small-scale producer and one biodiesel blend, B7, with Swedish petroleum diesel (environmental class 1) were utilized in this study; the samples are listed below in table 3. Table 3: Designations and descriptions of the biodiesel samples utilized in this study.
A RME produced in a large-scale continuous process through the Esterfip-H method.
B RME produced in a large-scale continuous process through homologous base-catalyzed esterification.
C Biodiesel derived from waste cooking oil through a homologous base-catalyzed small-scale batch process.
D 7% of fuel A blended in Swedish MK1 mineral diesel.
Fuel A is produced by the Esterfip-H method, where a solid metal catalyst is utilized instead of sodium or potassium hydroxide, resulting in an exceedingly pure FAME product as well as salt-free glycerin. The production rate is approximately 15 tons per hour. Fuel B is also produced through a continuous process with a production rate of approximately 6 tons per hour, thus, utilizing potassium hydroxide as catalyst. The potassium hydroxide and phosphates are ejected in the glycerin phase. The glycerin is normally utilized as fertilizer. Fuel C, that is derived from waste cooking oil is produced through base-catalyzed transesterification in a batch process, utilizing potassium hydroxide as catalyst, this ester product is utilized only for combustion for heat. The batch size and reaction time are approximately 2000 L and 24 hours respectively. As waste cooking oil comprises a large content of free fatty acids the feedstock needs to be neutralized before esterification which is performed by addition of sulfuric acid.
3.2 Qualitative Analyses of Biodiesel
A reduced quality analysis, only including control of factors presumed to influence or indicate the fuels propensity to form deposits, was performed. The analyses were performed according to the European (EN 14214:2012) and American standard (ASTM D6751 -12) specifications for biodiesel when possible. However, in the absence of suitable equipment other methods established at Exova where utilized. [26]
18
3.2.1 FAME Content and Composition with GC-FID and FTIR
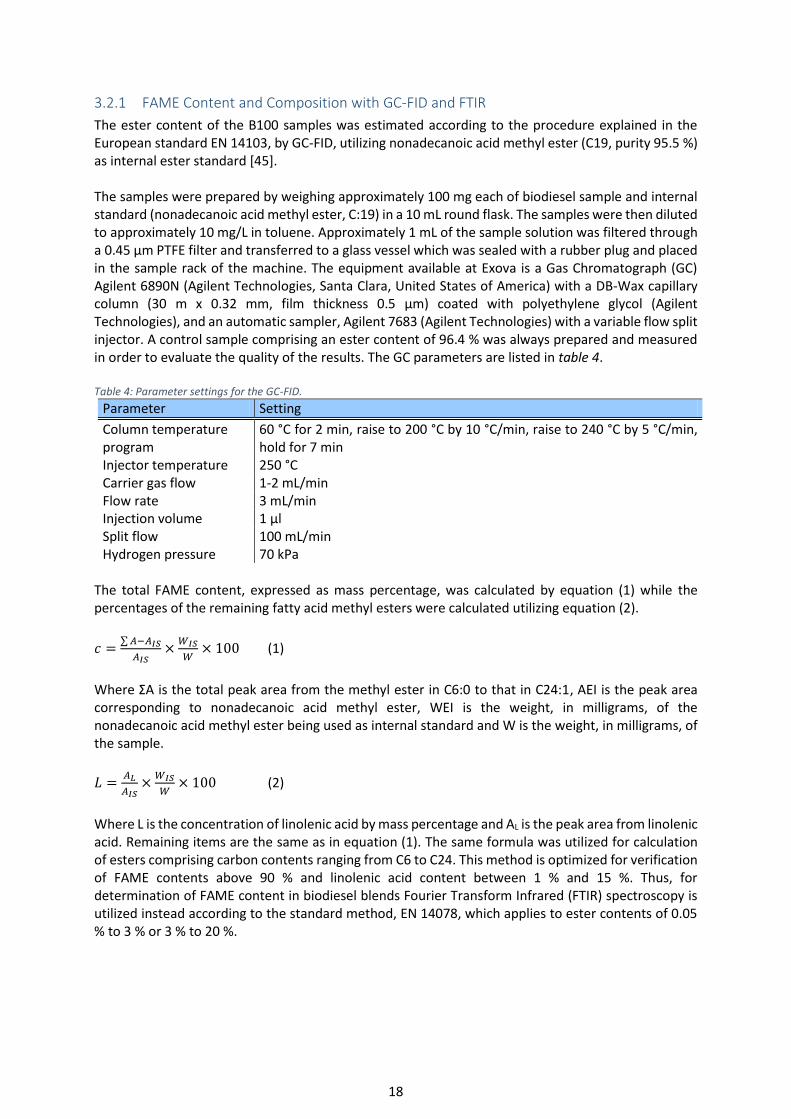
The ester content of the B100 samples was estimated according to the procedure explained in the European standard EN 14103, by GC-FID, utilizing nonadecanoic acid methyl ester (C19, purity 95.5 %) as internal ester standard [45]. The samples were prepared by weighing approximately 100 mg each of biodiesel sample and internal standard (nonadecanoic acid methyl ester, C:19) in a 10 mL round flask. The samples were then diluted to approximately 10 mg/L in toluene. Approximately 1 mL of the sample solution was filtered through a 0.45 µm PTFE filter and transferred to a glass vessel which was sealed with a rubber plug and placed in the sample rack of the machine. The equipment available at Exova is a Gas Chromatograph (GC) Agilent 6890N (Agilent Technologies, Santa Clara, United States of America) with a DB-Wax capillary column (30 m x 0.32 mm, film thickness 0.5 µm) coated with polyethylene glycol (Agilent Technologies), and an automatic sampler, Agilent 7683 (Agilent Technologies) with a variable flow split injector. A control sample comprising an ester content of 96.4 % was always prepared and measured in order to evaluate the quality of the results. The GC parameters are listed in table 4. Table 4: Parameter settings for the GC-FID.
Parameter Setting
Column temperature program
60 °C for 2 min, raise to 200 °C by 10 °C/min, raise to 240 °C by 5 °C/min, hold for 7 min
Injector temperature 250 °C Carrier gas flow 1-2 mL/min Flow rate 3 mL/min Injection volume 1 μl Split flow 100 mL/min Hydrogen pressure 70 kPa
The total FAME content, expressed as mass percentage, was calculated by equation (1) while the percentages of the remaining fatty acid methyl esters were calculated utilizing equation (2).
𝑐 =∑ 𝐴−𝐴𝐼𝑆
𝐴𝐼𝑆×
𝑊𝐼𝑆
𝑊× 100 (1)
Where ΣA is the total peak area from the methyl ester in C6:0 to that in C24:1, AEI is the peak area corresponding to nonadecanoic acid methyl ester, WEI is the weight, in milligrams, of the nonadecanoic acid methyl ester being used as internal standard and W is the weight, in milligrams, of the sample.
𝐿 =𝐴𝐿
𝐴𝐼𝑆×
𝑊𝐼𝑆
𝑊× 100 (2)
Where L is the concentration of linolenic acid by mass percentage and AL is the peak area from linolenic acid. Remaining items are the same as in equation (1). The same formula was utilized for calculation of esters comprising carbon contents ranging from C6 to C24. This method is optimized for verification of FAME contents above 90 % and linolenic acid content between 1 % and 15 %. Thus, for determination of FAME content in biodiesel blends Fourier Transform Infrared (FTIR) spectroscopy is utilized instead according to the standard method, EN 14078, which applies to ester contents of 0.05 % to 3 % or 3 % to 20 %.
19
The FAME content of the B7 sample was determined according to EN 14078 utilizing FTIR, the instrument was a Spectrum GX-FTIR Spectrometer from Perkin Elmer (Perkin Elmer, Waltham, Massachusetts, United States of America). The biodiesel sample was diluted 1:5 with FAME free petroleum diesel which was also utilized to obtain a background spectrum. The measuring cell was washed with cyclohexane and dried before the sample was added, the absorbance at 1745 ± 5 cm-1 was then measured. A control sample was run before the actual sample in order to confirm the accuracy of the calibration curve. A FAME free middle distillate is utilized as background and for dilution of samples. All calculations were conducted by the FTIR software which utilizes a fixed density of FAME of 883 kg/m3 (15 °C).
3.2.2 Oxidation Stability with Rancimat
The apparatus utilized for oxidation stability measurements at Exova is an 873 Biodiesel Rancimat (Metrohm Ltd., Herisau, Switzerland). The analysis was conducted by placing 3 g of biodiesel in two test tubes each as double measurements were performed. The measuring flask was filled with distilled water and the apparatus was assembled according to figure 17 (section 3). The measurements were stopped as the conductivity reached 200 μS/cm.
3.2.3 Contents of Elements with ICP-OES, ED-XRF and AAS
At Exova standard methods for analysis of different elements have been developed with various instruments and adapted to give as accurate results as possible for specific elements. Sulfur content was measured utilizing the established methods at Exova with ED-XRF, sodium and potassium contents were measured by AAS and remaining metal contents (such as Cu, Al and Zn) were measured by ICP-OES. The ICP-OES apparatus available at the Exova facilities is a Varian 725-ES (Varian Inc. now Agilent Technologies, Santa Clara, United States of America) utilizing a charge coupled device (CCD) as detector. The XRF instrument available at the Exova facilities is a Spectro iQ II Benchtop (Spectro, Ametek, Kleve, Germany). The method is very effective and accurate. The AAS instrument available at Exova facilities is a Solaar 929 (Unicam, Cambridge, United Kingdom), light source is a sodium and potassium multi-element hollow cathode lamp (Heraus, Cambridge, United Kingdom). The samples did not require any dilution because of the low concentrations of the elements measured.
3.2.4 Water content by Karl Fischer Titration
Traditional coulometric Karl Fischer titration was utilized for determination of water contents in biodiesel according to the American standard E1064. Karl Fischer titration is based on the anode oxidation of iodide (I-) generating iodine (I2) which reacts with water in the presence of an alcohol, SO2 and a base (B) seen in reactions (3) and (4) [57]. When methanol is utilized as solvent the molar conditions of water to I2 is 1:1 and one mol of water corresponds to two electrons. ROH + SO2 + B BH+ + ROSO2
- (3) H2O + I2 + ROSO2
- + 2B ROSO3- + 2BH+I- (4)
Before equilibrium is reached I2 is consumed in reaction (4), however, at the end of the titration I2 suddenly appears in an excess which changes the resistance in the solvent [57]. The end point is detected bipotentiometrically, as a detector circuit measures the voltage needed to maintain a certain current between the electrodes. When the voltage abruptly drops equilibrium has been reached and the water content in the sample is calculated according to equation (5).
𝑊𝑎𝑡𝑒𝑟 𝑐𝑜𝑛𝑡𝑒𝑛𝑡 (%) = 𝜇𝑔 𝑤𝑎𝑡𝑒𝑟 𝑓𝑜𝑢𝑛𝑑
𝑔 𝑠𝑎𝑚𝑝𝑙𝑒 ×10 000 (5)
20
The analysis was conducted using a Metrohm 684 KF Coloumeter (Metrohm, Herisau, Switzerland) by adding approximately 1 mL of sample to the Karl Fischer titration vessel with a syringe. The weight of the sample was measured and entered to the apparatus which automatically calculated the water content according to equation Y.
3.2.5 Peroxide Number by Titration
The peroxide contents were measured through titration with aqueous sodium thiosulfate solution in the presence of potassium iodide, according to the American standard D3703 which normally applies to aviation fuels, gasoline and diesel fuels [58]. However, no precision data for peroxide measurements of biodiesel are reported in the standard due to high variability in the results within and between laboratories, possibly indicating that this method is not fully applicable for biodiesel. The method measures the amount of iodine (I2) formed by reaction (6). The addition of starch will rapidly turn the solution blue as starch-iodine complexes are formed and the mixture is then titrated. First, a 300 mL flask was flushed with nitrogen gas before approximately 5 grams of biodiesel sample was added and the exact sample mass was entered in the dosimeter. 25 mL of tetrachlorethylen were added to the sample which then rested for one minute with a steady nitrogen flow before 20 mL of acetic acid were added and the nitrogen flow was decreased. 2 mL of potassium iodide was added and the mixture then rested for five minutes before 100 mL of distilled water and 5 mL starch solution were added (turning the mixture blue) and the nitrogen flow was turned off.
2 I- + H2O + ROOH -> ROH + 2OH- + I2 (6)
A magnetic stirrer was added to the flask and 0.005 M sodium thiosulfate in aqueous solution was titrated to the mixture. The titration stopped as the mixture had turned light yellow. The peroxide number was automatically calculated through equation (7) where A is the amount of sodium thiosulfate solution required to reach the titration point of the sample, B is required amount titrand to reach the titration point of the blank, N is the normality of the sodium thiosulfate solution, 8 is the milliequivalent of hydroxide number and S is amount of sample utilized expressed in grams.
𝑃𝑒𝑟𝑜𝑥𝑖𝑑𝑒 𝑐𝑜𝑛𝑡𝑒𝑛𝑡 [𝑚𝑔/𝑘𝑔] =(𝐴−𝐵)𝑁×1000×8
𝑆 (7)
3.2.6 Reaction Onset Temperatures with pDSC
Pressure Differential Scanning Calorimetry (pDSC) was utilized for determination of onset temperature for thermal reactions occurring in biodiesel. The DSC available at Exova is a Q20 with a Tzero Pressure DSC cell (TA Instruments, New Caste, Delaware, United States of America). The DSC was run at a nitrogen pressure of 500 psi and a temperature ramp from 35 to 400 ˚C utilizing an empty sample cell as reference. Approximately 10 mg of test sample was weighted into a DSC sample cell which then was sealed with a lid comprising a venting hole and placed on one of the thermo elements.
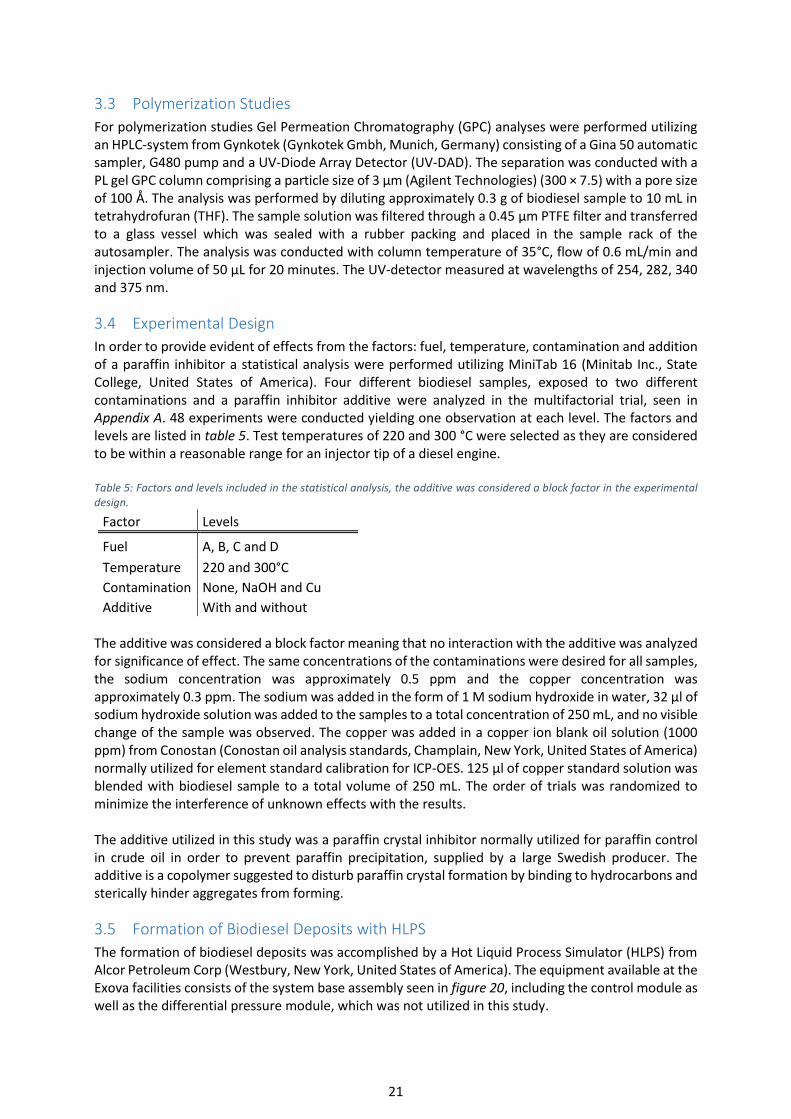
21
3.3 Polymerization Studies
For polymerization studies Gel Permeation Chromatography (GPC) analyses were performed utilizing an HPLC-system from Gynkotek (Gynkotek Gmbh, Munich, Germany) consisting of a Gina 50 automatic sampler, G480 pump and a UV-Diode Array Detector (UV-DAD). The separation was conducted with a PL gel GPC column comprising a particle size of 3 µm (Agilent Technologies) (300 × 7.5) with a pore size of 100 Å. The analysis was performed by diluting approximately 0.3 g of biodiesel sample to 10 mL in tetrahydrofuran (THF). The sample solution was filtered through a 0.45 µm PTFE filter and transferred to a glass vessel which was sealed with a rubber packing and placed in the sample rack of the autosampler. The analysis was conducted with column temperature of 35°C, flow of 0.6 mL/min and injection volume of 50 µL for 20 minutes. The UV-detector measured at wavelengths of 254, 282, 340 and 375 nm.
3.4 Experimental Design
In order to provide evident of effects from the factors: fuel, temperature, contamination and addition of a paraffin inhibitor a statistical analysis were performed utilizing MiniTab 16 (Minitab Inc., State College, United States of America). Four different biodiesel samples, exposed to two different contaminations and a paraffin inhibitor additive were analyzed in the multifactorial trial, seen in Appendix A. 48 experiments were conducted yielding one observation at each level. The factors and levels are listed in table 5. Test temperatures of 220 and 300 °C were selected as they are considered to be within a reasonable range for an injector tip of a diesel engine. Table 5: Factors and levels included in the statistical analysis, the additive was considered a block factor in the experimental design.
Factor Levels
Fuel A, B, C and D
Temperature 220 and 300°C
Contamination None, NaOH and Cu
Additive With and without The additive was considered a block factor meaning that no interaction with the additive was analyzed for significance of effect. The same concentrations of the contaminations were desired for all samples, the sodium concentration was approximately 0.5 ppm and the copper concentration was approximately 0.3 ppm. The sodium was added in the form of 1 M sodium hydroxide in water, 32 µl of sodium hydroxide solution was added to the samples to a total concentration of 250 mL, and no visible change of the sample was observed. The copper was added in a copper ion blank oil solution (1000 ppm) from Conostan (Conostan oil analysis standards, Champlain, New York, United States of America) normally utilized for element standard calibration for ICP-OES. 125 µl of copper standard solution was blended with biodiesel sample to a total volume of 250 mL. The order of trials was randomized to minimize the interference of unknown effects with the results. The additive utilized in this study was a paraffin crystal inhibitor normally utilized for paraffin control in crude oil in order to prevent paraffin precipitation, supplied by a large Swedish producer. The additive is a copolymer suggested to disturb paraffin crystal formation by binding to hydrocarbons and sterically hinder aggregates from forming.
3.5 Formation of Biodiesel Deposits with HLPS
The formation of biodiesel deposits was accomplished by a Hot Liquid Process Simulator (HLPS) from Alcor Petroleum Corp (Westbury, New York, United States of America). The equipment available at the Exova facilities consists of the system base assembly seen in figure 20, including the control module as well as the differential pressure module, which was not utilized in this study.
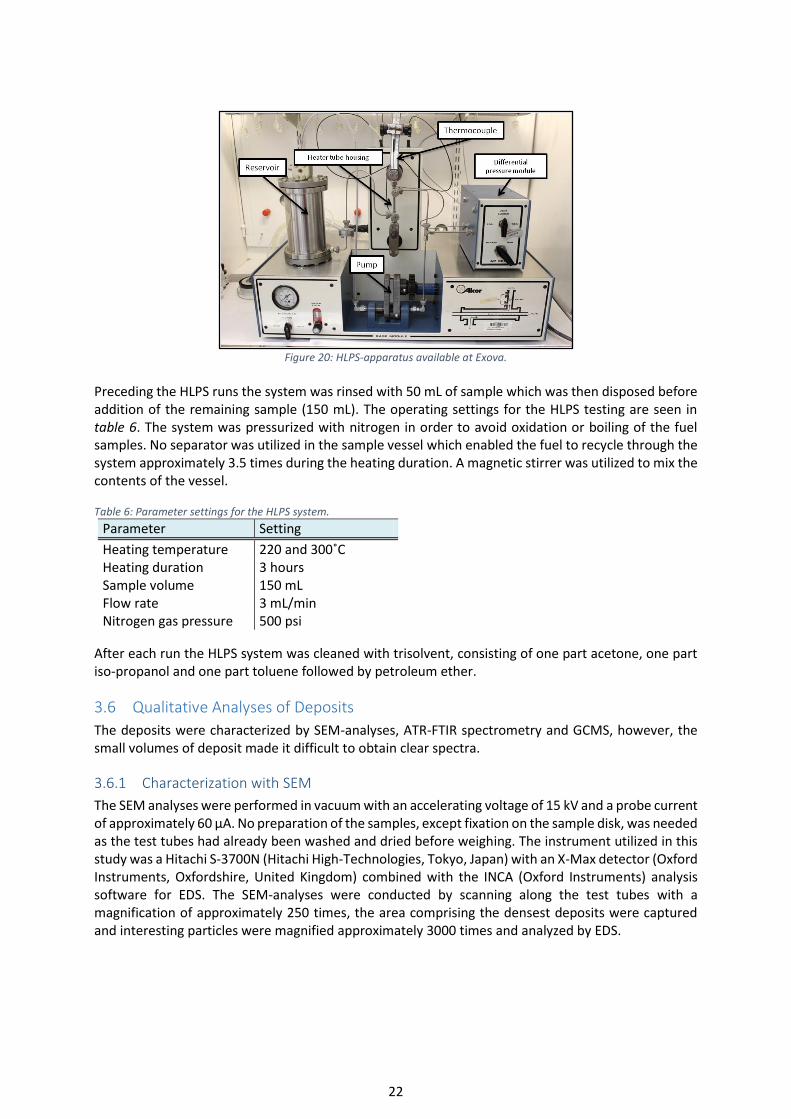
22
Figure 20: HLPS-apparatus available at Exova.
Preceding the HLPS runs the system was rinsed with 50 mL of sample which was then disposed before addition of the remaining sample (150 mL). The operating settings for the HLPS testing are seen in table 6. The system was pressurized with nitrogen in order to avoid oxidation or boiling of the fuel samples. No separator was utilized in the sample vessel which enabled the fuel to recycle through the system approximately 3.5 times during the heating duration. A magnetic stirrer was utilized to mix the contents of the vessel. Table 6: Parameter settings for the HLPS system.
Parameter Setting
Heating temperature 220 and 300˚C Heating duration 3 hours Sample volume 150 mL Flow rate 3 mL/min Nitrogen gas pressure 500 psi
After each run the HLPS system was cleaned with trisolvent, consisting of one part acetone, one part iso-propanol and one part toluene followed by petroleum ether.
3.6 Qualitative Analyses of Deposits
The deposits were characterized by SEM-analyses, ATR-FTIR spectrometry and GCMS, however, the small volumes of deposit made it difficult to obtain clear spectra.
3.6.1 Characterization with SEM
The SEM analyses were performed in vacuum with an accelerating voltage of 15 kV and a probe current of approximately 60 µA. No preparation of the samples, except fixation on the sample disk, was needed as the test tubes had already been washed and dried before weighing. The instrument utilized in this study was a Hitachi S-3700N (Hitachi High-Technologies, Tokyo, Japan) with an X-Max detector (Oxford Instruments, Oxfordshire, United Kingdom) combined with the INCA (Oxford Instruments) analysis software for EDS. The SEM-analyses were conducted by scanning along the test tubes with a magnification of approximately 250 times, the area comprising the densest deposits were captured and interesting particles were magnified approximately 3000 times and analyzed by EDS.
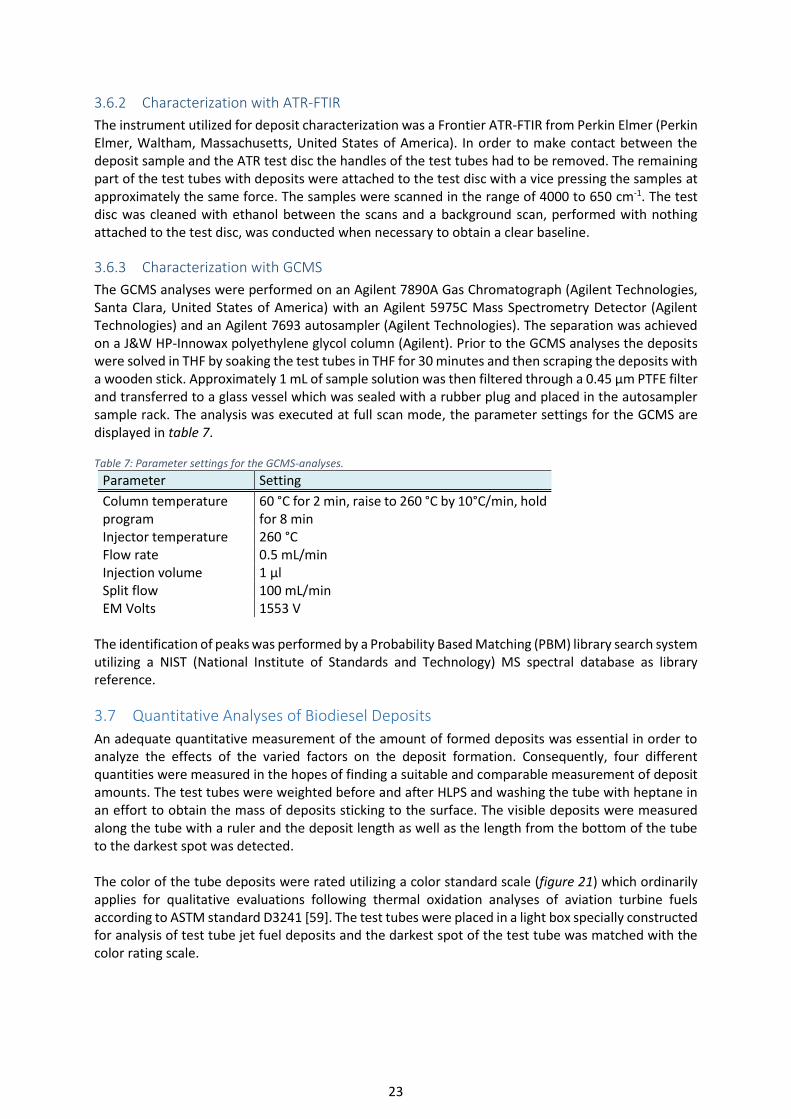
23
3.6.2 Characterization with ATR-FTIR
The instrument utilized for deposit characterization was a Frontier ATR-FTIR from Perkin Elmer (Perkin Elmer, Waltham, Massachusetts, United States of America). In order to make contact between the deposit sample and the ATR test disc the handles of the test tubes had to be removed. The remaining part of the test tubes with deposits were attached to the test disc with a vice pressing the samples at approximately the same force. The samples were scanned in the range of 4000 to 650 cm-1. The test disc was cleaned with ethanol between the scans and a background scan, performed with nothing attached to the test disc, was conducted when necessary to obtain a clear baseline.
3.6.3 Characterization with GCMS
The GCMS analyses were performed on an Agilent 7890A Gas Chromatograph (Agilent Technologies, Santa Clara, United States of America) with an Agilent 5975C Mass Spectrometry Detector (Agilent Technologies) and an Agilent 7693 autosampler (Agilent Technologies). The separation was achieved on a J&W HP-Innowax polyethylene glycol column (Agilent). Prior to the GCMS analyses the deposits were solved in THF by soaking the test tubes in THF for 30 minutes and then scraping the deposits with a wooden stick. Approximately 1 mL of sample solution was then filtered through a 0.45 µm PTFE filter and transferred to a glass vessel which was sealed with a rubber plug and placed in the autosampler sample rack. The analysis was executed at full scan mode, the parameter settings for the GCMS are displayed in table 7. Table 7: Parameter settings for the GCMS-analyses.
Parameter Setting
Column temperature program
60 °C for 2 min, raise to 260 °C by 10°C/min, hold for 8 min
Injector temperature 260 °C Flow rate 0.5 mL/min Injection volume 1 μl Split flow 100 mL/min EM Volts 1553 V
The identification of peaks was performed by a Probability Based Matching (PBM) library search system utilizing a NIST (National Institute of Standards and Technology) MS spectral database as library reference.
3.7 Quantitative Analyses of Biodiesel Deposits
An adequate quantitative measurement of the amount of formed deposits was essential in order to analyze the effects of the varied factors on the deposit formation. Consequently, four different quantities were measured in the hopes of finding a suitable and comparable measurement of deposit amounts. The test tubes were weighted before and after HLPS and washing the tube with heptane in an effort to obtain the mass of deposits sticking to the surface. The visible deposits were measured along the tube with a ruler and the deposit length as well as the length from the bottom of the tube to the darkest spot was detected. The color of the tube deposits were rated utilizing a color standard scale (figure 21) which ordinarily applies for qualitative evaluations following thermal oxidation analyses of aviation turbine fuels according to ASTM standard D3241 [59]. The test tubes were placed in a light box specially constructed for analysis of test tube jet fuel deposits and the darkest spot of the test tube was matched with the color rating scale.
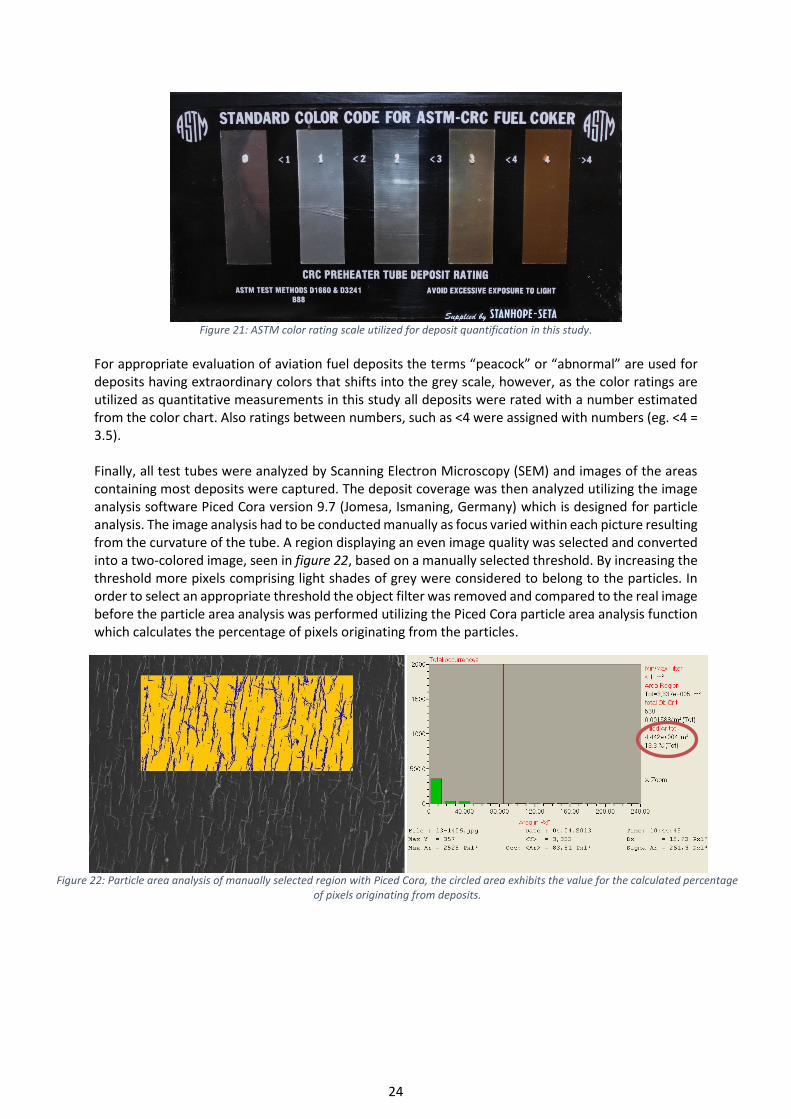
24
Figure 21: ASTM color rating scale utilized for deposit quantification in this study.
For appropriate evaluation of aviation fuel deposits the terms “peacock” or “abnormal” are used for deposits having extraordinary colors that shifts into the grey scale, however, as the color ratings are utilized as quantitative measurements in this study all deposits were rated with a number estimated from the color chart. Also ratings between numbers, such as <4 were assigned with numbers (eg. <4 = 3.5). Finally, all test tubes were analyzed by Scanning Electron Microscopy (SEM) and images of the areas containing most deposits were captured. The deposit coverage was then analyzed utilizing the image analysis software Piced Cora version 9.7 (Jomesa, Ismaning, Germany) which is designed for particle analysis. The image analysis had to be conducted manually as focus varied within each picture resulting from the curvature of the tube. A region displaying an even image quality was selected and converted into a two-colored image, seen in figure 22, based on a manually selected threshold. By increasing the threshold more pixels comprising light shades of grey were considered to belong to the particles. In order to select an appropriate threshold the object filter was removed and compared to the real image before the particle area analysis was performed utilizing the Piced Cora particle area analysis function which calculates the percentage of pixels originating from the particles.
Figure 22: Particle area analysis of manually selected region with Piced Cora, the circled area exhibits the value for the calculated percentage
of pixels originating from deposits.
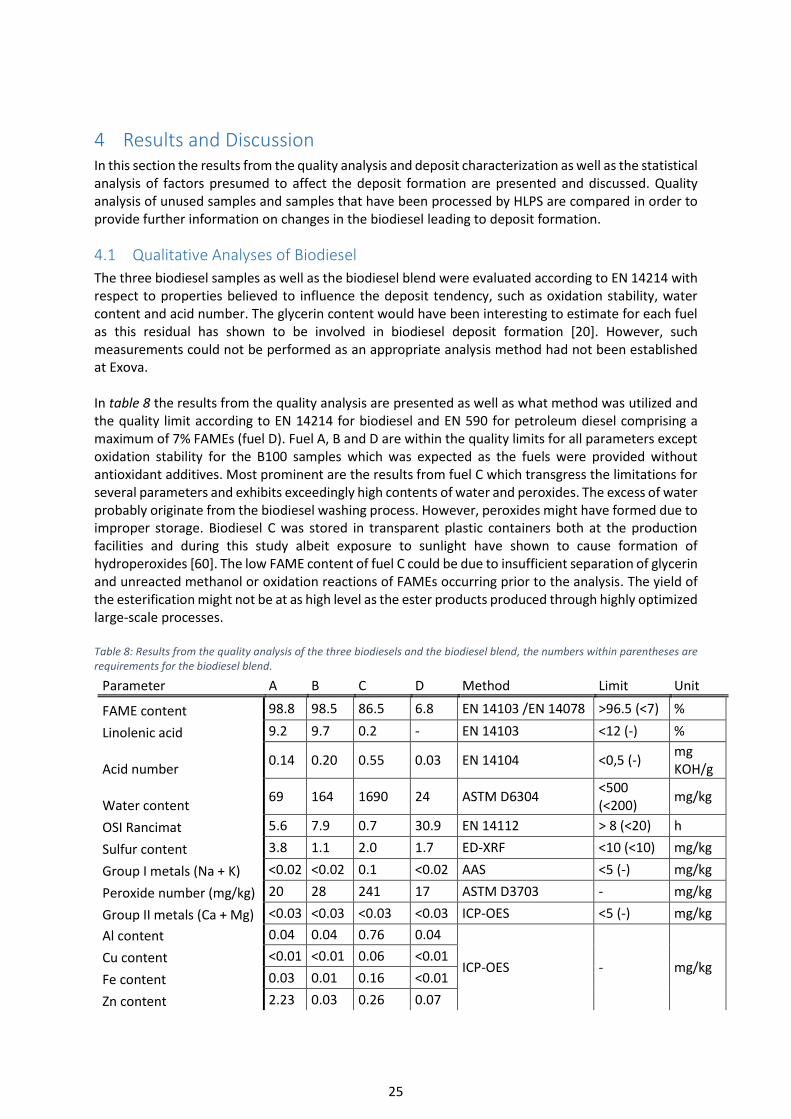
25
4 Results and Discussion In this section the results from the quality analysis and deposit characterization as well as the statistical analysis of factors presumed to affect the deposit formation are presented and discussed. Quality analysis of unused samples and samples that have been processed by HLPS are compared in order to provide further information on changes in the biodiesel leading to deposit formation.
4.1 Qualitative Analyses of Biodiesel
The three biodiesel samples as well as the biodiesel blend were evaluated according to EN 14214 with respect to properties believed to influence the deposit tendency, such as oxidation stability, water content and acid number. The glycerin content would have been interesting to estimate for each fuel as this residual has shown to be involved in biodiesel deposit formation [20]. However, such measurements could not be performed as an appropriate analysis method had not been established at Exova. In table 8 the results from the quality analysis are presented as well as what method was utilized and the quality limit according to EN 14214 for biodiesel and EN 590 for petroleum diesel comprising a maximum of 7% FAMEs (fuel D). Fuel A, B and D are within the quality limits for all parameters except oxidation stability for the B100 samples which was expected as the fuels were provided without antioxidant additives. Most prominent are the results from fuel C which transgress the limitations for several parameters and exhibits exceedingly high contents of water and peroxides. The excess of water probably originate from the biodiesel washing process. However, peroxides might have formed due to improper storage. Biodiesel C was stored in transparent plastic containers both at the production facilities and during this study albeit exposure to sunlight have shown to cause formation of hydroperoxides [60]. The low FAME content of fuel C could be due to insufficient separation of glycerin and unreacted methanol or oxidation reactions of FAMEs occurring prior to the analysis. The yield of the esterification might not be at as high level as the ester products produced through highly optimized large-scale processes. Table 8: Results from the quality analysis of the three biodiesels and the biodiesel blend, the numbers within parentheses are requirements for the biodiesel blend.
Parameter A B C D Method Limit Unit
FAME content 98.8 98.5 86.5 6.8 EN 14103 /EN 14078 >96.5 (<7) %
Linolenic acid 9.2 9.7 0.2 - EN 14103 <12 (-) %
Acid number 0.14 0.20 0.55 0.03 EN 14104 <0,5 (-)
mg KOH/g
Water content 69 164 1690 24 ASTM D6304
<500 (<200)
mg/kg
OSI Rancimat 5.6 7.9 0.7 30.9 EN 14112 > 8 (<20) h
Sulfur content 3.8 1.1 2.0 1.7 ED-XRF <10 (<10) mg/kg
Group I metals (Na + K) <0.02 <0.02 0.1 <0.02 AAS <5 (-) mg/kg
Peroxide number (mg/kg) 20 28 241 17 ASTM D3703 - mg/kg
Group II metals (Ca + Mg) <0.03 <0.03 <0.03 <0.03 ICP-OES <5 (-) mg/kg
Al content 0.04 0.04 0.76 0.04
ICP-OES - mg/kg Cu content <0.01 <0.01 0.06 <0.01
Fe content 0.03 0.01 0.16 <0.01
Zn content 2.23 0.03 0.26 0.07
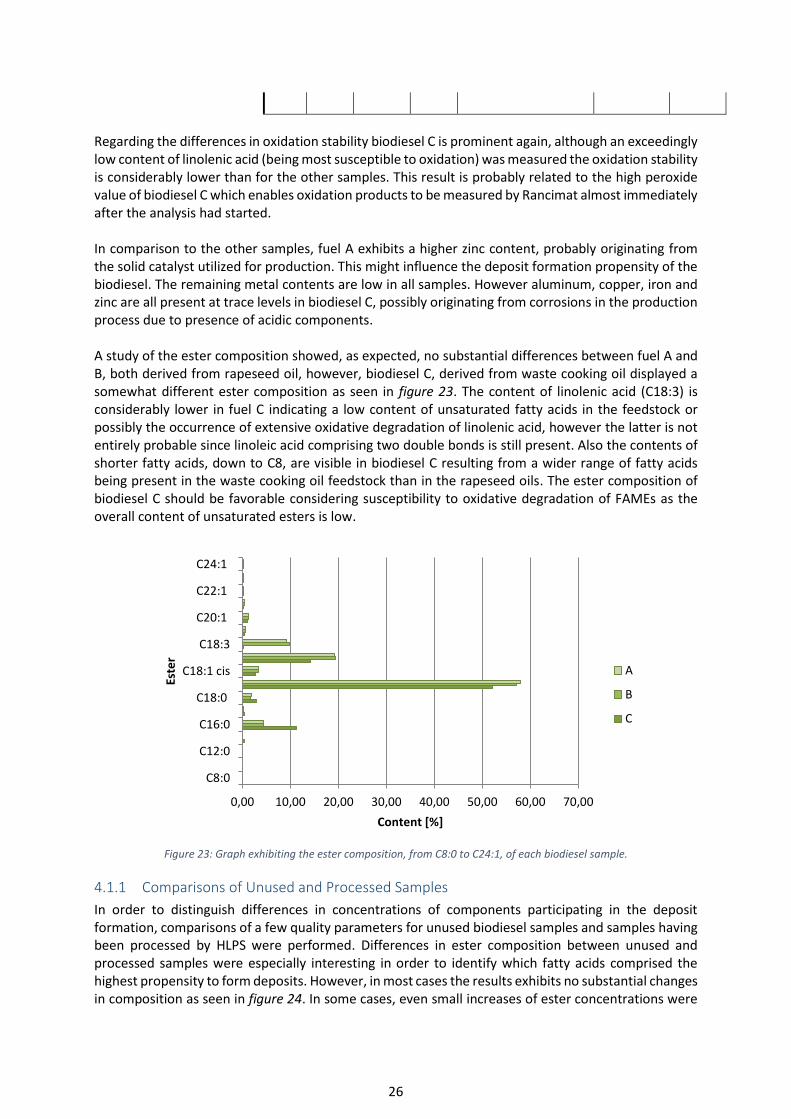
26
Regarding the differences in oxidation stability biodiesel C is prominent again, although an exceedingly low content of linolenic acid (being most susceptible to oxidation) was measured the oxidation stability is considerably lower than for the other samples. This result is probably related to the high peroxide value of biodiesel C which enables oxidation products to be measured by Rancimat almost immediately after the analysis had started. In comparison to the other samples, fuel A exhibits a higher zinc content, probably originating from the solid catalyst utilized for production. This might influence the deposit formation propensity of the biodiesel. The remaining metal contents are low in all samples. However aluminum, copper, iron and zinc are all present at trace levels in biodiesel C, possibly originating from corrosions in the production process due to presence of acidic components. A study of the ester composition showed, as expected, no substantial differences between fuel A and B, both derived from rapeseed oil, however, biodiesel C, derived from waste cooking oil displayed a somewhat different ester composition as seen in figure 23. The content of linolenic acid (C18:3) is considerably lower in fuel C indicating a low content of unsaturated fatty acids in the feedstock or possibly the occurrence of extensive oxidative degradation of linolenic acid, however the latter is not entirely probable since linoleic acid comprising two double bonds is still present. Also the contents of shorter fatty acids, down to C8, are visible in biodiesel C resulting from a wider range of fatty acids being present in the waste cooking oil feedstock than in the rapeseed oils. The ester composition of biodiesel C should be favorable considering susceptibility to oxidative degradation of FAMEs as the overall content of unsaturated esters is low.
Figure 23: Graph exhibiting the ester composition, from C8:0 to C24:1, of each biodiesel sample.
4.1.1 Comparisons of Unused and Processed Samples
In order to distinguish differences in concentrations of components participating in the deposit formation, comparisons of a few quality parameters for unused biodiesel samples and samples having been processed by HLPS were performed. Differences in ester composition between unused and processed samples were especially interesting in order to identify which fatty acids comprised the highest propensity to form deposits. However, in most cases the results exhibits no substantial changes in composition as seen in figure 24. In some cases, even small increases of ester concentrations were
0,00 10,00 20,00 30,00 40,00 50,00 60,00 70,00
C8:0
C12:0
C16:0
C18:0
C18:1 cis
C18:3
C20:1
C22:1
C24:1
Content [%]
Este
r
A
B
C
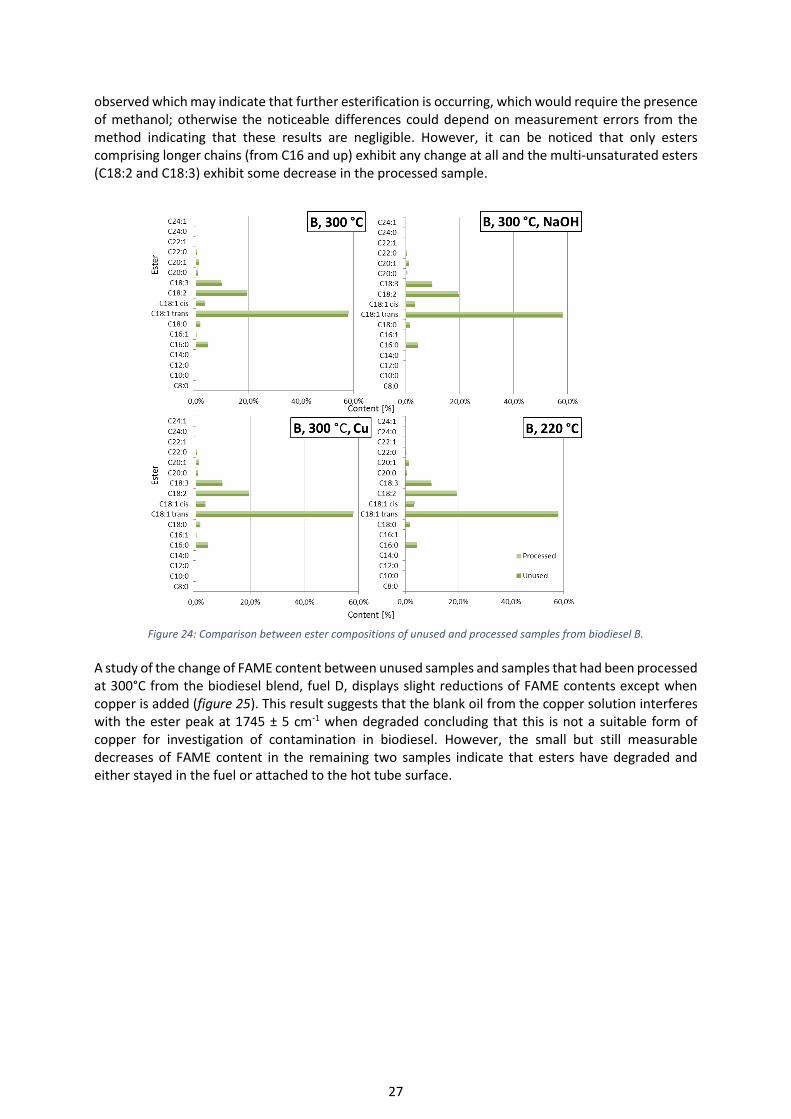
27
observed which may indicate that further esterification is occurring, which would require the presence of methanol; otherwise the noticeable differences could depend on measurement errors from the method indicating that these results are negligible. However, it can be noticed that only esters comprising longer chains (from C16 and up) exhibit any change at all and the multi-unsaturated esters (C18:2 and C18:3) exhibit some decrease in the processed sample.
Figure 24: Comparison between ester compositions of unused and processed samples from biodiesel B.
A study of the change of FAME content between unused samples and samples that had been processed at 300°C from the biodiesel blend, fuel D, displays slight reductions of FAME contents except when copper is added (figure 25). This result suggests that the blank oil from the copper solution interferes with the ester peak at 1745 ± 5 cm-1 when degraded concluding that this is not a suitable form of copper for investigation of contamination in biodiesel. However, the small but still measurable decreases of FAME content in the remaining two samples indicate that esters have degraded and either stayed in the fuel or attached to the hot tube surface.
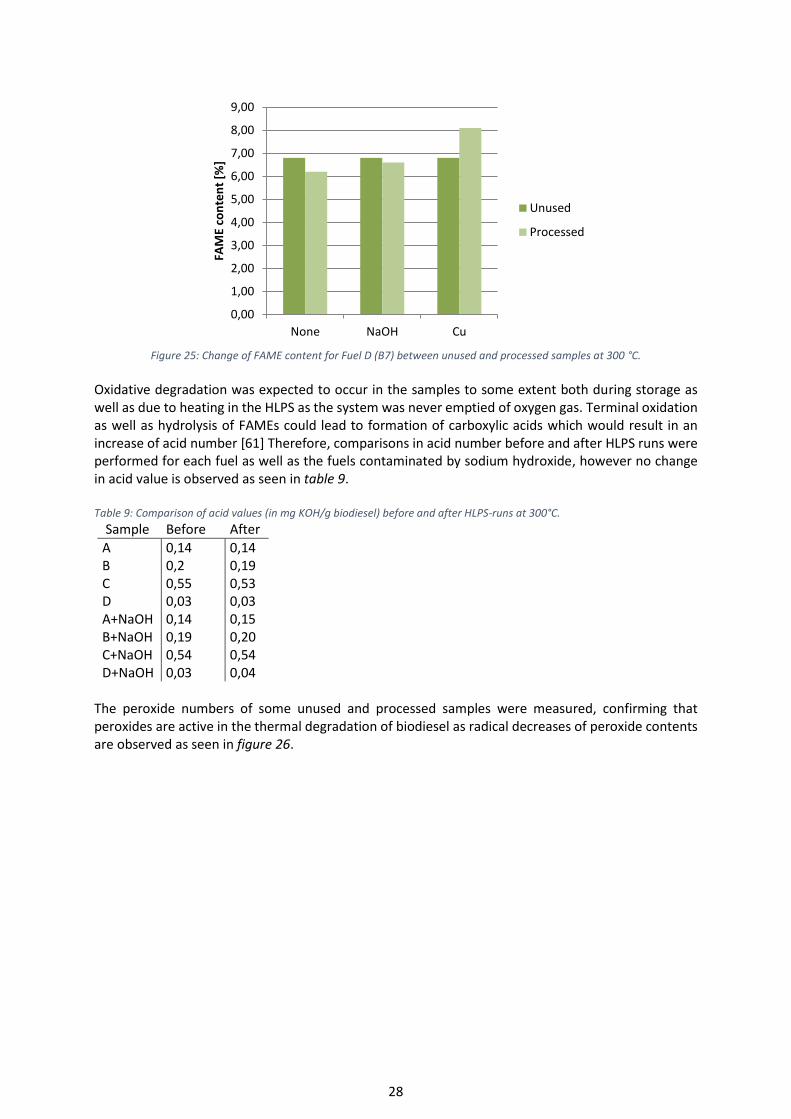
28
Figure 25: Change of FAME content for Fuel D (B7) between unused and processed samples at 300 °C.
Oxidative degradation was expected to occur in the samples to some extent both during storage as well as due to heating in the HLPS as the system was never emptied of oxygen gas. Terminal oxidation as well as hydrolysis of FAMEs could lead to formation of carboxylic acids which would result in an increase of acid number [61] Therefore, comparisons in acid number before and after HLPS runs were performed for each fuel as well as the fuels contaminated by sodium hydroxide, however no change in acid value is observed as seen in table 9. Table 9: Comparison of acid values (in mg KOH/g biodiesel) before and after HLPS-runs at 300°C.
Sample Before After
A 0,14 0,14 B 0,2 0,19 C 0,55 0,53 D 0,03 0,03 A+NaOH 0,14 0,15 B+NaOH 0,19 0,20 C+NaOH 0,54 0,54 D+NaOH 0,03 0,04
The peroxide numbers of some unused and processed samples were measured, confirming that peroxides are active in the thermal degradation of biodiesel as radical decreases of peroxide contents are observed as seen in figure 26.
0,00
1,00
2,00
3,00
4,00
5,00
6,00
7,00
8,00
9,00
None NaOH Cu
FAM
E co
nte
nt
[%]
Unused
Processed
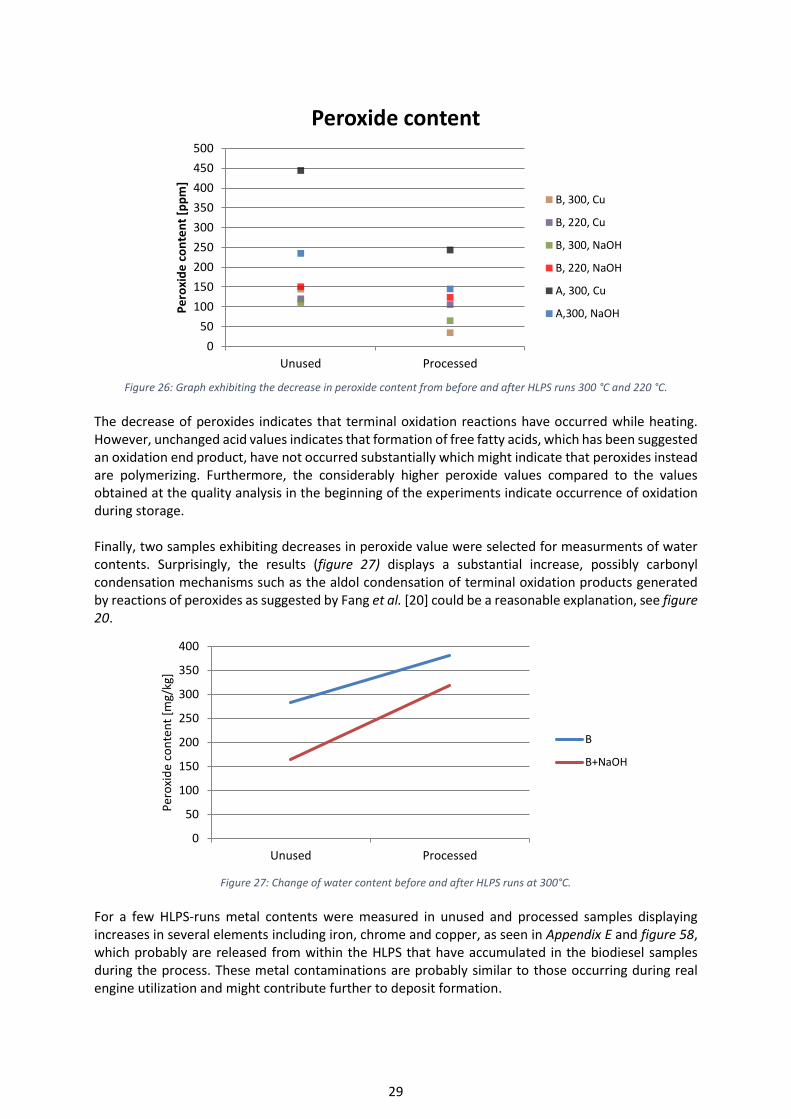
29
Figure 26: Graph exhibiting the decrease in peroxide content from before and after HLPS runs 300 °C and 220 °C.
The decrease of peroxides indicates that terminal oxidation reactions have occurred while heating. However, unchanged acid values indicates that formation of free fatty acids, which has been suggested an oxidation end product, have not occurred substantially which might indicate that peroxides instead are polymerizing. Furthermore, the considerably higher peroxide values compared to the values obtained at the quality analysis in the beginning of the experiments indicate occurrence of oxidation during storage. Finally, two samples exhibiting decreases in peroxide value were selected for measurments of water contents. Surprisingly, the results (figure 27) displays a substantial increase, possibly carbonyl condensation mechanisms such as the aldol condensation of terminal oxidation products generated by reactions of peroxides as suggested by Fang et al. [20] could be a reasonable explanation, see figure 20.
Figure 27: Change of water content before and after HLPS runs at 300°C.
For a few HLPS-runs metal contents were measured in unused and processed samples displaying increases in several elements including iron, chrome and copper, as seen in Appendix E and figure 58, which probably are released from within the HLPS that have accumulated in the biodiesel samples during the process. These metal contaminations are probably similar to those occurring during real engine utilization and might contribute further to deposit formation.
0
50
100
150
200
250
300
350
400
450
500
Unused Processed
Pe
roxi
de
co
nte
nt
[pp
m]
Peroxide content
B, 300, Cu
B, 220, Cu
B, 300, NaOH
B, 220, NaOH
A, 300, Cu
A,300, NaOH
0
50
100
150
200
250
300
350
400
Unused Processed
Per
oxi
de
con
ten
t [m
g/kg
]
B
B+NaOH
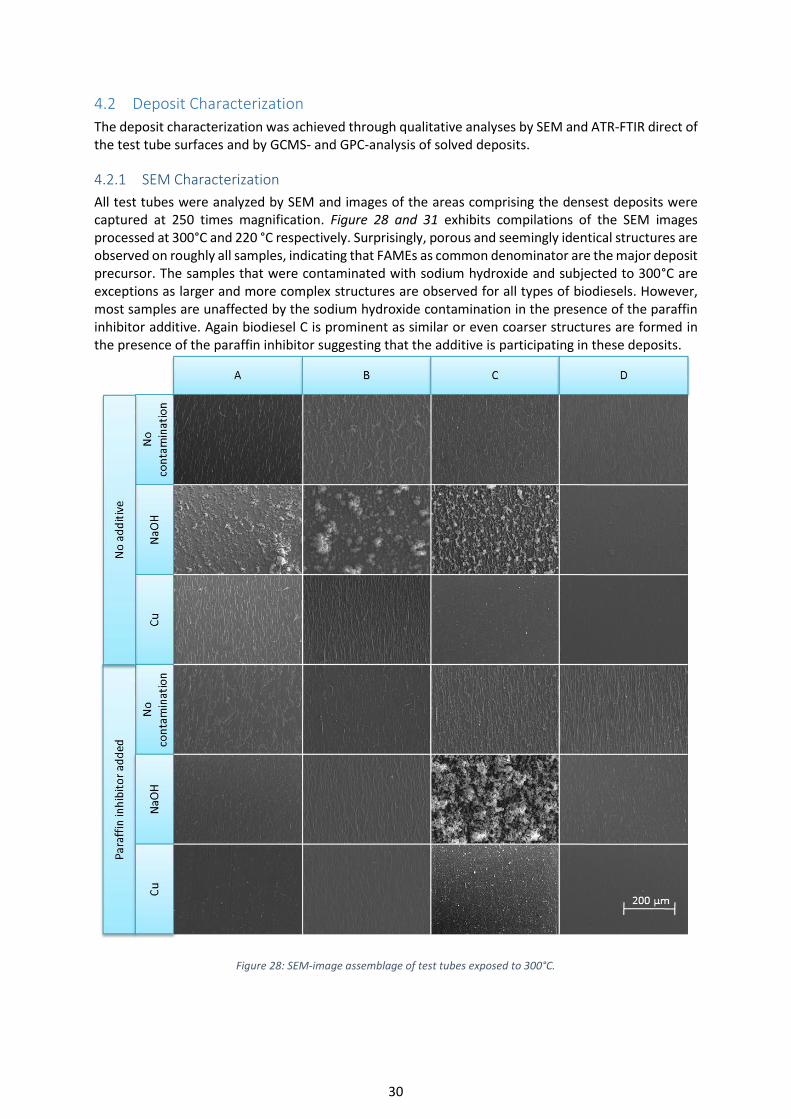
30
4.2 Deposit Characterization
The deposit characterization was achieved through qualitative analyses by SEM and ATR-FTIR direct of the test tube surfaces and by GCMS- and GPC-analysis of solved deposits.
4.2.1 SEM Characterization
All test tubes were analyzed by SEM and images of the areas comprising the densest deposits were captured at 250 times magnification. Figure 28 and 31 exhibits compilations of the SEM images processed at 300°C and 220 °C respectively. Surprisingly, porous and seemingly identical structures are observed on roughly all samples, indicating that FAMEs as common denominator are the major deposit precursor. The samples that were contaminated with sodium hydroxide and subjected to 300°C are exceptions as larger and more complex structures are observed for all types of biodiesels. However, most samples are unaffected by the sodium hydroxide contamination in the presence of the paraffin inhibitor additive. Again biodiesel C is prominent as similar or even coarser structures are formed in the presence of the paraffin inhibitor suggesting that the additive is participating in these deposits.
Figure 28: SEM-image assemblage of test tubes exposed to 300°C.
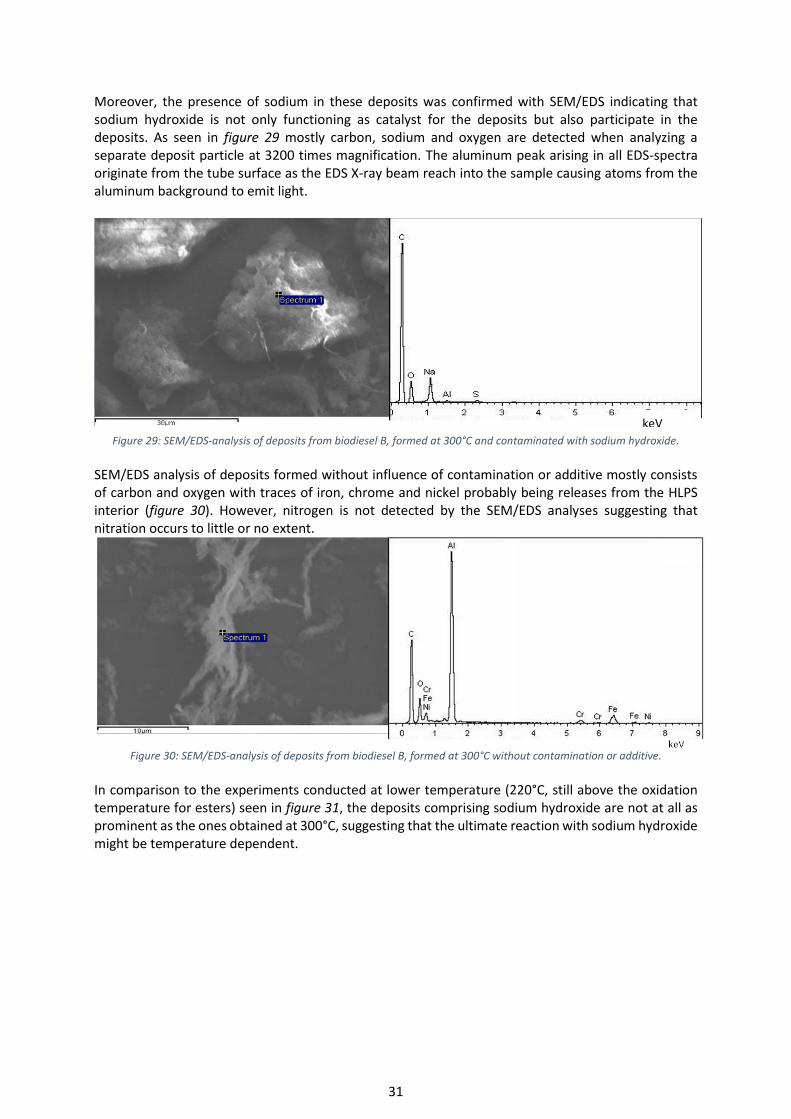
31
Moreover, the presence of sodium in these deposits was confirmed with SEM/EDS indicating that sodium hydroxide is not only functioning as catalyst for the deposits but also participate in the deposits. As seen in figure 29 mostly carbon, sodium and oxygen are detected when analyzing a separate deposit particle at 3200 times magnification. The aluminum peak arising in all EDS-spectra originate from the tube surface as the EDS X-ray beam reach into the sample causing atoms from the aluminum background to emit light.
Figure 29: SEM/EDS-analysis of deposits from biodiesel B, formed at 300°C and contaminated with sodium hydroxide.
SEM/EDS analysis of deposits formed without influence of contamination or additive mostly consists of carbon and oxygen with traces of iron, chrome and nickel probably being releases from the HLPS interior (figure 30). However, nitrogen is not detected by the SEM/EDS analyses suggesting that nitration occurs to little or no extent.
Figure 30: SEM/EDS-analysis of deposits from biodiesel B, formed at 300°C without contamination or additive.
In comparison to the experiments conducted at lower temperature (220°C, still above the oxidation temperature for esters) seen in figure 31, the deposits comprising sodium hydroxide are not at all as prominent as the ones obtained at 300°C, suggesting that the ultimate reaction with sodium hydroxide might be temperature dependent.
keV
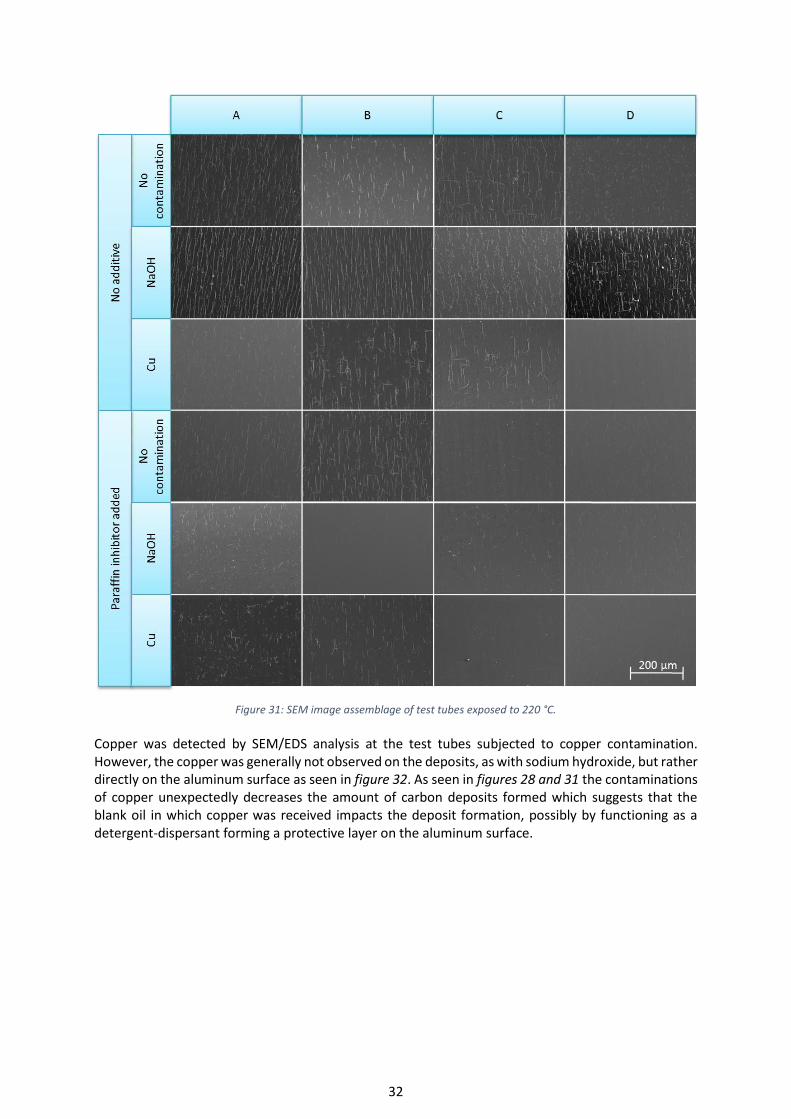
32
Figure 31: SEM image assemblage of test tubes exposed to 220 °C.
Copper was detected by SEM/EDS analysis at the test tubes subjected to copper contamination. However, the copper was generally not observed on the deposits, as with sodium hydroxide, but rather directly on the aluminum surface as seen in figure 32. As seen in figures 28 and 31 the contaminations of copper unexpectedly decreases the amount of carbon deposits formed which suggests that the blank oil in which copper was received impacts the deposit formation, possibly by functioning as a detergent-dispersant forming a protective layer on the aluminum surface.
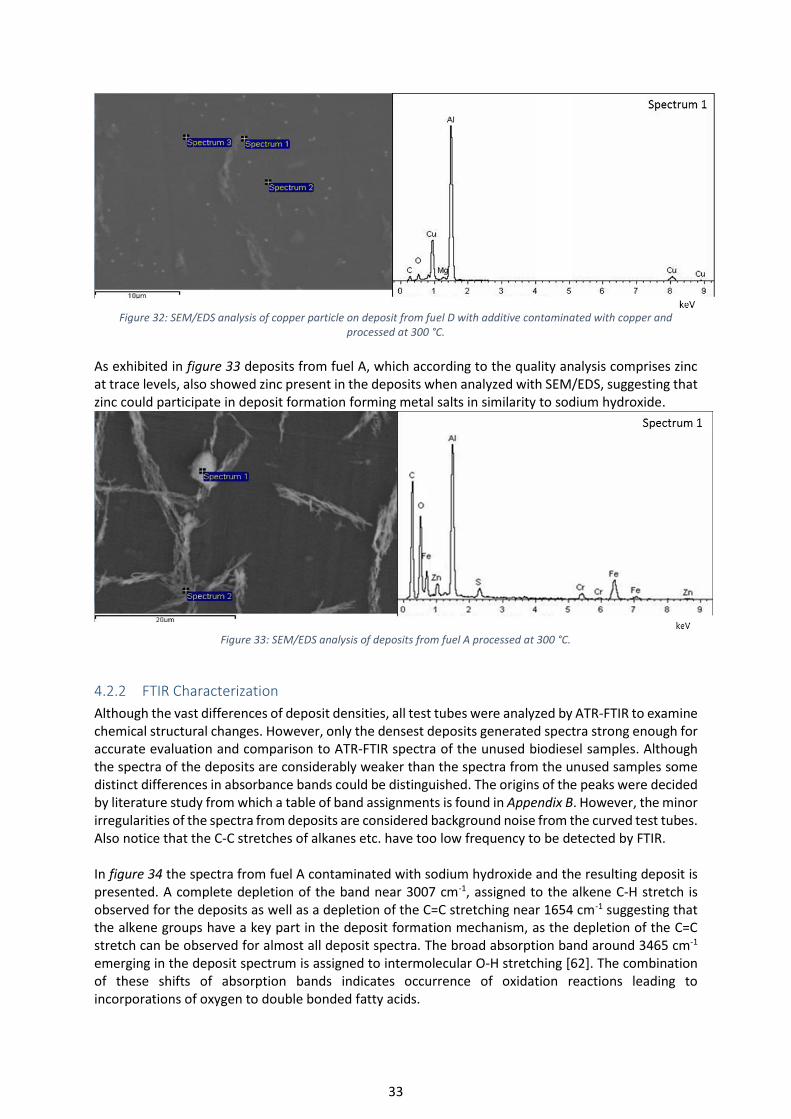
33
Figure 32: SEM/EDS analysis of copper particle on deposit from fuel D with additive contaminated with copper and
processed at 300 °C.
As exhibited in figure 33 deposits from fuel A, which according to the quality analysis comprises zinc at trace levels, also showed zinc present in the deposits when analyzed with SEM/EDS, suggesting that zinc could participate in deposit formation forming metal salts in similarity to sodium hydroxide.
Figure 33: SEM/EDS analysis of deposits from fuel A processed at 300 °C.
4.2.2 FTIR Characterization
Although the vast differences of deposit densities, all test tubes were analyzed by ATR-FTIR to examine chemical structural changes. However, only the densest deposits generated spectra strong enough for accurate evaluation and comparison to ATR-FTIR spectra of the unused biodiesel samples. Although the spectra of the deposits are considerably weaker than the spectra from the unused samples some distinct differences in absorbance bands could be distinguished. The origins of the peaks were decided by literature study from which a table of band assignments is found in Appendix B. However, the minor irregularities of the spectra from deposits are considered background noise from the curved test tubes. Also notice that the C-C stretches of alkanes etc. have too low frequency to be detected by FTIR. In figure 34 the spectra from fuel A contaminated with sodium hydroxide and the resulting deposit is presented. A complete depletion of the band near 3007 cm-1, assigned to the alkene C-H stretch is observed for the deposits as well as a depletion of the C=C stretching near 1654 cm-1 suggesting that the alkene groups have a key part in the deposit formation mechanism, as the depletion of the C=C stretch can be observed for almost all deposit spectra. The broad absorption band around 3465 cm-1 emerging in the deposit spectrum is assigned to intermolecular O-H stretching [62]. The combination of these shifts of absorption bands indicates occurrence of oxidation reactions leading to incorporations of oxygen to double bonded fatty acids.
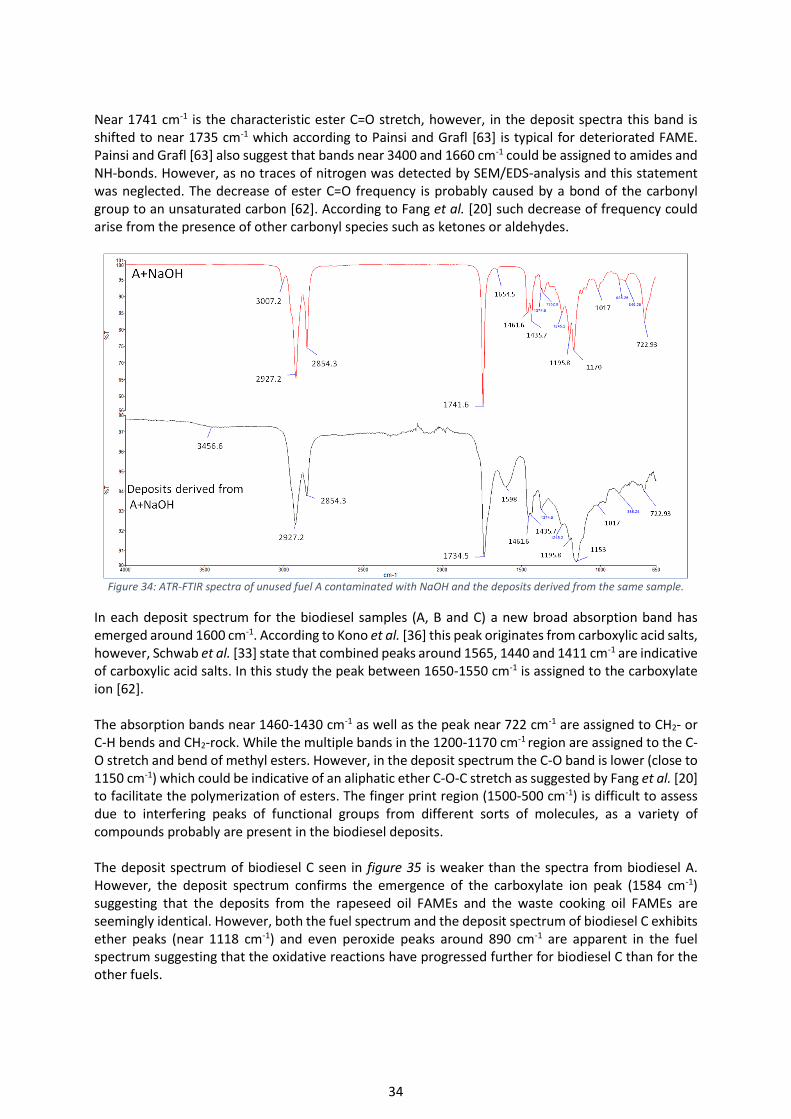
34
Near 1741 cm-1 is the characteristic ester C=O stretch, however, in the deposit spectra this band is shifted to near 1735 cm-1 which according to Painsi and Grafl [63] is typical for deteriorated FAME. Painsi and Grafl [63] also suggest that bands near 3400 and 1660 cm-1 could be assigned to amides and NH-bonds. However, as no traces of nitrogen was detected by SEM/EDS-analysis and this statement was neglected. The decrease of ester C=O frequency is probably caused by a bond of the carbonyl group to an unsaturated carbon [62]. According to Fang et al. [20] such decrease of frequency could arise from the presence of other carbonyl species such as ketones or aldehydes.
Figure 34: ATR-FTIR spectra of unused fuel A contaminated with NaOH and the deposits derived from the same sample.
In each deposit spectrum for the biodiesel samples (A, B and C) a new broad absorption band has emerged around 1600 cm-1. According to Kono et al. [36] this peak originates from carboxylic acid salts, however, Schwab et al. [33] state that combined peaks around 1565, 1440 and 1411 cm-1 are indicative of carboxylic acid salts. In this study the peak between 1650-1550 cm-1 is assigned to the carboxylate ion [62]. The absorption bands near 1460-1430 cm-1 as well as the peak near 722 cm-1 are assigned to CH2- or C-H bends and CH2-rock. While the multiple bands in the 1200-1170 cm-1 region are assigned to the C-O stretch and bend of methyl esters. However, in the deposit spectrum the C-O band is lower (close to 1150 cm-1) which could be indicative of an aliphatic ether C-O-C stretch as suggested by Fang et al. [20] to facilitate the polymerization of esters. The finger print region (1500-500 cm-1) is difficult to assess due to interfering peaks of functional groups from different sorts of molecules, as a variety of compounds probably are present in the biodiesel deposits.
The deposit spectrum of biodiesel C seen in figure 35 is weaker than the spectra from biodiesel A. However, the deposit spectrum confirms the emergence of the carboxylate ion peak (1584 cm-1) suggesting that the deposits from the rapeseed oil FAMEs and the waste cooking oil FAMEs are seemingly identical. However, both the fuel spectrum and the deposit spectrum of biodiesel C exhibits ether peaks (near 1118 cm-1) and even peroxide peaks around 890 cm-1 are apparent in the fuel spectrum suggesting that the oxidative reactions have progressed further for biodiesel C than for the other fuels.
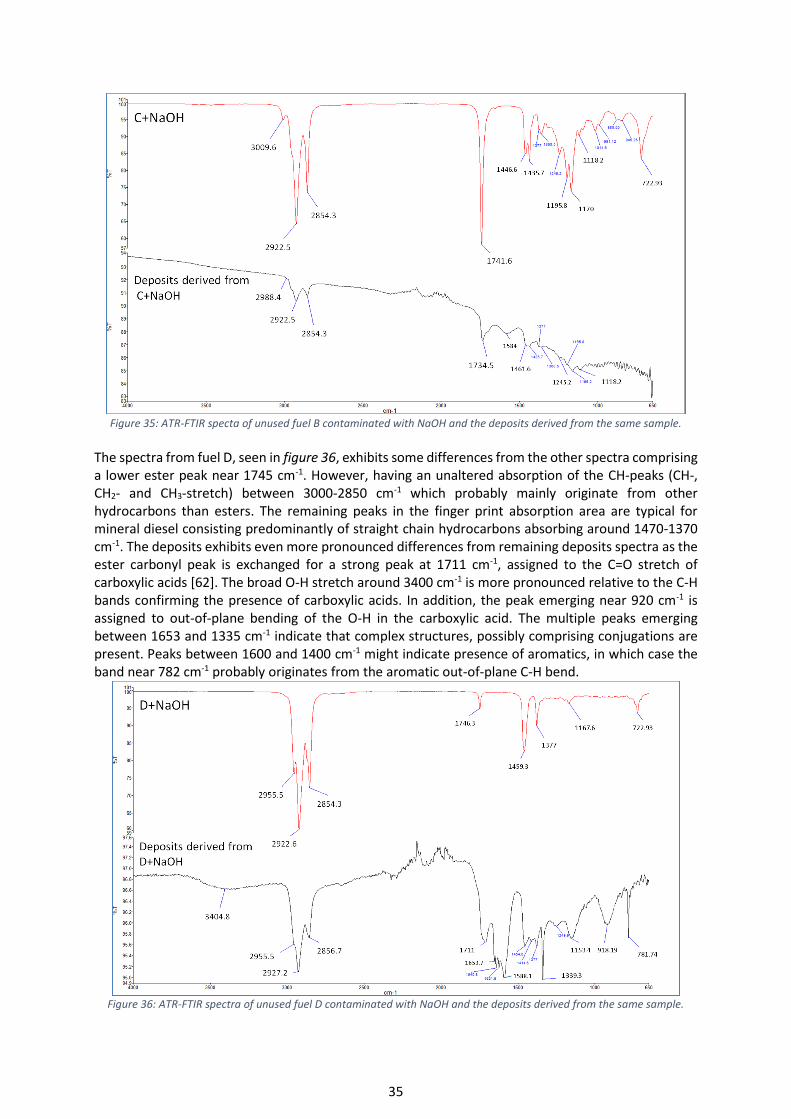
35
Figure 35: ATR-FTIR specta of unused fuel B contaminated with NaOH and the deposits derived from the same sample.
The spectra from fuel D, seen in figure 36, exhibits some differences from the other spectra comprising a lower ester peak near 1745 cm-1. However, having an unaltered absorption of the CH-peaks (CH-, CH2- and CH3-stretch) between 3000-2850 cm-1 which probably mainly originate from other hydrocarbons than esters. The remaining peaks in the finger print absorption area are typical for mineral diesel consisting predominantly of straight chain hydrocarbons absorbing around 1470-1370 cm-1. The deposits exhibits even more pronounced differences from remaining deposits spectra as the ester carbonyl peak is exchanged for a strong peak at 1711 cm-1, assigned to the C=O stretch of carboxylic acids [62]. The broad O-H stretch around 3400 cm-1 is more pronounced relative to the C-H bands confirming the presence of carboxylic acids. In addition, the peak emerging near 920 cm-1 is assigned to out-of-plane bending of the O-H in the carboxylic acid. The multiple peaks emerging between 1653 and 1335 cm-1 indicate that complex structures, possibly comprising conjugations are present. Peaks between 1600 and 1400 cm-1 might indicate presence of aromatics, in which case the band near 782 cm-1 probably originates from the aromatic out-of-plane C-H bend.
Figure 36: ATR-FTIR spectra of unused fuel D contaminated with NaOH and the deposits derived from the same sample.
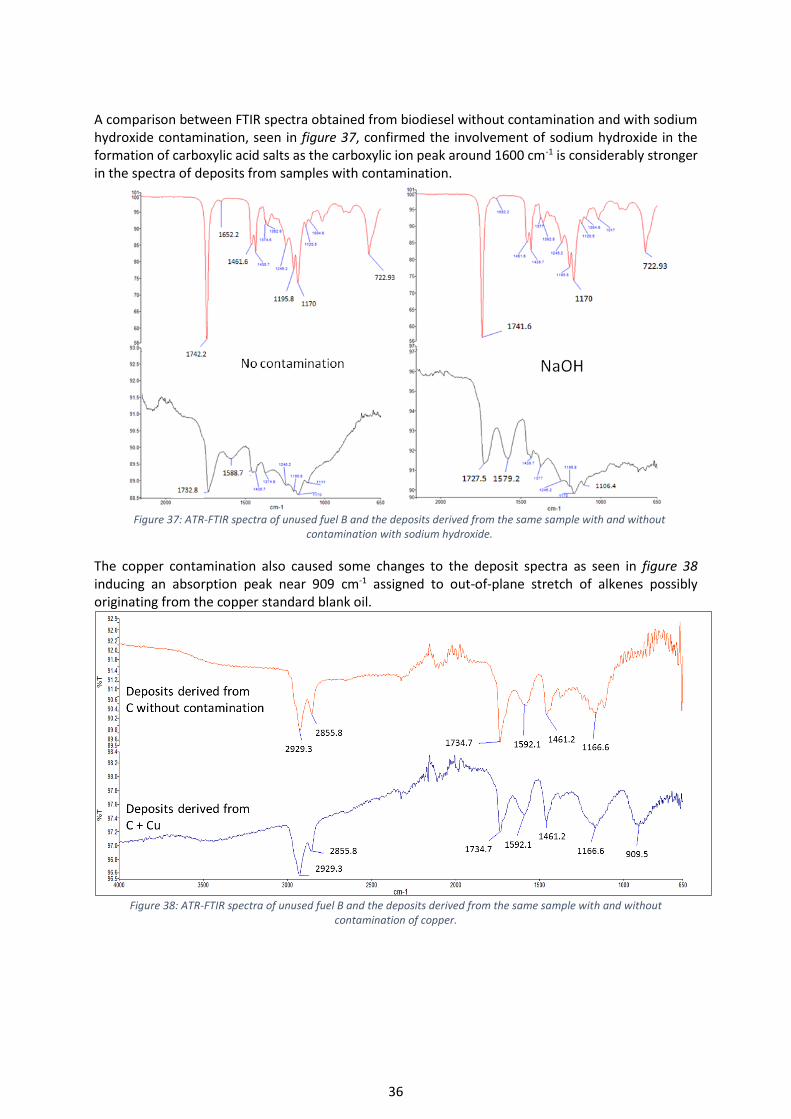
36
A comparison between FTIR spectra obtained from biodiesel without contamination and with sodium hydroxide contamination, seen in figure 37, confirmed the involvement of sodium hydroxide in the formation of carboxylic acid salts as the carboxylic ion peak around 1600 cm-1 is considerably stronger in the spectra of deposits from samples with contamination.
The copper contamination also caused some changes to the deposit spectra as seen in figure 38 inducing an absorption peak near 909 cm-1 assigned to out-of-plane stretch of alkenes possibly originating from the copper standard blank oil.
Figure 38: ATR-FTIR spectra of unused fuel B and the deposits derived from the same sample with and without
contamination of copper.
Figure 37: ATR-FTIR spectra of unused fuel B and the deposits derived from the same sample with and without
contamination with sodium hydroxide.
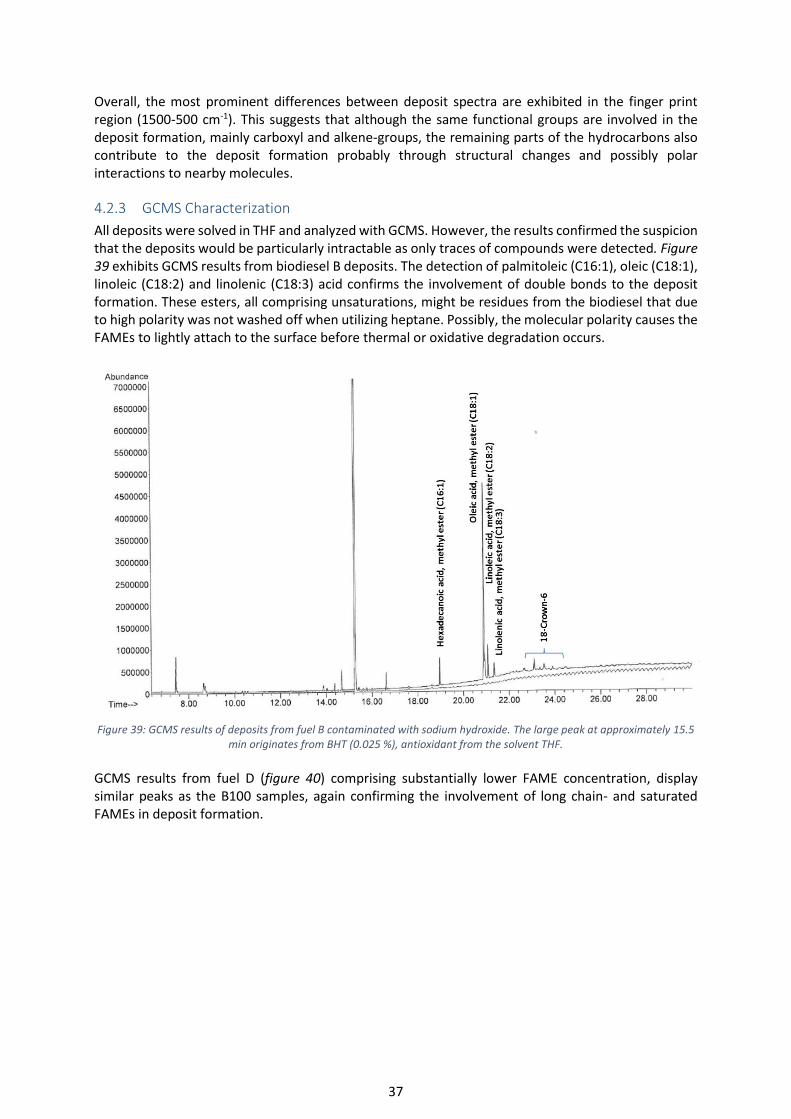
37
Overall, the most prominent differences between deposit spectra are exhibited in the finger print region (1500-500 cm-1). This suggests that although the same functional groups are involved in the deposit formation, mainly carboxyl and alkene-groups, the remaining parts of the hydrocarbons also contribute to the deposit formation probably through structural changes and possibly polar interactions to nearby molecules.
4.2.3 GCMS Characterization
All deposits were solved in THF and analyzed with GCMS. However, the results confirmed the suspicion that the deposits would be particularly intractable as only traces of compounds were detected. Figure 39 exhibits GCMS results from biodiesel B deposits. The detection of palmitoleic (C16:1), oleic (C18:1), linoleic (C18:2) and linolenic (C18:3) acid confirms the involvement of double bonds to the deposit formation. These esters, all comprising unsaturations, might be residues from the biodiesel that due to high polarity was not washed off when utilizing heptane. Possibly, the molecular polarity causes the FAMEs to lightly attach to the surface before thermal or oxidative degradation occurs.
Figure 39: GCMS results of deposits from fuel B contaminated with sodium hydroxide. The large peak at approximately 15.5
min originates from BHT (0.025 %), antioxidant from the solvent THF.
GCMS results from fuel D (figure 40) comprising substantially lower FAME concentration, display similar peaks as the B100 samples, again confirming the involvement of long chain- and saturated FAMEs in deposit formation.
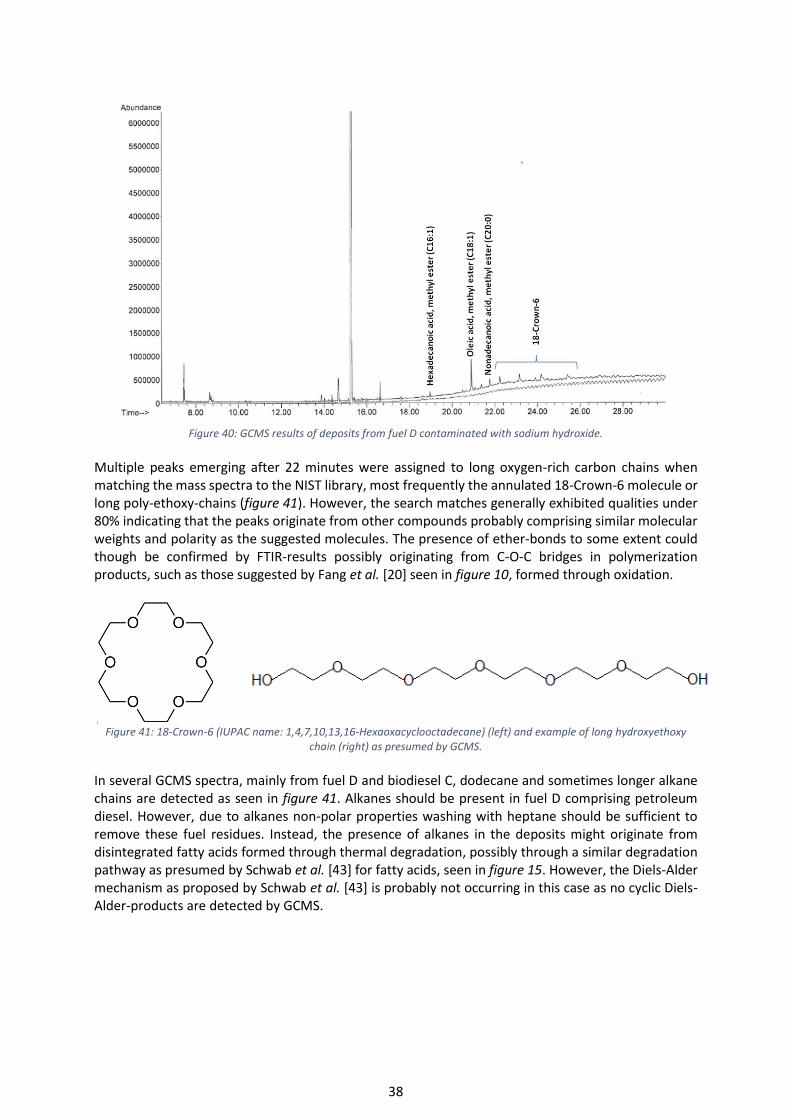
38
Figure 40: GCMS results of deposits from fuel D contaminated with sodium hydroxide.
Multiple peaks emerging after 22 minutes were assigned to long oxygen-rich carbon chains when matching the mass spectra to the NIST library, most frequently the annulated 18-Crown-6 molecule or long poly-ethoxy-chains (figure 41). However, the search matches generally exhibited qualities under 80% indicating that the peaks originate from other compounds probably comprising similar molecular weights and polarity as the suggested molecules. The presence of ether-bonds to some extent could though be confirmed by FTIR-results possibly originating from C-O-C bridges in polymerization products, such as those suggested by Fang et al. [20] seen in figure 10, formed through oxidation.
Figure 41: 18-Crown-6 (IUPAC name: 1,4,7,10,13,16-Hexaoxacyclooctadecane) (left) and example of long hydroxyethoxy
chain (right) as presumed by GCMS.
In several GCMS spectra, mainly from fuel D and biodiesel C, dodecane and sometimes longer alkane chains are detected as seen in figure 41. Alkanes should be present in fuel D comprising petroleum diesel. However, due to alkanes non-polar properties washing with heptane should be sufficient to remove these fuel residues. Instead, the presence of alkanes in the deposits might originate from disintegrated fatty acids formed through thermal degradation, possibly through a similar degradation pathway as presumed by Schwab et al. [43] for fatty acids, seen in figure 15. However, the Diels-Alder mechanism as proposed by Schwab et al. [43] is probably not occurring in this case as no cyclic Diels-Alder-products are detected by GCMS.
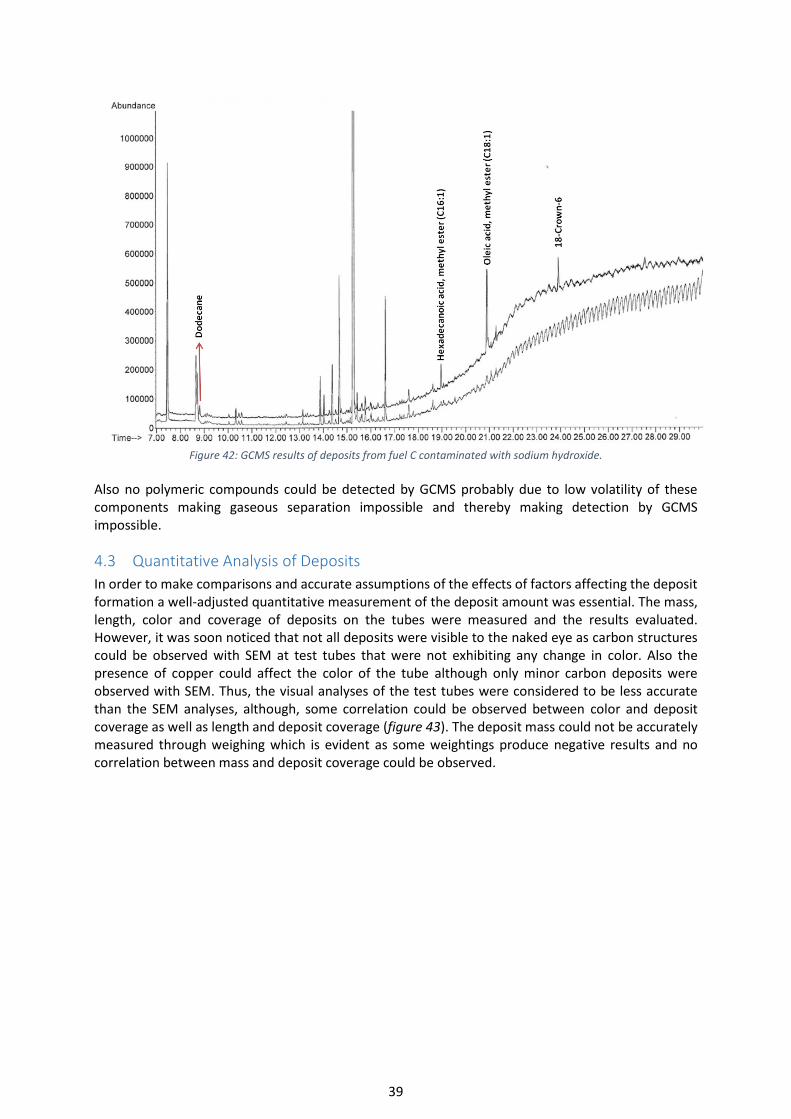
39
Figure 42: GCMS results of deposits from fuel C contaminated with sodium hydroxide.
Also no polymeric compounds could be detected by GCMS probably due to low volatility of these components making gaseous separation impossible and thereby making detection by GCMS impossible.
4.3 Quantitative Analysis of Deposits
In order to make comparisons and accurate assumptions of the effects of factors affecting the deposit formation a well-adjusted quantitative measurement of the deposit amount was essential. The mass, length, color and coverage of deposits on the tubes were measured and the results evaluated. However, it was soon noticed that not all deposits were visible to the naked eye as carbon structures could be observed with SEM at test tubes that were not exhibiting any change in color. Also the presence of copper could affect the color of the tube although only minor carbon deposits were observed with SEM. Thus, the visual analyses of the test tubes were considered to be less accurate than the SEM analyses, although, some correlation could be observed between color and deposit coverage as well as length and deposit coverage (figure 43). The deposit mass could not be accurately measured through weighing which is evident as some weightings produce negative results and no correlation between mass and deposit coverage could be observed.
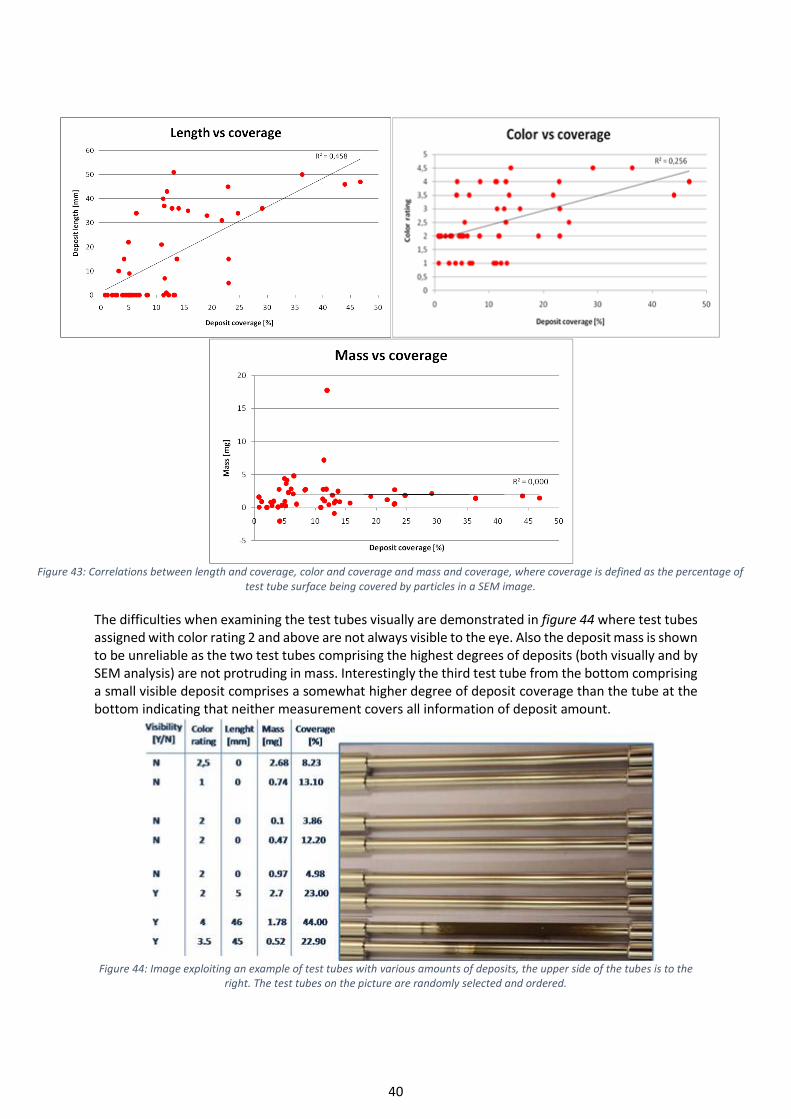
40
The difficulties when examining the test tubes visually are demonstrated in figure 44 where test tubes assigned with color rating 2 and above are not always visible to the eye. Also the deposit mass is shown to be unreliable as the two test tubes comprising the highest degrees of deposits (both visually and by SEM analysis) are not protruding in mass. Interestingly the third test tube from the bottom comprising a small visible deposit comprises a somewhat higher degree of deposit coverage than the tube at the bottom indicating that neither measurement covers all information of deposit amount.
Figure 44: Image exploiting an example of test tubes with various amounts of deposits, the upper side of the tubes is to the
right. The test tubes on the picture are randomly selected and ordered.
Figure 43: Correlations between length and coverage, color and coverage and mass and coverage, where coverage is defined as the percentage of
test tube surface being covered by particles in a SEM image.
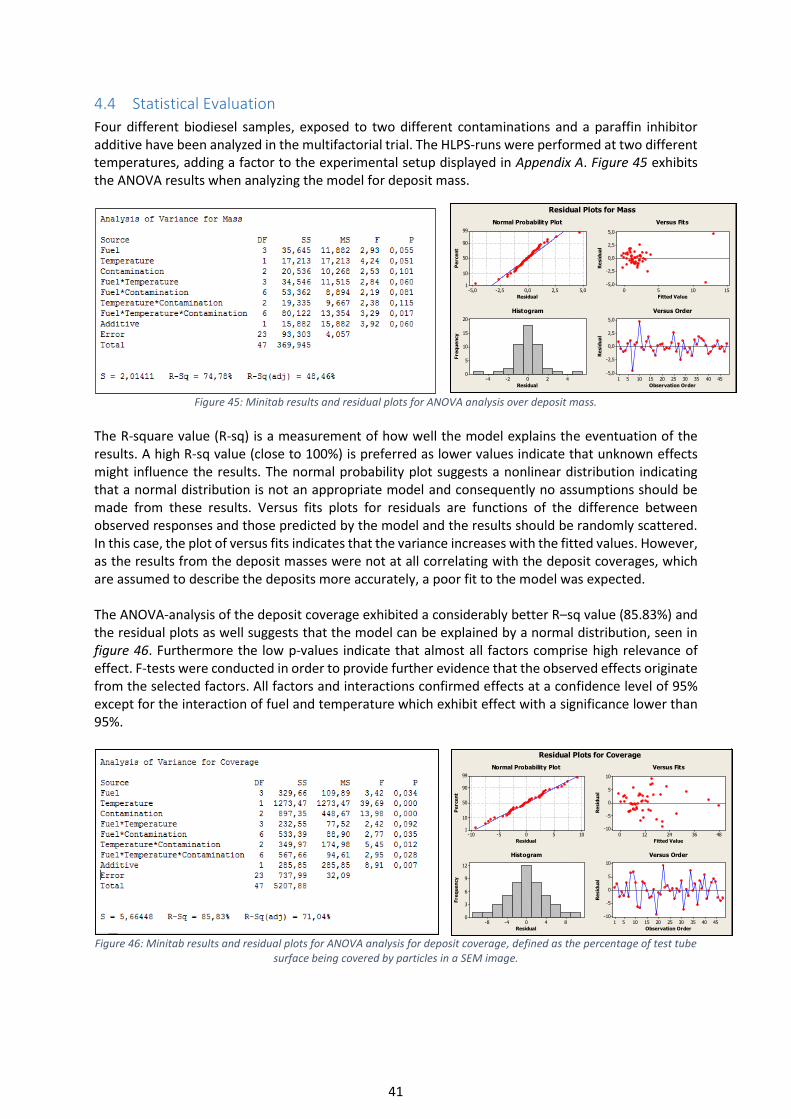
41
4.4 Statistical Evaluation
Four different biodiesel samples, exposed to two different contaminations and a paraffin inhibitor additive have been analyzed in the multifactorial trial. The HLPS-runs were performed at two different temperatures, adding a factor to the experimental setup displayed in Appendix A. Figure 45 exhibits the ANOVA results when analyzing the model for deposit mass.
Figure 45: Minitab results and residual plots for ANOVA analysis over deposit mass.
The R-square value (R-sq) is a measurement of how well the model explains the eventuation of the results. A high R-sq value (close to 100%) is preferred as lower values indicate that unknown effects might influence the results. The normal probability plot suggests a nonlinear distribution indicating that a normal distribution is not an appropriate model and consequently no assumptions should be made from these results. Versus fits plots for residuals are functions of the difference between observed responses and those predicted by the model and the results should be randomly scattered. In this case, the plot of versus fits indicates that the variance increases with the fitted values. However, as the results from the deposit masses were not at all correlating with the deposit coverages, which are assumed to describe the deposits more accurately, a poor fit to the model was expected. The ANOVA-analysis of the deposit coverage exhibited a considerably better R–sq value (85.83%) and the residual plots as well suggests that the model can be explained by a normal distribution, seen in figure 46. Furthermore the low p-values indicate that almost all factors comprise high relevance of effect. F-tests were conducted in order to provide further evidence that the observed effects originate from the selected factors. All factors and interactions confirmed effects at a confidence level of 95% except for the interaction of fuel and temperature which exhibit effect with a significance lower than 95%.
Figure 46: Minitab results and residual plots for ANOVA analysis for deposit coverage, defined as the percentage of test tube
surface being covered by particles in a SEM image.
5,02,50,0-2,5-5,0
99
90
50
10
1
Residual
Pe
rce
nt
151050
5,0
2,5
0,0
-2,5
-5,0
Fitted Value
Re
sid
ua
l
420-2-4
20
15
10
5
0
Residual
Fre
qu
en
cy
454035302520151051
5,0
2,5
0,0
-2,5
-5,0
Observation Order
Re
sid
ua
l
Normal Probability Plot Versus Fits
Histogram Versus Order
Residual Plots for Mass
1050-5-10
99
90
50
10
1
Residual
Pe
rce
nt
483624120
10
5
0
-5
-10
Fitted Value
Re
sid
ua
l
840-4-8
12
9
6
3
0
Residual
Fre
qu
en
cy
454035302520151051
10
5
0
-5
-10
Observation Order
Re
sid
ua
l
Normal Probability Plot Versus Fits
Histogram Versus Order
Residual Plots for Coverage
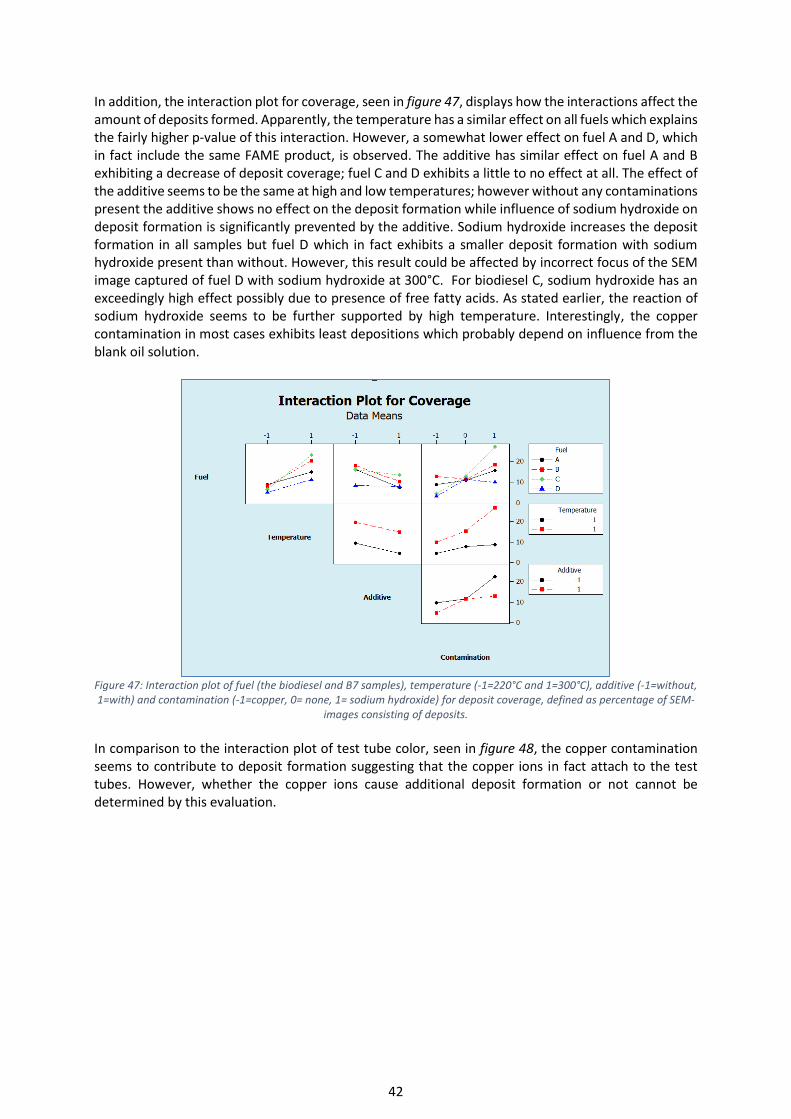
42
In addition, the interaction plot for coverage, seen in figure 47, displays how the interactions affect the amount of deposits formed. Apparently, the temperature has a similar effect on all fuels which explains the fairly higher p-value of this interaction. However, a somewhat lower effect on fuel A and D, which in fact include the same FAME product, is observed. The additive has similar effect on fuel A and B exhibiting a decrease of deposit coverage; fuel C and D exhibits a little to no effect at all. The effect of the additive seems to be the same at high and low temperatures; however without any contaminations present the additive shows no effect on the deposit formation while influence of sodium hydroxide on deposit formation is significantly prevented by the additive. Sodium hydroxide increases the deposit formation in all samples but fuel D which in fact exhibits a smaller deposit formation with sodium hydroxide present than without. However, this result could be affected by incorrect focus of the SEM image captured of fuel D with sodium hydroxide at 300°C. For biodiesel C, sodium hydroxide has an exceedingly high effect possibly due to presence of free fatty acids. As stated earlier, the reaction of sodium hydroxide seems to be further supported by high temperature. Interestingly, the copper contamination in most cases exhibits least depositions which probably depend on influence from the blank oil solution.
Figure 47: Interaction plot of fuel (the biodiesel and B7 samples), temperature (-1=220°C and 1=300°C), additive (-1=without, 1=with) and contamination (-1=copper, 0= none, 1= sodium hydroxide) for deposit coverage, defined as percentage of SEM-
images consisting of deposits.
In comparison to the interaction plot of test tube color, seen in figure 48, the copper contamination seems to contribute to deposit formation suggesting that the copper ions in fact attach to the test tubes. However, whether the copper ions cause additional deposit formation or not cannot be determined by this evaluation.
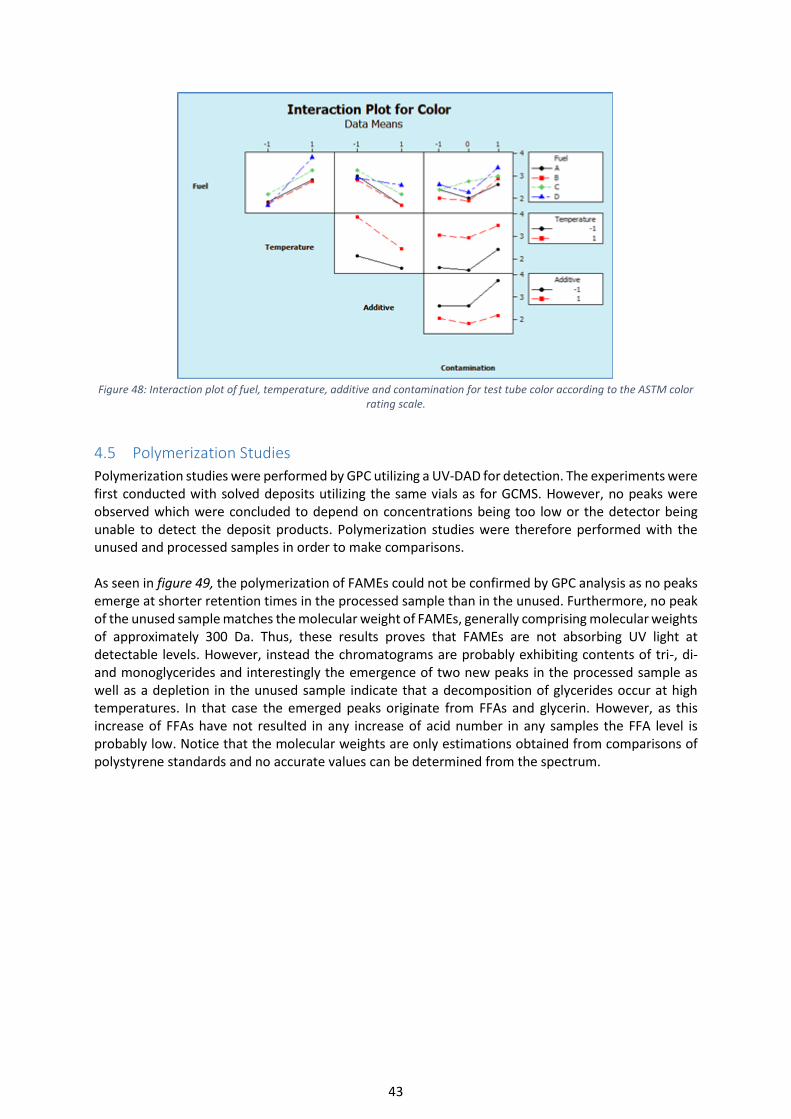
43
Figure 48: Interaction plot of fuel, temperature, additive and contamination for test tube color according to the ASTM color
rating scale.
4.5 Polymerization Studies
Polymerization studies were performed by GPC utilizing a UV-DAD for detection. The experiments were first conducted with solved deposits utilizing the same vials as for GCMS. However, no peaks were observed which were concluded to depend on concentrations being too low or the detector being unable to detect the deposit products. Polymerization studies were therefore performed with the unused and processed samples in order to make comparisons. As seen in figure 49, the polymerization of FAMEs could not be confirmed by GPC analysis as no peaks emerge at shorter retention times in the processed sample than in the unused. Furthermore, no peak of the unused sample matches the molecular weight of FAMEs, generally comprising molecular weights of approximately 300 Da. Thus, these results proves that FAMEs are not absorbing UV light at detectable levels. However, instead the chromatograms are probably exhibiting contents of tri-, di- and monoglycerides and interestingly the emergence of two new peaks in the processed sample as well as a depletion in the unused sample indicate that a decomposition of glycerides occur at high temperatures. In that case the emerged peaks originate from FFAs and glycerin. However, as this increase of FFAs have not resulted in any increase of acid number in any samples the FFA level is probably low. Notice that the molecular weights are only estimations obtained from comparisons of polystyrene standards and no accurate values can be determined from the spectrum.
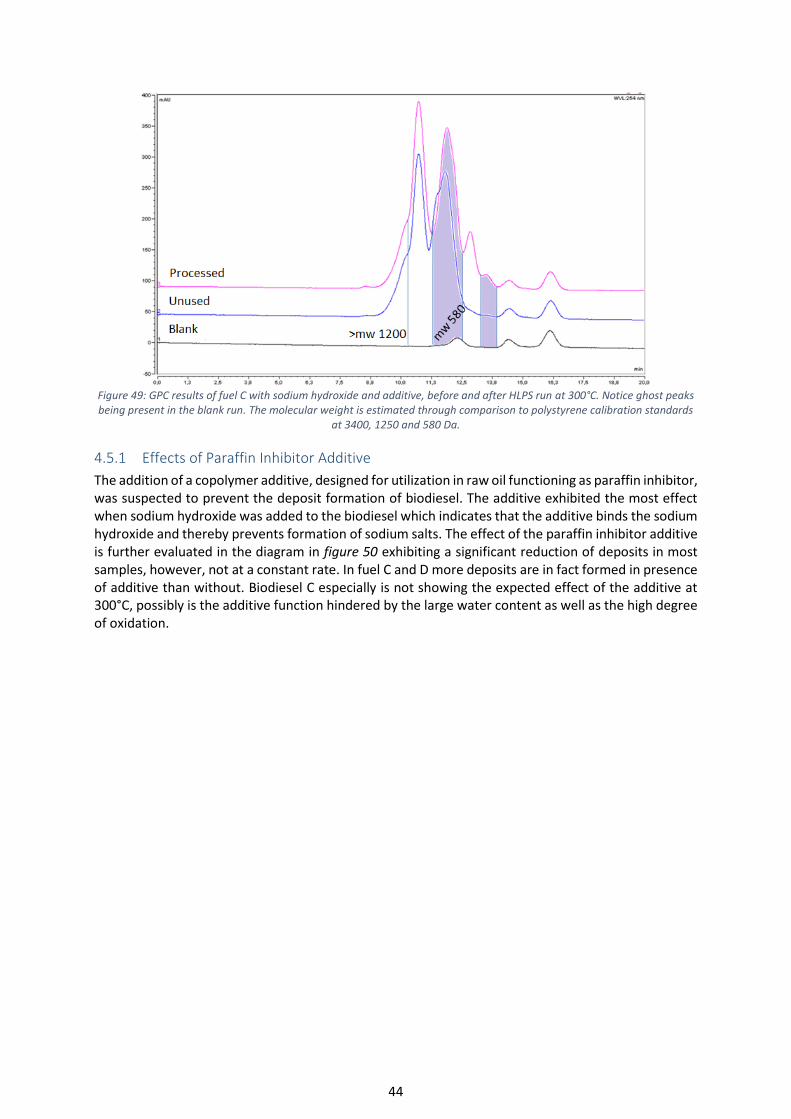
44
Figure 49: GPC results of fuel C with sodium hydroxide and additive, before and after HLPS run at 300°C. Notice ghost peaks being present in the blank run. The molecular weight is estimated through comparison to polystyrene calibration standards
at 3400, 1250 and 580 Da.
4.5.1 Effects of Paraffin Inhibitor Additive
The addition of a copolymer additive, designed for utilization in raw oil functioning as paraffin inhibitor, was suspected to prevent the deposit formation of biodiesel. The additive exhibited the most effect when sodium hydroxide was added to the biodiesel which indicates that the additive binds the sodium hydroxide and thereby prevents formation of sodium salts. The effect of the paraffin inhibitor additive is further evaluated in the diagram in figure 50 exhibiting a significant reduction of deposits in most samples, however, not at a constant rate. In fuel C and D more deposits are in fact formed in presence of additive than without. Biodiesel C especially is not showing the expected effect of the additive at 300°C, possibly is the additive function hindered by the large water content as well as the high degree of oxidation.
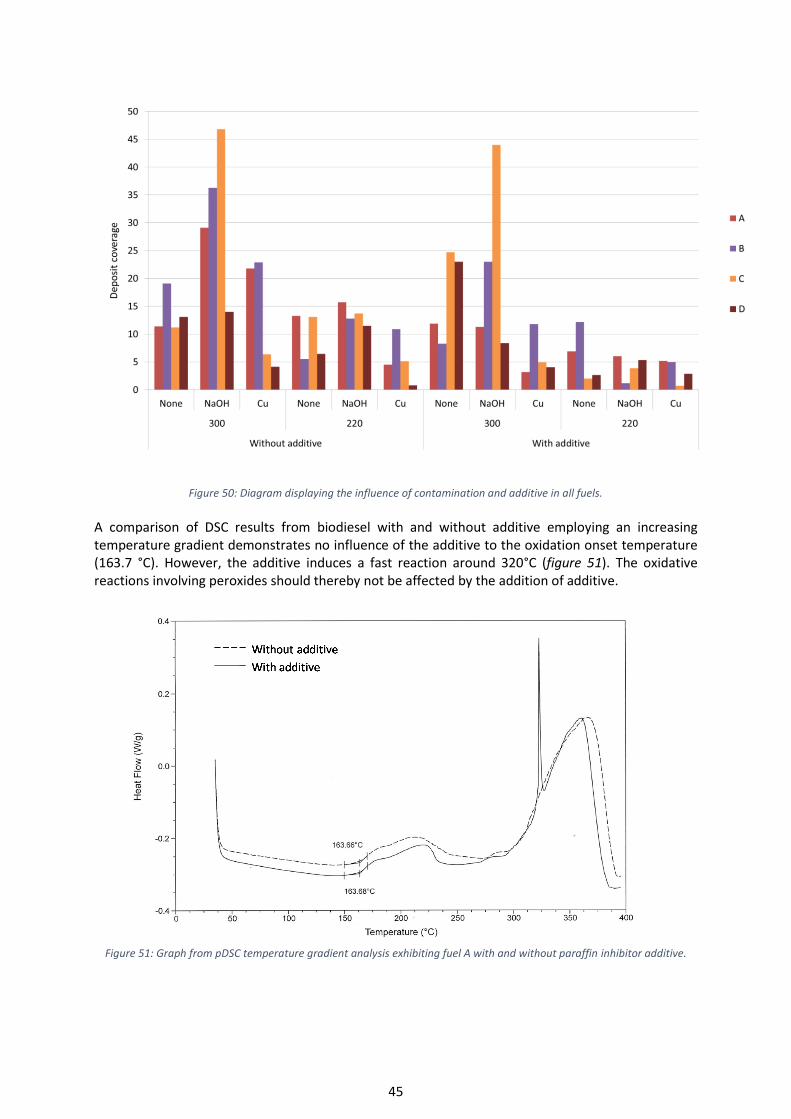
45
Figure 50: Diagram displaying the influence of contamination and additive in all fuels.
A comparison of DSC results from biodiesel with and without additive employing an increasing temperature gradient demonstrates no influence of the additive to the oxidation onset temperature (163.7 °C). However, the additive induces a fast reaction around 320°C (figure 51). The oxidative reactions involving peroxides should thereby not be affected by the addition of additive.
Figure 51: Graph from pDSC temperature gradient analysis exhibiting fuel A with and without paraffin inhibitor additive.
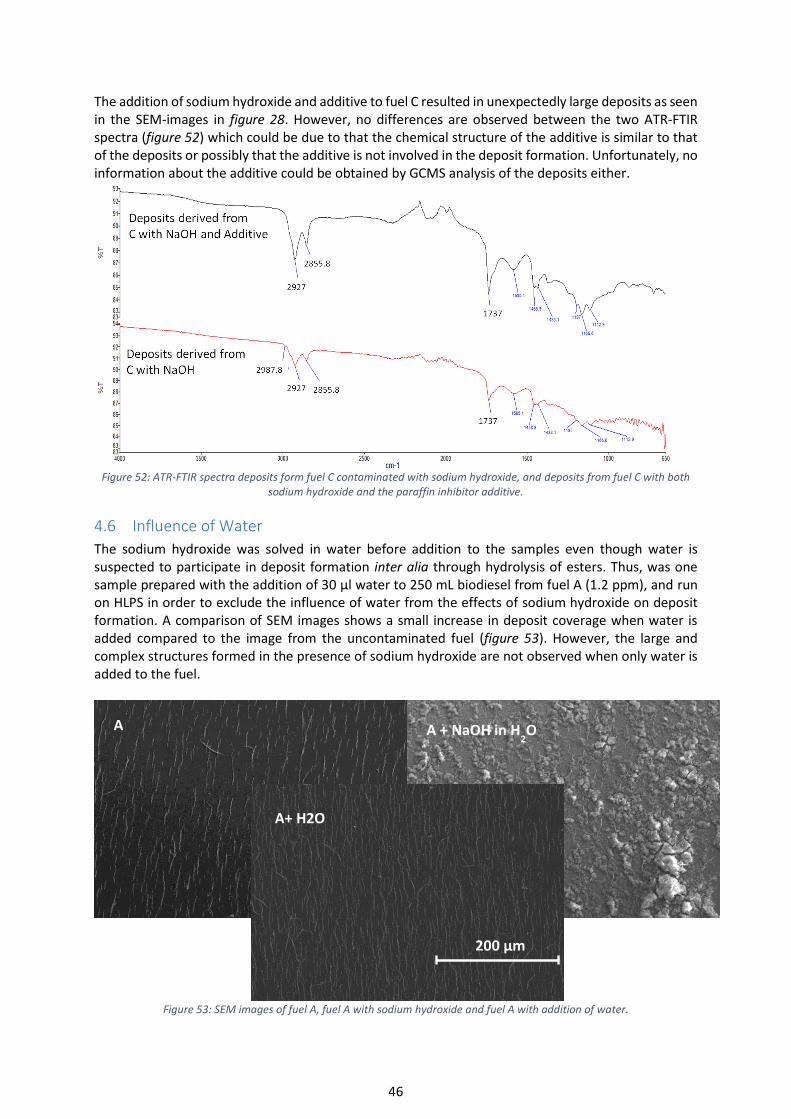
46
The addition of sodium hydroxide and additive to fuel C resulted in unexpectedly large deposits as seen in the SEM-images in figure 28. However, no differences are observed between the two ATR-FTIR spectra (figure 52) which could be due to that the chemical structure of the additive is similar to that of the deposits or possibly that the additive is not involved in the deposit formation. Unfortunately, no information about the additive could be obtained by GCMS analysis of the deposits either.
Figure 52: ATR-FTIR spectra deposits form fuel C contaminated with sodium hydroxide, and deposits from fuel C with both
sodium hydroxide and the paraffin inhibitor additive.
4.6 Influence of Water
The sodium hydroxide was solved in water before addition to the samples even though water is suspected to participate in deposit formation inter alia through hydrolysis of esters. Thus, was one sample prepared with the addition of 30 µl water to 250 mL biodiesel from fuel A (1.2 ppm), and run on HLPS in order to exclude the influence of water from the effects of sodium hydroxide on deposit formation. A comparison of SEM images shows a small increase in deposit coverage when water is added compared to the image from the uncontaminated fuel (figure 53). However, the large and complex structures formed in the presence of sodium hydroxide are not observed when only water is added to the fuel.
Figure 53: SEM images of fuel A, fuel A with sodium hydroxide and fuel A with addition of water.
200 µm
A A + NaOH in H2O
A+ H2O
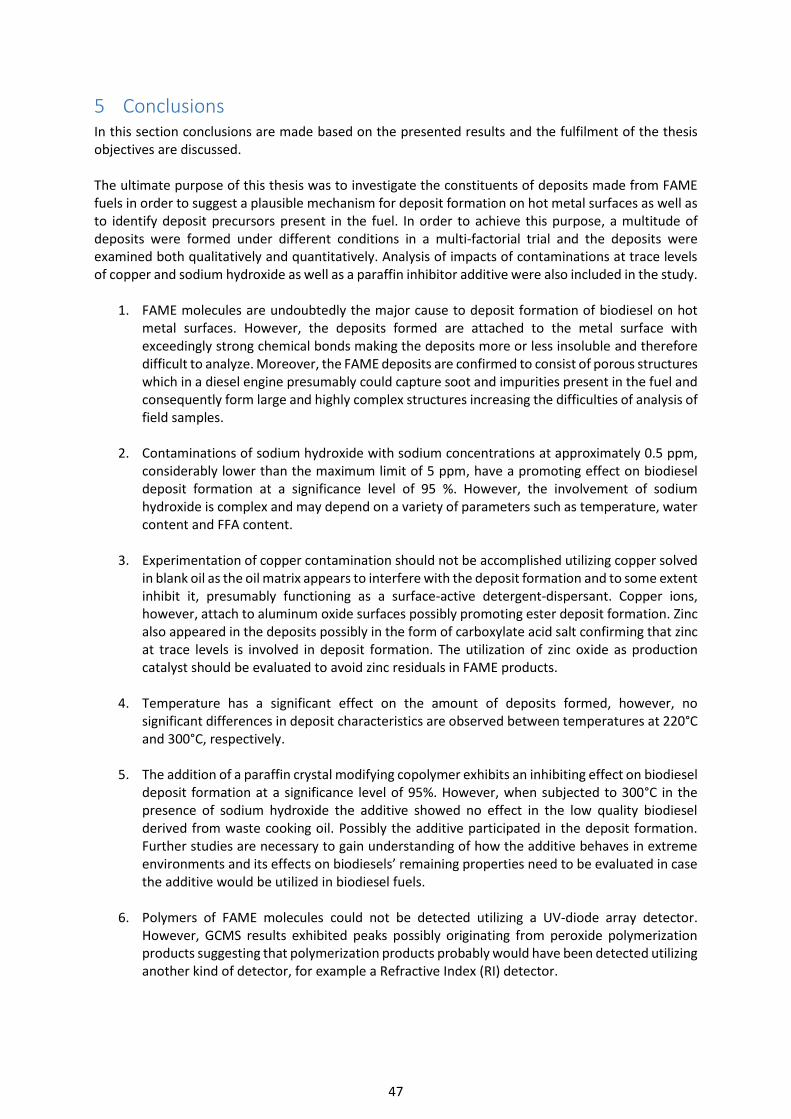
47
5 Conclusions In this section conclusions are made based on the presented results and the fulfilment of the thesis objectives are discussed. The ultimate purpose of this thesis was to investigate the constituents of deposits made from FAME fuels in order to suggest a plausible mechanism for deposit formation on hot metal surfaces as well as to identify deposit precursors present in the fuel. In order to achieve this purpose, a multitude of deposits were formed under different conditions in a multi-factorial trial and the deposits were examined both qualitatively and quantitatively. Analysis of impacts of contaminations at trace levels of copper and sodium hydroxide as well as a paraffin inhibitor additive were also included in the study.
1. FAME molecules are undoubtedly the major cause to deposit formation of biodiesel on hot metal surfaces. However, the deposits formed are attached to the metal surface with exceedingly strong chemical bonds making the deposits more or less insoluble and therefore difficult to analyze. Moreover, the FAME deposits are confirmed to consist of porous structures which in a diesel engine presumably could capture soot and impurities present in the fuel and consequently form large and highly complex structures increasing the difficulties of analysis of field samples.
2. Contaminations of sodium hydroxide with sodium concentrations at approximately 0.5 ppm, considerably lower than the maximum limit of 5 ppm, have a promoting effect on biodiesel deposit formation at a significance level of 95 %. However, the involvement of sodium hydroxide is complex and may depend on a variety of parameters such as temperature, water content and FFA content.
3. Experimentation of copper contamination should not be accomplished utilizing copper solved
in blank oil as the oil matrix appears to interfere with the deposit formation and to some extent inhibit it, presumably functioning as a surface-active detergent-dispersant. Copper ions, however, attach to aluminum oxide surfaces possibly promoting ester deposit formation. Zinc also appeared in the deposits possibly in the form of carboxylate acid salt confirming that zinc at trace levels is involved in deposit formation. The utilization of zinc oxide as production catalyst should be evaluated to avoid zinc residuals in FAME products.
4. Temperature has a significant effect on the amount of deposits formed, however, no significant differences in deposit characteristics are observed between temperatures at 220°C and 300°C, respectively.
5. The addition of a paraffin crystal modifying copolymer exhibits an inhibiting effect on biodiesel deposit formation at a significance level of 95%. However, when subjected to 300°C in the presence of sodium hydroxide the additive showed no effect in the low quality biodiesel derived from waste cooking oil. Possibly the additive participated in the deposit formation. Further studies are necessary to gain understanding of how the additive behaves in extreme environments and its effects on biodiesels’ remaining properties need to be evaluated in case the additive would be utilized in biodiesel fuels.
6. Polymers of FAME molecules could not be detected utilizing a UV-diode array detector. However, GCMS results exhibited peaks possibly originating from peroxide polymerization products suggesting that polymerization products probably would have been detected utilizing another kind of detector, for example a Refractive Index (RI) detector.

48
7. Degradation of peroxides is accelerated at high temperatures not correlating with any change in acid number suggesting that the resulting terminal oxidation products are not mainly free fatty acids but rather polymeric structures which contribute to the deposit formation.
Further studies are necessary in order to determine the main mechanisms occurring during thermal degradation of biodiesel. However, the results obtained in this study confirms that the Diels-Alder mechanism cannot be counted as the universal degradation pathway for FAME molecules as cyclic ene-compounds that then would have formed in an extent have not been observed at all in this study. Instead oxidation intermediates such as peroxides and epoxides may interact with double bonds forming polymerization products during heating. Unsaturated esters, compared to saturated, are more likely to contribute to the deposits due to polar interactions of the double bonds to deposit precursors attached to the hot metal surface. Due to the variety of fatty acid chains and remaining hydro carbons present in diesel fuels the thermal degradation probably consists of a wide range of mechanisms resulting in complex deposits. However, by identifying the major deposit precursors the solution to how to prevent fuel injector depositions comes one step closer.
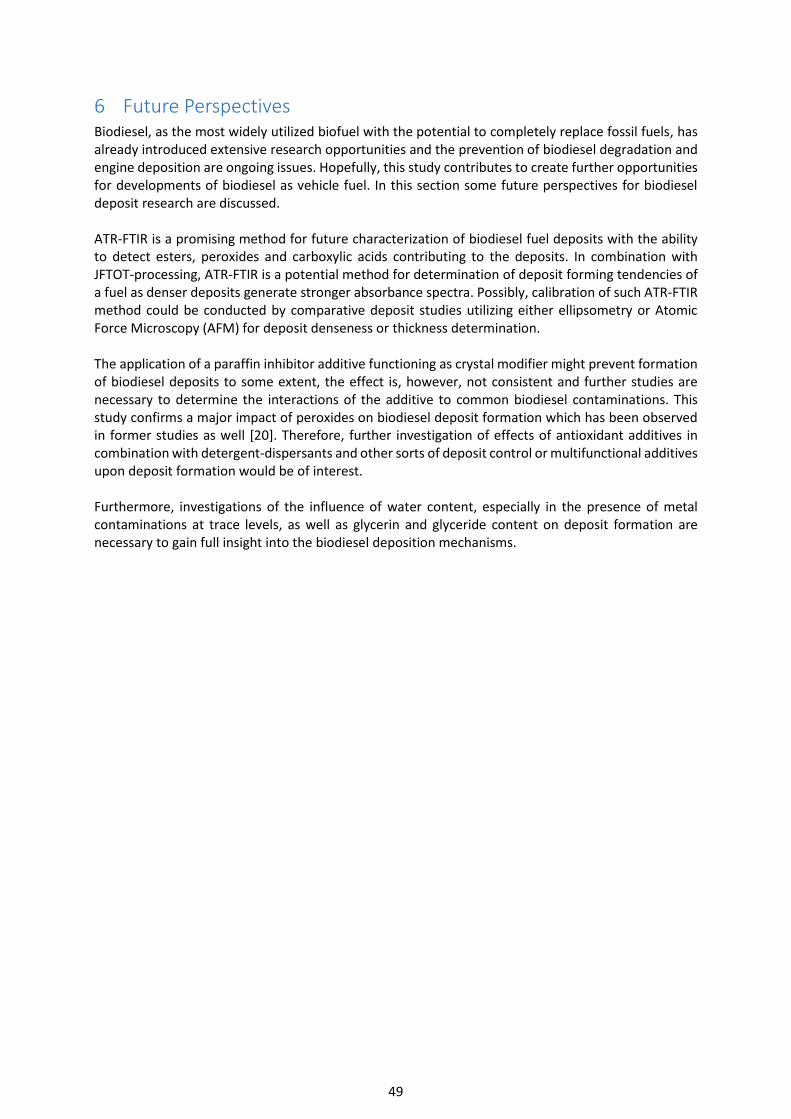
49
6 Future Perspectives Biodiesel, as the most widely utilized biofuel with the potential to completely replace fossil fuels, has already introduced extensive research opportunities and the prevention of biodiesel degradation and engine deposition are ongoing issues. Hopefully, this study contributes to create further opportunities for developments of biodiesel as vehicle fuel. In this section some future perspectives for biodiesel deposit research are discussed. ATR-FTIR is a promising method for future characterization of biodiesel fuel deposits with the ability to detect esters, peroxides and carboxylic acids contributing to the deposits. In combination with JFTOT-processing, ATR-FTIR is a potential method for determination of deposit forming tendencies of a fuel as denser deposits generate stronger absorbance spectra. Possibly, calibration of such ATR-FTIR method could be conducted by comparative deposit studies utilizing either ellipsometry or Atomic Force Microscopy (AFM) for deposit denseness or thickness determination. The application of a paraffin inhibitor additive functioning as crystal modifier might prevent formation of biodiesel deposits to some extent, the effect is, however, not consistent and further studies are necessary to determine the interactions of the additive to common biodiesel contaminations. This study confirms a major impact of peroxides on biodiesel deposit formation which has been observed in former studies as well [20]. Therefore, further investigation of effects of antioxidant additives in combination with detergent-dispersants and other sorts of deposit control or multifunctional additives upon deposit formation would be of interest. Furthermore, investigations of the influence of water content, especially in the presence of metal contaminations at trace levels, as well as glycerin and glyceride content on deposit formation are necessary to gain full insight into the biodiesel deposition mechanisms.

50
7 Acknowledgements During this project I have had the opportunity to work with a wide range of interesting and modern techniques within the biotechnical sector. For this wonderful learning experience I want to thank Rickard Jansson and Hans Karlsson who have supervised me with the outmost commitment through the whole project. Without you the project would not have proceeded and generated as much results as it did! Many thanks to the remaining personnel at the department for Fuel and Lubricant Testing (FLT) for putting up with me asking questions and messing up your laboratory, sometimes causing minor disasters! Thanks to all of you who shared your knowledge and supervised me during this project. Special thanks to Karin Lantz at the department for Metallic Materials and Surface Engineering (MMS) for a much appreciated introduction and supervision of SEM, the images certainly enlightened this master thesis. I would also like to thank the companies that have contributed to this project with samples for the study. Last but not least, I want to thank my family and friends for all of your support, especially my partner Peter for all the nicely cooked dinners and for reminding me to take a break once in a while.
51
8 References [1] Gnansounou, E., A. Dauriat, J. Villegas, and L. Panichelli, 2009, Life cycle assessment of biofuels:
Energy and greenhouse gas balances, Bioresource technology, vol. 100, no. 21, p. 4919-4930. [2] DIRECTIVE 2009/28/EC OF THE EUROPEAN PARLIAMENT AND OF THE COUNCIL of 23 April 2009,
OJ L 140, 5.6.2009, 16-16-62 [3] EurObserv’ER, 2012, EurObserv’ER Biofuels Barometer Available: the growth in biofuel
consumption slowed down in 2011, http://www.eurobserver.org/pdf/press/year_2012/biofuels/English.pdf, accessed: 2013-02-20
[4] EurObserv’ER, 2012, Biofuels Barometer, the increase in EU biofuel transport consumption in 2011, http://www.eurobserv-er.org/pdf/baro210.pdf, accessed: 2013-03-06
[5] Hong, J., 2012, Uncertainty propagation in life cycle assessment of biodiesel versus diesel: global warming and non-renewable energy, Bioresource technology, vol. 113, p. 3-7.
[6] Kutas, G., Lindberg, C., and Steenblik, R., 2007, BIOFUELS - AT WHAT COST? Government support for ethanol and biodiesel in the European Union, The Global Subsidies Initiative (GSI), Geneva, Switzerland
[7] Hoekman, S. K., A. Broch, C. Robbins, E. Ceniceros, and M. Natarajan, 2012, Review of biodiesel composition, properties, and specifications, Renewable and Sustainable Energy Reviews, vol. 16, no. 1, p. 143-169.
[8] Ullmann, J., M. Geduldig, H. Stutzenberger, R. Caprotti, and G. Balfour, 2008, Investigation into the Formation and Prevention of Internal Diesel Injector Deposits, SAE Technical Paper, vol. 2008-01-0926.
[9] Barker, J., P. Richards, M. Goodwin, and J. Wooler, 2009, Influence of High Injection Pressure on Diesel Fuel Stability: A Study of Resultant Deposits, SAE Technical Paper, vol. 2009-01-1877.
[10] Bouilly, J., A. Mohammadi, Y. Lida, H. Hashimoto, Z. Samaras, and S. Geivanidis, 2012, Biodiesel Stability and its Effects on Diesel Fuel Injection Equipment, SAE Technical Paper, vol. 2012-01-0860.
[11] Omori, T., A. Tanaka, K. Yamada, and S. Bunne, 2011, Biodiesel deposit formation mechanism and improvement of Fuel Injection Equipment (FIE) , SAE Technical Paper, vol. 2011-01-1935.
[12] Lacey, P., S. Gail, J. M. Kientz, N. Milovanovic, and C. Gris, 2011, Internal Fuel Injector Deposits, SAE Int. J. Fuels Lubr., vol. 5, no. 1, p. 132-133-145.
[13] Barker, J., P. Richard, C. Snape, and W. Meredith, 2011, Diesel Injector Deposits - An Issue That Has Evolved with Engine Technology, SAE Technical Paper, vol. 2011-01-1923.
[14] Ejaz, M. S. and J., Younis, 2008, A review of biodiesel as vehicular fuel, Renewable and Sustainable Energy Reviews, vol. 12, no. 9, p. 2484-2494
[15] ASTM D6751-12, 2012, Standard specification for biodiesel fuel blend stock (B100) for middle distillate fuels, West Conshohocken, United States of America, ASTM International
[16] Oh, P. P., H. L. N. Lau, J. Chen, M. F. Chong, and Y. M. Choo, 2012, A review on conventional technologies and emerging process intensification (PI) methods for biodiesel production, Renewable and Sustainable Energy Reviews, vol. 16, no. 7, p. 5131-5145
[17] Knothe, G., 2006, Analyzing Biodiesel: Standards and Other Methods, Journal of the American Oil Chemists' Society, vol. 83, no. 10, p. 823-833
[18] BS EN 590:2009 (2009), Automotive fuels. Diesel. Requirements and test methods, London,Great Britain, BSI-British Standard Institution
[19] Meher, L. C., Vidya S. D., and Naik S.N, 2006, Technical aspects of biodiesel production by transesterification—a review, Renewable and Sustainable Energy Reviews, 2006, vol. 10, no. 3, p. 248-268
[20] Fang, H. and R. McCormick, 2006, Spectroscopic Study of Biodiesel Degradation Pathways, SAE Technical Paper, vol. 2006-01-3300
[21] Helwani, Z., M. R. Othman, N. Aziz, W. J. N. Fernando, and J. Kim, 2009, Technologies for production of biodiesel focusing on green catalytic techniques: A review, Fuel Processing Technology, vol. 90, no. 12, p. 1502-1514
52
[22] Yang, F., Hanna, M., A. and Sun R., 2012, Value-added uses for crude glycerol-a byproduct of biodiesel production, Biotechnology for Biofuels, vol. 5, no. 1, p. 13.
[23] Ribeiro, A., Castro, F. and Carvalho, J., 2011, Influence of free fatty acid content in biodiesel production on non-edible oils, Wastes: Solutions, Treatments and Opportunities, 1st international Conference, September 12th-14th 2011
[24] Veljokovíc, V. B., Lakicévíc, S.H., Stamenkovíc, O.S., Todorovíc, Z.B. and Lazíc, M.L., 2006, Biodiesel production from tobacco (Nicotiana tabacum L.) seed oil with a high content of free fatty acids, Fuel, vol. 85, no. 17-18, p. 2671-2675
[25] European Parliament, C., 2009, DIRECTIVE 2009/28/EC OF THE EUROPEAN PARLIAMENT AND OF THE COUNCILnof 23 April 2009, OJ L, vol. 140, no. 5.6.2009, p. 16-16-62.
[26] BS EN 14214:2012, 2012, Liquid petroleum products – Fatty acid methyl esters (FAME) for use in diesel engines and heating applications – Requirements and test methods, Brussels, Belgium, CEN-European Committee for Standardization
[27] Knothe, G. and Dunn, R. O., 2003, Dependence of Oil Stability Index of Fatty Compounds on Their Structure and Concentration and Presence of Metals, Journal of the American Oil Chemists' Society, vol. 80, no. 10, p. 1021-1025
[28] McMurry, J, 2011, Fundamentals of Organic Chemistry international edition, 7E, Brooks/Cole, Cengage Learning
[29] ASTM D664-11a, 2011, Standard test method for Acid Number of Petroleum Products by potentiometric Titration, West Conshohocken, United States of America, ASTM International
[30] Rodrigo A. A. Munoz, David M. Fernandes, Douglas Q. Santos, Tatielli G. G. Barbosa and Raquel M. F. Sousa, 2012, Biodiesel: Production, Characterization, Chapter 6 Metallic Corrosion and Analytical Methods for Contaminants, Biodiesel - Feedstocks, Production and Applications, Prof. Zhen Fang (Ed.)
[31] Beck, A., M. Bubalik, and J. Hancsok, 2011, Development of Multifunctional Detergent-Dispersant Additives Based on Fatty Acid Methyl Ester for Diesel and Biodiesel Fuel, Biodiesel- Quality, Emissions and By-Products, Montero, D. G., (Ed.)
[32] Tang, H., A. Wang, S. O. Salley, and K. Y. Simon Ng, 2008, The Effect of Natural and Synthetic Antioxidants on the Oxidative Stability of Biodiesel, Journal of the American Oil Chemists' Society (JAOCS), vol. 85, no. 4, p. 13-13
[33] Schwab, S. D., J. J. Bennett, S. J. Dell, J. M. Galante-Fox, A. M. Kulinowsky, and K. T. Miller, 2010, Internal Injector Deposits in High-Pressure Common Rail Diesel Engines, SAE Int. J. Fuels Lubr., vol. 3, no. 2, p. 865-865-878
[34] Xu, J., S. Xing, H. Qian, S. Chen, X. Wei, R. Zhang, L. Li, and X. Guo, 2013, Effect of polar/nonpolar groups in comb-type copolymers on cold flowability and paraffin crystallization of waxy oils, Fuel, vol. 103, no. 0, p. 600-605
[35] Yusmady Bin, M. A., 2009, Diesel and Bio-diesel deposits on a Hot Wall Surface, Thesis for doctor in philosophy, Prof. Masatakaari ph. D. Eng, department of system engineering Gumma University, Japan
[36] Kono, N., K. Yamamori, T. Furukawa, and M. Noorman, 2012, FAME Blended Diesel Fuel Impacts on Engine/Vehicle Systems, SAE Int. J. Fuels Lubr., vol. 5, no. 1, p. 163-163-179
[37] Pattamaprom, C., W. Pakdee, and S. Ngamjaroen, 2012, Storage degradation of palm-derived biodiesels: Its effects on chemical properties and engine performance, Renewable Energy, vol. 37, no. 1, p. 412-418
[38] Ogawa, T., S., Kajiya, S., Kosaka, I., Tajima, M., Yamamoto and M., Okada, (2008), Analysis of Oxidative Deterioration of Biodiesel Fuel. SAE Technical Paper 2008-01-2502
[39] Waynick, J. A., 2007, Characterization of biodiesel oxidation and oxidation products, Texas, United States of America: Fuels and Lubricants Technology Department
[40] Arca, M., B. K., Sharma, N. P. J., Price, J. M. Perez, and K. M., Doll, 2011, Evidence contrary to the accepted Diels-Alder Mechanism in the thermal modification of vegetable oil, Journal of American Oil and Chemistry Society, vol. 89, p. 987-994
53
[41] Karavalakis, G., G. Fontaras, D. Ampatzoglou, M. Kousoulidou, S. Stournas, Z. Samaras, and E. Bakeas, 2010, Effects of low concentration biodiesel blends application on modern passenger cars. Part 3: Impact on PAH, nitro-PAH, and oxy-PAH emissions, Environmental Pollution, vol. 158, no. 5, p. 1584-1594
[42] Mikami, K. and M. Shimizu, 1992, Asymmetric Ene Reactions in Organic Synthesis, American Chemical Society, vol. 92, no. 5, p. 1021-1050
[43] Schwab A. W., G. J., Dykstra, E. Selke, S. C. Sorenson and H., Pryde, 1988, Diesel fuel from thermal decomposition of soybean oil. Journal of American Oil and Chemistry Society, vol. 65 p. 1781–1785
[44] Knothe, G., 2001, Analytical Methods Used in the Production and Fuel Quality Assessment of Biodiesel, Trans. ASAE, vol. 44, p. 193–200
[45] BS EN 14103:2011, 2011, Fat and oil derivatives - Fatty Acid Methyl Esters (FAME) - Determination of ester and linolenic acid methyl ester contents, London, Great Britain, BSI-British Standard Institution
[46] BS EN 14078:2009, 2009, Liquid petroleum products. Determination of fatty acid methyl ester (FAME) content in middle distillates. Infrared spectrometry method, London, Great Britain, BSI-British Standard Institution
[47] ASTM D6474-12, 2012, Standard Test Method for Determining Molecular Weight Distribution and Molecular Weight Averages of Polyolefins by High Temperature Gel Permeation Chromatography, West Conshohocken, United States of America, ASTM International
[48] Chuck, C. J., C. D. Bannister, R. W. Jenkins, J. P. Lowe, and M. G. Davidson, 2012, A comparison of analytical techniques and the products formed during the decomposition of biodiesel under accelerated conditions, Fuel, vol. 96, no. 0, p. 426-433
[49] Honorato, F. A., Honorato, R. S., Pimentelc, M. F. and Araujo M. C. U., 2002, Analytical curve or standard addition method: how to elect and design—a strategy applied to copper determination in sugarcane spirits using AAS, Analyst, vol. 127, p. 1520-1525
[50] ASTM D7220-12, 2012, Standard Test Method for Sulfur in Automotive, Heating, and Jet Fuels by Monochromatic Energy Dispersive X-ray Fluorescence Spectrometry, West Conshohocken, United States of America, ASTM International
[51] BS EN 15751:2009, 2009, Automotive fuels – Fatty acid methyl ester (FAME) fuel and blends with diesel fuel – Determination of oxidation stability by accelerated oxidation method, London, Great Britain: BSI – British Standards Institution
[52] ASTM D6186-08, 2008, Standard Test Method for Oxidation Induction Time of Lubricating Oils by Pressure Differential Scanning Calorimetry (PDSC), West Conshohocken, United States of America, ASTM International
[53] Leonardo, R. S.; Murta Valle, M. L.; Dweck J., 2012, An alternative method by pressurized DSC to evaluate biodiesel antioxidants efficiency, Journal of Thermal Analysis and Calorimetry, vol. 108, no. 2, p. 751 – 759
[54] Alcor Petroleum Corporation, 1982, HLPS User’s Manual. Alcor Petroleum Instruments Inc. [55] Newbury, D. E. and Ritchie, N. W. M., 2012, Is Scanning Electron Microscopy/Energy Dispersive X-
ray Spectrometry (SEM/EDS) Quantitative?, The Journal of Scanning Microscopies, vol. 0, p. 1–28 [56] Wilson, K., Walker, J., 2010, Principles and Techniques of Biochemistry and Molecular Biology,
Seventh edition, Cambridge University Press, p. 130-132 [57] Harris, D. C., 2007, Quantitative Chemical Analysis Seventh edition, W. H. Freeman and Company,
p. 460, 507, 542-543 [58] ASTM D3703-07, 2012, Standard Test Method for Hydroperoxide Number of Aviation Turbine
Fuels, Gasoline and Diesel Fuels, West Conshohocken, United States of America, ASTM International
[59] ASTM D3241-12, 2012, Standard Test Method for Thermal Oxidation Stability of Aviation Turbine Fuels, West Conshohocken, United States of America, ASTM International
54
[60] Cooper, W. J., R. G. Zika, R. G. Petasne, and J. M. C. Plane, 1988, Photochemical formation of hydrogen peroxide in natural waters exposed to sunlight, Environmental science & technology, vol. 22, no. 10, p. 1156-1160
[61] Dodos, G. S., Zannikos, F. And Stournas, S., 2009, Effect of Metals in the Oxidation Stability and Lubricity of Biodiesel Fuel, SAE Tech. Paper Series, no 01-1829
[62] Silverstein, R. M., Clayton Bassler, G., Morrill, T. C., 1991, Spectrometric Identification of organic compounds, fifth edition, John Wiley and Sons Inc.
[63] Painsi, M. and Grafl, Alexander, 2013, Understanding Internal Diesel Injector Deposits: New Insights from Laboratory Experiments, 9th International Colloquium Fuel, Technische Akademie Esslingen, Germany
[64] Higdon, T., 2010, FTIR Spectroscopy Technology, Market Evolution and Future Strategies of Bruker Optics Inc., B.S. Physics, McGill University, Master of Science in Engineering and Management, Massachusetts Institute of Technology, United States of America
[65] Schick, C., 2008, Differential scanning calorimeter (DSC) with temperature controlled furnace, US Patent no. 7448796, United States of America
[66] Holding, R., Meehan, E., 1995, Molecular Weight Characterization of Synthetic Polymers, Dolbey, R. (Ed.) Rapra Technology Limited, Report 83, vol. 7, no. 11
[67] Barbour, R., Quigley, R., Panesar, A., Payne, J., 2013, Finding a solution To internal deposits, 9th International Colloquium Fuel, Technische Akademie Esslingen, Germany
[68] Wang, H., Tang, H., Wilson, J., Salley, S. O. and Simon Ng K. Y., 2008, Total Acid Number Determination of Biodiesel and Biodiesel Blends, Journal of American Oil and Chemistry Society, vol. 85, p. 1083-1086
[69] Axens Process Licensing, Esterfip-H™ A BREAKTHROUGH IN BIODIESEL PRODUCTION, Axens Group Technologies, Paris, France, http://gep-france.com/biocarb/axens.pdf, accessed: 2013-02-25
[70] Coates, J., 2000, Interpretation of Infrared Spectra, A Practical Approach, Encyclopedia of Analytical Chemistry, R.A. Meyers (Ed.), John Wiley & Sons Ltd. p. 10815–10837
[71] Kane, S. R., Ashby, P. D. and Pruitt, A. L., 2009. Characterization and tribology of PEG-like coatings on UHMWPE for total hip replacements, Joint Graduate Group in Bioengineering, Journal of Biomedical Materials Research Part A, p. 1500-1509
[72] Brown, S. T., H. Wong, C. B. Hinderer and J. Klettlinger, 2012, Enhancement of Aviation Fuel Thermal Stability Characterization through Application of Ellipsometry, National Aeronautics and Space Administration, NASA/TM-2012-217404
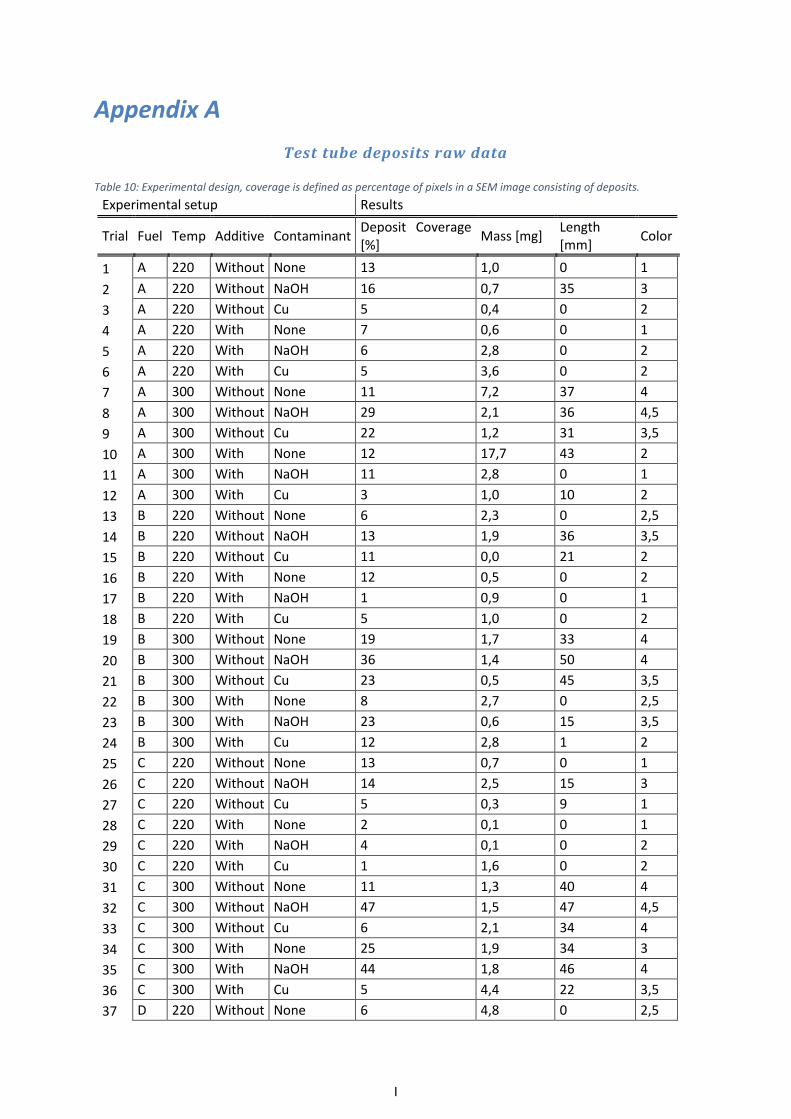
I
Appendix A
Test tube deposits raw data Table 10: Experimental design, coverage is defined as percentage of pixels in a SEM image consisting of deposits.
Experimental setup Results
Trial Fuel Temp Additive Contaminant Deposit Coverage [%]
Mass [mg] Length [mm]
Color
1 A 220 Without None 13 1,0 0 1
2 A 220 Without NaOH 16 0,7 35 3
3 A 220 Without Cu 5 0,4 0 2
4 A 220 With None 7 0,6 0 1
5 A 220 With NaOH 6 2,8 0 2
6 A 220 With Cu 5 3,6 0 2
7 A 300 Without None 11 7,2 37 4
8 A 300 Without NaOH 29 2,1 36 4,5
9 A 300 Without Cu 22 1,2 31 3,5
10 A 300 With None 12 17,7 43 2
11 A 300 With NaOH 11 2,8 0 1
12 A 300 With Cu 3 1,0 10 2
13 B 220 Without None 6 2,3 0 2,5
14 B 220 Without NaOH 13 1,9 36 3,5
15 B 220 Without Cu 11 0,0 21 2
16 B 220 With None 12 0,5 0 2
17 B 220 With NaOH 1 0,9 0 1
18 B 220 With Cu 5 1,0 0 2
19 B 300 Without None 19 1,7 33 4
20 B 300 Without NaOH 36 1,4 50 4
21 B 300 Without Cu 23 0,5 45 3,5
22 B 300 With None 8 2,7 0 2,5
23 B 300 With NaOH 23 0,6 15 3,5
24 B 300 With Cu 12 2,8 1 2
25 C 220 Without None 13 0,7 0 1
26 C 220 Without NaOH 14 2,5 15 3
27 C 220 Without Cu 5 0,3 9 1
28 C 220 With None 2 0,1 0 1
29 C 220 With NaOH 4 0,1 0 2
30 C 220 With Cu 1 1,6 0 2
31 C 300 Without None 11 1,3 40 4
32 C 300 Without NaOH 47 1,5 47 4,5
33 C 300 Without Cu 6 2,1 34 4
34 C 300 With None 25 1,9 34 3
35 C 300 With NaOH 44 1,8 46 4
36 C 300 With Cu 5 4,4 22 3,5
37 D 220 Without None 6 4,8 0 2,5

II
38 D 220 Without NaOH 12 1,0 7 3
39 D 220 Without Cu 1 0,1 0 1
40 D 220 With None 3 0,8 0 1
41 D 220 With NaOH 5 4,2 0 2
42 D 220 With Cu 3 0,3 0 1
43 D 300 Without None 13 -0,9 51 2
44 D 300 Without NaOH 14 0,9 36 4,5
45 D 300 Without Cu 4 -2,0 45 4
46 D 300 With None 23 2,7 5 2
47 D 300 With NaOH 8 2,8 0 2
48 D 300 With Cu 4 2,8 0 2
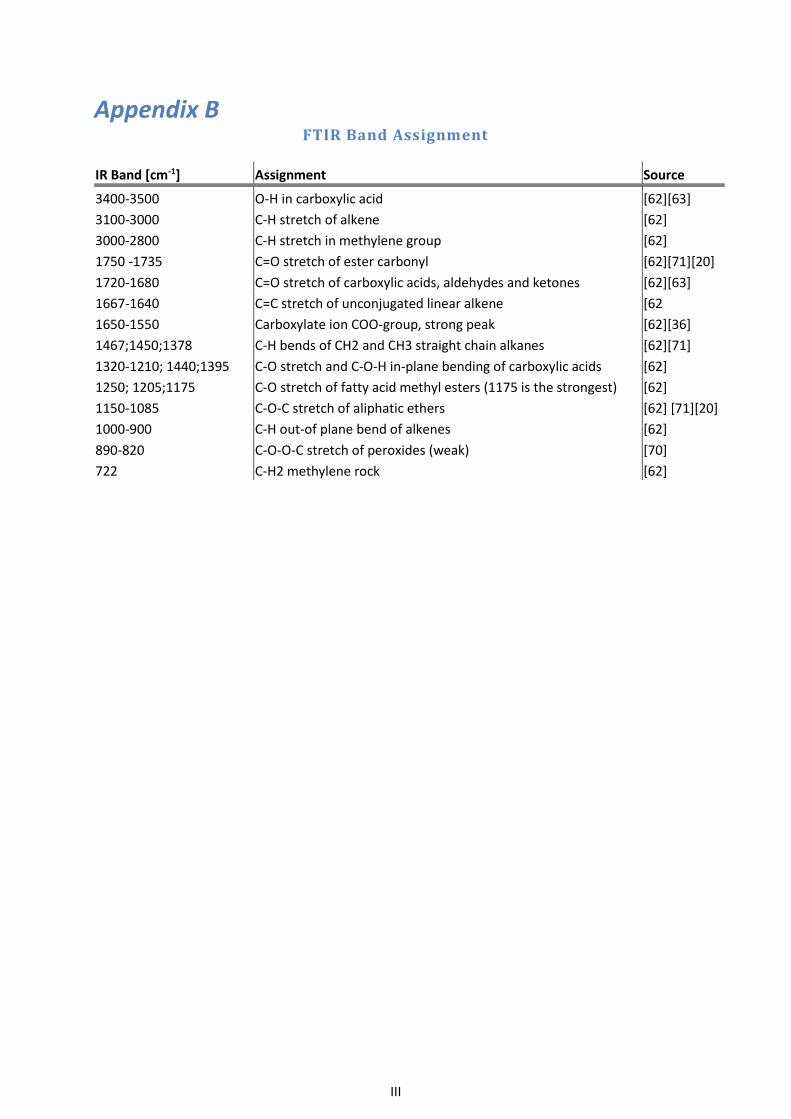
III
Appendix B FTIR Band Assignment
IR Band [cm-1] Assignment Source
3400-3500 O-H in carboxylic acid [62][63]
3100-3000 C-H stretch of alkene [62]
3000-2800 C-H stretch in methylene group [62]
1750 -1735 C=O stretch of ester carbonyl [62][71][20]
1720-1680 C=O stretch of carboxylic acids, aldehydes and ketones [62][63]
1667-1640 C=C stretch of unconjugated linear alkene [62
1650-1550 Carboxylate ion COO-group, strong peak [62][36]
1467;1450;1378 C-H bends of CH2 and CH3 straight chain alkanes [62][71]
1320-1210; 1440;1395 C-O stretch and C-O-H in-plane bending of carboxylic acids [62]
1250; 1205;1175 C-O stretch of fatty acid methyl esters (1175 is the strongest) [62]
1150-1085 C-O-C stretch of aliphatic ethers [62] [71][20]
1000-900 C-H out-of plane bend of alkenes [62]
890-820 C-O-O-C stretch of peroxides (weak) [70]
722 C-H2 methylene rock [62]
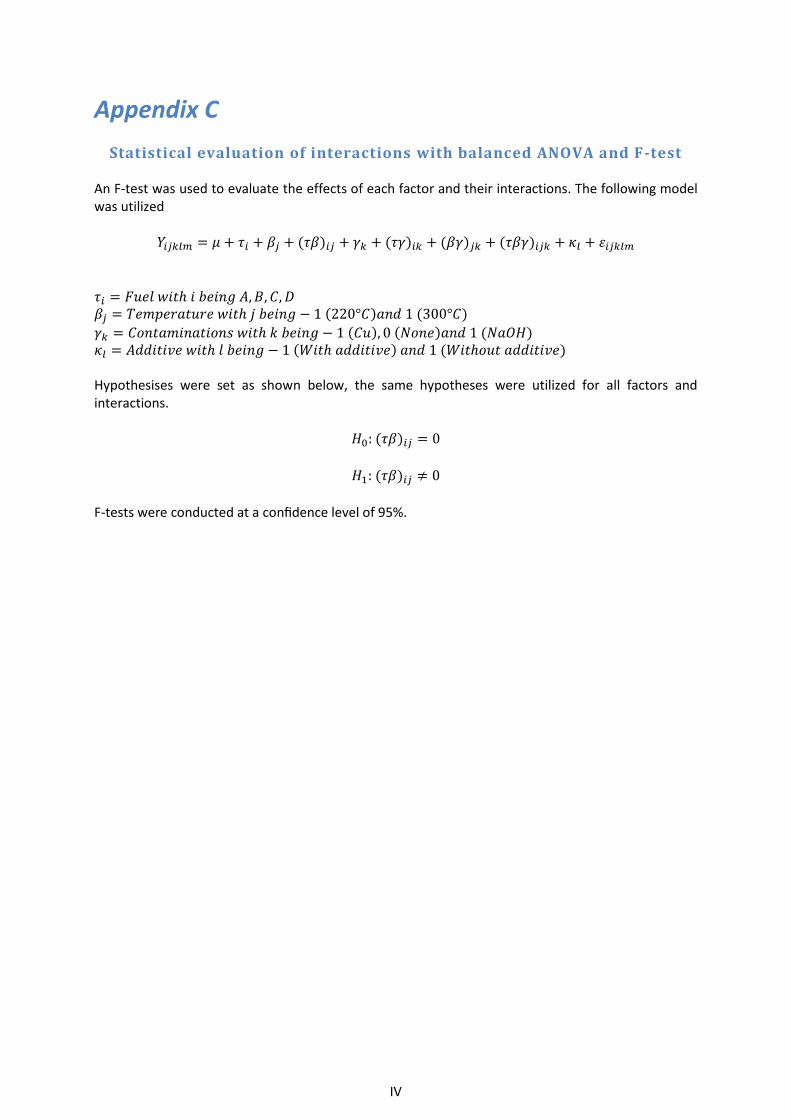
IV
Appendix C
Statistical evaluation of interactions with balanced ANOVA and F-test An F-test was used to evaluate the effects of each factor and their interactions. The following model was utilized
𝑌𝑖𝑗𝑘𝑙𝑚 = 𝜇 + 𝜏𝑖 + 𝛽𝑗 + (𝜏𝛽)𝑖𝑗 + 𝛾𝑘 + (𝜏𝛾)𝑖𝑘 + (𝛽𝛾)𝑗𝑘 + (𝜏𝛽𝛾)𝑖𝑗𝑘 + 𝜅𝑙 + 𝜀𝑖𝑗𝑘𝑙𝑚
𝜏𝑖 = 𝐹𝑢𝑒𝑙 𝑤𝑖𝑡ℎ 𝑖 𝑏𝑒𝑖𝑛𝑔 𝐴, 𝐵, 𝐶, 𝐷 𝛽𝑗 = 𝑇𝑒𝑚𝑝𝑒𝑟𝑎𝑡𝑢𝑟𝑒 𝑤𝑖𝑡ℎ 𝑗 𝑏𝑒𝑖𝑛𝑔 − 1 (220°𝐶)𝑎𝑛𝑑 1 (300°𝐶)
𝛾𝑘 = 𝐶𝑜𝑛𝑡𝑎𝑚𝑖𝑛𝑎𝑡𝑖𝑜𝑛𝑠 𝑤𝑖𝑡ℎ 𝑘 𝑏𝑒𝑖𝑛𝑔 − 1 (𝐶𝑢), 0 (𝑁𝑜𝑛𝑒)𝑎𝑛𝑑 1 (𝑁𝑎𝑂𝐻) 𝜅𝑙 = 𝐴𝑑𝑑𝑖𝑡𝑖𝑣𝑒 𝑤𝑖𝑡ℎ 𝑙 𝑏𝑒𝑖𝑛𝑔 − 1 (𝑊𝑖𝑡ℎ 𝑎𝑑𝑑𝑖𝑡𝑖𝑣𝑒) 𝑎𝑛𝑑 1 (𝑊𝑖𝑡ℎ𝑜𝑢𝑡 𝑎𝑑𝑑𝑖𝑡𝑖𝑣𝑒) Hypothesises were set as shown below, the same hypotheses were utilized for all factors and interactions.
𝐻0: (𝜏𝛽)𝑖𝑗 = 0
𝐻1: (𝜏𝛽)𝑖𝑗 ≠ 0
F-tests were conducted at a confidence level of 95%.
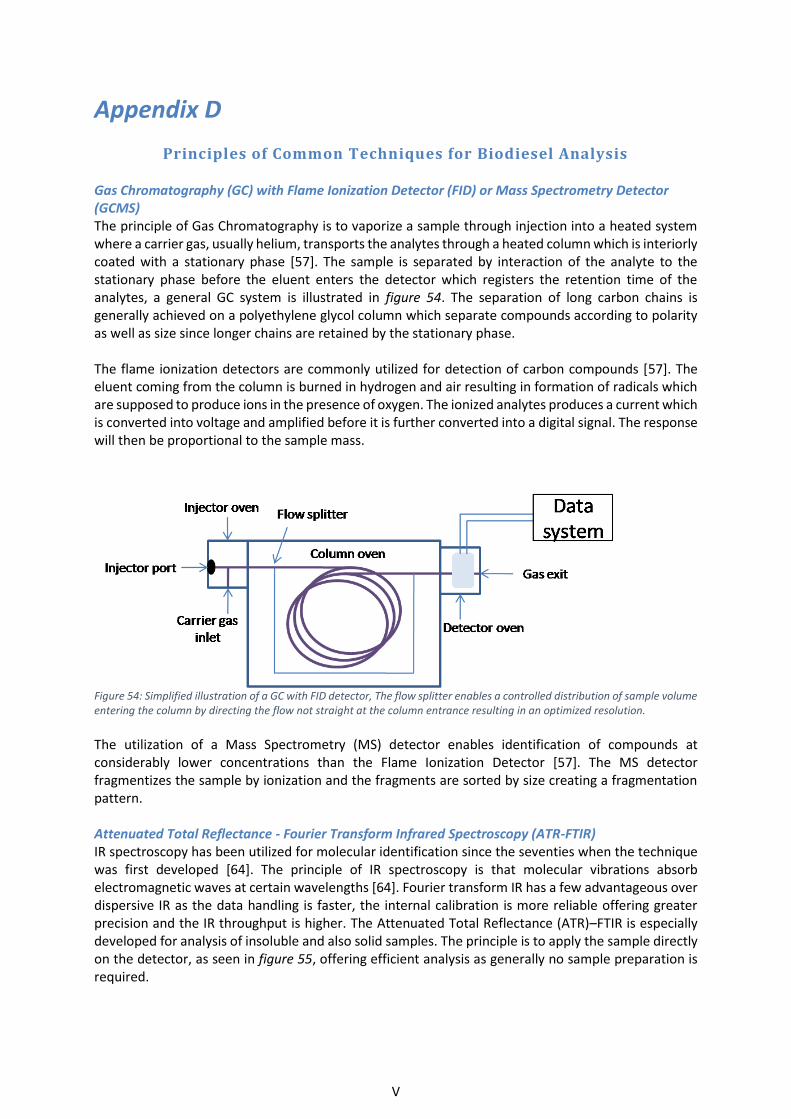
V
Appendix D
Principles of Common Techniques for Biodiesel Analysis
Gas Chromatography (GC) with Flame Ionization Detector (FID) or Mass Spectrometry Detector (GCMS) The principle of Gas Chromatography is to vaporize a sample through injection into a heated system where a carrier gas, usually helium, transports the analytes through a heated column which is interiorly coated with a stationary phase [57]. The sample is separated by interaction of the analyte to the stationary phase before the eluent enters the detector which registers the retention time of the analytes, a general GC system is illustrated in figure 54. The separation of long carbon chains is generally achieved on a polyethylene glycol column which separate compounds according to polarity as well as size since longer chains are retained by the stationary phase. The flame ionization detectors are commonly utilized for detection of carbon compounds [57]. The eluent coming from the column is burned in hydrogen and air resulting in formation of radicals which are supposed to produce ions in the presence of oxygen. The ionized analytes produces a current which is converted into voltage and amplified before it is further converted into a digital signal. The response will then be proportional to the sample mass.
Figure 54: Simplified illustration of a GC with FID detector, The flow splitter enables a controlled distribution of sample volume entering the column by directing the flow not straight at the column entrance resulting in an optimized resolution.
The utilization of a Mass Spectrometry (MS) detector enables identification of compounds at considerably lower concentrations than the Flame Ionization Detector [57]. The MS detector fragmentizes the sample by ionization and the fragments are sorted by size creating a fragmentation pattern. Attenuated Total Reflectance - Fourier Transform Infrared Spectroscopy (ATR-FTIR) IR spectroscopy has been utilized for molecular identification since the seventies when the technique was first developed [64]. The principle of IR spectroscopy is that molecular vibrations absorb electromagnetic waves at certain wavelengths [64]. Fourier transform IR has a few advantageous over dispersive IR as the data handling is faster, the internal calibration is more reliable offering greater precision and the IR throughput is higher. The Attenuated Total Reflectance (ATR)–FTIR is especially developed for analysis of insoluble and also solid samples. The principle is to apply the sample directly on the detector, as seen in figure 55, offering efficient analysis as generally no sample preparation is required.
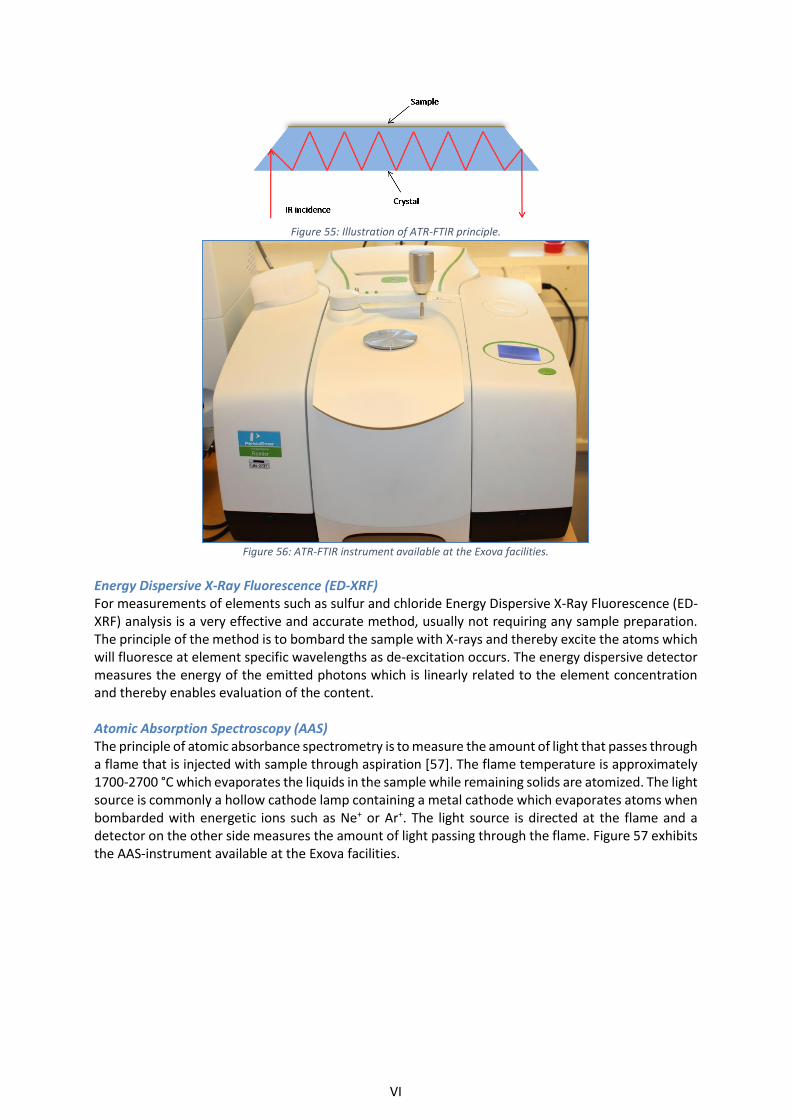
VI
Figure 55: Illustration of ATR-FTIR principle.
Figure 56: ATR-FTIR instrument available at the Exova facilities.
Energy Dispersive X-Ray Fluorescence (ED-XRF) For measurements of elements such as sulfur and chloride Energy Dispersive X-Ray Fluorescence (ED-XRF) analysis is a very effective and accurate method, usually not requiring any sample preparation. The principle of the method is to bombard the sample with X-rays and thereby excite the atoms which will fluoresce at element specific wavelengths as de-excitation occurs. The energy dispersive detector measures the energy of the emitted photons which is linearly related to the element concentration and thereby enables evaluation of the content. Atomic Absorption Spectroscopy (AAS) The principle of atomic absorbance spectrometry is to measure the amount of light that passes through a flame that is injected with sample through aspiration [57]. The flame temperature is approximately 1700-2700 °C which evaporates the liquids in the sample while remaining solids are atomized. The light source is commonly a hollow cathode lamp containing a metal cathode which evaporates atoms when bombarded with energetic ions such as Ne+ or Ar+. The light source is directed at the flame and a detector on the other side measures the amount of light passing through the flame. Figure 57 exhibits the AAS-instrument available at the Exova facilities.
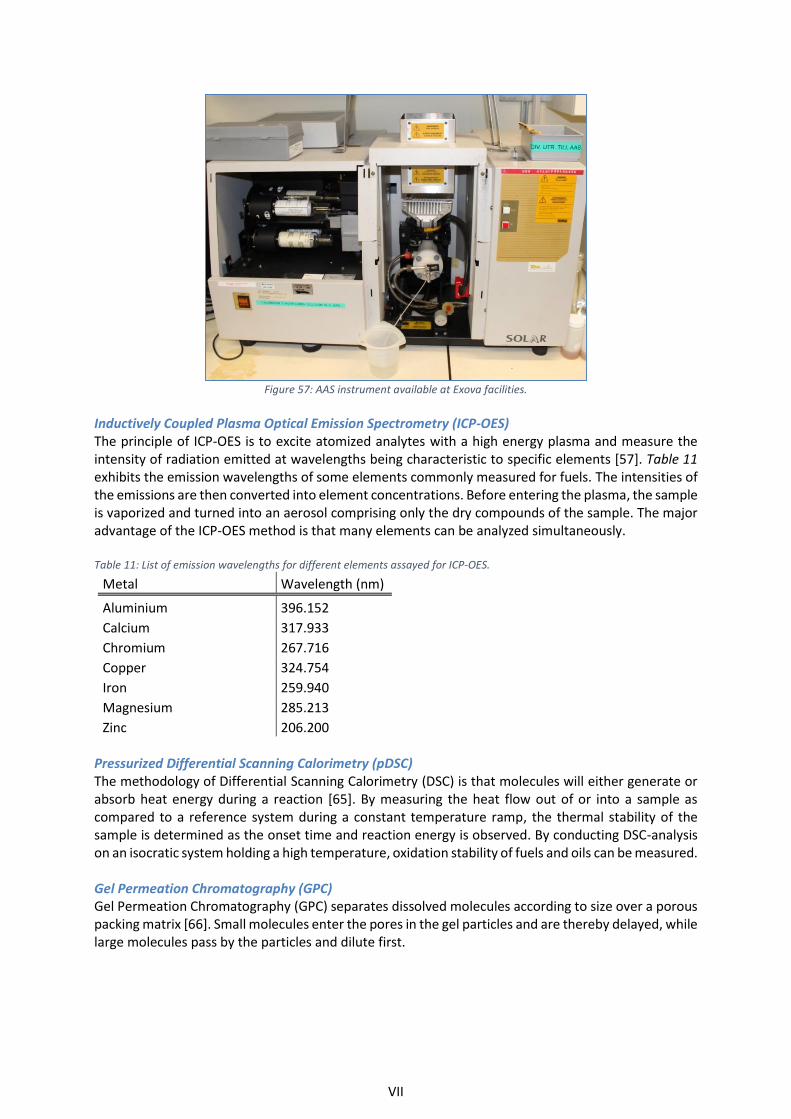
VII
Figure 57: AAS instrument available at Exova facilities.
Inductively Coupled Plasma Optical Emission Spectrometry (ICP-OES) The principle of ICP-OES is to excite atomized analytes with a high energy plasma and measure the intensity of radiation emitted at wavelengths being characteristic to specific elements [57]. Table 11 exhibits the emission wavelengths of some elements commonly measured for fuels. The intensities of the emissions are then converted into element concentrations. Before entering the plasma, the sample is vaporized and turned into an aerosol comprising only the dry compounds of the sample. The major advantage of the ICP-OES method is that many elements can be analyzed simultaneously. Table 11: List of emission wavelengths for different elements assayed for ICP-OES.
Metal Wavelength (nm)
Aluminium 396.152
Calcium 317.933
Chromium 267.716
Copper 324.754
Iron 259.940
Magnesium 285.213
Zinc 206.200 Pressurized Differential Scanning Calorimetry (pDSC) The methodology of Differential Scanning Calorimetry (DSC) is that molecules will either generate or absorb heat energy during a reaction [65]. By measuring the heat flow out of or into a sample as compared to a reference system during a constant temperature ramp, the thermal stability of the sample is determined as the onset time and reaction energy is observed. By conducting DSC-analysis on an isocratic system holding a high temperature, oxidation stability of fuels and oils can be measured. Gel Permeation Chromatography (GPC) Gel Permeation Chromatography (GPC) separates dissolved molecules according to size over a porous packing matrix [66]. Small molecules enter the pores in the gel particles and are thereby delayed, while large molecules pass by the particles and dilute first.
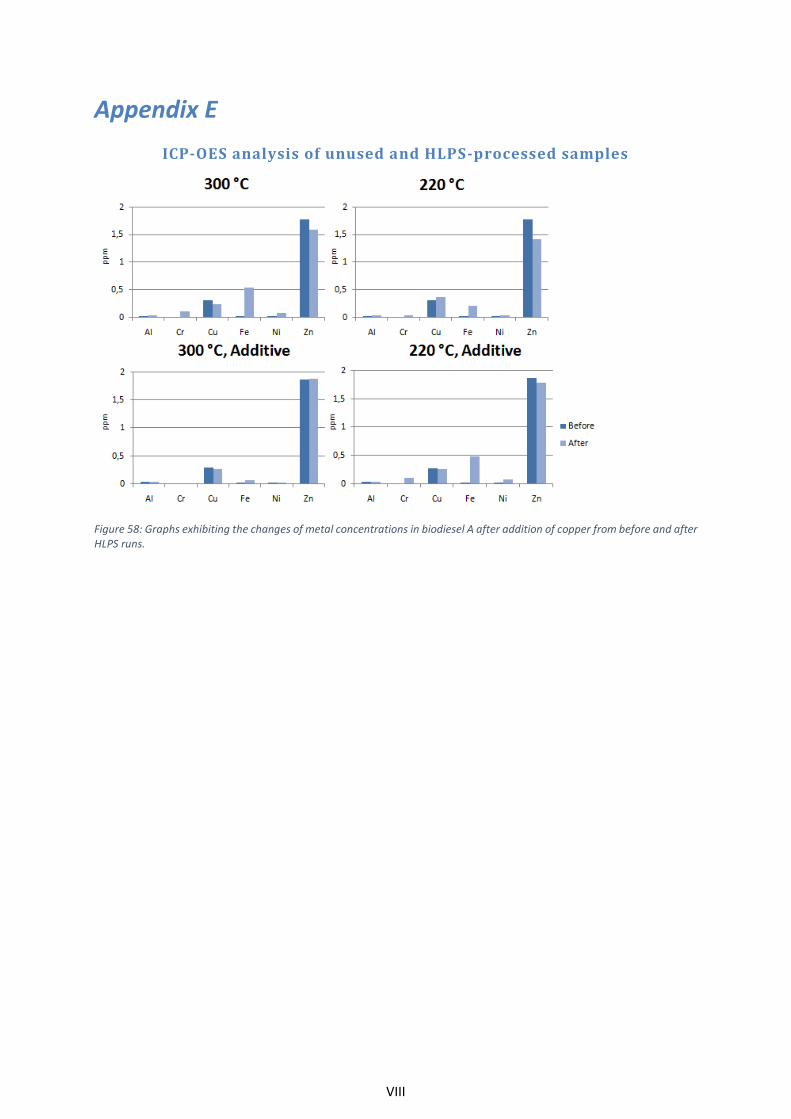
VIII
Appendix E
ICP-OES analysis of unused and HLPS-processed samples
Figure 58: Graphs exhibiting the changes of metal concentrations in biodiesel A after addition of copper from before and after HLPS runs.
I
Upphovsrätt Detta dokument hålls tillgängligt på Internet – eller dess framtida ersättare –från
publiceringsdatum under förutsättning att inga extraordinära omständigheter
uppstår.
Tillgång till dokumentet innebär tillstånd för var och en att läsa, ladda ner,
skriva ut enstaka kopior för enskilt bruk och att använda det oförändrat för icke-
kommersiell forskning och för undervisning. Överföring av upphovsrätten vid en
senare tidpunkt kan inte upphäva detta tillstånd. All annan användning av
dokumentet kräver upphovsmannens medgivande. För att garantera äktheten,
säkerheten och tillgängligheten finns lösningar av teknisk och administrativ art.
Upphovsmannens ideella rätt innefattar rätt att bli nämnd som upphovsman i
den omfattning som god sed kräver vid användning av dokumentet på ovan be-
skrivna sätt samt skydd mot att dokumentet ändras eller presenteras i sådan form
eller i sådant sammanhang som är kränkande för upphovsmannens litterära eller
konstnärliga anseende eller egenart.
För ytterligare information om Linköping University Electronic Press se för-
lagets hemsida http://www.ep.liu.se/
Copyright The publishers will keep this document online on the Internet – or its possible replacement –from the date of publication barring exceptional circumstances.
The online availability of the document implies permanent permission for anyone to read, to download, or to print out single copies for his/hers own use and to use it unchanged for non-commercial research and educational purpose. Subsequent transfers of copyright cannot revoke this permission. All other uses of the document are conditional upon the consent of the copyright owner. The publisher has taken technical and administrative measures to assure authenticity, security and accessibility.
According to intellectual property law the author has the right to be mentioned when his/her work is accessed as described above and to be protected against infringement.
For additional information about the Linköping University Electronic Press and its procedures for publication and for assurance of document integrity, please refer to its www home page: http://www.ep.liu.se/.
© Emilie Westberg