Embed Size (px)
Citation preview
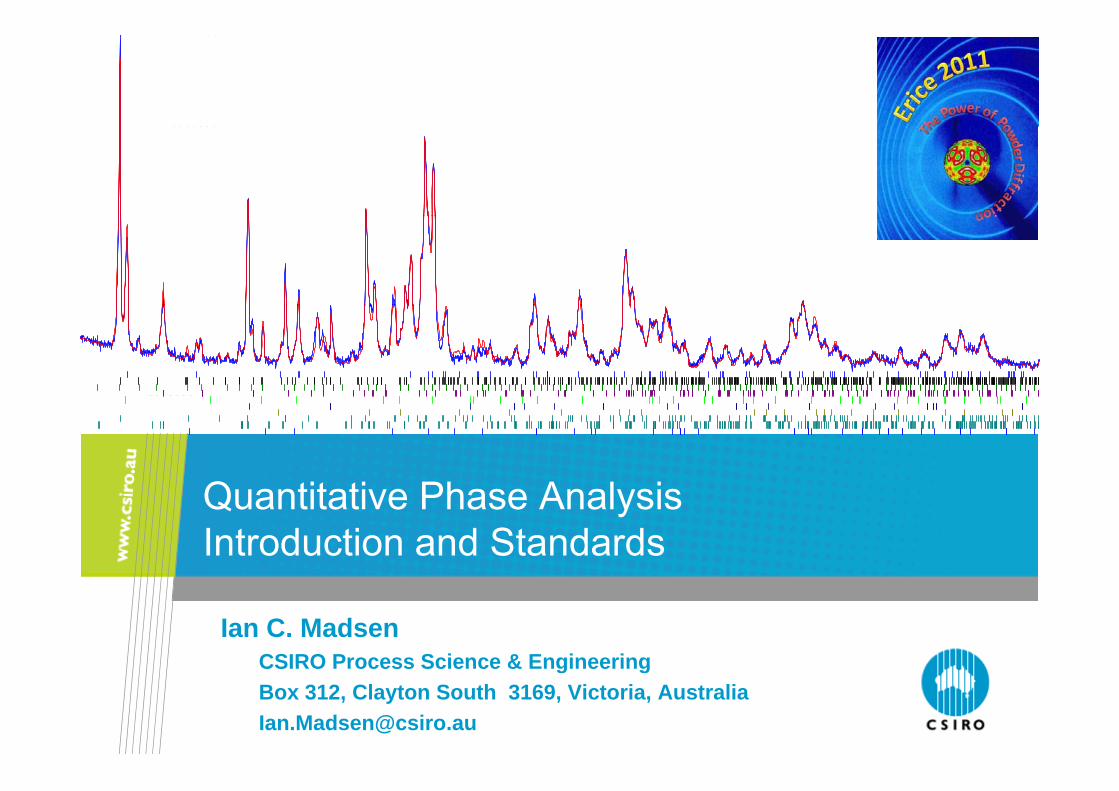
Brownmillerite 40.56 %C3Ao 13.99 %C3Ac 11.70 %Arcanite 0.58 %Aphthitalite 0.75 %Quartz 1.16 %Calcite 3.22 %Gypsum 16.65 %Bassanite 8.90 %Dolomite 2.50 %
Q tit ti Ph A l iQuantitative Phase Analysis Introduction and Standards
Ian C. MadsenCSIRO Process Science & Engineering
AXAA 2008 Advanced Workshop Session M3.3
CSIRO Process Science & EngineeringBox 312, Clayton South 3169, Victoria, [email protected]
Outline
• Basis of quantitative phase1 analysis (QPA)
Out e
• How to select which method to use
• Analysis of phases with poorly defined crystal structuresy p p y y
• Use of Rietveld based methodology in QPA• Advantages & Disadvantages
• Selected outcomes of the round robin on QPA
• Issues in precision & accuracyp y
Erice 2011 – The Power of Powder Diffraction – Ian Madsen CSIRO Process Science & Engineering
1 Phase = a crystallographically distinct component of the sample – not to be confused with the “phase problem”
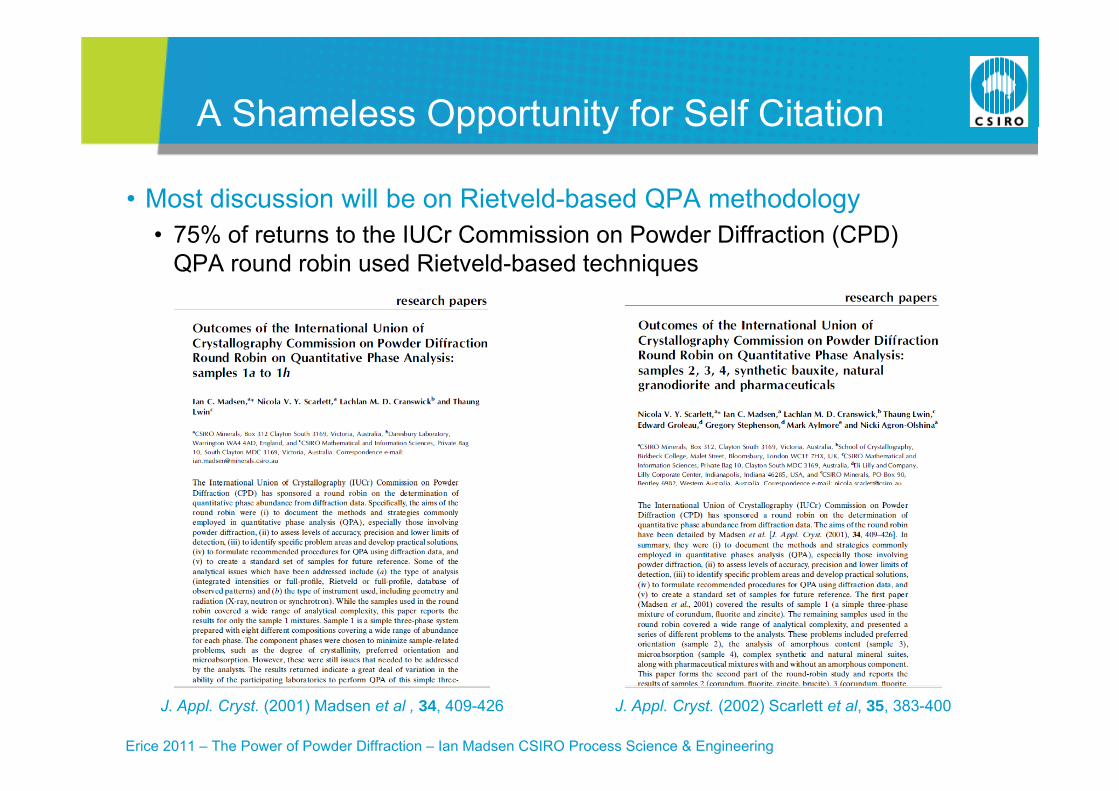
A Shameless Opportunity for Self Citation
• Most discussion will be on Rietveld-based QPA methodology
S a e ess Oppo tu ty o Se C tat o
• 75% of returns to the IUCr Commission on Powder Diffraction (CPD) QPA round robin used Rietveld-based techniques
Erice 2011 – The Power of Powder Diffraction – Ian Madsen CSIRO Process Science & Engineering
J. Appl. Cryst. (2001) Madsen et al , 34, 409-426 J. Appl. Cryst. (2002) Scarlett et al, 35, 383-400
Methods Direct and IndirectBasis of Quantitative Phase Analysis
Methods – Direct and IndirectMerits of Different ApproachesPutting QPA on an Absolute Scaleg Q

Analytical Methods of Phase Analysisa yt ca et ods o ase a ys s
• Indirect methods• Measure e.g. bulk chemistry – apportion elemental abundances according
to assumed composition of each phase normative calculation (Bogue method for Portland cement)
• Potential for errors in assumed compositions• Instability in method when phases have similar chemistry
Direct Methods• Direct Methods• Magnetic susceptibility – limited to samples with magnetic phases• Selective dissolution – rate of dissolution can be phase dependant• Density measurements – physical separation of phases• Image analysis – optical & e-beam images – issues with stereology• Thermal analysis – magnitude of endo-/exo-thermic features during phase• Thermal analysis – magnitude of endo-/exo-thermic features during phase
transitions relate to phase content
Diff ti b d th d
Erice 2011 – The Power of Powder Diffraction – Ian Madsen CSIRO Process Science & Engineering
• Diffraction based methods ………………………….
XRD for Quantitative Phase Analysiso Qua t tat e ase a ys s
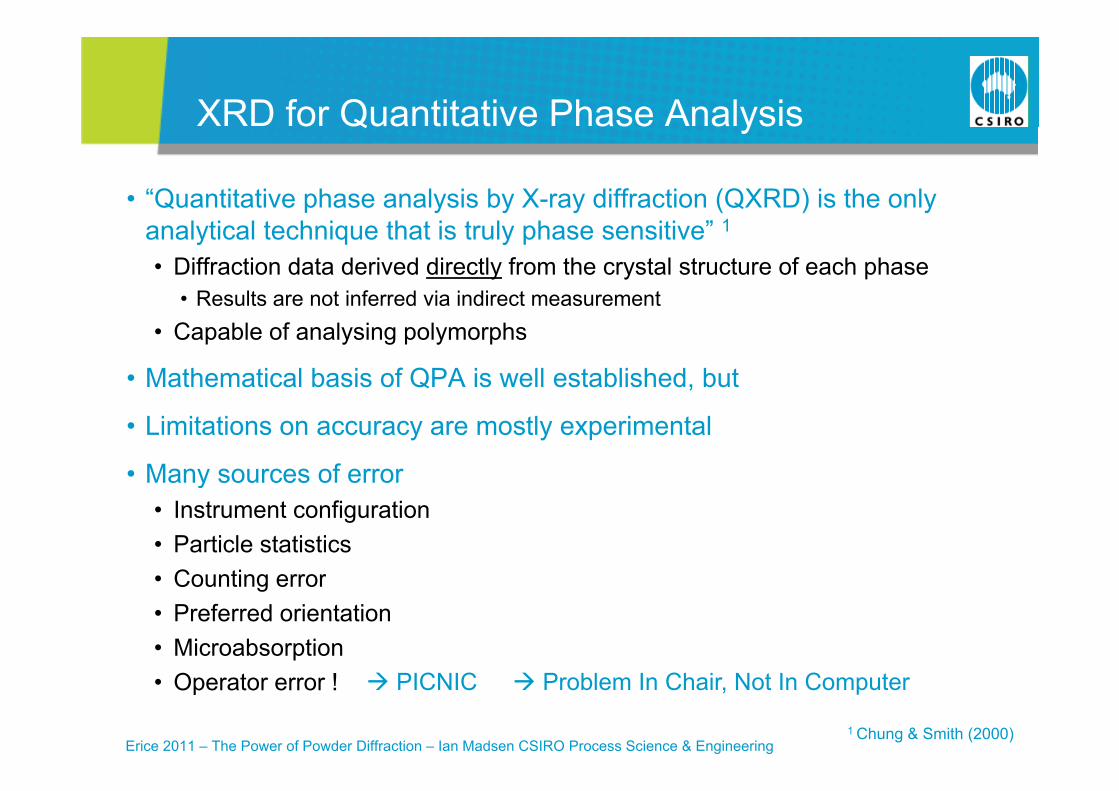
• “Quantitative phase analysis by X-ray diffraction (QXRD) is the only analytical technique that is truly phase sensitive” 1• Diffraction data derived directly from the crystal structure of each phase
• Results are not inferred via indirect measurementesu ts a e ot e ed a d ect easu e e t• Capable of analysing polymorphs
• Mathematical basis of QPA is well established, but
• Limitations on accuracy are mostly experimental
• Many sources of error y• Instrument configuration• Particle statistics
Counting error• Counting error• Preferred orientation• Microabsorption
Erice 2011 – The Power of Powder Diffraction – Ian Madsen CSIRO Process Science & Engineering
• Operator error !
1 Chung & Smith (2000)
PICNIC Problem In Chair, Not In Computer

Range of Complexity in QPASynthetic Materials
• Sample 1G from IUCr CPD round robin
Synthetic Materials
• ‘Simple’ – 3 well defined phases with high symmetry, small unit cells• Little peak overlap
150
Corundum 33.08 %Fluorite 33.56 %Zincite 33.35 %
ount
s) 100
Sqrt(
Co
5050
Erice 2011 – The Power of Powder Diffraction – Ian Madsen CSIRO Process Science & Engineering
2Th Degrees7065605550454035302520
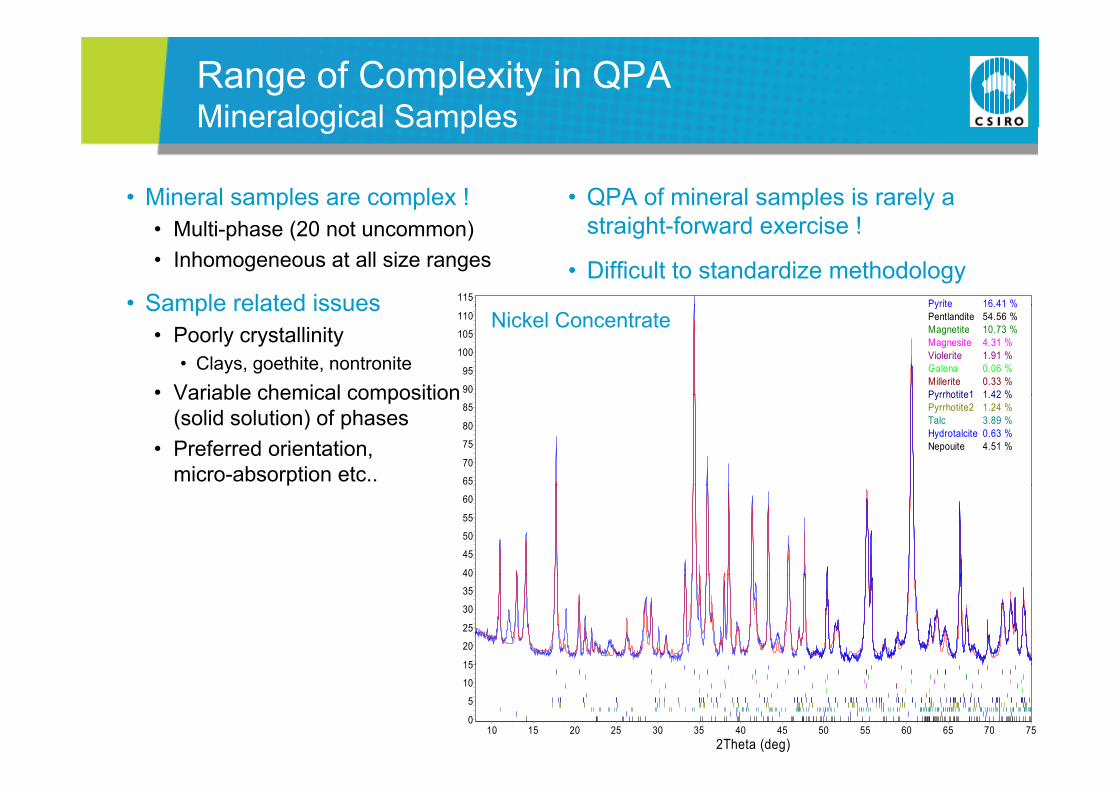
Range of Complexity in QPA Mineralogical SamplesMineralogical Samples
• Mineral samples are complex ! • QPA of mineral samples is rarely a
115 Pyrite 16 41 %
• Multi-phase (20 not uncommon) • Inhomogeneous at all size ranges
• Sample related issues
straight-forward exercise !
• Difficult to standardize methodology
110
105
100
95
90
Pyrite 16.41 %Pentlandite 54.56 %Magnetite 10.73 %Magnesite 4.31 %Violerite 1.91 %Galena 0.06 %Millerite 0.33 %Pyrrhotite1 1 42 %
Sample related issues• Poorly crystallinity
• Clays, goethite, nontronite• Variable chemical composition
Nickel Concentrate
85
80
75
70
65
Pyrrhotite1 1.42 %Pyrrhotite2 1.24 %Talc 3.89 %Hydrotalcite 0.63 %Nepouite 4.51 %
Variable chemical composition(solid solution) of phases
• Preferred orientation, micro-absorption etc..
60
55
50
45
40
p
40
35
30
25
20
15
2Theta (deg)7570656055504540353025201510
15
10
5
0
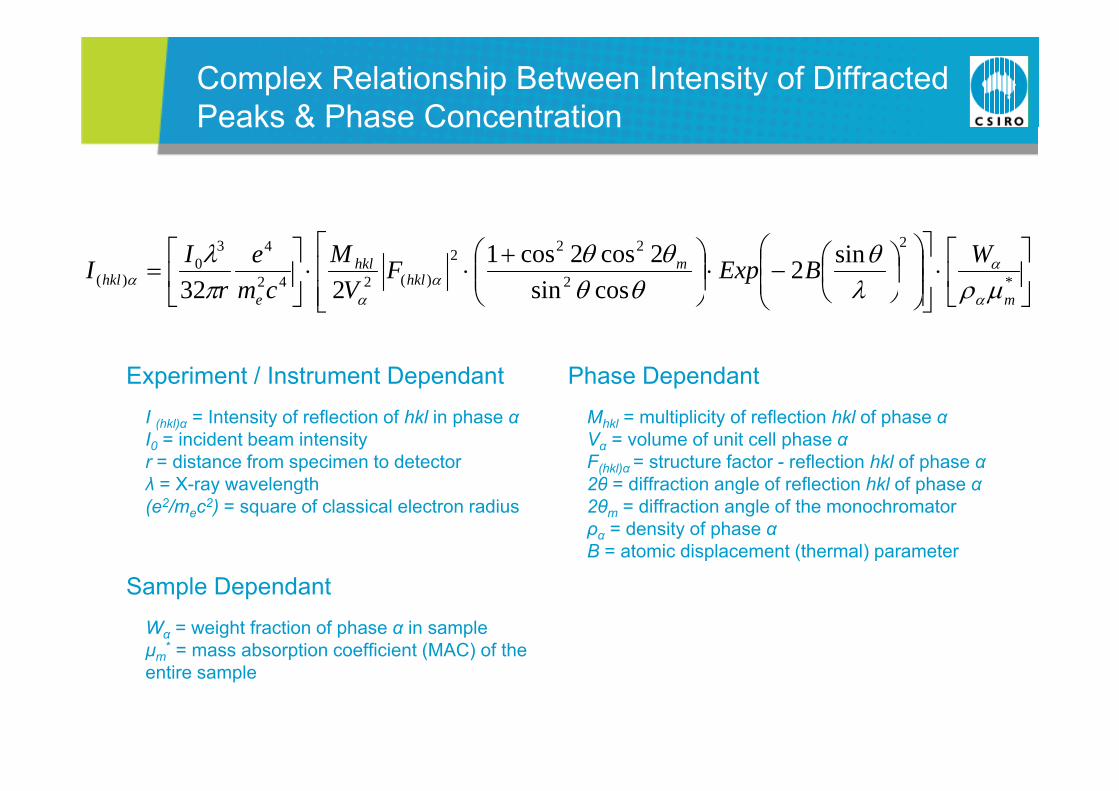
Complex Relationship Between Intensity of Diffracted Peaks & Phase ConcentrationPeaks & Phase Concentration
*
2
2
222
)(242
430
)(sin2
cossin2cos2cos1
232
m
mhkl
hkl
ehkl
WBExpFV
Mcm
er
II
Experiment / Instrument Dependant Phase Dependant
I (hkl)α = Intensity of reflection of hkl in phase αI0 = incident beam intensityr = distance from specimen to detectorλ = X-ray wavelength
Mhkl = multiplicity of reflection hkl of phase αVα = volume of unit cell phase αF(hkl)α = structure factor - reflection hkl of phase α2θ = diffraction angle of reflection hkl of phase αλ = X-ray wavelength
(e2/mec2) = square of classical electron radius2θ = diffraction angle of reflection hkl of phase α2θm = diffraction angle of the monochromatorρα = density of phase αB = atomic displacement (thermal) parameter
Sample DependantWα = weight fraction of phase α in sampleμm
* = mass absorption coefficient (MAC) of the entire sample
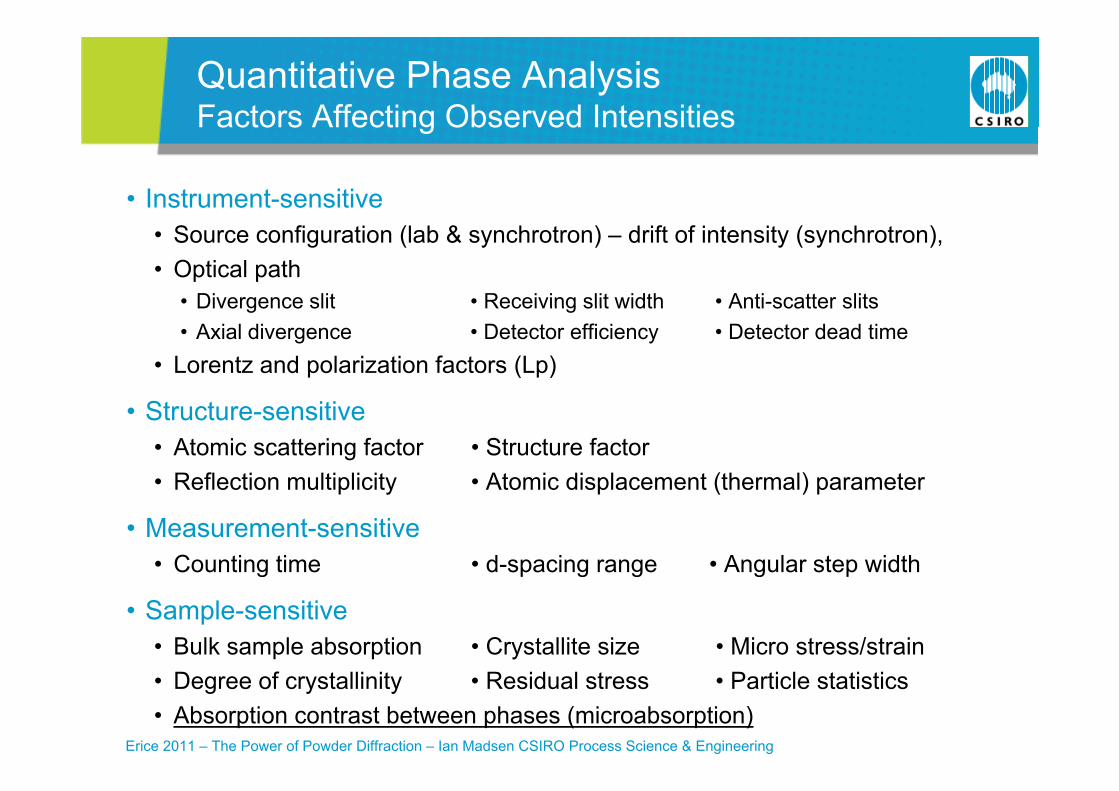
Quantitative Phase AnalysisFactors Affecting Observed IntensitiesFactors Affecting Observed Intensities
• Instrument-sensitive• Source configuration (lab & synchrotron) – drift of intensity (synchrotron), • Optical path
• Divergence slit • Receiving slit width • Anti-scatter slitsDivergence slit Receiving slit width Anti scatter slits• Axial divergence • Detector efficiency • Detector dead time
• Lorentz and polarization factors (Lp)
• Structure-sensitive• Atomic scattering factor • Structure factor• Reflection multiplicity • Atomic displacement (thermal) parameterReflection multiplicity Atomic displacement (thermal) parameter
• Measurement-sensitive• Counting time • d-spacing range • Angular step widthg p g g g p
• Sample-sensitive• Bulk sample absorption • Crystallite size • Micro stress/strain
Erice 2011 – The Power of Powder Diffraction – Ian Madsen CSIRO Process Science & Engineering
• Degree of crystallinity • Residual stress • Particle statistics• Absorption contrast between phases (microabsorption)
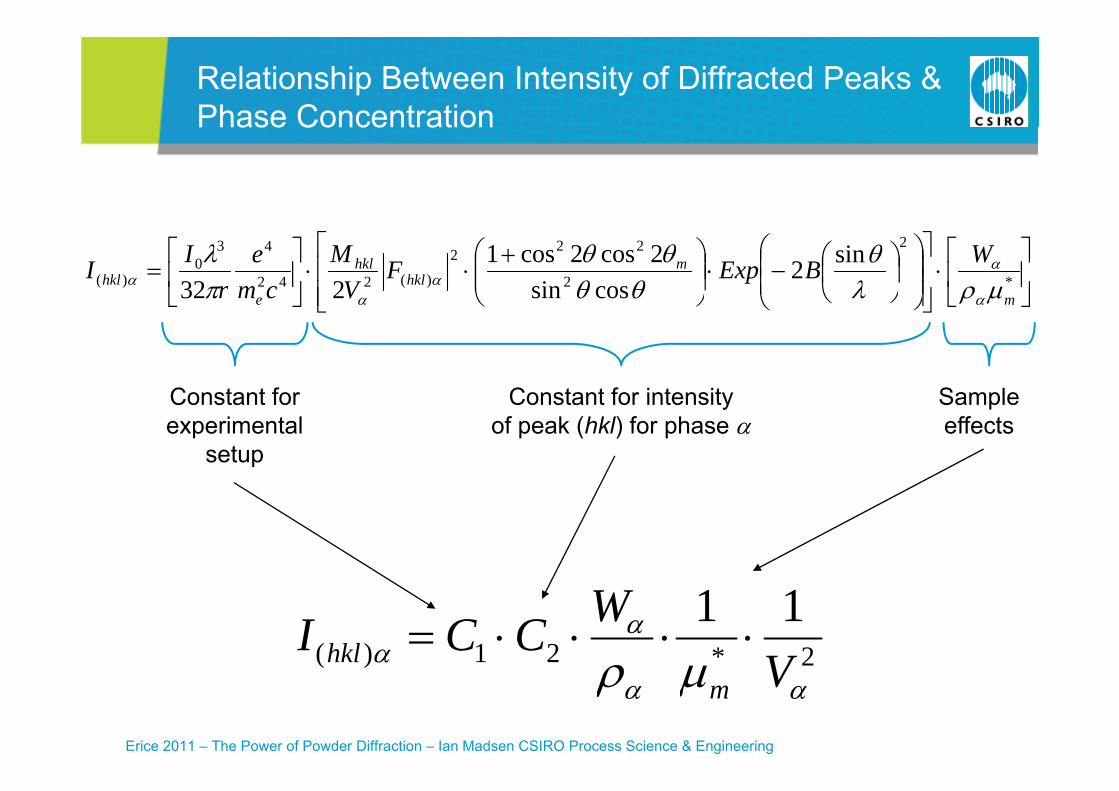
Relationship Between Intensity of Diffracted Peaks & Phase ConcentrationPhase Concentration
*
2
2
222
)(242
430
)(sin2
cossin2cos2cos1
232
m
mhkl
hkl
ehkl
WBExpFV
Mcm
er
II
Constant for SampleConstant for intensity
Constant for experimental
setup
Sample effects
Constant for intensity of peak (hkl) for phase
2* 21)(11
VWCCI hkl
Erice 2011 – The Power of Powder Diffraction – Ian Madsen CSIRO Process Science & Engineering
2)( Vm
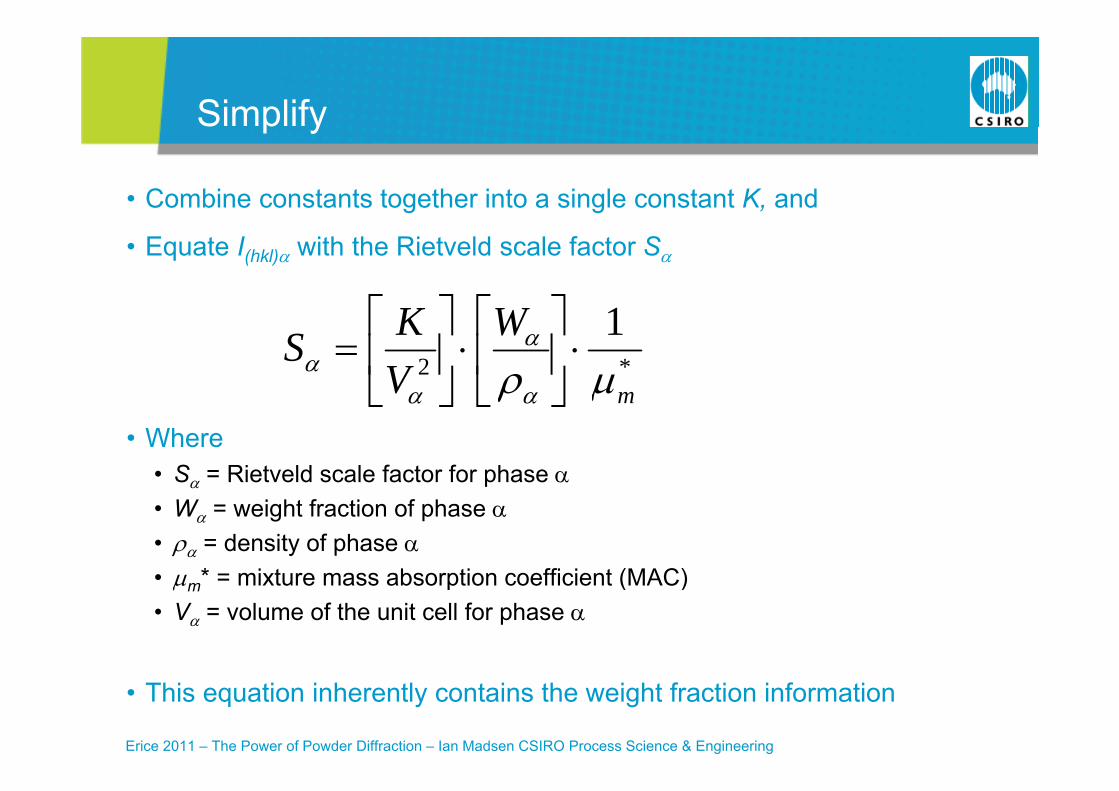
SimplifyS p y
• Combine constants together into a single constant K, and
• Equate I(hkl) with the Rietveld scale factor S
*2
1
m
WVKS
• Where• S = Rietveld scale factor for phase
m
p• W = weight fraction of phase • = density of phase • * = mixture mass absorption coefficient (MAC)• m* = mixture mass absorption coefficient (MAC)• V = volume of the unit cell for phase
Erice 2011 – The Power of Powder Diffraction – Ian Madsen CSIRO Process Science & Engineering
• This equation inherently contains the weight fraction information
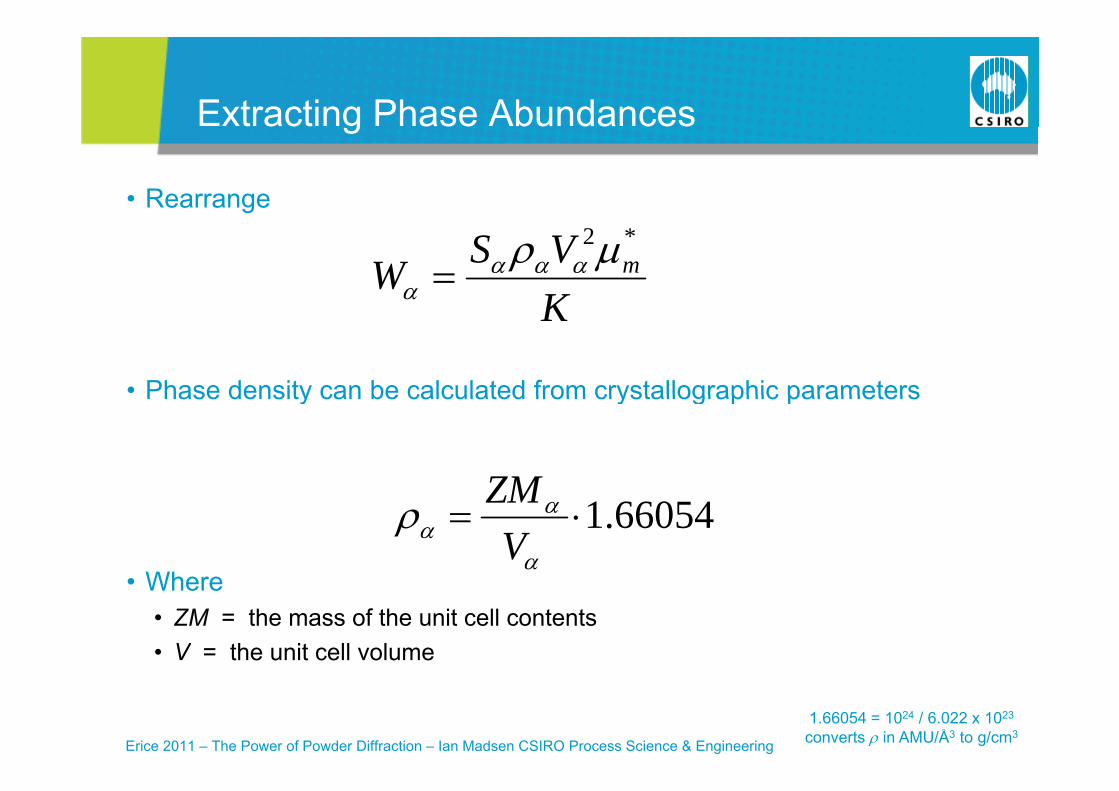
Extracting Phase Abundancest act g ase bu da ces
• Rearrange
KVSW m
*2
• Phase density can be calculated from crystallographic parameters
K
Phase density can be calculated from crystallographic parameters
ZM
Wh
1.66054
V
ZM
• Where• ZM = the mass of the unit cell contents• V = the unit cell volume
Erice 2011 – The Power of Powder Diffraction – Ian Madsen CSIRO Process Science & Engineering
1.66054 = 1024 / 6.022 x 10²³
converts in AMU/Å3 to g/cm3
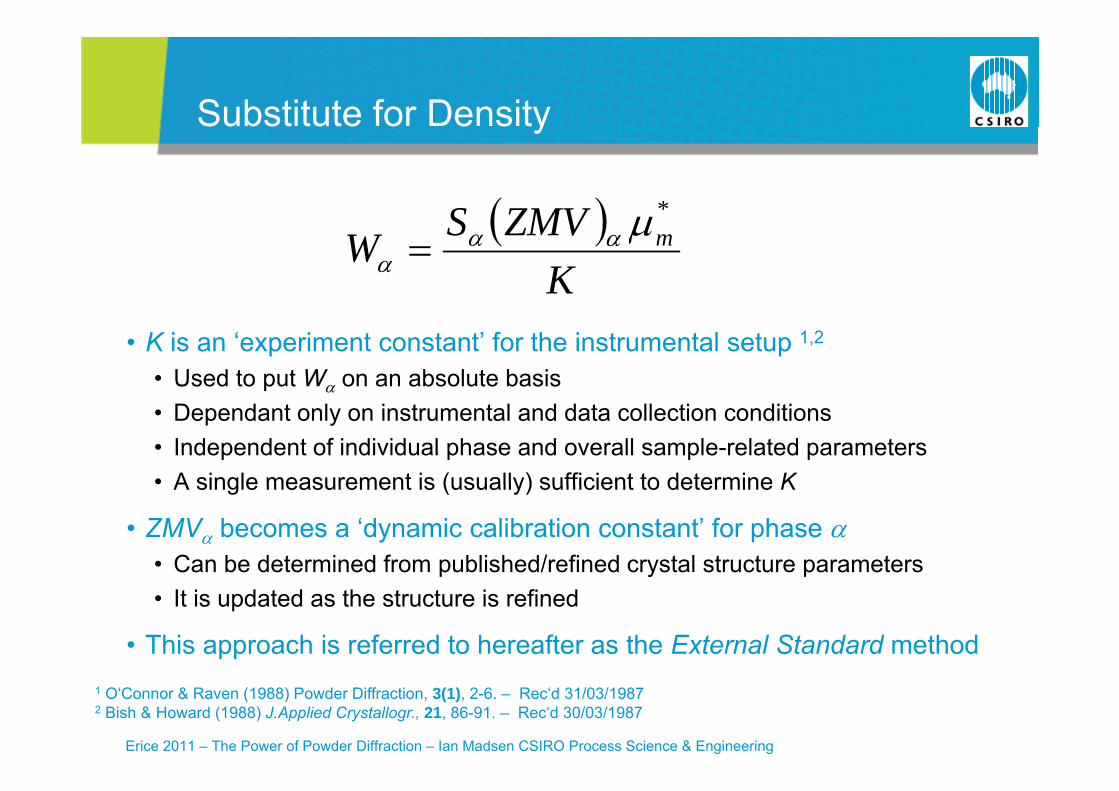
Substitute for DensitySubst tute o e s ty
ZMVS * K
ZMVSW m
• K is an ‘experiment constant’ for the instrumental setup 1,2
• Used to put W on an absolute basis• Dependant only on instrumental and data collection conditions• Independent of individual phase and overall sample-related parameters• A single measurement is (usually) sufficient to determine KA single measurement is (usually) sufficient to determine K
• ZMV becomes a ‘dynamic calibration constant’ for phase • Can be determined from published/refined crystal structure parametersp y p• It is updated as the structure is refined
• This approach is referred to hereafter as the External Standard method
Erice 2011 – The Power of Powder Diffraction – Ian Madsen CSIRO Process Science & Engineering
1 O‘Connor & Raven (1988) Powder Diffraction, 3(1), 2-6. – Rec‘d 31/03/1987 2 Bish & Howard (1988) J.Applied Crystallogr., 21, 86-91. – Rec‘d 30/03/1987
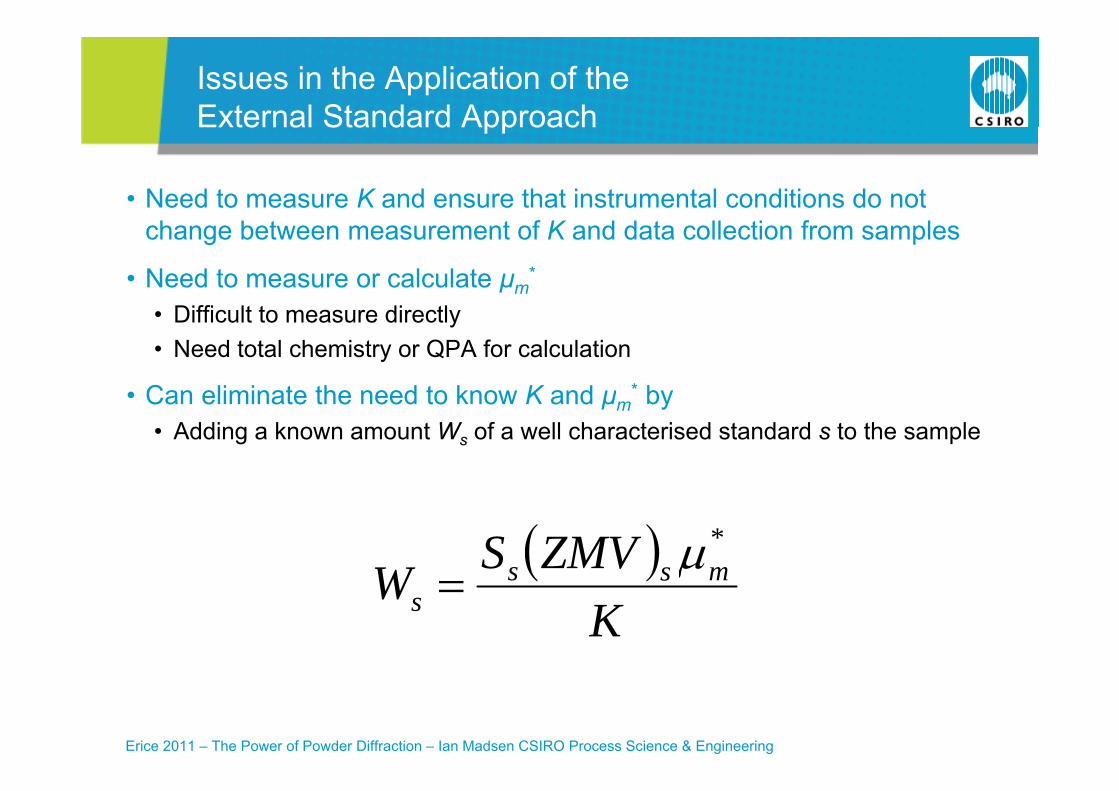
Issues in the Application of the External Standard ApproachExternal Standard Approach
• Need to measure K and ensure that instrumental conditions do not change between measurement of K and data collection from samples
• Need to measure or calculate μm*
Diffi lt t di tl• Difficult to measure directly• Need total chemistry or QPA for calculation
• Can eliminate the need to know K and μ * by• Can eliminate the need to know K and μm by• Adding a known amount Ws of a well characterised standard s to the sample
ZMVSW mss*
KW mss
s
Erice 2011 – The Power of Powder Diffraction – Ian Madsen CSIRO Process Science & Engineering
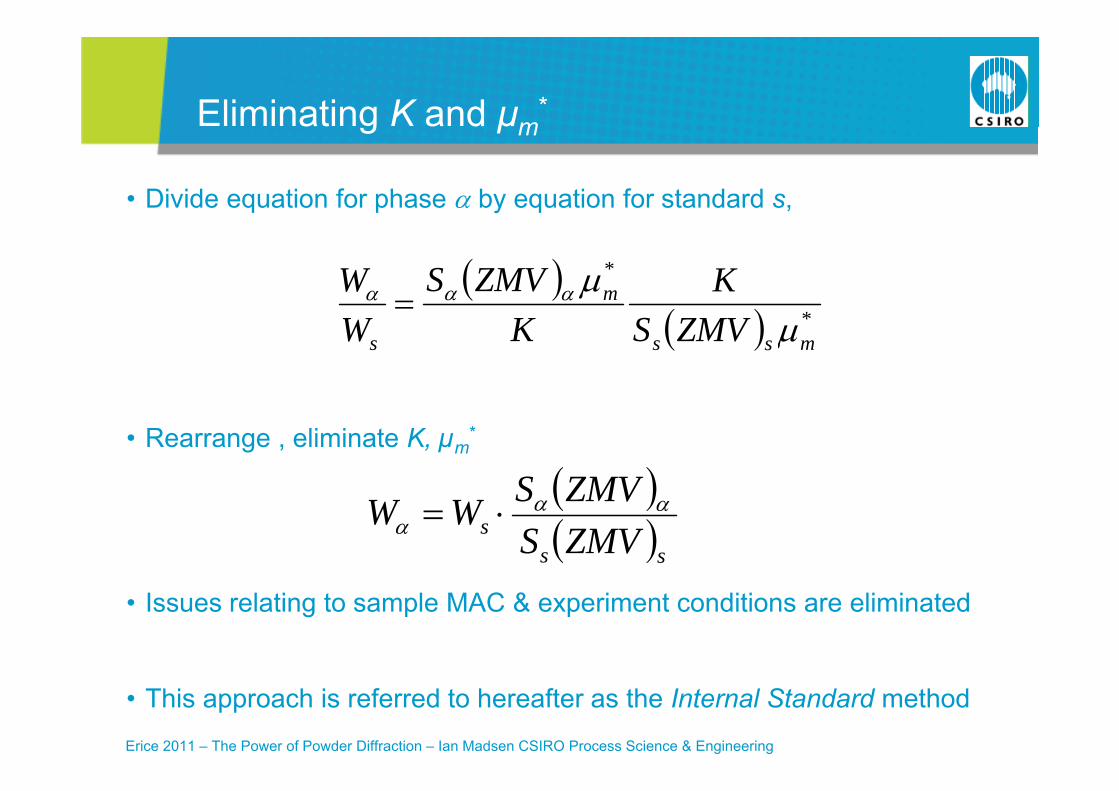
Eliminating K and μm*at g a d μm
• Divide equation for phase by equation for standard s,
*m KZMVSW *
msss ZMVSKW
• Rearrange , eliminate K, µm*
ZMVS ss
s ZMVSZMVSWW
• Issues relating to sample MAC & experiment conditions are eliminated
Erice 2011 – The Power of Powder Diffraction – Ian Madsen CSIRO Process Science & Engineering
• This approach is referred to hereafter as the Internal Standard method
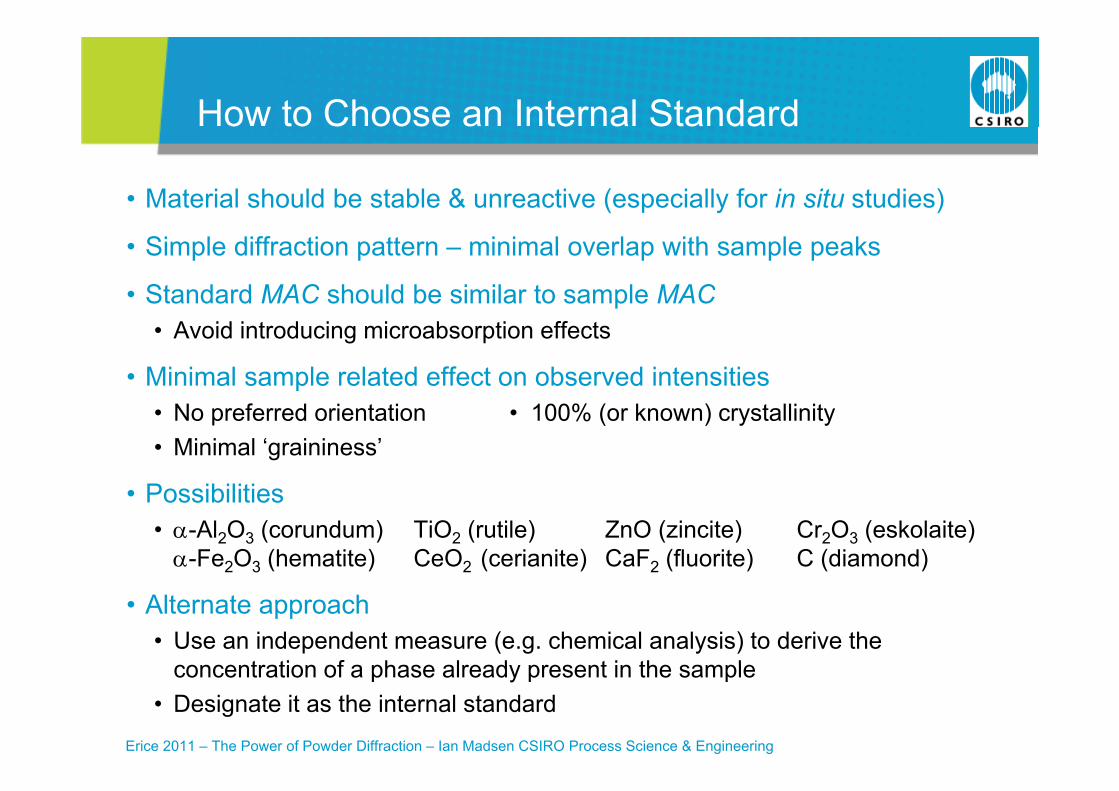
How to Choose an Internal Standardo to C oose a te a Sta da d
• Material should be stable & unreactive (especially for in situ studies)
• Simple diffraction pattern – minimal overlap with sample peaks
• Standard MAC should be similar to sample MACp• Avoid introducing microabsorption effects
• Minimal sample related effect on observed intensities• No preferred orientation • 100% (or known) crystallinity• Minimal ‘graininess’
P ibiliti• Possibilities• -Al2O3 (corundum) TiO2 (rutile) ZnO (zincite) Cr2O3 (eskolaite) -Fe2O3 (hematite) CeO2 (cerianite) CaF2 (fluorite) C (diamond)
• Alternate approach• Use an independent measure (e.g. chemical analysis) to derive the
concentration of a phase alread present in the sample
Erice 2011 – The Power of Powder Diffraction – Ian Madsen CSIRO Process Science & Engineering
concentration of a phase already present in the sample• Designate it as the internal standard
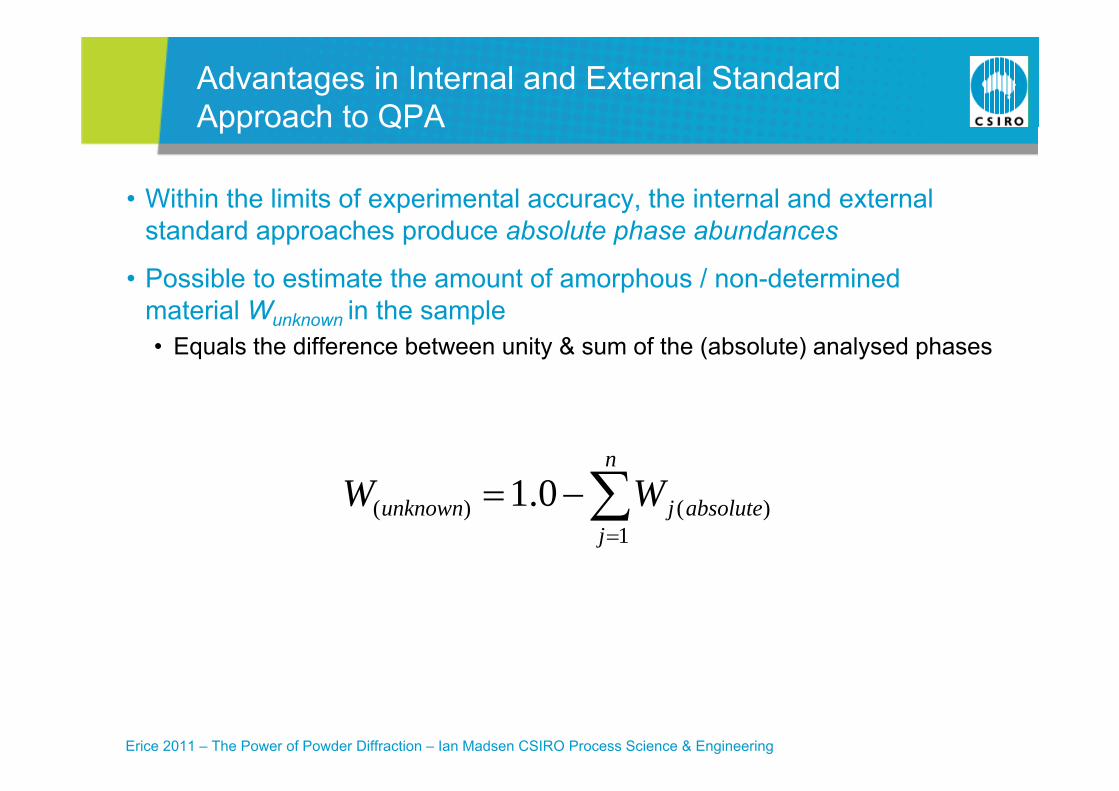
Advantages in Internal and External Standard Approach to QPAApproach to QPA
• Within the limits of experimental accuracy, the internal and external standard approaches produce absolute phase abundances
• Possible to estimate the amount of amorphous / non-determined material W in the samplematerial Wunknown in the sample• Equals the difference between unity & sum of the (absolute) analysed phases
n
WW 01
j
absolutejunknown WW1
)()( 0.1
Erice 2011 – The Power of Powder Diffraction – Ian Madsen CSIRO Process Science & Engineering
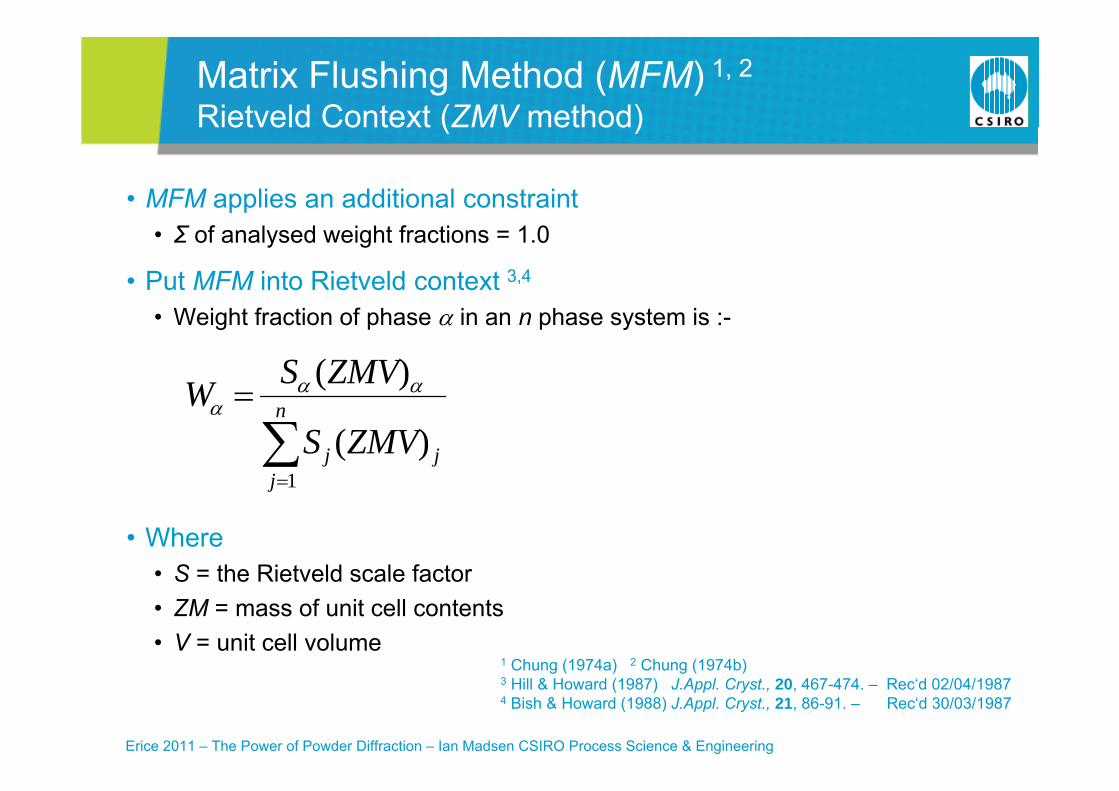
Matrix Flushing Method (MFM) 1, 2
Rietveld Context (ZMV method)
• MFM applies an additional constraint
Rietveld Context (ZMV method)
• Σ of analysed weight fractions = 1.0
• Put MFM into Rietveld context 3,4
• Weight fraction of phase in an n phase system is :-
)(
ZMVSW
1)(
n
jjj ZMVS
W
• Where• S = the Rietveld scale factor
1j
• S = the Rietveld scale factor• ZM = mass of unit cell contents• V = unit cell volume
1 Chung (1974a) 2 Chung (1974b)
Erice 2011 – The Power of Powder Diffraction – Ian Madsen CSIRO Process Science & Engineering
1 Chung (1974a) 2 Chung (1974b) 3 Hill & Howard (1987) J.Appl. Cryst., 20, 467-474. – Rec‘d 02/04/19874 Bish & Howard (1988) J.Appl. Cryst., 21, 86-91. – Rec‘d 30/03/1987
Matrix Flushing Method (MFM) 1, 2
Rietveld Context (cont’d)
• This approach is the most widely used for Rietveld based QPA
Rietveld Context (cont d)
• Almost universally coded into Rietveld analysis programs• This is probably the default QPA reported
BUT l d th t l ti h b d• BUT, only produces the correct relative phase abundances. • If the sample contains amorphous phases and/or unidentified crystalline
phases analysed weight fractions will be overestimated
• If absolute abundances are required ..• Reaction kinetics in in situ studies• Measurement of amorphous content
etc... etc...
• ... then this method is not suitable
Erice 2011 – The Power of Powder Diffraction – Ian Madsen CSIRO Process Science & Engineering
How to Select Which QPA Method to Use
• Experiment at the Australian Synchrotron by Webster et al. 1
o to Se ect c Q et od to Use
• Study of nucleation & crystal growth of gibbsite Al(OH)3• Context – Bayer process (extraction of Al from bauxite ores)
S th ti B li (Al l d d ti l ti )• Synthetic Bayer liquors (Al-loaded caustic solutions) • Seeded with various Fe-oxides – in this example, goethite (-FeOOH)
• Use S-XRD to follow mechanism & kinetics of phase formation
Erice 2011 – The Power of Powder Diffraction – Ian Madsen CSIRO Process Science & Engineering
1 Webster, N.A.S. et al, J. Appl. Cryst., 43: 466-472.
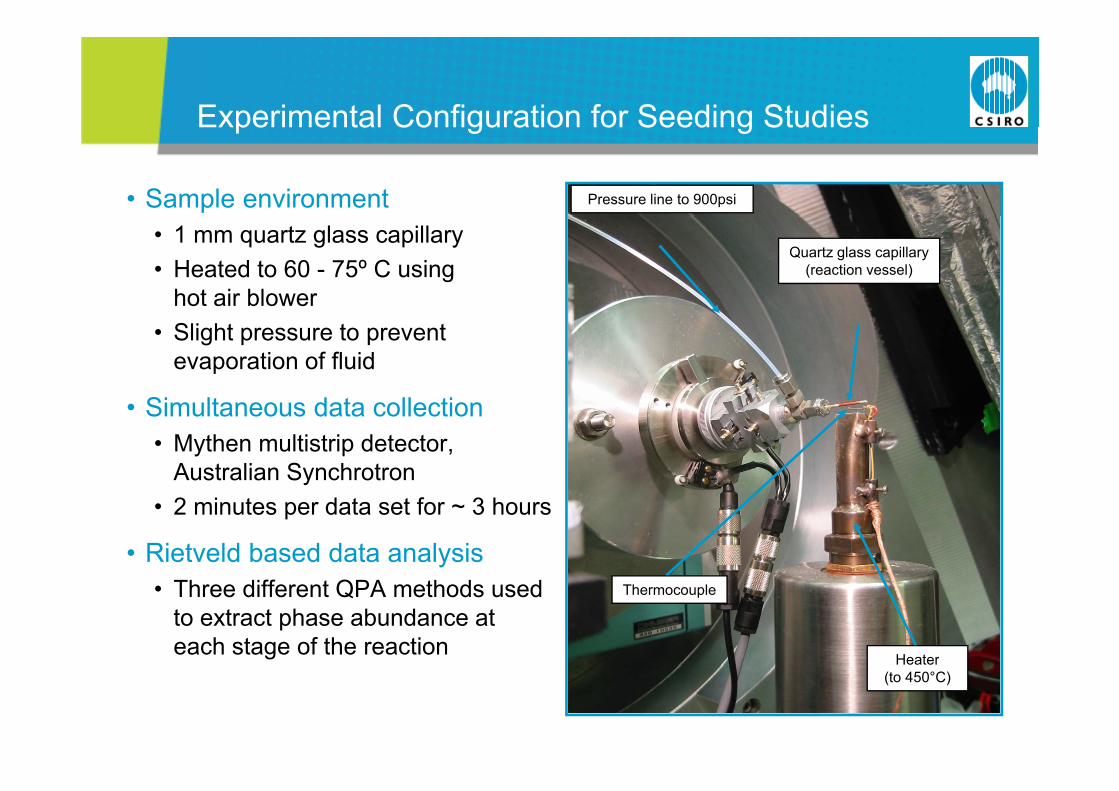
Experimental Configuration for Seeding StudiesExperimental Configuration for Seeding Studies
• Sample environment Pressure line to 900psi
• 1 mm quartz glass capillary• Heated to 60 - 75º C using
hot air blower
Quartz glass capillary (reaction vessel)
hot air blower• Slight pressure to prevent
evaporation of fluid
• Simultaneous data collection• Mythen multistrip detector,
Australian Synchrotron• 2 minutes per data set for ~ 3 hours
• Rietveld based data analysis • Three different QPA methods used
to extract phase abundance at each stage of the reaction
Heater
Thermocouple
(to 450°C)
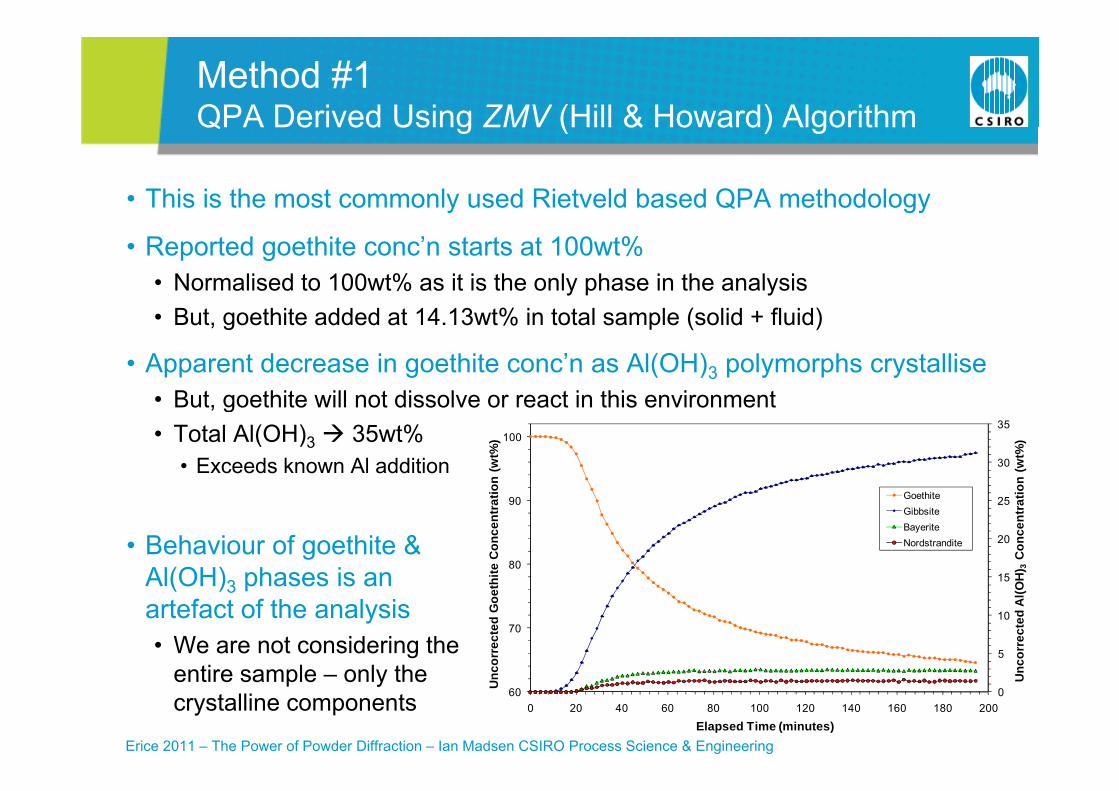
Method #1QPA Derived Using ZMV (Hill & Howard) Algorithm
• This is the most commonly used Rietveld based QPA methodology
QPA Derived Using ZMV (Hill & Howard) Algorithm
• Reported goethite conc’n starts at 100wt%• Normalised to 100wt% as it is the only phase in the analysis• But, goethite added at 14.13wt% in total sample (solid + fluid)
• Apparent decrease in goethite conc’n as Al(OH)3 polymorphs crystalliseBut goethite will not dissolve or react in this environment• But, goethite will not dissolve or react in this environment
• Total Al(OH)3 35wt%• Exceeds known Al addition 30
35100
on (w
t%)
on (w
t%)
• Behaviour of goethite & Al(OH) phases is an 15
20
25
80
90
H) 3
Con
cent
ratio
ite C
once
ntra
tio Goethite Gibbsite Bayerite Nordstrandite
Al(OH)3 phases is an artefact of the analysis• We are not considering the
i l l h5
10
15
70
corr
ecte
d A
l(OH
orre
cted
Goe
thi
Erice 2011 – The Power of Powder Diffraction – Ian Madsen CSIRO Process Science & Engineering
entire sample – only thecrystalline components 060
0 20 40 60 80 100 120 140 160 180 200
Unc
Unc
o
Elapsed Time (minutes)
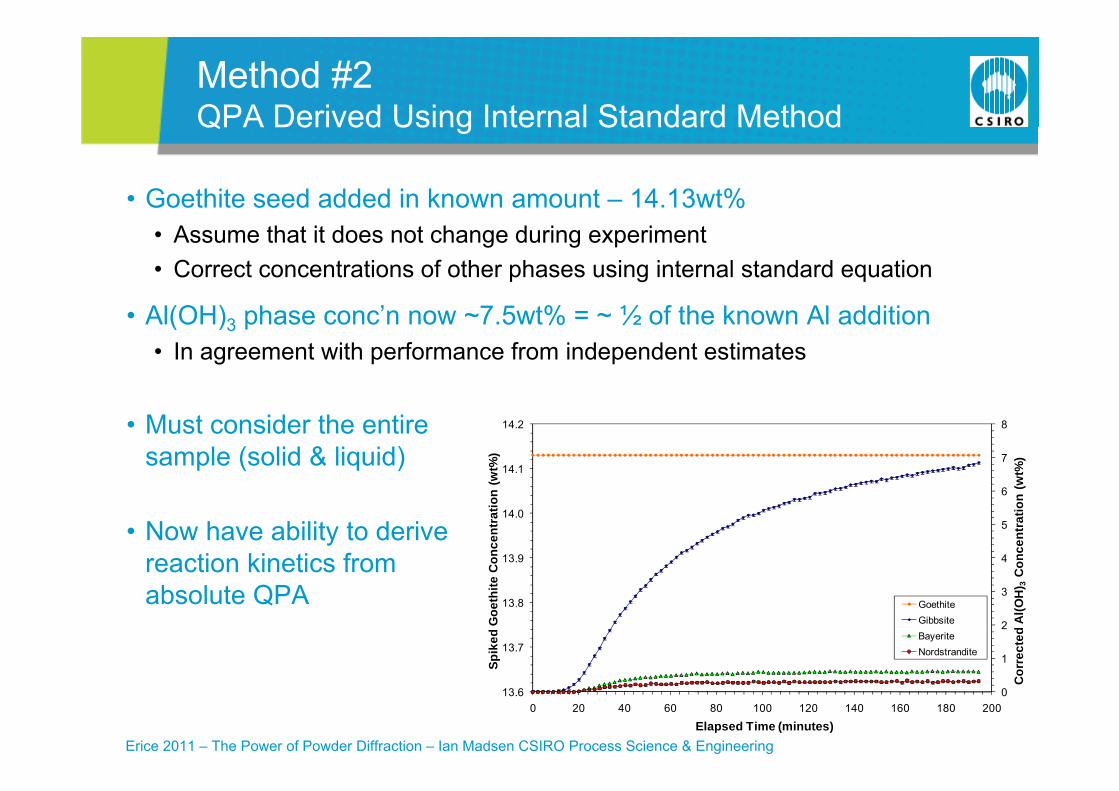
Method #2QPA Derived Using Internal Standard Method
• Goethite seed added in known amount – 14.13wt%
QPA Derived Using Internal Standard Method
• Assume that it does not change during experiment• Correct concentrations of other phases using internal standard equation
Al(OH) h ’ 7 5 t% ½ f th k Al dditi• Al(OH)3 phase conc’n now ~7.5wt% = ~ ½ of the known Al addition• In agreement with performance from independent estimates
• Must consider the entire sample (solid & liquid) 7
8
14.1
14.2
wt%
)
(wt%
)
• Now have ability to derivereaction kinetics from 4
5
6
13.9
14.0
Con
cent
ratio
n (w
Con
cent
ratio
n
absolute QPA
1
2
3
13.7
13.8
rrec
ted
Al(O
H) 3
C
Spik
ed G
oeth
ite
Goethite Gibbsite Bayerite Nordstrandite
Erice 2011 – The Power of Powder Diffraction – Ian Madsen CSIRO Process Science & Engineering
013.60 20 40 60 80 100 120 140 160 180 200
CorS
Elapsed Time (minutes)
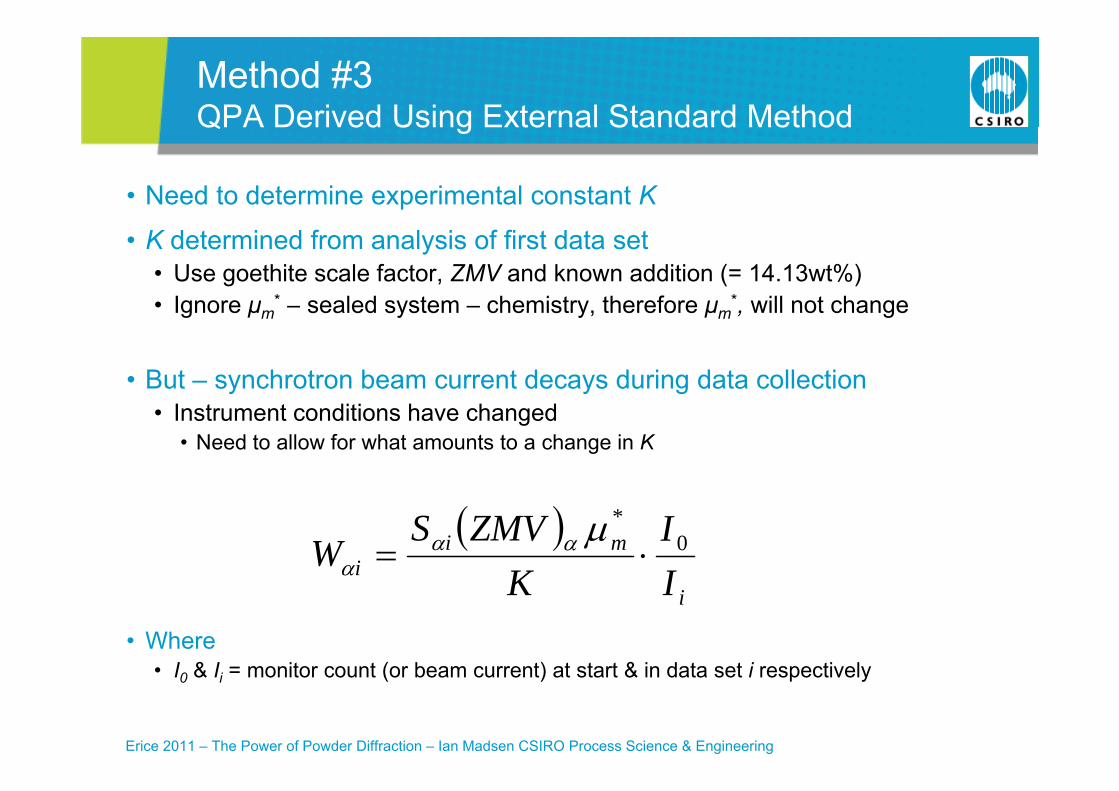
Method #3QPA Derived Using External Standard Method
• Need to determine experimental constant K
QPA Derived Using External Standard Method
• K determined from analysis of first data set• Use goethite scale factor, ZMV and known addition (= 14.13wt%)• Ignore μ * – sealed system – chemistry therefore μ * will not change• Ignore μm – sealed system – chemistry, therefore μm , will not change
• But – synchrotron beam current decays during data collection• Instrument conditions have changed
• Need to allow for what amounts to a change in K
mii I
IK
ZMVSW 0
*
• WhereI & I it t ( b t) t t t & i d t t i ti l
ii IK
Erice 2011 – The Power of Powder Diffraction – Ian Madsen CSIRO Process Science & Engineering
• I0 & Ii = monitor count (or beam current) at start & in data set i respectively
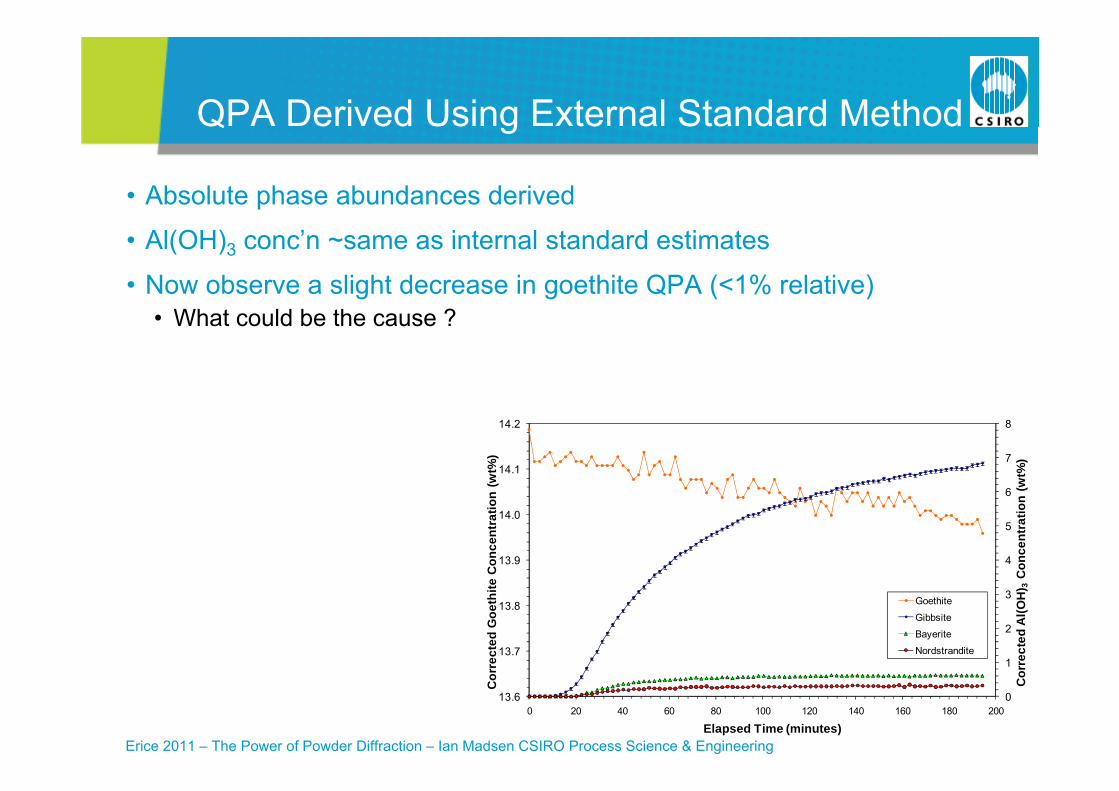
QPA Derived Using External Standard Method
• Absolute phase abundances derived
Q e ed Us g te a Sta da d et od
• Al(OH)3 conc’n ~same as internal standard estimates
• Now observe a slight decrease in goethite QPA (<1% relative)• What could be the cause ?
7
8
14.1
14.2
wt%
)
(wt%
)
4
5
6
13.9
14.0
Con
cent
ratio
n (w
Con
cent
ratio
n (
1
2
3
13.7
13.8
rect
ed A
l(OH
) 3C
rect
ed G
oeth
ite
Goethite
Gibbsite
Bayerite
Nordstrandite
Erice 2011 – The Power of Powder Diffraction – Ian Madsen CSIRO Process Science & Engineering
0
1
13.60 20 40 60 80 100 120 140 160 180 200
Cor
r
Cor
r
Elapsed Time (minutes)
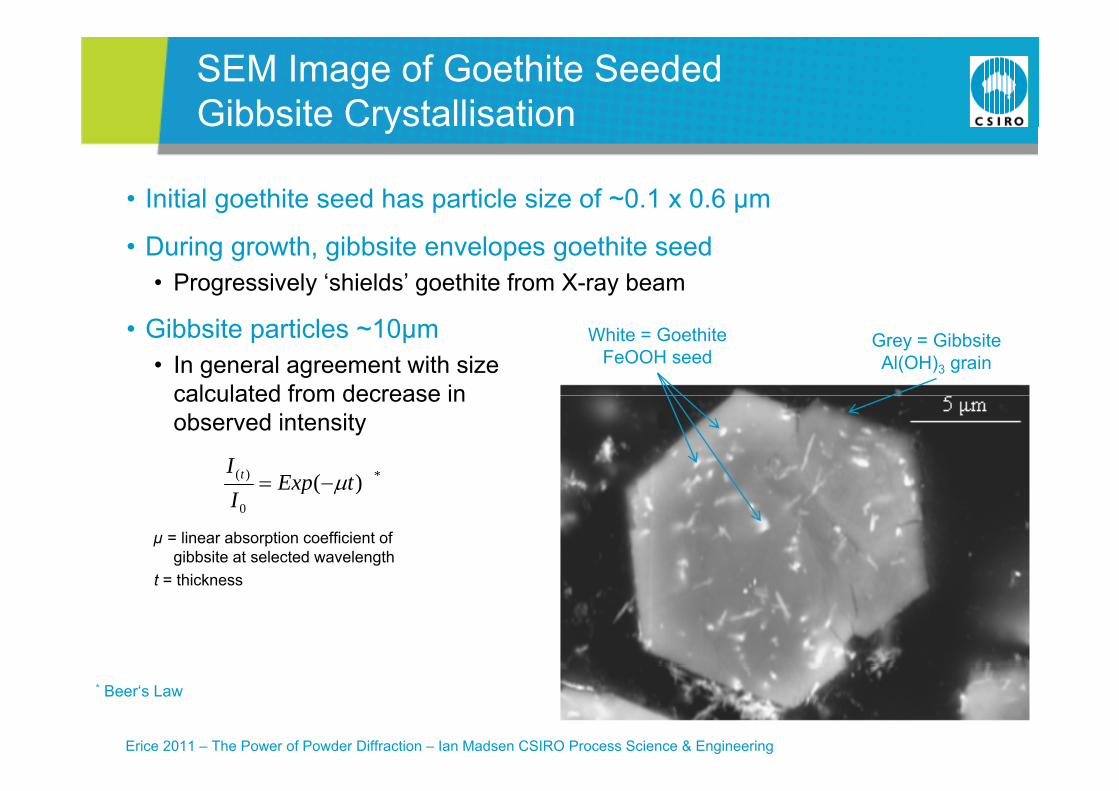
SEM Image of Goethite Seeded Gibbsite Crystallisation
• Initial goethite seed has particle size of ~0.1 x 0.6 µm
G bbs te C ysta sat o
• During growth, gibbsite envelopes goethite seed• Progressively ‘shields’ goethite from X-ray beam
• Gibbsite particles ~10µm• In general agreement with size
calculated from decrease in
White = Goethite FeOOH seed
Grey = Gibbsite Al(OH)3 grain
calculated from decrease in observed intensity
*)( )( tExpI t
µ = linear absorption coefficient of gibbsite at selected wavelength
t thi k
0
)( tExpI
t = thickness
Erice 2011 – The Power of Powder Diffraction – Ian Madsen CSIRO Process Science & Engineering
* Beer‘s Law
QPA of phases withPONKCS1
QPA of phases with Partial Or No Known Crystal Structure
1 Scarlett, N.V.Y. and Madsen, I.C., (2006), “Quantification of phases with partial or no known crystal structures”, Powder Diffraction, 21(4), 278-284.
Issues in the Analysis of ‘Real’ Materials
• Sometimes, materials (esp. mineralogical) contain phases for which the
ssues t e a ys s o ea ate a s
crystal structure is not well defined• May be crystalline but with new and unknown structure, or • Poorly ordered or even amorphousPoorly ordered or even amorphous
• Structure may change with the weather!• XRD pattern for some clay minerals affected by humidityp y y y
Erice 2011 – The Power of Powder Diffraction – Ian Madsen CSIRO Process Science & Engineering
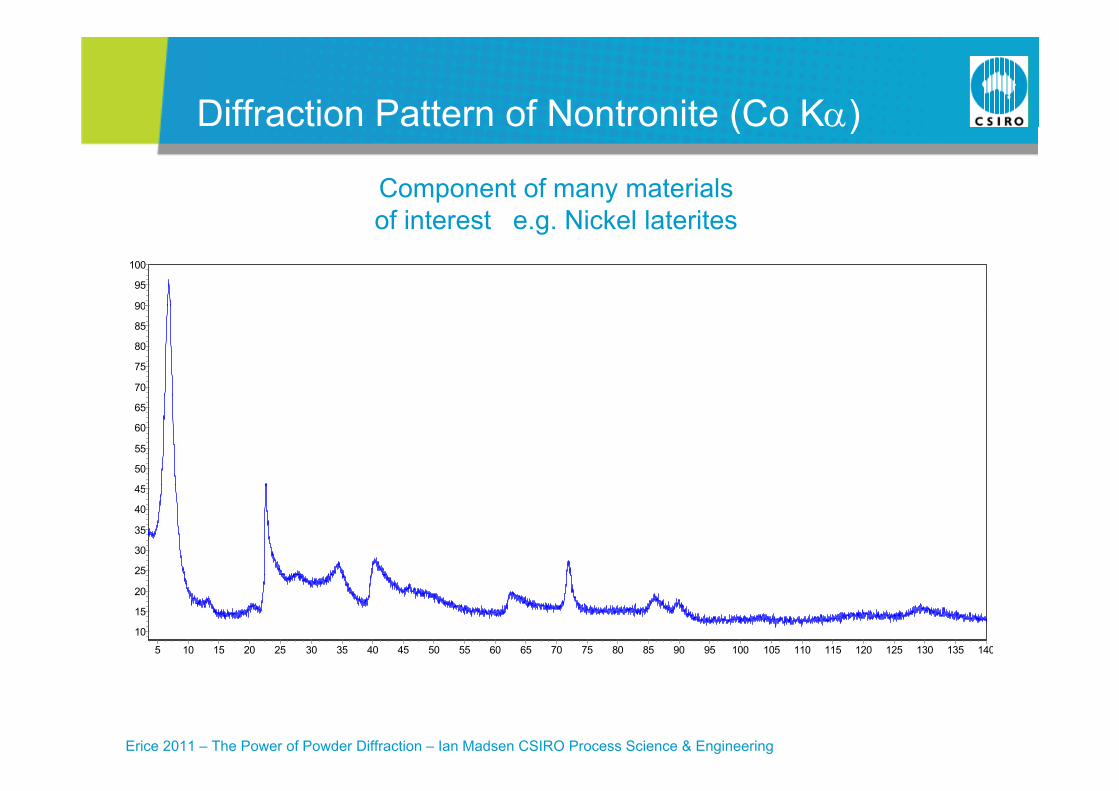
Diffraction Pattern of Nontronite (Co K)act o atte o o t o te (Co )
Component of many materials of interest e g Nickel laterites
100
95
90
of interest e.g. Nickel laterites
90
85
80
75
70
65
60
55
50
4545
40
35
30
25
1401351301251201151101051009590858075706560555045403530252015105
20
15
10
Erice 2011 – The Power of Powder Diffraction – Ian Madsen CSIRO Process Science & Engineering
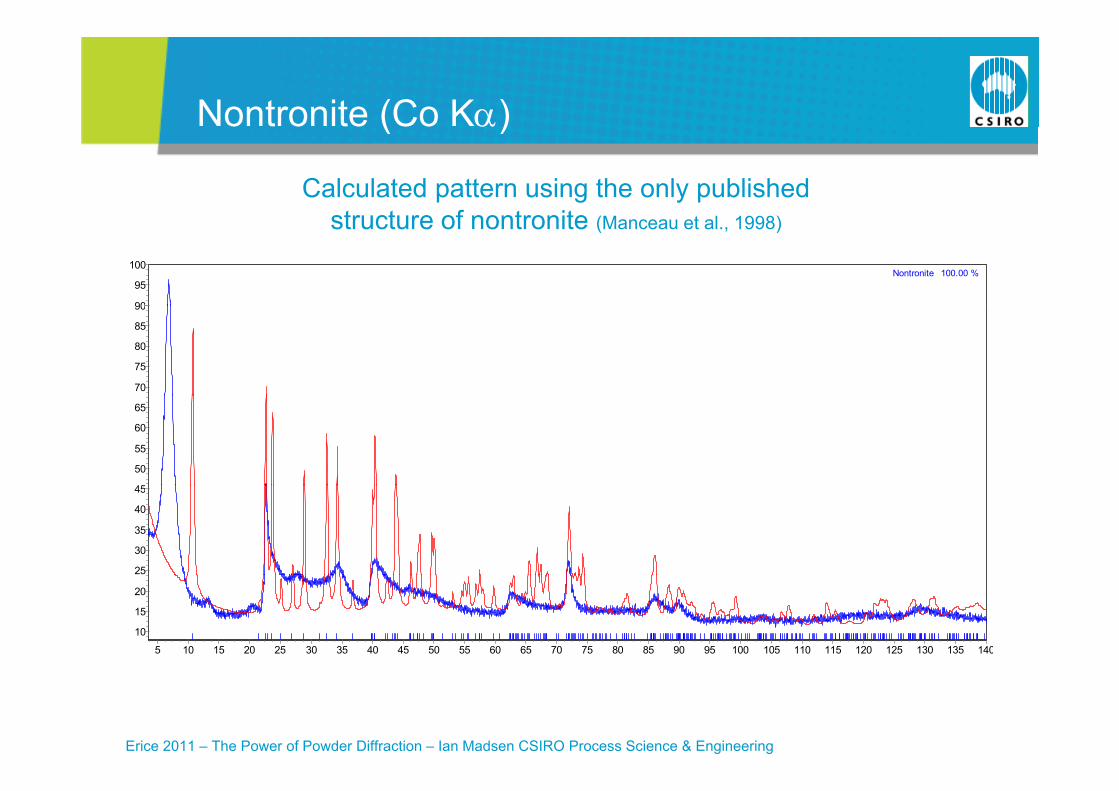
Nontronite (Co K)
Calculated pattern using the only published structure of nontronite (M t l 1998)
o t o te (Co )
structure of nontronite (Manceau et al., 1998)
100
95
90
Nontronite 100.00 %
90
85
80
75
70
65
60
55
50
4545
40
35
30
25
1401351301251201151101051009590858075706560555045403530252015105
20
15
10
Erice 2011 – The Power of Powder Diffraction – Ian Madsen CSIRO Process Science & Engineering
Nontronite (Co K)
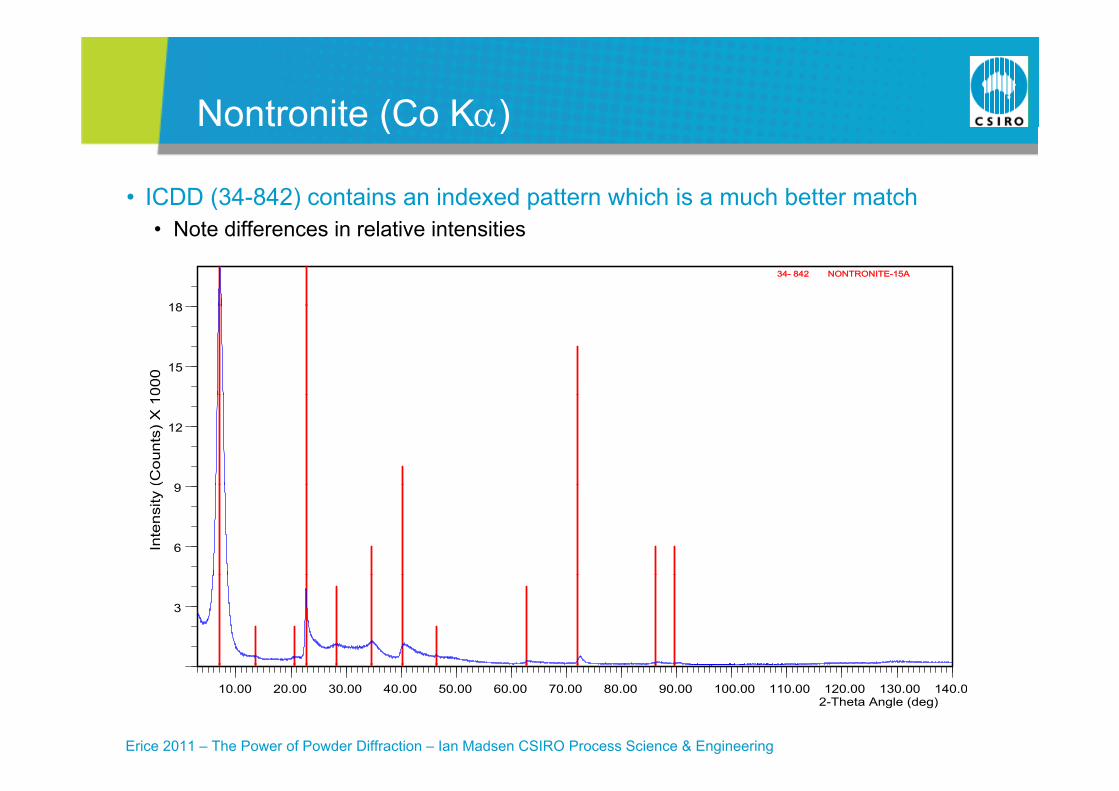
• ICDD (34-842) contains an indexed pattern which is a much better match
o t o te (Co )
• Note differences in relative intensities
34- 842 NONTRONITE-15A
18
15
18
000
9
12
(Cou
nts)
X 1
6
9
Inte
nsity
3
Erice 2011 – The Power of Powder Diffraction – Ian Madsen CSIRO Process Science & Engineering
\ \2-Theta Angle (deg)
10.00 20.00 30.00 40.00 50.00 60.00 70.00 80.00 90.00 100.00 110.00 120.00 130.00 140.0
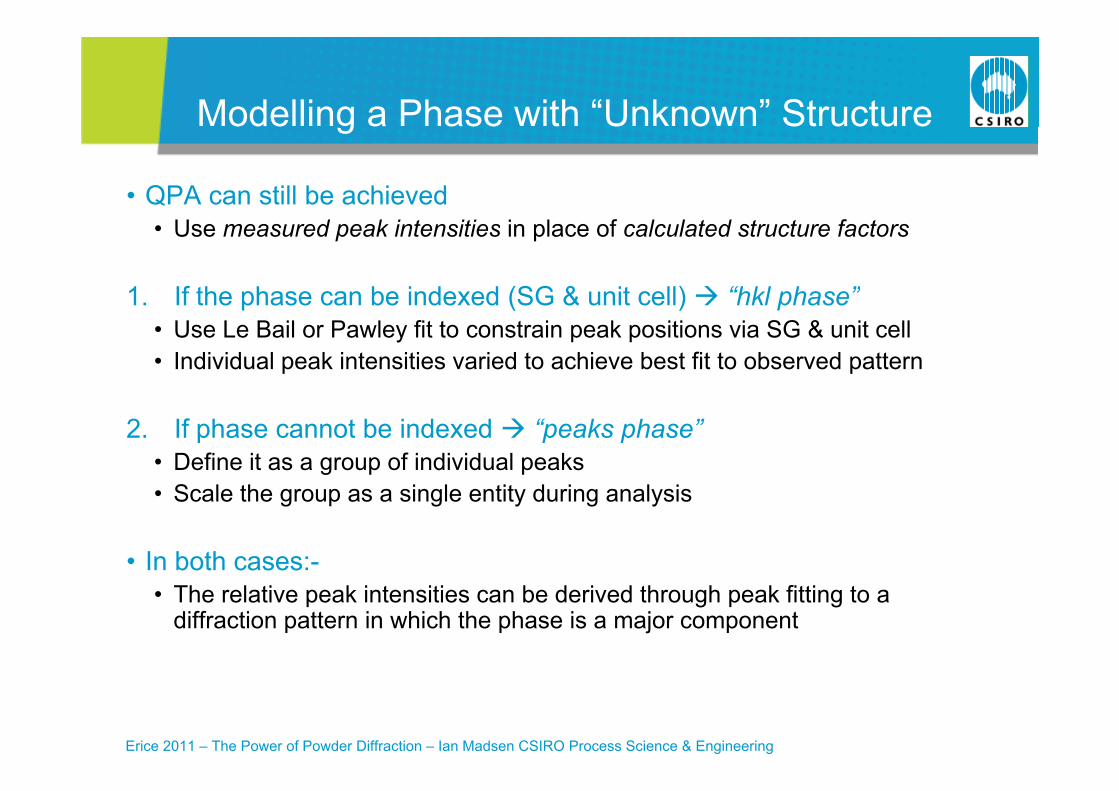
Modelling a Phase with “Unknown” Structureode g a ase t U o St uctu e
• QPA can still be achieved • Use measured peak intensities in place of calculated structure factors
1. If the phase can be indexed (SG & unit cell) “hkl phase”p ( ) p• Use Le Bail or Pawley fit to constrain peak positions via SG & unit cell • Individual peak intensities varied to achieve best fit to observed pattern
2. If phase cannot be indexed “peaks phase”• Define it as a group of individual peaks
S l th i l tit d i l i• Scale the group as a single entity during analysis
• In both cases:-• The relative peak intensities can be derived through peak fitting to a
diffraction pattern in which the phase is a major component
Erice 2011 – The Power of Powder Diffraction – Ian Madsen CSIRO Process Science & Engineering
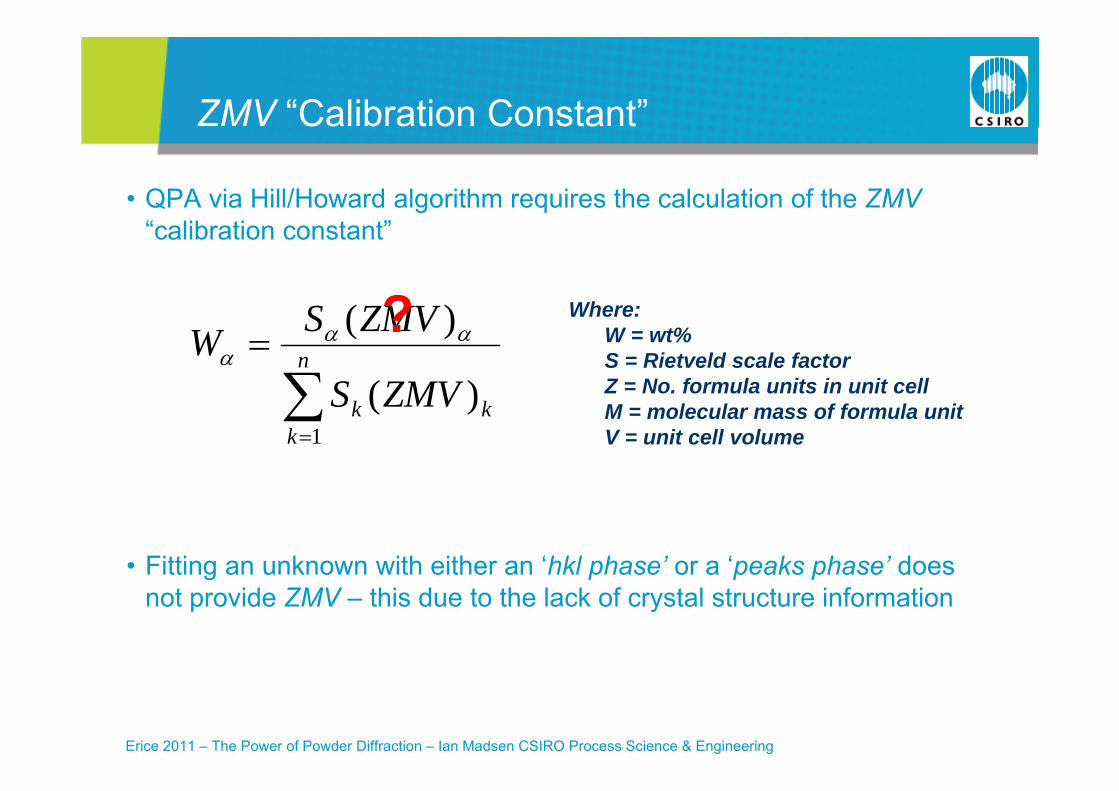
ZMV “Calibration Constant”Ca b at o Co sta t
• QPA via Hill/Howard algorithm requires the calculation of the ZMV“calibration constant”
Where:ZMVS )( ? Where:W = wt% S = Rietveld scale factorZ = No. formula units in unit cell
n
ZMVS
ZMVSW)(
)(
?M = molecular mass of formula unitV = unit cell volume
k
kk ZMVS1
)(
• Fitting an unknown with either an ‘hkl phase’ or a ‘peaks phase’ does g p p pnot provide ZMV – this due to the lack of crystal structure information
Erice 2011 – The Power of Powder Diffraction – Ian Madsen CSIRO Process Science & Engineering
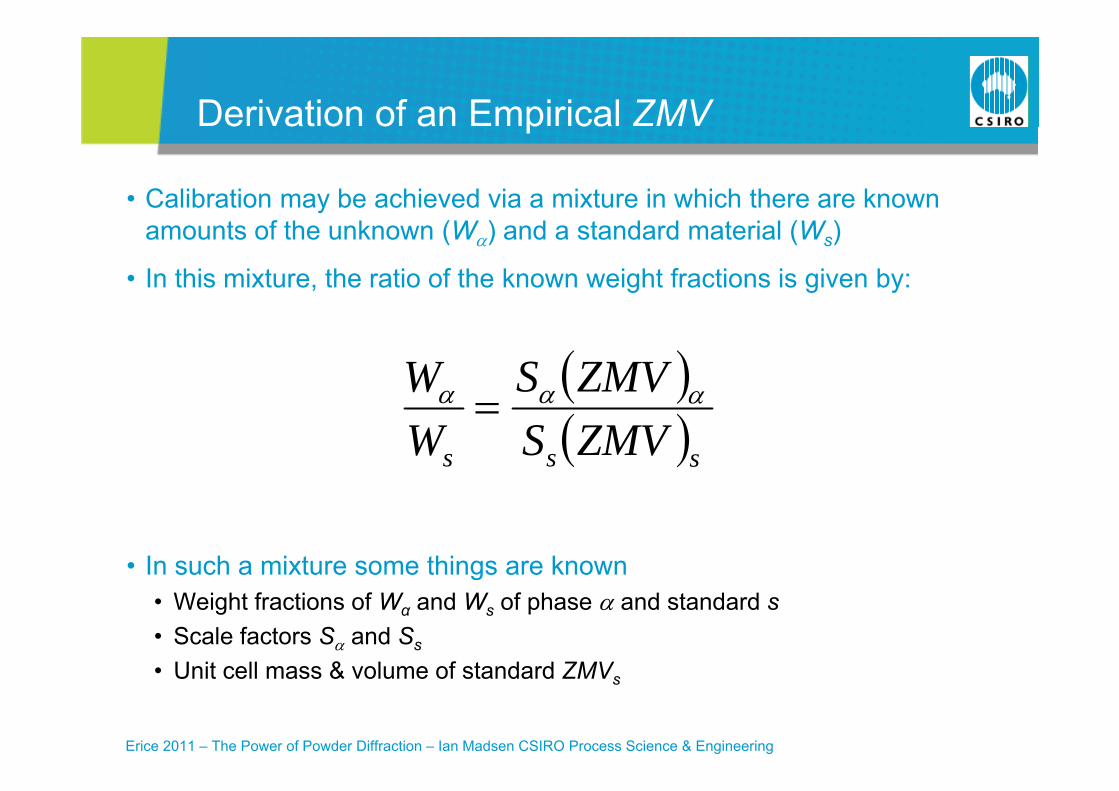
Derivation of an Empirical ZMV
• Calibration may be achieved via a mixture in which there are known
e at o o a p ca
amounts of the unknown (W) and a standard material (Ws)
• In this mixture, the ratio of the known weight fractions is given by:
ZMVSW sss ZMVSW
• In such a mixture some things are knowng• Weight fractions of Wα and Ws of phase and standard s• Scale factors S and Ss
U it ll & l f t d d ZMV
Erice 2011 – The Power of Powder Diffraction – Ian Madsen CSIRO Process Science & Engineering
• Unit cell mass & volume of standard ZMVs
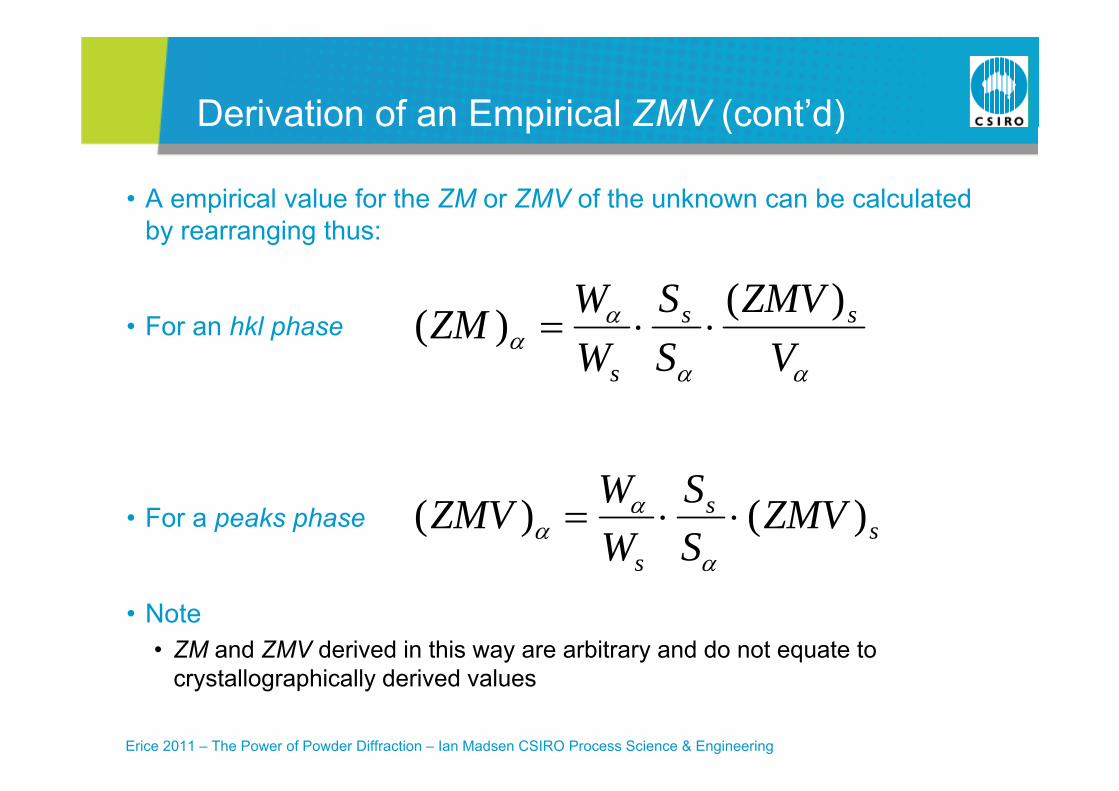
Derivation of an Empirical ZMV (cont’d)
• A empirical value for the ZM or ZMV of the unknown can be calculated
e at o o a p ca (co t d)
by rearranging thus:
ZMVSW )(• For an hkl phase
V
ZMVSS
WWZM ss
s
)()(
SW• For a peaks phase s
s
s
ZMVSS
WWZMV )()(
• Note • ZM and ZMV derived in this way are arbitrary and do not equate to
Erice 2011 – The Power of Powder Diffraction – Ian Madsen CSIRO Process Science & Engineering
crystallographically derived values
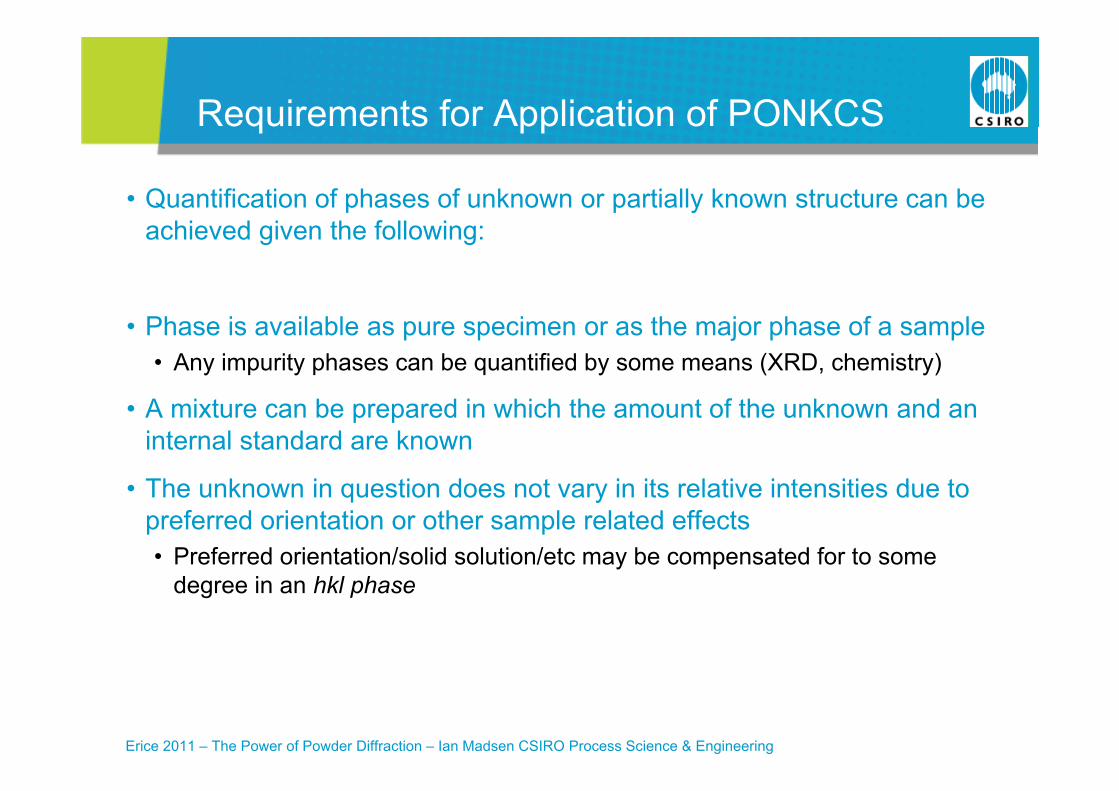
Requirements for Application of PONKCS
• Quantification of phases of unknown or partially known structure can be
equ e e ts o pp cat o o O CS
achieved given the following:
• Phase is available as pure specimen or as the major phase of a sample• Any impurity phases can be quantified by some means (XRD, chemistry)
• A mixture can be prepared in which the amount of the unknown and an internal standard are known
• The unknown in question does not vary in its relative intensities due to• The unknown in question does not vary in its relative intensities due to preferred orientation or other sample related effects• Preferred orientation/solid solution/etc may be compensated for to some
degree in an hkl phase
Erice 2011 – The Power of Powder Diffraction – Ian Madsen CSIRO Process Science & Engineering
Quantitative Phase Analysis Using the
Advantages Disadvantages Precision & Accuracy
y gRietveld Method
Advantages, Disadvantages, Precision & Accuracy
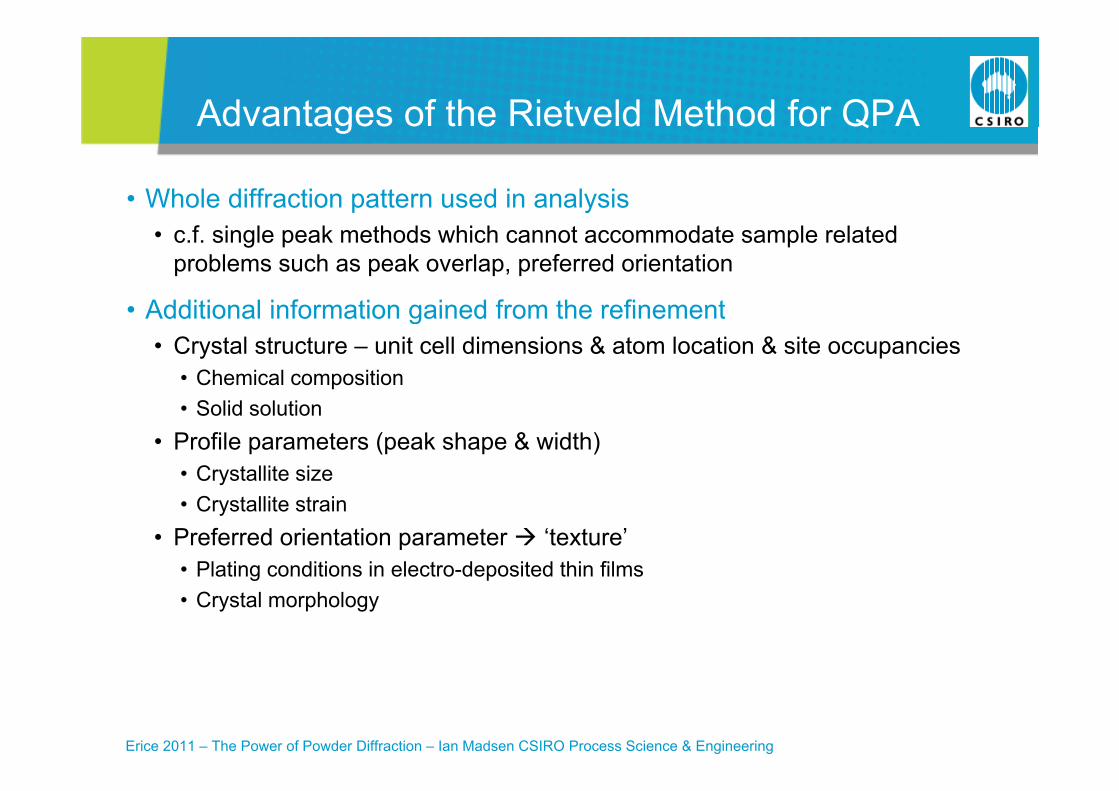
Advantages of the Rietveld Method for QPAd a tages o t e et e d et od o Q
• Whole diffraction pattern used in analysis• c.f. single peak methods which cannot accommodate sample related
problems such as peak overlap, preferred orientation
Additional information gained from the refinement• Additional information gained from the refinement• Crystal structure – unit cell dimensions & atom location & site occupancies
• Chemical composition• Solid solution
• Profile parameters (peak shape & width)• Crystallite size• Crystallite strain
• Preferred orientation parameter ‘texture’• Plating conditions in electro-deposited thin filmsPlating conditions in electro deposited thin films• Crystal morphology
Erice 2011 – The Power of Powder Diffraction – Ian Madsen CSIRO Process Science & Engineering
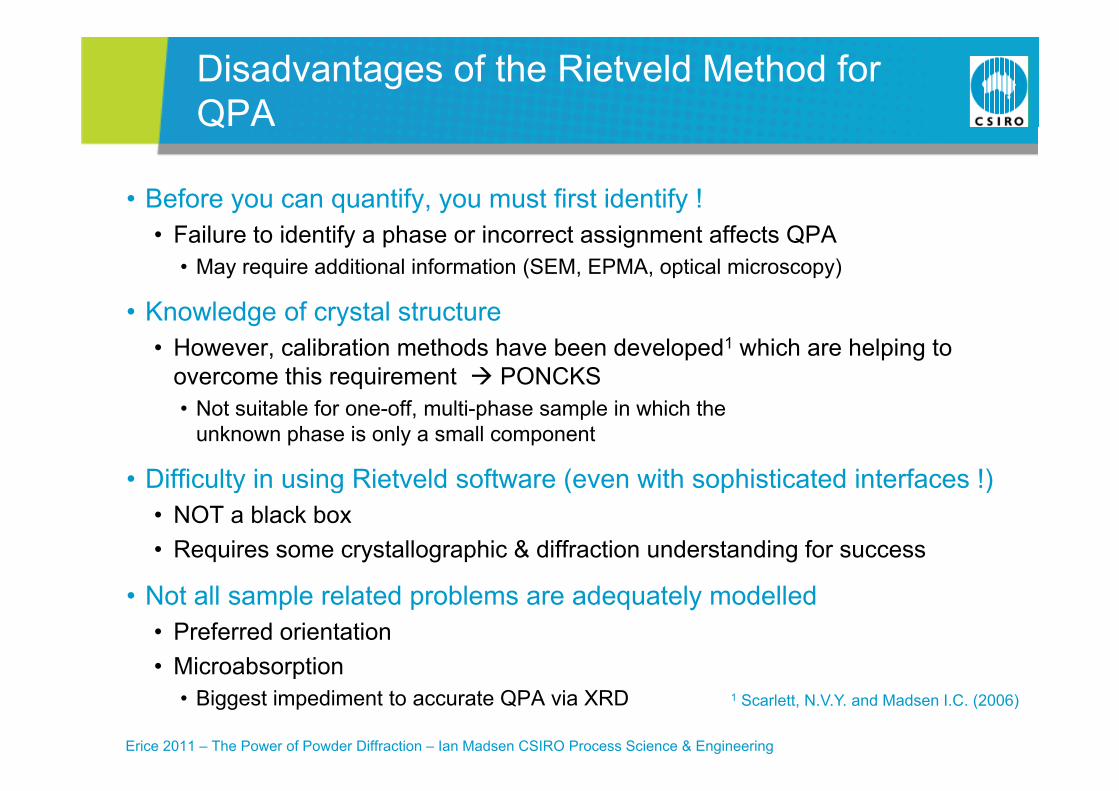
Disadvantages of the Rietveld Method for QPAQ
• Before you can quantify, you must first identify !• Failure to identify a phase or incorrect assignment affects QPA
• May require additional information (SEM, EPMA, optical microscopy)
K l d f t l t t• Knowledge of crystal structure• However, calibration methods have been developed1 which are helping to
overcome this requirement PONCKS• Not suitable for one-off, multi-phase sample in which the
unknown phase is only a small component
• Difficulty in using Rietveld software (even with sophisticated interfaces !)Difficulty in using Rietveld software (even with sophisticated interfaces !)• NOT a black box • Requires some crystallographic & diffraction understanding for success
• Not all sample related problems are adequately modelled• Preferred orientation• Microabsorption
Erice 2011 – The Power of Powder Diffraction – Ian Madsen CSIRO Process Science & Engineering
• Microabsorption• Biggest impediment to accurate QPA via XRD 1 Scarlett, N.V.Y. and Madsen I.C. (2006)
IUCr Commission on Powder Diffraction Round Robin on Quantitative Phase AnalysisRound Robin on Quantitative Phase Analysis
• Run between 1996 – 2002
• Aims of the round robin• Document methods (esp. powder diffraction) & strategies employed in QPA• Assess accuracy, precision and lower limits of detection• Identify problem areas and develop practical solutions• Formulate recommended procedures for QPA using diffraction datap g• Create a standard set of samples for future reference
• Two published papers on outcomes 1,2
Erice 2011 – The Power of Powder Diffraction – Ian Madsen CSIRO Process Science & Engineering
1 Madsen I.C. et al (2001) 2 Scarlett, N.V.Y. et al (2002)
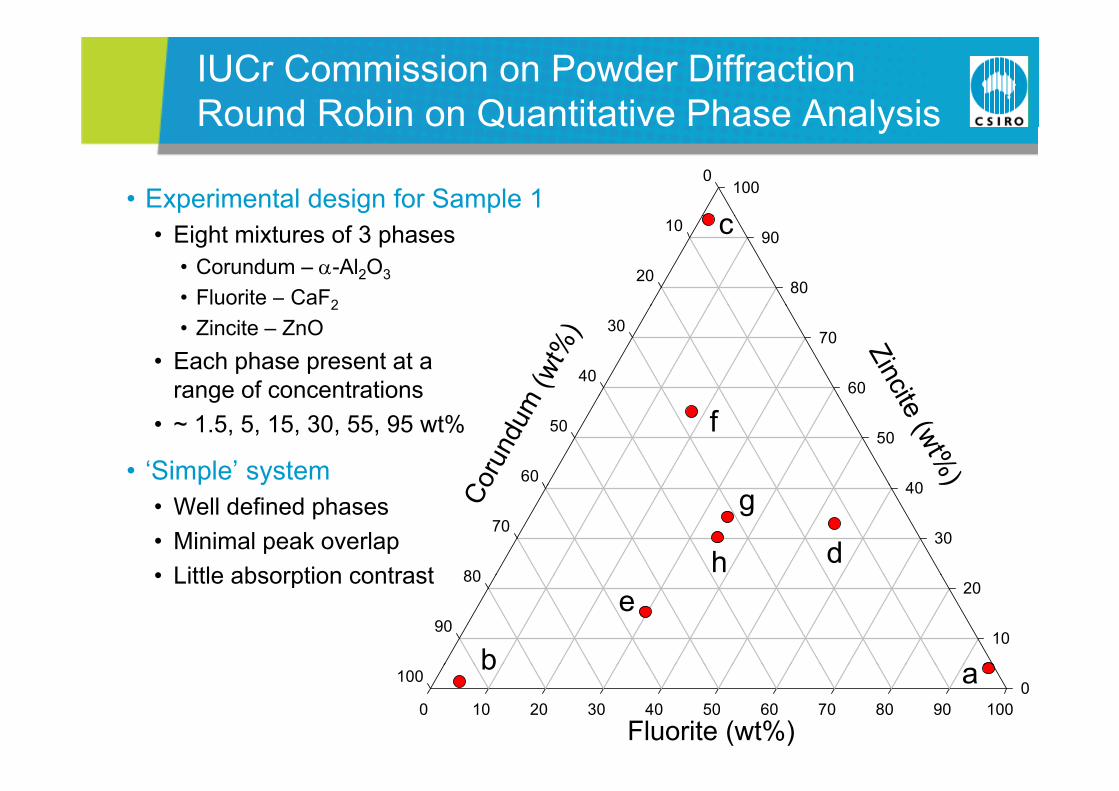
IUCr Commission on Powder Diffraction Round Robin on Quantitative Phase Analysis
1000
ou d ob o Qua t tat e ase a ys s
• Experimental design for Sample 1
80
9010
20
c• Eight mixtures of 3 phases• Corundum – -Al2O3
• Fluorite – CaF2
m(w
t%)
60
70 Zincit
30
40
2
• Zincite – ZnO• Each phase present at a
range of concentrations
Coru
ndum
40
50
ite (wt%)
50
60
frange of concentrations
• ~ 1.5, 5, 15, 30, 55, 95 wt%
• ‘Simple’ systemCo
30
40
)
70
80d
g
h
• Well defined phases• Minimal peak overlap• Little absorption contrast
10
2080
90
b
e• Little absorption contrast
0 10 20 30 40 50 60 70 80 90 100Fluorite (wt%)
0100 ab
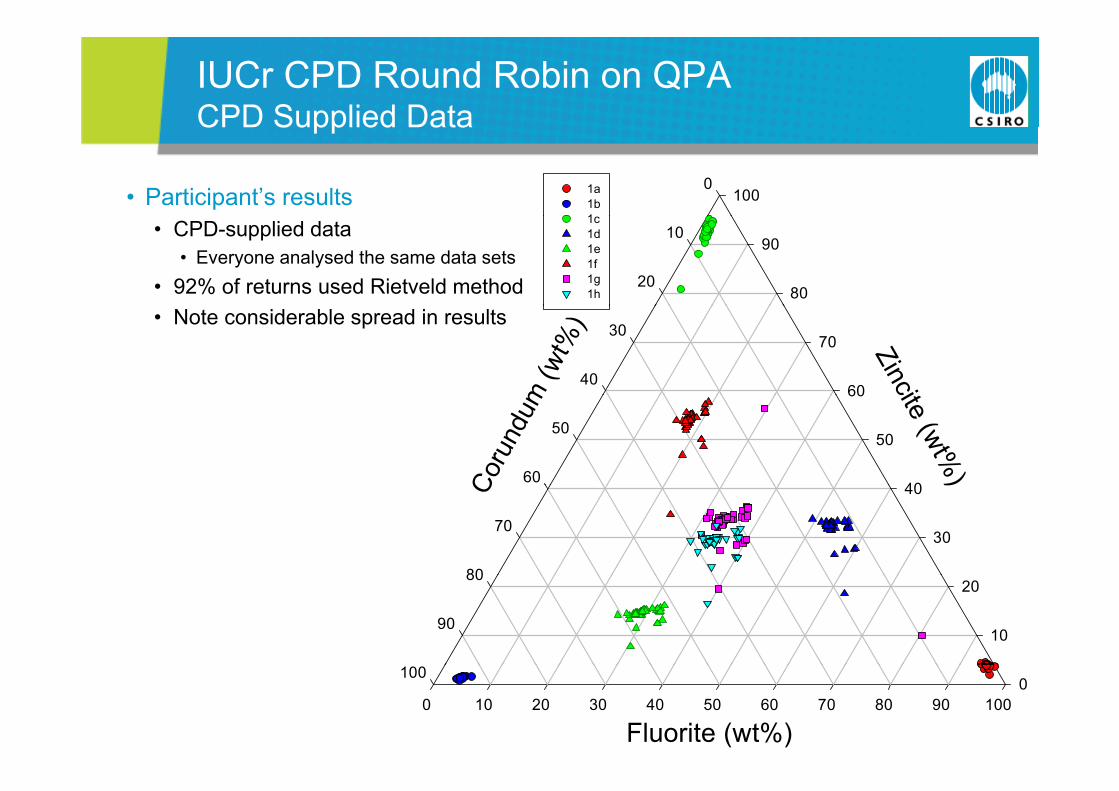
IUCr CPD Round Robin on QPACPD Supplied Data
10001a
1b1
CPD Supplied Data
• Participant’s results
80
9010
20
1c1d1e1f1g1h
• CPD-supplied data• Everyone analysed the same data sets
• 92% of returns used Rietveld method
m (w
t%)
60
70 Zincit
30
40
• Note considerable spread in results
Coru
ndum
40
50
60 cite (wt%)
50
60C
30
40
)
70
80
10
2080
90
0 10 20 30 40 50 60 70 80 90 100
Fluorite (wt%)
0100
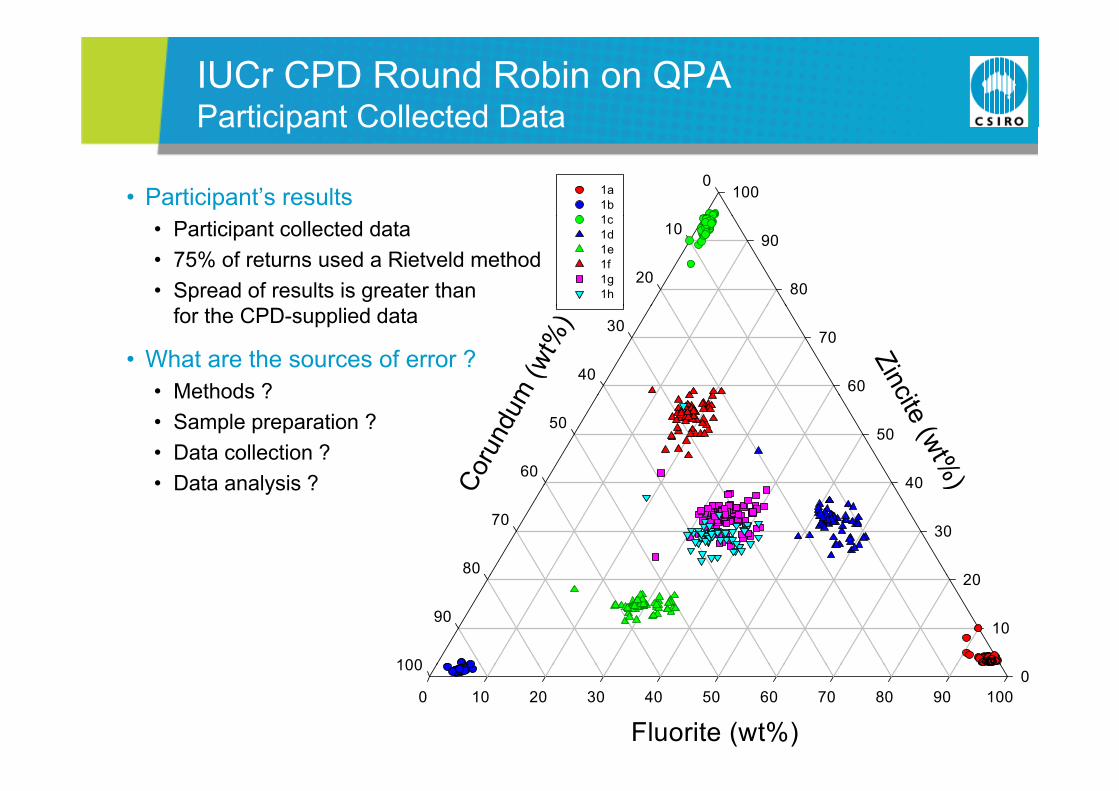
IUCr CPD Round Robin on QPAParticipant Collected Data
1000
1a1b1
Participant Collected Data
• Participant’s results
80
9010
20
1c1d1e1f1g1h
• Participant collected data• 75% of returns used a Rietveld method• Spread of results is greater than
m (w
t%)
60
70 Zinci
30
40
for the CPD-supplied data
• What are the sources of error ?• Methods ?
Coru
ndum
40
50
cite (wt%)
50
60
Methods ?• Sample preparation ?• Data collection ?• Data analysis ? C
20
30
40 )
70
80
• Data analysis ?
10
20
90
100
0 10 20 30 40 50 60 70 80 90 100
Fluorite (wt%)
0100
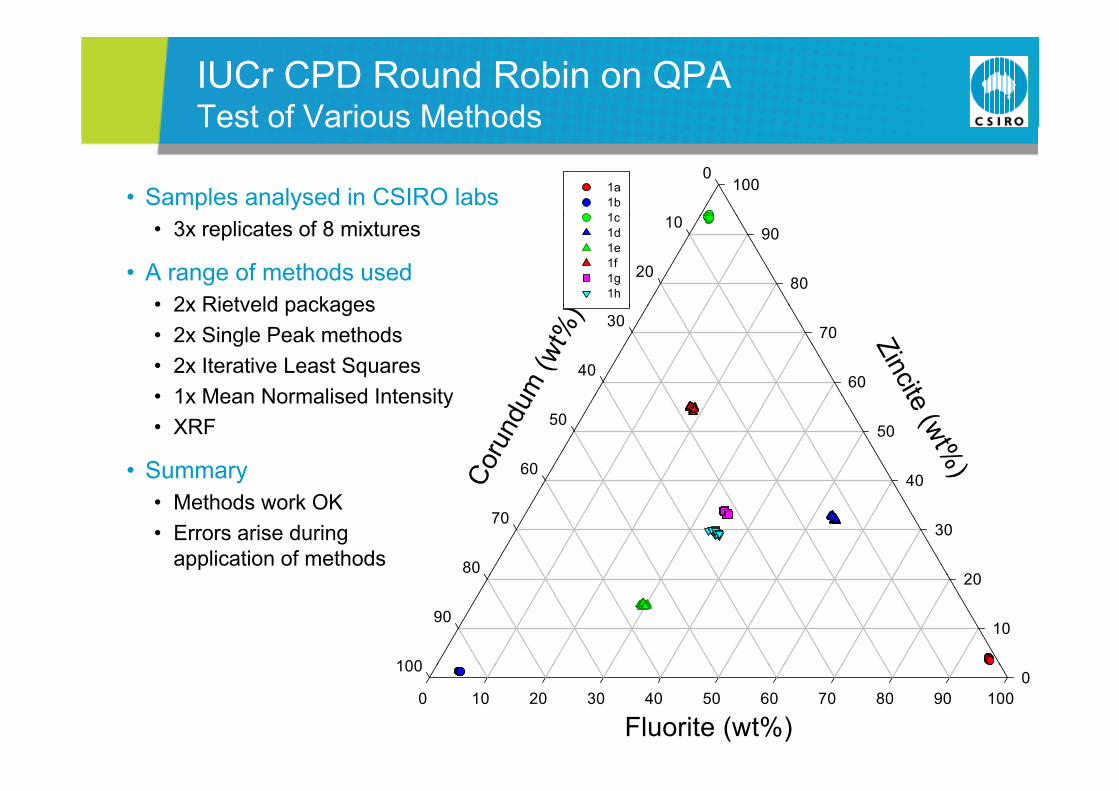
IUCr CPD Round Robin on QPATest of Various Methods
1000
1a1b1c
Test of Various Methods
• Samples analysed in CSIRO labs
)
80
9010
20
1c1d1e1f1g1h
• 3x replicates of 8 mixtures
• A range of methods used• 2x Rietveld packages
um (w
t%)
60
70 Zincite
30
40
• 2x Rietveld packages• 2x Single Peak methods• 2x Iterative Least Squares• 1x Mean Normalised Intensity
Coru
ndum
40
50
te (wt%)
50
60
• 1x Mean Normalised Intensity• XRF
• Summary C
20
30
40
70
80
• Methods work OK• Errors arise during
application of methods
10
20
90
100
0 10 20 30 40 50 60 70 80 90 100
Fluorite (wt%)
0100
Sources of Error in QPARietveld Analysis Procedures
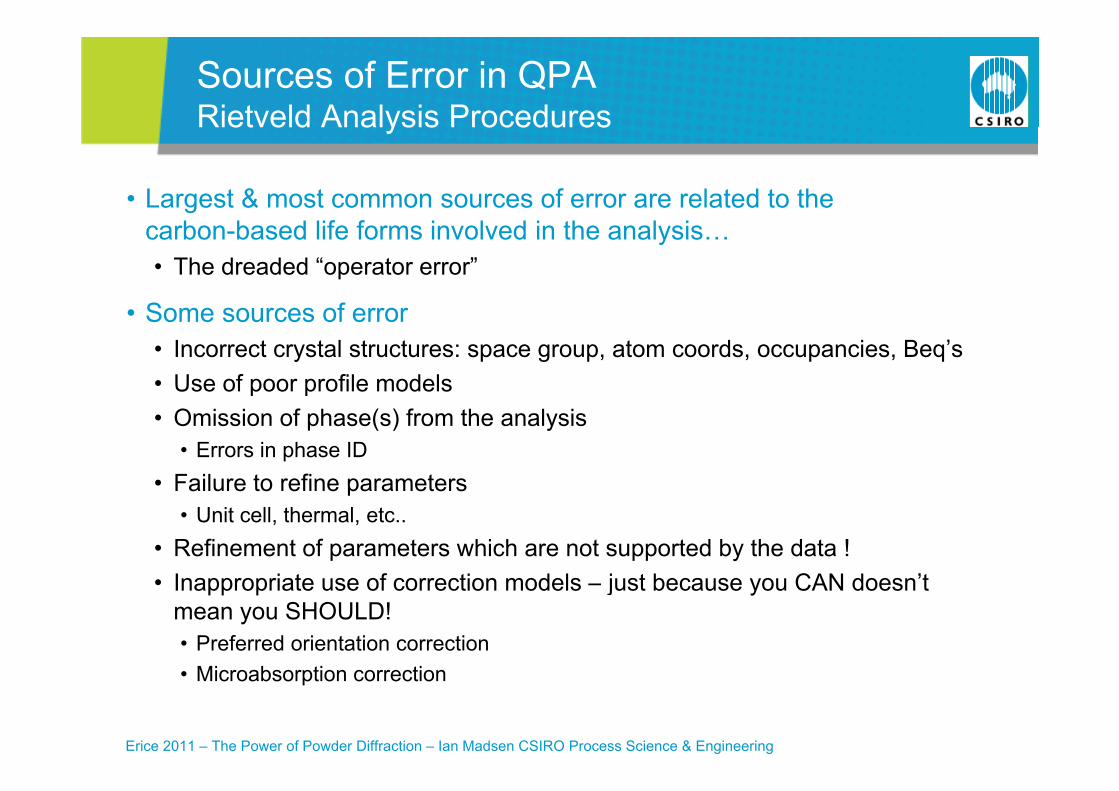
• Largest & most common sources of error are related to the
Rietveld Analysis Procedures
carbon-based life forms involved in the analysis… • The dreaded “operator error”
S f• Some sources of error• Incorrect crystal structures: space group, atom coords, occupancies, Beq’s• Use of poor profile modelsp p• Omission of phase(s) from the analysis
• Errors in phase ID• Failure to refine parameters• Failure to refine parameters
• Unit cell, thermal, etc..• Refinement of parameters which are not supported by the data !
I i t f ti d l j t b CAN d ’t• Inappropriate use of correction models – just because you CAN doesn’t mean you SHOULD!• Preferred orientation correction
Erice 2011 – The Power of Powder Diffraction – Ian Madsen CSIRO Process Science & Engineering
• Microabsorption correction
Sources of Error in QPARietveld Analysis Procedures (cont’d)Rietveld Analysis Procedures (cont d)
• Poor assessment of output• Acceptance of physically unrealistic parameters (esp. thermal parameters)• Acceptance of incomplete refinements
• High values of R-factorsHigh values of R factors • Refined parameters not checked• Visual fit of model not checked
• Poor understanding of issues in data collection and analysis procedures• Rietveld software often treated as ‘black-box’
These issues can only be solved through continuing education of users of diffraction methodology and Rietveld-based software
Erice 2011 – The Power of Powder Diffraction – Ian Madsen CSIRO Process Science & Engineering
Estimating Errors in QPAIssues in Precision and Accuracy
Estimating Errors in QPA
Precision, Accuracy & the Calculation of Errorec s o , ccu acy & t e Ca cu at o o o
• The issue of precision and accuracy in QPA via XRD is a difficult one
• Analysts most often report Rietveld errors calculated during refinement as the errors in the final quantification
Th l b l t d l t th th ti l fit f th d l• These values numbers are related purely to the mathematical fit of the model• They do not represent either precision or accuracy of the QPA !
• Determination of actual accuracy is no trivial taskDetermination of actual accuracy is no trivial task• Needs recourse to some other measure of the sample
Erice 2011 – The Power of Powder Diffraction – Ian Madsen CSIRO Process Science & Engineering
Precision, Accuracy & the Calculation of Errorec s o , ccu acy & t e Ca cu at o o o
• Consider Sample 4 from the IUCr CPD round robin• Components chosen to deliberately create a microabsorption problem
• Phases present• Corundum – Al2O3
• Magnetite – Fe3O4
• Zircon – ZrSiO44
Erice 2011 – The Power of Powder Diffraction – Ian Madsen CSIRO Process Science & Engineering
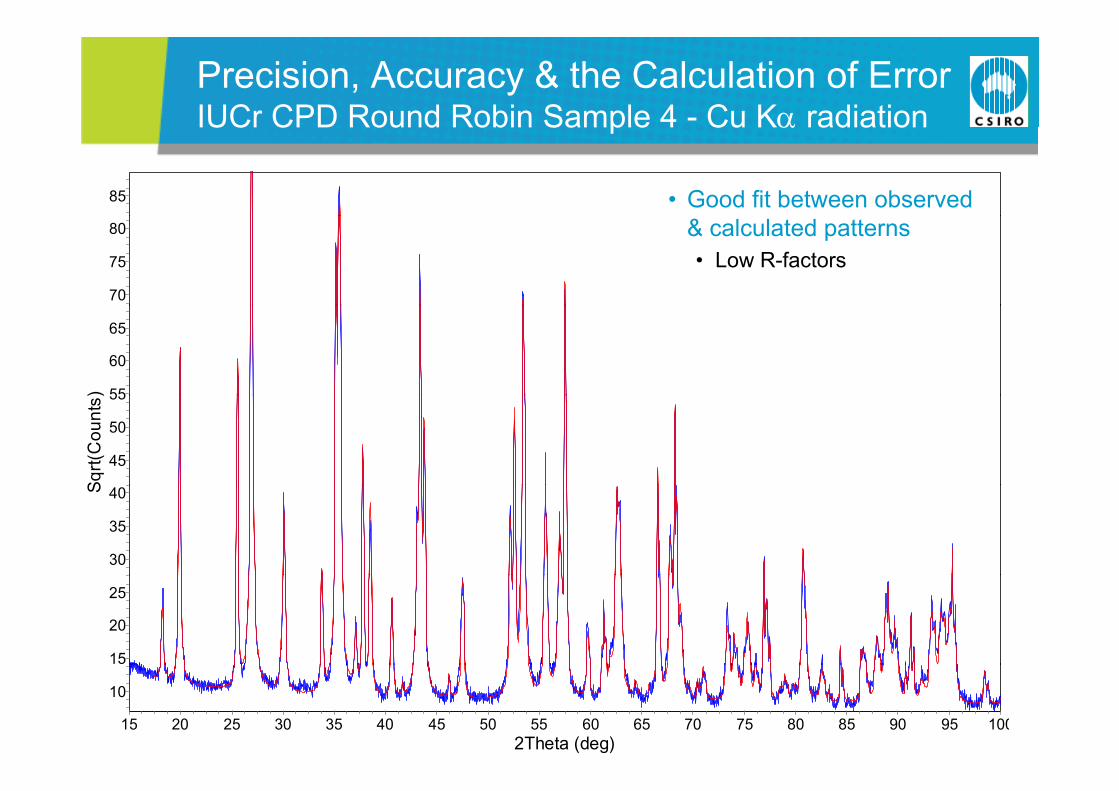
Precision, Accuracy & the Calculation of ErrorIUCr CPD Round Robin Sample 4 - Cu K radiation
85
IUCr CPD Round Robin Sample 4 Cu K radiation
• Good fit between observed 80
75
70
& calculated patterns• Low R-factors
)
65
60
55
Sqrt(
Cou
nts) 55
50
45
S 40
35
30
25
20
15
2Theta (deg)1009590858075706560555045403530252015
10
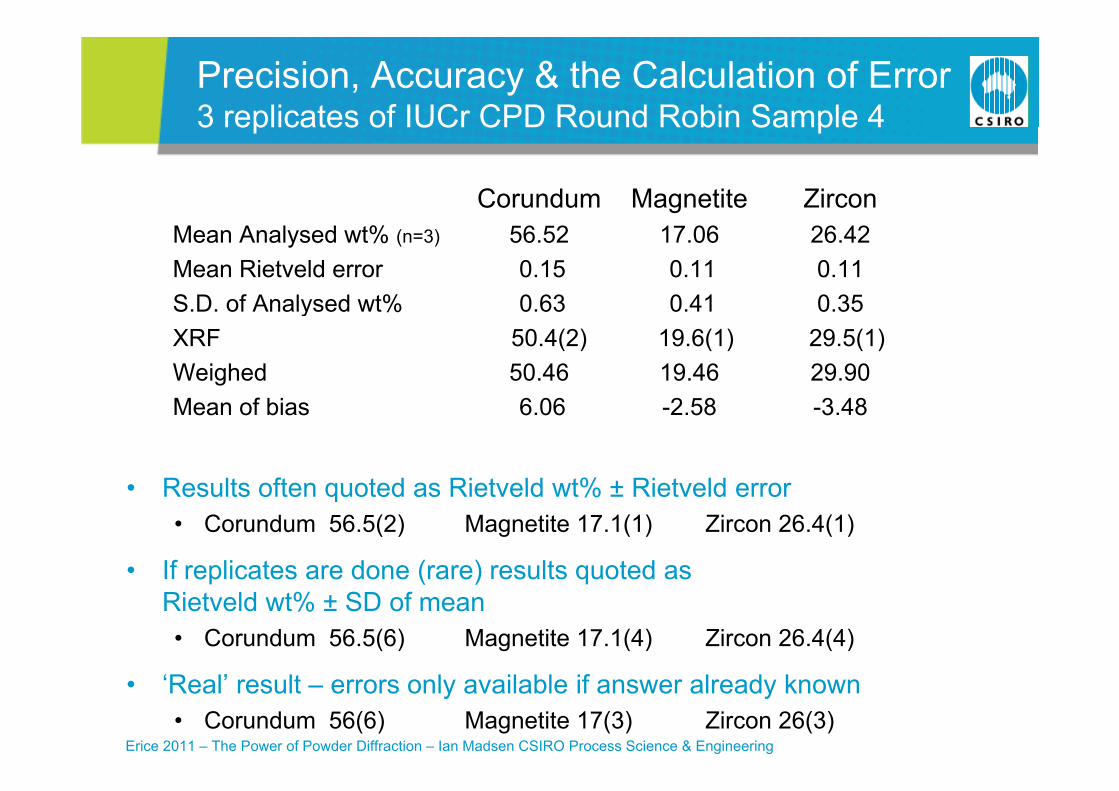
Precision, Accuracy & the Calculation of Error3 replicates of IUCr CPD Round Robin Sample 43 replicates of IUCr CPD Round Robin Sample 4
Corundum Magnetite ZirconMean Analysed wt% (n=3) 56.52 17.06 26.42Mean Rietveld error 0.15 0.11 0.11S D of Analysed wt% 0 63 0 41 0 35S.D. of Analysed wt% 0.63 0.41 0.35XRF 50.4(2) 19.6(1) 29.5(1)Weighed 50.46 19.46 29.90Mean of bias 6.06 -2.58 -3.48
• Results often quoted as Rietveld wt% ± Rietveld error• Results often quoted as Rietveld wt% ± Rietveld error • Corundum 56.5(2) Magnetite 17.1(1) Zircon 26.4(1)
• If replicates are done (rare) results quoted asIf replicates are done (rare) results quoted as Rietveld wt% ± SD of mean• Corundum 56.5(6) Magnetite 17.1(4) Zircon 26.4(4)
Erice 2011 – The Power of Powder Diffraction – Ian Madsen CSIRO Process Science & Engineering
• ‘Real’ result – errors only available if answer already known• Corundum 56(6) Magnetite 17(3) Zircon 26(3)
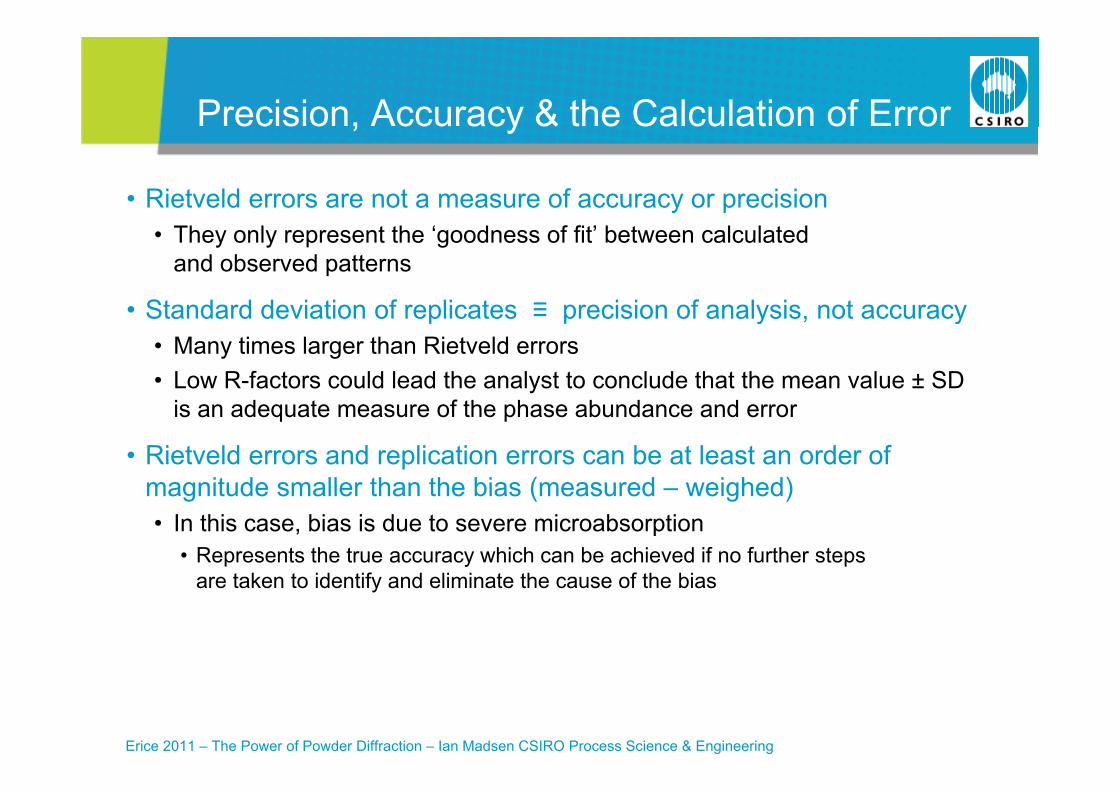
Precision, Accuracy & the Calculation of Errorec s o , ccu acy & t e Ca cu at o o o
• Rietveld errors are not a measure of accuracy or precision• They only represent the ‘goodness of fit’ between calculated
and observed patterns
Standard deviation of replicates ≡ precision of analysis not accuracy• Standard deviation of replicates ≡ precision of analysis, not accuracy• Many times larger than Rietveld errors• Low R-factors could lead the analyst to conclude that the mean value ± SD
is an adequate measure of the phase abundance and error
• Rietveld errors and replication errors can be at least an order of magnitude smaller than the bias (measured weighed)magnitude smaller than the bias (measured – weighed) • In this case, bias is due to severe microabsorption
• Represents the true accuracy which can be achieved if no further steps t k t id tif d li i t th f th biare taken to identify and eliminate the cause of the bias
Erice 2011 – The Power of Powder Diffraction – Ian Madsen CSIRO Process Science & Engineering
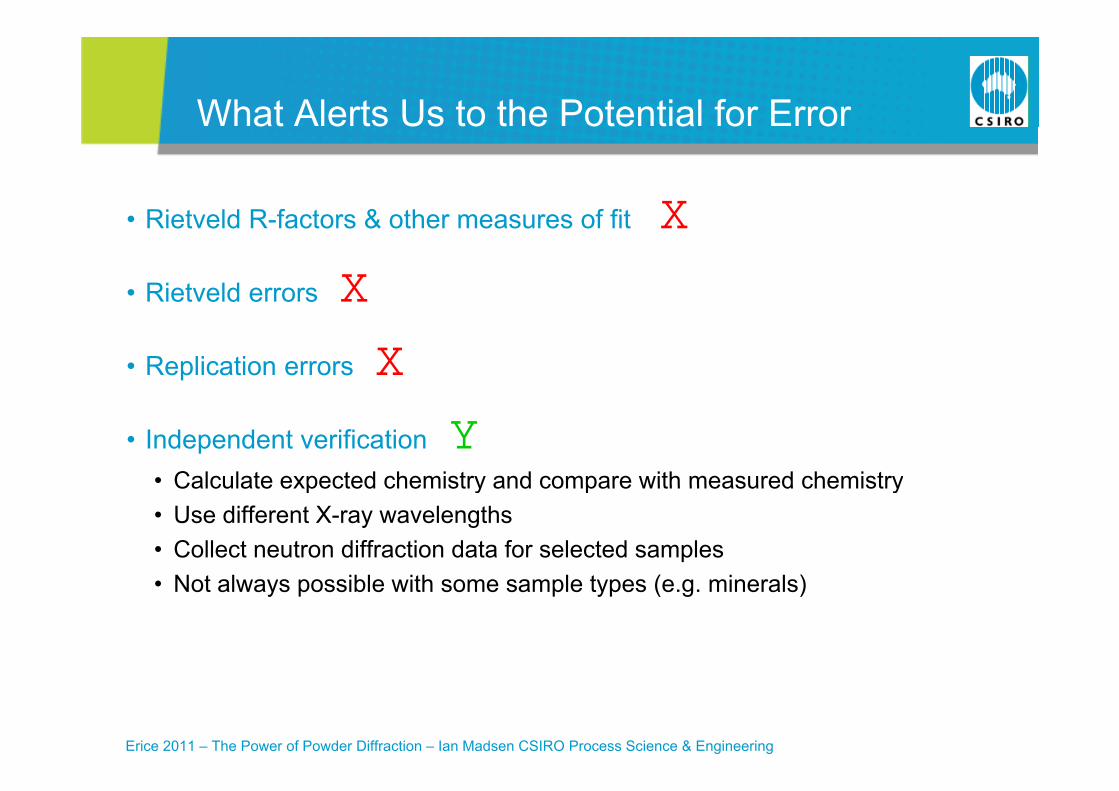
What Alerts Us to the Potential for Errorat e ts Us to t e ote t a o o
• Rietveld R factors & other measures of fit �• Rietveld R-factors & other measures of fit �
• Rietveld errors �
• Replication errors �
• Independent verification �• Calculate expected chemistry and compare with measured chemistryCalculate expected chemistry and compare with measured chemistry• Use different X-ray wavelengths• Collect neutron diffraction data for selected samples
N t l ibl ith l t ( i l )• Not always possible with some sample types (e.g. minerals)
Erice 2011 – The Power of Powder Diffraction – Ian Madsen CSIRO Process Science & Engineering
MicroabsorptionIssues in Precision and Accuracy
Microabsorption
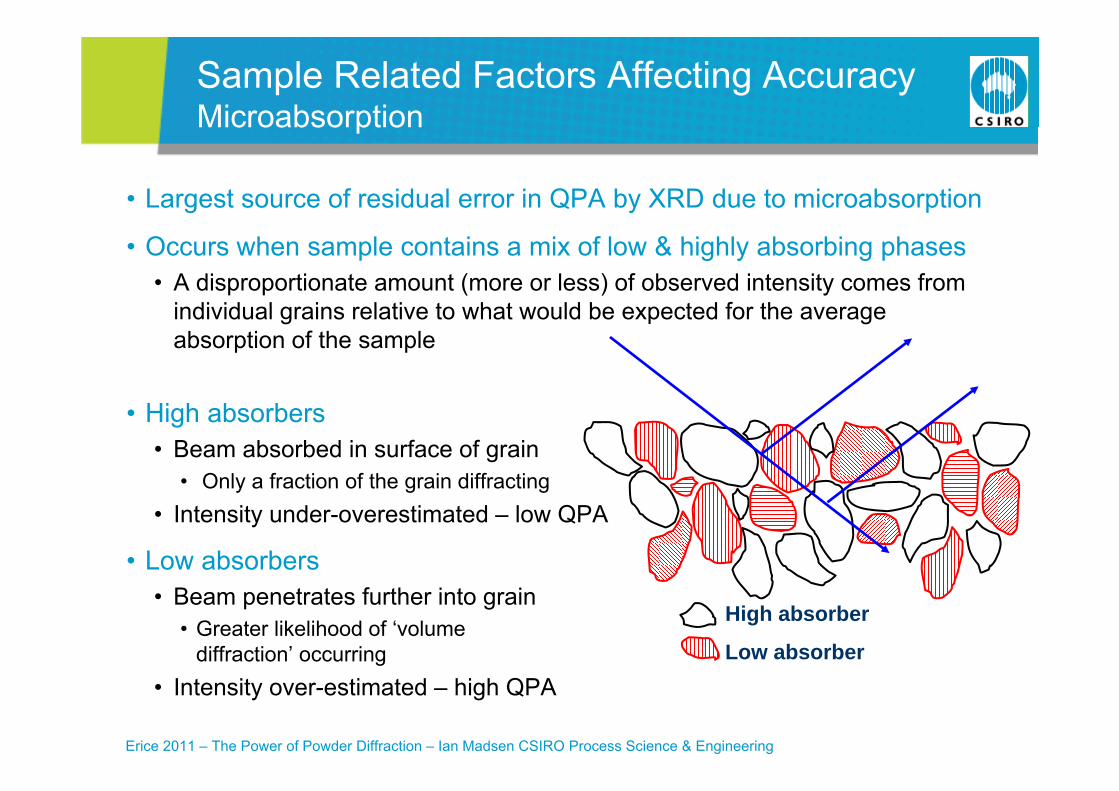
Sample Related Factors Affecting AccuracyMicroabsorptionMicroabsorption
• Largest source of residual error in QPA by XRD due to microabsorption
• Occurs when sample contains a mix of low & highly absorbing phases• A disproportionate amount (more or less) of observed intensity comes from
i di id l i l ti t h t ld b t d f thindividual grains relative to what would be expected for the average absorption of the sample
• High absorbers• Beam absorbed in surface of grain
• Only a fraction of the grain diffractingOnly a fraction of the grain diffracting• Intensity under-overestimated – low QPA
• Low absorbers• Beam penetrates further into grain
• Greater likelihood of ‘volume diffraction’ occurring
High absorber
Low absorber
Erice 2011 – The Power of Powder Diffraction – Ian Madsen CSIRO Process Science & Engineering
g• Intensity over-estimated – high QPA

Sample Related Factors Affecting AccuracyMicroabsorption (cont’d)Microabsorption (cont d)
• For the analyst encountering a new sample, it is difficult to determine whether a correction for microabsorption is required without first obtaining additional information
The Brindley model is most frequently applied correction• The Brindley model is most frequently applied correction • Requires knowledge of absorption contrast and particle sizes
• The latter is not easily achieved in ‘real’ samples
• The Brindley model assumes spherical particles of uniform size • Assumption is unrealistic in real samples
E h ti l i i d b l i i SEM• Even when particle size is measured by e.g. laser-sizing or SEM,the best form of correction can still be unclear
Erice 2011 – The Power of Powder Diffraction – Ian Madsen CSIRO Process Science & Engineering
Sample Related Factors Affecting AccuracyMicroabsorption (cont’d)Microabsorption (cont d)
• Many applications suffer from unnecessary and/or excessive correction• Minor microabsorption problem in Sample 1 suite in Round Robin• Largely overcorrected when addressed
• Better results achieved through care in sample preparation than in• Better results achieved through care in sample preparation than in application of correction
• Microabsorption is virtually absent for neutronsMicroabsorption is virtually absent for neutrons• Neutron diffraction based results can act as a ‘benchmark’ for X-ray studies
Erice 2011 – The Power of Powder Diffraction – Ian Madsen CSIRO Process Science & Engineering
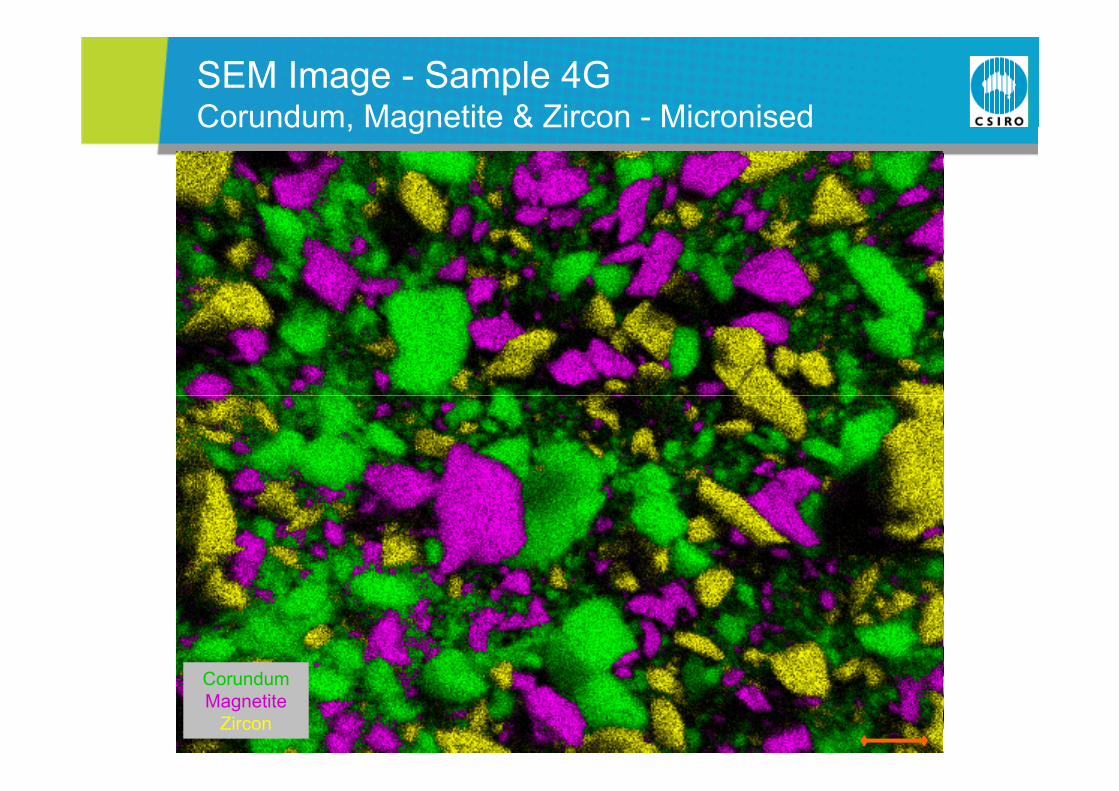
SEM Image - Sample 4GCorundum, Magnetite & Zircon - MicronisedCorundum, Magnetite & Zircon Micronised
CorundumMagnetite
Zircon
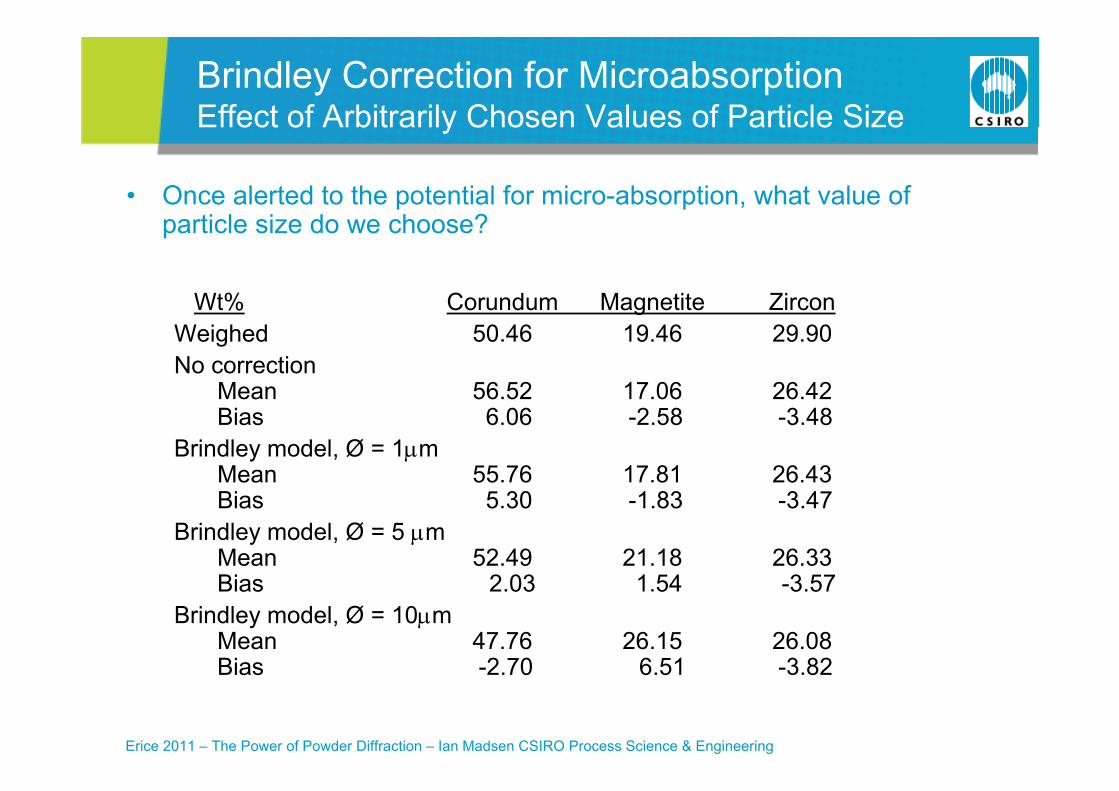
Brindley Correction for MicroabsorptionEffect of Arbitrarily Chosen Values of Particle SizeEffect of Arbitrarily Chosen Values of Particle Size
• Once alerted to the potential for micro-absorption, what value of ti l i d h ?particle size do we choose?
Wt% Corundum Magnetite ZirconWt% Corundum Magnetite ZirconWeighed 50.46 19.46 29.90No correction
Mean 56 52 17 06 26 42Mean 56.52 17.06 26.42Bias 6.06 -2.58 -3.48
Brindley model, Ø = 1mMean 55.76 17.81 26.43Bias 5.30 -1.83 -3.47
Brindley model, Ø = 5 mMean 52.49 21.18 26.33Bi 2 03 1 54 3 57Bias 2.03 1.54 -3.57
Brindley model, Ø = 10mMean 47.76 26.15 26.08Bias 2 70 6 51 3 82
Erice 2011 – The Power of Powder Diffraction – Ian Madsen CSIRO Process Science & Engineering
Bias -2.70 6.51 -3.82
Particle StatisticsFactors Affecting Accuracy
Particle Statistics
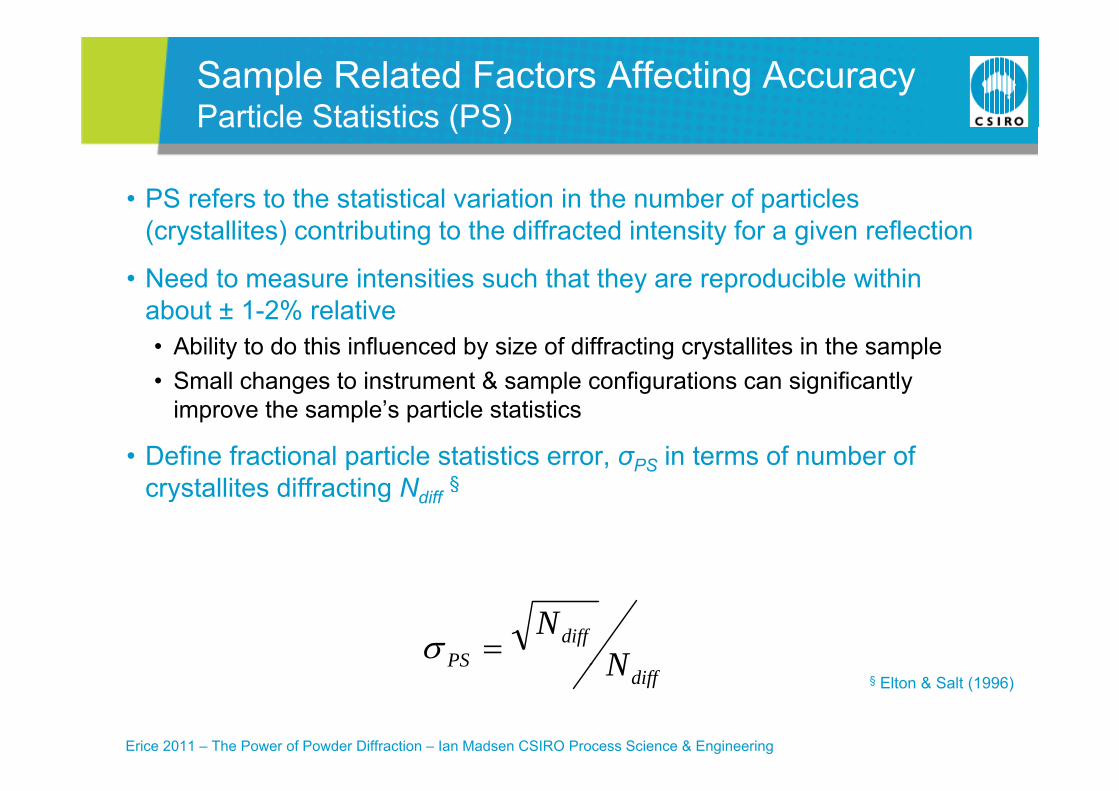
Sample Related Factors Affecting AccuracyParticle Statistics (PS)Particle Statistics (PS)
• PS refers to the statistical variation in the number of particles (crystallites) contributing to the diffracted intensity for a given reflection
• Need to measure intensities such that they are reproducible within about ± 1 2% relativeabout ± 1-2% relative• Ability to do this influenced by size of diffracting crystallites in the sample• Small changes to instrument & sample configurations can significantly
improve the sample’s particle statistics
• Define fractional particle statistics error, σPS in terms of number of crystallites diffracting N §crystallites diffracting Ndiff
§
diffPS N
N
Erice 2011 – The Power of Powder Diffraction – Ian Madsen CSIRO Process Science & Engineering
diffPS N
§ Elton & Salt (1996)
Sample Related Factors Affecting AccuracyParticle Statistics (cont’d)Particle Statistics (cont d)
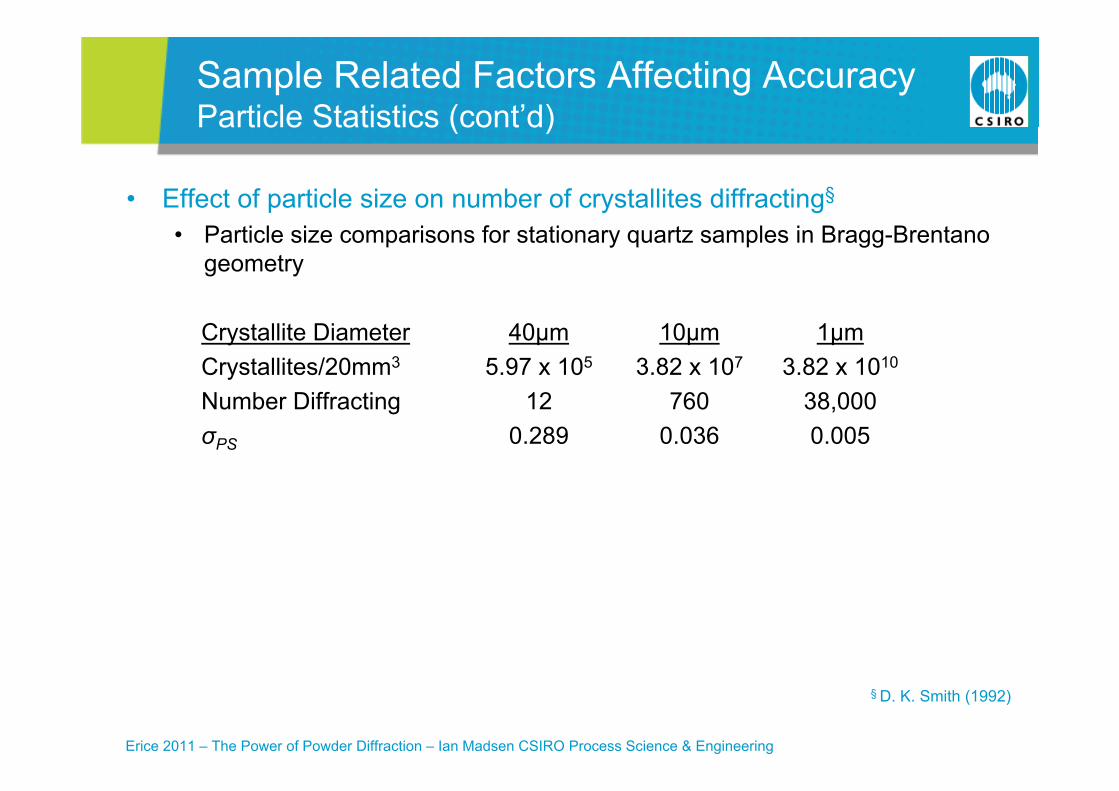
• Effect of particle size on number of crystallites diffracting§
• Particle size comparisons for stationary quartz samples in Bragg-Brentano geometry
Crystallite Diameter 40µm 10µm 1µmCrystallites/20mm3 5.97 x 10⁵ 3.82 x 10⁷ 3.82 x 10¹⁰
N b Diff ti 12 760 38 000Number Diffracting 12 760 38,000σPS 0.289 0.036 0.005
Erice 2011 – The Power of Powder Diffraction – Ian Madsen CSIRO Process Science & Engineering
§ D. K. Smith (1992)
Sample Related Factors Affecting Accuracy Ways to improve particle statisticsWays to improve particle statistics
• Increase the instrument beam divergence• Use a broad focus rather than a fine focus tube • Use wider divergence and receiving slits• σ improved by ~ 2x• σPS improved by 2x• Issue for synchrotron based work
• Geometry serves to decrease divergence
• Rotate the sample• About the vertical to sample surface – flat plate sample• About the sample axis capillary sample• About the sample axis – capillary sample• σPS improved by ~ 5 to 6x
Erice 2011 – The Power of Powder Diffraction – Ian Madsen CSIRO Process Science & Engineering
Sample Related Factors Affecting AccuracyWays to improve particle statistics (cont’d)Ways to improve particle statistics (cont d)
• Oscillate the sample about θ axis (flat plate geometry)• Destroys θ/2θ relationship
• Aberrations in peak intensities, positions & profile shapes • σPS improvement depends on the range of oscillation usedσPS improvement depends on the range of oscillation used
• Repack the sample, recollect and reanalyse the diffraction data • Averaging results produces more meaningful parameter values• Independent determination of parameter esd’s
• Reduce mean crystallite size by mechanical comminution of the sample• The most effective method of increasing the number of crystallites examined • McCrone micronising mill reduces particle size to ~10µm or less in 1-20 min.
Erice 2011 – The Power of Powder Diffraction – Ian Madsen CSIRO Process Science & Engineering
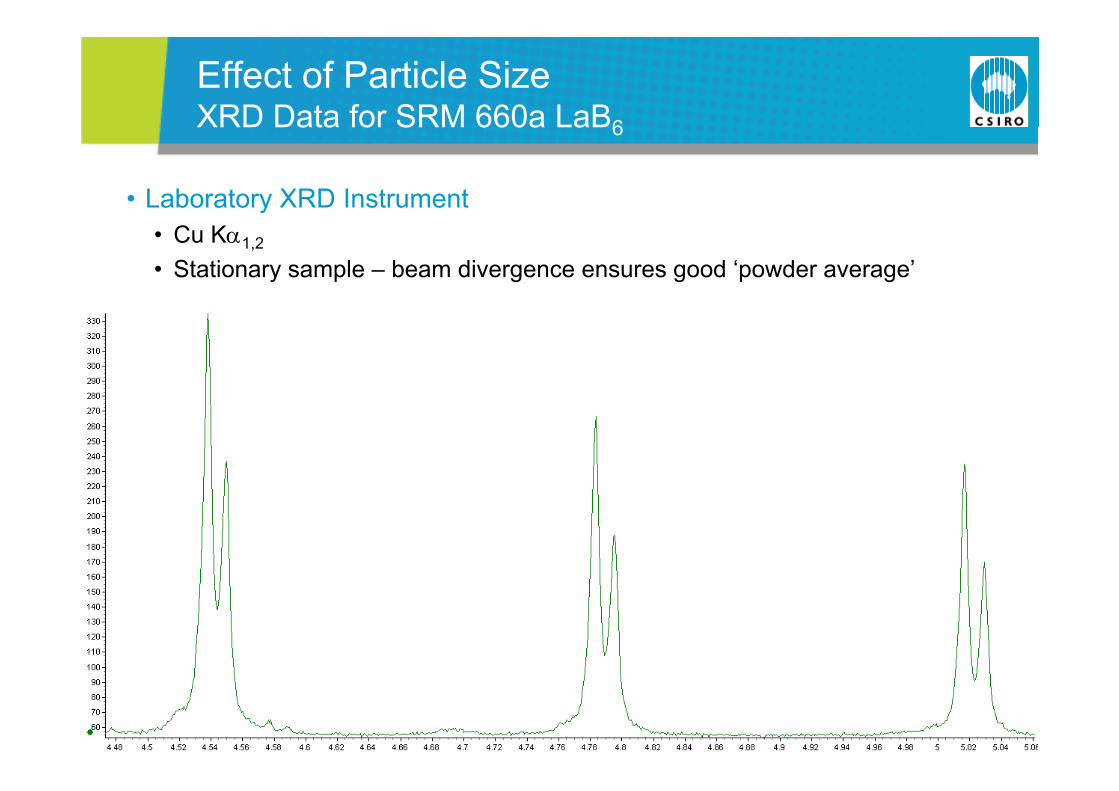
Effect of Particle SizeXRD Data for SRM 660a LaB6XRD Data for SRM 660a LaB6
• Laboratory XRD Instrument • Cu K1,2
• Stationary sample – beam divergence ensures good ‘powder average’
Erice 2011 – The Power of Powder Diffraction – Ian Madsen CSIRO Process Science & Engineering

Effect of Particle SizeXRD Data for SRM 660a LaB6XRD Data for SRM 660a LaB6
• Australian Synchrotron • 0.3mm capillary• Spinning sample – rotating sample ensures a good ‘powder average’
Erice 2011 – The Power of Powder Diffraction – Ian Madsen CSIRO Process Science & Engineering
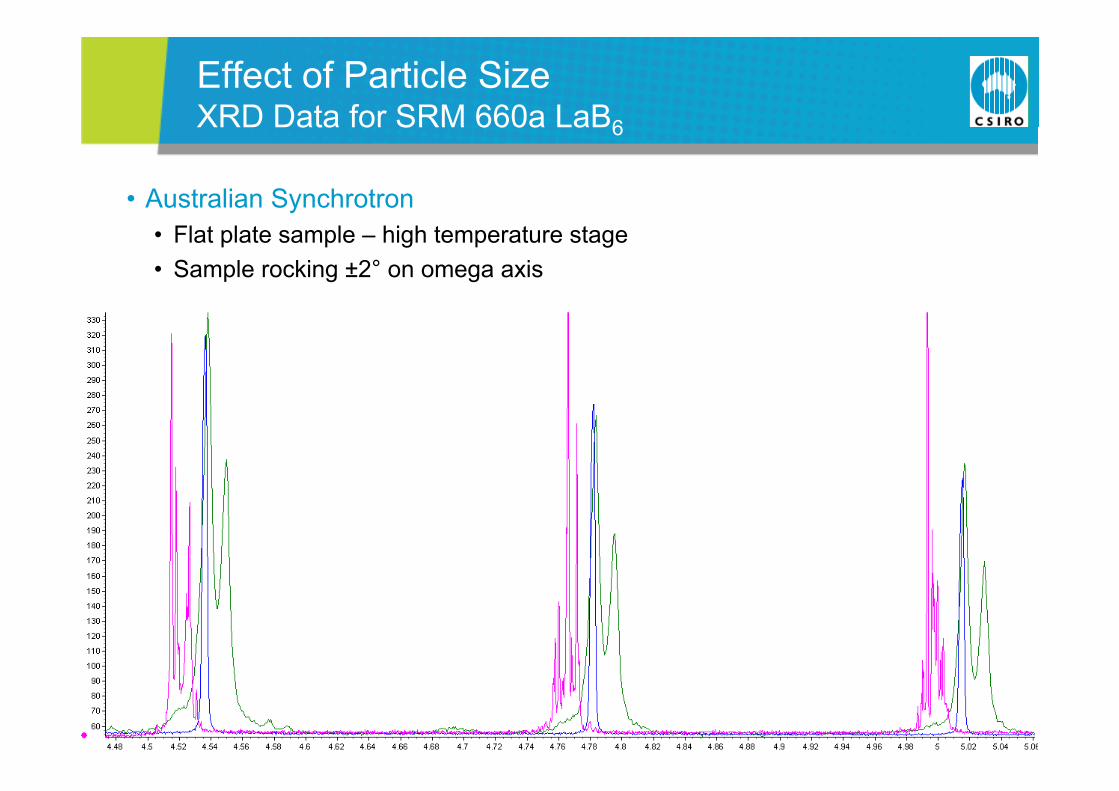
Effect of Particle SizeXRD Data for SRM 660a LaB6XRD Data for SRM 660a LaB6
• Australian Synchrotron • Flat plate sample – high temperature stage• Sample rocking ±2° on omega axis
Erice 2011 – The Power of Powder Diffraction – Ian Madsen CSIRO Process Science & Engineering
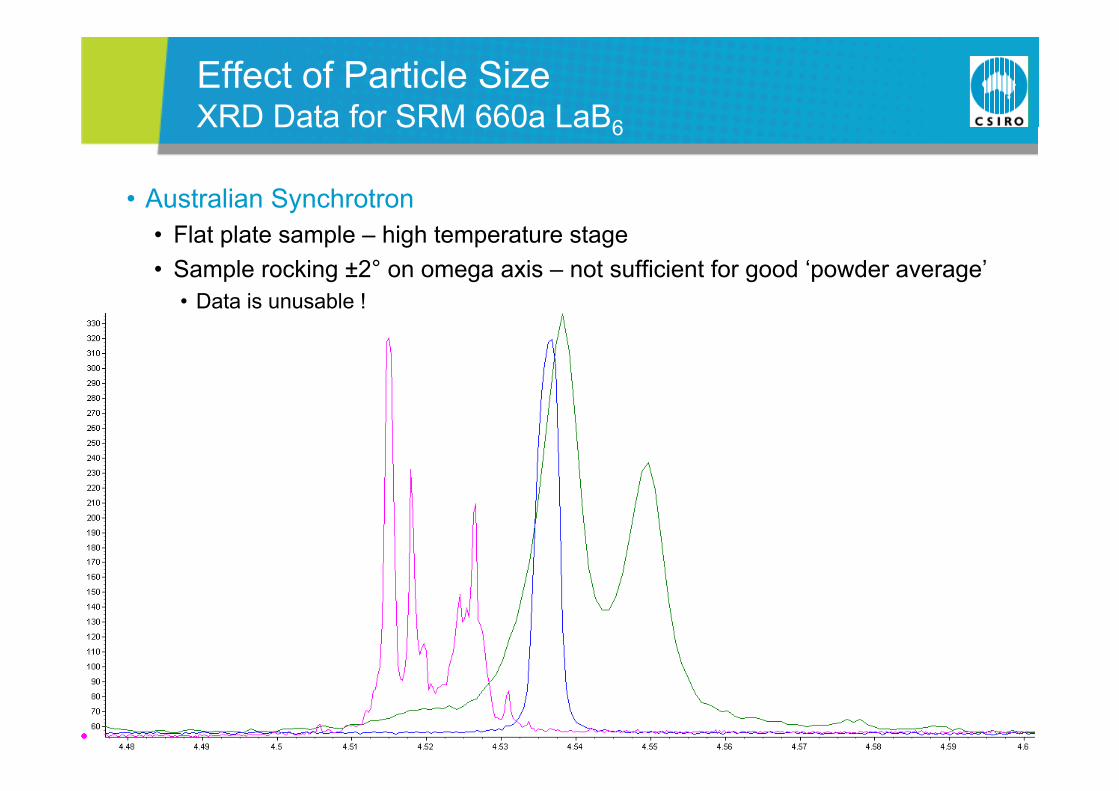
Effect of Particle SizeXRD Data for SRM 660a LaB6XRD Data for SRM 660a LaB6
• Australian Synchrotron • Flat plate sample – high temperature stage• Sample rocking ±2° on omega axis – not sufficient for good ‘powder average’
• Data is unusable !Data is unusable !
Erice 2011 – The Power of Powder Diffraction – Ian Madsen CSIRO Process Science & Engineering
Referencese e e ces• Alexander & Klug (1948), “X-ray diffraction analysis of crystalline dusts”, Analytical Chemistry, 20, 886-894
• Bish, D.L. and S.A. Howard (1988) Quantitative phase analysis using the Rietveld method. Journal of Applied Crystallography, 21(2): pp. 86-91.( ) pp
• Chung, F.H. and D.K. Smith (2000), Chapter 2 - The Practice of Diffraction Analysis, in Industrial Applications of X-ray Diffraction, F.H. Chung and D.K. Smith, Editors., Marcel Dekker.
• Chung, F.H. (1974a) Quantitative interpretation of X-ray diffraction patterns of mixtures. I. Matrix-flushing method for quantitative multicomponent analysis. Journal of Applied Crystallography,. 7: pp. 519-525.
• Chung, F.H. (1974b) Quantitative interpretation of X-ray diffraction patterns of mixtures. II. Adiabatic principle of X-ray diffraction analysis of mixtures. Journal of Applied Crystallography, 7: pp. 526-531.
• Elton, N.J. and P.D. Salt (1996) Particle statistics in quantitative X-ray diffractometry. Powder Diffraction, 11(3): 218-229.
• Hill, R.J. and C.J. Howard (1987) Quantitative Phase Analysis from Neutron Powder Diffraction Data using the Rietveld Method.Journal of Applied Crystallography 20: pp 467 474Journal of Applied Crystallography, 20: pp. 467-474.
• Madsen, I.C., N.V.Y. Scarlett, L.M.D. Cranswick, and T. Lwin (2001) Outcomes of the International Union of Crystallography Commission on Powder Diffraction Round Robin on Quantitative Phase Analysis: samples 1a to 1h. Journal of Applied Crystallography, 34(4): pp. 409-426.
• O'Connor, B.H. and M.D. Raven (1988) Application of the Rietveld Refinement Procedure in Assaying Powdered Mixtures. Powder ff ( )Diffraction, 3(1): pp. 2-6
• Scarlett, N.V.Y., I.C. Madsen, L.M.D. Cranswick, T. Lwin, E. Groleau, G. Stephenson, M. Aylmore, and N. Agron-Olshina (2002) Outcomes of the International Union of Crystallography Commission on Powder Diffraction Round Robin on Quantitative Phase Analysis: samples 2, 3, 4, synthetic bauxite, natural granodiorite and pharmaceuticals.Journal of Applied Crystallography, 35(4): pp. 383-400.
• Scarlett, N.V.Y. and Madsen I.C. (2006), “Quantification of phases with partial or no known crystal structures” Powder Diffraction, 21(4), 278-284.
• Smith, D.K. (1992) Particle Statistics and Whole Pattern Methods in Quantitative X-ray Powder Diffraction Analysis. Advances in X-ray Analysis, 35: pp. 1-15.
• Webster N A S I C Madsen M J Loan R B Knott F Naim K S Wallwork and J A Kimpton (2010) An Investigation of
Erice 2011 – The Power of Powder Diffraction – Ian Madsen CSIRO Process Science & Engineering
• Webster, N.A.S., I.C. Madsen, M.J. Loan, R.B. Knott, F. Naim, K.S. Wallwork, and J.A. Kimpton (2010) An Investigation of Goethite-Seeded Al(OH)3 Precipitation Using in situ X-ray Diffraction and Rietveld-based Quantitative Phase Analysis. Journal of Applied Crystallography, 43: pp. 466-472
• Zevin & Kimmel (1995) Quantitative X-ray Diffractometry. Springer New York
CSIRO Process Science & EngineeringCSIRO Process Science & EngineeringIan MadsenTeam Leader – Diffraction Science
Phone: +61 3 9545 8785Email: [email protected]: www.csiro.au/minerals
Contact UsContact UsPhone: 1300 363 400 or +61 3 9545 2176
Email: [email protected] Web: www.csiro.au


