Embed Size (px)
Citation preview
QlikView Overview
Insert Name Here
Dated February 16, 2012.
Legal Disclaimer
This Presentation contains forward-looking statements, including, but not limited to, statements regarding the value
and effectiveness of QlikTech's products, the introduction of product enhancements or additional products and
QlikTech's growth, expansion and market leadership, that involve risks, uncertainties, assumptions and other factors
which, if they do not materialize or prove correct, could cause QlikTech's results to differ materially from those
expressed or implied by such forward-looking statements. All statements, other than statements of historical fact, are
statements that could be deemed forward-looking statements, including statements containing the words "predicts,"
"plan," "expects," "anticipates," "believes," "goal," "target," "estimate," "potential," "may", "will," "might," "could," and
similar words. QlikTech intends all such forward-looking statements to be covered by the safe harbor provisions for
forward-looking statements contained in Section 21E of the Exchange Act and the Private Securities Litigation Reform
Act of 1995. Actual results may differ materially from those projected in such statements due to various factors,
including but not limited to: risks and uncertainties inherent in our business; our ability to attract new customers and
retain existing customers; our ability to effectively sell, service and support our products; our ability to manage our
international operations; our ability to compete effectively; our ability to develop and introduce new products and add-
ons or enhancements to existing products; our ability to continue to promote and maintain our brand in a cost-effective
manner; our ability to manage growth; our ability to attract and retain key personnel; the scope and validity of
intellectual property rights applicable to our products; adverse economic conditions in general and adverse economic
conditions specifically affecting the markets in which we operate; and other risks more fully described in QlikTech's
publicly available filings with the Securities and Exchange Commission. Past performance is not necessarily indicative
of future results. The forward-looking statements included in this presentation represent QlikTech's views as of the
date of this presentation. QlikTech anticipates that subsequent events and developments will cause its views to
change. QlikTech undertakes no intention or obligation to update or revise any forward-looking statements, whether
as a result of new information, future events or otherwise. These forward-looking statements should not be relied upon
as representing QlikTech's views as of any date subsequent to the date of this presentation.
This Presentation should be read in conjunction with QlikTech's periodic reports filed with the SEC (SEC Information),
including the disclosures therein of certain factors which may affect QlikTech’s future performance. Individual
statements appearing in this Presentation are intended to be read in conjunction with and in the context of the
complete SEC Information documents in which they appear, rather than as stand-alone statements.
© 2011 Qlik Technologies Inc. All rights reserved. QlikTech and QlikView are trademarks or registered trademarks of
Qlik Technologies Inc. or its subsidiaries in the U.S. and other countries. Other company names, product names and
company logos mentioned herein are the trademarks, or registered trademarks of their owners.
Dated February 16, 2012.
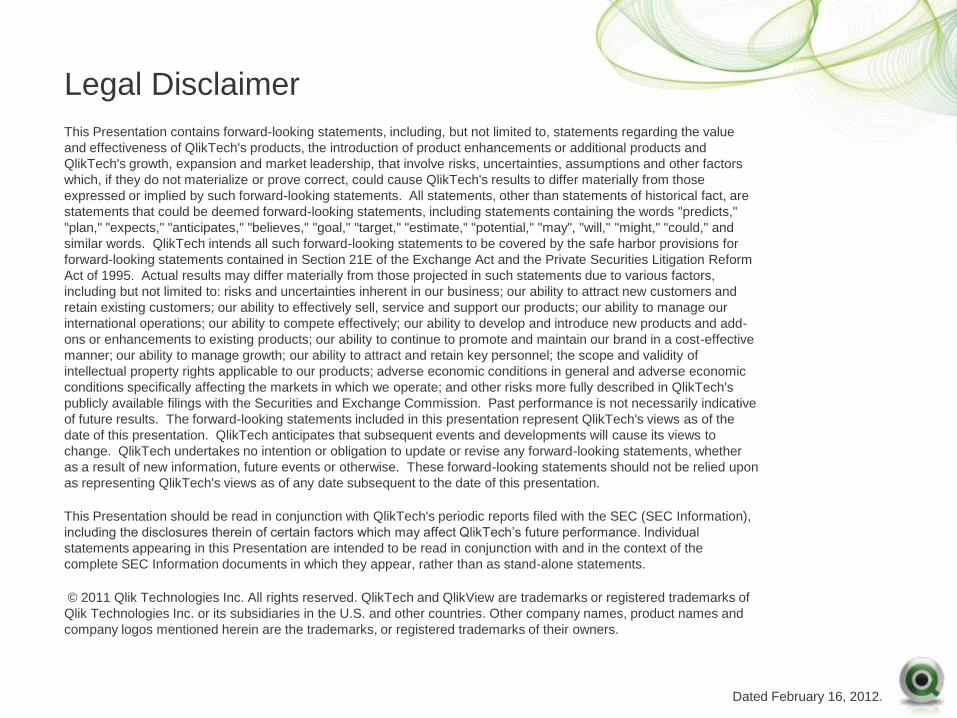
A New Kind of Software Company
• U.S.-based company,
founded 1993 in Sweden
• 24,000 customers in
100 countries
• 1,200 global partners
• 1,000+ employees across
28 offices in 23 countries
• NASDAQ: QLIK
• Change Their World
grant program
Broad Base of 24,000 Customers
Dated February 16, 2012.
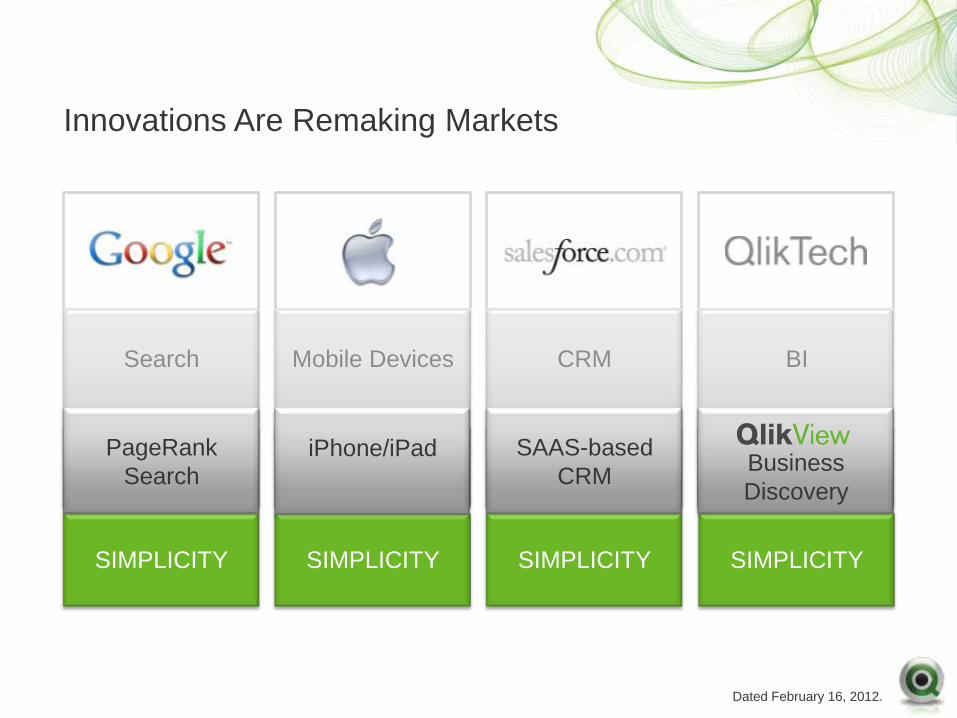
Mobile Devices Search
Innovations Are Remaking Markets
BI CRM
SIMPLICITY SIMPLICITY SIMPLICITY SIMPLICITY
PageRank
Search
iPhone/iPad SAAS-based
CRM Business
Discovery
Dated February 16, 2012.
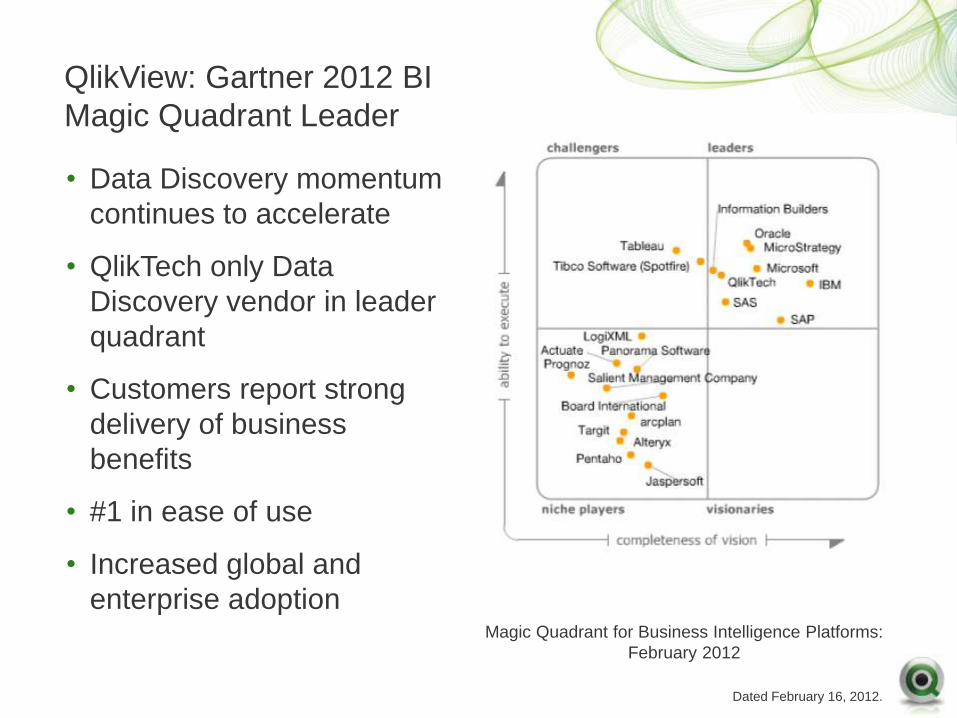
QlikView: Gartner 2012 BI
Magic Quadrant Leader
• Data Discovery momentum
continues to accelerate
• QlikTech only Data
Discovery vendor in leader
quadrant
• Customers report strong
delivery of business
benefits
• #1 in ease of use
• Increased global and
enterprise adoption Magic Quadrant for Business Intelligence Platforms:
February 2012
Dated February 16, 2012.
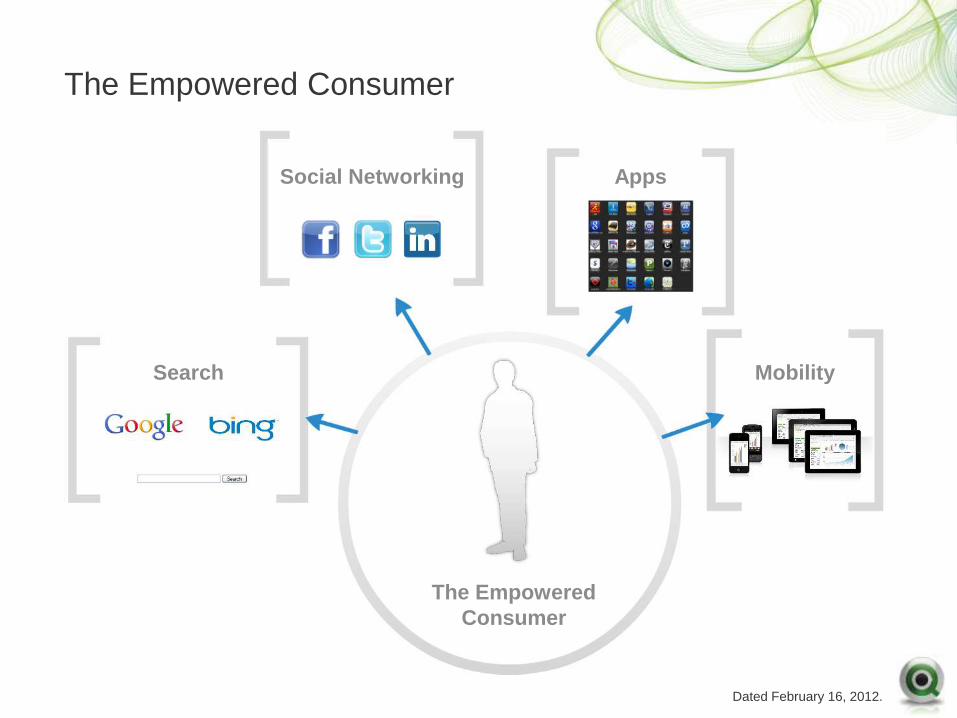
The Empowered Consumer
Mobility Search
Social Networking Apps
The Empowered
Consumer
Dated February 16, 2012.
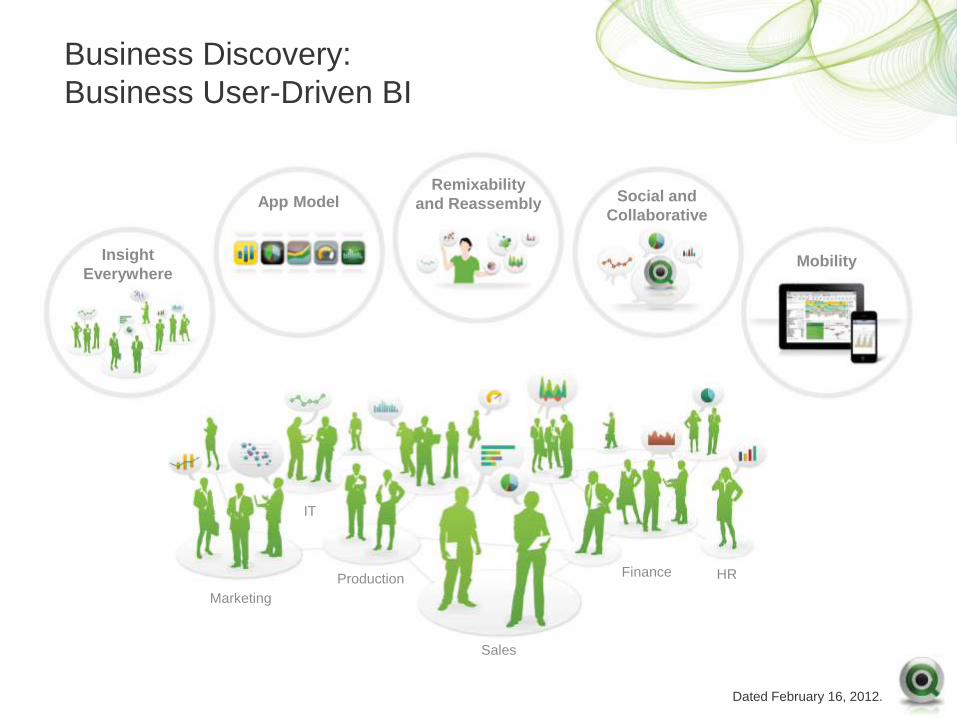
Business Discovery:
Business User-Driven BI
Insight
Everywhere
App Model Remixability
and Reassembly Social and
Collaborative
Mobility
Finance HR
Sales
Marketing
IT
Production
Dated February 16, 2012.
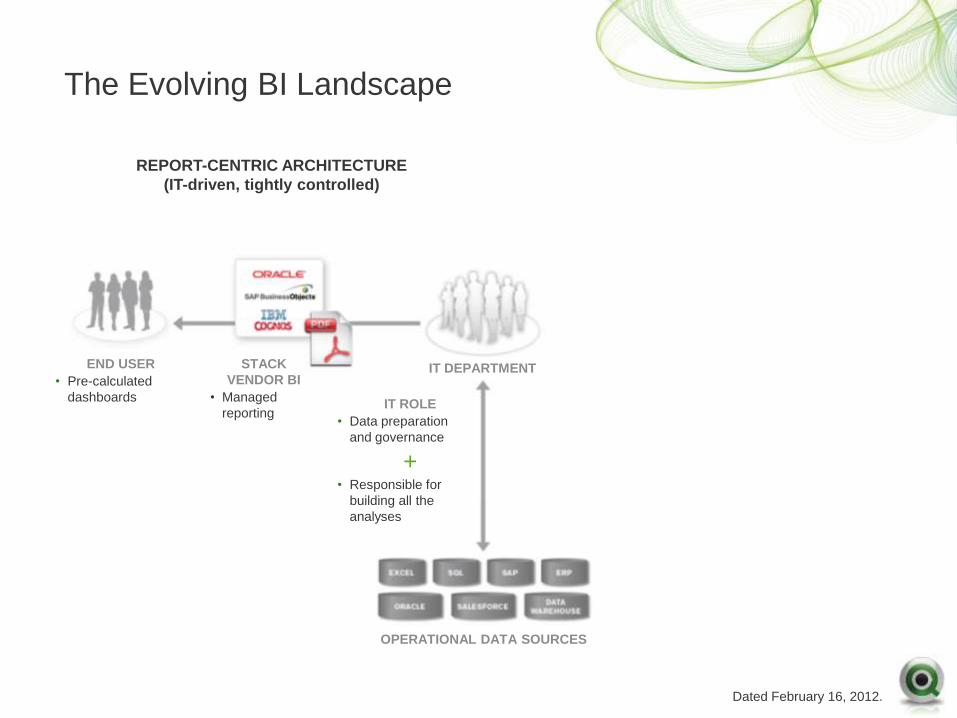
The Evolving BI Landscape
STACK
VENDOR BI
• Managed
reporting
END USER
• Pre-calculated
dashboards
OPERATIONAL DATA SOURCES
IT DEPARTMENT
REPORT-CENTRIC ARCHITECTURE
(IT-driven, tightly controlled)
IT ROLE
• Data preparation
and governance
+ • Responsible for
building all the
analyses
Dated February 16, 2012.
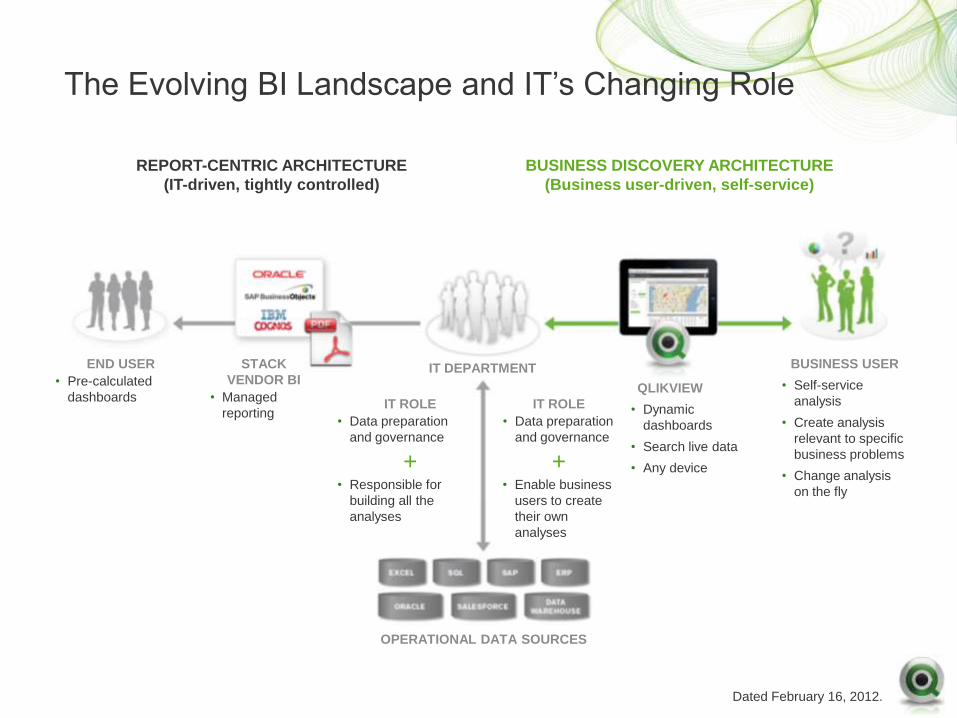
The Evolving BI Landscape and IT’s Changing Role
STACK
VENDOR BI
• Managed
reporting IT ROLE
• Data preparation
and governance
+ • Enable business
users to create
their own
analyses
IT ROLE
• Data preparation
and governance
+ • Responsible for
building all the
analyses
END USER
• Pre-calculated
dashboards
BUSINESS USER
• Self-service
analysis
• Create analysis
relevant to specific
business problems
• Change analysis
on the fly
QLIKVIEW
• Dynamic
dashboards
• Search live data
• Any device
OPERATIONAL DATA SOURCES
IT DEPARTMENT
REPORT-CENTRIC ARCHITECTURE
(IT-driven, tightly controlled)
BUSINESS DISCOVERY ARCHITECTURE
(Business user-driven, self-service)
Dated February 16, 2012.
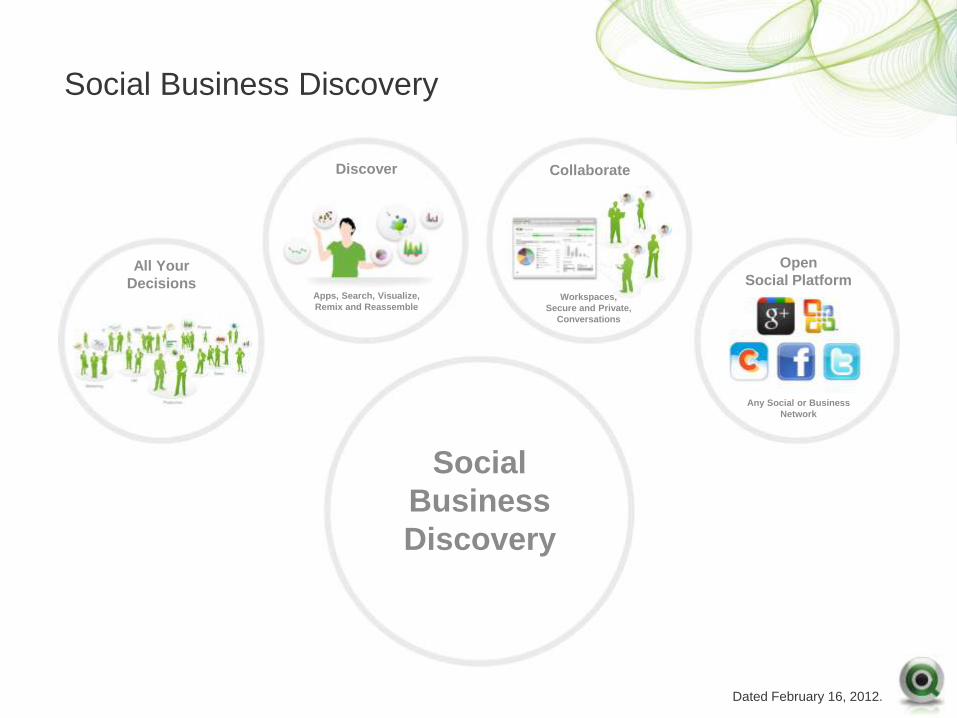
Social Business Discovery
All Your
Decisions
Discover
Apps, Search, Visualize,
Remix and Reassemble
Collaborate
Open
Social Platform
Social
Business
Discovery
Workspaces,
Secure and Private,
Conversations
Any Social or Business
Network

Dated February 16, 2012.
QlikView on Mobile
Engaging
User Interface
One QlikView,
Any Device
Complete
Business Discovery
Experience Live Data
Manageable
And Secure
QlikView
On Mobile
Not Just Gorgeous,
But Genius
Dated February 16, 2012.
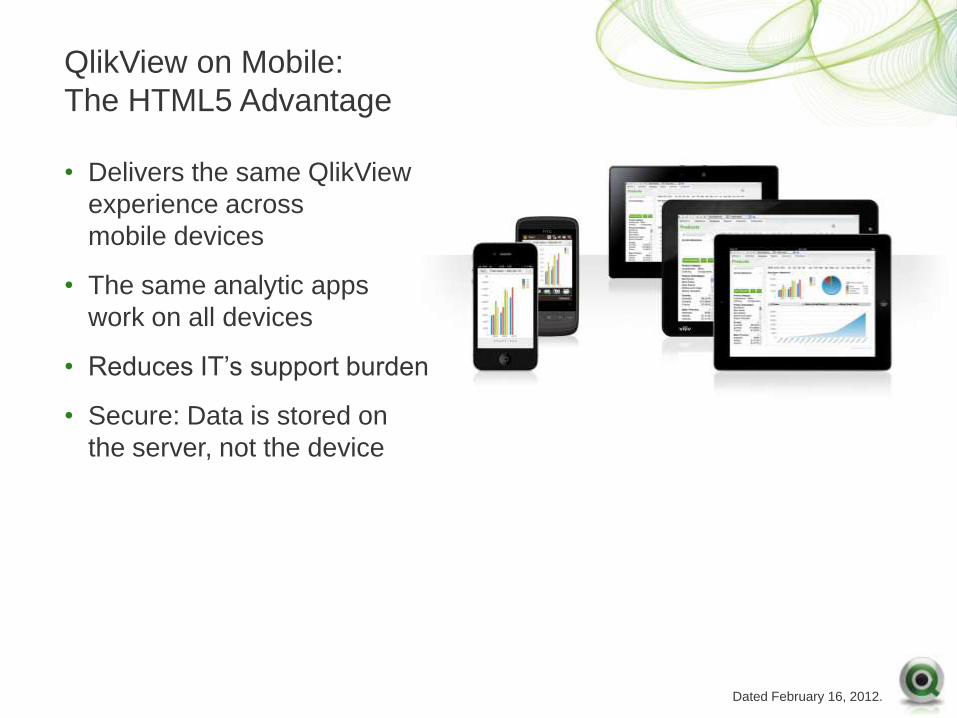
QlikView on Mobile:
The HTML5 Advantage
• Delivers the same QlikView
experience across
mobile devices
• The same analytic apps
work on all devices
• Reduces IT’s support burden
• Secure: Data is stored on
the server, not the device
Dated February 16, 2012.
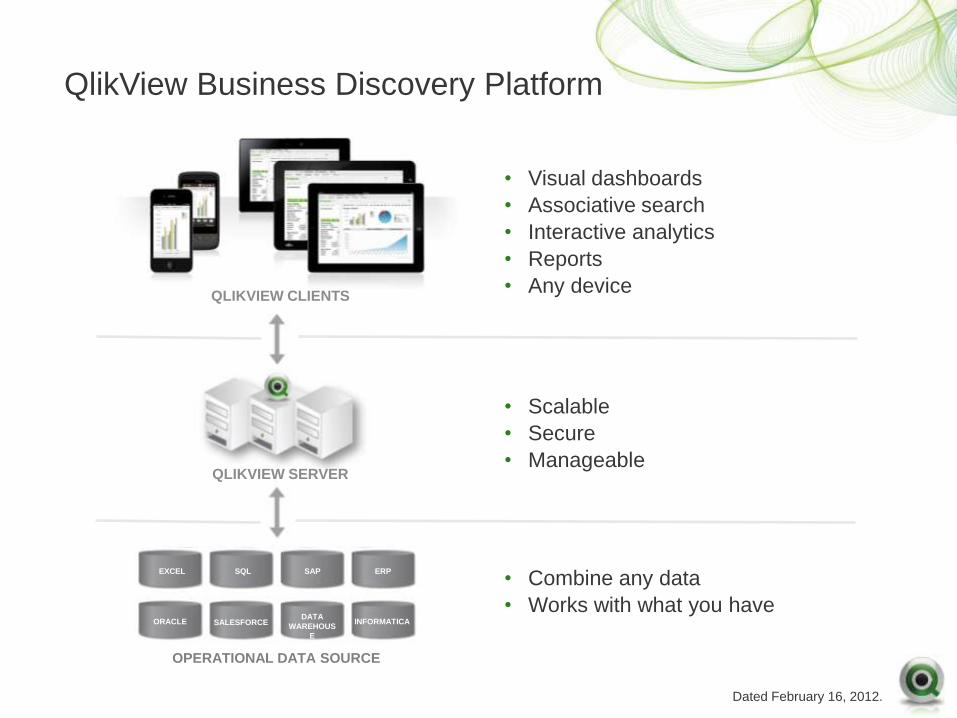
QlikView Business Discovery Platform
QLIKVIEW SERVER
OPERATIONAL DATA SOURCES
QLIKVIEW CLIENTS
• Visual dashboards
• Associative search
• Interactive analytics
• Reports
• Any device
• Scalable
• Secure
• Manageable
• Combine any data
• Works with what you have
EXCEL SQL SAP ERP
ORACLE SALESFORCE DATA
WAREHOUS
E
INFORMATICA
OPERATIONAL DATA SOURCE
Dated February 16, 2012.
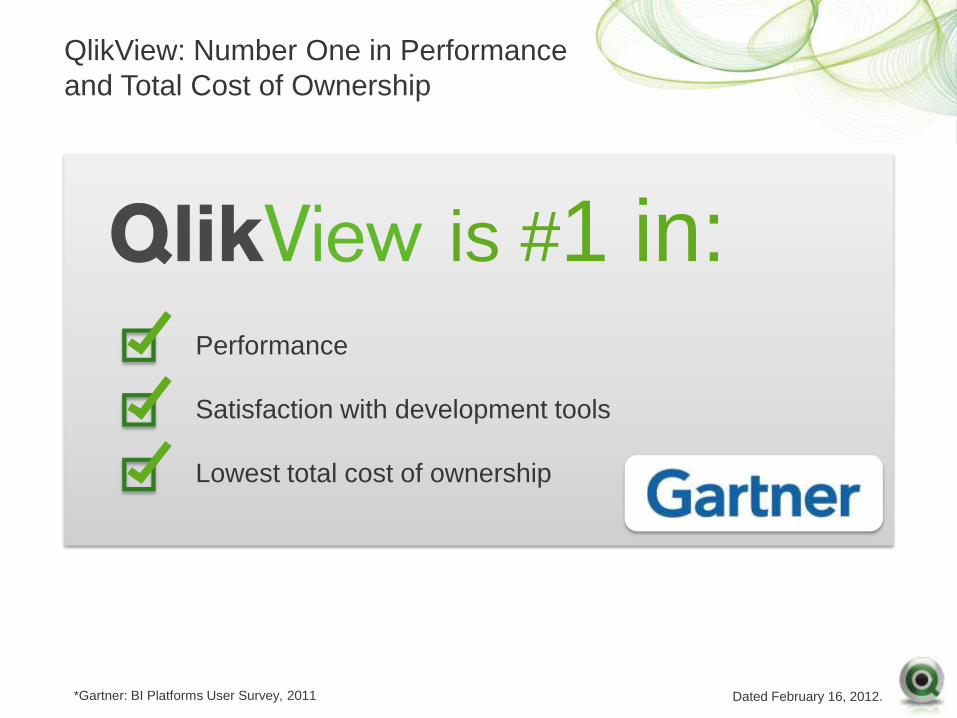
QlikView: Number One in Performance
and Total Cost of Ownership
*Gartner: BI Platforms User Survey, 2011
is #1 in: Performance
Satisfaction with development tools
Lowest total cost of ownership
Dated February 16, 2012.
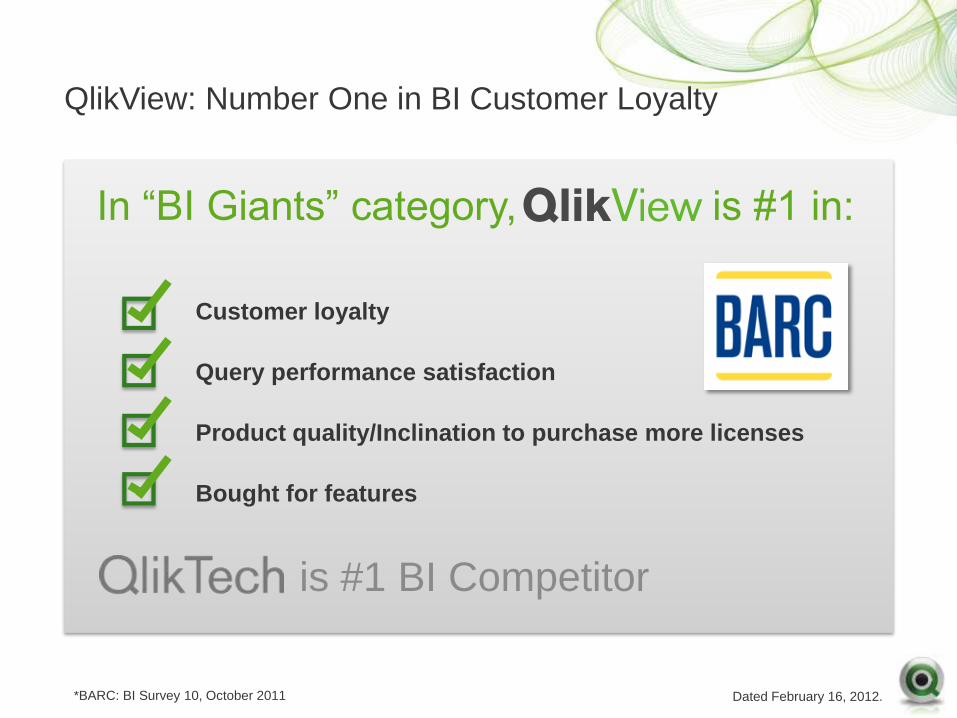
QlikView: Number One in BI Customer Loyalty
*BARC: BI Survey 10, October 2011
Customer loyalty
Query performance satisfaction
Product quality/Inclination to purchase more licenses
Bought for features
In “BI Giants” category, is #1 in:
is #1 BI Competitor
Dated February 16, 2012.
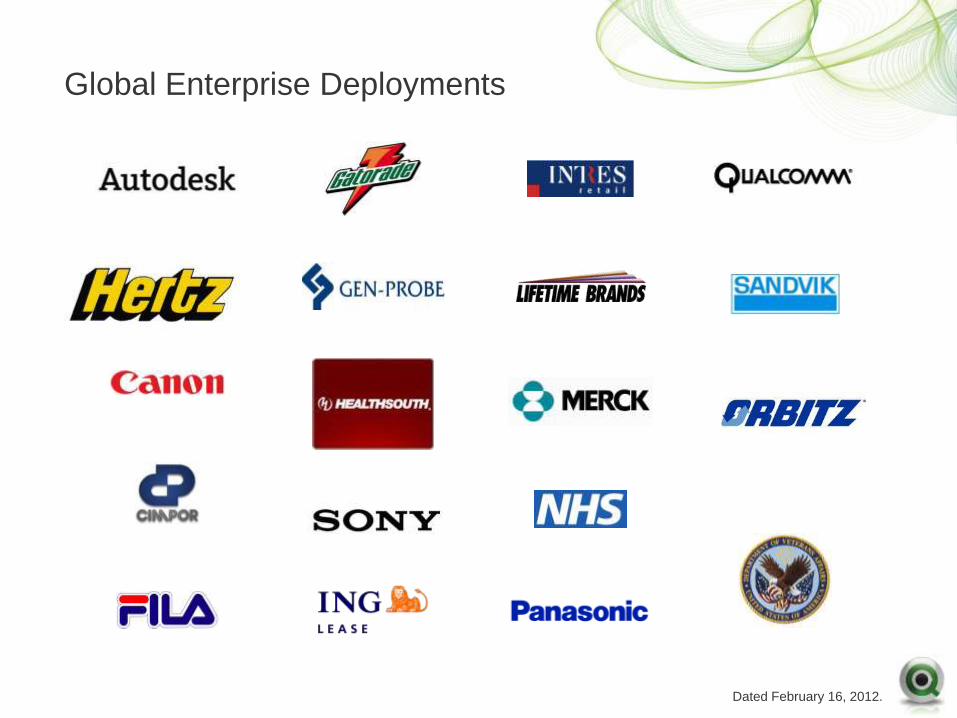
Global Enterprise Deployments
Dated February 16, 2012.
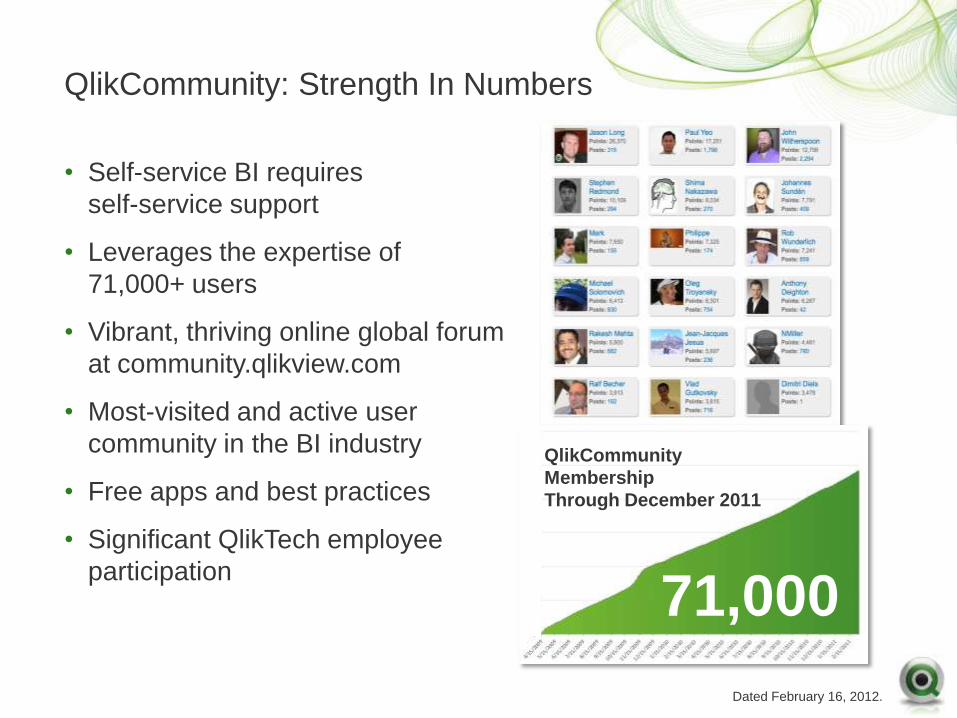
QlikCommunity: Strength In Numbers
• Self-service BI requires
self-service support
• Leverages the expertise of
71,000+ users
• Vibrant, thriving online global forum
at community.qlikview.com
• Most-visited and active user
community in the BI industry
• Free apps and best practices
• Significant QlikTech employee
participation
QlikCommunity
Membership
Through December 2011
71,000
Dated February 16, 2012.
Summary
• Gartner: "QlikView is the poster child for
a new end-user-driven approach to BI.”
• The QlikView Business Discovery platform
delivers true self-service BI that empowers
business users by driving innovative decision
making
• QlikView social Business Discovery puts
the social and collaborative experience
front and center
• QlikView on Mobile delivers anywhere,
anytime access on virtually any deviceMore
• Over 24,000 customers in 100 countries
Dated February 16, 2012.
Appendix #1:
Disruptive Technology, Power and Simplicity Slide
Dated February 16, 2012.
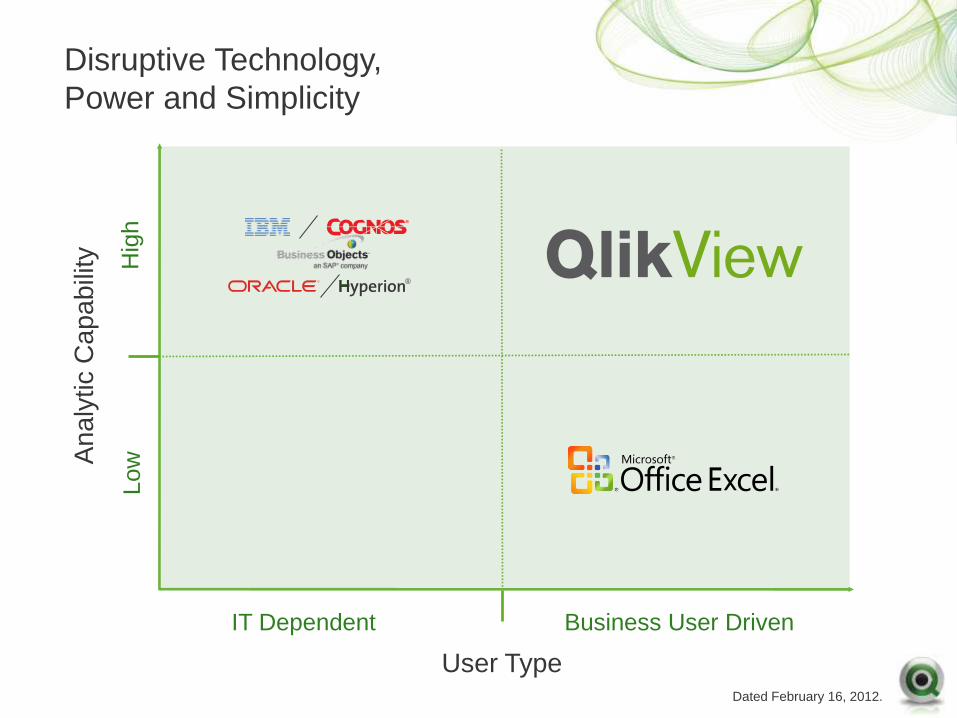
Disruptive Technology,
Power and Simplicity
IT Dependent Business User Driven
An
aly
tic C
ap
ab
ility
Low
H
igh
®
User Type
Dated February 16, 2012.
Appendix #2:
QlikView 11
Dated February 16, 2012.
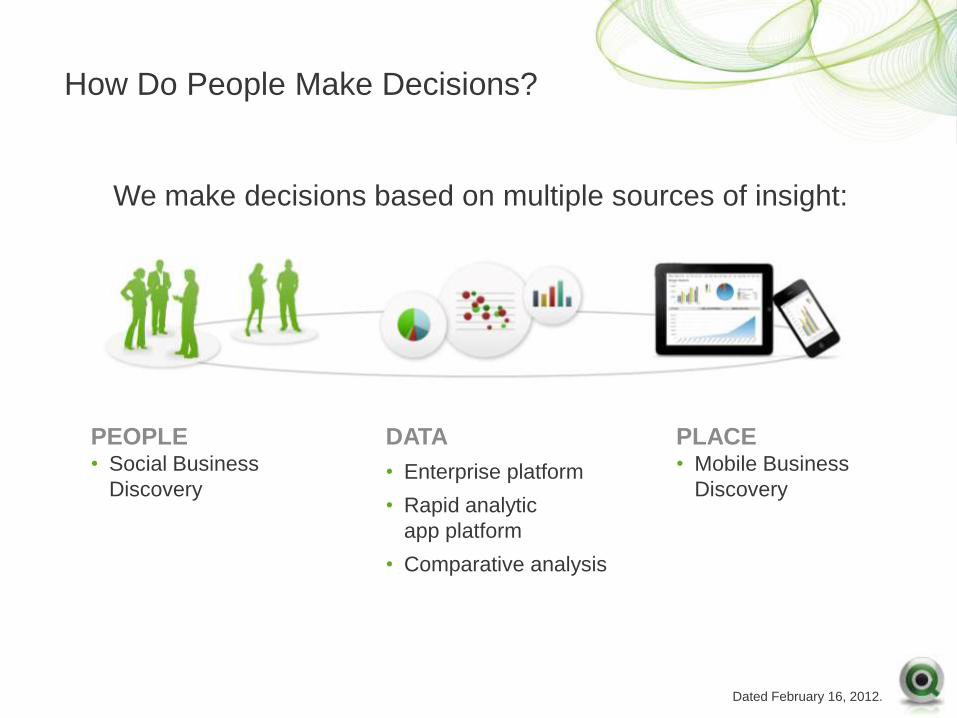
How Do People Make Decisions?
We make decisions based on multiple sources of insight:
DATA
• Enterprise platform
• Rapid analytic
app platform
• Comparative analysis
PLACE • Mobile Business
Discovery
PEOPLE • Social Business
Discovery
Dated February 16, 2012.
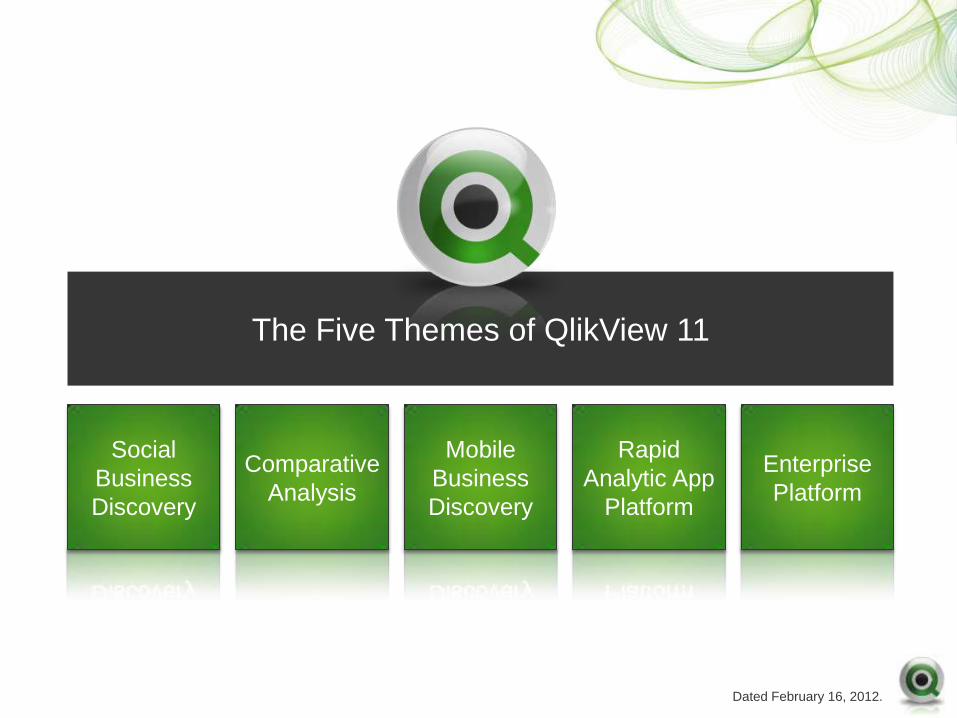
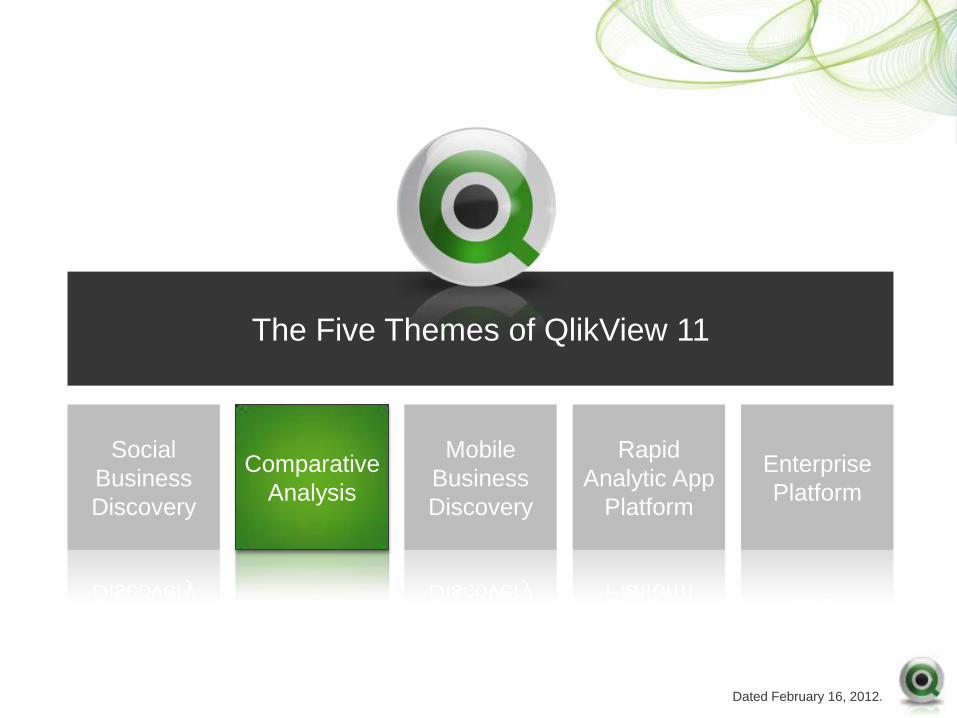
Comparative
Analysis
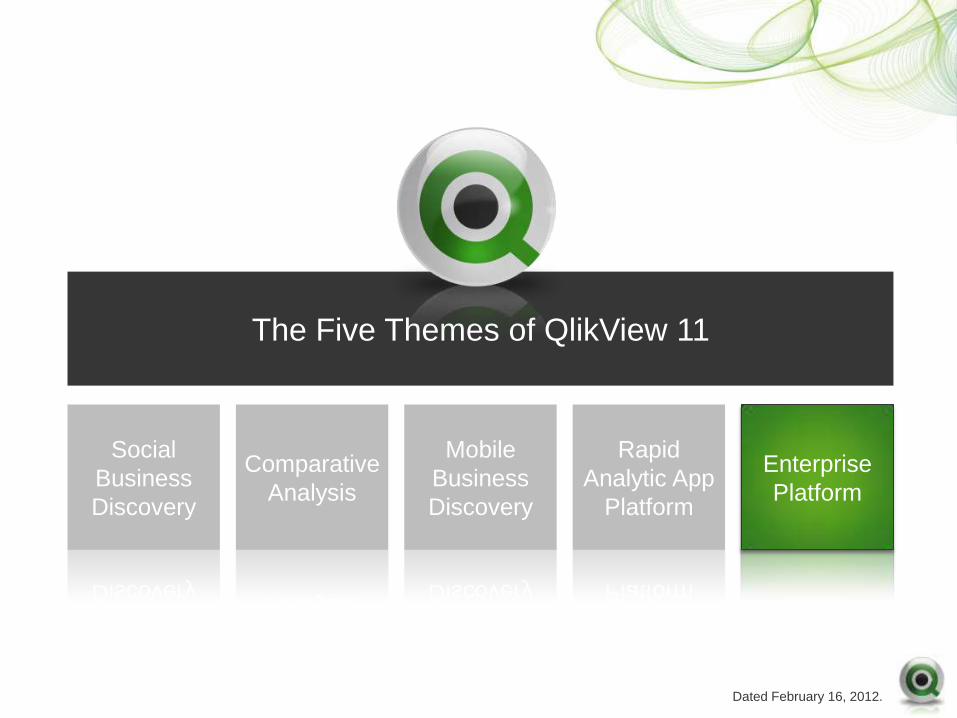
The Five Themes of QlikView 11
Social
Business
Discovery
Rapid
Analytic App
Platform
Mobile
Business
Discovery
Enterprise
Platform
Dated February 16, 2012.
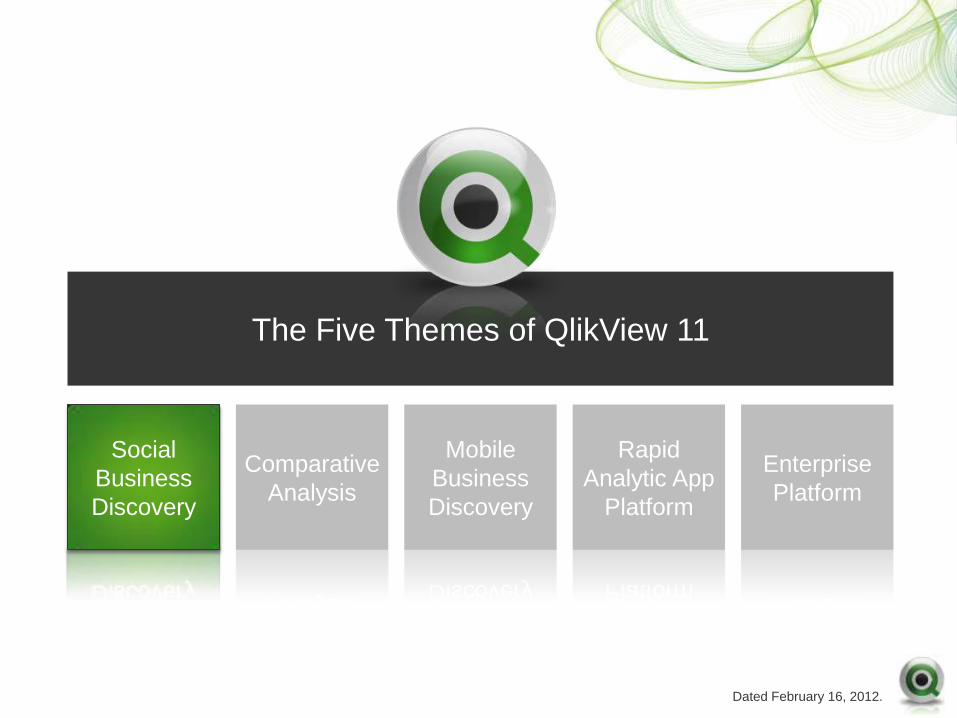
Comparative
Analysis
The Five Themes of QlikView 11
Social
Business
Discovery
Rapid
Analytic App
Platform
Mobile
Business
Discovery
Enterprise
Platform
Dated February 16, 2012.
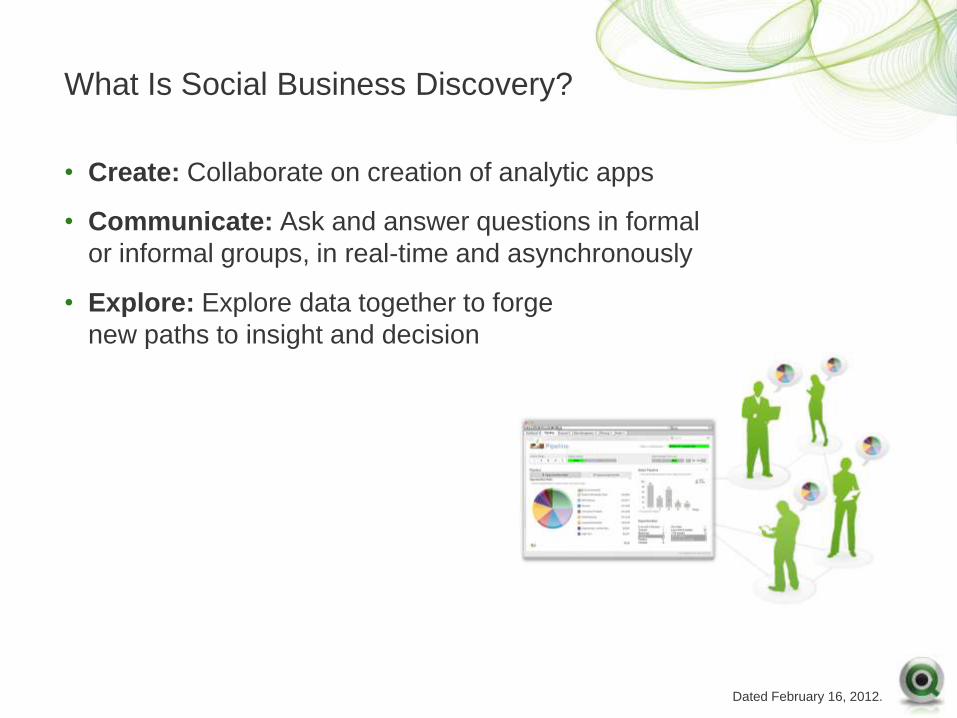
What Is Social Business Discovery?
• Create: Collaborate on creation of analytic apps
• Communicate: Ask and answer questions in formal
or informal groups, in real-time and asynchronously
• Explore: Explore data together to forge
new paths to insight and decision
Dated February 16, 2012.
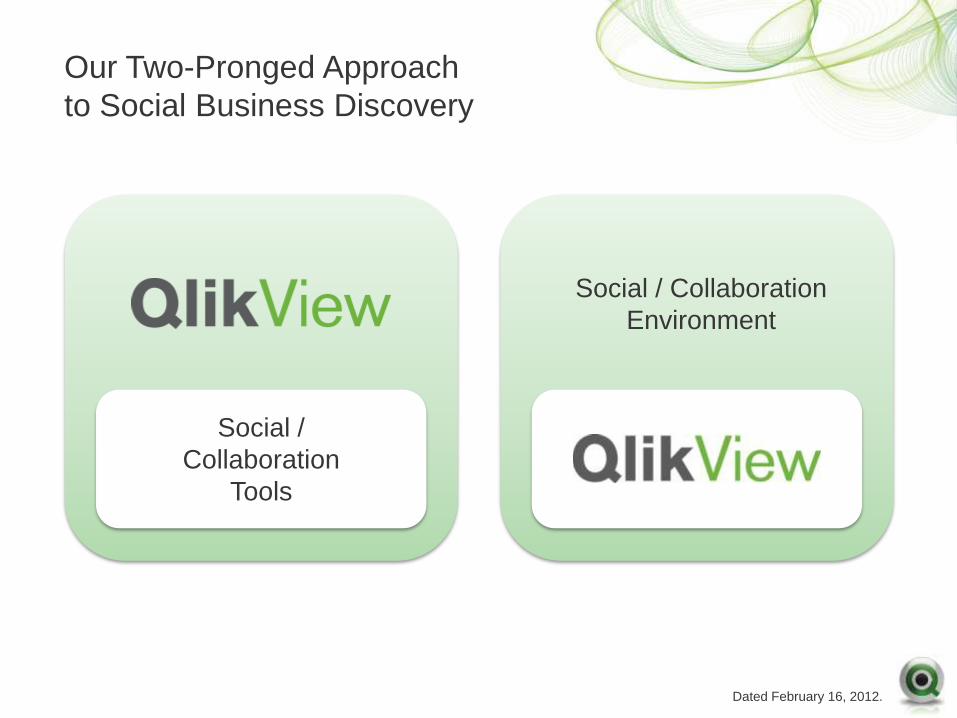
Our Two-Pronged Approach
to Social Business Discovery
Social /
Collaboration
Tools
Social / Collaboration
Environment
Dated February 16, 2012.
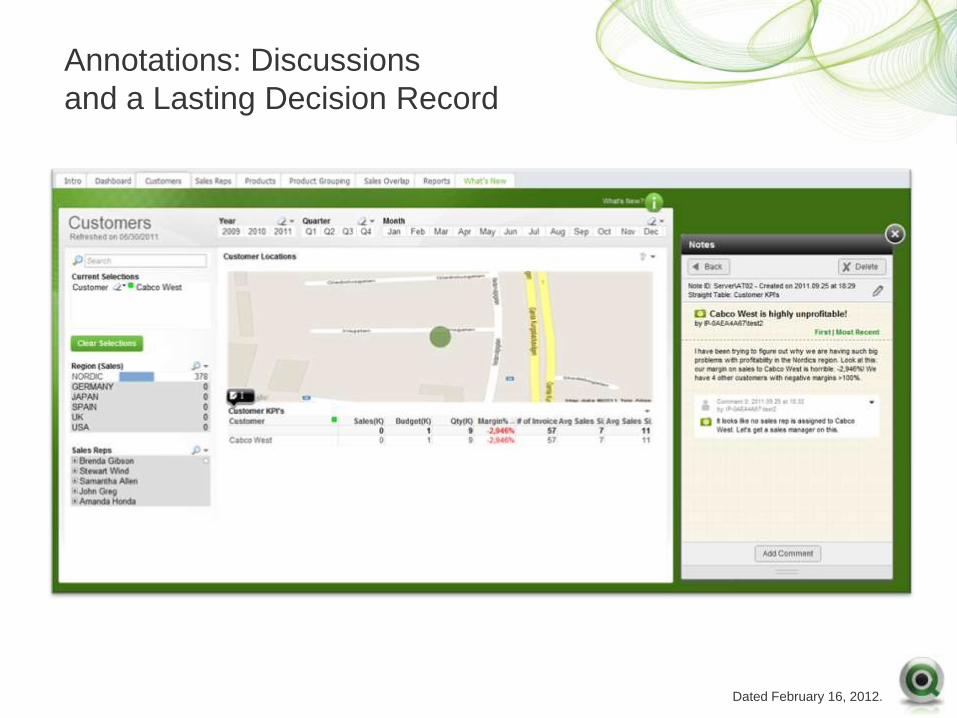
Annotations: Discussions
and a Lasting Decision Record
Dated February 16, 2012.
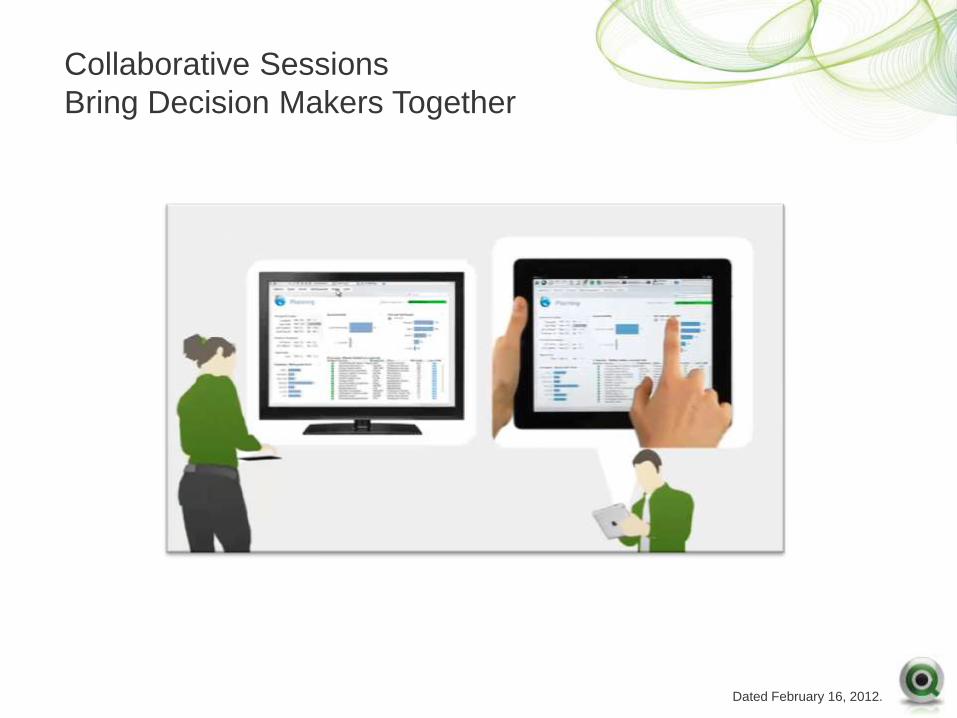
Collaborative Sessions
Bring Decision Makers Together
Dated February 16, 2012.
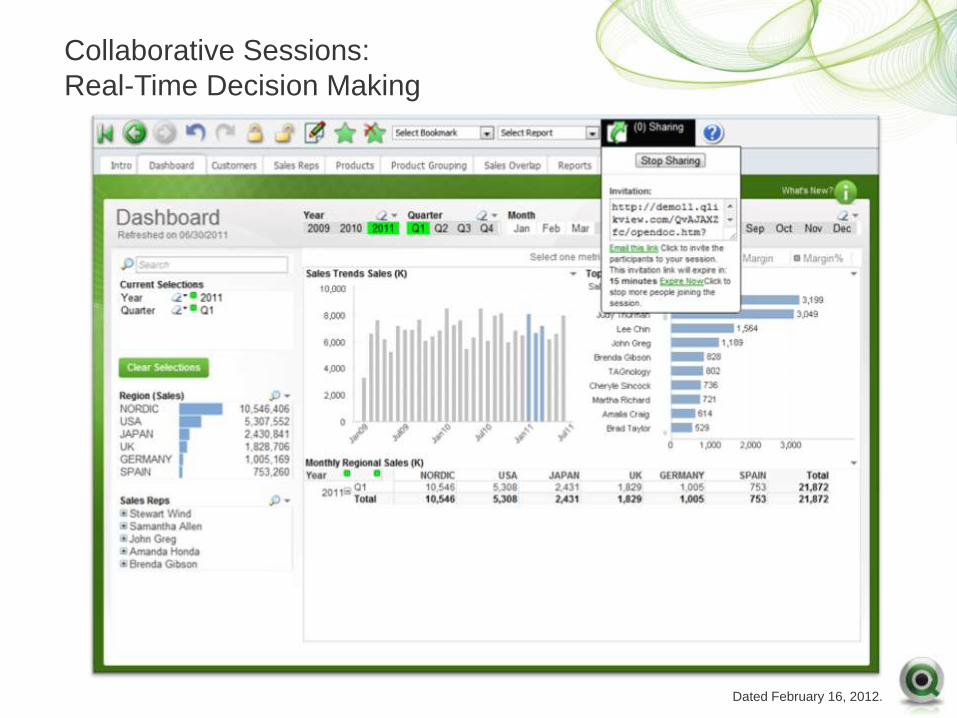
Collaborative Sessions:
Real-Time Decision Making
Dated February 16, 2012.
Comparative
Analysis
The Five Themes of QlikView 11
Social
Business
Discovery
Rapid
Analytic App
Platform
Mobile
Business
Discovery
Enterprise
Platform
Dated February 16, 2012.
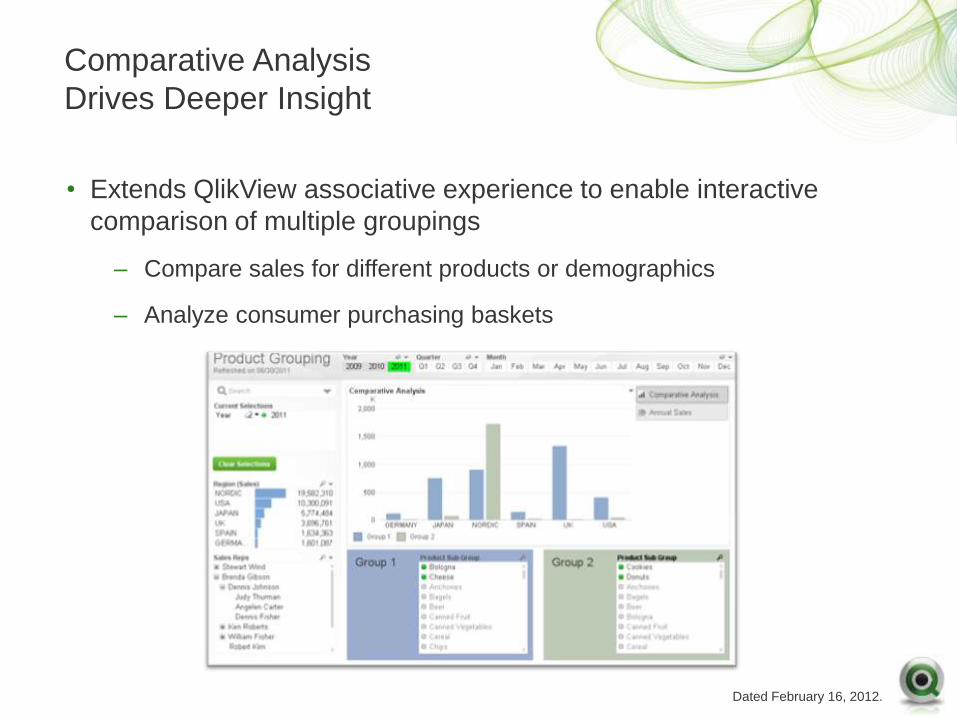
• Extends QlikView associative experience to enable interactive
comparison of multiple groupings
– Compare sales for different products or demographics
– Analyze consumer purchasing baskets
Comparative Analysis
Drives Deeper Insight
Dated February 16, 2012.
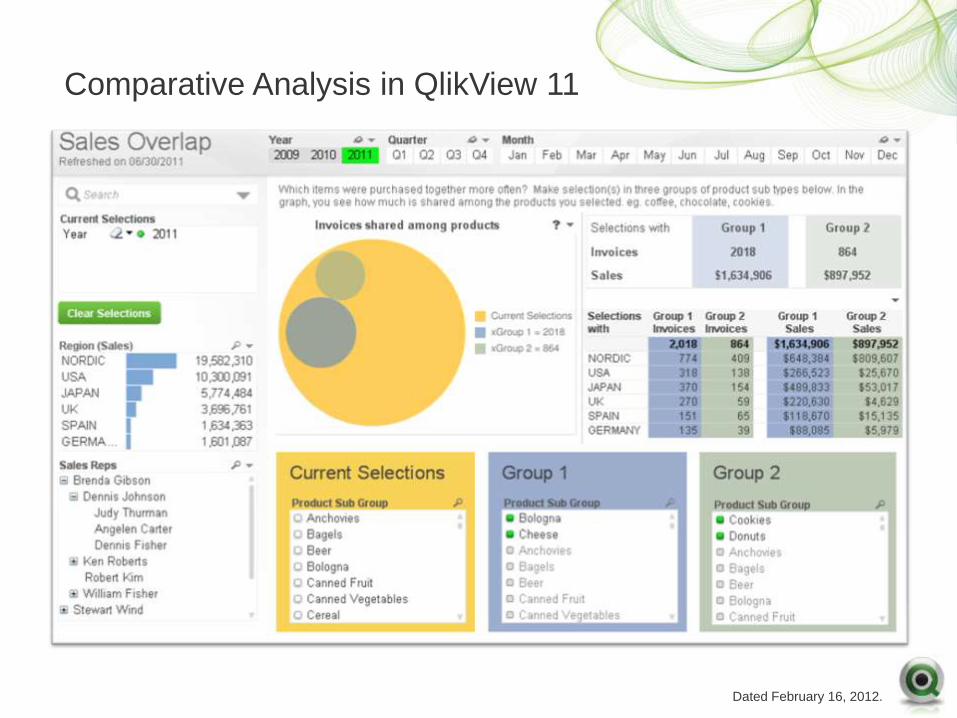
Comparative Analysis in QlikView 11
Dated February 16, 2012.
Comparative
Analysis
The Five Themes of QlikView 11
Social
Business
Discovery
Rapid
Analytic App
Platform
Mobile
Business
Discovery
Enterprise
Platform
Dated February 16, 2012.
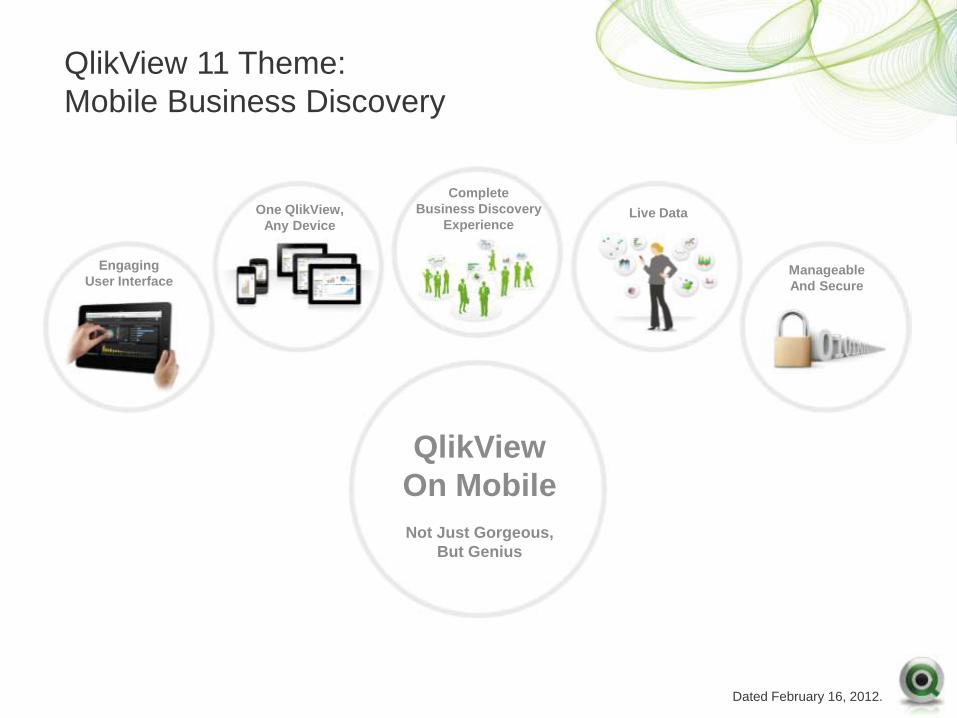
QlikView 11 Theme:
Mobile Business Discovery
Engaging
User Interface
One QlikView,
Any Device
Complete
Business Discovery
Experience Live Data
Manageable
And Secure
QlikView
On Mobile
Not Just Gorgeous,
But Genius
Dated February 16, 2012.
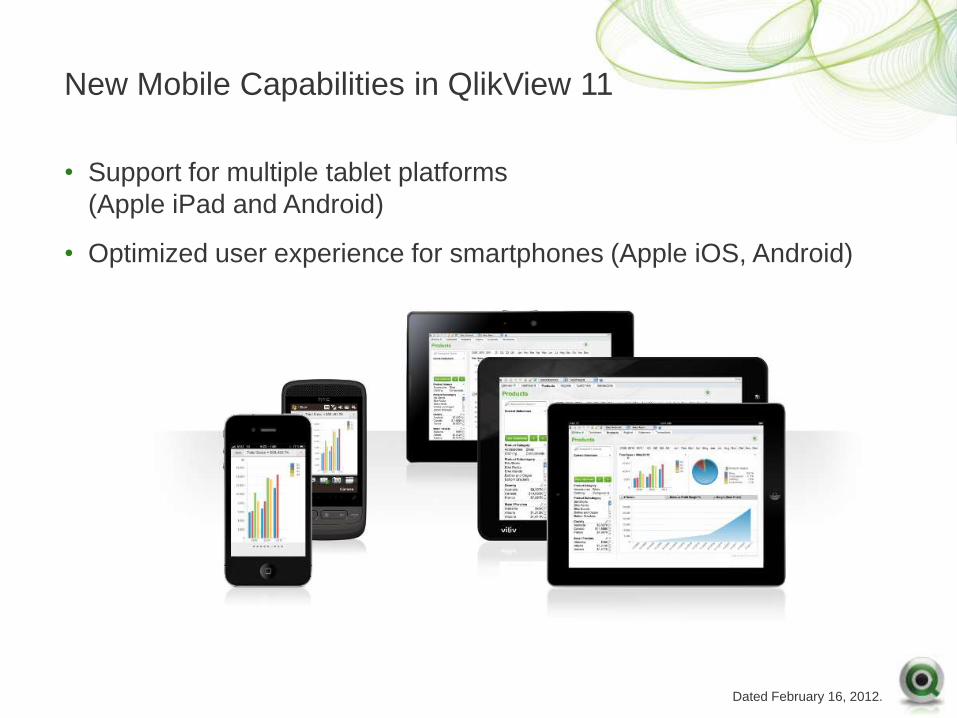
New Mobile Capabilities in QlikView 11
• Support for multiple tablet platforms
(Apple iPad and Android)
• Optimized user experience for smartphones (Apple iOS, Android)
Dated February 16, 2012.
Comparative
Analysis
The Five Themes of QlikView 11
Social
Business
Discovery
Rapid
Analytic App
Platform
Mobile
Business
Discovery
Enterprise
Platform
Dated February 16, 2012.
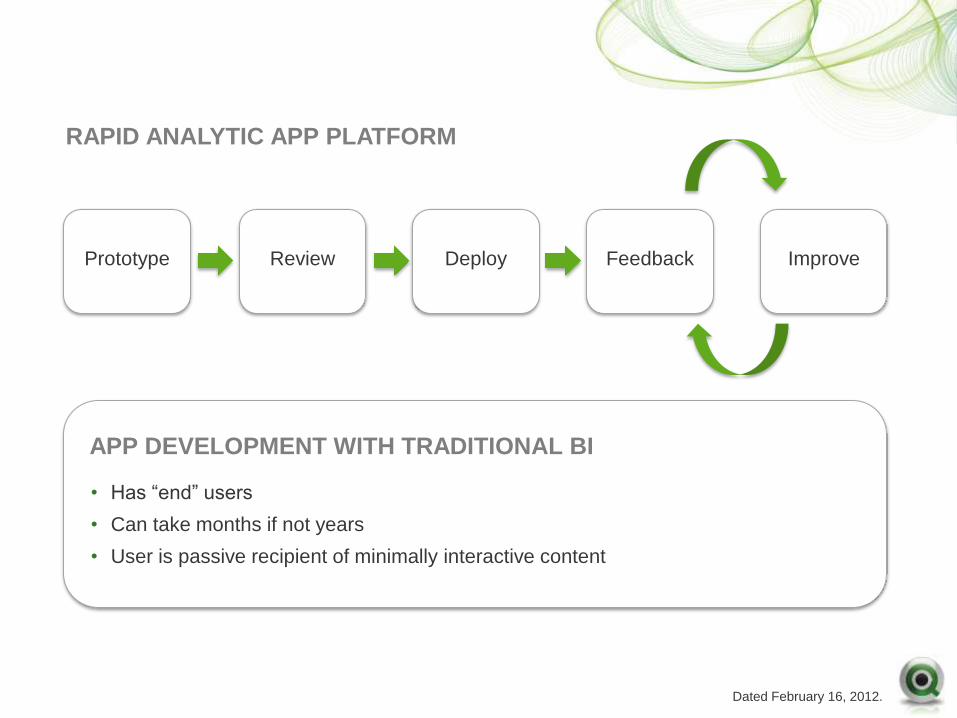
Prototype Review Deploy Feedback Improve
RAPID ANALYTIC APP PLATFORM
APP DEVELOPMENT WITH TRADITIONAL BI
• Has “end” users
• Can take months if not years
• User is passive recipient of minimally interactive content
Dated February 16, 2012.
QlikView 11 Theme:
Rapid Analytic App Platform
• Improved application development
• Extensibility
Dated February 16, 2012.
Improved Application
Development in QlikView 11
• Version control integration streamlines development
• Metadata enhancements for developers help improve
the business user experience
• Improved Ajax dialog boxes make it easier for business users
to create and modify objects
• Granular chart dimension control simplifies presentation
of data in charts
• Improved layout options make it easier to create QlikView apps
Dated February 16, 2012.
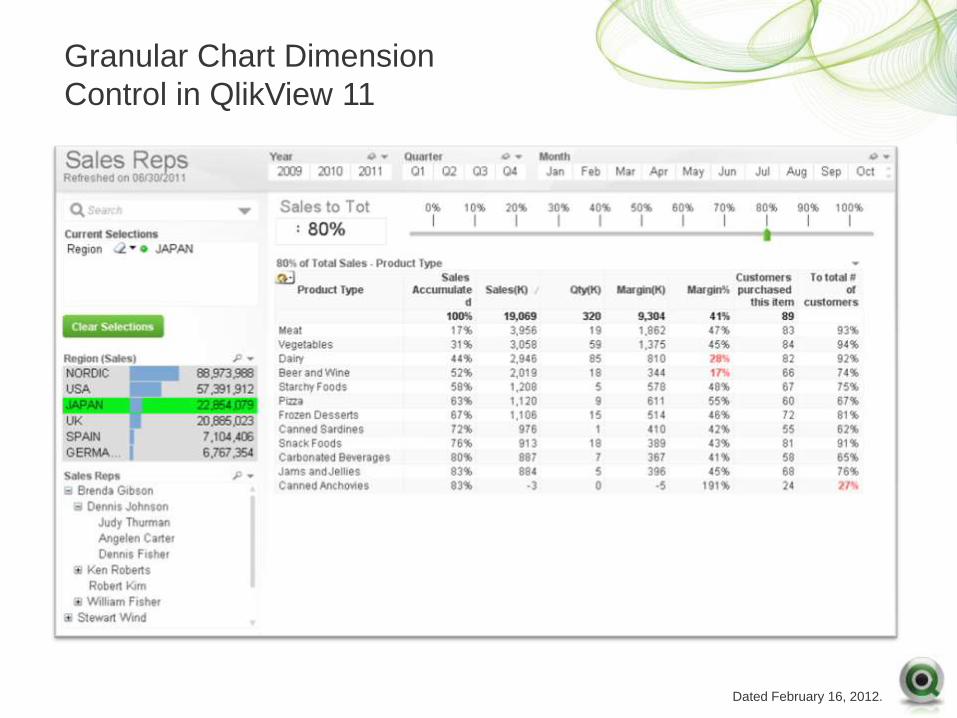
Granular Chart Dimension
Control in QlikView 11
Dated February 16, 2012.
Improved Layout Options
in QlikView 11
• Conditional enabling of dimensions and expressions
makes apps more intuitive and easy to use
• Container object enhancements make better use
of screen real estate
• Improved tab navigation makes it easier to find content
Dated February 16, 2012.
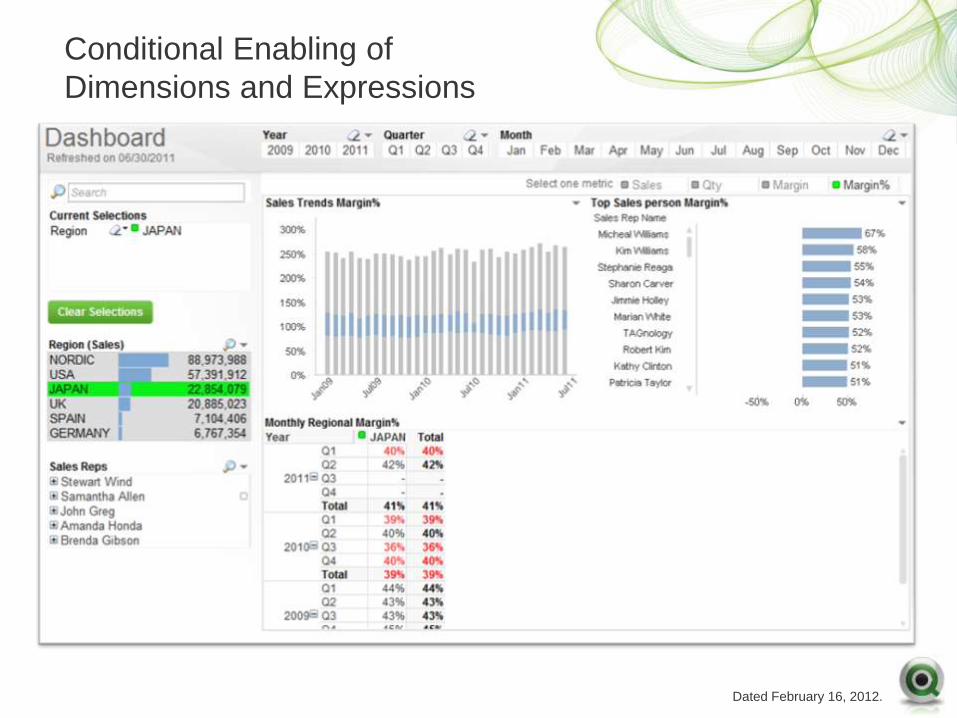
Conditional Enabling of
Dimensions and Expressions
Dated February 16, 2012.
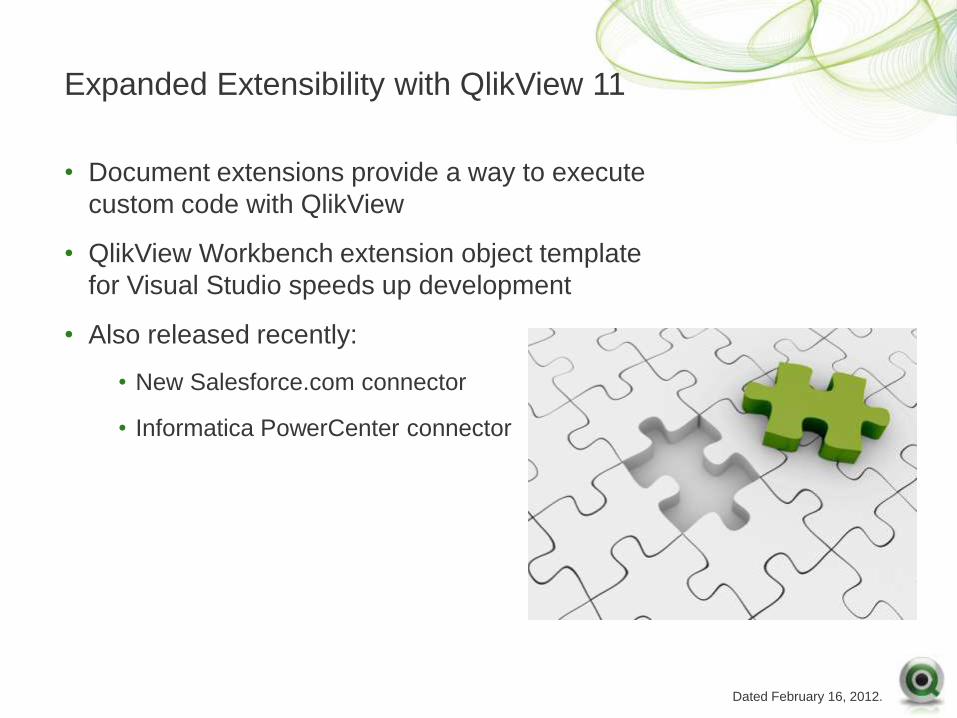
Expanded Extensibility with QlikView 11
• Document extensions provide a way to execute
custom code with QlikView
• QlikView Workbench extension object template
for Visual Studio speeds up development
• Also released recently:
• New Salesforce.com connector
• Informatica PowerCenter connector
Dated February 16, 2012.
Comparative
Analysis
The Five Themes of QlikView 11
Social
Business
Discovery
Rapid
Analytic App
Platform
Mobile
Business
Discovery
Enterprise
Platform
Dated February 16, 2012.
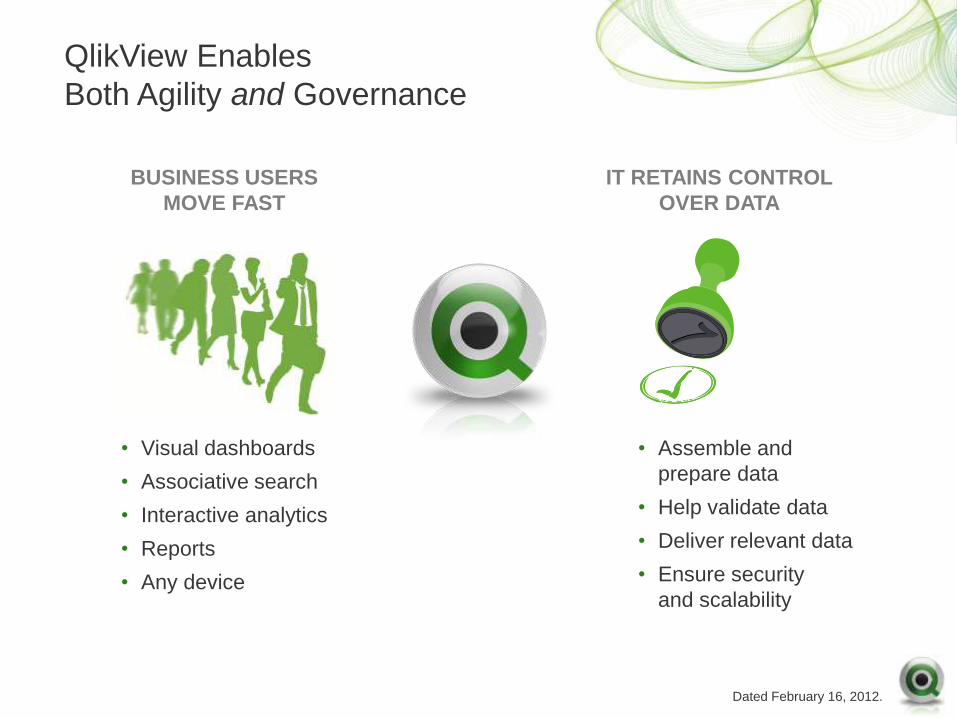
QlikView Enables
Both Agility and Governance
• Visual dashboards
• Associative search
• Interactive analytics
• Reports
• Any device
• Assemble and
prepare data
• Help validate data
• Deliver relevant data
• Ensure security
and scalability
BUSINESS USERS
MOVE FAST
IT RETAINS CONTROL
OVER DATA
Dated February 16, 2012.
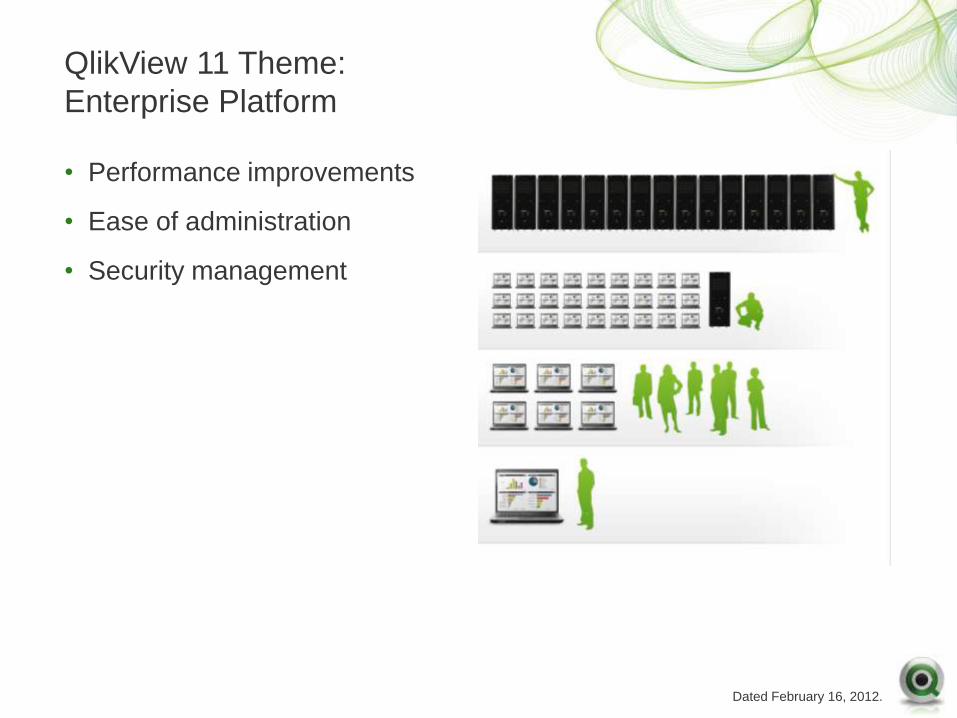
QlikView 11 Theme:
Enterprise Platform
• Performance improvements
• Ease of administration
• Security management
Dated February 16, 2012.
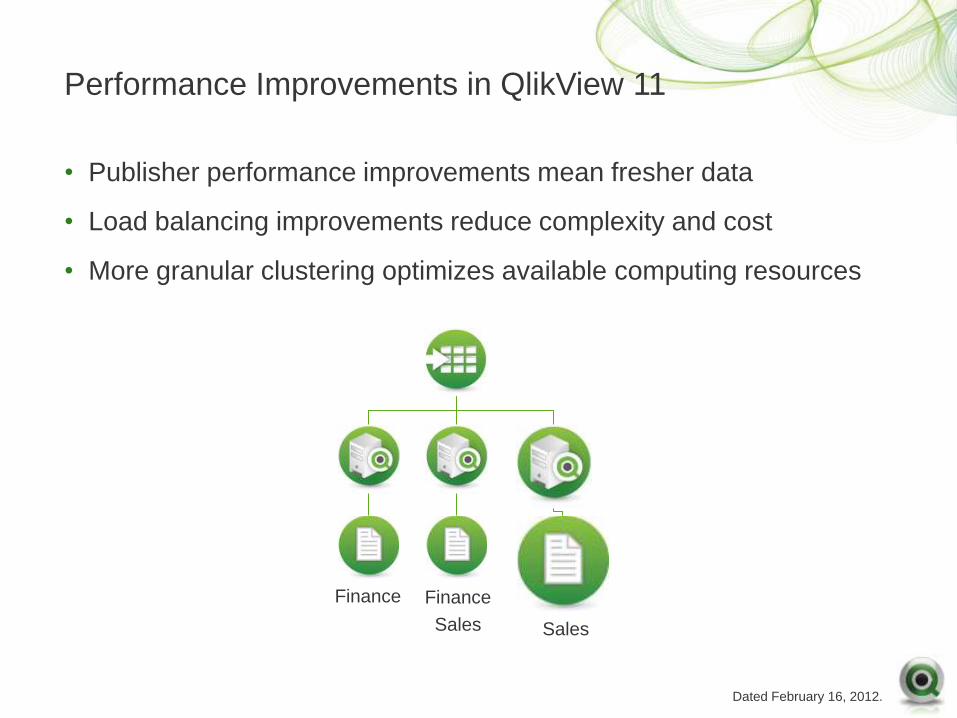
Performance Improvements in QlikView 11
• Publisher performance improvements mean fresher data
• Load balancing improvements reduce complexity and cost
• More granular clustering optimizes available computing resources
Finance Finance
Sales Sales
Dated February 16, 2012.
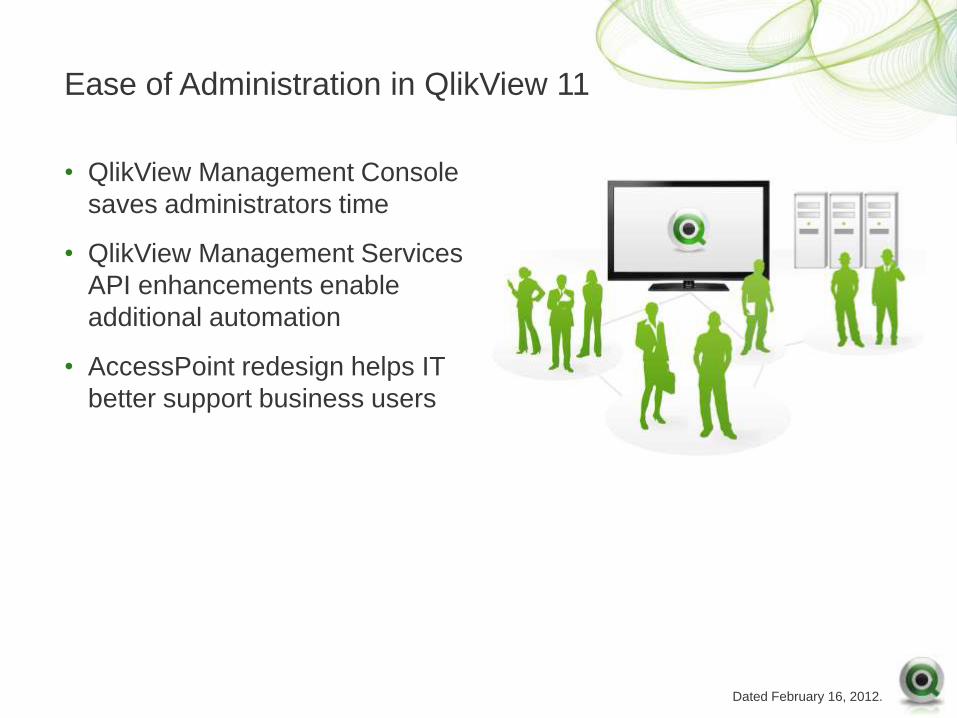
Ease of Administration in QlikView 11
• QlikView Management Console
saves administrators time
• QlikView Management Services
API enhancements enable
additional automation
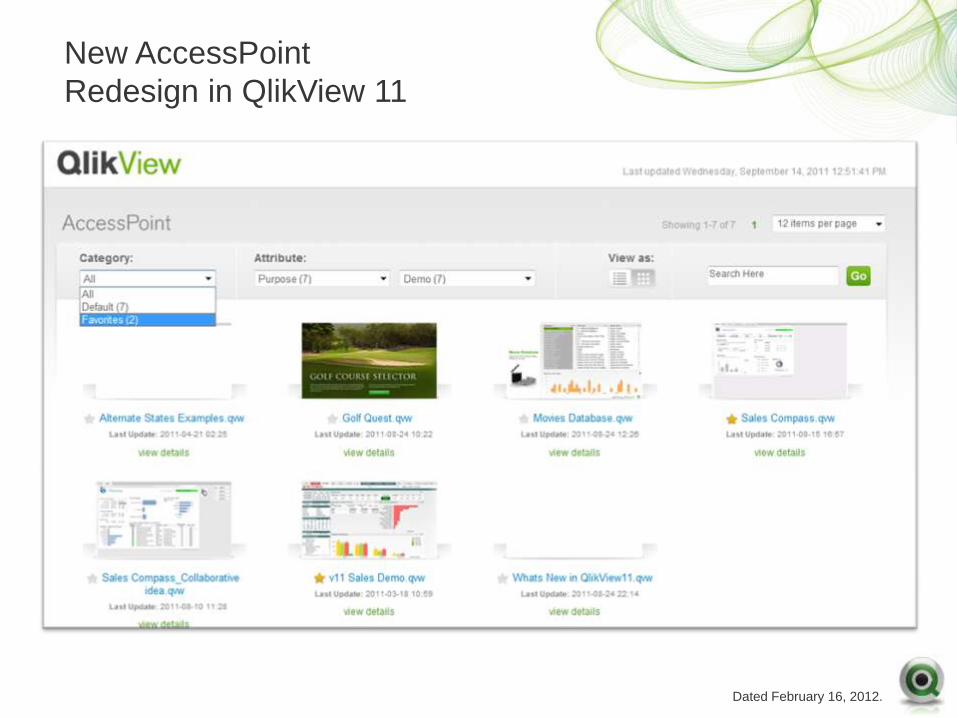
• AccessPoint redesign helps IT
better support business users
Dated February 16, 2012.
New AccessPoint
Redesign in QlikView 11
Dated February 16, 2012.
Security Management in QlikView 11
• Document-level auditing improves audit accuracy and lowers risk
• Granular download and export control improves manageability
• Publisher QVD task generation makes it easier to manage and
secure data centrally
Dated February 16, 2012.
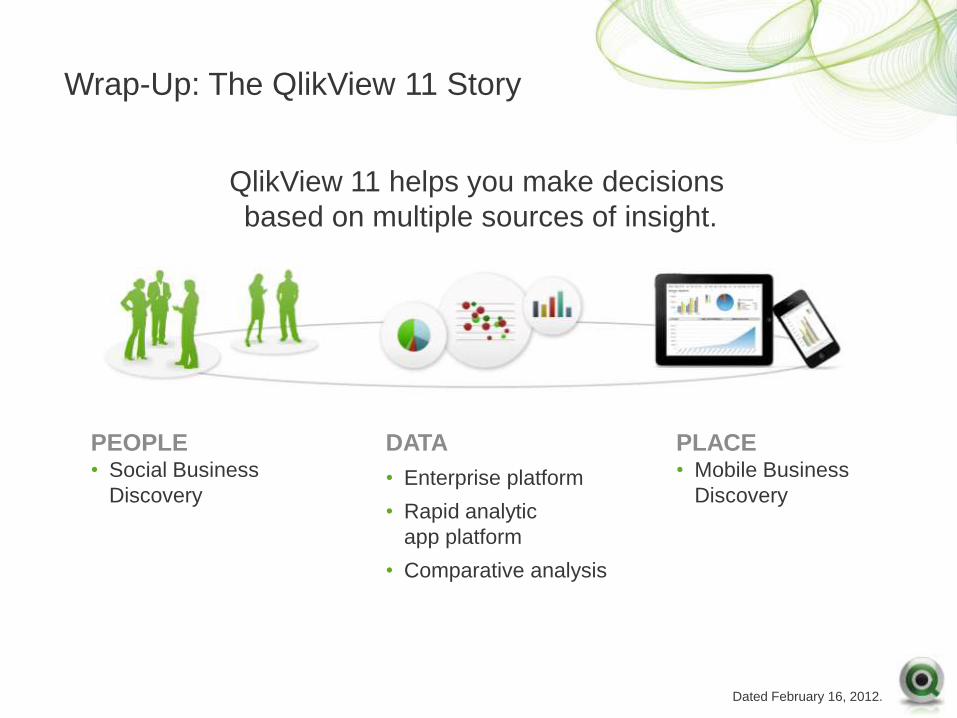
Wrap-Up: The QlikView 11 Story
QlikView 11 helps you make decisions
based on multiple sources of insight.
DATA
• Enterprise platform
• Rapid analytic
app platform
• Comparative analysis
PLACE • Mobile Business
Discovery
PEOPLE • Social Business
Discovery

Dated February 16, 2012.
Appendix #3:
What Makes QlikView Unique
Dated February 16, 2012.
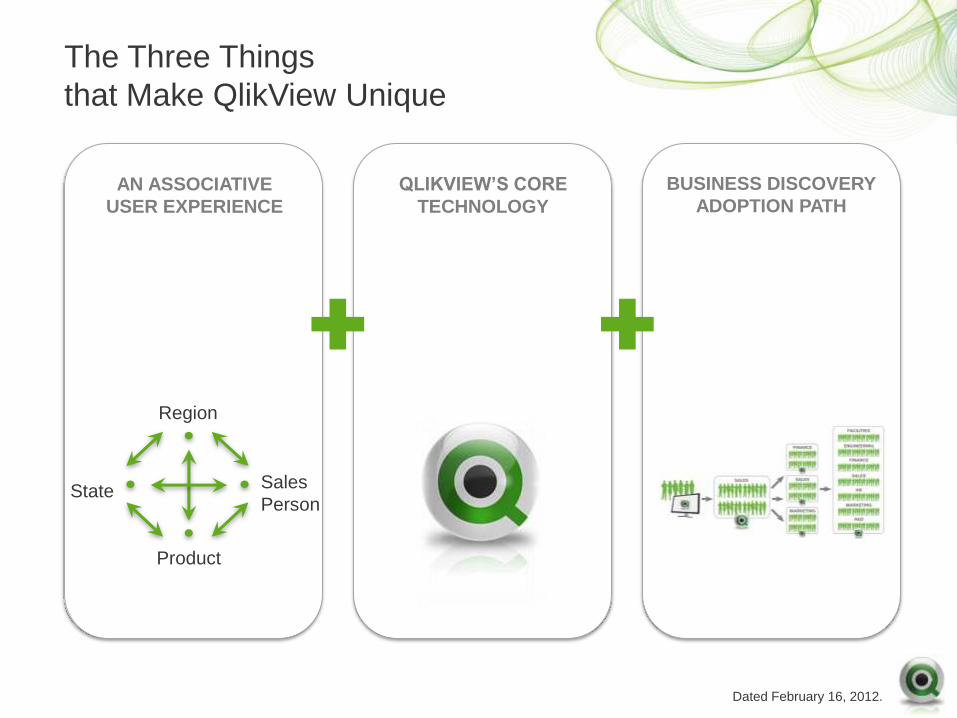
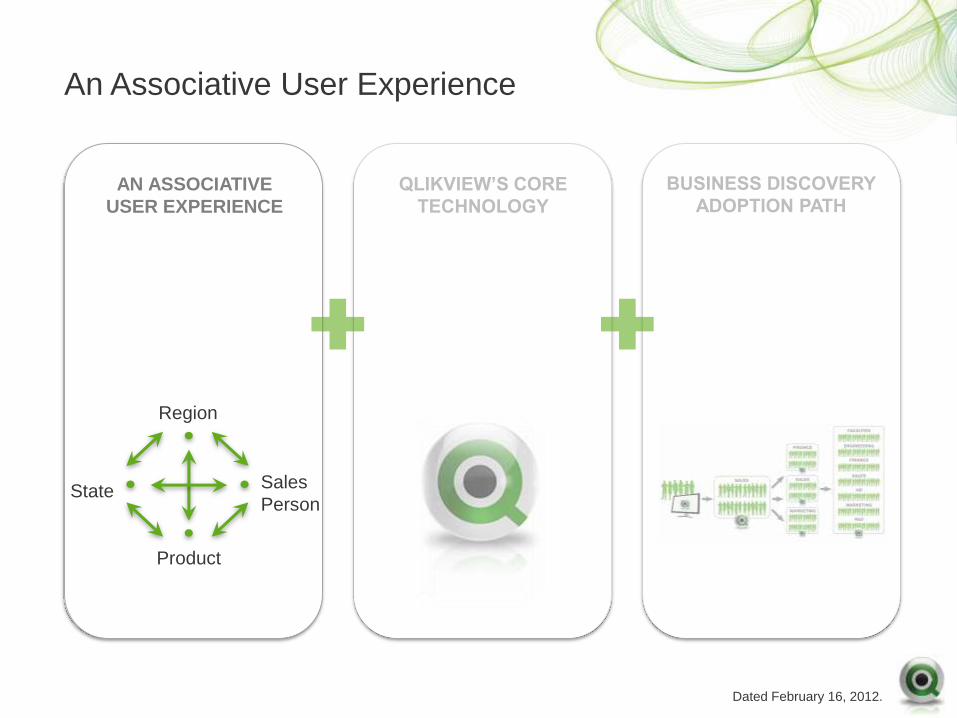
The Three Things
that Make QlikView Unique
Region
Product
State Sales
Person
AN ASSOCIATIVE
USER EXPERIENCE
QLIKVIEW’S CORE
TECHNOLOGY
BUSINESS DISCOVERY
ADOPTION PATH
Dated February 16, 2012.
An Associative User Experience
Region
Product
State Sales
Person
AN ASSOCIATIVE
USER EXPERIENCE
Dated February 16, 2012.
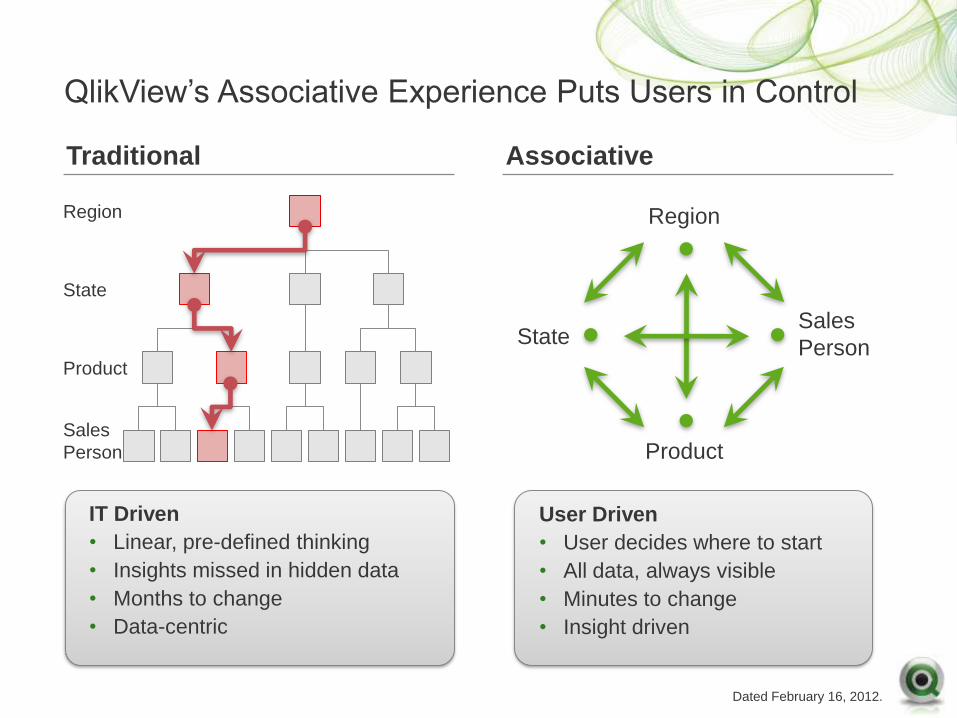
QlikView’s Associative Experience Puts Users in Control
Region
State
Product
Sales
Person
IT Driven
• Linear, pre-defined thinking
• Insights missed in hidden data
• Months to change
• Data-centric
User Driven
• User decides where to start
• All data, always visible
• Minutes to change
• Insight driven
Traditional Associative
Region
Product
State Sales
Person
Dated February 16, 2012.
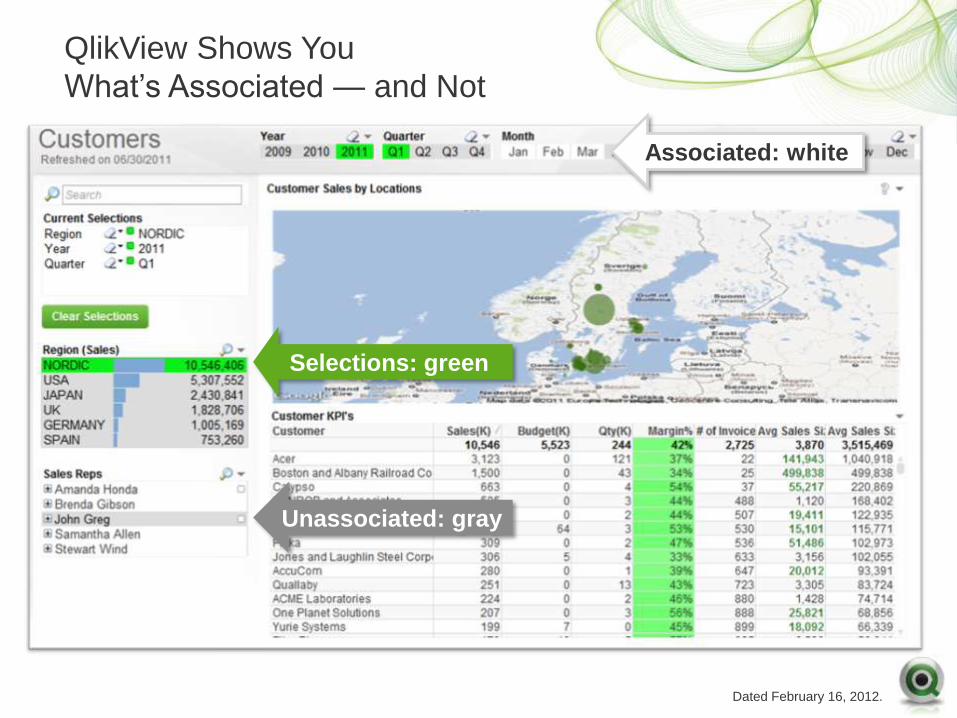
QlikView Shows You
What’s Associated — and Not
Selections: green
Unassociated: gray
Associated: white
Dated February 16, 2012.
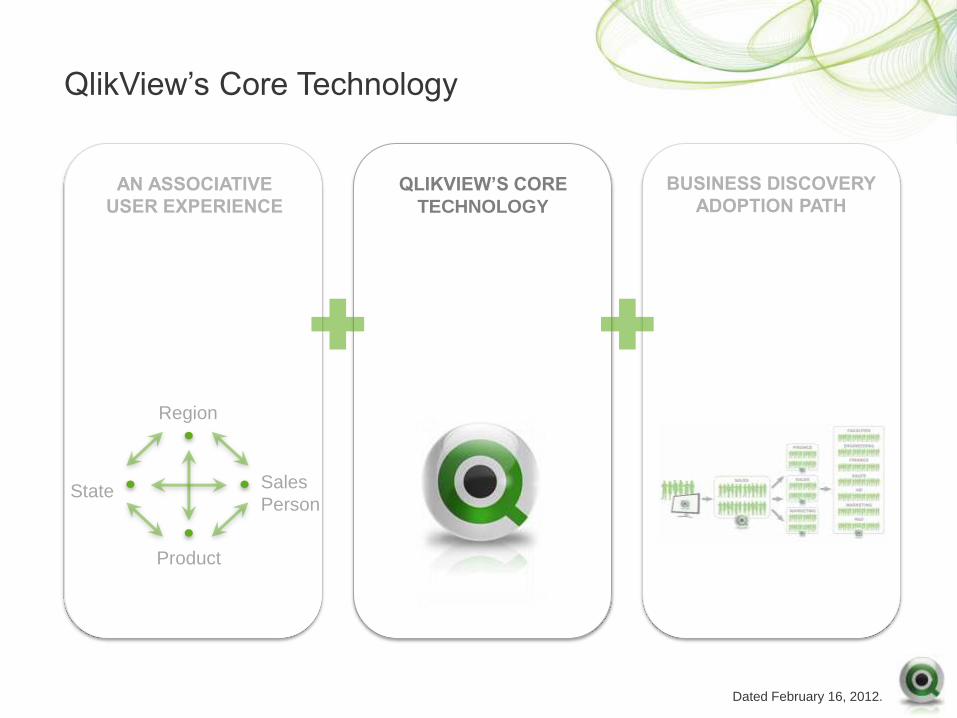
QlikView’s Core Technology
Region
Product
State Sales
Person
QLIKVIEW’S CORE
TECHNOLOGY
Dated February 16, 2012.
QlikView’s Core Technology: The Basics
• Compresses data to 10% of its original size
• Holds data in memory for a super-fast user experience
• Optimizes the power of the processor
Dated February 16, 2012.
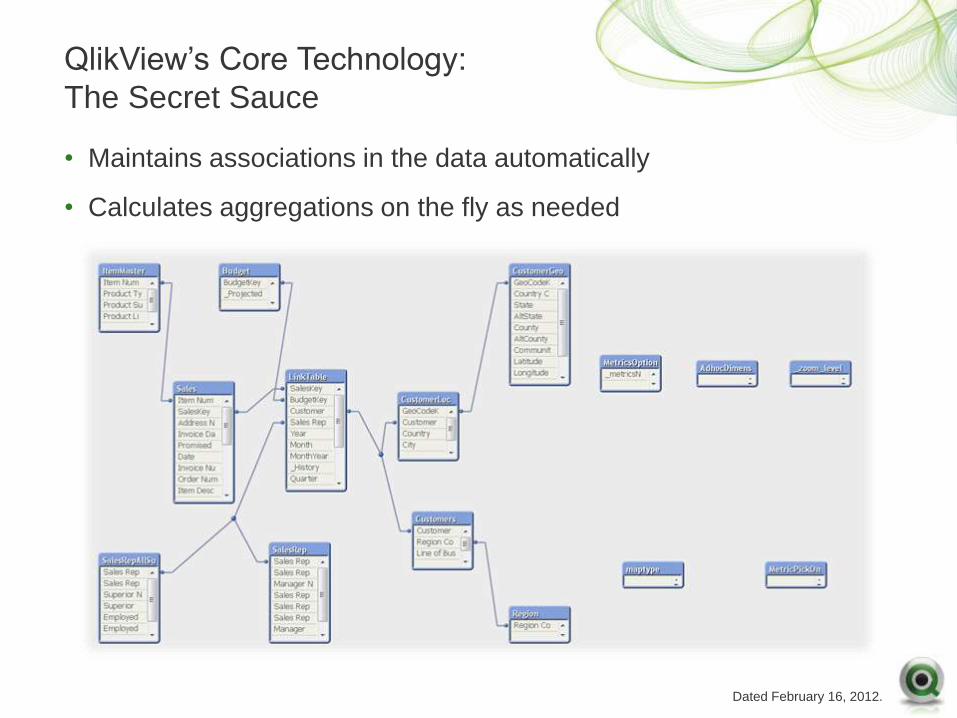
QlikView’s Core Technology:
The Secret Sauce
• Maintains associations in the data automatically
• Calculates aggregations on the fly as needed
Dated February 16, 2012.
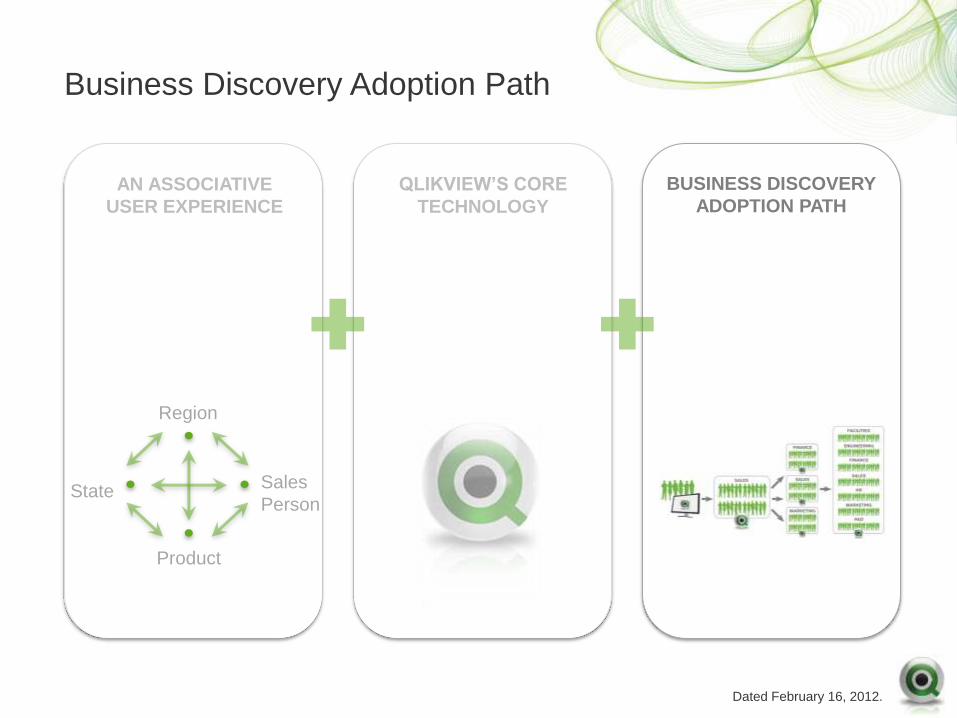
Business Discovery Adoption Path
Region
Product
State Sales
Person
AN ASSOCIATIVE
USER EXPERIENCE
QLIKVIEW’S CORE
TECHNOLOGY
BUSINESS DISCOVERY
ADOPTION PATH
Dated February 16, 2012.
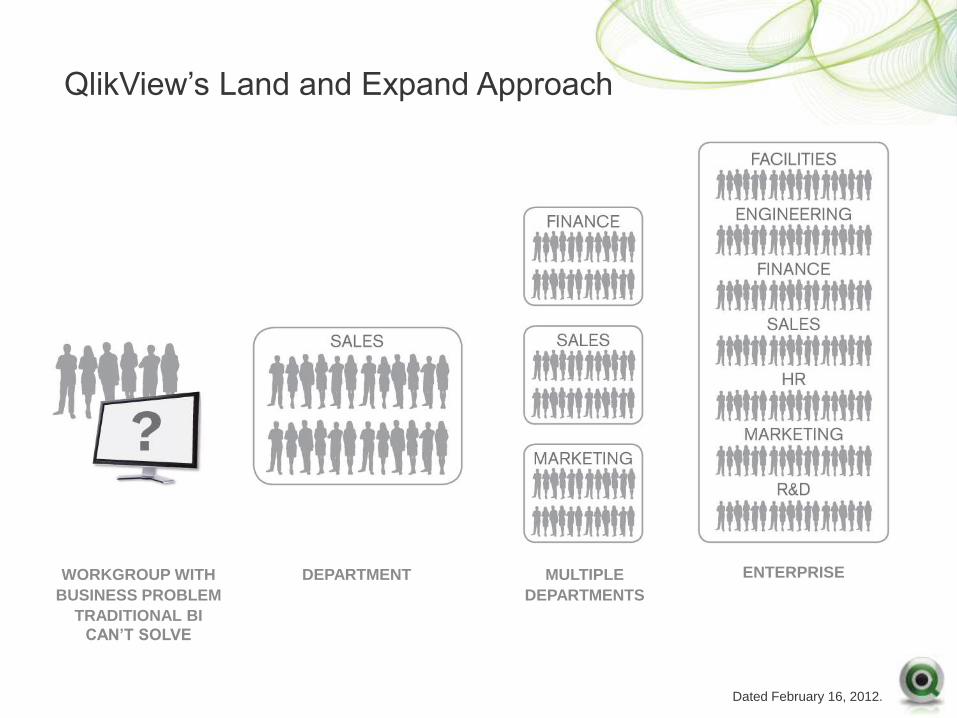
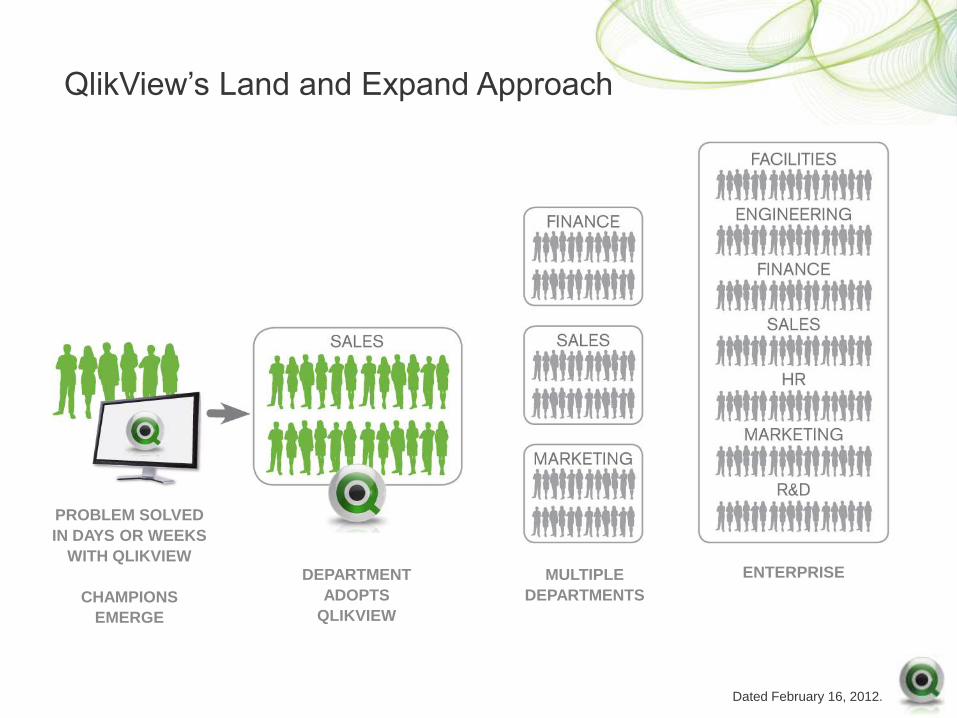
QlikView’s Land and Expand Approach
WORKGROUP WITH
BUSINESS PROBLEM
TRADITIONAL BI
CAN’T SOLVE
MULTIPLE
DEPARTMENTS
ENTERPRISE DEPARTMENT
Dated February 16, 2012.
QlikView’s Land and Expand Approach
PROBLEM SOLVED
IN DAYS OR WEEKS
WITH QLIKVIEW
CHAMPIONS
EMERGE
MULTIPLE
DEPARTMENTS
ENTERPRISE DEPARTMENT
ADOPTS
QLIKVIEW
Dated February 16, 2012.
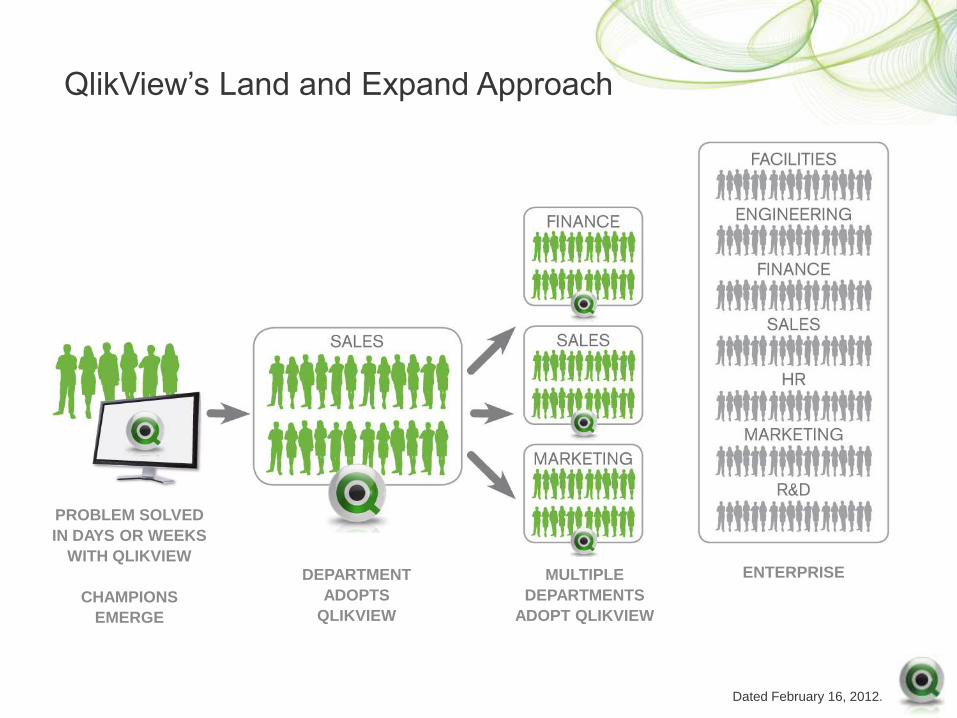
QlikView’s Land and Expand Approach
PROBLEM SOLVED
IN DAYS OR WEEKS
WITH QLIKVIEW
CHAMPIONS
EMERGE
DEPARTMENT
ADOPTS
QLIKVIEW
MULTIPLE
DEPARTMENTS
ADOPT QLIKVIEW
ENTERPRISE
Dated February 16, 2012.
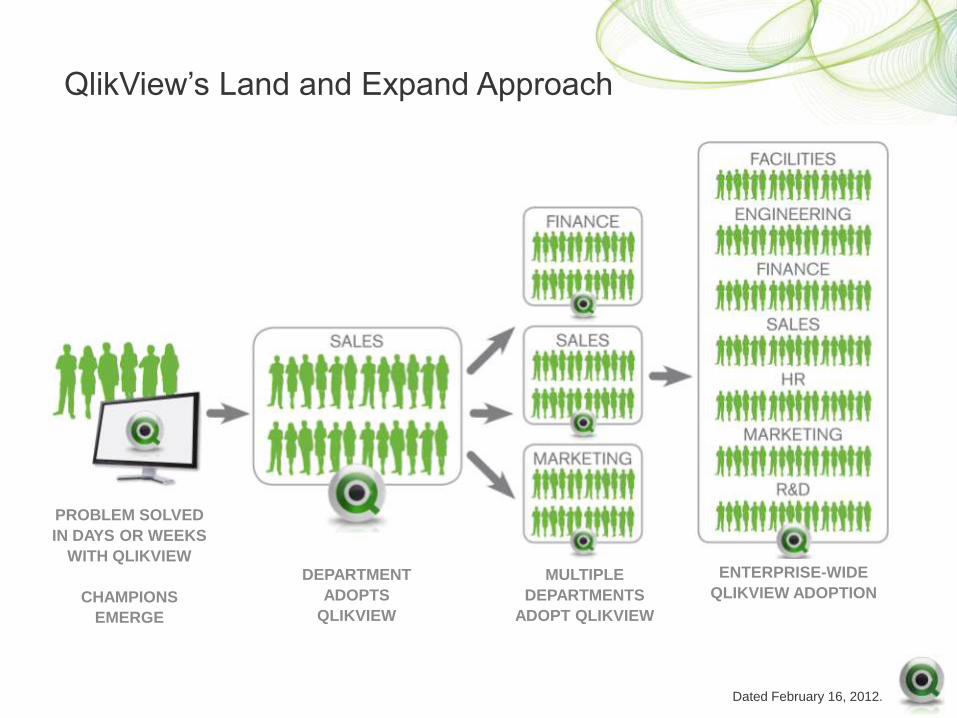
QlikView’s Land and Expand Approach
PROBLEM SOLVED
IN DAYS OR WEEKS
WITH QLIKVIEW
CHAMPIONS
EMERGE
DEPARTMENT
ADOPTS
QLIKVIEW
MULTIPLE
DEPARTMENTS
ADOPT QLIKVIEW
ENTERPRISE-WIDE
QLIKVIEW ADOPTION
Dated February 16, 2012.
Appendix #4:
Customer Case Studies/Template
Dated February 16, 2012.
World leader in 3D design, engineering and
entertainment software.
Challenges
• Link departmentalized BI efforts under one corporate umbrella
• Grow a strong BI competency center
• Provide more intelligence, deliver more data and allow for velocity
through the user base, without traditional BI’s years or months of waiting
Solution
Deployed QlikView as the company’s worldwide enterprise standard for:
• Functional dashboards across the enterprise
Results
• 56 dashboards in less than one year for more than 800 business users
• Consolidated over 25 years of customer and product data from multiple
sources, including SAP, into QlikView
• Increased visibility for more strategic sales, customer service and
revenue opportunities
56 GLOBAL DASHBOARDS IMPLEMENTED WORLDWIDE
Dated February 16, 2012.
Consumer electronics and technology products giant.
Challenges
• Existing BI tools required expert skills to use
• No visibility of each site's operating ratio, component losses,
human resources structures, and cost/performance analysis
Solution
Deployed QlikView for:
• Integrating with strategic business process re-engineering
• Delivering real-time shop-floor data visualization to local
and international offices
• User-level interaction allows rapid data drill-down
on productivity metrics
Results
• Zero-wait visibility of each site's operating ratio, component losses,
human resources structures, and cost/performance analysis
ZERO-WAIT SHOP FLOOR DATA VISUALISATION
Dated February 16, 2012.
U.S. health insurer covering 131,000 members in 14 states
Challenges
• Required performance trends and KPI analysis on 140 million
subscriber and provider records
• Needed to integrate Oracle, SQL Server, Access, and Paradox data
Solution
Deployed QlikView for:
• Claims processing and provider reimbursement analysis
• Claims representative customer satisfaction tracking
Results
• Deployed in under two weeks
• Improved profitability through dramatic data accuracy improvements
• Increased customer satisfaction
140 MILLION DATA RECORDS DEPLOYED
IN UNDER 2 WEEKS
Dated February 16, 2012.
Subsidiary of PepsiCo, Inc. and manufacturer
of industry-leading sports drink Gatorade.
Challenges
• Sought real-time sales data to proactively respond to market changes
• Wanted to improve reporting time
• Needed to handle tens of millions of data records
Solution
Deployed QlikView to analyze:
• Sales and profitability by account
• Sales expenses
• Billing
Results
• Reduced reporting time from 1-4 hours to 3 minutes,
saving $237 per employee, per report
• Gained real-time visibility of company-wide sales performance
• Realized full return on investment in four months
TENS OF MILLIONS OF DATA RECORDS
REPORTING TIME REDUCED FROM
1-4 HOURS TO 3 MINUTES
$237 SAVED PER EMPLOYEE, PER REPORT

Dated February 16, 2012.
The publicly-funded healthcare system of England,
providing the majority of healthcare in the country.
Challenges
• Needed to consolidate, visualize and analyze financial data across
all regional NHS hubs
• Wanted to reduce contract spend throughout NHS supply chain
Solution
Deployed QlikView to regional hubs and financial personnel nationwide for:
• Benefits reporting
• Spend vs. cost analysis
• Supplier and purchaser analysis
• Organizational benchmarking analysis
Results
• $66 million in procurement cost savings over two years
• Improved regional hub performance through better data insight
• Significant reduction in management time spent on reporting and analysis
$66 MILLION IN PROCUREMENT COST SAVINGS
Dated February 16, 2012.
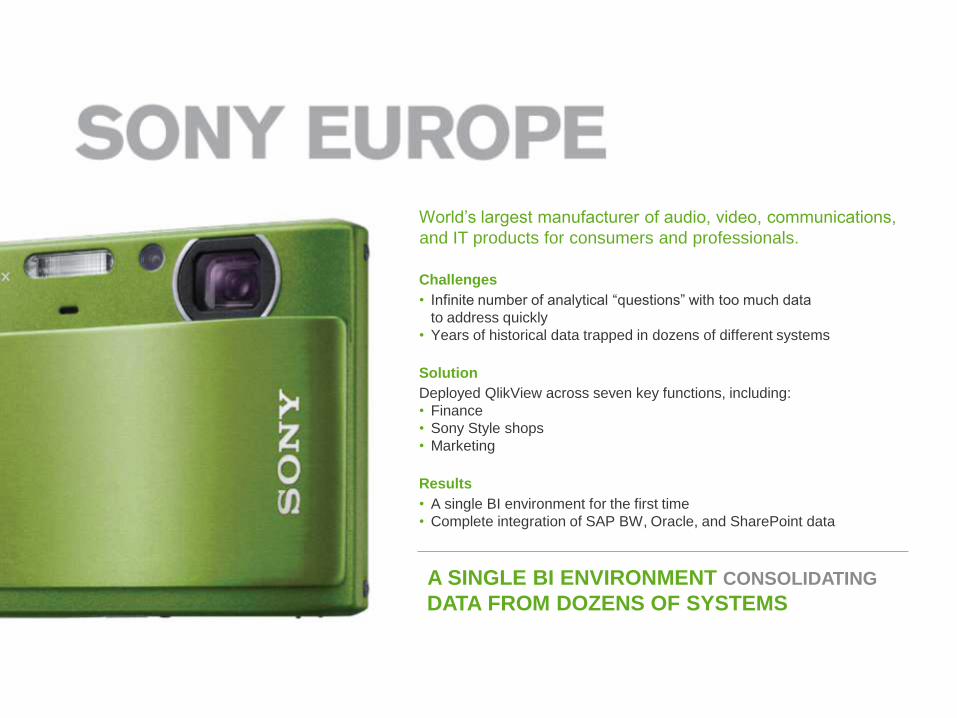
World’s largest manufacturer of audio, video, communications,
and IT products for consumers and professionals.
Challenges
• Infinite number of analytical “questions” with too much data
to address quickly
• Years of historical data trapped in dozens of different systems
Solution
Deployed QlikView across seven key functions, including:
• Finance
• Sony Style shops
• Marketing
Results
• A single BI environment for the first time
• Complete integration of SAP BW, Oracle, and SharePoint data
A SINGLE BI ENVIRONMENT CONSOLIDATING
DATA FROM DOZENS OF SYSTEMS
Dated February 16, 2012.
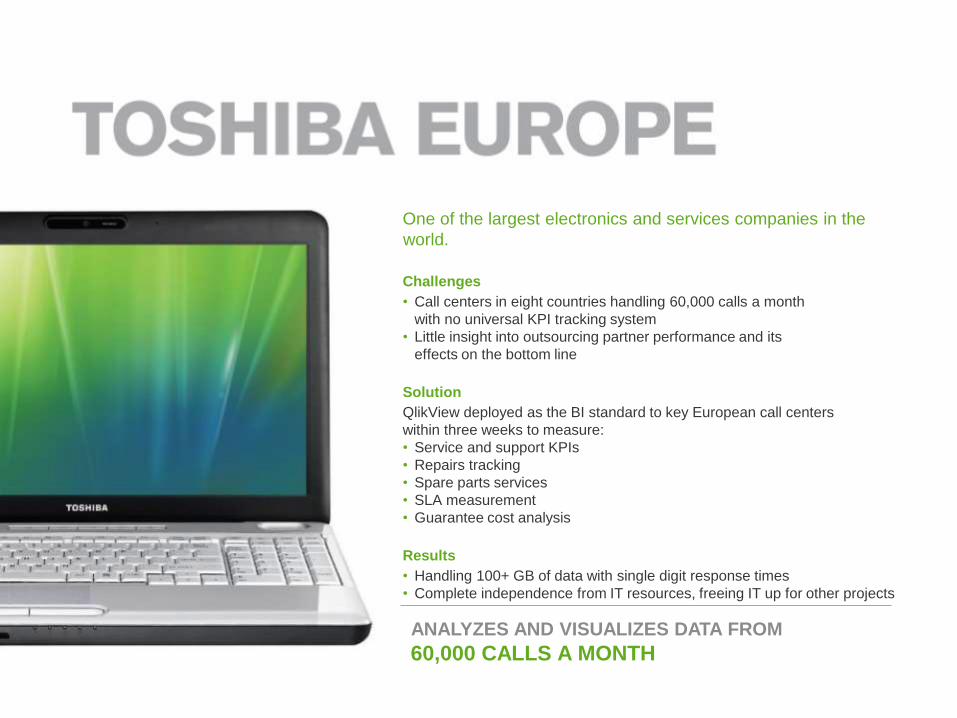
One of the largest electronics and services companies in the
world.
Challenges
• Call centers in eight countries handling 60,000 calls a month
with no universal KPI tracking system
• Little insight into outsourcing partner performance and its
effects on the bottom line
Solution
QlikView deployed as the BI standard to key European call centers
within three weeks to measure:
• Service and support KPIs
• Repairs tracking
• Spare parts services
• SLA measurement
• Guarantee cost analysis
Results
• Handling 100+ GB of data with single digit response times
• Complete independence from IT resources, freeing IT up for other projects
ANALYZES AND VISUALIZES DATA FROM
60,000 CALLS A MONTH
Dated February 16, 2012.
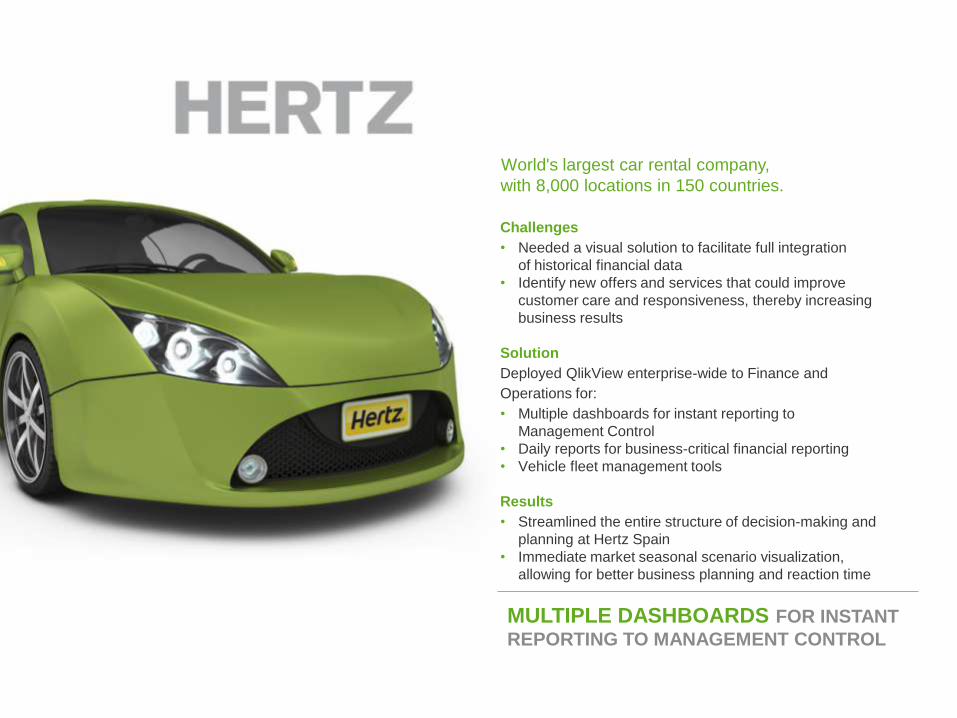
World's largest car rental company,
with 8,000 locations in 150 countries.
Challenges
• Needed a visual solution to facilitate full integration
of historical financial data
• Identify new offers and services that could improve
customer care and responsiveness, thereby increasing
business results
Solution
Deployed QlikView enterprise-wide to Finance and
Operations for:
• Multiple dashboards for instant reporting to
Management Control
• Daily reports for business-critical financial reporting
• Vehicle fleet management tools
Results
• Streamlined the entire structure of decision-making and
planning at Hertz Spain
• Immediate market seasonal scenario visualization,
allowing for better business planning and reaction time
MULTIPLE DASHBOARDS FOR INSTANT
REPORTING TO MANAGEMENT CONTROL
Dated February 16, 2012.
Area for graphic
Sub-title copy
Challenges
• Bullet copy
• Bullet copy
Solution
Deployed QlikView for:
• Bullet copy
• Bullet copy
Results
• Bullet copy
• Bullet copy
COMPANY NAME
DATA POINT DATA POINT COPY
Dated February 16, 2012.
Appendix #5:
Change Their World
Dated February 16, 2012.
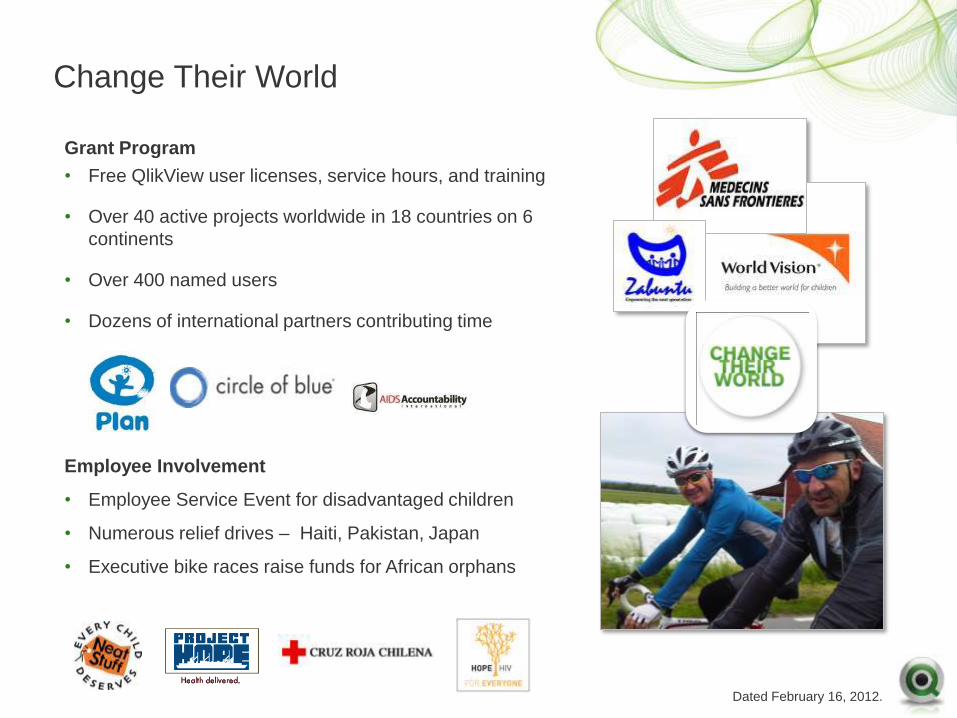
Grant Program
• Free QlikView user licenses, service hours, and training
• Over 40 active projects worldwide in 18 countries on 6
continents
• Over 400 named users
• Dozens of international partners contributing time
Employee Involvement
• Employee Service Event for disadvantaged children
• Numerous relief drives – Haiti, Pakistan, Japan
• Executive bike races raise funds for African orphans
Change Their World
Thank you!


![Syamsul Data Warehouse bagian Iilmukomputer.org/wp-content/uploads/2009/06/syamsul-data-warehous… · on [Asc/Desc] [….n] 4 Sebagai contoh,](https://img.dokumen.tips/doc/110x75/5b92fa9209d3f206218c6ecd/syamsul-data-warehouse-bagian-on-ascdesc-n-4-sebagai-contoh-jika-anda.jpg)