Embed Size (px)
Citation preview
S1
Pyridinium Boranephosphonate Modified DNA Oligonucleotides
Subhadeep Roy‡, Sibasish Paul‡, Mithun Royǂ, Rajen Kundu‡, Luca Monfregola‡ and Marvin H. Caruthers‡*
‡Department of Chemistry and Biochemistry, University of Colorado, Boulder, Colorado 80303, United States
ǂ Department of Basic Sciences and Humanities, National Institute of Technology, Manipur, Langol, Imphal-795004 (Manipur), India
Page# Figure S1: 1H NMR spectrum of 3. S2 Figure S2: 13C NMR spectrum of 3. S3 Figure S3: HRMS trace of 3. S4 Figure S4: HRMS trace of 4. S5 Figure S5: 1H NMR of 6. S6 Figure S6: 13C NMR of 6. S7 Figure S7: HRMS trace of 6. S8 Figure S8: 1H NMR of 11 S9 Figure S9: 13C NMR of 11 S10 Figure S10: HRMS trace of 11 S11 Figure S11: 1H NMR spectrum of 13. S12 Figure S12: 13C NMR spectrum of 13 S13 Figure S13: HRMS trace of 13 S14 Figure S14: 31P NMR spectra of reaction mixtures with varying amount of pyridine S15 Figure S15: 31P NMR of solution from reaction of 1 with 2,6-dimethylpyridine S16 Figure S16: Comparison of 11B decoupled 1H NMR spectrum of 6 and 13. S17 Figure S17: Fluorescence microscopy image of Hela cells treated with 1 µM ODN 10 S18 Figure S18: Fluorescence microscopy image of Hela cells treated with 100 nM ODN 10 S19 Table S1: Mass spectrometry characterization data for ODNs used in cell uptake studies S20 Figure S19: UV-Vis spectral traces for reduction of metal ions by 5 and 6. S20

S2
Figure S1. 1H NMR spectrum of compound 3. Peaks in the aromatic region correspond to pyridine.

S3
Figure S2. 13C NMR spectrum of compound 3.
S4
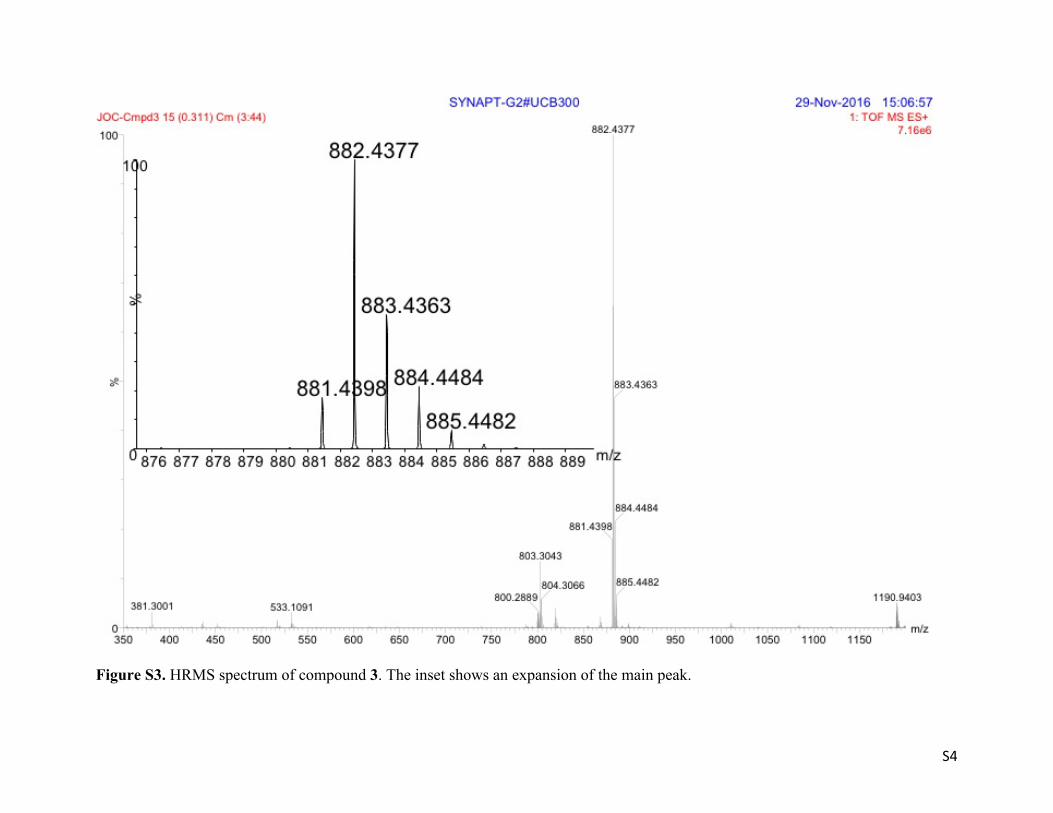
Figure S3. HRMS spectrum of compound 3. The inset shows an expansion of the main peak.

S5
Figure S4. HRMS spectrum of compound 4. The inset shows an expansion of the main peak.

S6
Figure S5. 1H NMR of compound 6.

S7
Figure S6. 13C NMR of compound 6.

S8
Figure S7. HRMS spectrum of compound 6.
S9
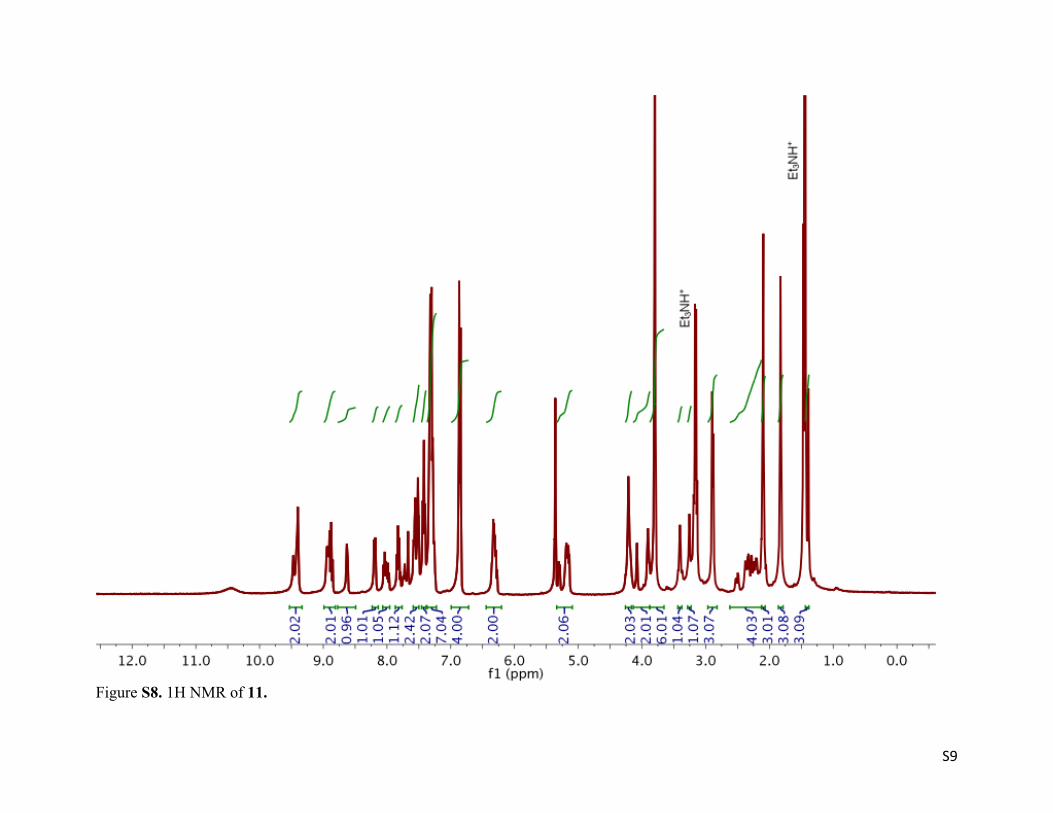
Figure S8. 1H NMR of 11.

S10
Figure S9. 13C NMR spectrum of 11.

S11
Figure S10. HRMS spectrum of 11.

S12
Figure S11. 1H NMR of compound 13.
S13
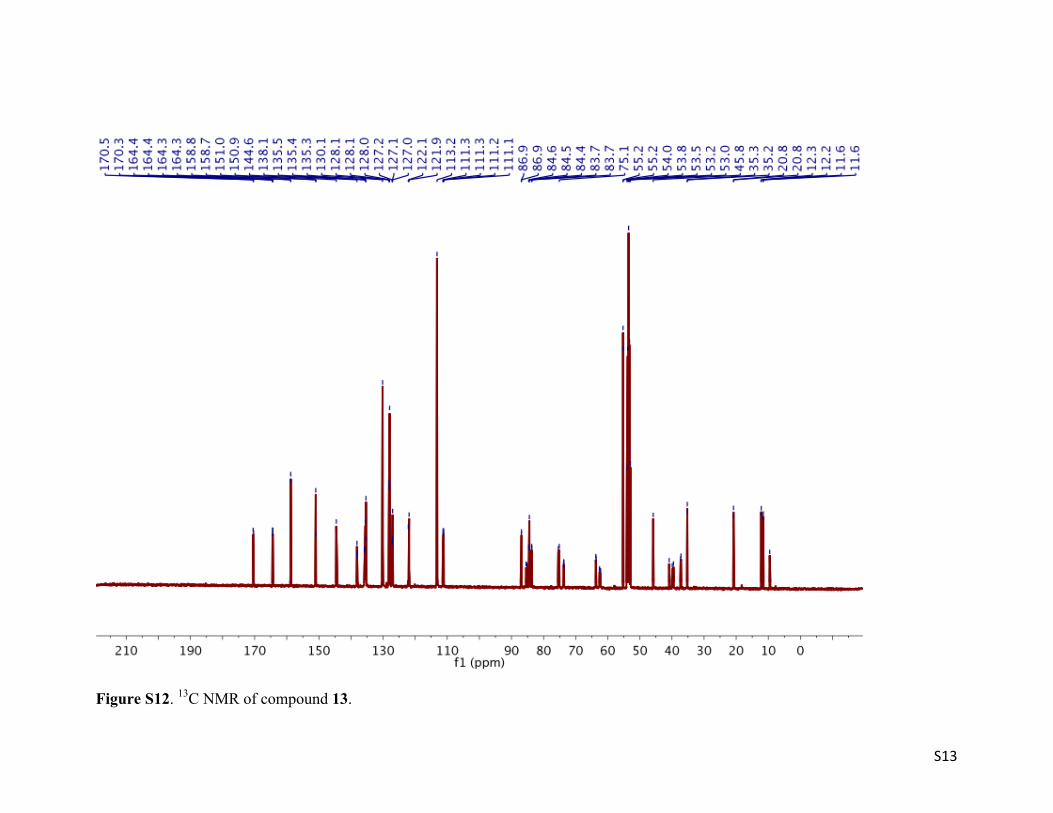
Figure S12. 13C NMR of compound 13.

S14
Figure S13. HRMS spectrum of 13.

S15
Figure S14. 31P NMR spectra from reaction mixtures containing variable amounts of pyridine with respect to 5: (A) 1 equivalent (B) 4 equivalents, (C) 8 equivalents and (D) 16 equivalents. One equivalent of iodine with respect to 5 was used for each of these reactions.
S16
.
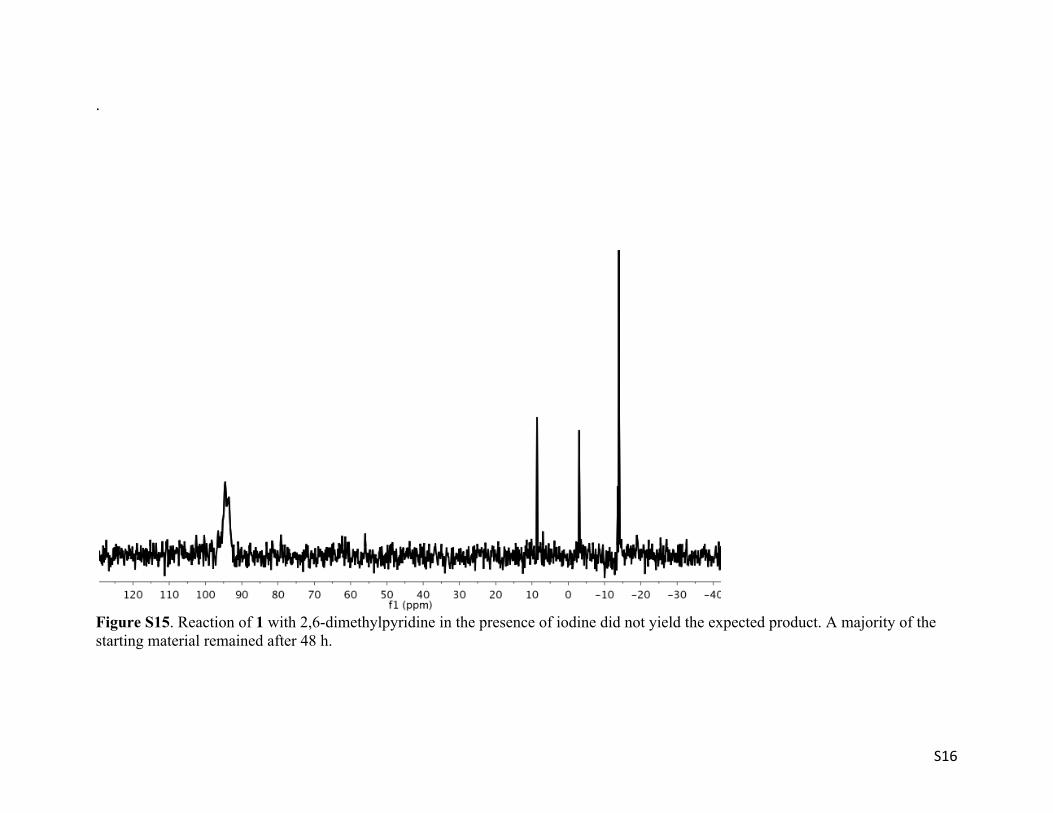
Figure S15. Reaction of 1 with 2,6-dimethylpyridine in the presence of iodine did not yield the expected product. A majority of the starting material remained after 48 h.

S17
Figure S16. Comparison of 11B decoupled 1H NMR of 6 (top) and 13 (bottom). Panel on the right shows a zoom-in of the region containing the resonance for the BH2 protons. The assignment of these peaks was based on comparison of the 11B decoupled and non-decoupled 1H NMR spectra.

S18
Figure S17. Fluorescence microscopy image (100 x magnification) of Hela cells treated with 1 µM ODN 10. The fluorescein signal is in green while that for the Hoechst 33258 dye is in blue.

S19
Figure S18. Fluorescence microscopy image (100 x magnification) of Hela cells treated with 100 nM ODN 10. The fluorescein signal is in green while that for the Hoechst 33258 dye is in blue.

S20
Sequence Theor. Mass. Obs. Mass
ODN 7 Fl- TpyTpTpTpTpTpTpTpTpTpTpTpTpTpTpTpTpTpTpTpyT – 3’ 7012.2 7012.2 ODN 8 Fl- TpyTpyTpTpTpTpTpTpTpTpTpTpTpTpTpTpTpTpTpyTpyT – 3’ 7163.6 7162.6 ODN 9 Fl- TpyTpyTpyTpTpTpTpTpTpTpTpTpTpTpTpTpTpTpyTpyTpyT – 3’ 7313.6 7312.4 ODN 10 Fl- TpyTpTpTpTpyTpTpTpTpyTpTpTpTpyTpTpTpTpyTpTpTpyT – 3’ 7313.6 7312.4 Table S1. LCMS data for ODNs used for cell uptake studies.
Figure S19. UV-visible spectral traces for the reduction of (a) HAuCl4, (b) K2PtCl4 at room temperature by 5 and (c) HAuCl4, (d) K2PtCl4 by 6. The reaction solutions contained 5 and 6 at 200 µM and the metals at 5 mM. Absorbance spectra were recorded from 0 to 120 min. and 0 to 240 min. for the reduction of HAuCl4
and K2PtCl4 respectively.
AuCl4-Vsd(TbpT) PtCl42-Vsd(TbpT)
AuCl4-Vsd(TpyT)PtCl42-Vsd(TpyT)
(a) (b)
(c) (d)
0-120min
0-120min
0-240min
0-120min
![Bis[4-(dimethylamino)pyridinium] octaaquachloridolanthanum ...journals.iucr.org/e/issues/2012/11/00/su2504/su2504.pdfBis[4-(dimethylamino)pyridinium] octaaquachloridolanthanum(III)](https://img.dokumen.tips/doc/110x75/5e0610443af6f93e3057972f/bis4-dimethylaminopyridinium-octaaquachloridolanthanum-4-dimethylaminopyridinium.jpg)


![Dna opportunity modified 7 22[1]](https://img.dokumen.tips/doc/110x75/55a1c45b1a28abce658b458a/dna-opportunity-modified-7-221.jpg)