Embed Size (px)
Citation preview
Pushover analysis for the seismic response prediction of cable-stayed bridges under multi-directional excitation A. Cámara *, MA Astiz Department of Mechanics and Structures, School of Civil Engineering, Technical University of Madrid, Prof. Aranguren s/n, Madrid, Spain
Cable-stayed bridges represent nowadays key points in transport networks and their seismic behavior needs to be fully understood, even beyond the elastic range of materials. Both nonlinear dynamic (NL-RHA) and static (pushover) procedures are currently available to face this challenge, each with intrinsic advantages and disadvantages, and their applicability in the study of the nonlinear seismic behavior of cable-stayed bridges is discussed here. The seismic response of a large number of finite element models with different span lengths, tower shapes and class of foundation soil is obtained with different procedures and compared. Several features of the original Modal Pushover Analysis (MPA) are modified in light of cable-stayed bridge characteristics, furthermore, an extension of MPA and a new coupled pushover analysis (CNSP) are suggested to estimate the complex inelastic response of such outstanding structures subjected to multi-axial strong ground motions.
1. Introduction
Cable-stayed bridges represent key points of the transport networks and, consequently, they are conceived to remain nearly elastic under the design seismic action, typically including dampers to control the response when located in seismic-prone areas. However, several important cable-stayed bridges with dampers (e.g. Rion-Antirion in Greece or Stonecutters in China) also allow some structural damage in the towers in order to reduce response uncertainties under unexpectedly large earthquakes. On the other hand, there are many cable-stayed bridges without seismic devices which are exposed to large earthquakes and inelastic excursions. Considering these extreme events, designers need appropriate methodologies to address if the ductility demand along the towers is acceptable, and to verify the elastic response of the deck.
Non-Linear Response History Analysis (NL-RHA) is undoubtedly the most rigorous methodology to deal with inelasticity in dynamic studies, allowing also the consideration of viscous dampers. However, several uncertainties are introduced in the definition of the models and analysis, to the point that there are seismic regulations which preclude this procedure [1]. In this sense, nonlinear static pushover analysis is very appealing.
In recent years, pushover strategies have received a great deal of research, especially since seismic design guidelines [2,3] were published. Their main goal is to estimate the nonlinear seismic
response by means of static calculations, pushing the structure up to certain target displacement using load patterns which try to represent the distribution of inertia forces. These methodologies are useful to uncover design weaknesses that could remain hidden in an elastic analysis and yield good estimations of the nonlinear seismic performance under certain conditions, drastically reducing the computational cost [4]. For these reasons many design guidelines recommend the use of pushover analysis to evaluate the inelastic seismic response [2,5,6], whereas the N2 pushover analysis [7] is adopted in Eurocode 8 [8]. However, the mathematical basis of the procedure is far from accurate; it is assumed that the nonlinear response of a multi degree-of-freedom structure can be related to the response of an equivalent single degree-of-freedom model (SDOF), which implies that the response is controlled by a single mode; furthermore it is assumed that this modal shape remains constant through the analysis [4]. Although these assumptions are clearly incorrect, if the structure response is dominated by the first mode of vibration the estimated results have been found to be generally accurate compared with rigorous NL-RHA [4,9,10]. Different proposals have been made to overcome the aforementioned shortcomings, briefly described in the following lines.
Chopra and Goel [11] introduced the Modal Pushover Analysis (MPA) in order to take into account the contributions of several important modes in the nonlinear dynamic response of the structure, neglecting the interaction between modes in nonlinear range and studying their response independently as it is performed in spectral analysis. This procedure, initially proposed for buildings under one-directional ground shaking and included in FEMA-440 [6], has been improved in order to include the effect of higher
modes through spectral analysis, considering their response completely elastic [12]. The modal contribution is finally combined with standard rules like CQC (Complete Quadratic Combination) or SRSS (Square Root of the Sum of Squares), based on elastic superposition principles unable to retain the sign of the modal force distributions, which may introduce errors [13].
Several adaptive pushover methods have been developed in order to 'update' the load distribution pattern along the structure as long as yielding mechanisms are developed, they can be based on imposed load [14] or displacements patterns [15]. Although the consideration of variable modal properties normally improves the accuracy of the procedure [13,15], its difficulty is inevitably increased and it is somewhat away from the initial objective of a simplified yet accurate method. Moreover, Papanikolau et al. [16] pointed out the misleading results that adaptive pushover strategies could offer, and the numerical difficulties involved in the extraction of vibration modes if large inelastic deformations arise.
Another pitfall of pushover analysis is the difficulty in modeling three-dimensional (3D) and torsional effects, as well as considering multi-directional simultaneous seismic excitation, which in the present work are found to be important in structures with strong mode coupling like cable-stayed bridges [17]. In this direction, Lin and Tsai [18] proposed an extension of MPA, substituting the SDOF by a three degree of freedom system which takes into account the coupling between the two horizontal translations and the vertical rotation, increasing the complexity of the procedure. More practically, Huang and Gould [19] performed a simultaneous bi-directional pushover analysis considering two load patterns along both horizontal directions.
So far, most of the research is currently focused on buildings and few works address the problem of the applicability of pushover analysis to bridges [9,10,20]; the work of Paraskeva et al. [21] proposed key issues to employ MPA to bridges, providing information about the selection of the control point (among other features), and applying the procedure to a strongly curved bridge, where transverse modes present displacements also in longitudinal direction. Nonetheless, no specific studies on this topic about cable-stayed bridges have been found by the authors. On the other hand, bridges are usually more affected by higher modes and, therefore, proposing modal pushover procedures for these structures is even more of a challenge than in the case of buildings.
In this work, several considerations proposed for the applicability of MPA in triaxially excited cable-stayed bridges are first included. Subsequently, two new procedures are presented; the Extended Modal Pushover Analysis (EMPA), which considers the 3D components of the accelerograms, and the Coupled Nonlinear Static Pushover analysis (CNSP), which takes into account the nonlinear coupling between the governing modes. The validation of these pushover methods is performed by comparing their results with the extreme seismic response recorded in NL-RHA, considered as the 'exact' solution.
2. Implementation issues of MPA in cable-stayed bridges
The complex interactions among vibration modes, characteristic of cable-stayed bridges [17], force the designer to consider the full 3D model in pushover analysis. Furthermore, large differences in the stiffness of their constitutive members (towers, deck and cable-system) favor significant contributions of modes higher than the fundamental one, and typically among the first twenty modes (see Section 6.1), which clearly differentiate these structures from buildings. Several special features about the implementation of MPA in three-axially excited cable-stayed bridges have been proposed in this study and are described in the following lines.
MPA has been conceived for structures under one-directional seismic excitation, being its mathematical development included elsewhere [11]; if the bridge is three-directionally excited, in-plane pushover analyses may be conducted separately, deciding first which is the characteristic direction of the nth mode (referred as DRn) and neglecting its contributions in the other directions.
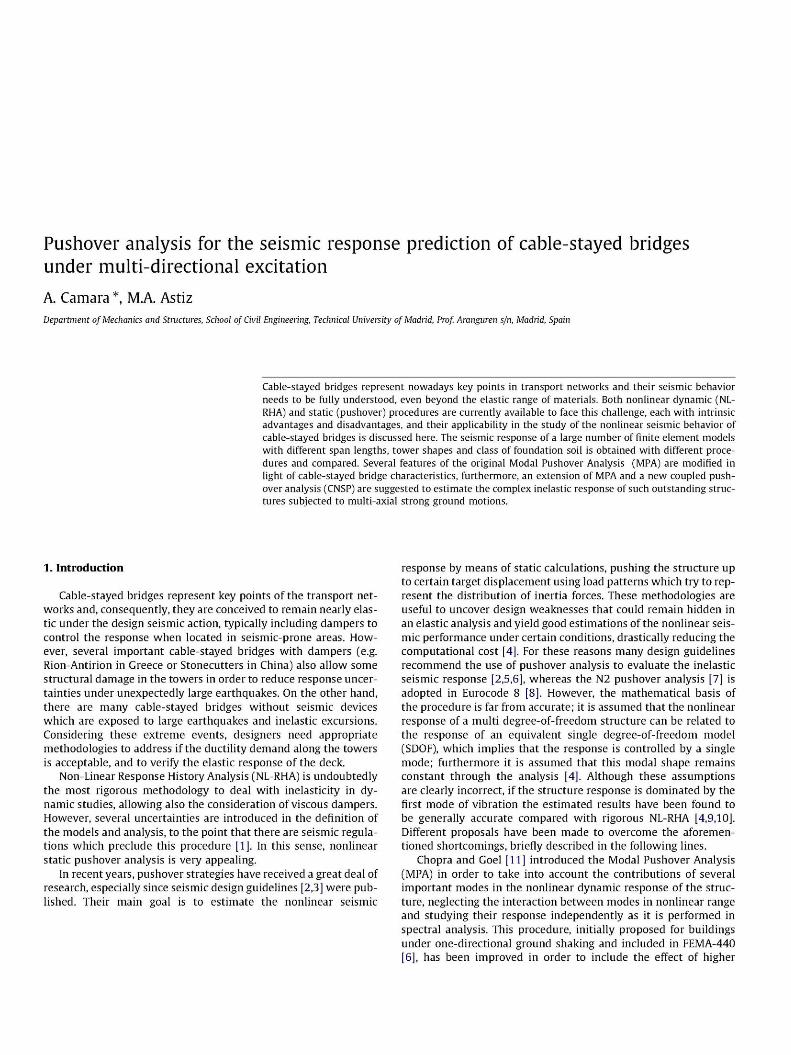
A previous study about the contributions of each mode below a reasonable upper limit of /m a x = 25 Hz (higher modes are neglected) should be performed in order to select the governing horizontal modes in longitudinal and transverse directions, i.e. the ones with larger contributions in the corresponding response (see Section 6.1). The inelastic demand is assumed to be governed by the first vibration modes, consequently, it is proposed to include in the nonlinear static analyses all the vibration modes below the limiting frequency/gov, which is established as/gOV= max(fnX, fnY), where/„x and/ny are the frequencies associated with the longitudinal and transverse governing modes respectively (Section 6.1 is devoted to the identification of such values). The modal responses obtained through pushover analysis are combined by means of CQC rule to obtain the inelastic contribution. On the other hand, all the modes between/gov and/m a x= 25 Hz are considered merely elastic and included by means of response spectrum analysis [12]. This elastic response is combined with the inelastic one obtained previously by employing the SRSS rule. Finally, frequencies above 25 Hz are directly neglected in light of the characteristic dynamic response of cable-stayed bridges. Fig. 1 aims to clarify the distinction of intervals in this proposal.
The nonlinear contribution of the first relevant modes is obtained with pushover analysis, integrating for each one the resulting SDOF differential equation in time-domain to obtain the modal displacement demand (the nonlinear spring cyclic behavior is solved with the algorithm proposed by Simo and Hughes [22]). This procedure is more rigorous than employing inelastic spectra (as it is proposed in Refs. [7,21]), since the contribution of modes in the short-period range has been observed to be relevant in the response of cable-stayed bridges (discussed in Section 6.1), being the estimates of displacement demand employing formulae based on the inelastic spectrum less accurate for these modes [7].
The selection of the roof as the control point in buildings is straightforward because it is generally the level with extreme recorded displacements. However, when dealing with three-directionally excited cable-stayed bridges, this point is not obvious. It is proposed here to establish the control point as the point with maximum modal displacement in the specific studied mode along its dominant direction (defined in Section 6.1). Therefore, optimized control points are considered by this proposal, which may be different from one vibration mode to another.
/max = 25 Hz
nY nX Mode number; n
Fig. 1. Scheme of mode selection in MPA and EMPA procedures (in this case nX > nY but it could be reversed).
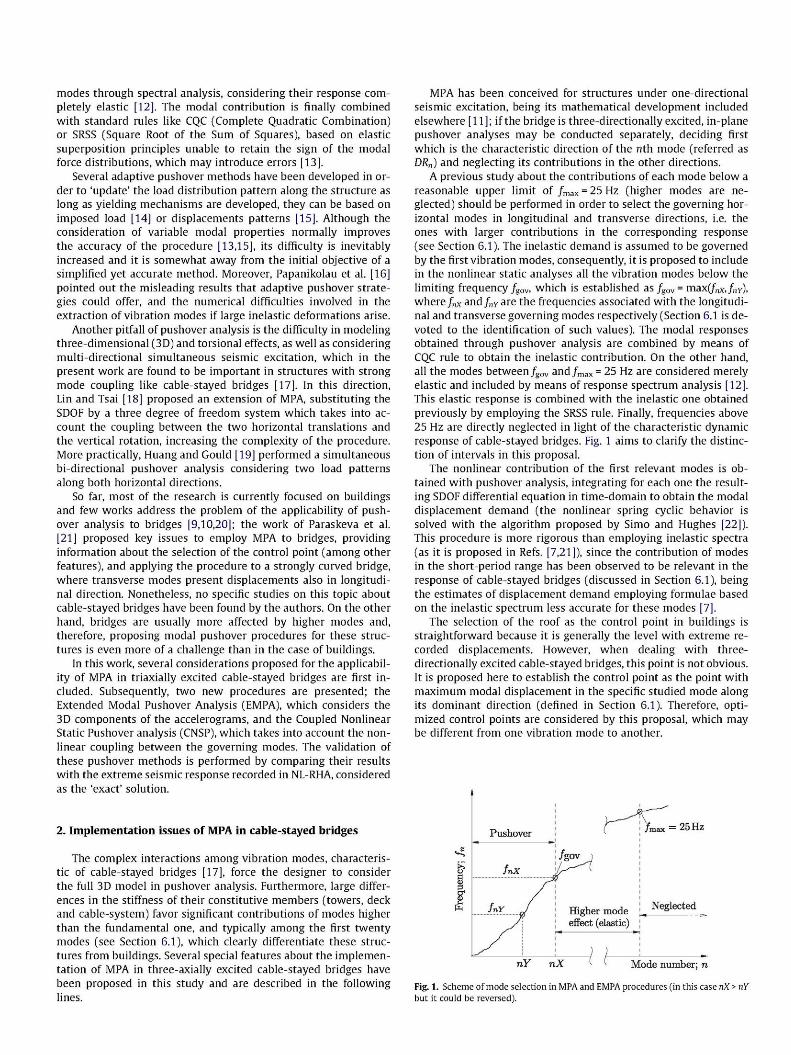
(a) Load distribution s* = m 0 n (b) Resulting control point displacement ürn
Fig. 2. Schematic 3D features of EMPA in a transverse n-mode (DR„ = Y).
In order to idealize the obtained 'capacity curve' (relating the base shear and the displacement of the control point) into a bilinear plot, a specific 'Equal Area' rule has been considered to represent more properly the actual curves obtained in the towers of cable-stayed bridges. In light of an extensive number of capacity curves extracted from these structures, the ideal elastic stiffness has been established as 75% of the initial one in the recorded curve, which presents a gradually decreasing slope caused by progressive development of plastic hinges at different locations along the towers.
3. Extended Modal Pushover Analysis: EMPA
An Extended Modal Pushover Analysis (EMPA) is proposed here, in order to fully take into account the multi-directional seismic excitation üj(t) = (ü*,üj ,ü | j . Neglecting the contributions of
one specific mode in directions different than the characteristic one (like original MPA suggests) is reasonable in regular buildings, where two well defined flexure planes are present, but could be misleading in irregular buildings or in bridges with strong modal coupling like cable-stayed bridges. Paraskeva et al. [21] applied MPA to one bridge with curved deck, considering also the longitudinal displacements in transverse modes. Cable-stayed bridges, on the other hand, are also affected by the vertical excitation in transverse modes; vibration modes with transverse flexure of the towers and the deck present a characteristic interaction with the girder torsion, and also with its vertical flexure in structures with moderate to medium spans (below 500 m), due to the coupled response exerted by the cable-system. Other modes with significant interactions are present in cable-stayed bridges [17], and two or three accelerogram components at the same time may contribute significantly to the response in these modes, but original MPA would discard secondary sources of the seismic response. EMPA has been designed as an attempt to incorporate these effects. Finishing with the motivation, note that although 0n is the modal displacement vector in a transverse, longitudinal or vertical mode, it could have non-zero components in the other two directions, albeit typically much smaller than the dominating
ones. Hence, the load distributions of vibration modes are 3D, as it is schematically represented in Fig. 2a, particularized for a transverse mode (DRn = Y).
EMPA is based on the same principles as MPA, but considering the system of dynamics under general 3D ground motions. The seismic excitation vector (right part of the system of dynamics) is the sum of three terms, each one corresponding to the three components of the accelerogram record:
mü + cu + fs(u, u) = -^i^(t) - sYül(t) - sziiz{t) (1)
where u(t) is the relative displacement vector, m and c are respectively the mass and damping matrices of the structure, fs defines the relationship between force and displacement vectors, iig is the ground acceleration in j-direction (j = X, Y, Z). Finally, considering a structure composed of N degrees of freedom, sJ[N x 1] is the spatial distribution of the seismic excitation in j-direction:
s* = iW = £# = £/>*, (2)
r\ and 0, being respectively the participation factor (scalar) in j -direction and the mode shape vector associated with ¡th mode. It is worth noting that both forces and bending moments are included in the expanded excitation vector, since three displacements and three rotations (6 DOF) per node are activated in the model and included in fc. On the other hand, i'[N x 1 ] is the displacement vector of the structure when the same unit movement is imposed in all the foundations in direction j . The spatial variability of the seismic action is not considered in this work and, hence, the displacements prescribed at ground level are equal. Pre-multiplying each term of Eq. (2) by <¡>T
n, and considering the orthogonality of the mass matrix, r{ is obtained:
P J n M„ '
with j =X,Y,Z (3)
Introducing the expanded vectors s*, sY, s2 in expression (1) with (2), pre-multiplying by </>l and taking into account the orthogonality properties:

^ m ü + ^ c ú + ^f s(u,ú): •M„
Y;;Y rAüx + r'üY +rü r¿,-;z (4)
W )
EMPA extends the original methodology to consider the 3D earthquake excitation by means of an equivalent acceleration history ü*n(t), defined in (4) in terms of the modal properties besides the earthquake record itself. So far the procedure is exact but, as it is assumed in MPA, the coupling between modes in nonlinear range is neglected at this point and a set oiJ(J < N) relevant modes is considered:
u(t) = 5>(t) « E^Kt) (5)
where q¡ is a generalized coordinate which takes into account the 3D nature of the mode shape 0„ being defined in expression (8b) below. The uncoupled SDOF system from (4) and (5) is obtained as follows:
- JI F
q„ + 2£„co„q„ + ^ = -"gi„(t) (6)
The procedure now takes into account the three components of the 3D pushover analysis (Fig. 2) by means of Fsn = <^fs(qn,qn), without neglecting the components different from the mode dominating direction (DRn). The bar symbol overfsn is established in order to differentiate it from the unidirectional pushover analysis in MPA. In fact, the capacity curve, which defines the required relationship Fsn/Mn, is obtained in a different way than MPA, taking into account the aforementioned contributions of the excitation vector in all available degrees of freedom. In order to do that, three capacity curves are recorded in a single pushover analysis of each mode, associated with the longitudinal, transverse and vertical
directions; [V] Vl VÍ as it was de-'bn-urnj> \ v bn ~ "rnJ , \ v bn ~ l
picted in Fig. 2, where V'bn and iim are respectively the total base shear and the displacement of the control point in j-direction during the 3D static analysis of nth mode.
Once these projected 2D capacity plots are obtained, they are transformed into coordinates Fsn¡Mn - qn:
sn bn
M„~ I>„
9Í,
(7a)
(7b)
in which FJsn and qj, represent the projection in j-direction (J = X, Y, Z)
of the 3D capacity curve associated with nth mode, whereas iim and <?Vm are respectively the corresponding displacement and normalized modal displacement at the control point, which is selected with the considerations proposed in MPA, regardless of the direction where the peak modal displacement is recorded. Finally L{ = fiml.
A so-called 'modular capacity curve' {Fsn/Mn - q„) is suggested to introduce the information of the three projected curves 'F{JMn - qj,) in the SDOF Eq. (6):
M„ (8a)
(8b)
This modular capacity curve includes information of the longitudinal, transverse and vertical capacity curves in the nth mode, and allows the definition of the equivalent SDOF expressed in (6), which subjected to the equivalent accelerogram Ü* (t) and
integrated in time domain, results in the modular generalized displacement demand maxt [q„(t)]. The modular target displacement which marks the end of the 3D pushover analysis (see Fig. 2b) is then:
C * = ^max[q„(t)j (9)
w h e r e 4>m = \] {4>xm) + {<Q + {4>z
m) . The rest of the steps, combining modal maxima and considering
higher mode effects are the same as in MPA. The same distribution of the modal range presented in MPA (Fig. 1) is employed, discerning among modes which require pushover analysis, response spectrum analysis or ignored frequencies.
4. Coupled Nonlinear Static Pushover analysis: CNSP
MPA neglects the interaction between the modes, superposing modal contributions just as it is done in a modal elastic analysis. The proposed extension (EMPA), despite considering the contribution of vibration modes in all directions, besides the associated effect under 3D seismic excitation, also assumes the different modes uncoupled and pushover analysis is performed separately for each mode. However, studying the longitudinal and transverse flexure separately is conceptually wrong if material nonlinearities are involved, because the damage exerted to the tower due to its longitudinal flexure unavoidably affects the transverse response and vice versa. In order to overcome this drawback, and to consider the nonlinear modal interaction, the Coupled Nonlinear Static Pushover analysis (CNSP) is proposed here, rooted in EMPA (presented above) and in the proposal of Huang and Gould [19].
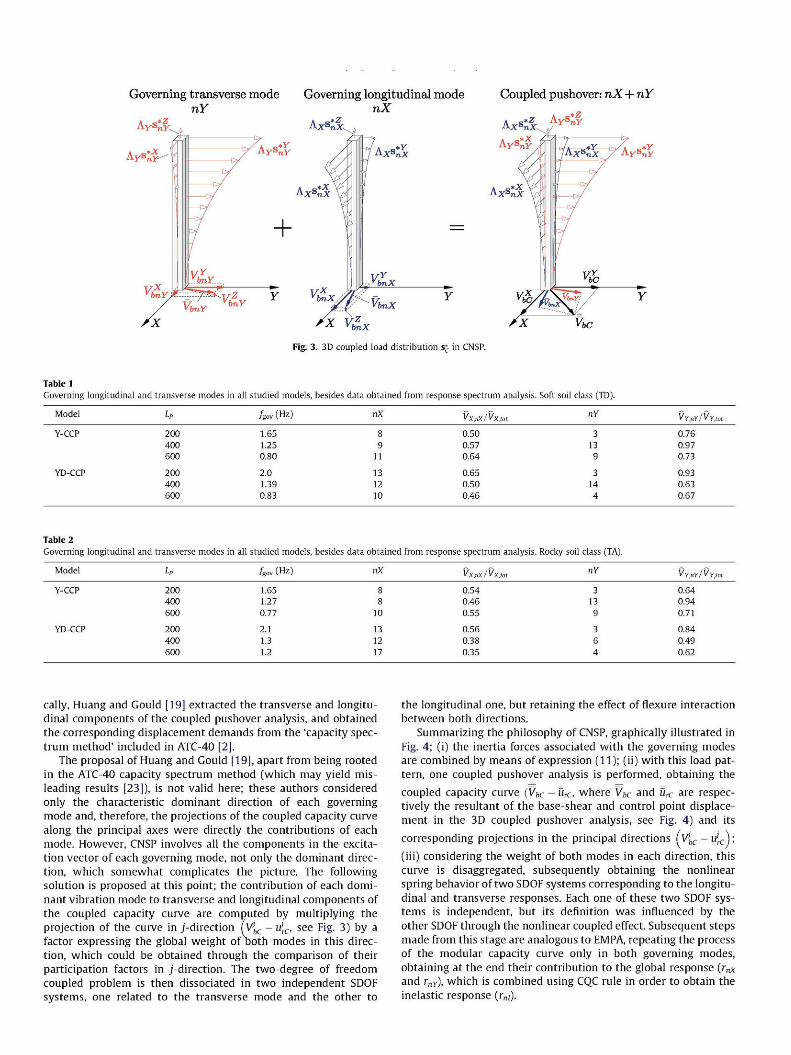
Like in other pushover strategies, first a modal analysis is carried out in order to select the governing modes, but now only these dominant modes are selected for the nonlinear static analysis; one in the transverse direction (0„y) and the other in the longitudinal one {4>nx\ as it is shown in Fig. 5. Once the governing modes have been selected, their load distribution is obtained separately, retaining its 3D nature as it is done in EMPA:
S*nY = TS\(j>nY; Six = m 0 n X (10)
In order to obtain the coupled response in longitudinal and transverse directions, a coupled load pattern (s'c) results from the algebraic weighted addition of both force distributions. These components are multiplied by the factor A, which takes into account the difference in the spectral accelerations associated with each governing mode [19]:
S*c = AYSlY + AxSlx (11)
where A' = Sa,/max(Sa1', Sax), with j =X, Y, whereas Sax and SaY are respectively the spectral accelerations associated with the governing longitudinal (nX) and transverse (nY) modes. Fig. 3 illustrates the excitation vectors of both modes, along with their algebraic combination, highlighting the 3D components of the load patterns in the governing modes ( s ^ and s*J
y, with j =X, Y,Z). An incremental static analysis of the structure subjected to the
coupled load pattern s'c is conducted, which implies that only one nonlinear static calculation is carried out in this coupled pushover analysis, whilst in MPA (and EMPA) such calculation needs to be repeated as many times as the number of modes below/gov (typically between 10 and 15 times in cable-stayed bridges, see Tables 1 and 2).
The coupled capacity curve resulting from CNSP (right part of Fig. 3) involves two vibration modes (i.e. two DOF). Unfortunately, pushover procedures presented so far deal only with one DOF. Several authors proposed solutions for coupled capacity curves; Lin and Tsai [18] suggested a three DOF system which inevitably increases the complexity of the pushover analysis; more practi-
Governing transverse mode Governing longitudinal mode nY nX
Coupled pushover: nX+ nY
*-YanY~
Ax<X
Ax*
A x < x
*Z AyS;f
Fig. 3. 3D coupled load distribution s'c in CNSP.
Table 1 Governing longitudinal and transverse modes in all studied models, besides data obtained from response spectrum analysis. Soft soil class (TD).
Model L, /gov (Hz) nX Vx,nx/Vx,tot nY Vy^y/Vytot
Y-CCP
YD-CCP
200 400 600
200 400 600
1.65 1.25 0.80
2.0 1.39 0.83
8 9 11
13 12 10
0.50 0.57 0.64
0.65 0.50 0.46
3 3 9
3 4 4
0.76 0.97 0.73
0.93 0.63 0.67
Table 2 Governing longitudinal and transverse modes in all studied models, besides data obtained from response spectrum analysis. Rocky soil class (TA).
Model L, /gov (Hz) nX Vx,nx/Vx,tot nY Vy,ny/Vy,m
Y-CCP
YD-CCP
200 400 600
200 400 600
1.65 1.27 0.77
2.1 1.3 1.2
8 8 10
13 12 17
0.54 0.46 0.55
0.56 0.38 0.35
3 3 9
3 6 4
0.64 0.94 0.71
0.84 0.49 0.62
cally, Huang and Gould [19] extracted the transverse and longitudinal components of the coupled pushover analysis, and obtained the corresponding displacement demands from the 'capacity spectrum method' included in ATC-40 [2],
The proposal of Huang and Gould [19], apart from being rooted in the ATC-40 capacity spectrum method (which may yield misleading results [23]), is not valid here; these authors considered only the characteristic dominant direction of each governing mode and, therefore, the projections of the coupled capacity curve along the principal axes were directly the contributions of each mode. However, CNSP involves all the components in the excitation vector of each governing mode, not only the dominant direction, which somewhat complicates the picture. The following solution is proposed at this point; the contribution of each dominant vibration mode to transverse and longitudinal components of the coupled capacity curve are computed by multiplying the projection of the curve in j-direction (v[c - \irC, see Fig. 3) by a factor expressing the global weight of both modes in this direction, which could be obtained through the comparison of their participation factors in j-direction. The two-degree of freedom coupled problem is then dissociated in two independent SDOF systems, one related to the transverse mode and the other to
the longitudinal one, but retaining the effect of flexure interaction between both directions.
Summarizing the philosophy of CNSP, graphically illustrated in Fig. 4; (i) the inertia forces associated with the governing modes are combined by means of expression (11); (ii) with this load pattern, one coupled pushover analysis is performed, obtaining the
coupled capacity curve {Vbc - 0rC, where Vbc and urC are respectively the resultant of the base-shear and control point displacement in the 3D coupled pushover analysis, see Fig. 4) and its
corresponding projections in the principal directions (v{c — ujc); (iii) considering the weight of both modes in each direction, this curve is disaggregated, subsequently obtaining the nonlinear spring behavior of two SDOF systems corresponding to the longitudinal and transverse responses. Each one of these two SDOF systems is independent, but its definition was influenced by the other SDOF through the nonlinear coupled effect. Subsequent steps made from this stage are analogous to EMPA, repeating the process of the modular capacity curve only in both governing modes, obtaining at the end their contribution to the global response (rnX
and rnY), which is combined using CQC rule in order to obtain the inelastic response (r„i).

SDOFnF-> rnY
Fig. 4. Summary of the CNSP philosophy.
25 Hz
Pushover Mode number; n
Fig. 5. Scheme of mode selection in the proposed CNSP (in this case nX > nY but it could be reversed).
Since expression (5) is employed beyond step (iii) in the preceding paragraph, CNSP also assumes that only the nth mode is excited when its corresponding component of the excitation vector (s*iig(t)) is imposed to the structure, which allows the independent definition of the longitudinal and transverse SDOF. However, in CNSP this assumption is made only for the two governing modes, whereas in MPA or EMPA it is repeated typically more than 10 times in cable-stayed bridges.
The participation in the response of any mode different from the governing ones, and below 25 Hz, is deemed to be elastic and response spectrum analysis is performed, obtaining the contribution of elastic modes to the global response (rei), see Fig. 5. Considering the effect of modes different than governing ones to be fully elastic falls on the safe side, since if this hypothesis is not true, and any other mode causes nonlinear excursions, its participation will be smaller than the corresponding elastic one considered in CNSP.
Finally, the combination of elastic and inelastic modal contributions is carried out with SRSS rule, hence considering both responses independent, which is questionable in some cases where governing periods are close to other modes judged elastic. This could be undoubtedly a source of errors but it has to be highlighted that less combinations between modal responses, sometimes inelastic and thus questionable, are needed in CNSP and the final goal of simplicity in pushover analysis should not be forgotten.
5. Proposed structures and seismic action
The aforementioned pushover procedures have been implemented in six cable-stayed bridges with central cable plane
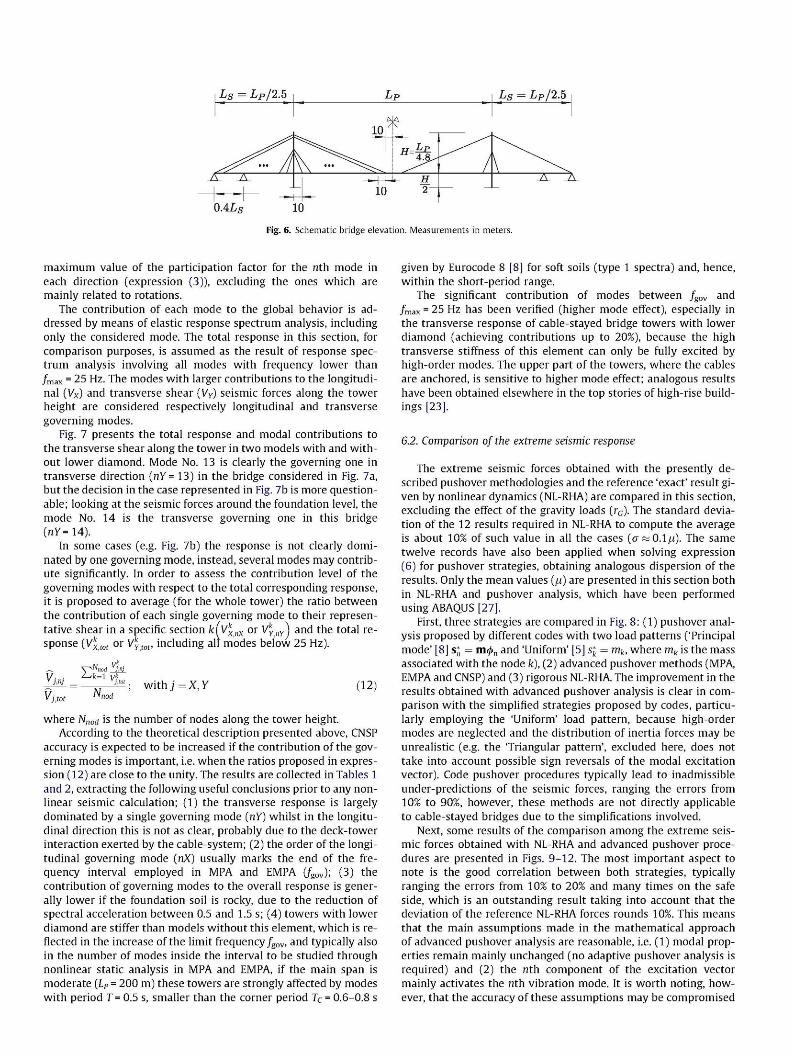
arrangement and two types of inverted 'Y'-shaped towers; with lower diamond (referred as 'YD-CCP') and without this element ('Y-CCP'). The foundation soil is soft (TD) or rocky (TA) [8]. The main spans considered are LP = 200, 400 and 600 m. A previous compilation of the dimensions of cable-stayed bridges built worldwide has led to the establishment of both sections and proportions, which completely define three dimensional finite element models with parameters in terms of the main span (LP). Fig. 6 illustrates the schematic elevation of the studied models. The tower inelastic response was simulated through a rigorous beam-type 'fiber-model' [24], both in NL-RHA and pushover strategies, defining at each node the position of each longitudinal rebar and concrete fiber. The hysteretic response of nonlinear SDOF systems in pushover analysis is represented by a combined linear isotropic/ kinematic hardening rule [22], whereas, in NL-RHA, the cyclic behavior of the section is directly given by the realistic constitutive material properties in each fiber. Cyclic stiffness degradation effects are not included.
The seismic action consists of two groups of twelve synthetic accelerograms, each obtained fitting its acceleration spectrum to the elastic design one proposed by Eurocode 8 (EC8) [8] for rocky soil (TA) and soft soil (TD), both considering type 1 spectrum and ground acceleration ag = 0.5 g (representative of highly seismic areas worldwide). Damping ratio is 4% in order to consider the reduced damping of cable-stayed bridges.
The minimum number of required records is usually three or four in seismic codes [25], but researchers agree that this limit is too low; a sensitivity analysis of the response of cable-stayed bridges under 24 synthetic signals has been performed here, concluding that the axial load along the towers is specially sensitive to the number of records studied, but the deviations are minimized and the solution is robust if the averaged response of 12 accelerograms is obtained. The total duration of the accelerograms is 20 s, and the strong pulse phase interval 4 s. The set of 12 records 3D applied have been generated with an ad hoc algorithm described elsewhere [26], satisfying Eurocode 8 provisions.
6. Discussion of the results
6.1. Selection of governing modes. Response spectrum analysis
The study about the contributions of each vibration mode to the global response, considering the specific seismic action applied, is a paramount stage prior to the pushover analysis. Before the identification of the governing modes, the characteristic dominant direction of each mode (DR) should be distinguished. It is proposed to assign DRn as the direction j (j = X, Y, Z) associated with the
Ls = Lp/2.5 Ls = Lp/2.5
Fig. 6. Schematic bridge elevation. Measurements in meters.
maximum value of the participation factor for the nth mode in each direction (expression (3)), excluding the ones which are mainly related to rotations.
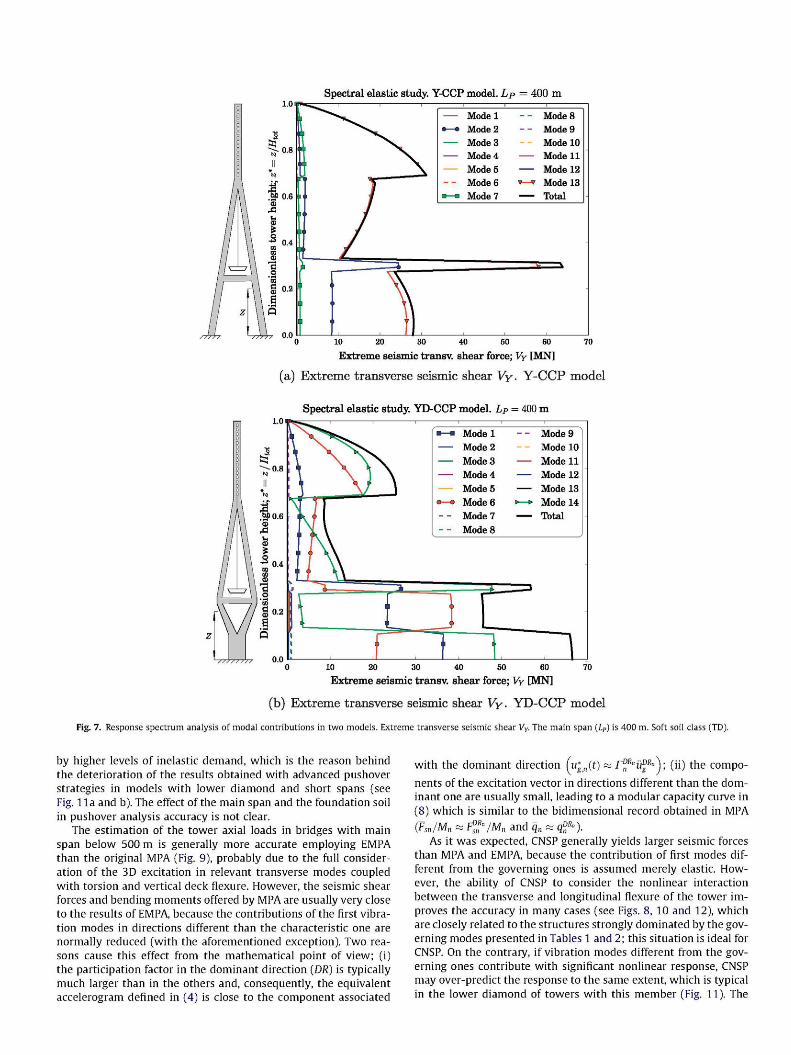
The contribution of each mode to the global behavior is addressed by means of elastic response spectrum analysis, including only the considered mode. The total response in this section, for comparison purposes, is assumed as the result of response spectrum analysis involving all modes with frequency lower than /max = 25 Hz. The modes with larger contributions to the longitudinal (Vx) and transverse shear (VV) seismic forces along the tower height are considered respectively longitudinal and transverse governing modes.
Fig. 7 presents the total response and modal contributions to the transverse shear along the tower in two models with and without lower diamond. Mode No. 13 is clearly the governing one in transverse direction (nY = 13) in the bridge considered in Fig. 7a, but the decision in the case represented in Fig. 7b is more questionable; looking at the seismic forces around the foundation level, the mode No. 14 is the transverse governing one in this bridge (ny=14).
In some cases (e.g. Fig. 7b) the response is not clearly dominated by one governing mode, instead, several modes may contribute significantly. In order to assess the contribution level of the governing modes with respect to the total corresponding response, it is proposed to average (for the whole tower) the ratio between the contribution of each single governing mode to their representative shear in a specific section k(vXnX or Vk
YnY j and the total response {Vk
xm or VYCM, including all modes below 25 Hz).
N„, with j =X, Y (12)
where Nnod is the number of nodes along the tower height. According to the theoretical description presented above, CNSP
accuracy is expected to be increased if the contribution of the governing modes is important, i.e. when the ratios proposed in expression (12) are close to the unity. The results are collected in Tables 1 and 2, extracting the following useful conclusions prior to any nonlinear seismic calculation; (1) the transverse response is largely dominated by a single governing mode (nY) whilst in the longitudinal direction this is not as clear, probably due to the deck-tower interaction exerted by the cable-system; (2) the order of the longitudinal governing mode (nX) usually marks the end of the frequency interval employed in MPA and EMPA (/gOV); (3) the contribution of governing modes to the overall response is generally lower if the foundation soil is rocky, due to the reduction of spectral acceleration between 0.5 and 1.5 s; (4) towers with lower diamond are stiffer than models without this element, which is reflected in the increase of the limit frequency /gov, and typically also in the number of modes inside the interval to be studied through nonlinear static analysis in MPA and EMPA, if the main span is moderate (LP = 200 m) these towers are strongly affected by modes with period T= 0.5 s, smaller than the corner period Tc = 0.6-0.8 s
given by Eurocode 8 [8] for soft soils (type 1 spectra) and, hence, within the short-period range.
The significant contribution of modes between /gov and /max = 25 Hz has been verified (higher mode effect), especially in the transverse response of cable-stayed bridge towers with lower diamond (achieving contributions up to 20%), because the high transverse stiffness of this element can only be fully excited by high-order modes. The upper part of the towers, where the cables are anchored, is sensitive to higher mode effect; analogous results have been obtained elsewhere in the top stories of high-rise buildings [23].
6.2. Comparison of the extreme seismic response
The extreme seismic forces obtained with the presently described pushover methodologies and the reference 'exact' result given by nonlinear dynamics (NL-RHA) are compared in this section, excluding the effect of the gravity loads (rG). The standard deviation of the 12 results required in NL-RHA to compute the average is about 10% of such value in all the cases (a a 0.1,u). The same twelve records have also been applied when solving expression (6) for pushover strategies, obtaining analogous dispersion of the results. Only the mean values (¡A) are presented in this section both in NL-RHA and pushover analysis, which have been performed using ABAQLIS [27].
First, three strategies are compared in Fig. 8: (1) pushover analysis proposed by different codes with two load patterns ('Principal mode' [8] s* = m0„ and 'Uniform' [5] s'k = mk, where mk is the mass associated with the node fe), (2) advanced pushover methods (MPA, EMPA and CNSP) and (3) rigorous NL-RHA. The improvement in the results obtained with advanced pushover analysis is clear in comparison with the simplified strategies proposed by codes, particularly employing the 'Uniform' load pattern, because high-order modes are neglected and the distribution of inertia forces may be unrealistic (e.g. the 'Triangular pattern', excluded here, does not take into account possible sign reversals of the modal excitation vector). Code pushover procedures typically lead to inadmissible under-predictions of the seismic forces, ranging the errors from 10% to 90%, however, these methods are not directly applicable to cable-stayed bridges due to the simplifications involved.
Next, some results of the comparison among the extreme seismic forces obtained with NL-RHA and advanced pushover procedures are presented in Figs. 9-12. The most important aspect to note is the good correlation between both strategies, typically ranging the errors from 10% to 20% and many times on the safe side, which is an outstanding result taking into account that the deviation of the reference NL-RHA forces rounds 10%. This means that the main assumptions made in the mathematical approach of advanced pushover analysis are reasonable, i.e. (1) modal properties remain mainly unchanged (no adaptive pushover analysis is required) and (2) the nth component of the excitation vector mainly activates the nth vibration mode. It is worth noting, however, that the accuracy of these assumptions may be compromised
Spectral elastic study. Y-CCP model. Lp = 400 m
Mode 1 •—• Mode 2
Mode 3 Mode 4
- Mode 5 - - Mode 6 • • Mode 7
- -- -
— — i — r
Mode 8 Mode 9 Mode 10 Mode 11 Mode 12 Mode 13 Total
10 2 0 3 0 4 0 SO 6 0 70
Extreme seismic transv. shear force; VY [MN]
(a) Extreme transverse seismic shear Vy. Y-CCP model
Spectral elastic study. YD-CCP model. LP = 400 m
— — — — •—• - -
Mode 1 Mode 2 Mode 3 Mode 4 Mode 5 Mode 6 Mode 7 Mode 8
- -
— — —
> — •
Mode 9 Mode 10 Mode 11 Mode 12 Mode 13 Mode 14 Total
10 20 30 40 50 60
Extreme seismic transv. shear force; Vy [MN]
(b) Extreme transverse seismic shear Vy- YD-CCP model Fig. 7. Response spectrum analysis of modal contributions in two models. Extreme transverse seismic shear VY. The main span (LP) is 400 m. Soft soil class (TD).
by higher levels of inelastic demand, which is the reason behind the deterioration of the results obtained with advanced pushover strategies in models with lower diamond and short spans (see Fig. 11a and b). The effect of the main span and the foundation soil in pushover analysis accuracy is not clear.
The estimation of the tower axial loads in bridges with main span below 500 m is generally more accurate employing EMPA than the original MPA (Fig. 9), probably due to the full consideration of the 3D excitation in relevant transverse modes coupled with torsion and vertical deck flexure. However, the seismic shear forces and bending moments offered by MPA are usually very close to the results of EMPA, because the contributions of the first vibration modes in directions different than the characteristic one are normally reduced (with the aforementioned exception). Two reasons cause this effect from the mathematical point of view; (i) the participation factor in the dominant direction (DR) is typically much larger than in the others and, consequently, the equivalent accelerogram defined in (4) is close to the component associated
with the dominant direction (u*n(t) R± r„ "ü°M; (ii) the components of the excitation vector in directions different than the dominant one are usually small, leading to a modular capacity curve in (8) which is similar to the bidimensional record obtained in MPA (Fsn/Mn « C/Mn and qn « < » ) .
As it was expected, CNSP generally yields larger seismic forces than MPA and EMPA, because the contribution of first modes different from the governing ones is assumed merely elastic. However, the ability of CNSP to consider the nonlinear interaction between the transverse and longitudinal flexure of the tower improves the accuracy in many cases (see Figs. 8, 10 and 12), which are closely related to the structures strongly dominated by the governing modes presented in Tables 1 and 2; this situation is ideal for CNSP. On the contrary, if vibration modes different from the governing ones contribute with significant nonlinear response, CNSP may over-predict the response to the same extent, which is typical in the lower diamond of towers with this member (Fig. 11). The

Soil type D. Y-CCP model. LP = 400 m
S 10 IS 20 25 30 35 40 45
Extreme seismic transv. shear force; Vy [MN]
Fig. 8. Extreme seismic transverse shear VY obtained with code pushover analysis, advanced pushover analysis (MPA EMPA, CNSP) and reference NL-RHA. Model 'Y-CCP' with main span LP = 400 m. Soft soil class (TD).
Soil type A. Y-CCP model .LP = 4 0 0 m * * > * 1 ^
^ ^ S f f t f r
-
1 1 1
o o MPA *—* CNSP EMPA — NL-RHA
t é *
\ o * \ x \ \ o -¿r \ \ \ \ O "¿r %1l \ \
-
\ \ t * _
i 1
i 1
: I 1
20 30 40
Extreme seismic axial load; N [MN] 50 60
Fig. 9. Extreme seismic axial load N along the height of the tower. Comparison between 'exact' NL-RHA and advanced pushover analysis (MPA, EMPA, CNSP). Model 'Y-CCP' with main span LP = 400 m. Rocky soil class (TA).
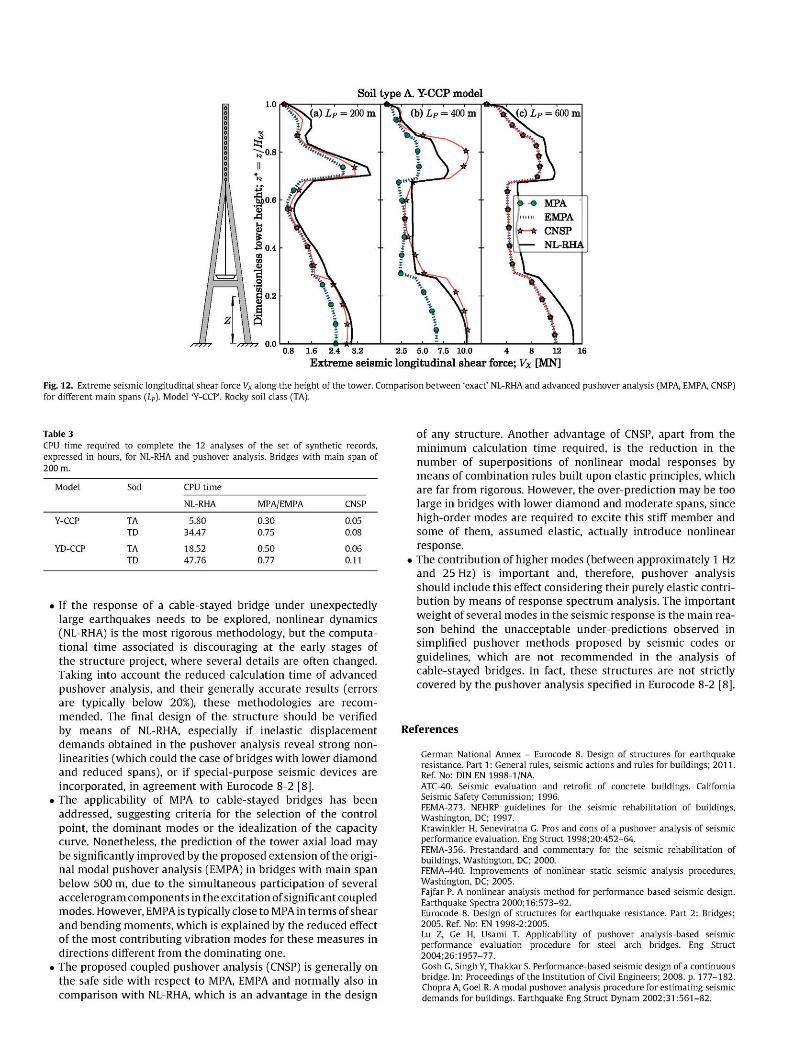
same phenomenon is behind the improved CNSP accuracy in the prediction of the forces associated with the transverse tower response (VY and JV), in comparison with the longitudinal one (Vx, which was expected from Section 6.1). Nonetheless, CNSP is usually better than MPA and EMPA predicting the longitudinal shear (see Fig. 12) and bending moment (Myy).
Dealing with the applicability of advanced pushover analysis more in depth, it should be remarked that these nonlinear static procedures are able to take into account the effect of seismic dissi-pative devices (e.g. yielding metallic dampers), since their contribution to the inelastic response is captured in the pushover analysis, and the hysteretic damping is included by means of the numerical integration of the equivalent SDOF in time-domain. However, they are not recommended when velocity-dependent devices are incorporated (e.g. viscous fluid dampers), since such effects are not covered in the static pushing of the structure. Currently there are
attempts in seismic guidelines (e.g. FEMA-356 [5]) in order to study structures with velocity-dependent dampers by means of static equivalent pushover analysis, but in a very simplistic manner.
6.3. Computational cost
Finally, the calculation time (CPU time) employed by both advanced pushover analysis and NL-RHA to complete the 12 analyses required to obtain the average response is presented in Table 3, using a standard computer which could be available in any engineering office (3 GB RAM, 2.40 GHz processor). NL-RHA employs a variable time step in the Hilber Hughes Taylor (HHT) algorithm [28] for implicit dynamics, which is reduced if the recorded damage increases [27] (minimum time step recorded 2.9E-5 s, maximum allowed 0.01 s). It is worth noting that no parallelization techniques have been employed when using NL-RHA, which could

Soil type D. Y-CCP model
(c) LP = 600 m
o o MPA EMPA CNSP NL-RHA
3 6 9 12 10 20 30 40 15 30 45 60
Extreme seismic transverse shear force; Vy [MN]
Fig. 10. Extreme seismic transverse shear force VY along the height of the tower. Comparison between 'exact' NL-RHA and advanced pushover analysis (MPA, EMPA, CNSP) for different main spans (LP). Model 'Y-CCP'. Soft soil class (TD).
Sou type D. YD-CCP model
4 8 12 16 20 40 60 20 40 60
Extreme seismic transverse shear force; Vy [MN]
Fig. 11. Extreme seismic transverse shear force VY along the height of the tower. Comparison between 'exact' NL-RHA and advanced pushover analysis (MPA, EMPA, CNSP) for different main spans (LP). Model 'YD-CCP'. Soft soil class (TD).
reduce the large computational cost observed. Values are qualitative since they depend on the software, furthermore, part of the CPU time is independent of the analysis method.
The reduction in the required CPU time using pushover analysis is dramatic, whilst the results are generally precise with the aforementioned exceptions. As long as the inelastic demand is larger in the towers (i.e. for soft soils or lower diamond configurations [26]), the CPU time is larger, but advanced pushover strategies are less influenced since the capacity curves always reach the collapse, regardless of the seismic intensity. The reduction of the CPU time in CNSP is remarkable, since it only performs one nonlinear static analysis, whereas MPA and EMPA need to repeat this process (which is sometimes demanding) for all the modes below the maximum governing frequency /gov, requiring between 8 and 17 static analyses (see Tables 1 and 2) performed consecutively, leading to CPU times around 6-9 times higher.
7. Conclusions
The contribution of this work in advanced pushover analysis is three-fold: (i) the broadly accepted modal pushover analysis (MPA) [11] in building structures is adapted to three-axially excited cable-stayed bridges, (ii) an extension of MPA, referred as EMPA, is suggested to fully consider the three-dimensional effects of the vibration modes and the seismic excitation, and (iii) a procedure named CNSP is proposed in order to take into account the nonlinear coupling between governing longitudinal and transverse modes. The mathematical background of the advanced pushover procedures proposed in this work has been presented with generality and, hence, they could be applied to any structure, either bridge or building. The following conclusions are drawn from this study about 3D pushover procedures in large cable-stayed bridges:
Soil type A. Y-CCP model
1.6 2.4 3.2 2.5 5.0 7.5 10.0 4 8 12 E x t r e m e se i smic longi tudinal s h e a r force; Vx [MN]
Fig. 12. Extreme seismic longitudinal shear force Vx along the height of the tower. Comparison between 'exact' NL-RHA and advanced pushover analysis (MPA, EMPA, CNSP) for different main spans (LP). Model 'Y-CCP'. Rocky soil class (TA).
Table 3 CPU time required to complete the 12 analyses of the set of synthetic records, expressed in hours, for NL-RHA and pushover analysis. Bridges with main span of 200 m.
Model
Y-CCP
YD-CCP
Soil
TA TD
TA TD
CPU time
NL-RHA
5.80 34.47
18.52 47.76
MPA/EMPA
0.30 0.75
0.50 0.77
CNSP
0.05 0.08
0.06 0.11
If the response of a cable-stayed bridge under unexpectedly large earthquakes needs to be explored, nonlinear dynamics (NL-RHA) is the most rigorous methodology, but the computational time associated is discouraging at the early stages of the structure project, where several details are often changed. Taking into account the reduced calculation time of advanced pushover analysis, and their generally accurate results (errors are typically below 20%), these methodologies are recommended. The final design of the structure should be verified by means of NL-RHA, especially if inelastic displacement demands obtained in the pushover analysis reveal strong non-linearities (which could the case of bridges with lower diamond and reduced spans), or if special-purpose seismic devices are incorporated, in agreement with Eurocode 8-2 [8], The applicability of MPA to cable-stayed bridges has been addressed, suggesting criteria for the selection of the control point, the dominant modes or the idealization of the capacity curve. Nonetheless, the prediction of the tower axial load may be significantly improved by the proposed extension of the original modal pushover analysis (EMPA) in bridges with main span below 500 m, due to the simultaneous participation of several accelerogram components in the excitation of significant coupled modes. However, EMPA is typically close to MPA in terms of shear and bending moments, which is explained by the reduced effect of the most contributing vibration modes for these measures in directions different from the dominating one. The proposed coupled pushover analysis (CNSP) is generally on the safe side with respect to MPA, EMPA and normally also in comparison with NL-RHA, which is an advantage in the design
of any structure. Another advantage of CNSP, apart from the minimum calculation time required, is the reduction in the number of superpositions of nonlinear modal responses by means of combination rules built upon elastic principles, which are far from rigorous. However, the over-prediction may be too large in bridges with lower diamond and moderate spans, since high-order modes are required to excite this stiff member and some of them, assumed elastic, actually introduce nonlinear response. The contribution of higher modes (between approximately 1 Hz and 25 Hz) is important and, therefore, pushover analysis should include this effect considering their purely elastic contribution by means of response spectrum analysis. The important weight of several modes in the seismic response is the main reason behind the unacceptable under-predictions observed in simplified pushover methods proposed by seismic codes or guidelines, which are not recommended in the analysis of cable-stayed bridges. In fact, these structures are not strictly covered by the pushover analysis specified in Eurocode 8-2 [8],
References
German National Annex - Eurocode 8. Design of structures for earthquake resistance. Part 1: General rules, seismic actions and rules for buildings; 2011. Ref. No: DIN EN 1998-1/NA. ATC-40. Seismic evaluation and retrofit of concrete buildings. California Seismic Safety Commission; 1996. FEMA-273. NEHRP guidelines for the seismic rehabilitation of buildings, Washington, DC; 1997. Krawinkler H, Seneviratna G. Pros and cons of a pushover analysis of seismic performance evaluation. Eng Struct 1998;20:452-64. FEMA-356. Prestandard and commentary for the seismic rehabilitation of buildings, Washington, DC; 2000. FEMA-440. Improvements of nonlinear static seismic analysis procedures, Washington, DC; 2005. Fajfar P. A nonlinear analysis method for performance based seismic design. Earthquake Spectra 2000;16:573-92. Eurocode 8. Design of structures for earthquake resistance. Part 2: Bridges; 2005. Ref. No: EN 1998-2:2005. Lu Z, Ge H, Usami T. Applicability of pushover analysis-based seismic performance evaluation procedure for steel arch bridges. Eng Struct 2004;26:1957-77. Gosh G, Singh Y, Thakkar S. Performance-based seismic design of a continuous bridge. In: Proceedings of the Institution of Civil Engineers; 2008. p. 177-182. Chopra A, Goel R. A modal pushover analysis procedure for estimating seismic demands for buildings. Earthquake Eng Struct Dynam 2002;31:561-82.
Chopra A, Goel R, Chintanapakdee C. Evaluation of a modified mpa procedure assuming higher modes as elastic to estimate seismic demands. Earthquake Spectra 2004;20:757-78. Ferracuti B, Pinho R, Savoia M, Francia R. Verification of displacement-based adaptive pushover through multi-ground motion incremental dynamic analysis. Eng Struct 2009;31:1789-99. Gupta B, Kunnath S. Adaptive spectra-based pushover procedure for seismic evaluation of structures. Earthquake Spectra 2000;16(2):367-91. Antoniou S, Pinho R. Development and verification of a displacement-based adaptive pushover procedure. J Earthquake Eng 2004;8(5):643-61. Papanikolaou V, Elnashai A, Pareja J. Limits of applicability of conventional and adaptive pushover analysis for seismic response assessment. Technical report. Mid-America Earthquake (MAE) Center; 2005. Abdel-Ghaffar A. Cable-stayed bridges under seismic action. In: Cable-stayed Bridges; Recent Developments and their Future. Yokohama (Japan): Elsevier Science Ltd.; 1991. p. 171-92. Lin J, Tsai K. Seismic analysis of two-way asymmetric building systems under bi-directional seismic ground motions. Earthquake Eng Struct Dynam 2008;37:305-28. Huang W, Gould P. 3-D pushover analysis of a collapsed reinforced concrete chimney. Finite Elem Anal Des 2007;43:879-87.
Shattarat N, Symans M, McLean D, Cofer W. Evaluation of nonlinear static analysis methods and software tools for seismic analysis of highway bridges. Eng Struct 2008;30:1335-45. Paraskeva T, Kappos A, Sextos A. Extension of modal pushover analysis to seismic assessment of bridges. Earthquake Eng Struct Dynam 2006;35:1269-93. Simo J, Hughes T. Computational inelasticity. Stanford (USA): Springer; 1998. Chopra A. Dynamics of structures, theory and applications to earthquake engineering. 3rd ed. Berkeley: Prentice Hall, University of California; 2007. Légeron F, Paultre P, Mazars J. Damage mechanics modelling of nonlinear seismic behavior of concrete structures. J Struct Eng 2005;131:946-55. Bommer J, Ruggeri C. The specification of acceleration time-histories in seismic design codes. Eur Earthquake Eng 2002;16:3-17. Cámara A, Astiz M. Typological study of the elastic seismic behaviour of cable-stayed bridges. In: Proceedings of the eighth European conference on structural dynamics, Leuven, Belgium; 2011. ABAQUS. Finite element analysis program. Version 6.10. Providence, USA; 2010. Hilber H, Hughes T, Taylor R. Improved numerical dissipation of time integration algorithms in structural dynamics. Earthquake Eng Struct Dynam 1977;5:283-92.