Embed Size (px)
Citation preview
Pune Towards Smart City
CONTENT
▪ Score Card & Precondition Documents
▪ PMC’s Budget
– Fiscal Capacity
– Technical & Administrative Capacity
▪ Pune City’s Vision (version 1.0)
▪ Citizen Participation Framework
▪ PMC’s Initiatives towards Smart Cities Mission
Challenge - 1
SCORE CARD & PRECONDITION DOCUMENTS
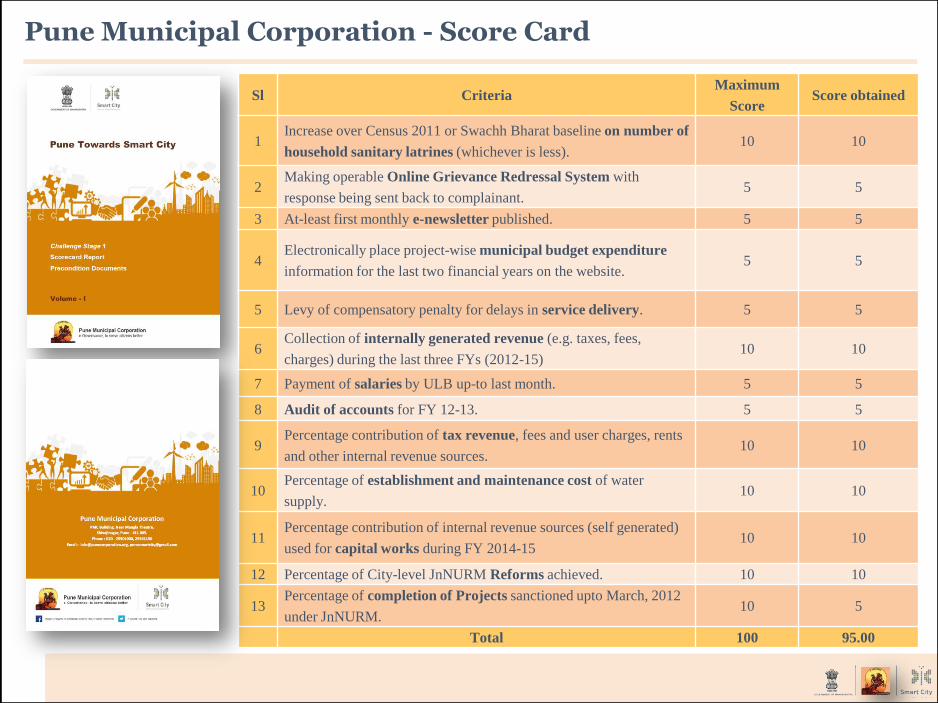
Pune Municipal Corporation - Score Card
Sl Criteria Maximum
Score Score obtained
1 Increase over Census 2011 or Swachh Bharat baseline on number of
household sanitary latrines (whichever is less). 10 10
2 Making operable Online Grievance Redressal System with
response being sent back to complainant. 5 5
3 At-least first monthly e-newsletter published. 5 5
4 Electronically place project-wise municipal budget expenditure
information for the last two financial years on the website. 5 5
5 Levy of compensatory penalty for delays in service delivery. 5 5
6 Collection of internally generated revenue (e.g. taxes, fees,
charges) during the last three FYs (2012-15) 10 10
7 Payment of salaries by ULB up-to last month. 5 5
8 Audit of accounts for FY 12-13. 5 5
9 Percentage contribution of tax revenue, fees and user charges, rents
and other internal revenue sources. 10 10
10 Percentage of establishment and maintenance cost of water
supply. 10 10
11 Percentage contribution of internal revenue sources (self generated)
used for capital works during FY 2014-15 10 10
12 Percentage of City-level JnNURM Reforms achieved. 10 10
13 Percentage of completion of Projects sanctioned upto March, 2012
under JnNURM. 10 5
Total 100 95.00
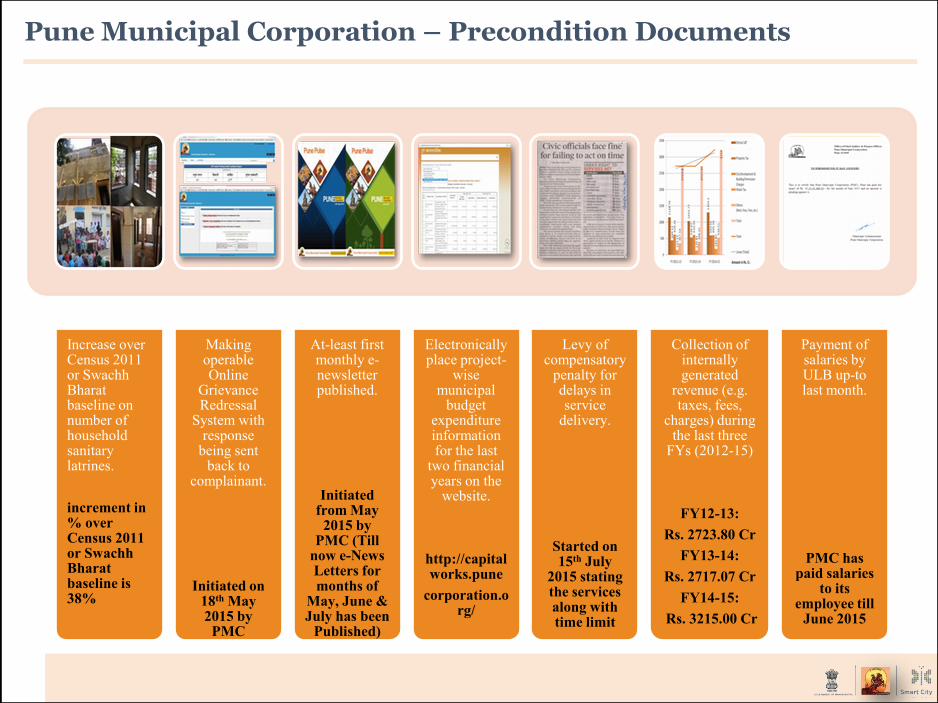
Increase over Census 2011 or Swachh Bharat baseline on number of household sanitary latrines.
increment in % over Census 2011 or Swachh Bharat baseline is 38%
Making operable Online
Grievance Redressal
System with response
being sent back to
complainant.
Initiated on 18th May 2015 by
PMC
At-least first monthly e-newsletter published.
Initiated from May
2015 by PMC (Till
now e-News Letters for months of
May, June & July has been
Published)
Electronically place project-
wise municipal
budget expenditure information for the last
two financial years on the
website.
http://capitalworks.pune
corporation.org/
Levy of compensatory
penalty for delays in service
delivery.
Started on 15th July
2015 stating the services along with time limit
Collection of internally generated
revenue (e.g. taxes, fees,
charges) during the last three
FYs (2012-15)
FY12-13:
Rs. 2723.80 Cr
FY13-14:
Rs. 2717.07 Cr
FY14-15:
Rs. 3215.00 Cr
Payment of salaries by ULB up-to last month.
PMC has paid salaries
to its employee till
June 2015
Pune Municipal Corporation – Precondition Documents
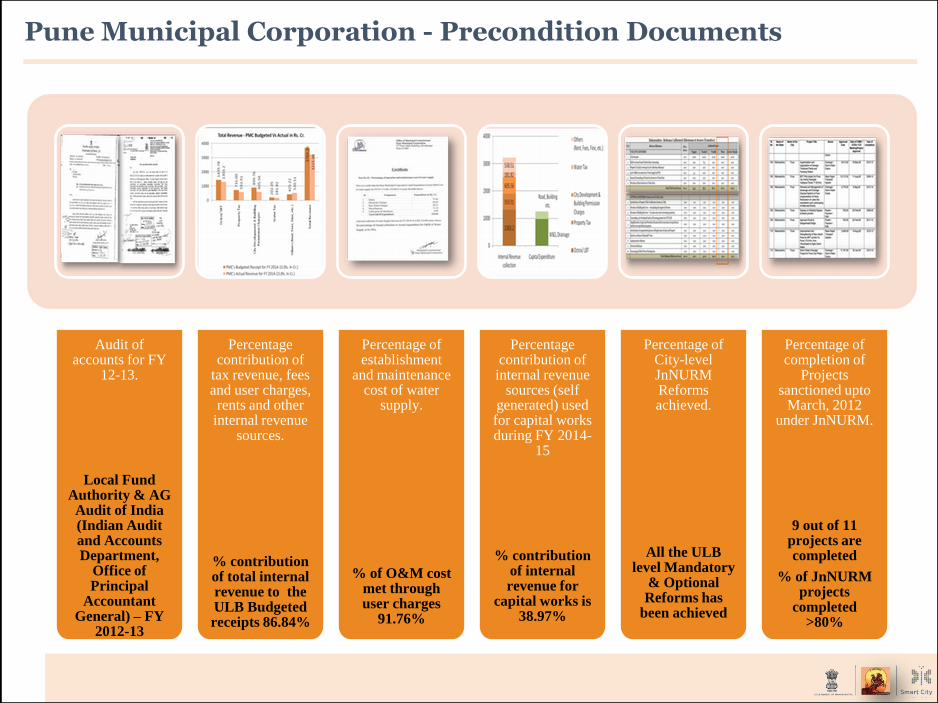
Audit of accounts for FY
12-13.
Local Fund Authority & AG Audit of India (Indian Audit and Accounts Department,
Office of Principal
Accountant General) – FY
2012-13
Percentage contribution of
tax revenue, fees and user charges, rents and other
internal revenue sources.
% contribution of total internal revenue to the ULB Budgeted receipts 86.84%
Percentage of establishment
and maintenance cost of water
supply.
% of O&M cost met through user charges
91.76%
Percentage contribution of
internal revenue sources (self
generated) used for capital works during FY 2014-
15
% contribution of internal revenue for
capital works is 38.97%
Percentage of City-level JnNURM Reforms achieved.
All the ULB level Mandatory
& Optional Reforms has
been achieved
Percentage of completion of
Projects sanctioned upto
March, 2012 under JnNURM.
9 out of 11 projects are completed
% of JnNURM projects
completed >80%
Pune Municipal Corporation - Precondition Documents
PMC’s FISCAL, TECHNICAL & ADMINISTRATIVE CAPACITY
PMC’s Budget – Fiscal Capacity
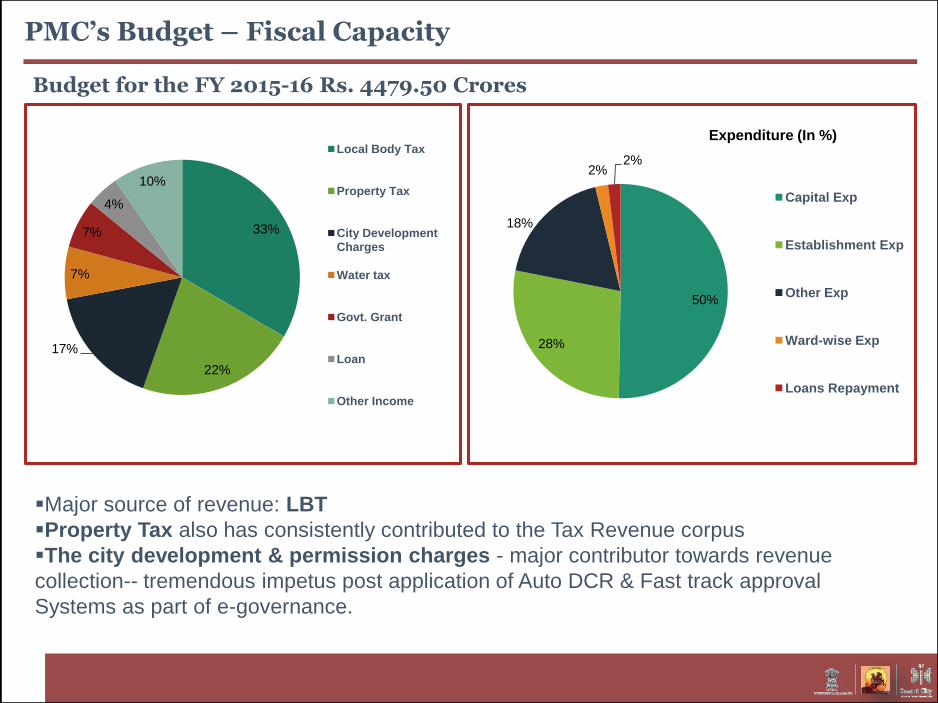
Budget for the FY 2015-16 Rs. 4479.50 Crores
Major source of revenue: LBT
Property Tax also has consistently contributed to the Tax Revenue corpus
The city development & permission charges - major contributor towards revenue
collection-- tremendous impetus post application of Auto DCR & Fast track approval
Systems as part of e-governance.
50%
28%
18%
2% 2%
Capital Exp
Establishment Exp
Other Exp
Ward-wise Exp
Loans Repayment
Expenditure (In %)
33%
22%
17%
7%
7%
4%
10%
Local Body Tax
Property Tax
City Development Charges
Water tax
Govt. Grant
Loan
Other Income
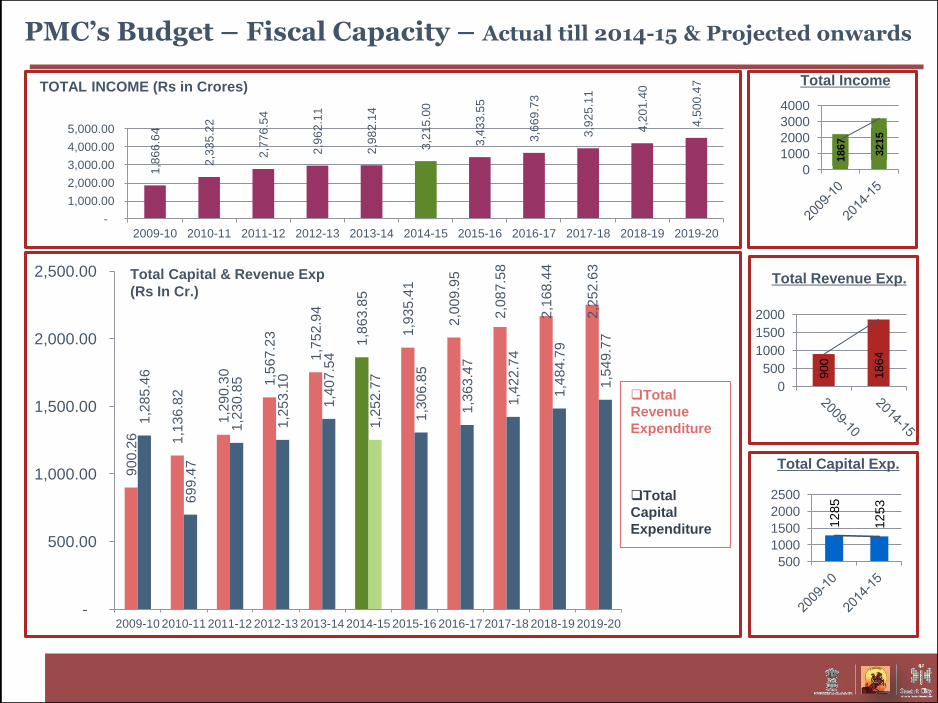
PMC’s Budget – Fiscal Capacity – Actual till 2014-15 & Projected onwards
1,8
66
.64
2,3
35
.22
2,7
76
.54
2,9
62
.11
2,9
82
.14
3,2
15
.00
3,4
33
.55
3,6
69
.73
3,9
25
.11
4,2
01
.40
4,5
00
.47
-
1,000.00
2,000.00
3,000.00
4,000.00
5,000.00
2009-10 2010-11 2011-12 2012-13 2013-14 2014-15 2015-16 2016-17 2017-18 2018-19 2019-20
TOTAL INCOME (Rs in Crores) Total Income
90
0.2
6
1,1
36
.82
1,2
90
.30
1,5
67
.23
1,7
52
.94
1,8
63
.85
1,9
35
.41
2,0
09
.95
2,0
87
.58
2,1
68
.44
2,2
52
.63
1,2
85
.46
69
9.4
7
1,2
30
.85
1,2
53
.10
1,4
07.5
4
1,2
52
.77
1,3
06
.85
1,3
63
.47
1,4
22
.74
1,4
84.7
9
1,5
49
.77
-
500.00
1,000.00
1,500.00
2,000.00
2,500.00
2009-10 2010-11 2011-12 2012-13 2013-14 2014-15 2015-16 2016-17 2017-18 2018-19 2019-20
Total Capital & Revenue Exp
(Rs In Cr.)
Total
Revenue
Expenditure
Total
Capital
Expenditure 1285
1253
500
1000
1500
2000
2500
900
1864
0
500
1000
1500
2000
Total Revenue Exp.
1867
3215
0
1000
2000
3000
4000
Total Capital Exp.
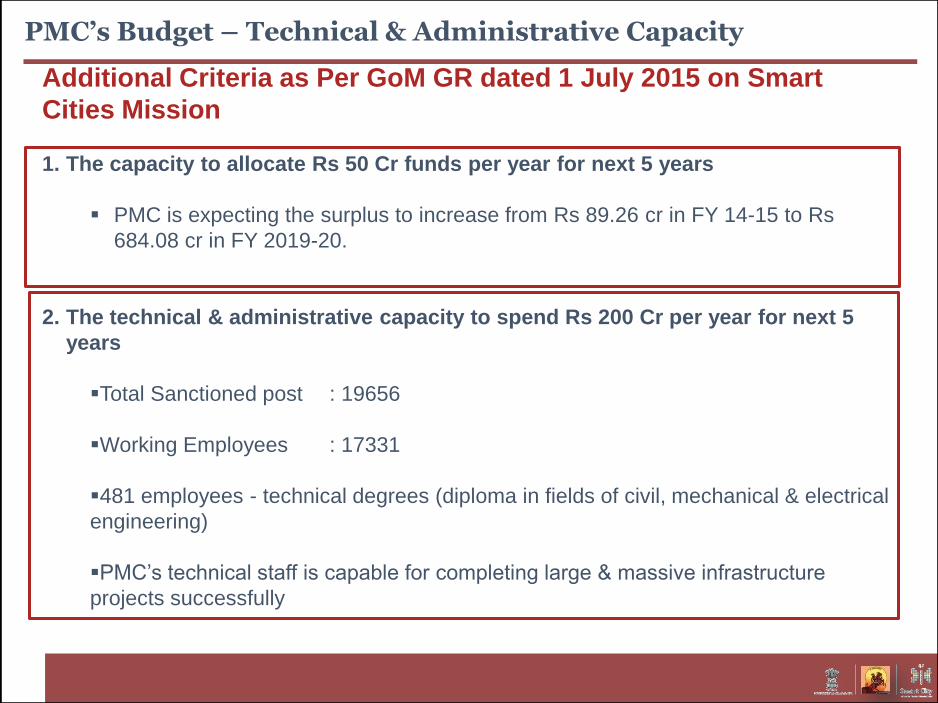
PMC’s Budget – Technical & Administrative Capacity
Additional Criteria as Per GoM GR dated 1 July 2015 on Smart
Cities Mission
1. The capacity to allocate Rs 50 Cr funds per year for next 5 years
PMC is expecting the surplus to increase from Rs 89.26 cr in FY 14-15 to Rs
684.08 cr in FY 2019-20.
2. The technical & administrative capacity to spend Rs 200 Cr per year for next 5
years
Total Sanctioned post : 19656
Working Employees : 17331
481 employees - technical degrees (diploma in fields of civil, mechanical & electrical
engineering)
PMC’s technical staff is capable for completing large & massive infrastructure
projects successfully
PUNE CITY’S VISION (VERSION 1.0)
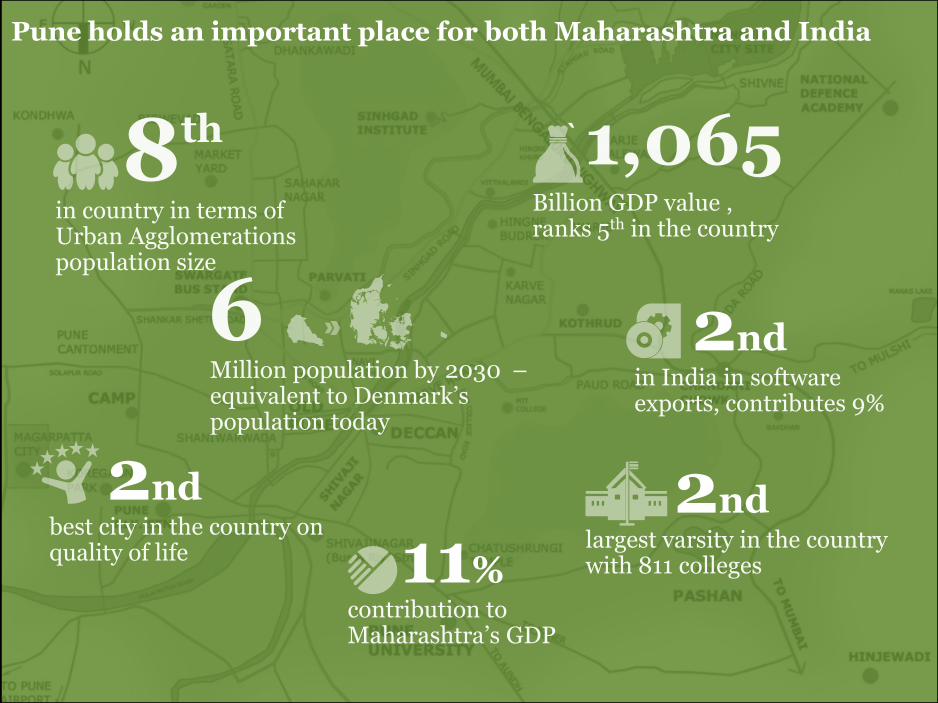
Pune holds an important place for both Maharashtra and India
2nd
2nd 2nd
11%
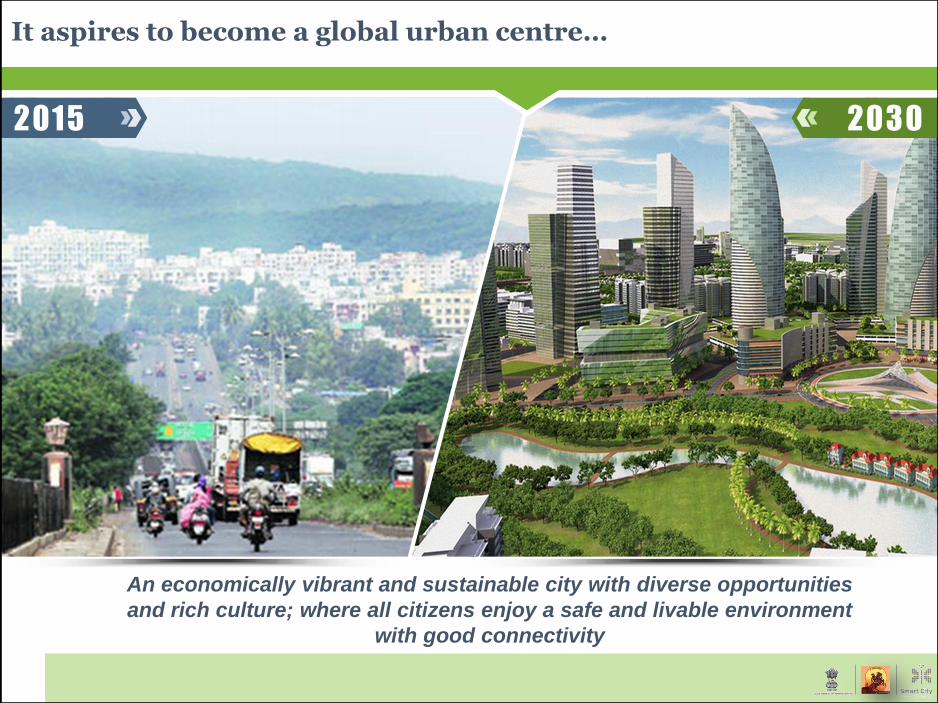
It aspires to become a global urban centre…
2015
An economically vibrant and sustainable city with diverse opportunities
and rich culture; where all citizens enjoy a safe and livable environment
with good connectivity
2030
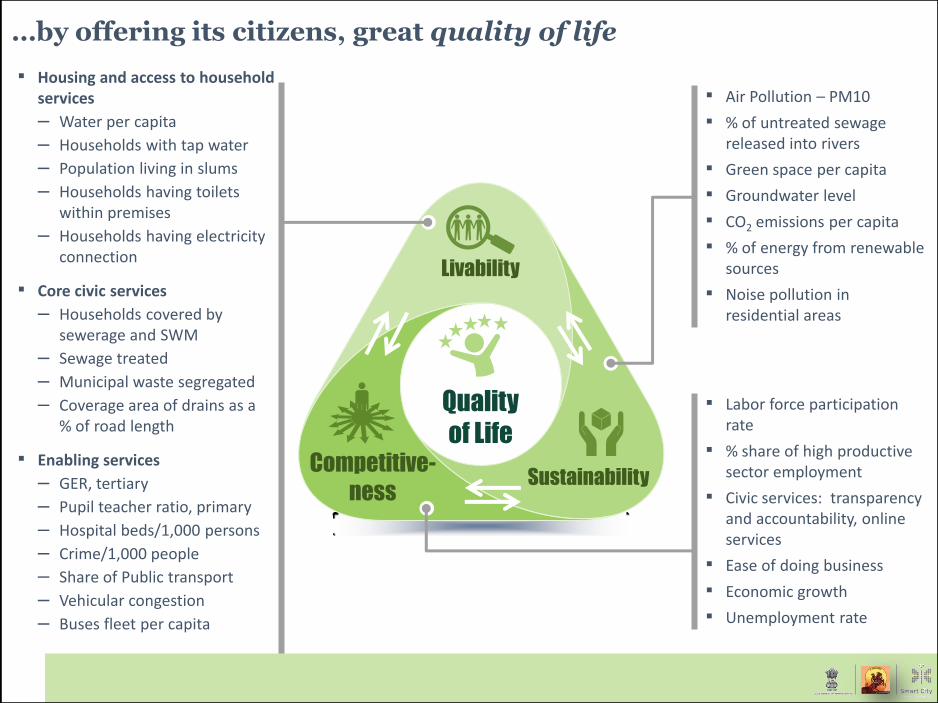
…by offering its citizens, great quality of life
Livability
Sustainability Competitive-
ness
Quality
of Life
▪ Housing and access to household services
– Water per capita
– Households with tap water
– Population living in slums
– Households having toilets within premises
– Households having electricity connection
▪ Core civic services
– Households covered by sewerage and SWM
– Sewage treated
– Municipal waste segregated
– Coverage area of drains as a % of road length
▪ Enabling services
– GER, tertiary
– Pupil teacher ratio, primary
– Hospital beds/1,000 persons
– Crime/1,000 people
– Share of Public transport
– Vehicular congestion
– Buses fleet per capita
▪ Labor force participation rate
▪ % share of high productive sector employment
▪ Civic services: transparency and accountability, online services
▪ Ease of doing business
▪ Economic growth
▪ Unemployment rate
▪ Air Pollution – PM10
▪ % of untreated sewage released into rivers
▪ Green space per capita
▪ Groundwater level
▪ CO2 emissions per capita
▪ % of energy from renewable sources
▪ Noise pollution in residential areas
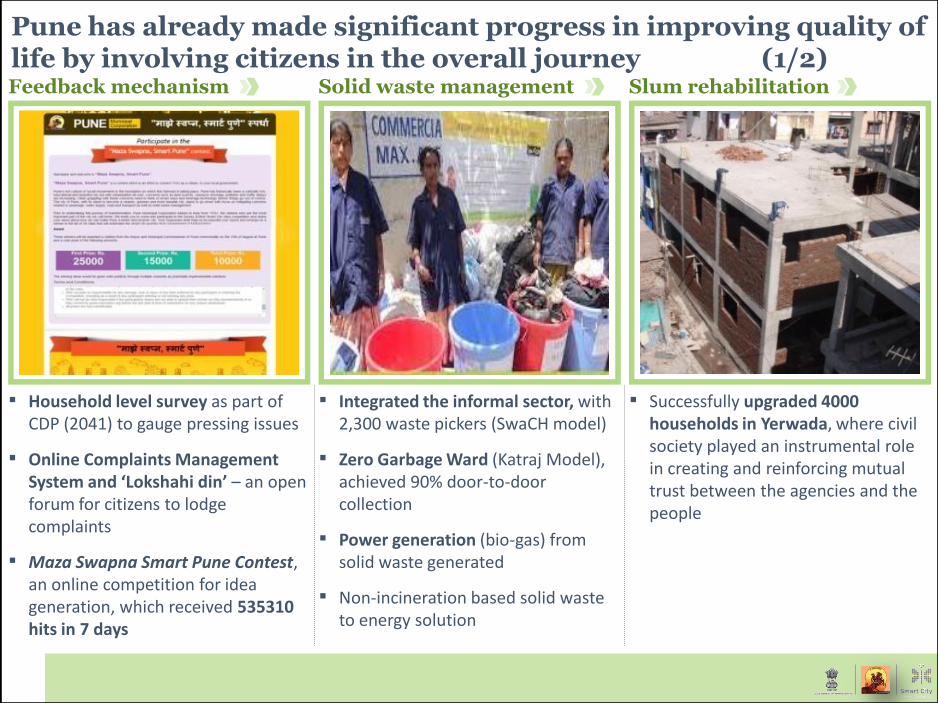
Pune has already made significant progress in improving quality of life by involving citizens in the overall journey (1/2)
▪ Household level survey as part of CDP (2041) to gauge pressing issues
▪ Online Complaints Management System and ‘Lokshahi din’ – an open forum for citizens to lodge complaints
▪ Maza Swapna Smart Pune Contest, an online competition for idea generation, which received 535310 hits in 7 days
▪ Integrated the informal sector, with 2,300 waste pickers (SwaCH model)
▪ Zero Garbage Ward (Katraj Model), achieved 90% door-to-door collection
▪ Power generation (bio-gas) from solid waste generated
▪ Non-incineration based solid waste to energy solution
▪ Successfully upgraded 4000 households in Yerwada, where civil society played an instrumental role in creating and reinforcing mutual trust between the agencies and the people
Feedback mechanism Solid waste management Slum rehabilitation
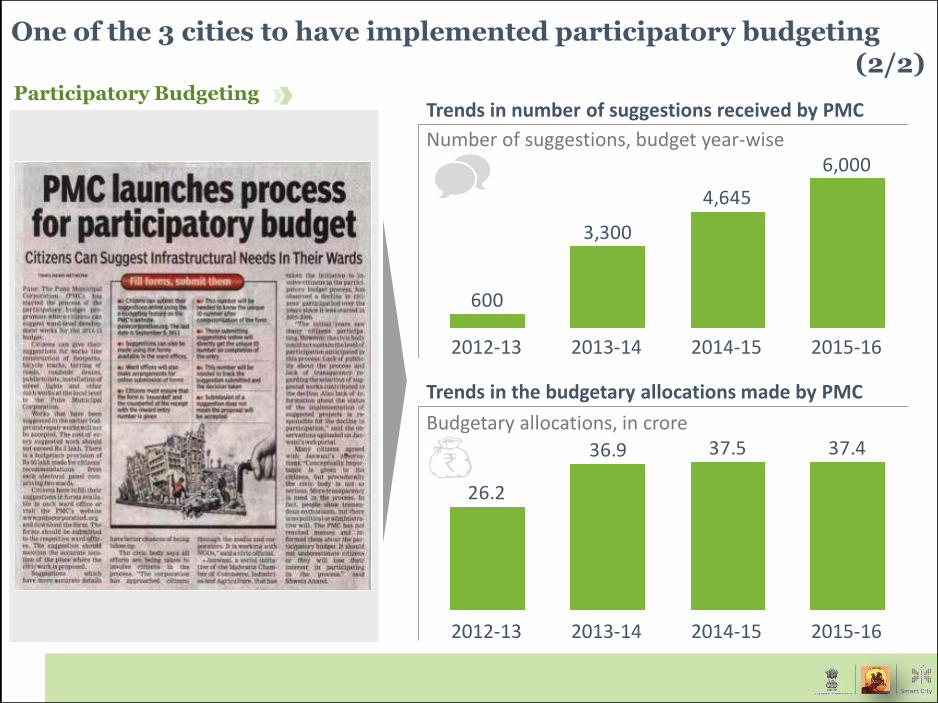
Number of suggestions, budget year-wise
Trends in the budgetary allocations made by PMC
Budgetary allocations, in crore
6,000
4,645
3,300
600
37.437.536.9
26.2
Trends in number of suggestions received by PMC
2012-13 2013-14 2014-15 2015-16
2012-13 2013-14 2014-15 2015-16
One of the 3 cities to have implemented participatory budgeting (2/2) Participatory Budgeting
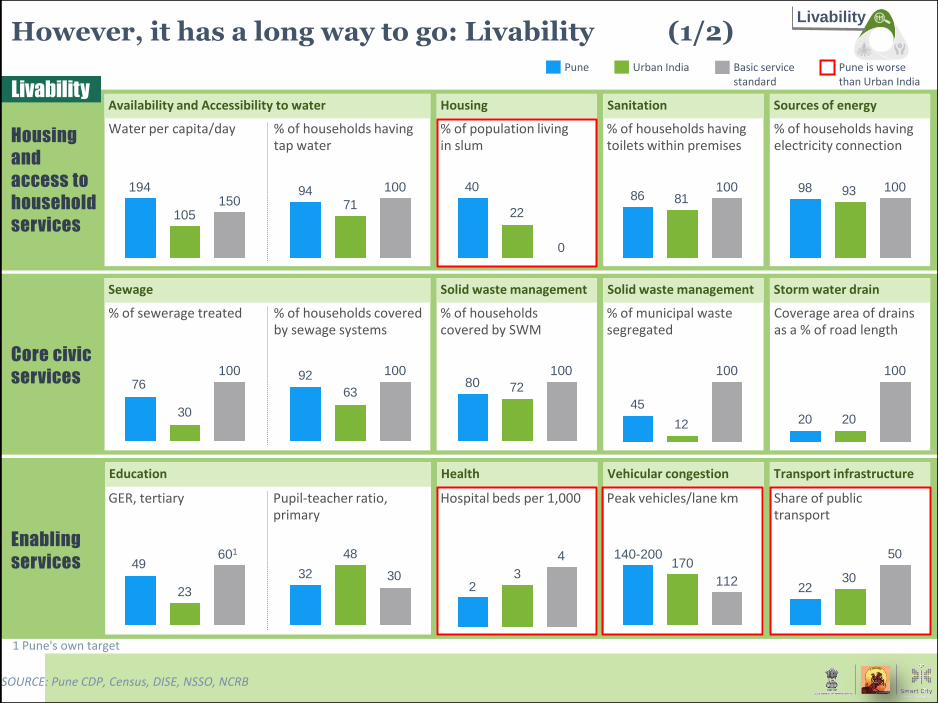
However, it has a long way to go: Livability (1/2)
SOURCE: Pune CDP, Census, DISE, NSSO, NCRB
Basic service standard
Core civic
services
Enabling
services
Housing
and
access to
household
services
1 Pune's own target
Pune is worse than Urban India
Livability Availability and Accessibility to water Housing Sanitation Sources of energy
Sewage
Health Education Vehicular congestion Transport infrastructure
Solid waste management Solid waste management Storm water drain
Water per capita/day % of households having tap water
% of population living in slum
% of households having toilets within premises
% of households having electricity connection
% of households covered by sewage systems
% of sewerage treated % of households covered by SWM
% of municipal waste segregated
Coverage area of drains as a % of road length
GER, tertiary Hospital beds per 1,000 Pupil-teacher ratio, primary
Peak vehicles/lane km Share of public transport
194 150
105 71
94 100
0
22
408186
100 9398 100
63
92 100
30
76100
72
100 80
12
45
100
2020
100
4
3223
49601
30
48
32112
170 140-200 50
3022
Pune Urban India
Livability
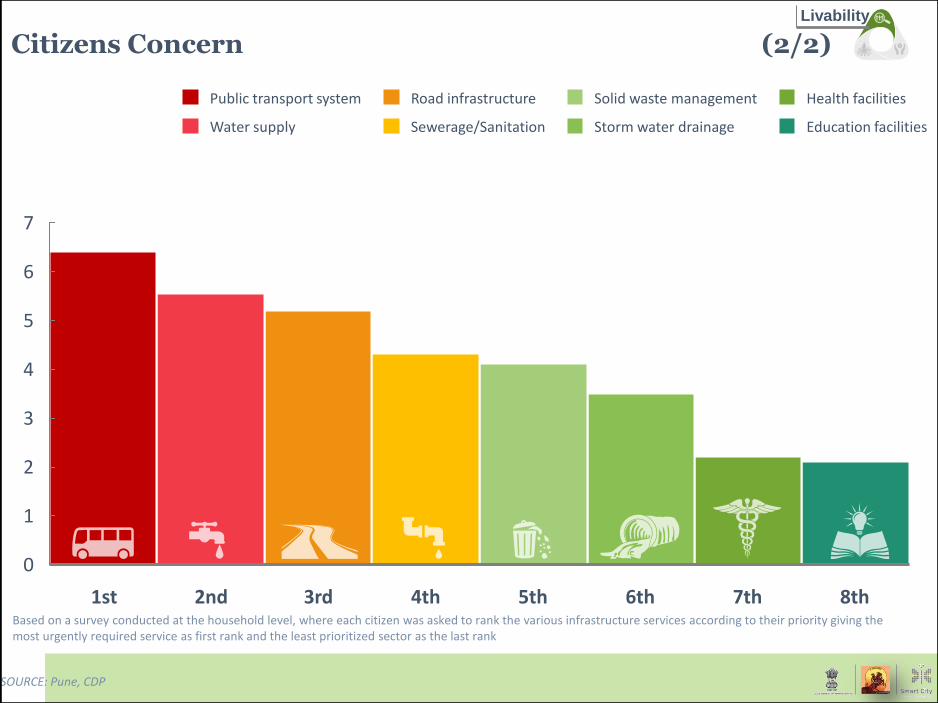
Citizens Concern (2/2)
SOURCE: Pune, CDP
0
1
2
3
4
5
6
7
8th 6th 4th 7th 5th 2nd 3rd 1st
Water supply Storm water drainage
Public transport system
Education facilities
Health facilities Road infrastructure
Sewerage/Sanitation
Solid waste management
Based on a survey conducted at the household level, where each citizen was asked to rank the various infrastructure services according to their priority giving the most urgently required service as first rank and the least prioritized sector as the last rank
Livability
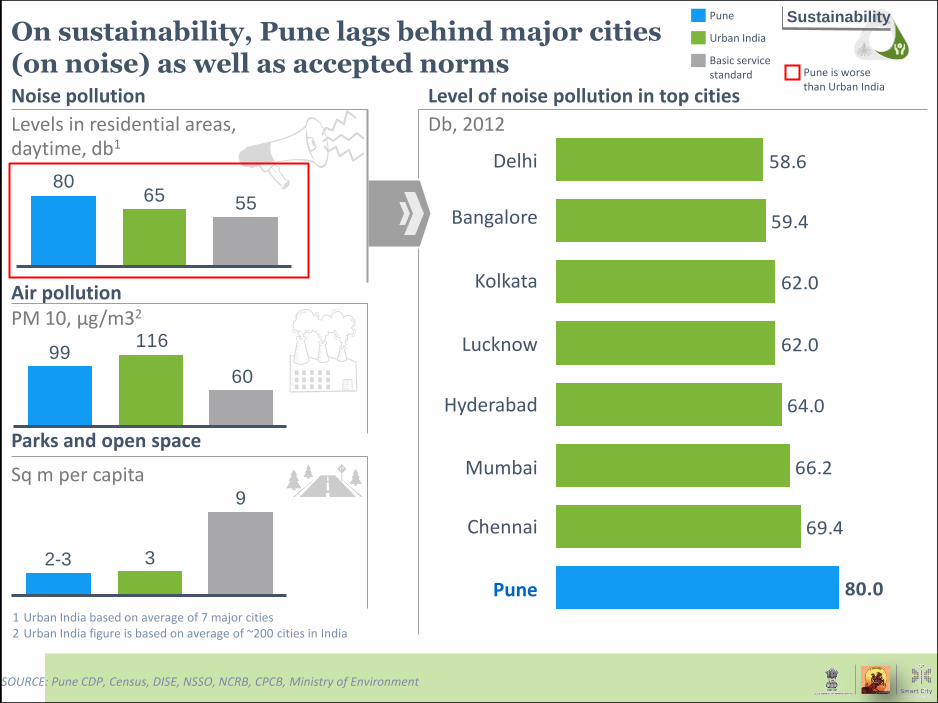
SOURCE: Pune CDP, Census, DISE, NSSO, NCRB, CPCB, Ministry of Environment
1 Urban India based on average of 7 major cities 2 Urban India figure is based on average of ~200 cities in India
69.4
66.2
64.0
62.0
62.0
59.4
58.6
80.0Pune
Delhi
Chennai
Mumbai
Hyderabad
Lucknow
Kolkata
Bangalore
On sustainability, Pune lags behind major cities (on noise) as well as accepted norms
Pune
Urban India
Basic service standard
Noise pollution
Air pollution PM 10, μg/m32
Levels in residential areas, daytime, db1
556580
60
11699
Level of noise pollution in top cities
Db, 2012
9
32-3
Parks and open space
Sq m per capita
Pune is worse than Urban India
Sustainability
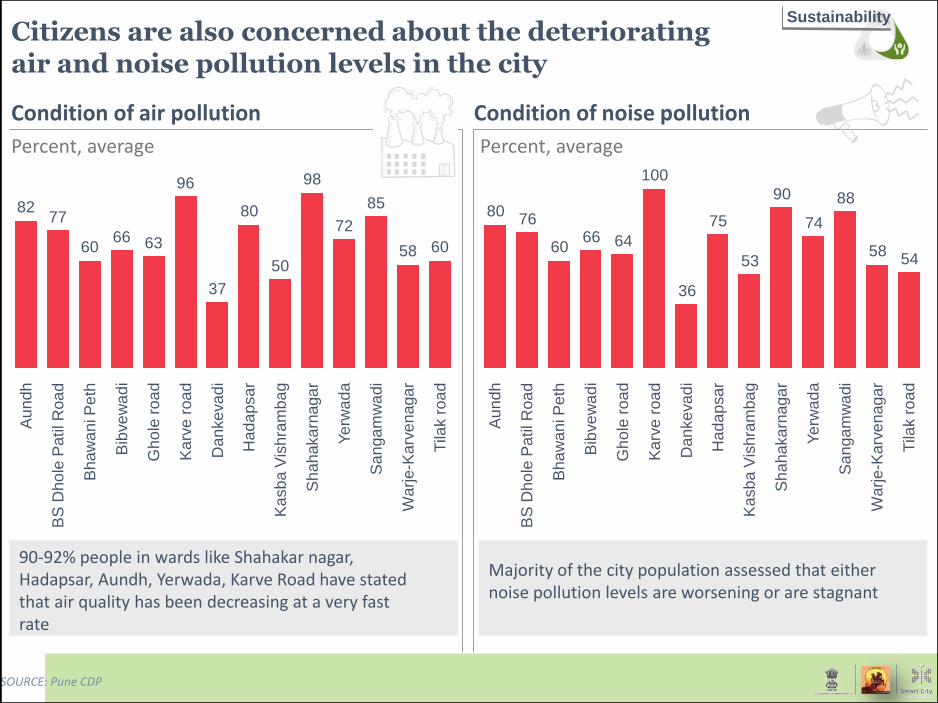
Citizens are also concerned about the deteriorating air and noise pollution levels in the city
Condition of air pollution Condition of noise pollution
6058
85
72
98
50
80
37
96
636660
7782
Gh
ole
ro
ad
Sa
nga
mw
adi
Ka
sb
a V
ishra
mb
ag
Warje
-Karv
en
agar
Ye
rwa
da
Had
ap
sar
Tila
k r
oa
d
Sh
ah
aka
rnaga
r
Bib
ve
wa
di
Ka
rve
roa
d
Dan
ke
va
di
Bh
aw
an
i Pe
th
BS
Dho
le P
atil R
oa
d
Au
nd
h
Percent, average Percent, average
5458
88
74
90
53
75
36
100
646660
7680
Bib
ve
wa
di
Bh
aw
an
i Pe
th
BS
Dho
le P
atil R
oa
d
Au
nd
h
Ye
rwa
da
Tila
k r
oa
d
Warje
-Karv
en
agar
Had
ap
sar
Ka
sb
a V
ishra
mb
ag
Sh
ah
aka
rnaga
r
Sa
nga
mw
adi
Dan
ke
va
di
Ka
rve
roa
d
Gh
ole
ro
ad
90-92% people in wards like Shahakar nagar, Hadapsar, Aundh, Yerwada, Karve Road have stated that air quality has been decreasing at a very fast rate
Majority of the city population assessed that either noise pollution levels are worsening or are stagnant
SOURCE: Pune CDP
Sustainability
z
Source: Pune CDP, Census, DISE, NSSO, NCRB, CPCB, Ministry of Environment
Competitiveness
1 New York
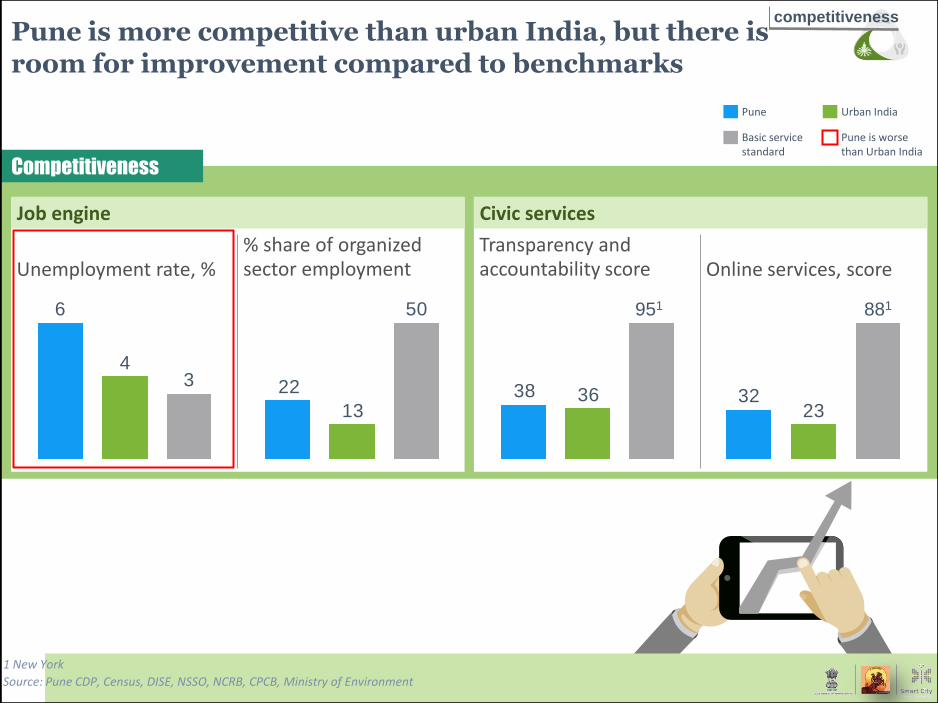
Pune is more competitive than urban India, but there is room for improvement compared to benchmarks
Pune Urban India
Basic service standard
Pune is worse than Urban India
Job engine Civic services
Unemployment rate, % % share of organized sector employment
Transparency and accountability score Online services, score
2332
881
34
6 50
13
22 3638
951
competitiveness
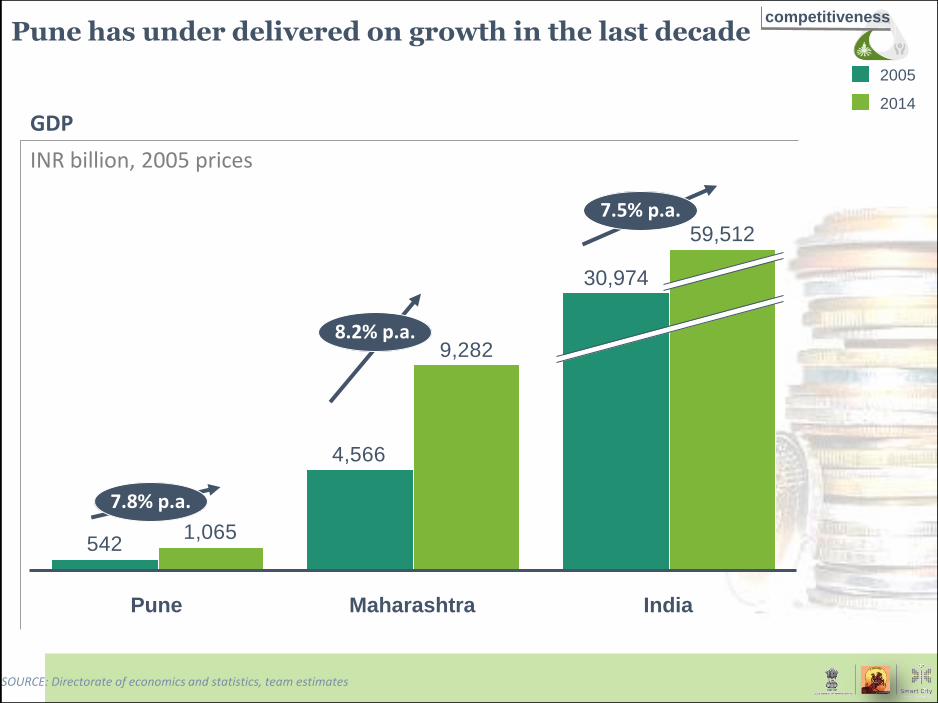
Pune has under delivered on growth in the last decade
GDP
INR billion, 2005 prices
4,566
542
9,282
1,065
India Pune
59,512
30,974
Maharashtra
2014
2005
7.8% p.a.
8.2% p.a.
7.5% p.a.
SOURCE: Directorate of economics and statistics, team estimates
competitiveness
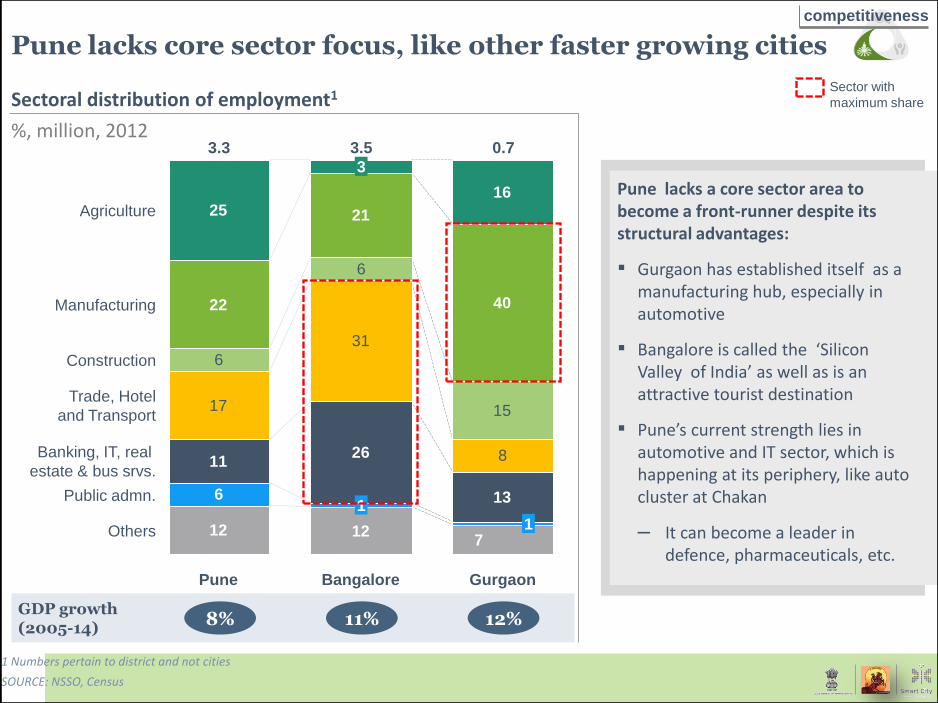
Pune lacks core sector focus, like other faster growing cities
12 12
1126
13
17
31
8
6
6
15
22
21
40
2516
7
6
3.5
1
Manufacturing
Agriculture
Bangalore
3
0.7
1
Pune
Others
Construction
Public admn.
Banking, IT, real
estate & bus srvs.
Trade, Hotel
and Transport
3.3
Gurgaon
Pune lacks a core sector area to become a front-runner despite its structural advantages:
▪ Gurgaon has established itself as a manufacturing hub, especially in automotive
▪ Bangalore is called the ‘Silicon Valley of India’ as well as is an attractive tourist destination
▪ Pune’s current strength lies in automotive and IT sector, which is happening at its periphery, like auto cluster at Chakan
– It can become a leader in defence, pharmaceuticals, etc.
Sector with
maximum share
%, million, 2012
Sectoral distribution of employment1
12% 11% 8% GDP growth (2005-14)
SOURCE: NSSO, Census
1 Numbers pertain to district and not cities
competitiveness
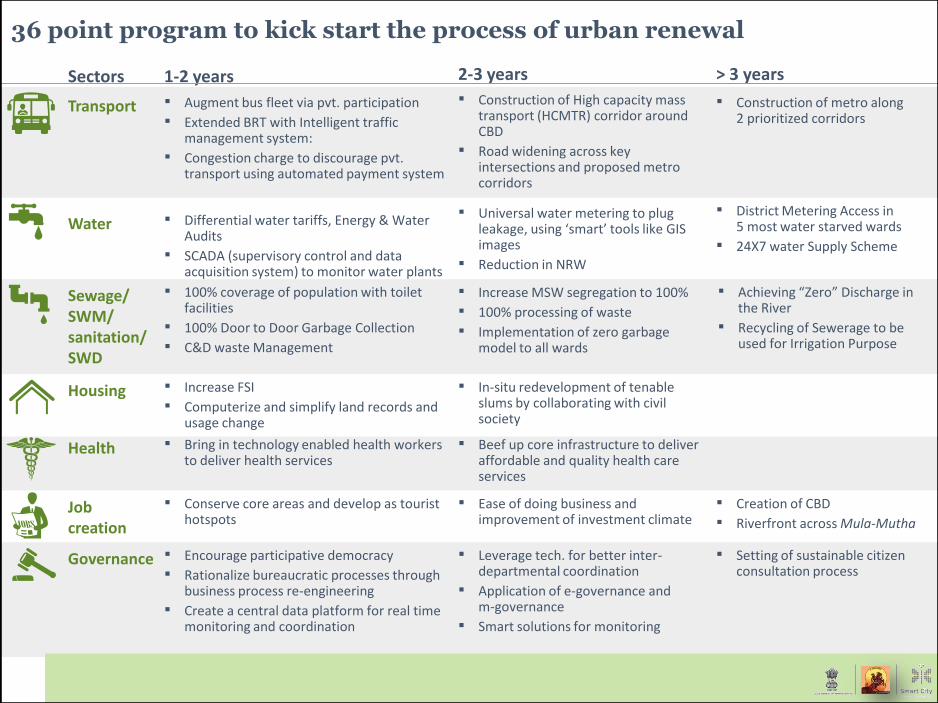
36 point program to kick start the process of urban renewal
Sectors 1-2 years 2-3 years > 3 years
▪ Increase FSI
▪ Computerize and simplify land records and usage change
▪ In-situ redevelopment of tenable slums by collaborating with civil society
Housing
▪ Differential water tariffs, Energy & Water Audits
▪ SCADA (supervisory control and data acquisition system) to monitor water plants
▪ Universal water metering to plug leakage, using ‘smart’ tools like GIS images
▪ Reduction in NRW
▪ District Metering Access in 5 most water starved wards
▪ 24X7 water Supply Scheme
Water
▪ Augment bus fleet via pvt. participation
▪ Extended BRT with Intelligent traffic management system:
▪ Congestion charge to discourage pvt. transport using automated payment system
▪ Construction of High capacity mass transport (HCMTR) corridor around CBD
▪ Road widening across key intersections and proposed metro corridors
▪ Construction of metro along 2 prioritized corridors
Transport
▪ Bring in technology enabled health workers to deliver health services
▪ Beef up core infrastructure to deliver affordable and quality health care services
Health
▪ Conserve core areas and develop as tourist hotspots
▪ Ease of doing business and improvement of investment climate
▪ Creation of CBD
▪ Riverfront across Mula-Mutha Job creation
▪ Encourage participative democracy
▪ Rationalize bureaucratic processes through business process re-engineering
▪ Create a central data platform for real time monitoring and coordination
▪ Leverage tech. for better inter-departmental coordination
▪ Application of e-governance and m-governance
▪ Smart solutions for monitoring
▪ Setting of sustainable citizen consultation process
Governance
▪ 100% coverage of population with toilet facilities
▪ 100% Door to Door Garbage Collection
▪ C&D waste Management
▪ Increase MSW segregation to 100%
▪ 100% processing of waste
▪ Implementation of zero garbage model to all wards
Sewage/ SWM/ sanitation/ SWD
▪ Achieving “Zero” Discharge in the River
▪ Recycling of Sewerage to be used for Irrigation Purpose

Health
Water
Supply
Transport Affordable
Housing
SMART
City
Slum
Eradication
Sanitation Job
Creation
Governance
Solid Waste
Management

TRANSPORT
Improve mobility by efficient utilization of existing stock and targeted interventions
and investments
Smart technology solutions to enhance efficiency
Road widening and building across key stretches
Augmenting the fleet by bringing private sector participation
Implementation of BRTS as proposed in Pune’s Comprehensive Mobility Plan (CMP)
Kick-start implementation of MRTS in a staggered manner
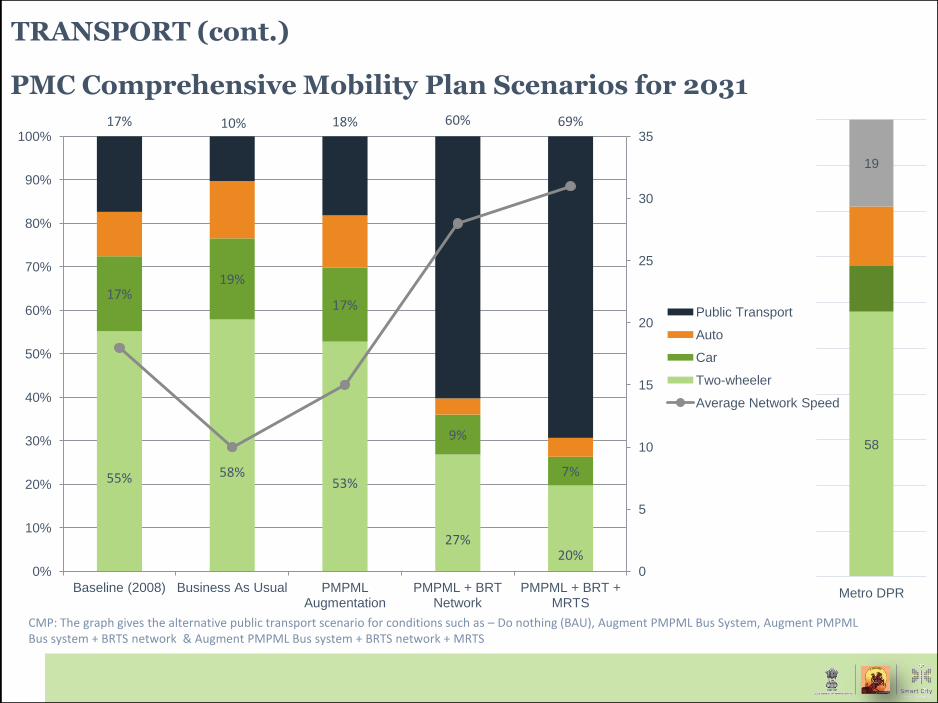
TRANSPORT (cont.)
55% 58% 53%
27% 20%
17% 19%
17%
9%
7%
17% 10% 18% 60% 69%
0
5
10
15
20
25
30
35
0%
10%
20%
30%
40%
50%
60%
70%
80%
90%
100%
Baseline (2008) Business As Usual PMPML Augmentation
PMPML + BRT Network
PMPML + BRT + MRTS
Public Transport
Auto
Car
Two-wheeler
Average Network Speed
58
19
Metro DPR
CMP: The graph gives the alternative public transport scenario for conditions such as – Do nothing (BAU), Augment PMPML Bus System, Augment PMPML Bus system + BRTS network & Augment PMPML Bus system + BRTS network + MRTS
PMC Comprehensive Mobility Plan Scenarios for 2031
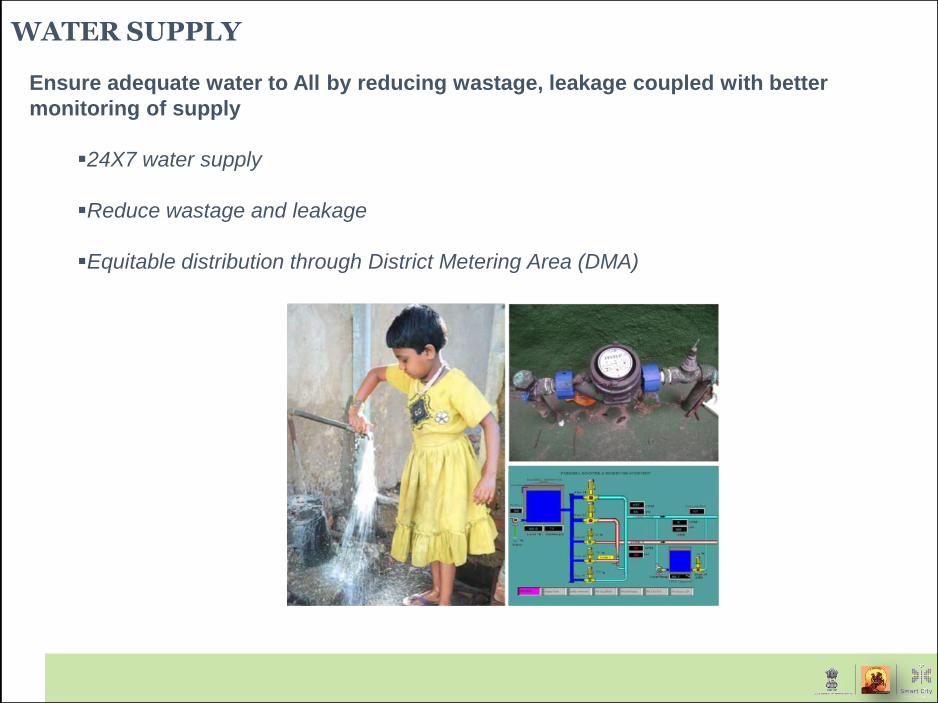
WATER SUPPLY
Ensure adequate water to All by reducing wastage, leakage coupled with better
monitoring of supply
24X7 water supply
Reduce wastage and leakage
Equitable distribution through District Metering Area (DMA)
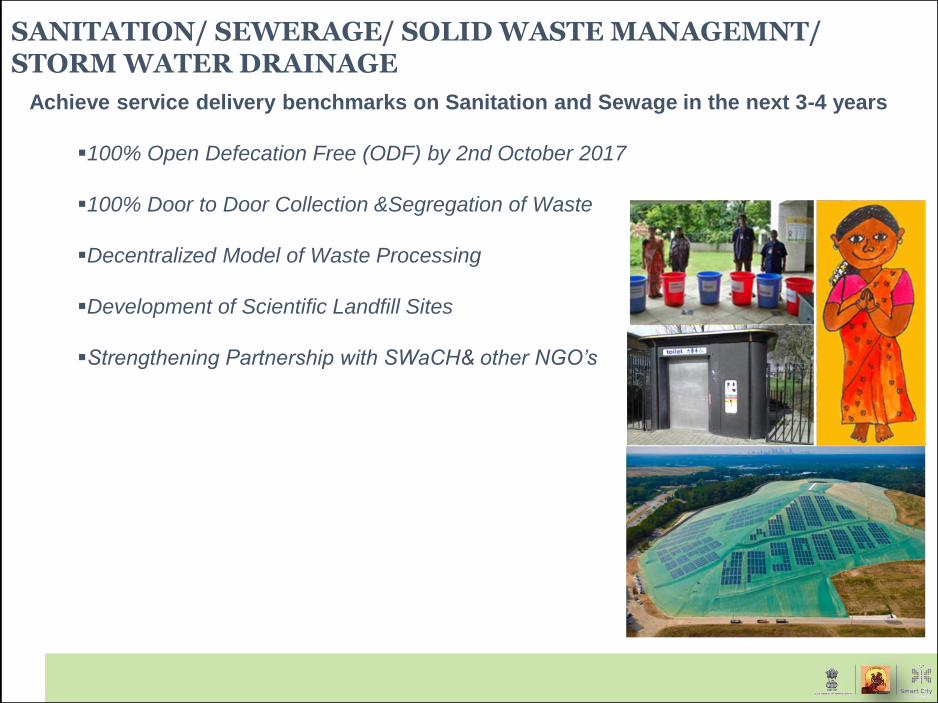
SANITATION/ SEWERAGE/ SOLID WASTE MANAGEMNT/ STORM WATER DRAINAGE
Achieve service delivery benchmarks on Sanitation and Sewage in the next 3-4 years
100% Open Defecation Free (ODF) by 2nd October 2017
100% Door to Door Collection &Segregation of Waste
Decentralized Model of Waste Processing
Development of Scientific Landfill Sites
Strengthening Partnership with SWaCH& other NGO’s
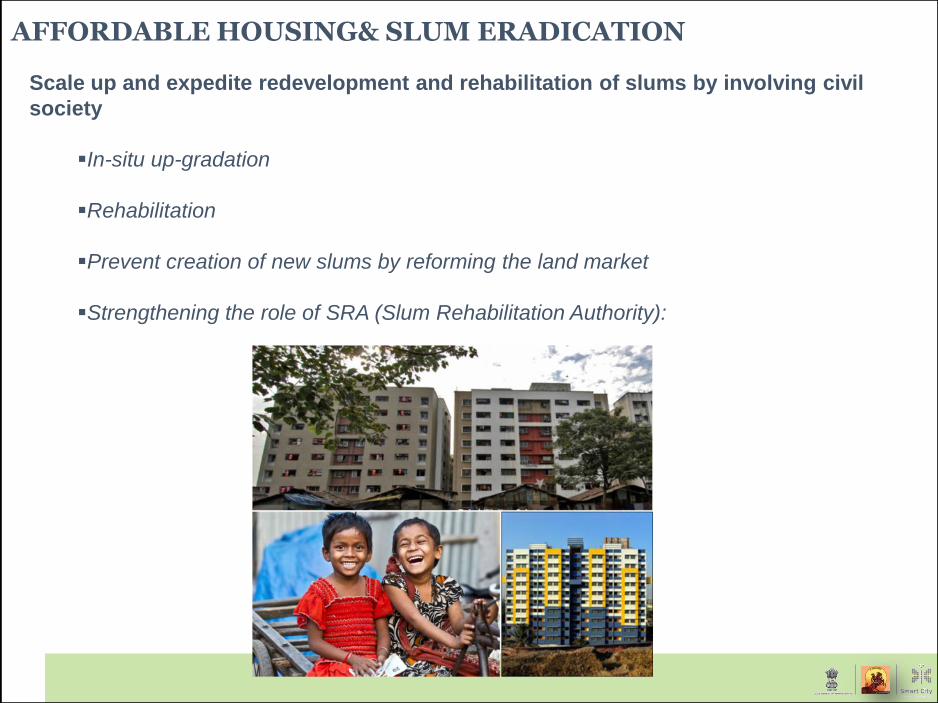
AFFORDABLE HOUSING& SLUM ERADICATION
Scale up and expedite redevelopment and rehabilitation of slums by involving civil
society
In-situ up-gradation
Rehabilitation
Prevent creation of new slums by reforming the land market
Strengthening the role of SRA (Slum Rehabilitation Authority):
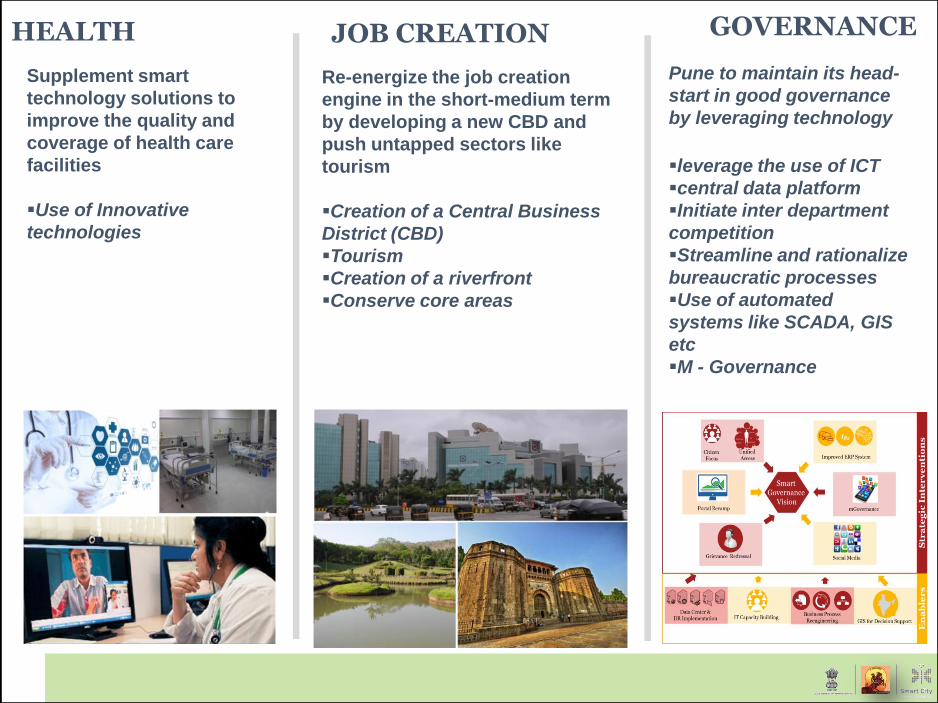
HEALTH JOB CREATION GOVERNANCE
Supplement smart
technology solutions to
improve the quality and
coverage of health care
facilities
Use of Innovative
technologies
Re-energize the job creation
engine in the short-medium term
by developing a new CBD and
push untapped sectors like
tourism
Creation of a Central Business
District (CBD)
Tourism
Creation of a riverfront
Conserve core areas
Pune to maintain its head-
start in good governance
by leveraging technology
leverage the use of ICT
central data platform
Initiate inter department
competition
Streamline and rationalize
bureaucratic processes
Use of automated
systems like SCADA, GIS
etc
M - Governance
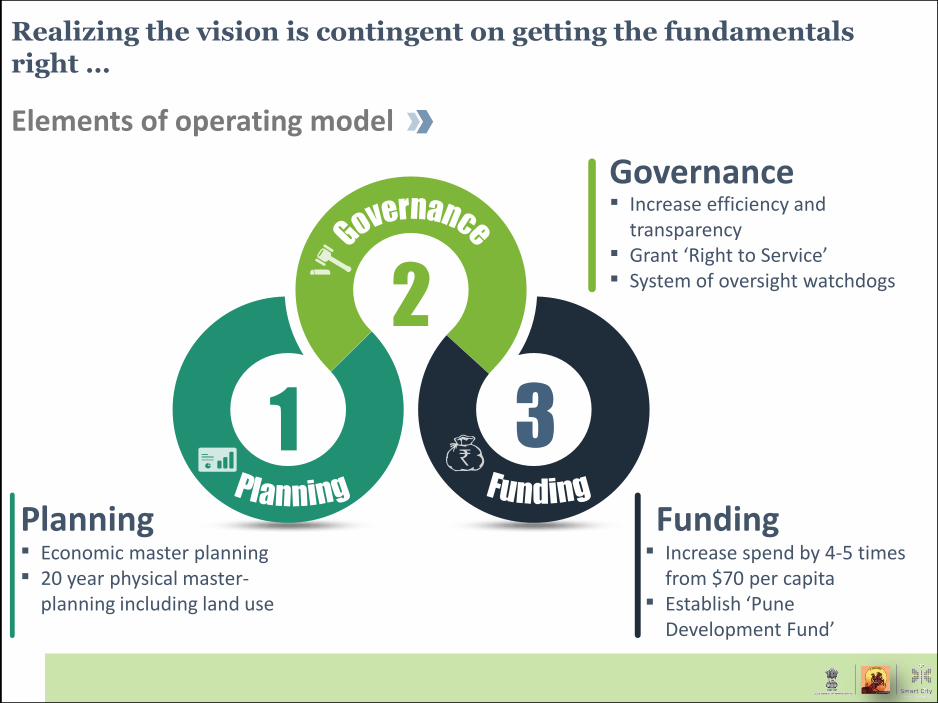
Realizing the vision is contingent on getting the fundamentals right …
1
2
3
▪ Economic master planning ▪ 20 year physical master-
planning including land use
Planning
▪ Increase efficiency and transparency
▪ Grant ‘Right to Service’ ▪ System of oversight watchdogs
Governance
▪ Increase spend by 4-5 times from $70 per capita
▪ Establish ‘Pune Development Fund’
Funding
Elements of operating model
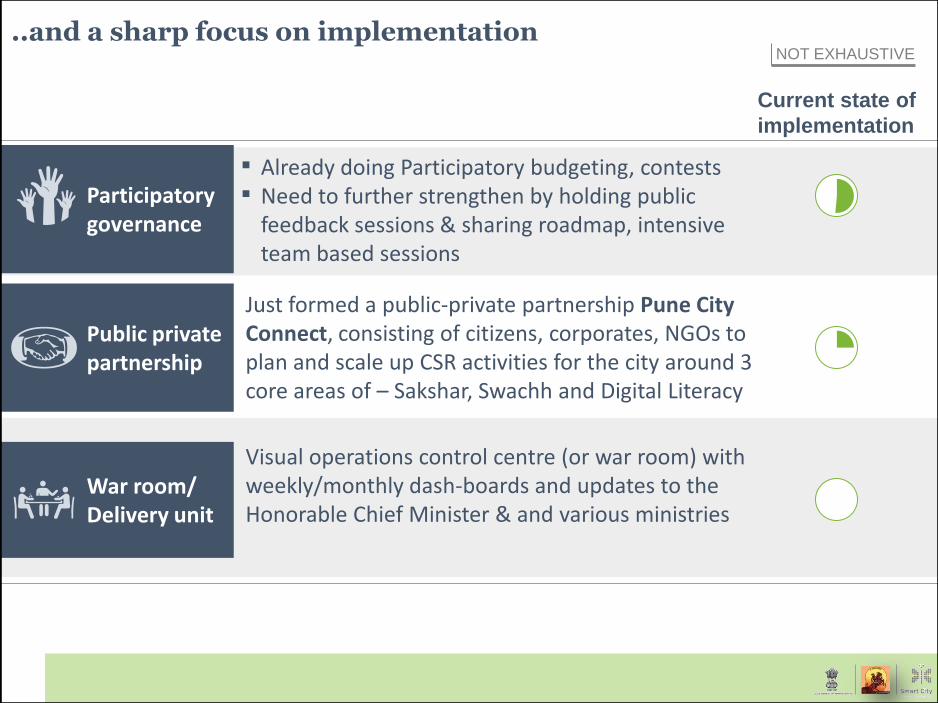
..and a sharp focus on implementation
Current state of
implementation
Public private partnership
Just formed a public-private partnership Pune City Connect, consisting of citizens, corporates, NGOs to plan and scale up CSR activities for the city around 3 core areas of – Sakshar, Swachh and Digital Literacy
War room/ Delivery unit
Visual operations control centre (or war room) with weekly/monthly dash-boards and updates to the Honorable Chief Minister & and various ministries
▪ Already doing Participatory budgeting, contests ▪ Need to further strengthen by holding public
feedback sessions & sharing roadmap, intensive team based sessions
Participatory governance
NOT EXHAUSTIVE
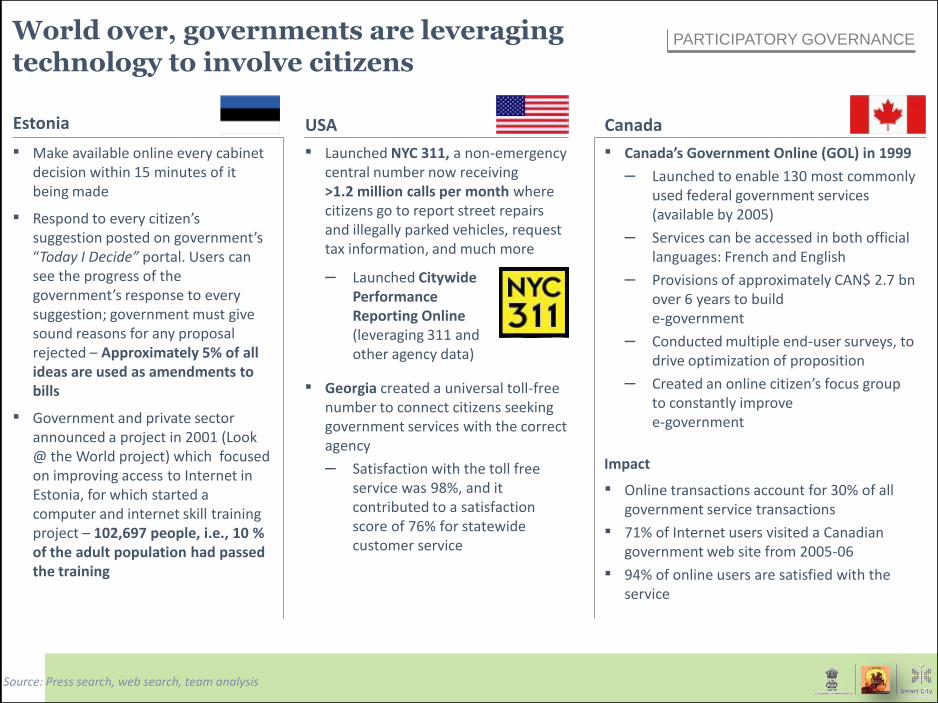
▪ Online transactions account for 30% of all government service transactions
▪ 71% of Internet users visited a Canadian government web site from 2005-06
▪ 94% of online users are satisfied with the service
World over, governments are leveraging technology to involve citizens
USA USA Canada Estonia
▪ Make available online every cabinet decision within 15 minutes of it being made
▪ Respond to every citizen’s suggestion posted on government’s “Today I Decide” portal. Users can see the progress of the government’s response to every suggestion; government must give sound reasons for any proposal rejected – Approximately 5% of all ideas are used as amendments to bills
▪ Government and private sector announced a project in 2001 (Look @ the World project) which focused on improving access to Internet in Estonia, for which started a computer and internet skill training project – 102,697 people, i.e., 10 % of the adult population had passed the training
▪ Launched NYC 311, a non-emergency central number now receiving >1.2 million calls per month where citizens go to report street repairs and illegally parked vehicles, request tax information, and much more
– Launched Citywide Performance Reporting Online (leveraging 311 and other agency data)
▪ Georgia created a universal toll-free number to connect citizens seeking government services with the correct agency
– Satisfaction with the toll free service was 98%, and it contributed to a satisfaction score of 76% for statewide customer service
▪ Canada’s Government Online (GOL) in 1999
– Launched to enable 130 most commonly used federal government services (available by 2005)
– Services can be accessed in both official languages: French and English
– Provisions of approximately CAN$ 2.7 bn over 6 years to build e-government
– Conducted multiple end-user surveys, to drive optimization of proposition
– Created an online citizen’s focus group to constantly improve e-government
Impact
PARTICIPATORY GOVERNANCE
Source: Press search, web search, team analysis
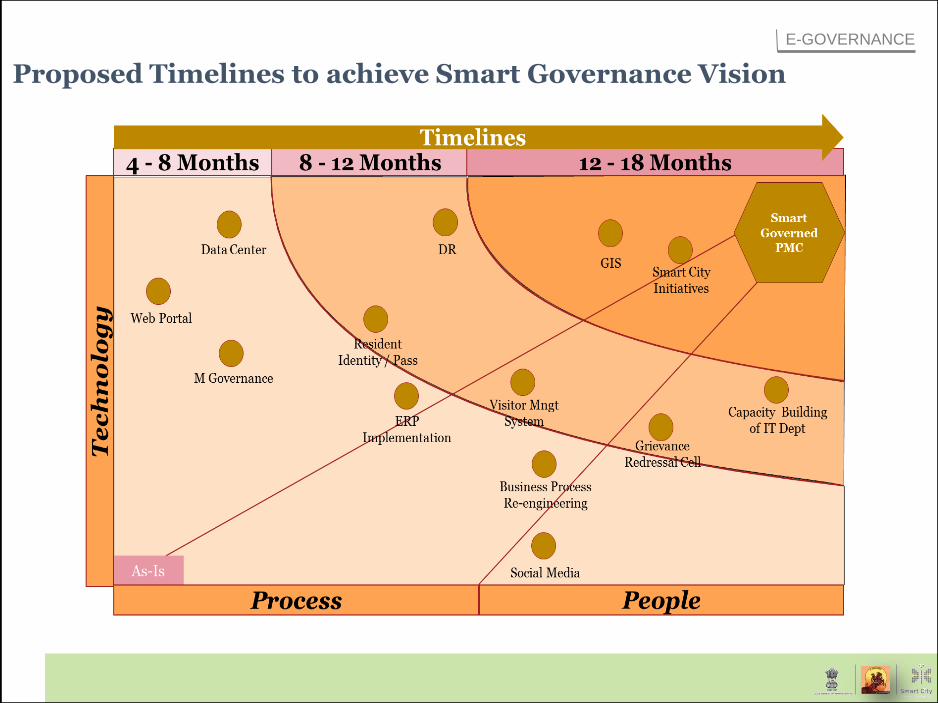
Proposed Timelines to achieve Smart Governance Vision
E-GOVERNANCE
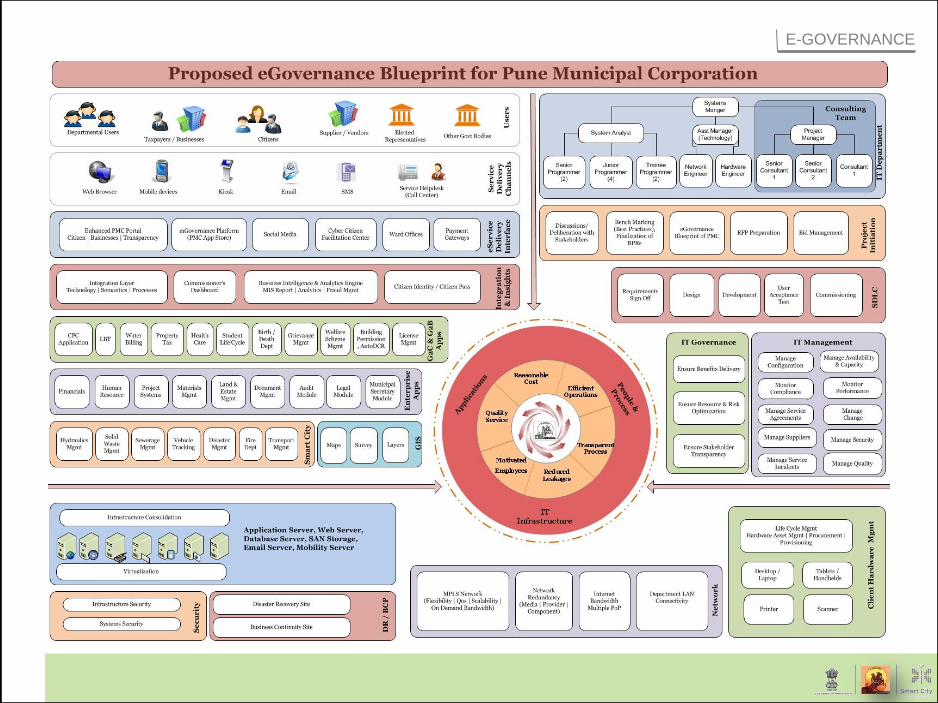
E-GOVERNANCE
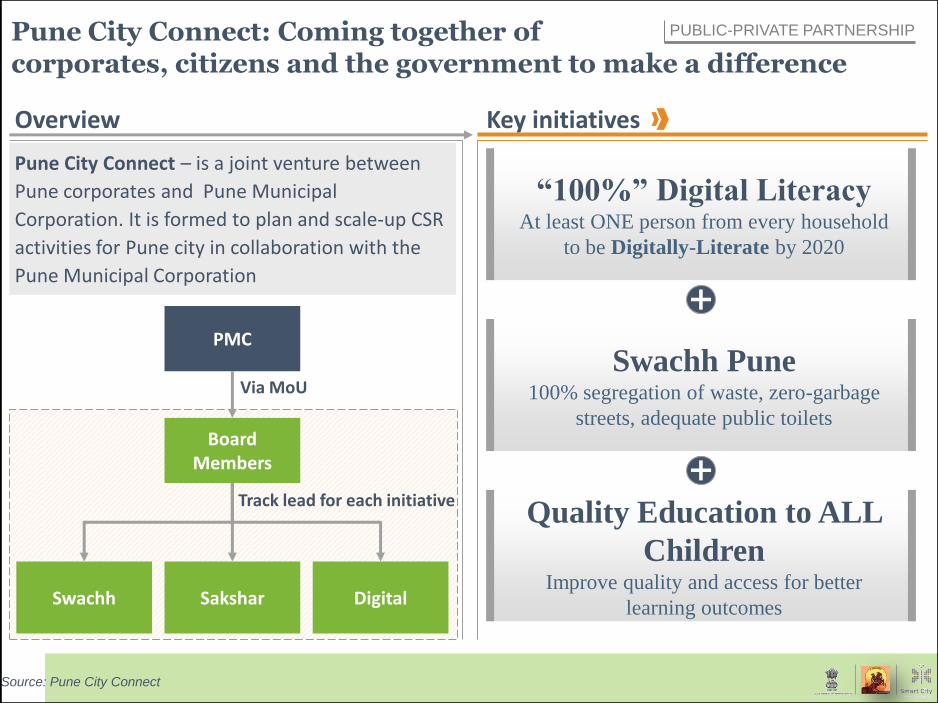
Pune City Connect: Coming together of corporates, citizens and the government to make a difference
Pune City Connect – is a joint venture between
Pune corporates and Pune Municipal
Corporation. It is formed to plan and scale-up CSR
activities for Pune city in collaboration with the
Pune Municipal Corporation
Overview
Board Members
Swachh Sakshar Digital
PMC
Via MoU
Key initiatives
“100%” Digital Literacy At least ONE person from every household
to be Digitally-Literate by 2020
Swachh Pune 100% segregation of waste, zero-garbage
streets, adequate public toilets
Track lead for each initiative Quality Education to ALL
Children Improve quality and access for better
learning outcomes
PUBLIC-PRIVATE PARTNERSHIP
Source: Pune City Connect
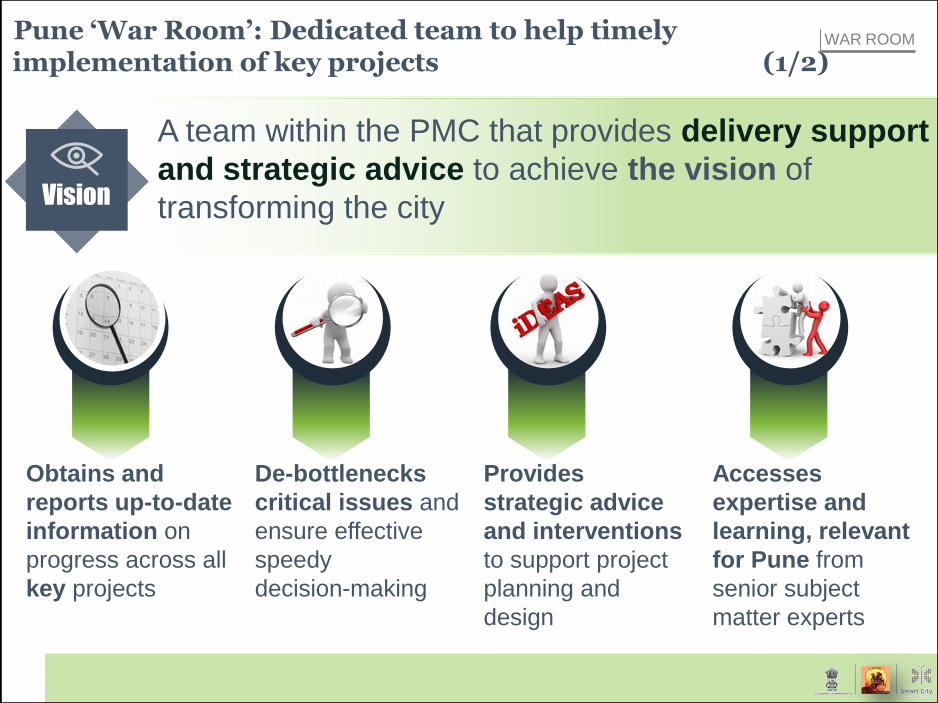
Pune ‘War Room’: Dedicated team to help timely implementation of key projects (1/2)
A team within the PMC that provides delivery support
and strategic advice to achieve the vision of
transforming the city Vision
Obtains and
reports up-to-date
information on
progress across all
key projects
De-bottlenecks
critical issues and
ensure effective
speedy
decision-making
Provides
strategic advice
and interventions
to support project
planning and
design
Accesses
expertise and
learning, relevant
for Pune from
senior subject
matter experts
WAR ROOM
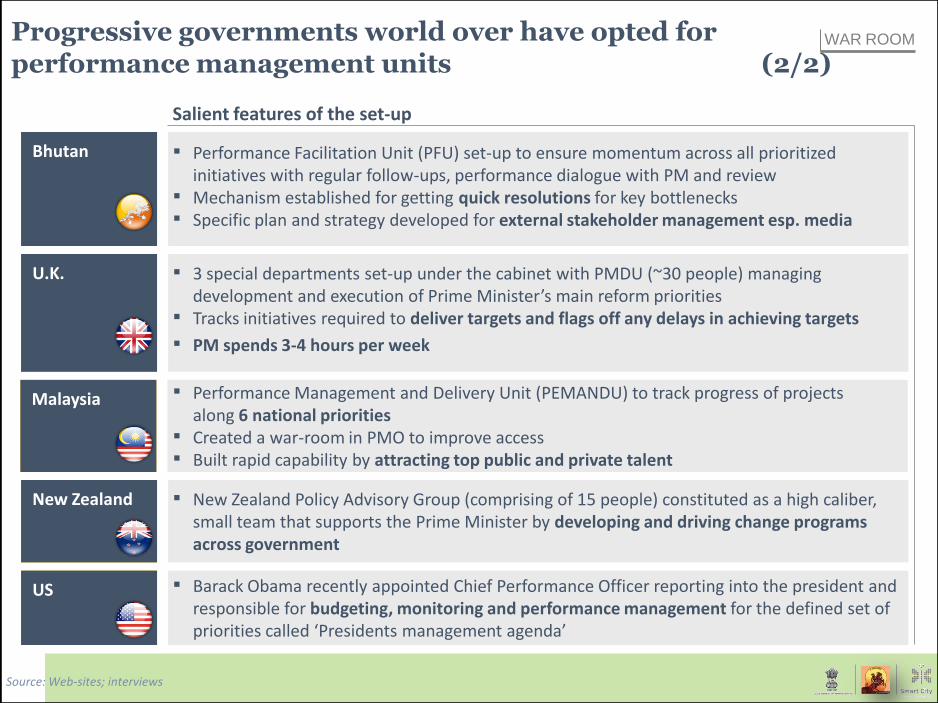
Progressive governments world over have opted for performance management units (2/2)
New Zealand ▪ New Zealand Policy Advisory Group (comprising of 15 people) constituted as a high caliber, small team that supports the Prime Minister by developing and driving change programs across government
US ▪ Barack Obama recently appointed Chief Performance Officer reporting into the president and responsible for budgeting, monitoring and performance management for the defined set of priorities called ‘Presidents management agenda’
Malaysia ▪ Performance Management and Delivery Unit (PEMANDU) to track progress of projects along 6 national priorities
▪ Created a war-room in PMO to improve access ▪ Built rapid capability by attracting top public and private talent
U.K. ▪ 3 special departments set-up under the cabinet with PMDU (~30 people) managing development and execution of Prime Minister’s main reform priorities
▪ Tracks initiatives required to deliver targets and flags off any delays in achieving targets
▪ PM spends 3-4 hours per week
Bhutan ▪ Performance Facilitation Unit (PFU) set-up to ensure momentum across all prioritized initiatives with regular follow-ups, performance dialogue with PM and review
▪ Mechanism established for getting quick resolutions for key bottlenecks ▪ Specific plan and strategy developed for external stakeholder management esp. media
Salient features of the set-up
WAR ROOM
Source: Web-sites; interviews
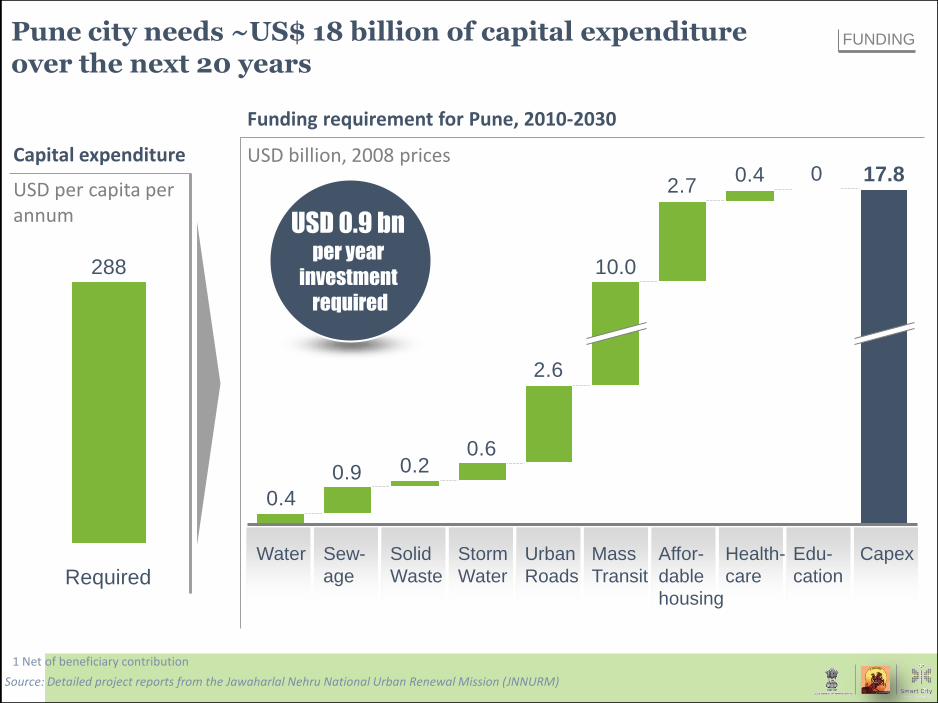
Pune city needs ~US$ 18 billion of capital expenditure over the next 20 years
USD per capita per annum
Required
288
2.6
0.60.20.9
0.4
00.42.7
10.0
17.8
Capex Edu-
cation
Health-
care
Affor-
dable
housing
Mass
Transit
Urban
Roads
Storm
Water
Solid
Waste
Sew-
age
Water
Funding requirement for Pune, 2010-2030
USD 0.9 bn per year
investment
required
FUNDING
USD billion, 2008 prices Capital expenditure
Source: Detailed project reports from the Jawaharlal Nehru National Urban Renewal Mission (JNNURM)
1 Net of beneficiary contribution
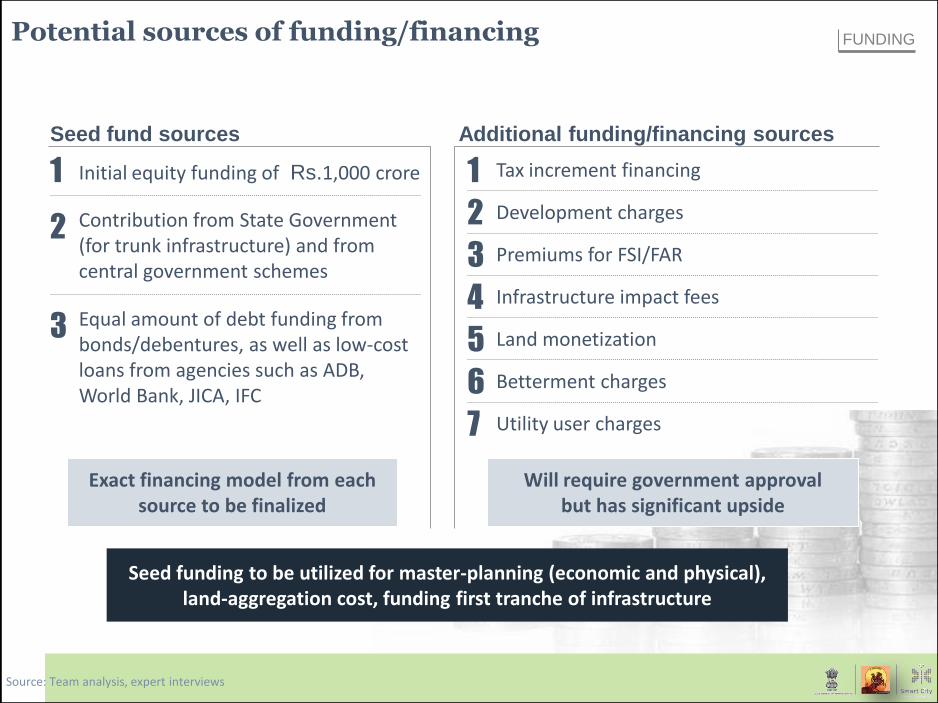
Potential sources of funding/financing
Additional funding/financing sources Seed fund sources
Seed funding to be utilized for master-planning (economic and physical), land-aggregation cost, funding first tranche of infrastructure
Initial equity funding of Rs.1,000 crore
Contribution from State Government (for trunk infrastructure) and from central government schemes
Equal amount of debt funding from bonds/debentures, as well as low-cost loans from agencies such as ADB, World Bank, JICA, IFC
Tax increment financing
Development charges
Premiums for FSI/FAR
Infrastructure impact fees
Land monetization
Betterment charges
Utility user charges
1
2
3
4
5
6
7
1
2
3
Exact financing model from each source to be finalized
Will require government approval but has significant upside
FUNDING
Source: Team analysis, expert interviews
CITIZEN PARTICIPATION FRAMEWORK
PMC’s Initiatives for Citizen Participation
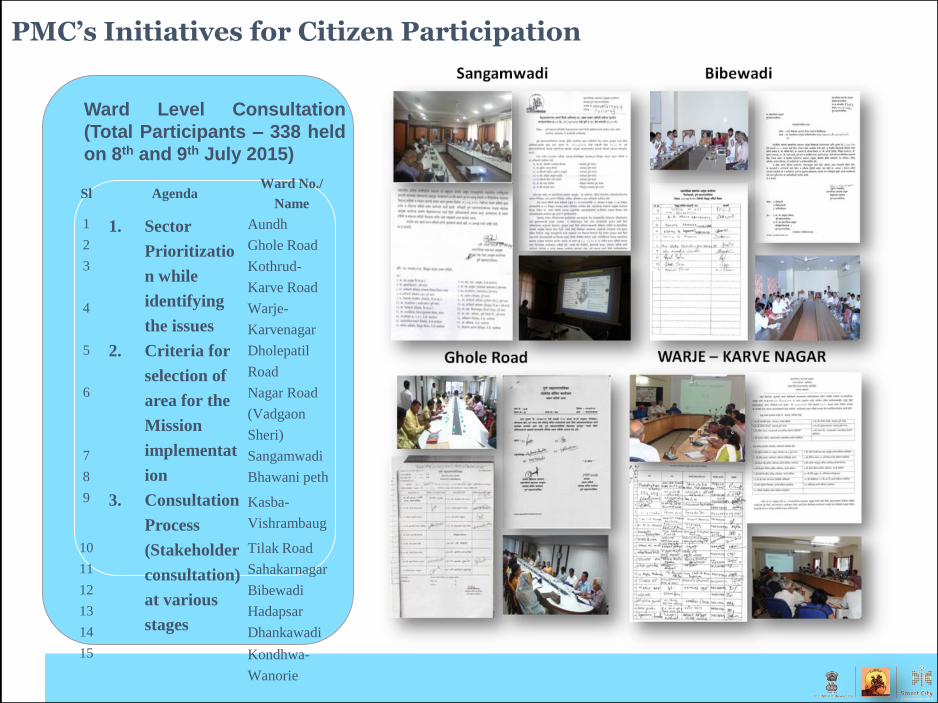
Ward Level Consultation
(Total Participants – 338 held
on 8th and 9th July 2015)
Sl Agenda
Ward No./
Name
1 1. Sector
Prioritizatio
n while
identifying
the issues
2. Criteria for
selection of
area for the
Mission
implementat
ion
3. Consultation
Process
(Stakeholder
consultation)
at various
stages
Aundh
2 Ghole Road
3 Kothrud-
Karve Road
4 Warje-
Karvenagar
5 Dholepatil
Road
6 Nagar Road
(Vadgaon
Sheri)
7 Sangamwadi
8 Bhawani peth
9 Kasba-
Vishrambaug
10 Tilak Road
11 Sahakarnagar
12 Bibewadi
13 Hadapsar
14 Dhankawadi
15 Kondhwa-
Wanorie
PMC’s Initiatives for Citizen Participation
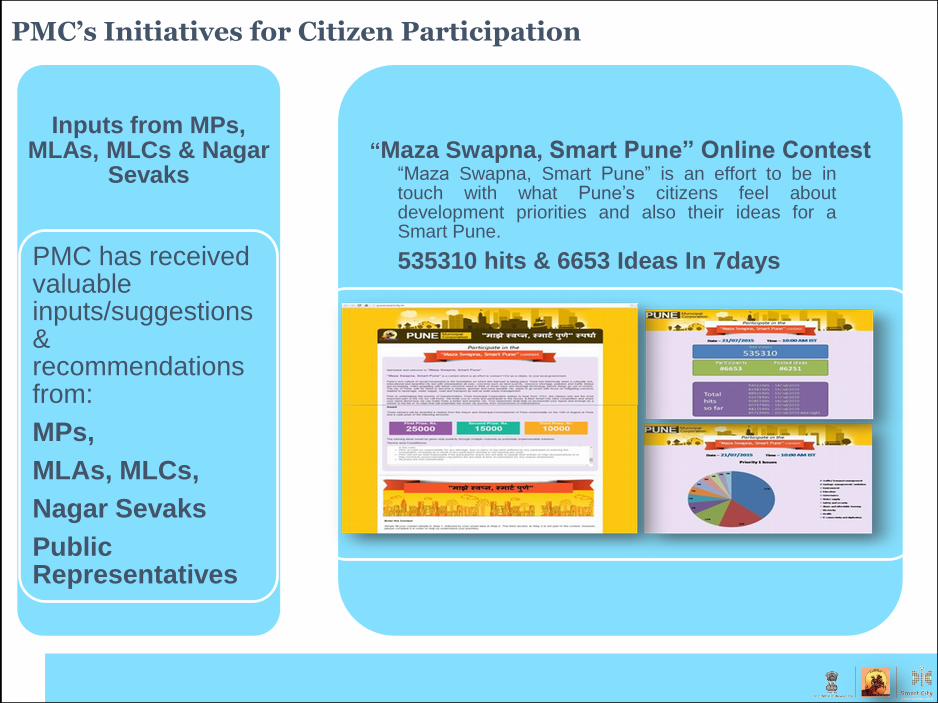
Inputs from MPs, MLAs, MLCs & Nagar
Sevaks
PMC has received valuable inputs/suggestions & recommendations from:
MPs,
MLAs, MLCs,
Nagar Sevaks
Public Representatives
“Maza Swapna, Smart Pune” Online Contest “Maza Swapna, Smart Pune” is an effort to be in touch with what Pune’s citizens feel about development priorities and also their ideas for a Smart Pune.
535310 hits & 6653 Ideas In 7days
PMC’s Initiatives for Citizen Participation
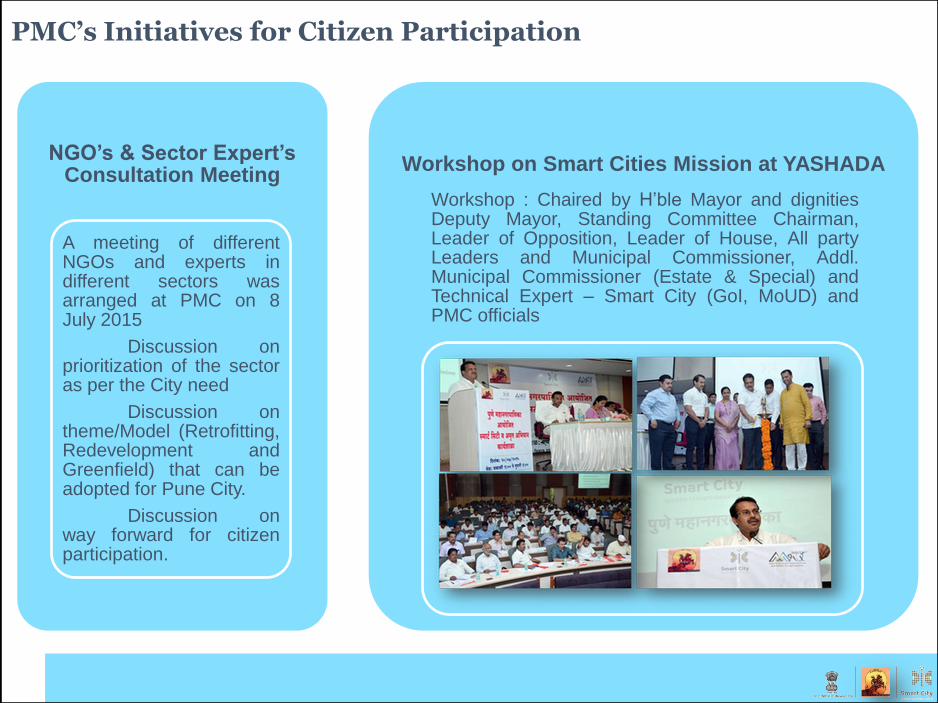
NGO’s & Sector Expert’s Consultation Meeting
A meeting of different NGOs and experts in different sectors was arranged at PMC on 8 July 2015
Discussion on prioritization of the sector as per the City need
Discussion on theme/Model (Retrofitting, Redevelopment and Greenfield) that can be adopted for Pune City.
Discussion on way forward for citizen participation.
Workshop on Smart Cities Mission at YASHADA
Workshop : Chaired by H’ble Mayor and dignities Deputy Mayor, Standing Committee Chairman, Leader of Opposition, Leader of House, All party Leaders and Municipal Commissioner, Addl. Municipal Commissioner (Estate & Special) and Technical Expert – Smart City (GoI, MoUD) and PMC officials
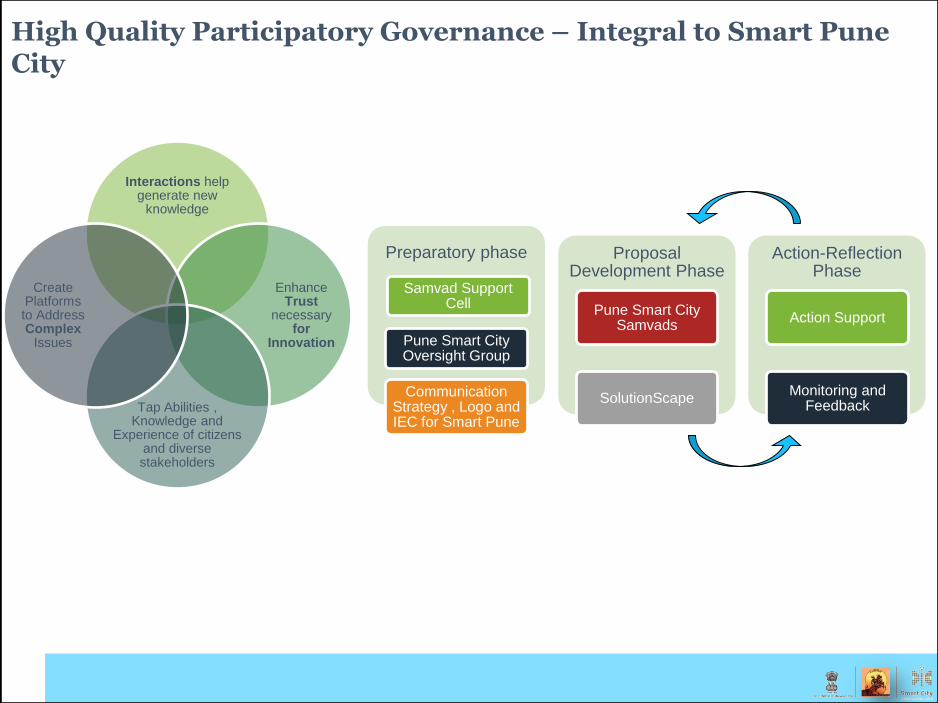
High Quality Participatory Governance – Integral to Smart Pune City
Interactions help generate new
knowledge
Enhance Trust
necessary for
Innovation
Tap Abilities , Knowledge and
Experience of citizens and diverse stakeholders
Create Platforms to Address Complex
Issues
Preparatory phase
Samvad Support Cell
Pune Smart City Oversight Group
Communication Strategy , Logo and IEC for Smart Pune
Proposal Development Phase
Pune Smart City Samvads
SolutionScape
Action-Reflection Phase
Action Support
Monitoring and Feedback

THANK YOU!


![COLLEGE OF ENGINEERING, PUNE [COEP] · PDF file... in College of Engineering, Pune. 1.2 Structure, ... Engineering Pune Page 8 4 Admission of GATE ... valid GATE score in relevant](https://img.dokumen.tips/doc/110x75/5abcd96b7f8b9a8f058e12da/college-of-engineering-pune-coep-in-college-of-engineering-pune-12-structure.jpg)