Embed Size (px)
Citation preview
Punching Shear in Waffle Slab, Seismic Design E. Arellano-Méndez & O.M. González-Cuevas Universidad Autónoma Metropolitana, México D.F.
SUMMARY: Five full-sized posttensioned flat slab-column connections subjected to axial load and flexural moment were tested to study their mode of failure, strength and ductility. The variables that were tested are: 1) provision of stirrups or stud shear reinforcement; 2) spacing between stirrups or shear studs; and 3) relationship between the applied axial load, Vu, and the punching shear strength of the slab with axial load and without shear reinforcement, VcR. In this research, waffle slabs were used, being more used in Mexico than solid slabs for economic reasons. The ductility of the connections was of special interest, since this type of structures is usually considered of low or medium ductility because the punching shear failures are brittle. It has been found that the maximum IDR (interstory drift ratio) reached in structures with flat slab-column connections depends on the relation between Vu and VcR, so this was one of the main variables in the research. Keywords: Slabs, slab column connection, shear reinforcement, punching shear, posttensioned concrete.
1. INTRODUCTION Posttensioned flat slabs may be designed or built as solid or as waffle types. In Mexico, it is most common to use waffle posttensioned slabs. Although they require more manpower, they are cheaper, since their total cost is constituted by a 40 % of manpower and 60 % of materials (Cortina, 2006), while in countries like United States of America, total cost is divided between 60% manpower and 40 % materials (Englekirk, 2006). A waffle slab becomes generally more expensive than a solid one in these countries. The structures design based on posttensioned waffle slabs in seismic zones was regulated for the first time in “Normas técnicas complementarias para el diseño y construcción de estructuras de concreto” (NTC-Concreto, 1996) in 1996. This document establishes that these structures must be built by a dual system; the first is a stiff reinforced concrete structure able to resist independently the seismic actions; this system generally is built within the perimeter of the building. The second is the system of waffle slab and columns, which must be able to resist gravitational loads and the actions and interstory drift that are induced when it works altogether with the first system under the action of the earthquake. (Section 9.7.3, NTC-Concreto, 2004). The building practice in Mexico of posttensioned waffle slabs consists of having main ribs relatively wide in the column axis, which, when intersected with the perpendicular axis, form a solid zone around the columns. However, this solid zone is relatively small in comparison with the one that usually exist in reinforced concrete waffle slabs. It has been considered important to run a research program oriented to the study of the behavior of the column connections with the posttensioned waffle slabs, with the purpose of obtaining regulations for calculating the resistance to punching shear and to determine its ductility It is of paramount importance to estimate the interstory drift ratio which the structures with this building system can reach, without the occurrence of a connection failure.
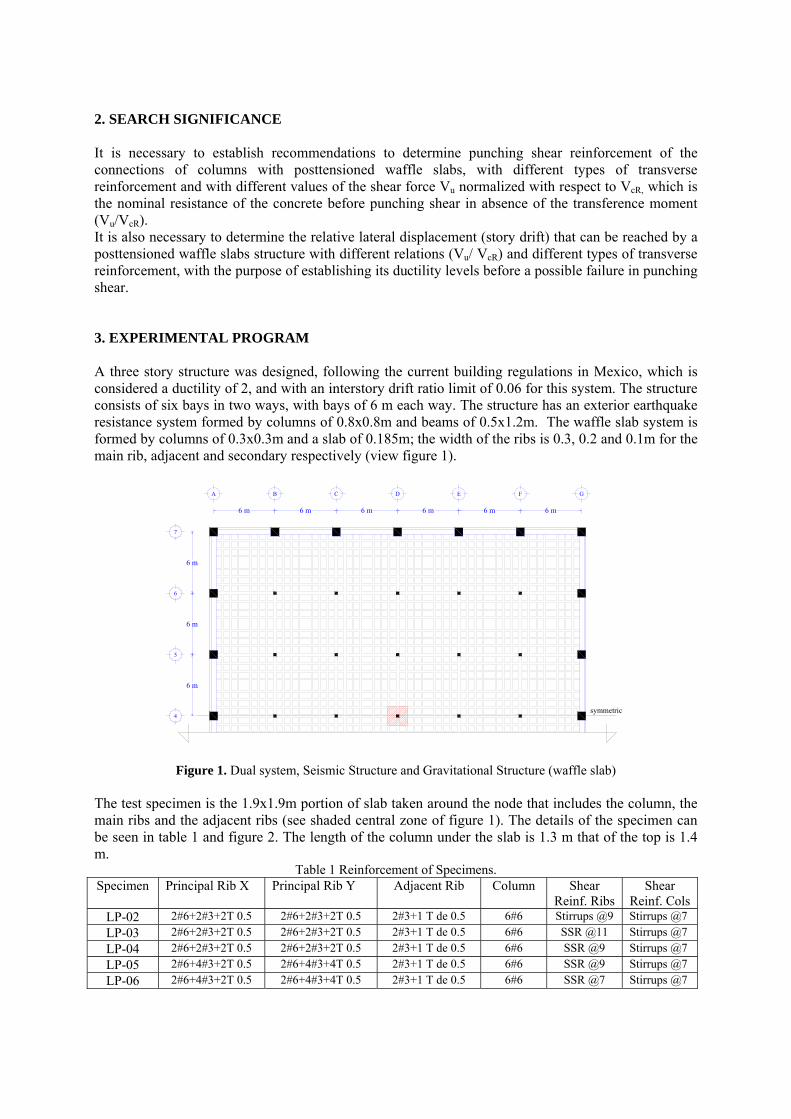
2. SEARCH SIGNIFICANCE It is necessary to establish recommendations to determine punching shear reinforcement of the connections of columns with posttensioned waffle slabs, with different types of transverse reinforcement and with different values of the shear force Vu normalized with respect to VcR, which is the nominal resistance of the concrete before punching shear in absence of the transference moment (Vu/VcR). It is also necessary to determine the relative lateral displacement (story drift) that can be reached by a posttensioned waffle slabs structure with different relations (Vu/ VcR) and different types of transverse reinforcement, with the purpose of establishing its ductility levels before a possible failure in punching shear. 3. EXPERIMENTAL PROGRAM A three story structure was designed, following the current building regulations in Mexico, which is considered a ductility of 2, and with an interstory drift ratio limit of 0.06 for this system. The structure consists of six bays in two ways, with bays of 6 m each way. The structure has an exterior earthquake resistance system formed by columns of 0.8x0.8m and beams of 0.5x1.2m. The waffle slab system is formed by columns of 0.3x0.3m and a slab of 0.185m; the width of the ribs is 0.3, 0.2 and 0.1m for the main rib, adjacent and secondary respectively (view figure 1).
Figure 1. Dual system, Seismic Structure and Gravitational Structure (waffle slab) The test specimen is the 1.9x1.9m portion of slab taken around the node that includes the column, the main ribs and the adjacent ribs (see shaded central zone of figure 1). The details of the specimen can be seen in table 1 and figure 2. The length of the column under the slab is 1.3 m that of the top is 1.4 m.
Table 1 Reinforcement of Specimens. Specimen Principal Rib X Principal Rib Y Adjacent Rib
Column Shear
Reinf. Ribs Shear
Reinf. Cols LP-02 2#6+2#3+2T 0.5 2#6+2#3+2T 0.5 2#3+1 T de 0.5 6#6 Stirrups @9 Stirrups @7
LP-03 2#6+2#3+2T 0.5 2#6+2#3+2T 0.5 2#3+1 T de 0.5 6#6 SSR @11 Stirrups @7
LP-04 2#6+2#3+2T 0.5 2#6+2#3+2T 0.5 2#3+1 T de 0.5 6#6 SSR @9 Stirrups @7
LP-05 2#6+4#3+2T 0.5 2#6+4#3+4T 0.5 2#3+1 T de 0.5 6#6 SSR @9 Stirrups @7
LP-06 2#6+4#3+2T 0.5 2#6+4#3+4T 0.5 2#3+1 T de 0.5 6#6 SSR @7 Stirrups @7
symmetric
6 m
6 m
6 m
A
7
6
5
4
B C D E
6 m 6 m 6 m 6 m 6 m 6 m
F G
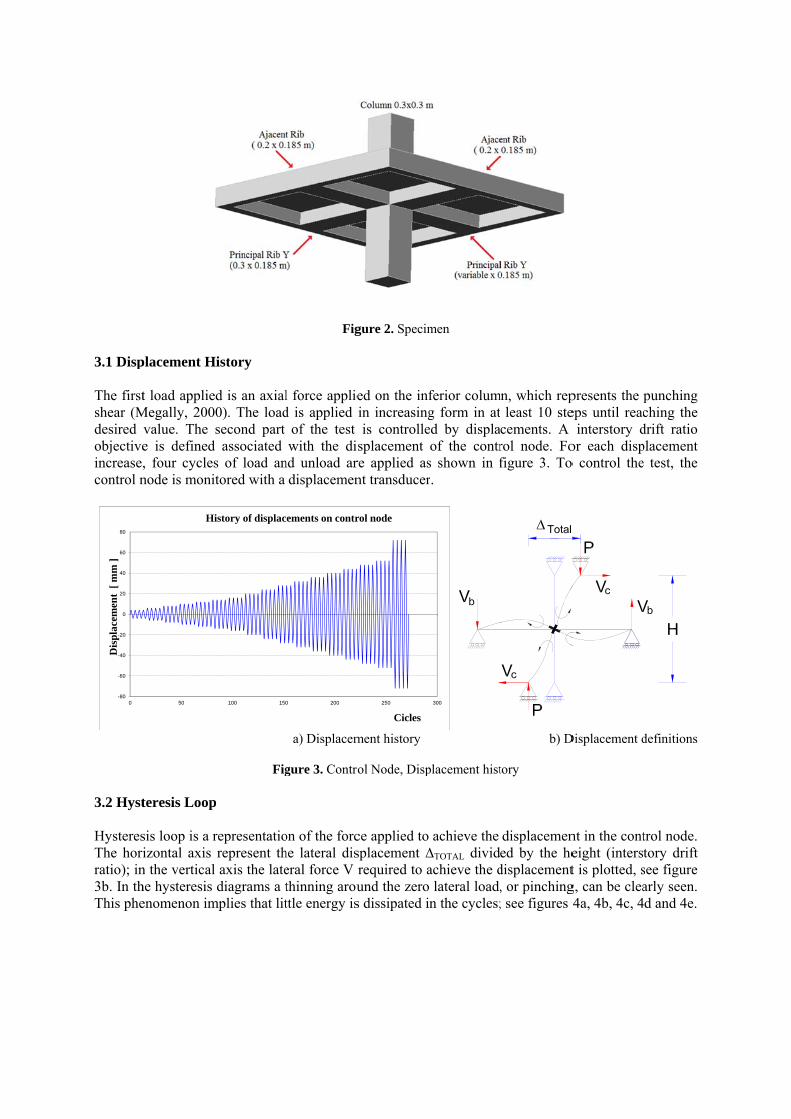
3.1 Disp The firstshear (Mdesired objectiveincrease,control n
3.2 Hyst HysteresThe horiratio); in3b. In thThis phe
-80
-60
-40
-20
0
20
40
60
80
0
Dis
plac
emen
t [
mm
]
placement H
t load applieMegally, 200
value. The e is defined, four cyclesnode is moni
teresis Loop
sis loop is a rizontal axis
n the verticalhe hysteresis enomenon im
50
Hi
History
ed is an axial0). The loadsecond part
d associated s of load anitored with a
Fig
p
representatiorepresent th
l axis the latediagrams a t
mplies that lit
100 150
istory of displac
Fig
l force applied is applied
of the test with the di
nd unload ardisplacemen
a) Displacem
gure 3. Contro
on of the forche lateral diseral force V thinning arouttle energy is
0 200
cements on contr
gure 2. Specim
ed on the infin increasingis controlle
splacement re applied asnt transducer
ment history
ol Node, Disp
ce applied tosplacement ∆required to aund the zeros dissipated i
250
Cicles
rol node
men
ferior columg form in ated by displaof the contr
s shown in fr.
placement hist
achieve the ∆TOTAL dividachieve the d lateral load,n the cycles;
300
mn, which repleast 10 ste
cements. A rol node. Fofigure 3. To
b) D
tory
displacemened by the he
displacement, or pinching; see figures
presents the eps until reac
interstory dor each dispo control the
Displacement d
nt in the conteight (interst is plotted, sg, can be clea4a, 4b, 4c, 4
punching ching the drift ratio placement e test, the
definitions
trol node. tory drift see figure arly seen.
4d and 4e.

Figure 5interstor2004) arbeyond t
Fi
5 shows thery drift ratiosre shown in the limits use
a)
c)
igure 4. Hyste
e envelope os used in thethis figure.
ed in the des
eresis loop a)L
of the hystee design of tIt can be obign, so, the d
e)
LP-02, b)LP-0
eresis curvesthe structurebserved that design regula
03, c)LP-04, d
s. The dispe (0.006 and
in all casesations appear
b)
d)
)LP-05, e)LP-
placements cd 0.012, secti
the maximur to be conse
-06
correspondintion 1.8, NTum resistancervative.
ng to the C-Sismo,
ce is well
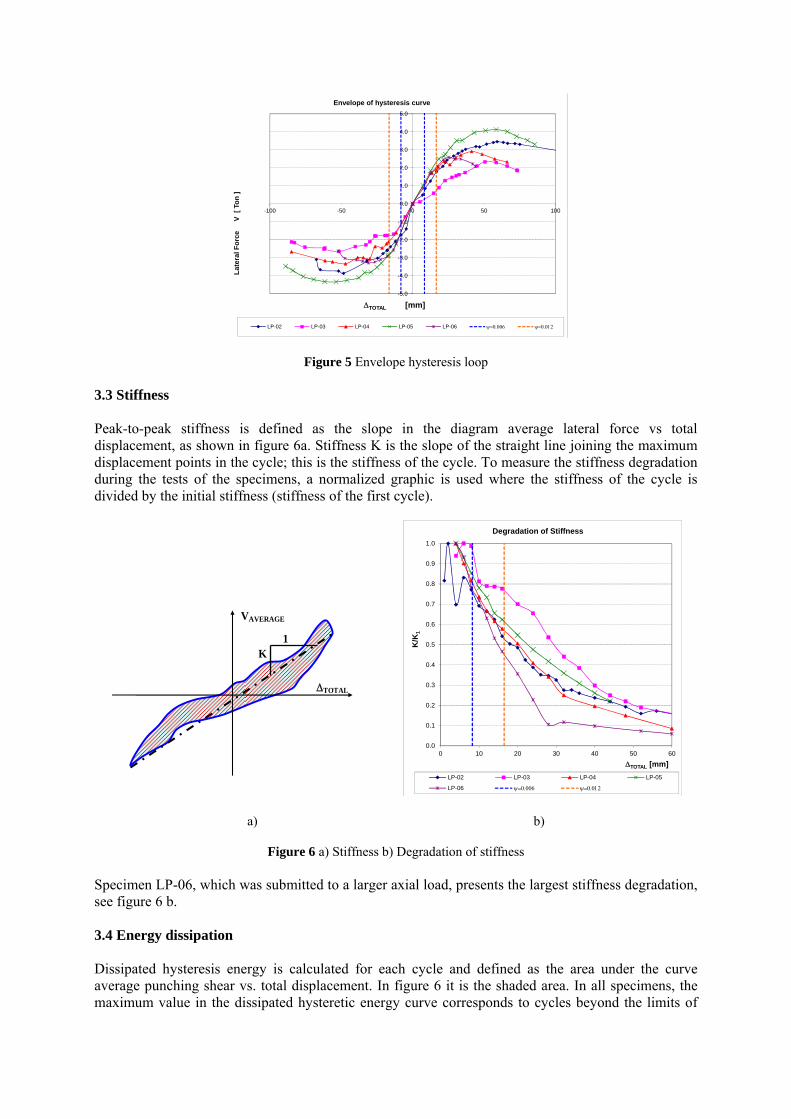
Figure 5 Envelope hysteresis loop 3.3 Stiffness Peak-to-peak stiffness is defined as the slope in the diagram average lateral force vs total displacement, as shown in figure 6a. Stiffness K is the slope of the straight line joining the maximum displacement points in the cycle; this is the stiffness of the cycle. To measure the stiffness degradation during the tests of the specimens, a normalized graphic is used where the stiffness of the cycle is divided by the initial stiffness (stiffness of the first cycle).
a) b)
Figure 6 a) Stiffness b) Degradation of stiffness Specimen LP-06, which was submitted to a larger axial load, presents the largest stiffness degradation, see figure 6 b. 3.4 Energy dissipation Dissipated hysteresis energy is calculated for each cycle and defined as the area under the curve average punching shear vs. total displacement. In figure 6 it is the shaded area. In all specimens, the maximum value in the dissipated hysteretic energy curve corresponds to cycles beyond the limits of
-5.0
-4.0
-3.0
-2.0
-1.0
0.0
1.0
2.0
3.0
4.0
5.0
-100 -50 0 50 100
La
tera
l Fo
rce
V
[ T
on
]
TOTAL [mm]
Envelope of hysteresis curve
LP-02 LP-03 LP-04 LP-05 LP-06
VAVERAGE
TOTAL
K 1
0.0
0.1
0.2
0.3
0.4
0.5
0.6
0.7
0.8
0.9
1.0
0 10 20 30 40 50 60
K/K
1
TOTAL [mm]
Degradation of Stiffness
LP-02 LP-03 LP-04 LP-05
LP-06

interstory drift ratio established in the norms (NTC-Sismo, 2004). It is observed that in most of the tested specimens, a sudden drop occurs after the maximum value is reached. So that maximum value corresponds to the failure of the specimen. Specimen LP-05 was the only one without the sudden drop. It should be noted that the failure mechanism in this specimen may be attributed to a flexural failure in the rib rather than a punching shear, as suggested by the cracking pattern in the specimen.
a) Energy Dissipated b) Energy Dissipated Accumulated
Figure 7. Energy Dissipated [ED]
The graphics of accumulated dissipated hysteretic energy are shown in figure 7b. In specimens LP-02, LP-03, LP-04 and LP-06, a sudden change in the slope of the curves can be observed. This change represents the moments in which the maximum value of ED is reached. In specimen LP-05 this change in the slope is not registered because the failure cannot be linked with a fragile failure as punching shear. 3.5 Equivalent Viscous Damping Equivalent viscous damping, (see figure 8), may be calculated in experimental curves with equation 1 (Chopra, 2000). This parameter represents the internal frictions in the material, which this type of connections is increased by the action of the posttensioned tendons that tends to close the cracks once the loads are removed.
a) b)
Figure 8 a) Definition of Equivalent Viscous damping, b) Experimental Equivalent Viscous damping
0
200
400
600
800
1000
1200
1400
0 10 20 30 40 50 60 70
Dis
sip
ated
Hys
tere
sis
En
erg
y [
To
n x
mm
]
TOTAL [mm]
Dissipated Hysteresis Energy ED
LP-02 LP-03 LP-04 LP-05
LP-06
0
1000
2000
3000
4000
5000
6000
7000
8000
9000
10000
0 10 20 30 40 50 60
Dis
sip
ated
Hys
tere
sis
En
erg
y A
ccu
mu
late
d
[ To
n x
mm
]
TOTAL [mm]
Dissipated Hysteresis Energy Accumulated EDAc
LP-02 LP-03 LP-04 LP-05
LP-06
VAVERAGE
TOTALED
ESo
0.00
0.10
0.20
0.30
0.40
0 10 20 30 40 50 60 70
Da
mp
ing
[
]
Displacement [mm]
Equivalent Viscous Damping by Cicle
LP-02 LP-03 LP-04 LP-05
LP-06
energyStrain
dissipatedEnergy
4
1
4
1
So
Deq E
E (1)
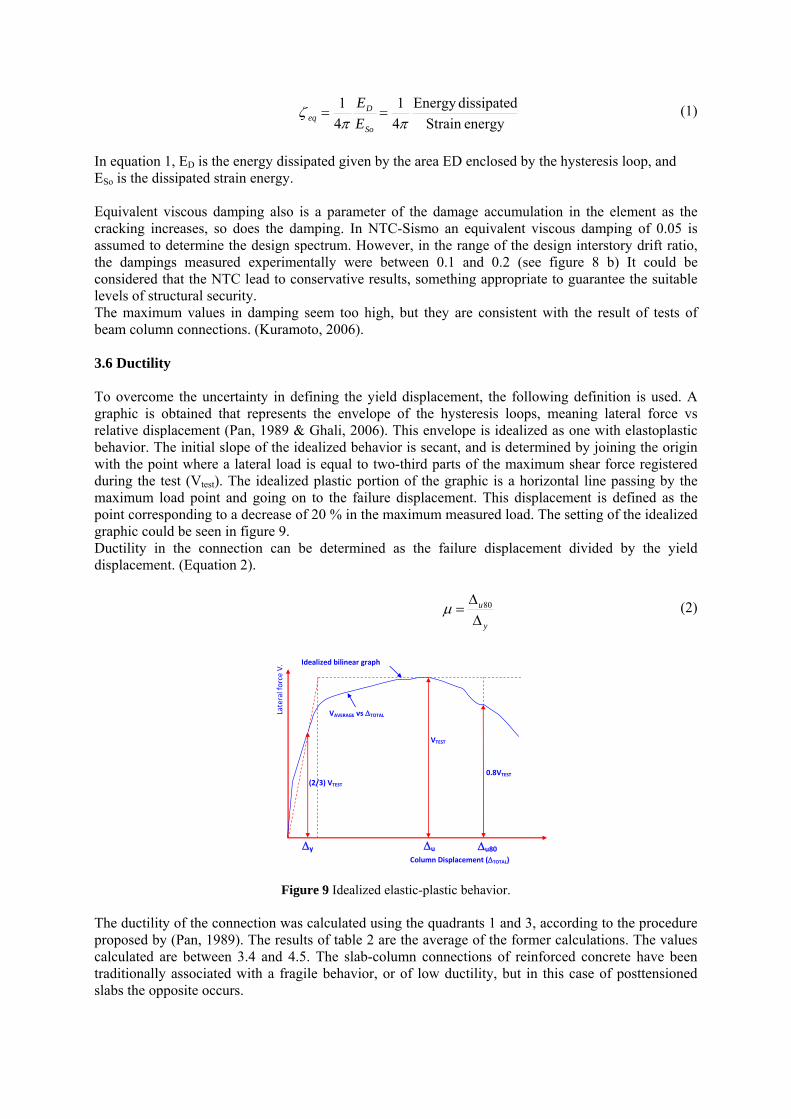
In equation 1, ED is the energy dissipated given by the area ED enclosed by the hysteresis loop, and ESo is the dissipated strain energy. Equivalent viscous damping also is a parameter of the damage accumulation in the element as the cracking increases, so does the damping. In NTC-Sismo an equivalent viscous damping of 0.05 is assumed to determine the design spectrum. However, in the range of the design interstory drift ratio, the dampings measured experimentally were between 0.1 and 0.2 (see figure 8 b) It could be considered that the NTC lead to conservative results, something appropriate to guarantee the suitable levels of structural security. The maximum values in damping seem too high, but they are consistent with the result of tests of beam column connections. (Kuramoto, 2006). 3.6 Ductility To overcome the uncertainty in defining the yield displacement, the following definition is used. A graphic is obtained that represents the envelope of the hysteresis loops, meaning lateral force vs relative displacement (Pan, 1989 & Ghali, 2006). This envelope is idealized as one with elastoplastic behavior. The initial slope of the idealized behavior is secant, and is determined by joining the origin with the point where a lateral load is equal to two-third parts of the maximum shear force registered during the test (Vtest). The idealized plastic portion of the graphic is a horizontal line passing by the maximum load point and going on to the failure displacement. This displacement is defined as the point corresponding to a decrease of 20 % in the maximum measured load. The setting of the idealized graphic could be seen in figure 9. Ductility in the connection can be determined as the failure displacement divided by the yield displacement. (Equation 2).
y
u
80 (2)
Figure 9 Idealized elastic-plastic behavior. The ductility of the connection was calculated using the quadrants 1 and 3, according to the procedure proposed by (Pan, 1989). The results of table 2 are the average of the former calculations. The values calculated are between 3.4 and 4.5. The slab-column connections of reinforced concrete have been traditionally associated with a fragile behavior, or of low ductility, but in this case of posttensioned slabs the opposite occurs.
y
VTEST
VAVERAGE vs TOTAL
(2/3) VTEST
u u80
Idealized bilinear graph
0.8VTEST
Column Displacement (TOTAL)
Lateral force V.
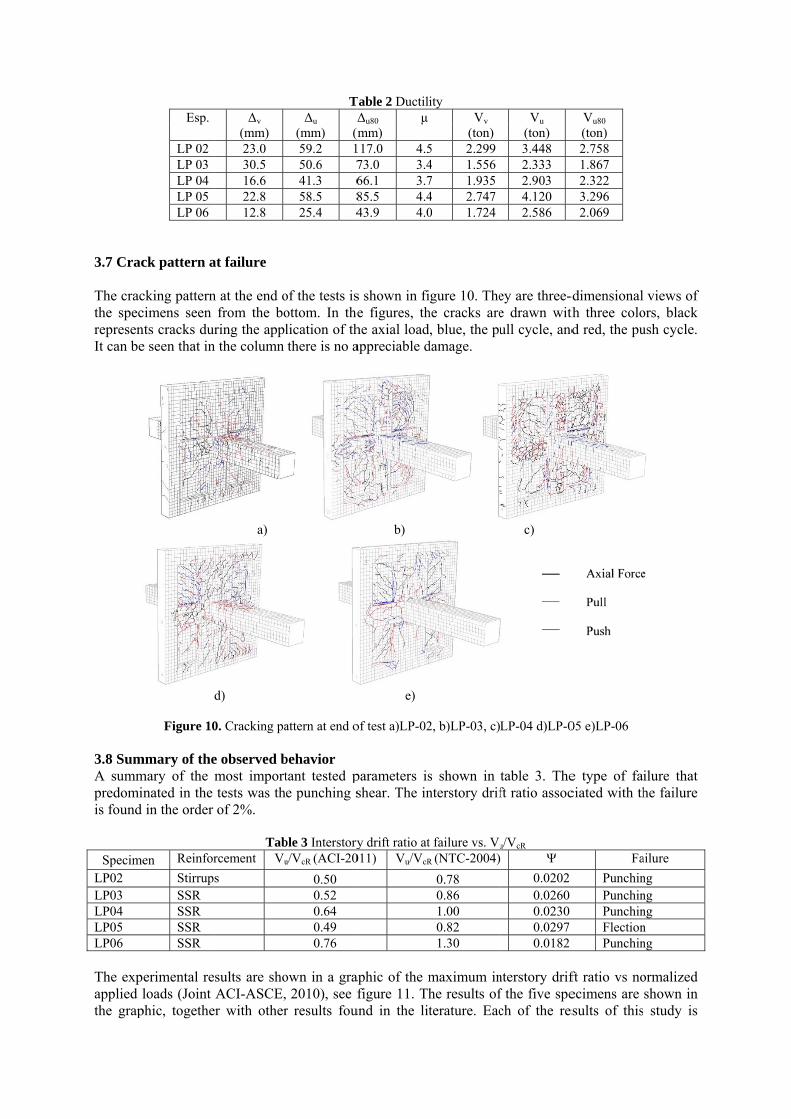
3.7 Crac The cracthe specrepresenIt can be
3.8 SumA summpredomiis found
SpecimeLP02 LP03 LP04 LP05 LP06 The expapplied lthe grap
Esp.
LP 02 LP 03 LP 04 LP 05 LP 06
ck pattern a
cking patterncimens seen nts cracks dure seen that in
Figure 10
mmary of themary of the m
nated in the in the order
en Reinfor
StirrupSSR SSR SSR SSR
erimental reloads (Joint
phic, togethe
Δy (mm) 23.0 30.5 16.6 22.8 12.8
at failure
n at the end ofrom the boring the appl
n the column
a)
d)
0. Cracking pa
e observed bmost importtests was thof 2%.
Tabrcement Vu
s
sults are shoACI-ASCE,
er with other
TΔu Δ
(mm) (m59.2 150.6 741.3 658.5 825.4 4
of the tests isottom. In thelication of ththere is no a
attern at end o
behavior tant tested pe punching s
ble 3 Interstoryu/VcR (ACI-20
0.50 0.52 0.64 0.49 0.76
own in a grap 2010), see fr results fou
Table 2 DuctilΔu80 µmm)
117.0 4.573.0 3.466.1 3.785.5 4.443.9 4.0
s shown in fie figures, thhe axial loadappreciable d
b)
e)
of test a)LP-02
parameters isshear. The in
y drift ratio at011) Vu/VcR
aphic of the mfigure 11. Th
und in the lit
ity Vy
(ton) 5 2.2994 1.5567 1.9354 2.7470 1.724
igure 10. Thehe cracks ared, blue, the pudamage.
2, b)LP-03, c)
s shown in nterstory drif
t failure vs. Vu
R (NTC-2004)
0.78 0.86 1.00 0.82 1.30
maximum inhe results ofterature. Eac
Vu (ton) 3.448 2.333 2.903 4.120 2.586
ey are three-de drawn withull cycle, and
c)
LP-04 d)LP-0
table 3. Theft ratio assoc
u/VcR
Ψ
0.0202 0.0260 0.0230 0.0297 0.0182
nterstory driff the five spech of the res
Vu80 (ton) 2.758 1.867 2.322 3.296 2.069
dimensionalth three colod red, the pu
05 e)LP-06
e type of faciated with th
Fa
PunchinPunchinPunchinFlectionPunchin
ft ratio vs noecimens are sults of this
views of ors, black ush cycle.
ilure that he failure
ailure
ng ng ng n ng
ormalized shown in study is
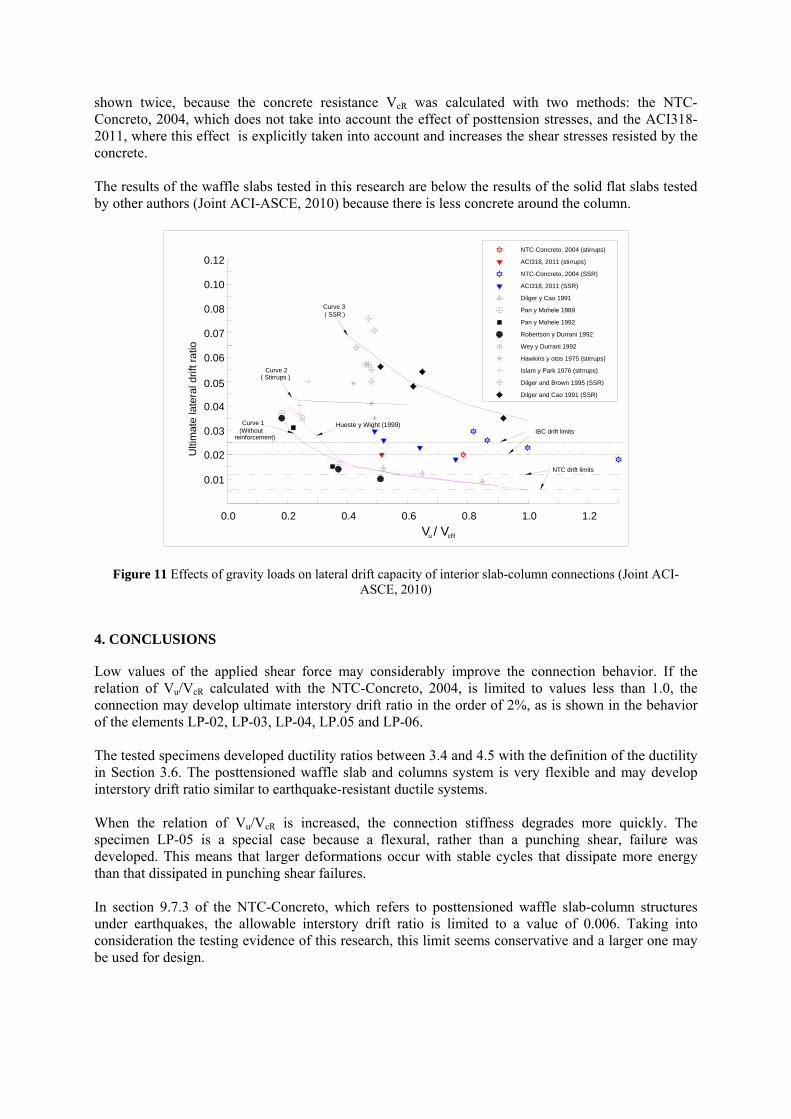
shown twice, because the concrete resistance VcR was calculated with two methods: the NTC-Concreto, 2004, which does not take into account the effect of posttension stresses, and the ACI318-2011, where this effect is explicitly taken into account and increases the shear stresses resisted by the concrete. The results of the waffle slabs tested in this research are below the results of the solid flat slabs tested by other authors (Joint ACI-ASCE, 2010) because there is less concrete around the column.
Figure 11 Effects of gravity loads on lateral drift capacity of interior slab-column connections (Joint ACI-ASCE, 2010)
4. CONCLUSIONS Low values of the applied shear force may considerably improve the connection behavior. If the relation of Vu/VcR calculated with the NTC-Concreto, 2004, is limited to values less than 1.0, the connection may develop ultimate interstory drift ratio in the order of 2%, as is shown in the behavior of the elements LP-02, LP-03, LP-04, LP.05 and LP-06. The tested specimens developed ductility ratios between 3.4 and 4.5 with the definition of the ductility in Section 3.6. The posttensioned waffle slab and columns system is very flexible and may develop interstory drift ratio similar to earthquake-resistant ductile systems. When the relation of Vu/VcR is increased, the connection stiffness degrades more quickly. The specimen LP-05 is a special case because a flexural, rather than a punching shear, failure was developed. This means that larger deformations occur with stable cycles that dissipate more energy than that dissipated in punching shear failures. In section 9.7.3 of the NTC-Concreto, which refers to posttensioned waffle slab-column structures under earthquakes, the allowable interstory drift ratio is limited to a value of 0.006. Taking into consideration the testing evidence of this research, this limit seems conservative and a larger one may be used for design.
V / V0.0 0.2 0.4 0.6 0.8 1.0
0.01
0.02
0.03
0.04
0.05
0.06
0.07
0.08
Ulti
mat
e la
tera
l drif
t rat
io
u cR
Curve 3
Curve 2
Curve 1IBC drift limits
Hueste y Wight (1999)(Without
( Stirrups )
( SSR )
Dilger y Cao 1991
Pan y Mohele 1989
Pan y Mohele 1992
Robertson y Durrani 1992
Wey y Durrani 1992
Hawkins y otos 1975 (stirrups)
Islam y Park 1976 (stirrups)
Dilger and Brown 1995 (SSR)
Dilger and Cao 1991 (SSR)
ACI318, 2011 (SSR)
NTC-Concreto, 2004 (SSR)
1.2
0.10
0.12 ACI318, 2011 (stirrups)
NTC-Concreto, 2004 (stirrups)
NTC drift limits
reinforcement)
Posttensioned waffle-slab and columns systems should not be used to dissipate energy, since the obtained tested hysteresis cycles were thin and present the pinching phenomenon around the origin, because the dominant failure mechanism was punching shear. Both types of shear reinforcement used were suitable to resist the applied load at low levels of interstory drift ratio. When levels of interstory drift ratio larger to those allowed in ductile structures regulations were applied, problems arose in the connections with stud shear reinforcement (SSR), because SSR does not properly confine the longitudinal reinforcement bars in the ribs. Buckling of the bars occurred when the cover concrete was lost. Since current design regulations require designing for low interstory drift ratio (ψ=0.006), it may be said that with both types of reinforcement it is possible to reach similar deformations with the same safety. Shear stud reinforcement has an advantage in the co-location rate, but with the inconvenience that they may not confine properly the compression steel. The use of posttensioned waffle slabs without a solid zone around the column is not recommended. Although this testing evidence seems to show that the system can reach deformation levels larger than those specified in the “Normas tecnicas complementarias para el diseño y construcción de estructuras de concreto (NTC-Conceto, 2004), more studies are required before such recommendation can be made. AKCNOWLEDGEMENT The sponsorship of Federal District Government in the development of this project is gratefully acknowledged, as the scholarship to pursue doctoral studies granted to Eduardo Arellano by CONACYT. REFERENCES ACI Committee 318, (2011), “Building code requirements for structural concrete”, ACI, Farmington Hills, Mi.
USA. Chopra A. K. (2000), “Dynamics of structures” Prentice Hall, USA, pp. 98-105. Cortina, P. (2006), Personal communication, Mexico Englekirk, R,(2006), Personal communication, 2nd Latin-American Meeting of Prefabricated Structures, October
2006, Veracruz, Mexico. Ghali, A. (2006), “Seismic-resistant joints of interior columns with prestressed slabs”, ACI Journal, Sep.-Oct.,
pp 710-719. Joint ACI-ASCE Committee 421, (2010), “Seismic design of punching shear reinforcement in flat plates (ACI
421.2R-10)”, American Concrete Institute, Farmington Hill, Mich., 26 pp. Kuramoto, H. and Nishiyama I., (2000) “Equivalent Damping Factor of Composite RCS Frames” ACI ,
Farmington Hills, Mi. USA. SP196-06 pp 109-124. Megally, S. and Ghali, A. ,(2000) “Seismic behaviour of slab-column connections” Canadian Journal of
Structural Engineering, vol 27, Jan. pp 84-100. NTC-Concreto, “Normas técnicas complementarias para el diseño y construcción de estructuras de concreto”,
(1996), Gaceta Oficial del Distrito Federal, Sexta época, Tomo I, No. 356, México, 25 de Marzo de 1996. (In Spanish).
NTC-Concreto, “Normas técnicas complementarias para el diseño y construcción de estructuras de concreto”, (2004), Gaceta Oficial del Distrito Federal, Décima cuarta época, Tomo I, No. 103-Bis, México, 6 de Octubre de 2004. (In Spanish, http://www.smie.org.mx/paginas/reglamentos/df/es_07.pdf)
NTC-Sismo,”Normas técnicas complementarias para el diseño por sismo”, (2004), Gaceta Oficial del Distrito Federal, Décima cuarta época, Tomo II, No. 103-Bis, México, 6 de Octubre de 2004. (In Spanish, http://www.smie.org.mx/paginas/reglamentos/df/es_08.pdf)
Pan, A., and Moehle, L.P., “Lateral Displacement Ductility of Reinforced Concrete Flat-Slabs”, ACI Structural Journal, V.86, No. 3, May-June 1989, pp250-258.