Embed Size (px)
Citation preview
Nat.Lab. report Nr UR 022/95
Xavier Croizé
Supervised by Hans Cillessen
PULSED LASER DEPOSITION
“General view and off axis deposition technique study”
O Philips Electonics N. V. 1995 All rights are reserved, Reproduction in whole or in part is prohibited without the written consent ofthe copyright owner

report UR 022/95
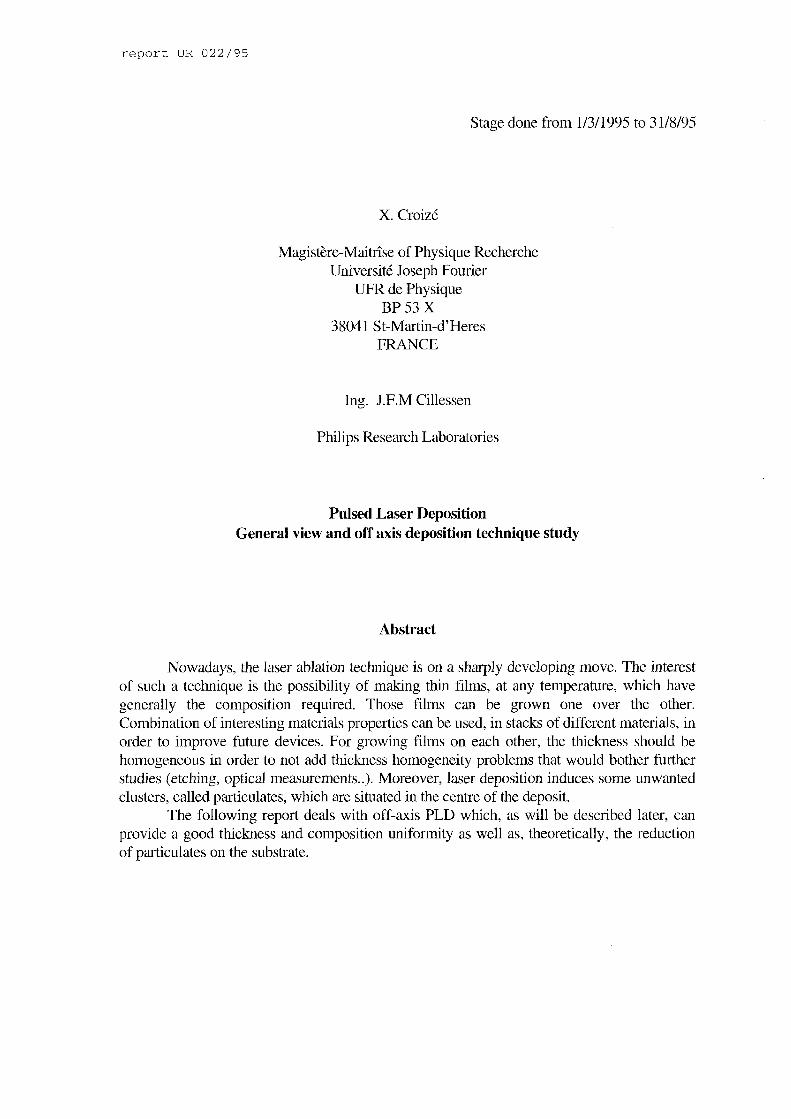
Stage done from 1/3/1995 to 31/8/95
X. Croizé
Magistère-Maitrîse of Physique Recherche Université Joseph Fourier
UFR de Physique BP 53 X
3804 1 St-Martin-d’Heres FRANCE
Ing. J.F.M Cillessen
Philips Research Laboratories
Pulsed Laser Deposition General view and off axis deposition technique study
Abstract
Nowadays, the laser ablation technique is on a sharply developing move. The interest of such a technique is the possibility of making thin films, at any temperature, which have generally the composition required. Those films can be grown one over the other. Combination of interesting materials properties can be used, in stacks of different materials, in order to improve future devices. For growing films on each other, the thickness should be homogeneous in order to not add thickness homogeneity problems that would bother further studies (etching, optical measurements..). Moreover, laser deposition induces some unwanted clusters, called particulates, which are situated in the centre of the deposit.
The following report deals with off-axis PLD which, as will be described later, can provide a good thickness and composition uniformity as well as, theoretically, the reduction of particulates on the substrate.

CONTENTS
1 Introduction
2 Theory 2.1 Pulsed Laser Deposition 2.2 Different parameters
3 Experimental
4 Ellipticity measurements
5 Results
6 Consequences of the offset: composition homogeneity
7 The other part of the work
S Different analysis procedures used Special materials: characteristics for PLD technique
9 Conclusion-Aknowledgements References
Appendix: Calculations in order to prove the cosine power
1
2 2 4
5
5
12
18
22
23 24
26 27
25
Distribution 30

UR 022/95
1 Introduction
This report describes the Pulsed Laser Deposition (PLD) technique. This way of making thin films is in expansion all over the world because it is simple compared to other techniques, such as MBE or sputtering, and a lot of interesting properties are being discovered. A simple technique is easy to control and one can focus on material problem in a versatile way.
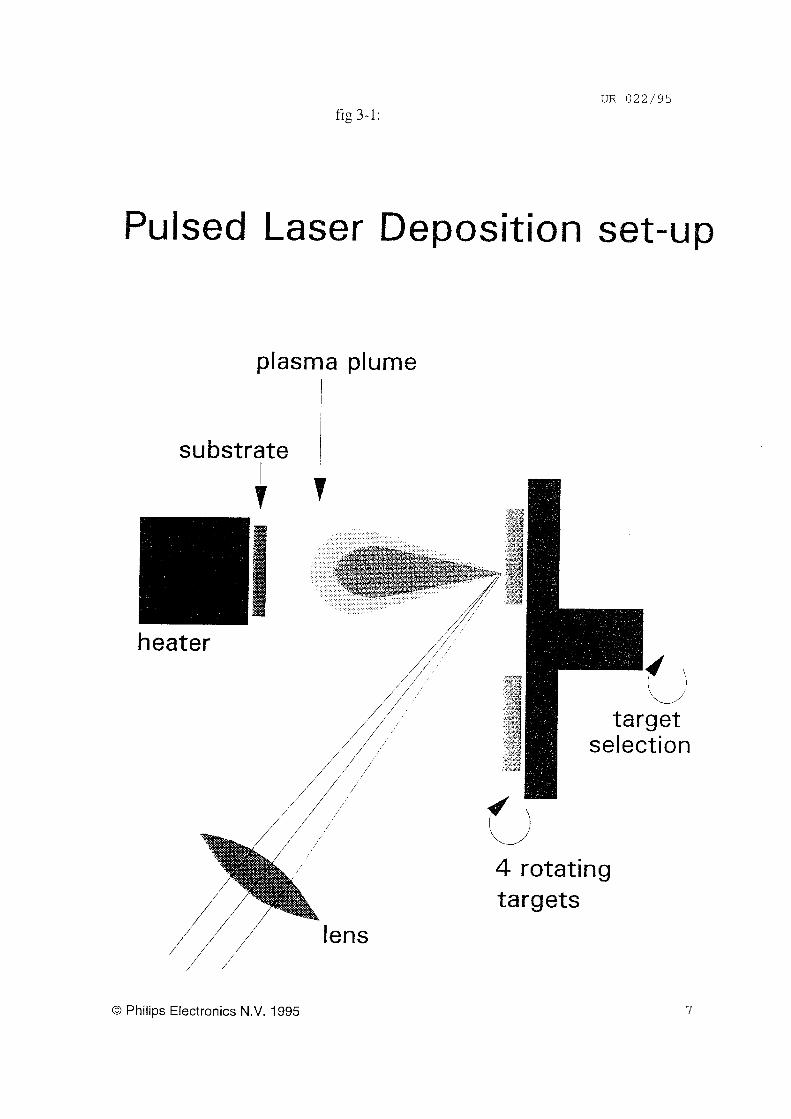
The main idea is simple: a laser enters a vacuum chamber and is focused on a target. This material is evaporated by the incident power: a plasma plume composed of the target compound is formed. A s a result from a short collisional mean free path in this dense plume, the plasma expands into the vacuum. If a substrate is in front of the target, the ablated species are deposited on it and the result is a layer of the recondensed target material on the substrate.
The advantage of this technique lies in the possibility of reproducing the exact stoechiometry of the multicomponent target and also of growing many different layers if one changes the target. Unfortunately, the thickness of the ablated layer is not always perfectly homogeneous. Moreover, one can observe many droplets (typically from the wavelength size to 1 pm) on the substrate layer whose concentration is higher in the centre of the plume.
O Philipc Electronics N.V. 1995 1
UR 022/95
2 Theory
2.1 PLD theory
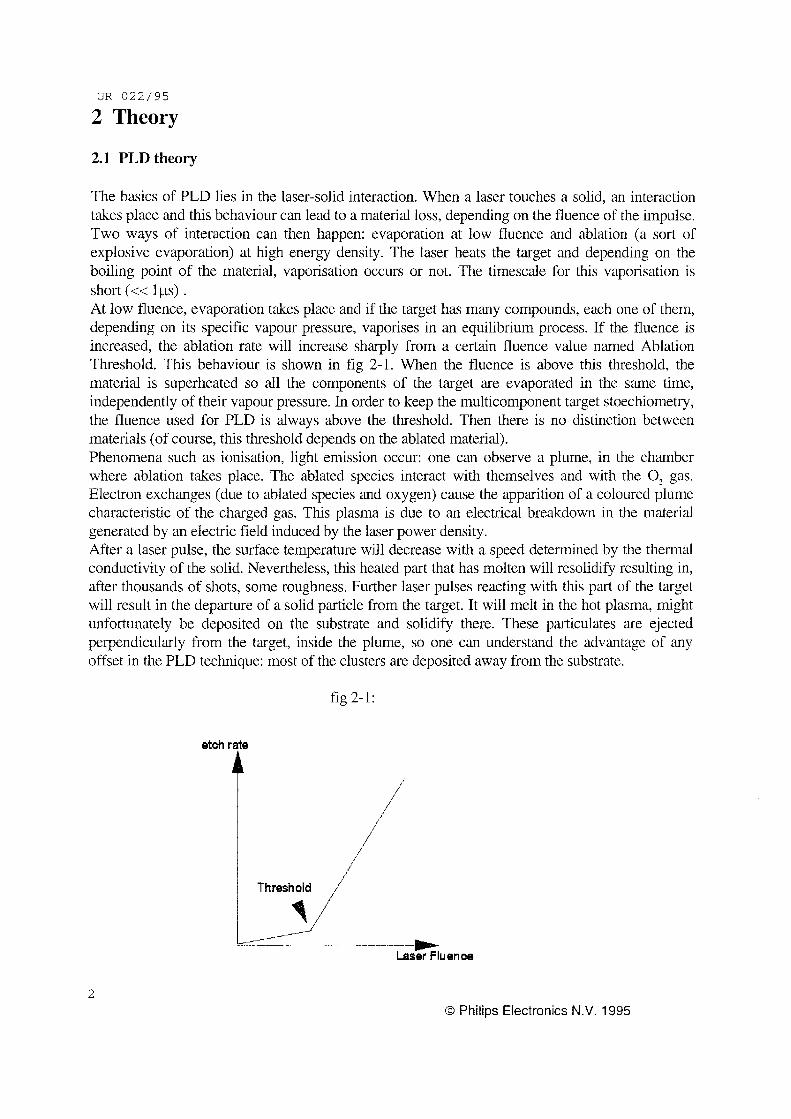
The basics of PLD lies in the laser-solid interaction. When a laser touches a solid, an interaction takes place and this behaviour can lead to a material loss, depending on the fluence of the impulse. Two ways of interaction can then happen: evaporation at low fluence and ablation (a sort of explosive evaporation) at high energy density. The laser heats the target and depending on the boiling point of the material, vaporisation occurs or not. The timescale for this vaporisation is short (« 1 cis) . At low fluence, evaporation takes place and if the target has many compounds, each one of them, depending on its specific vapour pressure, vaporises in an equilibrium process. If the fluence is increased, the ablation rate will increase sharply from a certain fluence value named Ablation Threshold. This behaviour is shown in fig 2-1. When the fluence is above this threshold, the material is superheated so all the components of the target are evaporuted in the same time, independently of their vapour pressure. In order to keep the multicomponent target stoechiometry, the fluence used for PLD is always above the threshold. Then there is no distinction between materials (of course, this threshold depends on the ablated material). Phenomena such as ionisation, light emission occur: one can observe a plume, in the chamber where ablation takes place. The ablated species interact with themselves and with the O, gas. Electron exchanges (due to ablated species and oxygen) cause the apparition of a coloured plume characteristic of the charged gas. This plasma is due to an electrical breakdown in the material generated by an electric field induced by the laser power density. After a laser pulse, the surface temperature will decrease with a speed determined by the thermal conductivity of the solid. Nevertheless, this heated part that has molten will resolidi@ resulting in, after thousands of shots, some roughness. Further laser pulses reacting with this part of the target will result in the departure of a solid particle from the target. It will melt in the hot plasma, might unfortunately be deposited on the substrate and solidi@ there. These particulates are ejected perpendicularly from the target, inside the plume, so one can understand the advantage of any offset in the PLD technique: most of the clusters are deposited away from the substrate.
fig 2- 1 :
etch raie
A
I Threshold 1 i I
Ir, Laser Fluence
2 O Philips Electronics N.V. 1995

UR 022/95
L--j
The laser touches the target with an angle of 45". A thin layer is ablated, forming a cloud which surrounds the target. Within the laser pulse, the cloud above the target acts like a shield (furthermore, the laser interacts with the cloud, heating it). Therefore, the plasma density increases and becomes opaque, shielding the surface from further exposure. So a dense gas is formed by evaporation from a hot surface. There is an interaction between the target and the gas which lies above it, resulting in a momentum exchange and leading to a one dimensional expansion (in the z- axis) along the target normal. The third and last step (in a vacuum environment) is a three dimensional adiabatic expansion. It is induced by a pressure gradient within the ablated gas cloud. The result is a three dimensional propagation into the vacuum
s
i
fig 2-2:
Evaporation
- I + i-D Expansion i
O Philips Electronics N.V. 1995 3
UR 022/95 2.2 Different parameters
All the thin films made were oxidic (namely, Ba,Zi,O,(BZO) ; Sn0,:Sb in which the dopage of antimony-X ppm- varies (ATO-X), Sr,Ru,Oxygen,(SRO), Pb,Zr,Ti,, O, (PZT), Sr,Ti,O, (STO) ). Unfortunately, when the ablation process takes place, there is a loss in the oxygen compound of the target. To compensate this, an oxygen environment has to be introduced. This is the only solution to deal with this oxygen loss and to produce oxidic thin films. The properties of oxidesare diverse and go from dielectric to piezoelectric, isolator ... Anyone who would grow materials with problem such as unwanted oxidation state of the cations would not end up with the expected properties ...
The pressure during the ablation is an important parameter; the following part will try to introduce the concepts that make this variable such a critical one for ablation. In vacuum, only the interaction between ablated species in the plume is responsible for scattering. In O, pressure many phenomena can happen: the interaction between O, gas and ablated species causes an energy loss for the ablated materials. Moreover the energy of each studied specie is really important because chocks are now appearing. Therefore, for a 3 material target (BZO ...), mass of each compound becomes a factor that one might count on.
One might also deal with an electrodynamic interaction: depending on the laser energy, the proportion of ions might or not be negligible. The laser parameters such as fluence, wavelength and frequency should also not be forgotten. Of course, the energy distribution of its beam might also be important (described later in this report).
The substrate temperature is a major factor for film deposition. The temperature is critical since two effects are related to this factor: the sticking coefficient can be assumed to unity at room temperature but it is a fact that, while heating the substrate, it will dramatically decrease. Moreover at room temperature, amorphous films are obtained because the energy necessary for crystallisation is not provided. For oxydic materials with the perovskite crystal structure, a substrate temperature of around 600°C is necessary to fully crystallise thin films. That is why most of the experiments were done close to this temperature.
4 O Philipc Electronics N.V. 1995
UR 022/95
3 Experimental
Laser An ArF excimer laser, which provides a 193nm wavelength, is used. It is the shortest commercially available wavelength: the smaller the wavelength, the smaller the penetration depth in the target. Moreover, UV ablation is very efficient for allmost any material. For all the expe- riments described, 350 mJ per pulse were used. This laser provides a special energy distribution: Gaussian in the vertical direction and top hat shaped in the horizontal axis. The beam cavity was provided with special electrodes delivering the beam shape described. This laser has a very useful function: ILC which controls the high voltage in order to get a constant energy value. The laser opening is controlled by a shutter, situated directly after the laser cavity. This allows an easy start and stop of the ablation process. The Lambda Physik laser beam is transported via two adjustable mirrors through a Plexiglas box, which is flushed with N,. Those mirrors must be handled with care because they are coated with a thin dielectric multilayer in order to be highly reflective. The nitrogen secures from an eventual loss of power of the laser beam and allows to better control its accurate value. After the second mirror, the beam is directed on a f/300mm lens. With the translation of this lens, one can change its distance to the target and so the imprint of the laser beam after focusing. For most of the experiments, a setting distance providing a rectangular spot (4.5x1.5mm) on the target was used. It corresponds to a fluence of 5J/cm2. One might check that the mirrors and the entering window are not dirty, otherwise they might induce a loss in energy.
Substrate Substrates are glued on a ceramic 65mm diameter disc with a solution of silver powder in ethanol. This way of gluing ensures a good thermal contact and avoids the use of metal clamps which leave tracks on the substrate. The ceramic absorber is clamped by three springs to a metallic ring. This one is attached to an externally V-grooved metallic frame by a conical shaped 0.2 mm stain- less steel foil. The whole is bound to a stainless steel gear-wheel, which is driven by a ceramic gearwheel. The conical shape of the absorber allows the focused laser beam to reach the target without any interaction with the substrate holder.
Heater The space behind the cone is occupied by two quartz lamps which constitute the heating system. Those lamps provide a good warming system (160 Watts are needed by the heater at 505°C and 213.75 W in order to reach 605°C) and of course a cooling water system is then necessary. The voltage applied to those lamps is PID controlled and so, the substrate temperature can be programmed to reach the maximum temperature in 10,20 or 50 minutes. The same device allows a slow cooling down process in order to not introduce any crack on the deposited layer. For any epitaxial deposition, a 50 minutes cooling time is necessary whereas a 20 minutes one was used for other experiments. A Sic absorber disc, the ceramic disc discussed in the “substrate” paragraph, is used for its good thermal conductivity and emissivity. The lamps are soldered with platinum wire to the external and due to different expansion coefficients between the lamps and the wires that connect them to the temperature controller, those laser welded bounds may break after many cycles to high temperature. The lamps are immediately disconnected from the system and the temperature dramatically decreases.
O Philips Electronics N.V. 1995 5
UR 022/95 mounting The cone onto which the substrate is mounted allows the rotation of the substrate during ablation. The speed is controlled by a computer and the absorber unit is rotating with a 8.14 round per minute speed. The rotation allows thickness uniformity. Moreover the rotation provides a homogeneous temperature distribution of the substrate while heating as well as when cooling down, in order to avoid cracks. The substrate holder is mounted on two translation stages: one to change target-substrate distance (parallel to the plume) and one to offset the centre of the plume from the middle of the substrate. For most of the experiments, the target-substrate distance was kept constant at 60mm.
target Most of the targets used have the perovskites crystal structure (A,B,O,). They were flattened in order to be parallel to the substrate. Each one is connected, to a target holder. This holder is mounted in a four-target carrousel. The target in use is driven by a motor outside the vacuum. The goal of rotating the target is clear: do not dig a hole into it. Each laser pulse ablates a new target place which has not been touched the instant before ... In this way, target waste can be av0ided.A differential wear appears, due to the fact that the rotational speed is the same for each point of the target but not the tangential speed.. So the outer part of the target will be less ablated than the the centre. Therefore, unfortunately, a small slope will appear with a dip in the centre of the target. This will introduce an angle between the substrate normal and the plume that one has to accouizt for. Furthermore, the target and the substrate might be parallel within 1”. In total the error of angle in parrallellicity is around 2.5” and along the target-substrate distance ( ~ 6 0 mm), it corresponds to a shift of the centre of the deposit of ~2.6mm. Moreover an axis connects the exterior of the chamber and the carrousel in order to rotate the carrousel and change the targets without breaking the vacuum. It can also be moved in the z-axis by a translation stage in order to open the system, change the target and manipulate inside the vacuum chamber when the ablation is over.
vacuum chamber The substrate holder is situated in a 50 litres vacuum chamber. This chamber can reach a vacuum of lox mbar using a rotational and a turbopump. The set up of this vacuum chamber allows the introduction of three gases namely O,, H,, and N,. The latter one is used to flush the system pipes when one wants to go from an oxygen ablation to another reactive gas (fast gas switching system). In fact, the pipes can be connected to a wide variety of reactive gases like NO,, NH,, H, ... Depending on the pressure needed, two devices help us in the gas control. At high pressure, a MKS baratron takes care of the gas entry whereas at high vacuum a Varian ionisation manometer is used. Both are controlled by a calibration voltage which tells what voltage to apply in order to obtain the expected pressure. For high pressure (>lo” mbars), the “process” command is used to throttle the turbopump. The PLD machine used in this stage is useful for its versatility and the high pressure range possible during ablation. Many windows are built in order to check if everything is all right during the ablation or to introduce other devices in later stages (such as time-of-flight detector.. .). One has to be careful with the manipulation of anything that might be inside the vacuum chamber: everything should be touched only with gloves. Moreover, if some targets have just be flattened, it was done with a special grease and so they have to be rinsed with ethanol in order to not introduce this fat in the vacuum.
6 O Philips Electronics N.V. 1995
UR 022/95 fig 3-1:
Pulsed Laser De osition s
plasma plume
substrate
7
heater
lens /’ /’
O Philips Electronics N.V. 1995 7
UR 022/95
4 Ellipticity measurements
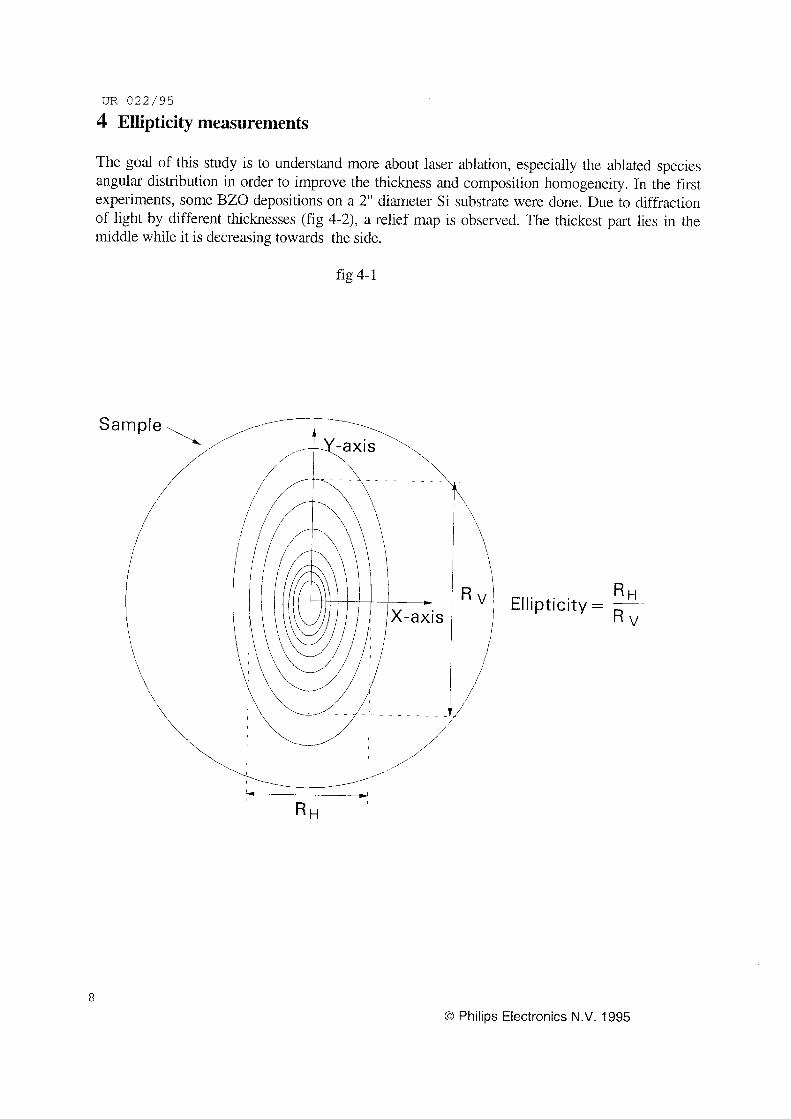
The goal of this study is to understand more about laser ablution, especially the ablated species angular distribution in order to improve the thickness and composition homogeneity. In the first experiments, some BZO depositions on a 2” diameter Si substrate were done. Due to diffraction of light by different thicknesses (fig 4-2), a relief map is observed. The thickest part lies in the middle while it is decreasing towards the side.
fig 4-1
R H R V
Ellipticity = __
8 O Philips Electronics N.V. 1995

O Philips Electronics N.V. 1995
UR 022/95
9
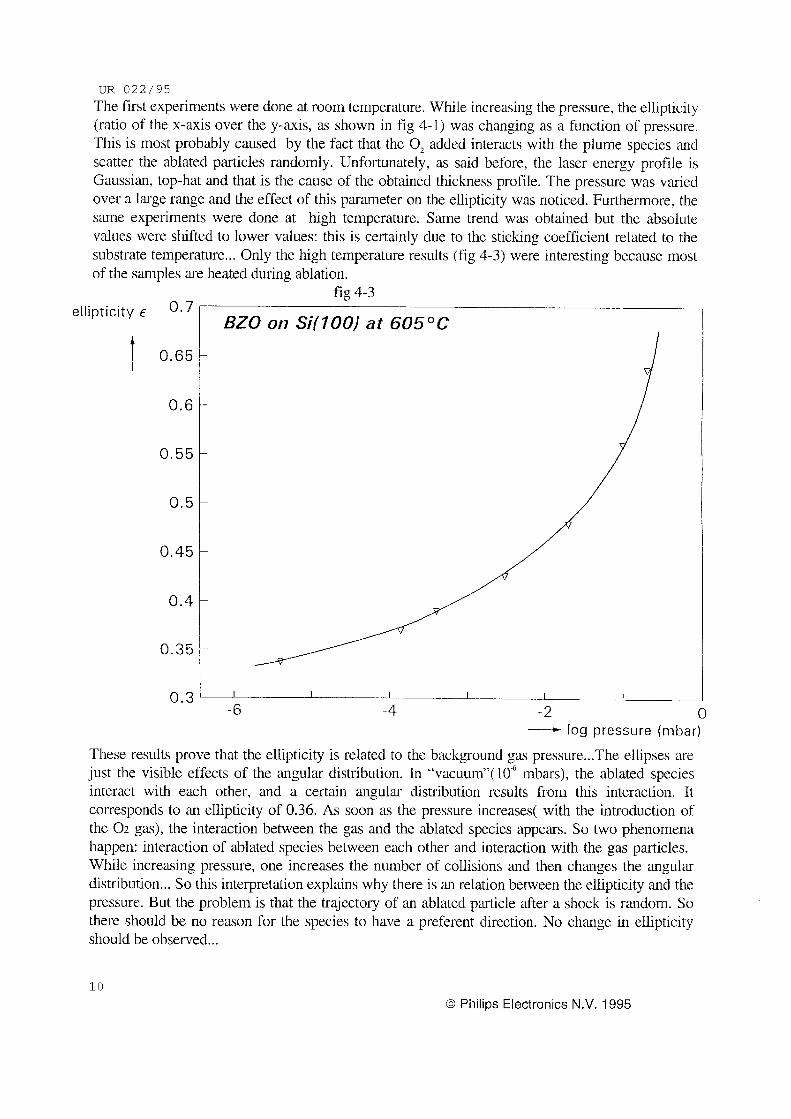
UR G22/95 The first experiments were done at room temperature. While increasing the pressure, the ellipticity (ratio of the x-axis over the y-axis, as shown in fig 4-1) was changing as a function of pressure. This is most probably caused by the fact that the O, added interacts with the plume species ‘and scatter the ablated particles randomly. Unfortunately, as said before, the laser energy profile is Gaussian, top-hat and that is the cause of the obtained thickness profile. The pressure was varied over a large range and the effect of this parameter on the ellipticity was noticed. Furthermore, the same experiments were done at high temperature. Same trend was obtained but the absolute values were shifted to lower values: this is certainly due to the sticking coefficient related to the substrate temperature.. . Only the high temperature results (fig 4-3) were interesting because most of the samples are heated during ablation.
fig 4-3 ellipticity E 0.7
0.65
0.6
0.55
0.5
0.45
0.4
0.3 ‘ I I I I I I
-6 -4 -2 O - log pressure (mbar) These results prove that the ellipticity is related to the background gas pressure ... The ellipses are just the visible effects of the angular distribution. In “vacuum”(106 mbars), the ablated species interact with each other, and a certain angular distribution results from this interaction. It corresponds to an ellipticity of 0.36. A s soon as the pressure increases( with the introduction of the 0 2 gas), the interaction between the gas and the ablated species appears. So two phenomena happen: interaction of ablated species between each other and interaction with the gas particles. While increasing pressure, one increases the number of collisions and then changes the angular distribution ... So this interpretation explains why there is ‘an relation between the ellipticity and the pressure. But the problem is that the trajectory of an ablated particle after a shock is random. So there should be no reason for the species to have a preferent direction. No change in ellipticity should be observed.. .
10 O Phiiips Electronics N.V. 1995

UR 022195 A way to solve this problem is to look at the energy distribution. It has been shown that the Y-axis in the laser imprint was related to the X-axis of the deposit and the target Y-axis was responsible of the X-axis deposit. This is also called the “flip over”: The longest direction of the laser spot results in the shortest one in the deposition pattern (see reference 2 ) . When the laser touches the target, the important parameter for the amount of ablated species is the absorption coefficient which might be dependent on the incident energy. Their relation can be supposed linear. This approximation might seem rude but this assumption can be used as a beginning. Furthermore, it will be supposed that the gas cloud is of imprint-like size (rectangle), parallel with the target.
Outside the plume, the pressure used during ablation is set. Inside the plume lies another pressure induced by ablation. With the former hypothesis, the ablated cloud pressure will have the same profile as the laser energy: namely, with the notations used before, the X-axis will be tophat and the Y axis will fit to a Gaussian profile.. Resulting from this, there will be a position-dependent pressure difference between the gas cloud and the ablation chamber. To talk about difference in pressure or energy in a quantitative explanation is about the same. The energy will now be used as unity in order to understand better what is going on. Due to the Gaussian profile, the species emitted from the Y-axis laser imprint had less energy (converging as a Gaussian, rapidly to O on the sides), than the pcarticles that started their travel on the substrate X-axis. A s a consequence of the “flip-over”, the ones that finish on the Y-axis were ablated with the top-hat energy (higher than the Gaussian). So the Y-axis of the substrate pattern is composed of species which were not (or really less than the other direction) influenced by the pressure contrary to the X-axis. Therefore, the background pressure dependence is higher for one direction of the substrate pattern than for the other one.. The ellipticity will therefore be depending on pressure. Of course this is just a model in which all the species are emitted in a plan parallel to the target normal. But one can understand that gas scatter in every direction and that is the reason why the final deposition pattern does not show the target size.
To prove that, a rectangular slit was introduced between the laser exit and the vacuum chamber. The laser is passing through this slit (not thin enough for diffraction anyway) whose opening was set in order to allow only a part of the initial beam to pass. This particular setting was done to keep only the central part of the Y-direction Gaussian beam and avoid the sides of the Tophat one. With this setting, if the former explanation was good, one would expect to see no change in ellipticity with the change of pressure: If only the high energy part is kept in the both directions, it looks like an energetically isotropic beam and both direction should be influenced by the background gas pressure in the same m o u n t . This was done at room temperature and with a 6cm target to substrate distance but no change was evident at first sight: for P=lO-‘ , ~=0.30 and for a 0.2mbar pressure, the ellipses were close to 1. The same experiment was done at high temperature with a smaller slit. A target to substrate distance of 4cm was used in order to increase the thickness deposited (at high temperature, the substrate sticking coefficient is lower then it is easier to deposit with a smaller target-substrate distance). An ellipticity of 0.275 was observed at 7E-6 mbars pressure whereas u value of 0.54 was noticed at 0.2 mbar. This result shows a dependence of ellipticity as a function of pressure. Maybe it is due to the fact that the slit was not small enough and the Gaussian profile did not turn into a “Tophat-like” distribution.
O Philips Electronics N.V. 1995 11

UR 022/95
5 Results
In this chapter, the results will be described about samples made in a background oxygen pressure of 0.2 mbar. Those experiments were done on Si at high temperature (~605" C). A s one can see in fig 4-2, the different colours appear well. It is due to the computer utilisation and the many useful function of "Core1 Draw" and "Photopaint". The accurate ellipticity can then be checked (in this case, r=0.64). The next step is the etching but no picture will be shown due to its lower interest. One just needs to know that the stripe was left in the vertical direction. Afterwards, the steps were measured as a function of the position on the substrate (one measurement per mm) by the Talystep (Rank Taylor Hobson U.K.) technique. A diamond stylus of 2.5 pm tipradius was used. Results are shown in figure 5-1. As one can see, two steps were done because it is a way to double check the thickness..
fig 5-1: -~ ,, 2 'ZI'U
'-IJ - I i i lr-T-----TTI~ _L A - I ti^^^'^^^^^!!^^^^^^^^ 4112/1ZllM
~ : - ~ ~ ~ - ~ ~ - ~ ~ , - ~ ~ ~ ~ l { - ~ ' I J i \ 1 f rr;.r i I ' ' ( T.ACE lil E' GLnNO RANK ;XY:C)R HCesm LEIC=S-E~ - 6133- ,WOE IN ENGLAND
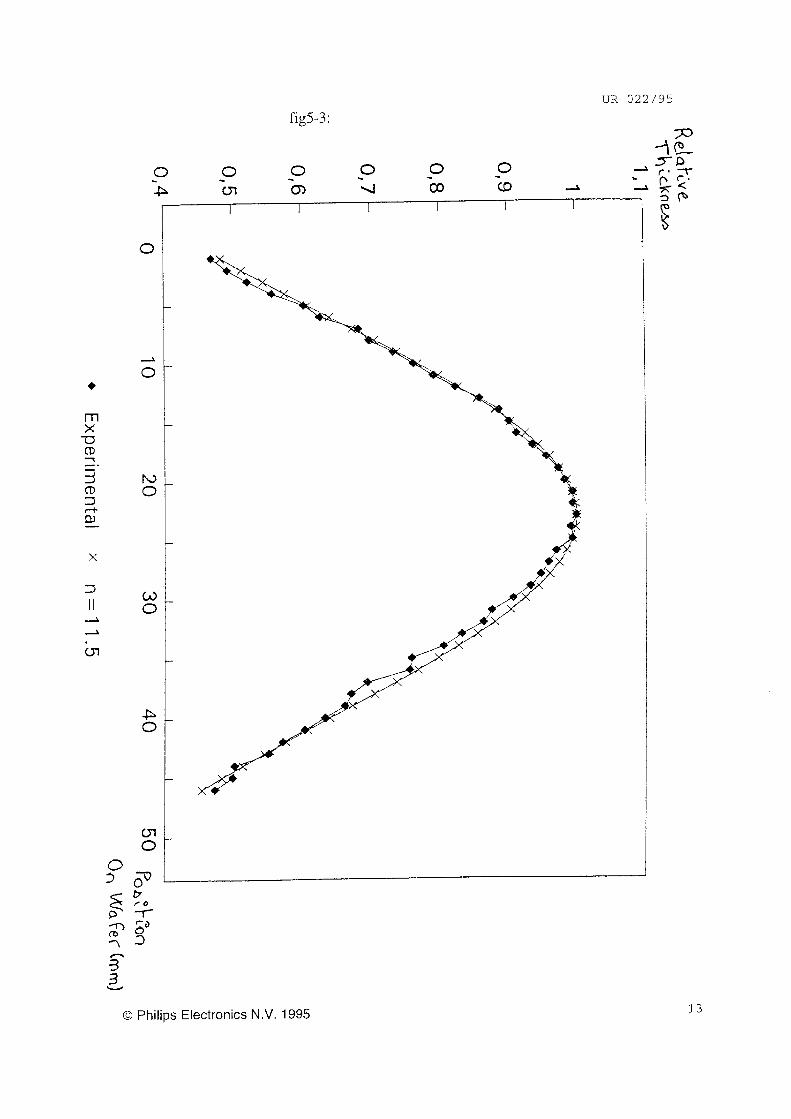
These results were set in a "Lotus" file in order to fit the thickness as a function of 9 in a cos"(9) graph (shown in 5-3). 0 is defined as the angle from the target normal ,in fig 5-2.
12
1
offset 'R' q 1 1 i
:fig 5-2
O Philips Electronics N.V. 1995 :I,
UR 022/95 fig5-3:
73 -\CL 3-P - O O O O O
I I 1 I l I m 4 co CD A
O
o
2
O
bJ O
c3 O
P O
CTi O
0 Philips Electronics N.V. 1995 13
UR 022/95 A s one can see, the power n=ll.S fits well to the curve and was chosen for further
calculations. For this pressure, ~=0.64 and n=11.5. With those two data, the thickness profile, if the substrate had rotated, can be calculated by the following equation:
in which: r and a are the coordinate system of the substrate. R is the offset. D is the value of the target-substrate distance and is in our case 60 m. This formula can also be written as following:
A(& d)" Th(a, I^) = (E2d2 +&2(-)2,sin2a-(-.cosa-1) 1. I" 2 7 4 ) -
R R
where d is a dimensionless value given by d=DíR.
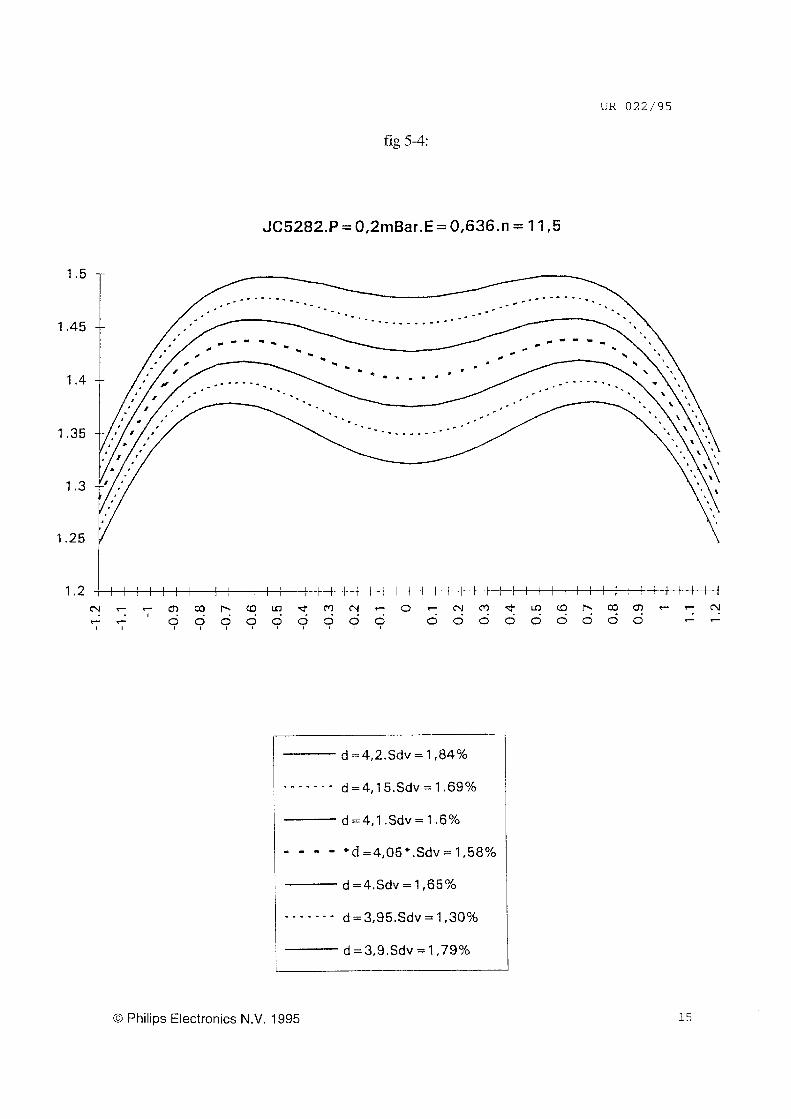
This equation needs to be integrated all along the surface by varying a from O to 2.n. Parameters given for calculations were ellipticity, cosine power and d range where to find the best thickness homogeneity. A s can be seen in 5-4, the relative thickness is calculated as a function of position in R range.
The values have been handled using Excel 4.0 and then for each d value the standard deviation and mean value were calculated between r = -R and r = R(the central part is the most interesting).
(StDev2(x,, xi.., x,,)= ) i1
The lowest ratio of those two quantities gave the d for which the thickness homogeneity is the best. The Standard Deviation formula was used because it is really well known. One might be careful with its use due to the fact that it is a weight average and so the value is masking peaks of thickness inhomogeneity.
14 O Philips Electronics N.V. 1995
UR 022/95
fig 5-4:
JC5282.P = 0,ZmBar.E = 0,636.n = 11,5
1.5
1.45
1.4
1.35
1.3
1.25
d =4,2.Sdv = 1,84%
d=4,15.Sdv=1.69%
d = 4,l .Sdv = 1.6%
* d = 4,05 * .Sdv = 1 ,58 %
d =4.Sdv = I ,65%
- -. . - - -
- - - -
- - - - - - - d =3,95.Sdv = 1,30% d=3,9,Sdv=1,79%
O Philips Electronics N.V. 1995 15
UR 022/95 Results for other uressures
0.02 3.00E-03 4.00E-04
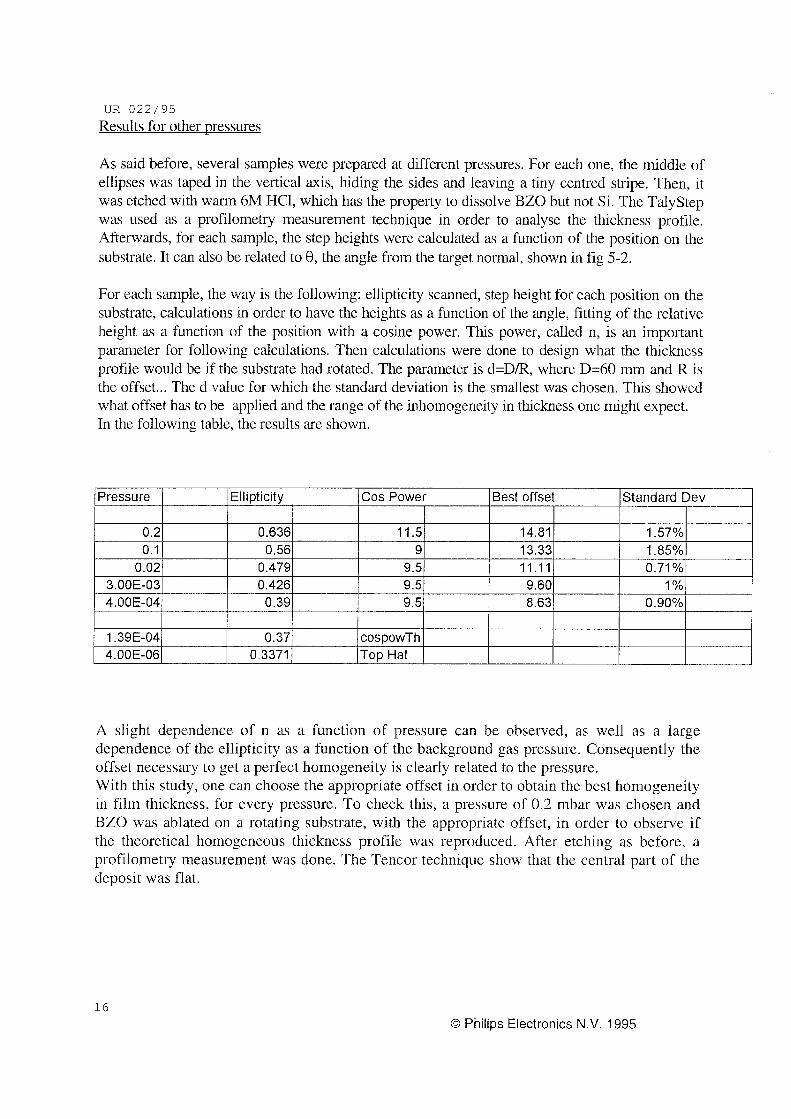
A s said before, several samples were prepared at different pressures. For each one, the middle of ellipses was taped in the vertical axis, hiding the sides and leaving a tiny centred stripe. Then, it was etched with warm 6 M HCI, which has the property to dissolve BZO but not Si. The TalyStep was used as a profilometry measurement technique in order to analyse the thickness profile. Afterwards, for each sample, the step heights were calculated as a function of the position on the substrate, It can also be related to 8, the angle from the target normal, shown in fig 5-2.
0.71 % 0.479 9.5 11.11 0.426 9.5 9.60 1% 0.39 9.5 8.63 0.90%
For each sample, the way is the following: ellipticity scanned, step height for each position on the substrate, calculations in order to have the heights as a function of the angle, fitting of the relative height as a function of the position with a cosine power. This power, called n, is an important parameter for following calculations. Then calculations were done to design what the thickness profile would be if the substrate had rotated. The parameter is d=D/R, where D=60 n m and R is the offset ... The d value for which the standard deviation is the smallest was chosen. This showed what offset has to be applied and the range of the inhomogeneity in thickness one might expect. In the following table, the results are shown.
1.39E-04 4.00E-06
Pressure j IEllipticity I /COS Power I Best offset IStandard Dev
0.37 cospowTh 0.3371 TOD Hat
I 0.21 I 0.6361 I I I .5/ I 14.81) I 1.57%1 I I 0.1 I I 0.561 I 91 1 13.331 / 1.85%1 I
A slight dependence of n as a function of pressure can be observed, as well as a large dependence of the ellipticity as a function of the background gas pressure. Consequently the offset necessary to get a perfect homogeneity is clearly related to the pressure. With this study, one can choose the appropriate offset in order to obtain the best homogeneity in film thickness, for every pressure. To check this, a pressure of 0.2 mbar was chosen and BZO was ablated on a rotating substrate, with the appropriate offset, in order to observe if the theoretical homogeneous thickness profile was reproduced. After etching as before, a profilometry measurement was done. The Tencor technique show that the central part of the deposit was flat.
16 O Philips Electronics N.V. 1995

UR 022/95
An interesting result is the one found at low pressure (4.2E-6 mbars) where, contrary to whatever expected and even mentioned in literature, the angular distribution law was not fitting to any cosine power. The thickness profile, shown in fig 5-5, is the one obtained for two extreme cases: high and low pressure. For the high vacuum ablated sample, one can see two top part symmetric by the centre (this symmetry shows that this result is not due to a measurement error ...) and the shape looks more like a top hat ... It is a fact that the studied axis comes from the tophat energy density profile.. That is too much coincidence to admit that those two facts are not related! Probably, at low pressure, the high energy particles trajectories are less changed changed by collisions than at high pressure.
fig 5-5
1 ,O5
0,95
> m a? CT
.- 0,75 + -
0,55 ‘ I I I I
-20 -1 o O 10 Angle
’Pres=4E-6 * ‘Pres=O,l
20
O Philips Electronics N.V. 1995 17
UR 022/95
6 Homogeneity as a function of offset
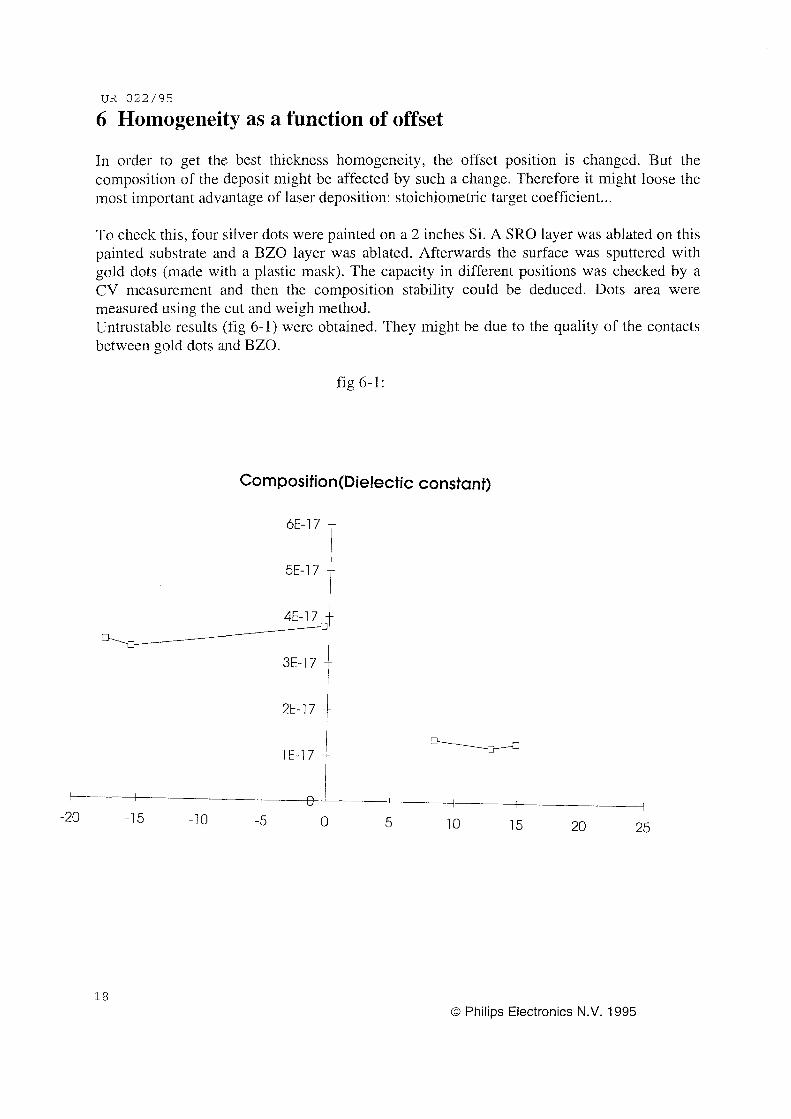
In order to get the best thickness homogeneity, the offset position is changed. But the composition of the deposit might be affected by such a change. Therefore it might loose the most important advantage of laser deposition: stoichiometric target coefficient.. .
To check this, four silver dots were painted on a 2 inches Si. A SRO layer was ablated on this painted substrate and a BZO layer was ablated. Afterwards the surface was sputtered with gold dots (made with a plastic mask). The capacity in different positions was checked by a CV measurement and then the composition stability could be deduced. Dots area were measured using the cut and weigh method. Untrustable results (fig 6-1) were obtained. They might be due to the quality of the contacts between gold dots and BZO.
fig 6- 1 :
Composition(Die1ectic constant)
6E-17
5E-17 t
2E-17 i-
I
5 10 15 20 25 -20 -1 5 -1 o -5 O
18 O Philips Electronics N.V. 1995
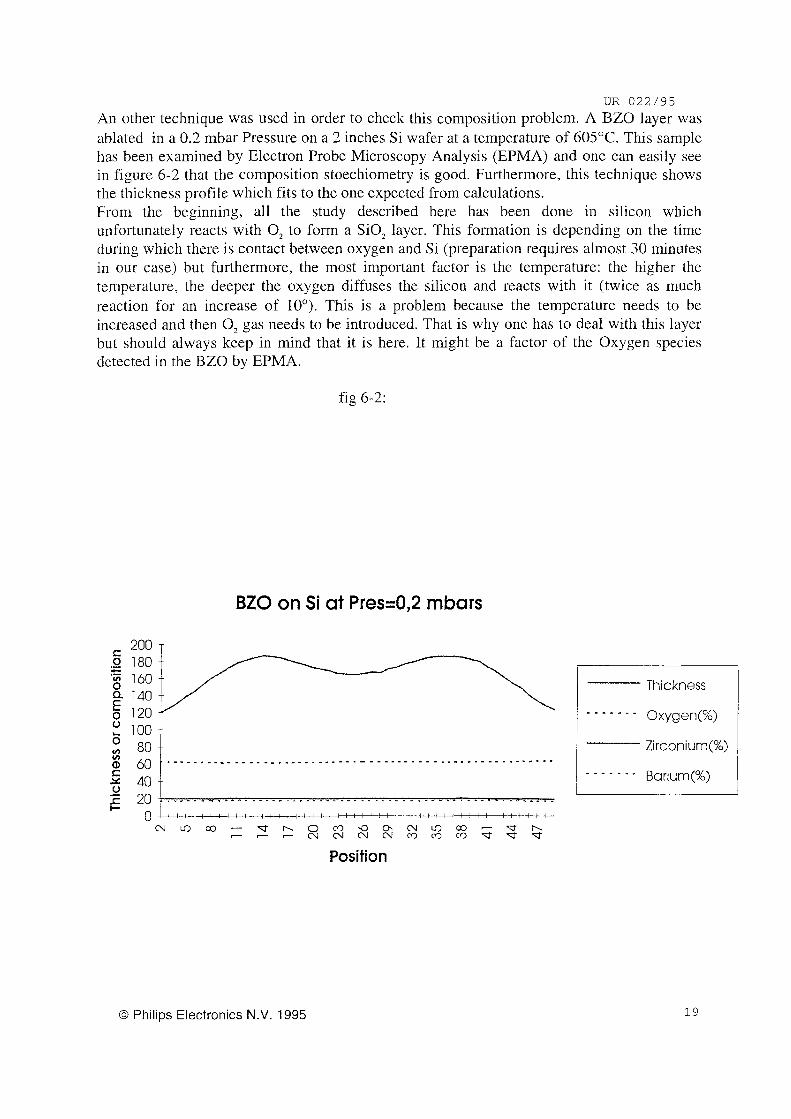
UR 022/95 An other technique was used in order to check this composition problem. A BZO layer was ablated in a 0.2 mbar Pressure on a 2 inches Si wafer at a temperature of 605°C. This sample has been examined by Electron Probe Microscopy Analysis (EPMA) and one can easily see in figure 6-2 that the composition stoechiometry is good. Furthermore, this technique shows the thickness profile which fits to the one expected from calculations. From the beginning, all the study described here has been done in silicon which unfortunately reacts with O, to form a SiO, layer. This formation is depending on the time during which there is contact between oxygen and Si (preparation requires almost 30 minutes in our case) but furthermore, the most important factor is the temperature: the higher the temperature, the deeper the oxygen diffuses the silicon and reacts with it (twice as much reaction for an increase of 10"). This is a problem because the temperature needs to be increased and then O, gas needs to be introduced. That is why one has to deal with this layer but should always keep in mind that it is here. It might be a factor of the Oxygen species detected in the BZO by EPMA.
fig 6-2:
BZO on Si at Pres=0,2 mbars
- .- 8 180 e 160
140 120
o 100 8 v> 80
4
Thickness
- - - - _ - _ Oxygen ("A) Zirconium(%)
Barium(%) ~
" _ " _ _ _ "
O Philips Electronics N.V. 1995 19
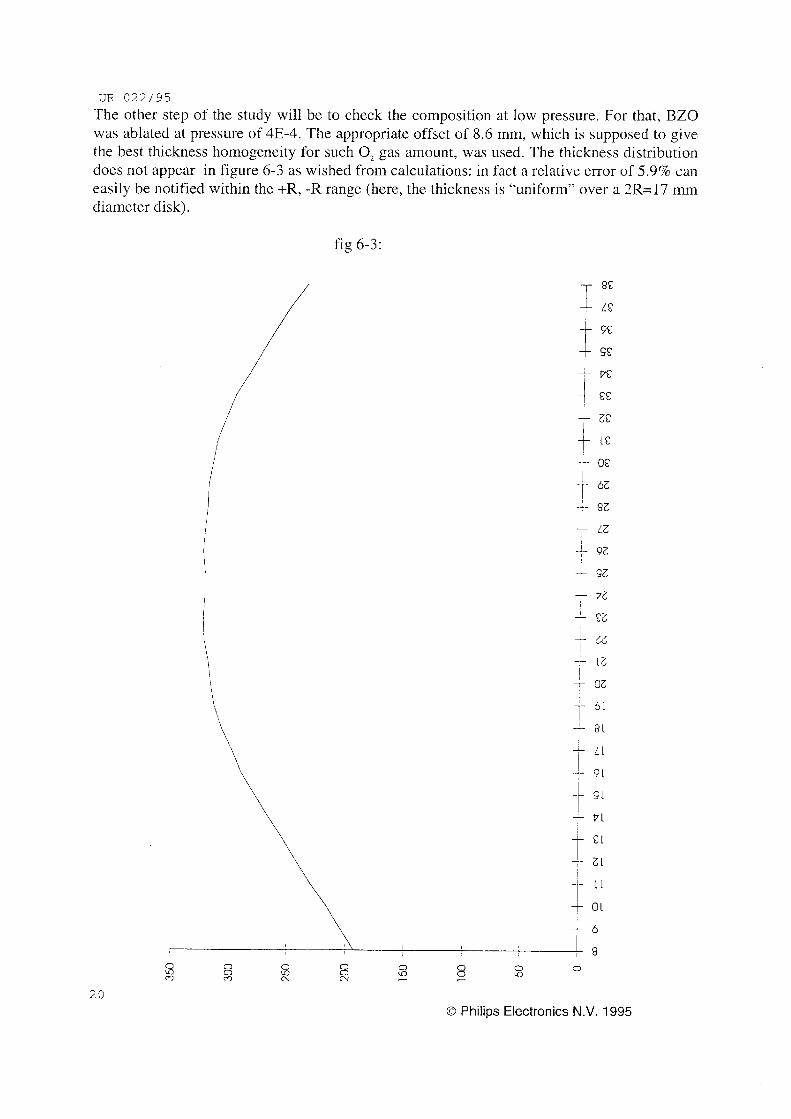
UR 022/95 The other step of the study will be to check the composition at low pressure. For that, BZO was ablated at pressure of 4E-4. The appropriate offset of 8.6 mm, which is supposed to give the best thickness homogeneity for such O, gas amount, was used. The thickness distribution does not appear in figure 6-3 as wished from calculations: in fact a relative error of 5.9% can easily be notified within the +R, -R range (here, the thickness is “uniform” over a 2R=17 mm diameter disk).
fig 6-3:
I I
T
1
20
O 5: O O 2 0 8 O O O
in O in c7 o Cu CJ
O Philips Electronics N.V. 1995

UR 022/95 Due to the good results from BZO in terms of thickness and composition homogemeity, critical materials such as PZT 20/80 were checked. Due to the volatility of Pb, the stoechiometry is difficult to keep. Furthermore, it was important for devices to be sure that the work done was OK. The results, shown in fig 6-4, prove that the composition is good. Furthermore, the relative thickness deviation is only 2.5%.
fig 6-4:
v; c O O
N i= a
// i I
I I OS
I I
I I 1
I I
I I
O Philips Electronics N.V. 1995 21

UR 022/95
7 The Other part of the work
For several people within the group Experimental Physics, thin films were prepared. The films were used for C-V measurements of all oxide capacitors (SRO (conductor), AT0 (semiconductor), BZO (isolator)) and etch rate experiments for device applications (B ZO ,S RO ,PZT, ATO) Program: In order to understand what is happening, a program was tried to copy a simulation from Jacques Kook work Initially a Monte-car10 random way is used and in order to imagine what behaviour is generated by interactions between a gas cloud and ablated species. The laser beam was circular and all the calculations done were using a circular symmetry. In order to apply part of this prograin at our case, new parameters had to be introduced .... The differences with the initial program lie in 2 points: different laser energy profile and so different geometry, but furthermore what interest us is the final position and not the intermediate one or the time of flight (cf ref2). Calculations were made and the final position of each ablated species was known. Those values were kept in a array. Depending on the number of ablated species on one position, this place was coloured with a special colour. Theoreticaly, the final screen should be a ellipse imprint.. There are still some problems and also in the drawing of ellipses. Maybe, the calculations were not good, or the drawing is not accurate enough but one does not end up with the expected profile.
22 O Philipc Electronics N.V. 1995
8 Different analysis procedures used UR 022195
SEM (Secondary Electron Microscope) A monochromatic electron beam (typically 30 KV) is applied on the substrate. Secondary electrons are emitted and are detected. From this signal, the sample can be analysed. It is also possible to use backscattered electrons. I would like to focus on the interest of such a machine. The SEM was used most of the time to obtain a cross section of the deposited sample. With this one, the thickness of the ablated layer can be deduced. A spare samplewas done. Afterwards, the thickness can provide a good calibration (Thicknesshhot) that will be used in order to ablate layers with an accurate thickness. Of course, the calibration is dependent on the pressure, the temperature, the material deposited, the target flatness, the fluence, the cleanness of the windows crossed by the laser, the wavelength, and the substrate.. So a lot of parameters influence the calibration but most of them stay constant from one experience to another. For each ablated material, a calibration was used. Of course, due to the lifetime of the target, the calibration might change a little bit. This technique can also show a top view of the sample in order to check if the layer was grown correctly. This has been useful to see the problems, discussed above, to grow SRO- ATO-BZO on AIZO,. Furthermore, the droplets can easily be observed by this top view.
X-Ray The X-Ray diffraction technique is useful to check the crystal phase and quality of a grown film. Multilayers can also be analysed by such a measurement. Moreover, one can check if a inaterial is deposited on the substrate by analysing the X-Ray profile. A problem was once encountered in the ablation of Alzo, and also of MgO. This technique showed us that no material was deposited on the substrate. So this measurement is a good way of checking the quality of one or numerous deposited layers. Furthermore if this layer is polycrystalline, it is possible to distinguish the peaks.
EPMA A monochromatic electron beam (typically 15KV) is focused on the substrate. A X-ray spectrometer is able to detect the wavelengths of the emitted radiations. From those, the substrate composition can be deduced. The Electron Probe Micro Analysis is a useful technique to analyse monolayers. It can distinguish the concentration of all the components with precision of almost 2%. Moreover a thickness profile can be obtained along a 2 5 m m radius substrate. The problem is that this measurement can only analyse monolayers and also that it might take a long time before one gets his results. Nevertheless, it is a great way of checking two results as a function of position on the substrate: composition and thickness profile.
Tencor Two types of talymeasurements were used: Talystep, described before, and a TalySurf 6 (Tencor). This machine comes from the Taylor Hobson firm. A force of 1mNewton is applied on the 2pm-radius stylus which crosses the investigated surface. It follows the surface and this surface profile is recorded. The results are then printed on u mm paper. The range used is above 300gm in the vertical direction and a 20mm distance can be scanned in the horizontal axis. This type of measurement was useful to check if the targets were not dug by too many ablation. If it is the case, they have to be flattened.
O Philips Electronics N.V. 1995 23
UR 022/95
Materials used for PLD
Subs trate A problem was once encountered with substrate quality: a PZT layer suddenly went off when applying any air pressure: unfortunately the sticking of the layer was not good. A SEM picture showed that the sapphire substrate used was containing polishing scratches. A substrate coming from another firm was perfect. So this might have been the problem. Care should be given to the quality of the substrate used. If a crack happens, the ablated material will slide into it. Taking in account the different speed expansion in different directions, some materials may induce layer cracks due to too much internal stress. Then the adhesion coefficient is bad and the deposited sample starts to delaminate ... Of course, this is not general and most of our substrate are perfect! One also has to know that the substrate should be cleaned carefully with ethanol. After that, the ethanol should be blown away with nitrogen before any drying rest appears.
BZO All the experiences shown in this study were done with BZO. Due to a good behaviour with any temperature, it was the easiest one to make a lot of samples with different temperature and different pressure. Moreover, the Ba is really heavy and so, there is no problem for seeing it in X-Ray diffraction patterns. ..Its dielectric isolator property made of him a good top layer for devices.
Alzo, and MgO: It is difficult to ablate some A1,0? and M g O . The principle is obvious: Al is ablated in a O, background environment in order to react and form A1 2 0 3 . The most uncomfortable situation is due to the deposit of metallic dust everywhere in the vacuum chamber and especially on the window where the laser penetrates the vacuum apparatus.. After any of those depositions, this window which has been particle sputtered is now really dirty and has to be changed. A way to deal with this would be to introduce another protective window but this would decrease the beam energy provided by the laser of around 4+4%. Anyway, experiments were tried with different O, pressures and several temperatures. .. At high temperature, X rays showed nothing except bare silicon, whatever pressure applied. This is due to the substrate sticking coefficient which is decreasing with the increase of temperatu- re. Then the same experiment was performed at room temperature. For low pressure, there is a lot of interaction and so the A1,0, is formed in the plasma. Afterwards, it is deposited in the substrate but does not stick there because it is just a powder, grains, and so is pumped away. This effect happens less with a 10E-4 mbar pressure: the O, stick to Si and Al comes and surrenders it. The reaction can then happen. But there might be a problem due to the fact that crystallisation only occurs at high temperature ... That is why none of expected peaks were visible. A try for M g O was also done at 300°C and 0.2 pressure but only a tiny MgO peak was remarkable leading to the doubt of existence due to the around noise. No excellent results were obtained ...
24 O Philips Electronics N.V. 1995
UR 022/95 PZT This ferroelectric product is used in many projects described beforehand. The PLD technique provides some films which contains this material and that is another reason for its important role in the making of devices. Several types are available but the ones used most are the 53/47 and 20/80 (P,Zr,,,,Ti,,,,O,and
The problein with the ablation of such a material is that the temperature is critical, as well as the pressure to use. If they are not 574°C for 0.2 pressure, one can hardly get any stoechiometric film. This is due to the fact that lead is really volatile, so if it does not stick to the surface as soon as it comes near it, it will rebound and be pumped in the vacuum. Furthermore, a high temperature should be used in order to crystallise ... Those two arguments make the ablation of PZT really hard ... If something is not done in the proper way, the concentration will not be good. That is why the idea of introducing a big offset in the PLD of such a material can seem hazardous. One can wonder if the lead concentration will be high enough outside the interior of the plume. In order to check this, a sample was made on a Si 2” wafer. The EPMA analysis showed a constant concentration of all the compounds along the substrate diameter.
PF-1 ,Ti,, 80,).
AT0300 The formula of this material is in fact Sn0,:Sb. The ratio of antimony varies from 300 to 1000ppm of Sn. So this semiconductor can be more or less doped. If highly doped, it will act like a transparent conductor. For KO work, the AT0300 was used as a middle layer :its semiconducting possibilities were then used in a capacitance system. One has to be careful with this material whose layers can not be grown over 505”. Furthermore, a layer above a AT0 can not be grown over this temperature neither. It has to be checked by EPMA because the amount of Sb in this layer is critical for its semiconducting properties. The use of this material is important due to devices
O Philips Electronics N.V. 1995 25
UR 022/95
9 Conclusion
This report shows the interest of the offset in the PLD technique: its qualities as well as its disadvantages. The thickness homogeneity can be optimised in a really good way. Moreover the composition does not seem to be affected by the offset for substrates up to 1.5 or 2 inches diameter.. . Despite these nice results, many points have still to be investigated such as the droplets prevention, the making of large substrate area PLD(4”-6”).. Furthermore, the comprehension of the phenomena obtained in this study might need deeper thoughts to understand quantitatively what is going on.
Acknowledgements
I would like to thank Harry Wondergem for the X-Ray measurements. His patience even with bad results and his fast work were helpful. For SEM measurements, Chris Geenen did a perfect job. His aptitude to give fast results were appreciated. I also thank Harry Nulens who did accurate measurements with the Talystep, even if this work was repetitive(6x40 measurements). I would like to thank Mark de Jong for useful calculations, and Joop Hengst for EPMA results. The author appreciated the great help of Ben Giesbers. Furthermore, I thank Edwin Pastoor for CV measurements and Jacques Kook for thinking computations as well as for programming help.
I say m y grateful thanks to Hans Cillessen for having offered m e this stage, introducing m e in the PLD subject, teaching me all about the machine used, and answering to my numerous questions. Furthermore, the correction of this report has been a hard task and i really appreciated the time he spent on it.
To end this, I would also like to thank different people such as the Vacuum and Mechanical department, and all the Theoretical and Experimental Physics group for welcoming m e in this project.
26 O Philips Electronics N.V. 1995
UR 022/95
References
1 ."Pulsed Laser Deposition of Thin Films" book from Douglas Chrisey and GraharnKHubler 2."Laser Ablation and Deposition of metals" ,thesis from Jacques C.S.Kools 3."Thiiz.films of unijbrm thickness by pulsed laser deposition" by N.J.Ianno and K.B.Erington
4."Growth of thin films by Laser-induced Evuporution" by J.Cheung and H.Sankur
5."Obseniation of 2 distinct components during PLD of high Tc supercoïzducting~fil~~zs"
Rev.Sci.Instrum.63, June 1992(p 3525-3526)
Critical Review in Solid State and Material Sciences, Vol. 15, Issue 1(1988), (p63-109)
by T.Venkatesan and X.D.Wu, A.Innam, and J.B.Wachtman Applied Physic Letters, Vol. 52, n"14, April 1988(pl193-1195)
6."MonteCarlo simulations of the transport of laser-ablated atoms in a diluted gas" by J.C.S Kook
Journal of Applied Physic, Vo1.74, n"l0, Nov. 1993 (~6401-6406) 7."Investigation oj the ablated flux characteristics during pulsed laser ablation depositionoj rnulticomponerzt oxides" by D.J.Lichtenwalner, O.Auciello, R.Dat and A.I.Kingon
Journal of Applied Physics, Vo1.74, n"12, Dec. 1993 (~7497)
O Philipc Electronics N.V. 1995 27
UR 022/95
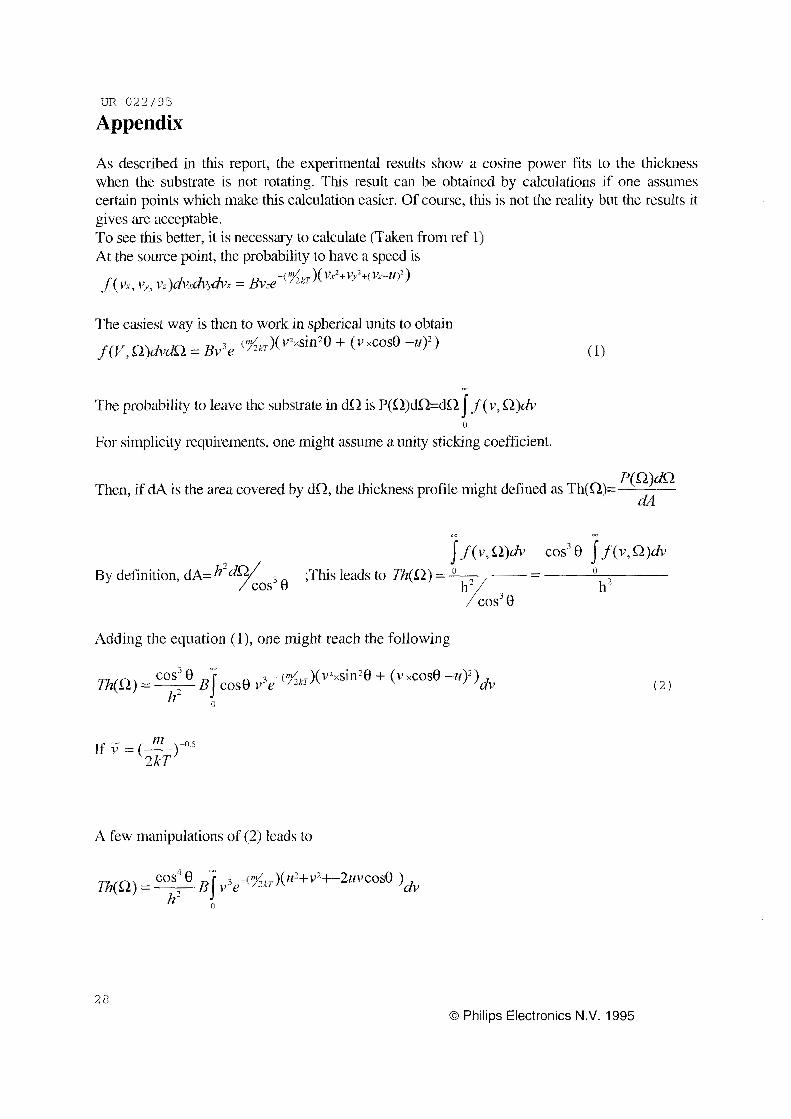
Appendix
A s described in this report, the experimental results show a cosine power fits to the thickness when the substrate is not rotating. This result can be obtained by calculations if one assunies certain points which make this calculation easier. Of course, this is not the reality but the results it gives ure acceptable. To see this better, it is necessary to calculate (Taken from ref 1) At the source point, the probability to have a speed is .f(vX, I-, = Bvze -(skT)( \’2+1,y+( I’Z-Zi)~)
The easiest way is then to work in spherical units to obtain f(V, Q2)úidQ = Bv3e -(y&)( vZxsin2û + (v xcosû -u)2)
- The probability to leave the substrate in dC2 is P(Q)dn=di2 f( v, Q)dv
For simplicity requirements, one might assume a unity sticking coefficient. O
P( L2)dQ dA
Then, if d A is the area covered by dil, the thickness profile might defined as Th(n)=
Adding the equation (l), one might reach the following
28 O Philips Electronics N.V. 1995
UR 022/95
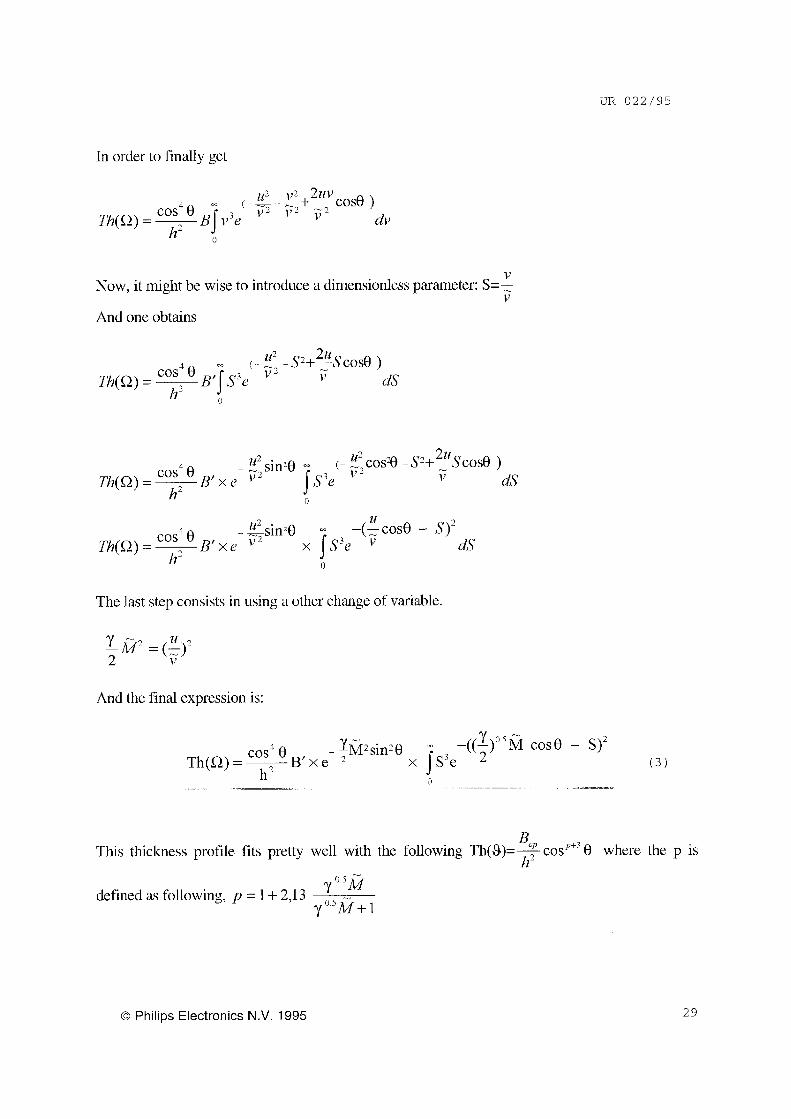
In order to finally get
I?
V Now, it might be wise to introduce a dimensionless parameter: S==
And one obtains
The last step consists in using a other change of variable.
And the final expression is:
- YR/IZsin20 - - ( ( 9 5 M cos0 - S)? B’xe x jS3e 2 ( 3 )
cos4 0 Th(Q) = ~ h2 o
BCP This thickness profile fits pretty well with the following Th(9)=-cos’”’0 where the p is h2
yo5iii yO%+l
defined as following, y = 1 + 2,13
O Philips Electronics N.V. 1995 29
UR 022/95
Distribution
Author Xavier Croizé Title Pulsed Laser Deposition. Global view and off axis deposition technique study.
copy to
PI Research Nat.Lab. Patent Dept. Dr.1r. J.A.Pals Dr. H.van Houten
Distribution list
Full report
Canberg, dr. A Lydtin, dr. H Wolf, dr. R Brekel, dr.ir. C.H.J van den Biermann, dr. U.K.P Cillessen, ing. J.F.M "7 Fastenau, dr.ir. R.H.J Feiner, dr. L.F Gaines, dr. J Giesbers, ing. J.B Grosse-Holz, K.0 Jong, dr.ir. M.J.M de Kools, dr. J.S.C Larsen, dr. P.K Muller, dr. G Spierings, clr.ir. G.A.C Ven, dr. J van de Walle. dr. G.F.A van de
wB-5 WB-5 WAH Adjunct-directeur Department head
P E - A P E - A Briarcliff WZ03 WZ07 W A 0 3 W A 0 5 wB 12 W A 0 3 wB12 W B 1 1 W B 1 2 W A 1 4 wB22 W A M 0 1 WZ04 W A 1 5 W A 1 4
W A 1 2 WB13
30 O Philips Electronics N.V. 1995


![PbTe thin films grown by femtosecond pulsed laser deposition. · electrodeposition [5], molecular beam epitaxy [6] and pulsed laser deposition [7,8,9 ] More recently, PbTe grown in](https://img.dokumen.tips/doc/110x75/5c0d44a109d3f247038d61bf/pbte-thin-films-grown-by-femtosecond-pulsed-laser-electrodeposition-5-molecular.jpg)