Embed Size (px)
Citation preview

Published October 2018
Document Version 1.0
Pulse Secure Virtual Traffic Manager: Exporting Analytics to the Elastic Stack
Deployment Guide

Pulse Secure Virtual Traffic Manager: ExportingAnalytics to the Elastic Stack
Pulse Secure, LLC2700 Zanker Road,Suite 200 San JoseCA 95134
www.pulsesecure.net
© 2018 by Pulse Secure, LLC. All rights reserved.
Pulse Secure and the Pulse Secure logo are trademarks of Pulse Secure, LLC in the United States.All other trademarks, service marks, registered trademarks, or registered service marks are theproperty of their respective owners.
Pulse Secure, LLC assumes no responsibility for any inaccuracies in this document. Pulse Secure, LLC reserves the right to change, modify, transfer, or otherwise revise this publication withoutnotice.
Pulse Secure Virtual Traffic Manager: Exporting Analytics to the Elastic Stack
The information in this document is current as of the date on the title page.
END USER LICENSE AGREEMENT
The Pulse Secure product that is the subject of this technical documentation consists of (or isintended for use with) Pulse Secure software. Use of such software is subject to the terms andconditions of the End User License Agreement (“EULA”) posted athttp://www.pulsesecure.net/support/eula/. By downloading, installing or using such software,you agree to the terms and conditions of that EULA.
Contents
INTRODUCTION . . . . . . . . . . . . . . . . . . . . . . . . . . . . . . . . . . . . . . . . . . . . . . . . . . . . . . . . . . . . . . . . . . . . . . . . . . . 1
PURPOSE OF THIS GUIDE . . . . . . . . . . . . . . . . . . . . . . . . . . . . . . . . . . . . . . . . . . . . . . . . . . . . . . . . . . . . . . 1
PREREQUISITES . . . . . . . . . . . . . . . . . . . . . . . . . . . . . . . . . . . . . . . . . . . . . . . . . . . . . . . . . . . . . . . . . . . . . . . 1
THE ELASTIC STACK . . . . . . . . . . . . . . . . . . . . . . . . . . . . . . . . . . . . . . . . . . . . . . . . . . . . . . . . . . . . . . . . . . . 2
CONFIGURATION SUMMARY. . . . . . . . . . . . . . . . . . . . . . . . . . . . . . . . . . . . . . . . . . . . . . . . . . . . . . . . . . . . 2
MORE INFORMATION. . . . . . . . . . . . . . . . . . . . . . . . . . . . . . . . . . . . . . . . . . . . . . . . . . . . . . . . . . . . . . . . . . 2
CONFIGURING LOGSTASH. . . . . . . . . . . . . . . . . . . . . . . . . . . . . . . . . . . . . . . . . . . . . . . . . . . . . . . . . . . . . . . . 3
ABOUT THE EXPORTED DATA . . . . . . . . . . . . . . . . . . . . . . . . . . . . . . . . . . . . . . . . . . . . . . . . . . . . . . . . . . 3
USING LOGSTASH TO PROCESS ANALYTICS DATA . . . . . . . . . . . . . . . . . . . . . . . . . . . . . . . . . . . . . . . . 3
CONFIGURING INPUT DEFINITIONS . . . . . . . . . . . . . . . . . . . . . . . . . . . . . . . . . . . . . . . . . . . . . . . . . . 3
SETTING FILTERS . . . . . . . . . . . . . . . . . . . . . . . . . . . . . . . . . . . . . . . . . . . . . . . . . . . . . . . . . . . . . . . . . . 4
CONFIGURING OUTPUTS . . . . . . . . . . . . . . . . . . . . . . . . . . . . . . . . . . . . . . . . . . . . . . . . . . . . . . . . . . . 6
CONFIGURING THE TRAFFIC MANAGER TO EXPORT DATA TO LOGSTASH. . . . . . . . . . . . . . . 7
VIEWING THE EXPORTED DATA IN KIBANA . . . . . . . . . . . . . . . . . . . . . . . . . . . . . . . . . . . . . . . . . . . . . . . 9
CONFIGURING INDEX PATTERNS . . . . . . . . . . . . . . . . . . . . . . . . . . . . . . . . . . . . . . . . . . . . . . . . . . . . . . . . 9
SEARCHING DATA. . . . . . . . . . . . . . . . . . . . . . . . . . . . . . . . . . . . . . . . . . . . . . . . . . . . . . . . . . . . . . . . . . . . . 9
i Pulse Secure Virtual Traffic Manager: ExportingAnalytics to the Elastic Stack

iiPulse Secure Virtual Traffic Manager: ExportingAnalytics to the Elastic Stack

Introduction
This chapter contains the following sections:
• Purpose of this Guide . . . . . . . . . . . . . . . . . . . . . . . . . . . . . . . . . . . . . . . . . . . . . . . . . . . . . . . . . . . 1• Prerequisites . . . . . . . . . . . . . . . . . . . . . . . . . . . . . . . . . . . . . . . . . . . . . . . . . . . . . . . . . . . . . . . . . . 1• The Elastic Stack. . . . . . . . . . . . . . . . . . . . . . . . . . . . . . . . . . . . . . . . . . . . . . . . . . . . . . . . . . . . . . . . 2• Configuration Summary . . . . . . . . . . . . . . . . . . . . . . . . . . . . . . . . . . . . . . . . . . . . . . . . . . . . . . . . . 2• More Information . . . . . . . . . . . . . . . . . . . . . . . . . . . . . . . . . . . . . . . . . . . . . . . . . . . . . . . . . . . . . . 2
Purpose of this GuideThis guide is intended for Pulse Secure Virtual Traffic Manager (the Traffic Manager) customers evaluating the Analytics Export feature in conjunction with the Elastic Stack.
Analytics Export is a license key-controlled feature of the Traffic Manager, designed to enable exporting of live analytics data from your Traffic Manager cluster to an external source. Traffic Manager clusters can export data about all the traffic they process, and can also export entries from log files present on the individual cluster members.
For more details on product licensing, contact Pulse Secure Technical Support.
PrerequisitesThis guide assumes you are familiar with the operation and administration of Pulse Secure Virtual Traffic Manager, and that you have a working knowledge of the Elastic Stack.
The steps referred to in this guide assume you have a fully working and licensed cluster of Traffic Manager instances, at version 17.2 or later, with the Analytics Export option enabled for each cluster member.
This guide was developed against Elastic Stack version 5.3.0. Make sure you have running instances of the following Elastic Stack components:
• Logstash
• Elasticsearch
• Kibana
For details on how to get started with the Elastic Stack, see https://www.elastic.co.
Note: While the Traffic Manager can operate as a singular instance, Pulse Secure recommends you deploy a cluster of two or more Traffic Manager instances for full fault-tolerance and failover in the event of service disruption. References to the Traffic Manager throughout this guide should be understood to refer to the configuration shared across all Traffic Manager instances.
1 Pulse Secure Virtual Traffic Manager: ExportingAnalytics to the Elastic Stack
For details of how to create a Traffic Manager cluster, see the Pulse Secure Virtual Traffic Manager: Installation and Getting Started Guide applicable to your product variant.
The Elastic StackThe Elastic Stack is a collection of open source tools that allow you to collect, store, search, analyze and visualize data. Traffic Manager cluster members can export their data to Logstash, where it is processed and stored in Elasticsearch. A system administrator or application developer can then use Kibana to search through the data in Elasticsearch and produce visualizations and reports on the data held.
Configuration SummaryTo perform analysis of the Traffic Manager’s live traffic and log data using the Elastic Stack, perform the following steps:
1. Configure Logstash to accept Traffic Manager analytics streams and store collected data items in ElasticSearch.
2. Configure the Traffic Manager to export analytics data to a Logstash instance.
3. Configure and use Kibana to view and search the analytics data held in ElasticSearch.
The remainder of this guide describes each of these steps in detail.
More InformationFor more details on the data that is exported for individual transactions, download the JSON schema from the System > Analytics Export > Transaction Metadata section of the Admin UI. The schema contains a full description of the export format, with details about what each field means.
For a more detailed description of the analytics export feature, see the Pulse Secure Virtual Traffic Manager: User’s Guide.
2Pulse Secure Virtual Traffic Manager: ExportingAnalytics to the Elastic Stack

Configuring Logstash
This chapter contains the following sections:
• About the Exported Data . . . . . . . . . . . . . . . . . . . . . . . . . . . . . . . . . . . . . . . . . . . . . . . . . . . . . . . . 3• Using Logstash to Process Analytics Data . . . . . . . . . . . . . . . . . . . . . . . . . . . . . . . . . . . . . . . . . . 3
About the Exported DataThe Traffic Manager exports data about the transactions it has processed (transaction metadata) over a raw TCP connection, optionally secured with TLS. The Traffic Manager also exports log entries through HTTP POST requests. These requests can be sent over a secure connection if necessary.
Both types of data are exported as JSON objects, with individual records separated by newline characters.
Using Logstash to Process Analytics DataLogstash collects and manipulates analytics data from the Traffic Manager cluster, before passing the processed records to ElasticSearch. To acheive this, Logstash uses three stages:
• inputs: define sources of incoming data
• filters: parse and modify stored data records in preparation for output
• outputs: send processed data to an external service for viewing/search
You define each of these stages in a text configuration file, fed into Logstash for execution. Each stage, and how it relates to the Traffic Manager, is covered in more detail through the remainder of this chapter.
For more information about Logstash, see https://www.elastic.co/products/logstash.
Configuring Input DefinitionsLogstash consumes data through configured input definitions. To prepare Logstash for the data sent by your Traffic Managers, configure two new input definitions for TCP and HTTP traffic. Both of these inputs should treat incoming data as newline-delimited JSON objects. In order to separate the two types of data later in the stack, records are labeled with a "type" field in the input definition to position them in different Elasticsearch indexes.
Both inputs can optionally be configured to accept only secure connections. See the Logstash documentation for details on how to set up security for each input.
Create a configuration file in your Logstash directory and add the following input definitions:
## Collect transaction data over TCP - no filters necessaryinput { tcp {
3 Pulse Secure Virtual Traffic Manager: ExportingAnalytics to the Elastic Stack
port => 5000 codec => json_lines add_field => { "type" => "transactions" } }} ## Collect log entries over HTTP, these are parsed using filtersinput { http { port => 8080 codec => json_lines add_field => { "type" => "logs" } }}
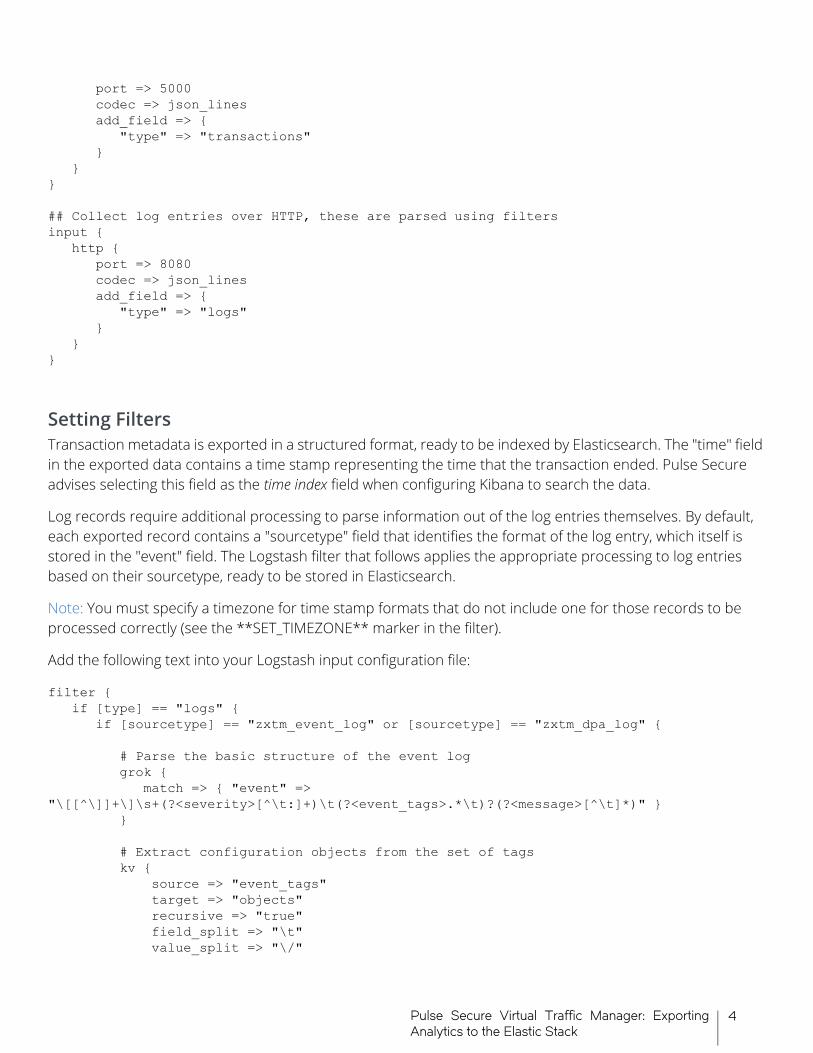
Setting FiltersTransaction metadata is exported in a structured format, ready to be indexed by Elasticsearch. The "time" field in the exported data contains a time stamp representing the time that the transaction ended. Pulse Secure advises selecting this field as the time index field when configuring Kibana to search the data.
Log records require additional processing to parse information out of the log entries themselves. By default, each exported record contains a "sourcetype" field that identifies the format of the log entry, which itself is stored in the "event" field. The Logstash filter that follows applies the appropriate processing to log entries based on their sourcetype, ready to be stored in Elasticsearch.
Note: You must specify a timezone for time stamp formats that do not include one for those records to be processed correctly (see the **SET_TIMEZONE** marker in the filter).
Add the following text into your Logstash input configuration file:
filter { if [type] == "logs" { if [sourcetype] == "zxtm_event_log" or [sourcetype] == "zxtm_dpa_log" { # Parse the basic structure of the event log grok { match => { "event" => "\[[^\]]+\]\s+(?<severity>[^\t:]+)\t(?<event_tags>.*\t)?(?<message>[^\t]*)" } } # Extract configuration objects from the set of tags kv { source => "event_tags" target => "objects" recursive => "true" field_split => "\t" value_split => "\/"
4Pulse Secure Virtual Traffic Manager: ExportingAnalytics to the Elastic Stack

trim_value => "\t" } # Split the rest of the tags into an array mutate { gsub => [ "event_tags", "[a-zA-Z0-9_]+\/.+?\t", "" ] gsub => [ "event_tags", "\t", " " ] split => { "event_tags" => " " } } } else if [sourcetype] == "zxtm_audit_log" { # Parse the basic structure of the audit log grok { match => { "event" => "\[(?<timestamp>.*?)\]\t(?<attributes>.*)" } } # Separate out the attributes into key/value pairs kv { source => "attributes" field_split => "\t" value_split => "=" trim_key => "\t" trim_value => "\t" remove_field => [ "attributes" ] } # Parse the date (as it is not included in records exported # by version 17.2 of the traffic manager) date { locale => "en" match => ["timestamp", "dd/MMM/yyyy:HH:mm:ss Z"] target => "@timestamp" remove_field => ["timestamp"] } } else if [sourcetype] == "syslog" { # Use built-in syslog format parser, but allow both classic and # modern variation on the timestamp grok { match => { "event" => [ "%{SYSLOGBASE}", "%{TIMESTAMP_ISO8601:timestamp} (?:%{SYSLOGFACILITY} )?%{SYSLOGHOST:logsource} %{SYSLOGPROG}:" ] } } date { locale => "en" match => ["timestamp", "MMM dd HH:mm:ss", "MMM d HH:mm:ss", "ISO8601"] target => "@timestamp" remove_field => ["timestamp"]
5 Pulse Secure Virtual Traffic Manager: ExportingAnalytics to the Elastic Stack

} } else if [sourcetype] == "zxtm_waf_log" { grok { match => { "event" => "(?<timestamp>\d+-\d+-\d+\s+\d+:\d+:\d+,\d+)\s+(?<process>[^\s]*)\s+(?<severity>\S+)\s+(?<message>.*)" } } date { locale => "en" match => ["timestamp", "yyyy-MM-dd HH:mm:ss,SSS"] timezone => "Europe/London" # **SET_TIMEZONE** Set your own timezone target => "@timestamp" remove_field => ["timestamp"] } } # If the exported data already contained a parsed timestamp, # use that as the entry's official timestamp. date { locale => "en" match => ["time", "UNIX"] target => "@timestamp" remove_field => ["time"] } }}
Configuring OutputsLogstash outputs the records it has constructed to an external destination for searching and analytics. This guide uses Elasticsearch.
Traffic Manager transaction and log records are stored in separate indexes, and each index is dated, allowing historical data to be periodically deleted to control storage requirements. Assuming that your Elasticsearch instance is accessible, the following output definition routes the exported data to Elasticsearch as needed.
This example routes data to "elasticsearch:9200", although any applicable URL of the form "<hostname>:9200" is acceptable.
Note: For deployments with Logstash and Elasticsearch installed on the same host, the URL "localhost:9200" is a legitimate value.
Add the following text into your Logstash input configuration file:
## Output the record to an appropriate index in Elastic Searchoutput { elasticsearch { hosts => "elasticsearch:9200" index => "%{type}-%{+YYYY.MM.dd}" }}
6Pulse Secure Virtual Traffic Manager: ExportingAnalytics to the Elastic Stack
Configuring the Traffic Manager to Export Data to Logstash
To export data into Logstash, configure the Traffic Manager with the details of your Logstash instance.
Perform the following steps:
1. Log in to the Admin UI of any one of your Traffic Manager cluster members.
2. Click System > Analytics Export.
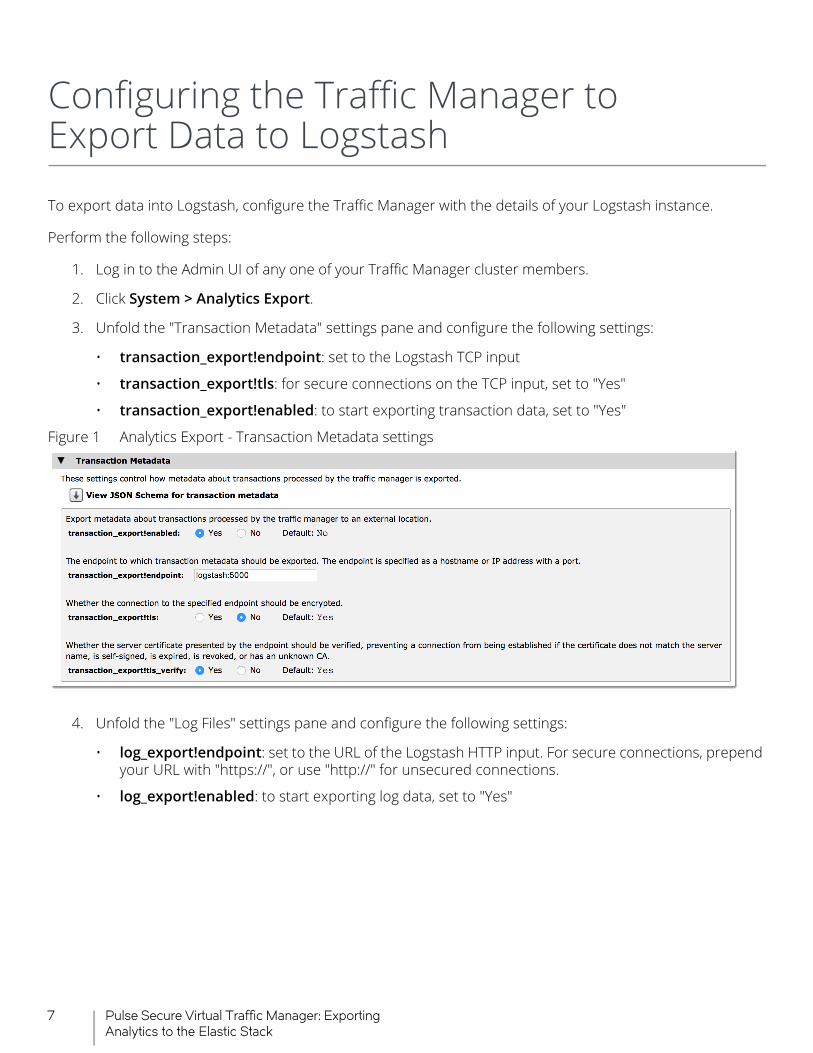
3. Unfold the "Transaction Metadata" settings pane and configure the following settings:
• transaction_export!endpoint: set to the Logstash TCP input
• transaction_export!tls: for secure connections on the TCP input, set to "Yes"
• transaction_export!enabled: to start exporting transaction data, set to "Yes"
Figure 1 Analytics Export - Transaction Metadata settings
4. Unfold the "Log Files" settings pane and configure the following settings:
• log_export!endpoint: set to the URL of the Logstash HTTP input. For secure connections, prepend your URL with "https://", or use "http://" for unsecured connections.
• log_export!enabled: to start exporting log data, set to "Yes"
7 Pulse Secure Virtual Traffic Manager: ExportingAnalytics to the Elastic Stack

Figure 2 Analytics Export - Log Files settings
By default, the Traffic Manager exports entries from its event, audit, and application firewall logs. Traffic Manager Appliance variants additionally export system log files.
To further select or deselect individual log types for exporting, click Choose Log Files to export. For each log category listed, click through to the detail screen and enable or disable the log as required. Use this page to also define new log categories for inclusion in the analytics export.
Problems with the selected configuration are flagged in the event log and on the Diagnose page of the Admin UI.
8Pulse Secure Virtual Traffic Manager: ExportingAnalytics to the Elastic Stack

Viewing the Exported Data in Kibana
This chapter contains the following sections:
• Configuring Index Patterns . . . . . . . . . . . . . . . . . . . . . . . . . . . . . . . . . . . . . . . . . . . . . . . . . . . . . . 9• Searching Data. . . . . . . . . . . . . . . . . . . . . . . . . . . . . . . . . . . . . . . . . . . . . . . . . . . . . . . . . . . . . . . . . 9
To explore the analytics data stored in ElasticSearch, configure Kibana to produce visualizations and reports.
Before proceeding, Pulse Secure recommends that you send test traffic through your Traffic Manager cluster so that transaction and log records are exported and stored in Elasticsearch. Doing so enables Kibana to build an understanding of the different fields present in the data.
Configuring Index PatternsIn the Kibana user interface, click Management > Index Patterns. Then, to add a new index pattern, click Add New. In the Index name box, type "transactions-*", then wait a few seconds for Kibana to populate the Time-field name drop-down list. Select "time" from the list to use the time that the transaction completed as the time index for each record, then click Create.
Figure 3 Adding a new index pattern
Next, perform the same actions for the "logs-*" index. However, in this case select "@timestamp" as the Time-field name as this is where the event time was recorded by the Logstash filter.
Searching DataUse the Discover tab to explore the transaction data and log entries stored in ElasticSearch. To toggle between the two indexes, use the drop-down box just below the search bar.
To search for specific data items, type your desired match pattern into the search bar.
9 Pulse Secure Virtual Traffic Manager: ExportingAnalytics to the Elastic Stack

Figure 4 Searching for all event logs with a severity of INFO
Kibana shows only those data entries that match the search pattern.
Figure 5 A sample entry from the event log, produced by a "log.info" statement in a TrafficScript rule
.
10Pulse Secure Virtual Traffic Manager: ExportingAnalytics to the Elastic Stack