Embed Size (px)
Citation preview

Pulmonary Nodule Detection, Characterization, andManagement With Multidetector Computed Tomography
Scott Brandman, MD and Jane P. Ko, MD
Abstract: Pulmonary nodule detection and characterization con-tinue to improve with technological advancements. The noninva-sive methods available for assisting in nodule detection and forcharacterizing nodules as benign, malignant, or indeterminate willbe discussed. Evidence-based guidelines will be reviewed to helpguide the appropriate management of pulmonary nodules.
Key Words: pulmonary nodule, computer-aided diagnosis, volume,
dual energy, management
(J Thorac Imaging 2011;26:90–105)
The solitary pulmonary nodule (SPN) is a frequentlyencountered finding on multidetector computed tomo-
graphy (MDCT). A nodule is of high clinical importance,given it may prove to be an early manifestation of lungcancer, which is the leading cause of death in the UnitedStates from malignancy.1 Early detection, accurate char-acterization, and appropriate management of pulmonarynodules require expertise across multiple disciplines such asradiology, oncology, pulmonary medicine, radiation onco-logy, and thoracic surgery. Given the high number of SPNsdetected on CT and the low sensitivity of both 18F-flourodeoxyglucose (FDG) positron-emission tomography(PET) and CT-guided biopsy for nodules smaller than5mm in size, the latest technologies for nodule detection,means of characterizing these lesions, and guidelines formanaging lung nodules will be addressed.2 We will alsodiscuss the role of new and developing technologies,including computer-aided detection (CAD), the nodulevolume assessment technique, dual-energy CT, and noduleenhancement.
PULMONARY NODULE DETECTION ON CTChest radiography remains the most commonly
ordered radiological examination. Unfortunately, radio-graphy has low sensitivity for demonstrating significantlesions and a high false-positive rate for the detection ofpulmonary nodules.3,4 The greater degree of spatial andcontrast resolution provided by MDCT enables improvedsensitivity and specificity for pulmonary nodule detection.Nevertheless, pulmonary nodules are still undetected onMDCT due to their small size; low Hounsfield unit (HU)attenuation (ground-glass nodules); perivascular central orendobronchial location; or adjacent parenchymal disease.5–8
VIEWING OPTIONSThe widespread availability of MDCT scanners pro-
vides the opportunity to examine thin-section (1mm) CTimages in the order of 2mm and smaller in thickness, whichimproves reader detection of focal lung findings andcharacterization of these findings as nodules. The overallsensitivity for reader detection of pulmonary nodules hasbeen reported to be 70% to 75%. However, sensitivity issignificantly lower for smaller pulmonary nodules relatedto volume averaging.9,10 Diederich et al10 reported thatreader sensitivity using 5-mm sections was 69% for nodulessmaller than 6mm, and 95% for those that were 6mm orlarger. However, the number of images to be examinedincreases by 5-fold when 1-mm-section images are usedinstead of 5-mm-section images, which can contribute toreader fatigue.11 In addition, on thin sections, small pulmo-nary nodules are difficult to differentiate from normalvascular structures.
Postprocessing techniques are now widely availableand can increase reader sensitivity for pulmonary nodules.The maximum intensity projection (MIP) technique dis-plays the brightest voxel along an array within a slab. In thelung, the voxels of a vessel are the brightest (in contrast tothe surrounding air-filled acini), and therefore their valuesare most often used for display. This leads to visualizationof the branching vessel within a slab and facilitatesdifferentiation of a perivascular nodule from the vessel(Fig. 1). MIP techniques were shown to improve thevisualization of small nodules.12,13 Park et al14 reported thenodule detection sensitivities of 4 readers (A, B, C, and D),who interpreted 1-mm sections, as 91%, 88%, 87%, and86%, respectively. The sensitivities increased to 94%, 96%,91%, and 92%, respectively, when the readers evaluated 5-mm MIPs reconstructed at 1-mm intervals; the sensitivitychange was significant for readers B, C, and D. The value ofMIPs has been shown in both axial and coronal projec-tions, in addition to coronal multiplanar reformations.15
Minimum intensity projection images may potentially playa role in the detection of ground-glass lesions (Fig. 2).
CADComputer-assisted image analysis methods can aid the
radiologist in detecting lung nodules. These computeralgorithms have been enabled by high-resolution thin-section MDCT data. CAD techniques have been shown toincrease the detection of small pulmonary nodules whilemaintaining time efficiency for diagnosis. CAD devices fornodule identification have been primarily investigated in therole of a second reader, in which CAD identifications areviewed subsequent to an initial review by the radio-logist.16–20 For example, in a study by Rubin et al,17 aCAD device increased reader sensitivity for the detection ofpulmonary nodules from 50% to 76%, with 3 false-positiveCopyright r 2011 by Lippincott Williams & Wilkins
From the Department of Radiology, Division of Thoracic Imaging,New York University Langone Medical Center, New York, NY.
Disclosures: None.Reprints: Jane P. Ko, MD, Department of Radiology, Thoracic
Imaging, New York University Langone Medical Center, 560 FirstAvenue, New York, NY 10016 (e-mail: [email protected]).
SYMPOSIA
90 | www.thoracicimaging.com J Thorac Imaging � Volume 26, Number 2, May 2011

detections per CT scan if all the true-positive CAD markswere to be accepted by readers. False-positive detections byCAD were related to artifact, branching points of vessels,or central vessels, and have been reduced with improvedCAD schemes to 3 or fewer per CT scan.17 Themaintenance of a low false-positive rate is important, asradiologist confidence in detecting small pulmonary no-dules can be influenced by CAD.21 A recent studydemonstrated that a radiologist will accept 11% of false-positive CAD marks.21 Both CAD and MIP were shown toassist the detection of lung nodules to equal degrees.14 Theutilization of CAD will be facilitated by seamless viewing ofCAD results on clinical picture archiving and communica-tion systems (PACS) rather than on a stand-alone work-station, and by ultimately, real-time interaction with CADresults on PACS (Fig. 3).
Minimal investigation has been devoted towards CADidentification of ground-glass nodules.22–26 CAD detection ofground-glass nodules is difficult. The faint attenuation andlow contrast of ground-glass nodules relative to the adjacentlung parenchyma hinder thresholding and segmen-tation techniques. For example, the sensitivity of a singleCAD technique was only 53% for ground-glass nodules,whereas it was 73% for a mixed ground-glass and solidnodule.27 As this technology continues to evolve, potentialexists for devices to positively impact reader detection of lungnodules for both ground-glass and solid attenuation nodules.
Nodule-detection techniques are also needed for auto-mated matching of lung nodules on multiple chest CTstudies, an essential aspect of nodule characterization. Theprocess of both nodule detection and image registrationrequires lung segmentation, feature extraction, and char-acterization by CAD. The comparison of multiple CTstudies poses challenges given variations in inspiratory lungvolumes, patient positioning, and lung pathology. Regis-tration techniques to overcome these challenges includerigid methods that account for patient rotation andlocation of the patient’s thorax within the image; however,differences related to scale and changes in lung, lobe, and
locoregional morphology that frequently occur are betteraddressed with deformable models and elastic registrationtechniques.28,29 Similar methods are used for intermodalityregistration, such as CT with magnetic resonance imaging.A study by Tao et al30 evaluated a computer registra-tion program’s ability to automatically match pulmonarynodules on 3 serial screening MDCTs. They demonstrateda 92.7% matching rate between studies performed 1 yearapart. Automated matching was not significantly affectedby nodule size or ground-glass attenuation. However, ajuxtapleural location significantly decreased the matchingrate to almost 86%. Other studies evaluated patients withmetastatic disease on serial examinations. These stud-ies demonstrated matching rates of only 66.7% and86.3%.31,32 Advances in the development of interfaces withclinical workstations would facilitate detection and com-parison of nodules over multiple studies in clinical practice.
NODULE MORPHOLOGY ON MDCTAND ETIOLOGIES
Benign nodules result primarily from infection. In-fectious granulomas account for more than 80% of benignSPNs33 (Fig. 4) with mycobacterial infection the mostcommon cause, followed by fungal organisms. Hamarto-mas, consisting of multiple mesenchymal tissue histologies,represent 10% of benign SPNs.33 Arteriovenous malforma-tions and aneurysms are other causes of an SPN.
Malignant etiologies for SPNs include primary lungcancer (84%) and solitary metastasis (8%) (Table 1).34 CTtrials for lung cancer screening have found an 8% to 51%prevalence of SPNs in high-risk patients.35,36 The mostcommon histologic subtype of lung cancer is adenocarci-noma. Adenocarcinoma represents 50% of malignantpulmonary nodules and is typically peripheral in location.34
Squamous cell carcinoma is the second most commonhistologic subtype of lung cancer, and two-thirds of thesetumors are located centrally.37 Other subtypes of lungcarcinoma can also present as SPNs. Small cell carcinoma
FIGURE 1. MIP image for solid nodule detection. Nodules (arrows) on 1-mm (A) axial section are more evident on the MIP (B) imageand are more readily differentiated from the vessels. The courses of the vessels are depicted to a greater degree on the MIP.
J Thorac Imaging � Volume 26, Number 2, May 2011 SPN Detection, Characterization, and Management
r 2011 Lippincott Williams & Wilkins www.thoracicimaging.com | 91

occurs as an SPN approximately 5% of the time and moreoften presents with bulky lymphadenopathy in the hilar andmediastinal regions.37,38 Carcinoid tumors are neuroendo-crine tumors that represent 1% to 2% of all lung tumors,with 10% to 20% atypical and the remainder typical. Inaddition, 16% to 40% of carcinoids occur in the peripherallung (Fig. 5).39,40 Although most often multiple, metastasesto the lung parenchyma from an extrapulmonary primarymalignancy such as colon and renal cell carcinoma,testicular cancer, melanoma, and sarcoma can appear asSPNs. Lymphoma in the lung parenchyma has severalappearances, including that of an SPN (Fig. 6).
Size is a primary factor in determining the risk formalignancy of a nodule. In a meta-analysis of 8 largescreening trials, the prevalence of malignancy depended onthe size of the nodules, ranging from 0% to 1% for nodules5mm or smaller, 6% to 28% for those between 5 and10mm, and 64% to 82% for nodules 20mm or larger.35
The presence of multiple nodules increases the like-lihood of etiologies such as metastatic disease, septic emboli,and pulmonary infarcts. In addition, inflammatory diseasessuch as Antineutrophil cytoplasmic autoantibody (ANCA)-associated vasculitis, sarcoidosis, amyloidosis, and rheuma-toid arthritis can lead to multiple benign pulmonarynodules.41,42 Multiple arteriovenous malformations (AVMs)can occur in patients who have hereditary hemorrhagic
telangectasias (Osler-Weber-Rendu syndrome). This is auto-somal-dominant disease with a triad of epistaxis, muco-cutaneous or visceral telangiectasias, and a family history(Fig. 7). A majority of AVMs (70%) are simple, with a singlefeeding artery and a single draining vein.43
Multiple isolated nodules of 8mm and smaller in sizeare typically considered independently as SPNs rather thanas multiple nodules caused by a common process.44
Alternatively, with multiple nodules that are larger than8mm in size, the rate of malignancy can be high. In astudy of video-assisted thoracoscopic (VATS)-resected lungnodules at an oncology center, 51% of 39 patients withmultiple nodules but no history of malignancy at the timeof VATS had at least one nodule proven to be malignant.45
In this population, the investigators demonstrated a 68%rate of malignancy for multiple and solitary nodules of0.5 cm or smaller in size, and a 70% rate for those between0.5 and 1 cm in size. The high rate of malignancy in thesepatients probably reflected the higher risk of cancer in thegeneral population at the investigators’ institution, inaddition to the inclusion of patients undergoing VATSnodule resection. Clustering of multiple nodules in one areaof the lung would suggest a benign over a malignantetiology; however, the presence of a dominant noduleaccompanied by smaller satellite nodules can occur withlung cancer.46
FIGURE 2. Ground-glass nodule (arrows) detection. Axial (A) and coronal 1-mm (B) sections demonstrate a right upper lobe faint ground-glass nodule. Axial (C) and coronal 1-mm (D) minimum intensity projection images increase the conspicuity of the nodule.
Brandman and Ko J Thorac Imaging � Volume 26, Number 2, May 2011
92 | www.thoracicimaging.com r 2011 Lippincott Williams & Wilkins

AttenuationGround-glass attenuation at CT is a characteristic that
has been associated with a subset of nodules representingprimary lung malignancy, more specifically adenocarcino-ma. Anywhere from 20% to 75% of ground-glass nodulesare malignant.34,47 Ground-glass-containing nodules havebeen termed “subsolid” by some investigators and are pureground-glass or partly solid, meaning that some soft tissuedensity is present within the nodule. Persistent pure ground-glass nodules have been associated with primarily bronchio-loalveolar carcinomas (BACs). In a study by Kim et al thatassessed the cause of persistent pure ground-glass nodules,40 of 53 (75%) ground-glass nodules were either BAC (36nodules) or adenocarcinoma (4 nodules). Another cause ofground-glass is nodules atypical adenomatous hyperplasia(AAH), a precursor to adenocarcinoma. AAH comprised6% of the nodules, while organizing pneumonia ornonspecific fibrosis accounted for 19%. In the study byKim et al,47 neoplastic nodules were larger in size with anaverage diameter of 13mm, while the AAHs were onaverage 8mm. Inflammatory ground-glass nodules had asimilar size as their neoplastic counterparts, with a meandiameter of 12mm. Areas of soft tissue density withinground-glass nodules have been associated with areas ofactive fibroblastic proliferation and invasive features seenwith adenocarcinoma (Fig. 8).48 The differentiation ofAAH, and low-grade BAC is difficult, and nodule sphericityin one investigation was significantly associated with AAH,as opposed to BAC, whereas an internal air bronchogramsignificantly correlated with BAC.49 Any increase in densitywithin a persistent ground-glass nodule, with or withoutassociated overall nodule size increase, raises the concern ofmalignancy and the histologic development of aggressivefeatures. Malignant ground-glass nodules have beendescribed to decrease in size occasionally, usually withincreasing density probably related to collapse fibrosis, andtherefore continued reassessment by CT of a decreasingnodule may be warranted.50 Of note, the term BAC will be
eliminated from the pathological lexicon and replaced withthe term adenocarcinoma to represent tumors with lepidicgrowth without invasive components.51 Tumors with in-vasive components that are 5 mm and smaller will be termedminimally invasive adenocarcinoma. Mixed-attenuation no-dules can also represent pulmonary lymphoma, althoughinfrequently (Fig. 6).
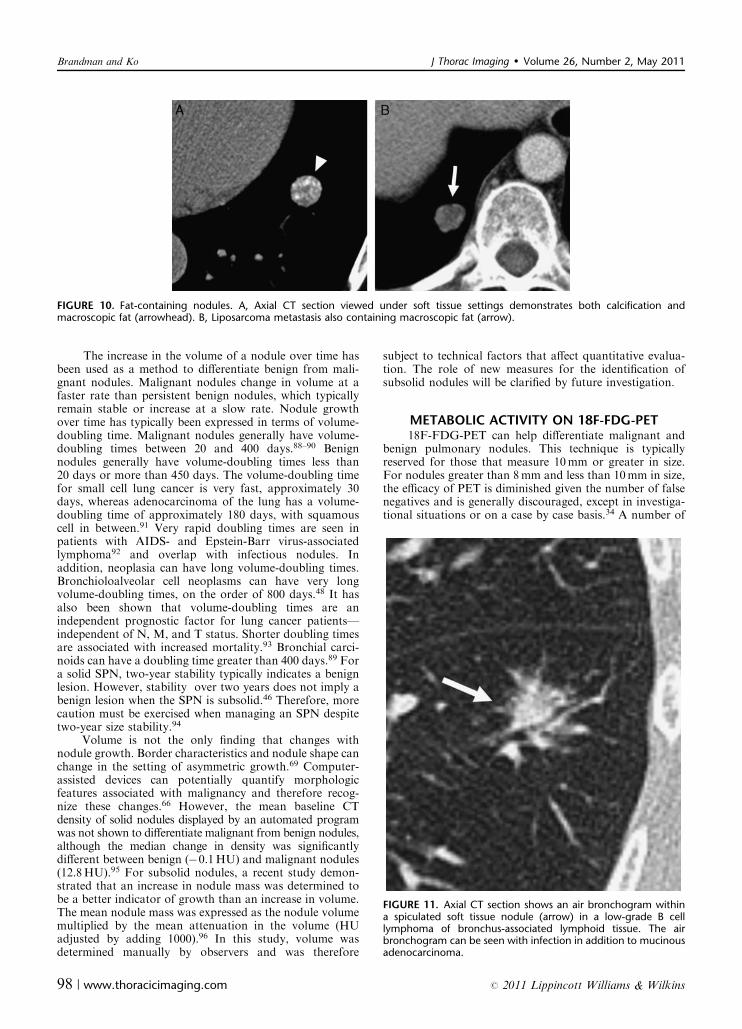
The pattern of calcification within an SPN is useful todetermine the likelihood of malignancy. Calcification ispresent within 10.6% of nodules and masses representinglung cancers.52 Patterns of calcification that raise suspicionfor malignancy include eccentric (asymmetric), reticular(linear), punctuate (discrete), and amorphous (indistinctseparation between foci of calcification).53 Eccentric calci-fication typically occurs when a carcinoma engulfs apreexisting adjacent granuloma. Other patterns of calcifica-tion seen in malignant nodules are dystrophic calcificationwithin necrotic areas of tumor and calcification related tomucin production. Benign SPNs calcify in patterns thathave been described as central, concentric, popcorn, anddiffuse (homogeneous). Prior granulomatous infection ismost often associated with central, concentric, or diffusecalcification. Popcorn calcification is seen in hamartomas(Fig. 9). The absence of a benign calcification pattern doesnot favor a malignant process, as up to 63% of benignnodules lack calcification.54 Identifiable macroscopic fatwithin a nodule on MDCT is a fairly characteristic findingof a pulmonary hamartoma,54 in addition to popcorncalcification. Although rare, other etiologies for pulmonarynodules containing visible fat on CT include solitaryliposarcoma metastasis and focus of exogenous lipoidpneumonia (Fig. 10).
Border, Shape, and Location CharacteristicsBenign pulmonary nodules most often have a well-
defined and smooth border. However, 21% of noduleswith a well-defined and smooth border are malignant.55
FIGURE 3. CAD detection of overlooked lingular nodule. On 5-mm (A) and 1-mm (B) axial sections, a location adjacent to the heartborder and cardiac pulsation artifact in the lung limited the identification of a pulmonary nodule (arrow). C, Axial section with CADmark (arrow), which was preprocessed on a server and displayed on a clinical PACS workstation, correctly identified the nodule despitethe presence of artifact.
J Thorac Imaging � Volume 26, Number 2, May 2011 SPN Detection, Characterization, and Management
r 2011 Lippincott Williams & Wilkins www.thoracicimaging.com | 93

A spiculated pulmonary nodule is most likely to bemalignant; however, this may not be a discriminator forsubsolid nodules.47 A lobular border is most oftenassociated with malignant nodules. In the Dutch-Belgianrandomized lung cancer screening trial (Nederlands Leu-vens Longkanker Screeningsonderzoek), lobular noduleshad a higher likelihood for malignancy compared withsmooth nodules, and all malignancies were intraparenchy-mal, without attachment to vessels.56,57 However, up to25% of benign nodules also can have a lobular border.58
For subsolid nodules, morphology (shape, border, and pre-sence of pleural tags) did not differentiate benign etiologies
such as interstitial fibrosis from the malignant BAC andadenocarcinoma in an investigation by Kim et al.47
Nodules surrounded by a ground-glass halo arenonspecific. The halo can represent either infection (oftenfungal) or hemorrhage secondary to vasculitis or metastaticdisease. Ground-glass halos are more commonly seen in thesetting of multiple nodules than with an SPN. Whenassociated with an SPN, the halo sign raises the suspicionfor BAC or, uncommonly, parenchymal lymphoma(Fig. 6).59 A reversed halo sign occurs when a nodule hascentral ground glass surrounded by soft tissue density.60
The sign has been described with organizing pneumonia
FIGURE 4. Axial chest CT images (A, B) depict a large nodule in the right upper lobe with mild low attenuation centrally and patentvessels. C, PET uptake is present mainly in the periphery of the lesion, suggesting central necrosis. Transthoracic needle biopsyconfirmed a focal abscess.
Brandman and Ko J Thorac Imaging � Volume 26, Number 2, May 2011
94 | www.thoracicimaging.com r 2011 Lippincott Williams & Wilkins

and other infectious and inflammatory etiologies. With thispattern, nodules are also typically multiple.
Both benign and malignant SPNs can have cavitationand air bronchograms (Fig. 11).61 Cavitation can occurwith infection, vasculitis, primary lung cancer, and meta-static disease. Cavity wall thickness has been investigated asa differentiating characteristic between benign and malig-nant nodules. In one investigation of cavities on radio-graphs, cavitary nodules with a wall thickness less than4mm were benign in 92% of cases, whereas those with awall thickness greater than 16mm were malignant in 95%of cases. Cavitary nodules with walls of intermediate (5 to15mm) thickness were malignant 51% of the time.62 OnCT, Honda et al63 reported that irregularity of the innercavity wall was significantly more frequent in malignant
compared with benign cavities (49% and 26%, respec-tively). A linear outer cavity wall was significantly morecommon in benign compared with malignant cavities (32%and 13%, respectively). An outer wall notch was identifiedmore in malignant than in benign cavities (54% and 29%,respectively). Nodule shape also offers predictive value,with an irregular shape having a higher likelihood formalignancy, as compared with round or polygonal no-dules.56 Air bronchograms are frequently seen in focalinfections, such as round pneumonia, but occur also inmalignancy, such as mucinous adenocarcinoma.
An upper lobe location for a lung nodule increases thepossibility that a lesion is lung cancer.64 However, apicalsegment nodularity that is small, peripheral, subpleural,and irregular is frequently seen and presumably related
TABLE 1. Differential Diagnosis of Solitary Pulmonary Nodule
Etiology Disease
NeoplasticMalignant Primary lung cancer (including adenocarcinoma, squamous cell carcinoma, bronchioloalveolar
carcinoma, and small cell carcinoma)Metastatic disease (including colon, breast, prostate, testicular, renal cell carcinoma, melanoma,and osteosarcoma)
Primary carcinoidPrimary lymphoma
Benign Hamartoma, neural tumor, fibroma, chondromaArteriovenous malformation
Infectious Granulomatous (mycobacterial or fungal)BacterialAbscess, septic embolus
Noninfectious Sarcoidosis, Wegener granulomatosis, Rheumatoid arthritis,amyloidosis
InfarctIntrapulmonary lymph node
Congenital Bronchial atresiaIntraparenchymal bronchogenic cyst
FIGURE 5. Left lower lobe carcinoid. A, Five-millimeter CT section demonstrates a mildly lobulated, ovoid, well-circumscribed nodule inthe left lower lobe. B, PET-CT imaging demonstrates mildly increased metabolic activity (standard uptake value, 2.0) corresponding tothe nodule (arrow). Surgical resection confirmed a typical carcinoid.
J Thorac Imaging � Volume 26, Number 2, May 2011 SPN Detection, Characterization, and Management
r 2011 Lippincott Williams & Wilkins www.thoracicimaging.com | 95

to postinflammatory fibrosis.46 Perifissural densities arefrequently small intraparenchymal lymph nodes withlow malignant potential, as described in screening popula-tions. These lymph nodes often appear triangular or oval inshape on CT (Fig. 12).46,65
Finally, nodule characterization using computer-assisted techniques remains under investigation.66 The goalfor computer assistance is to improve consistency incharacterizing nodules and to better predict their etiologyand behavior.67 Continued research in this area mayprovide greater insight into the predictive value of nodulecharacteristics.
NODULE VOLUME AND GROWTH ASSESSMENTNoncalcified subcentimeter pulmonary nodules detect-
ed on MDCT are monitored frequently with serial follow-up CT examinations. This is because 18F-FDG-PET,contrast-enhanced CT, and CT-guided percutaneous biopsyare less accurate for evaluating small pulmonary nodules.The follow-up assessment of pulmonary nodules does notonly include evaluating for interval size change, but alsomorphology and attenuation changes.
Follow-up MDCT assessment of SPN size change canbe accomplished either qualitatively or quantitatively. Themost common technique for quantitative measurement isthe manual placement of electronic calipers at the maxi-mum cross-sectional diameter on axial sections. However,Revel et al68 demonstrated that 2-dimensional CT measure-ments to evaluate for a size change are not reliable. Theyfound poor intrareader and interreader agreement on 2-dimensional size measurements. In addition, asymmetricgrowth may not be detected with 2-dimensional measure-ments. Three-dimensional volumetric measurement techni-ques have been shown to be more accurate.69
Computer-assisted techniques, primarily semiautomated,have been developed for measuring pulmonary nodules inlinear dimensions and volumetrically. Some are currentlycommercially available. Computer-assisted methods havebeen evaluated for use in the clinical scenarios of nodulecharacterization and for the surveillance of known malig-
nancy, the latter typically performed according to theResponse Assessment Criteria in Solid Tumors and WorldHealth Organization criteria. Schwartz et al70 reported thatmeasurement of tumor size was more consistent amongreaders using an automated autocontour technique thanelectronic calipers. Increasing knowledge of the precision(repeatability) and accuracy (bias) of these techniques hasbeen obtained.71–73 Computer-based linear and volume mea-surement methods use similar 3-dimensional nodule analysistechnology, with differences being the output obtained.
There are many factors that limit computer-assistednodule measurement. These include irregular margins, ir-regular overall shape, adjacent structures, and emphysema.Differences in inspiratory lung volume and cardiac cycle
FIGURE 6. Primary pulmonary lymphoma. Slow growth over 5.3 years of a pulmonary nodule (arrows) with solid and ground-glasscomponents, as seen on initial CT (left image), and CTs taken 3 (second from left), 4.5 (second from right), and 5.5 (right image) yearslater.
FIGURE 7. Arteriovenous malformations. Coronal maximumprojection reconstruction (MPR) shows 2 pulmonary nodules(white arrows) with prominent draining vein, which is shown forthe left upper lobe nodule (black arrow).
Brandman and Ko J Thorac Imaging � Volume 26, Number 2, May 2011
96 | www.thoracicimaging.com r 2011 Lippincott Williams & Wilkins

phase also limit the usefulness of computer-assisted nod-ule measurements when evaluating a follow-up study.74–79
Border characteristics can affect measurement variabilitybecause many techniques rely on segmentation of anodule’s border from adjacent structures, such as vessels,and shape assessment. Difficulty measuring perivascular,spiculated, perifissural, and pleural-based nodules has beenreported by some77–79 but not all investigations.80 Inaddition, some studies have shown that different CT dosesand reconstruction parameters affect nodule measure-ment.80–82 Smaller nodules are associated with greatermeasurement error given their susceptibility to partialvolume effect.73,80 In addition, measurement precision wasshown by Rampinelli et al83 to change after intravenouscontrast administration in patients who underwent multi-phase contrast-enhanced CT. A 4% to 6% and 4% to 7%higher median volume was identified for nodules onpostcontrast compared with noncontrast images for twodifferent commercial software packages. This occured at alltime points for one software program, and at all time pointsexcept 30 seconds after contrast for the other program. Theinvestigators postulated that this effect was due to increasedattenuation of the nodule’s edge that affected nodule seg-mentation. The particular phase of contrast enhancementwas not a significant factor in nodule volume calculation.Therefore, the volume difference may need to be consideredwhen comparing nodule volume measurements from CTsobtained with contrast to those without contrast. Finally,precision of volume measurement has minimally addressednodules of ground-glass attenuation, with investigation sofar primarily in phantom studies and with noncommercialproducts.84,85
Reported precision of volumetric analysis depends onthe software program and emphasizes the need to measurenodule volume change with the same program. In an eva-luation of 6 semiautomated software programs, De Hoopet al73 reported the variability of measuring nodule volumeon two unenhanced CT scans performed on the same visitin each of 20 patients with pulmonary metastases.Adequate segmentation occurred in 71% to 86% of noduleswith a variability of 16.4% to 22.3% (Fig. 13). Theinvestigators noted that there were systemic volumedifferences among 11 of 15 comparisons of manufacturers.
Marchiano et al,86 using a commercially-available softwareprogram, demonstrated a 95% confidence interval fordifferences in measured volumes in the range of ±27%,meaning a change in 27% of volume was probably asignificant change. Rampinelli et al87 recommended in theirstudy that for their volume assessment method tested, avolume change of greater than 30% for nodules between 5and 10mm should be confirmed with another follow-up CTto confirm nodule growth.
FIGURE 8. Mixed solid and ground-glass pulmonary nodule. A, Axial CT section shows a nodular soft tissue area devoid of airbronchograms (arrowhead) and ground-glass opacity (arrow) that was adenocarcinoma (B) on needle aspiration. The shape of thisnodule is polygonal in some portions. The lesion was confirmed by resection as a moderately differentiated adenocarcinoma with a BACcomponent.
FIGURE 9. Popcorn calcification in a hamartoma displayed oncoronal CT reconstruction.
J Thorac Imaging � Volume 26, Number 2, May 2011 SPN Detection, Characterization, and Management
r 2011 Lippincott Williams & Wilkins www.thoracicimaging.com | 97
The increase in the volume of a nodule over time hasbeen used as a method to differentiate benign from mali-gnant nodules. Malignant nodules change in volume at afaster rate than persistent benign nodules, which typicallyremain stable or increase at a slow rate. Nodule growthover time has typically been expressed in terms of volume-doubling time. Malignant nodules generally have volume-doubling times between 20 and 400 days.88–90 Benignnodules generally have volume-doubling times less than20 days or more than 450 days. The volume-doubling timefor small cell lung cancer is very fast, approximately 30days, whereas adenocarcinoma of the lung has a volume-doubling time of approximately 180 days, with squamouscell in between.91 Very rapid doubling times are seen inpatients with AIDS- and Epstein-Barr virus-associatedlymphoma92 and overlap with infectious nodules. Inaddition, neoplasia can have long volume-doubling times.Bronchioloalveolar cell neoplasms can have very longvolume-doubling times, on the order of 800 days.48 It hasalso been shown that volume-doubling times are anindependent prognostic factor for lung cancer patients—independent of N, M, and T status. Shorter doubling timesare associated with increased mortality.93 Bronchial carci-noids can have a doubling time greater than 400 days.89 Fora solid SPN, two-year stability typically indicates a benignlesion. However, stability over two years does not imply abenign lesion when the SPN is subsolid.46 Therefore, morecaution must be exercised when managing an SPN despitetwo-year size stability.94
Volume is not the only finding that changes withnodule growth. Border characteristics and nodule shape canchange in the setting of asymmetric growth.69 Computer-assisted devices can potentially quantify morphologicfeatures associated with malignancy and therefore recog-nize these changes.66 However, the mean baseline CTdensity of solid nodules displayed by an automated programwas not shown to differentiate malignant from benign nodules,although the median change in density was significantlydifferent between benign (�0.1HU) and malignant nodules(12.8HU).95 For subsolid nodules, a recent study demon-strated that an increase in nodule mass was determined tobe a better indicator of growth than an increase in volume.The mean nodule mass was expressed as the nodule volumemultiplied by the mean attenuation in the volume (HUadjusted by adding 1000).96 In this study, volume wasdetermined manually by observers and was therefore
subject to technical factors that affect quantitative evalua-tion. The role of new measures for the identification ofsubsolid nodules will be clarified by future investigation.
METABOLIC ACTIVITY ON 18F-FDG-PET18F-FDG-PET can help differentiate malignant and
benign pulmonary nodules. This technique is typicallyreserved for those that measure 10mm or greater in size.For nodules greater than 8mm and less than 10mm in size,the efficacy of PET is diminished given the number of falsenegatives and is generally discouraged, except in investiga-tional situations or on a case by case basis.34 A number of
FIGURE 10. Fat-containing nodules. A, Axial CT section viewed under soft tissue settings demonstrates both calcification andmacroscopic fat (arrowhead). B, Liposarcoma metastasis also containing macroscopic fat (arrow).
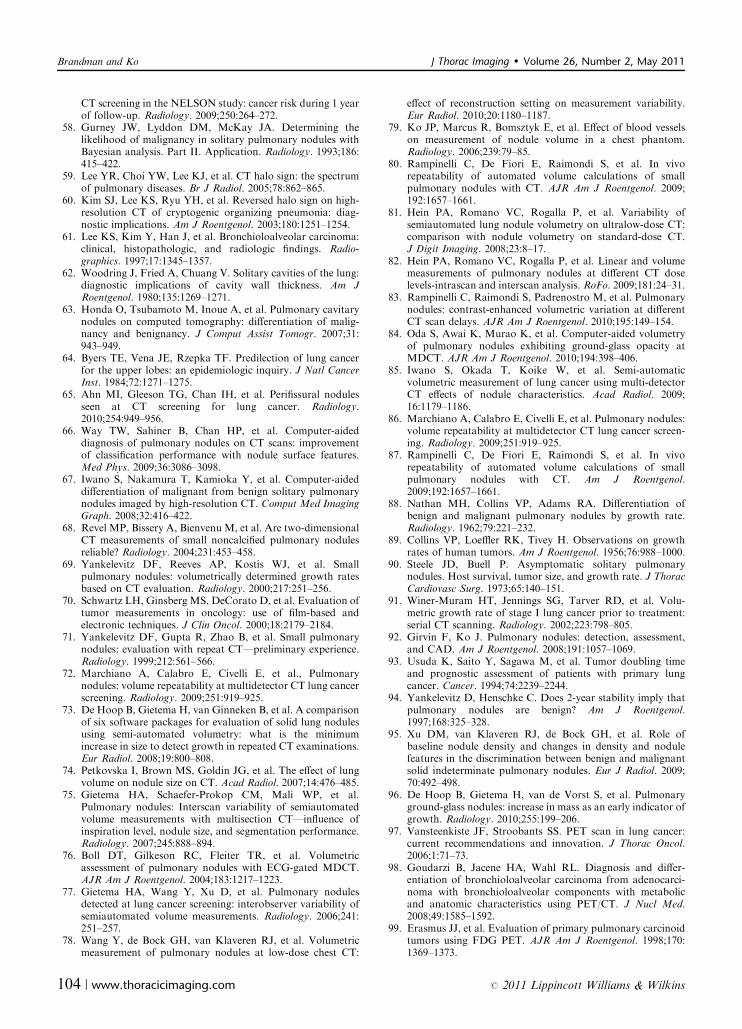
FIGURE 11. Axial CT section shows an air bronchogram withina spiculated soft tissue nodule (arrow) in a low-grade B celllymphoma of bronchus-associated lymphoid tissue. The airbronchogram can be seen with infection in addition to mucinousadenocarcinoma.
Brandman and Ko J Thorac Imaging � Volume 26, Number 2, May 2011
98 | www.thoracicimaging.com r 2011 Lippincott Williams & Wilkins

investigations have been published concerning the efficacyof PET. PET has sensitivities on the order of 80% to 100%,with specificities on the order of 40% to 100%. In ananalysis by Wahidi et al35 of 17 published studies, a pooled87% sensitivity and 83% specificity were reported. Abnor-mal 18F-FDG accumulation can occur with infectiousnodules due to fungi and mycobacteria, sarcoidosis,rheumatoid nodules, and other causes of focal inflamma-tory lung disease.34,97 As mentioned, false-negative 18F-
FDG-PET results can occur with pulmonary nodulessmaller than 10mm in size. In addition, tumors such asbronchioloalveolar cell carcinoma, well-differentiated ade-nocarcinoma, and carcinoid can all have low FDGuptake.97,98 In an investigation of seven carcinoid tumorsby Erasmus et al,99 a total of six tumors (three endobron-chial and three parenchymal) had no abnormal FDGuptake (Fig. 5). FDG-PET has been demonstrated to havea high negative predictive value; however, lesions that are
FIGURE 12. Intraparenchymal lymph node (A) CT axial section shows a smoothly marginated, well-circumscribed nodule in the leftlower lobe. B, This nodule was an intraparenchymal lymph node on hematoxylin and eosin stain. Pathology courtesy of Herman Yee,MD.
FIGURE 13. Computer-assisted segmentation and measurement of progressive colon metastases. A, Segmented nodule withdimensions on baseline CT examination are shown with a Response Assessment Criteria in Solid Tumors (RECIST) maximal nodulediameter of 12.2 mm and a volume of 0.667 mL. B, Segmentation of nodule on CT scan 2 months later demonstrates a RECIST maximaldiameter of 16.6 mm and a volume of 1.115 mL, representing a 36% increase in maximal dimension and a 67% increase in volume.
J Thorac Imaging � Volume 26, Number 2, May 2011 SPN Detection, Characterization, and Management
r 2011 Lippincott Williams & Wilkins www.thoracicimaging.com | 99

deemed probably benign are recommended to be followedup by CT to ensure that false-negative PET results are lateridentified.34
NODULE ENHANCEMENT CHARACTERISTICSON MDCT
CT nodule enhancement is a method that is notfrequently used, although it is an option when 18F-FDGPET imaging is not available.100–102 This technique is lessfrequently performed given the increasing access to 18F-FDG-PET imaging and the technical expertise required forCT nodule-enhancement studies.103 Nodules that measuregreater than 7mm and less than 30mm and lack calcifica-tion, cavitation, or ground-glass attenuation can becharacterized using this technique. Studied in a multicentertrial, imaging is performed prior to and 1, 2, 3, and 4minutes after intravenous contrast. The nodule’s precon-trast attenuation is subtracted from the maximal attenua-tion after intravenous contrast administration, as measuredwith a region of interest placed over a majority of thenodule on its largest cross-section in thin-section CTimages. A 15-HU or smaller enhancement suggests abenign etiology. To avoid false-negative diagnoses, theinvestigators for this multicenter study recommended theuse of a 10-HU threshold for enhancement and follow-upimaging with CT. The sensitivity and specificity were 98%and 58%, respectively, using a 15 HU threshold. Given thelower specificity of this technique, a greater than 15HUincrease may reflect either malignant or inflammatorydisease (Fig. 14).100
Nodule enhancement has been investigated withincreasing temporal resolution given advances in MDCTtechnology.104 In their study using 20-second imaging and2-dimensional region of interest analysis, Yi et al104 identi-fied that a 30-HU or greater enhancement had a sensitivityfor malignancy of 99%, with a specificity of 54%, positivepredictive value of 71%, and negative predictive value of97%. The analysis of contrast-enhanced data for noduleperfusion can potentially benefit from image-processingtechniques including volumetric enhancement analysis andsemiquantitative enhancement maps.105,106 Limited investi-gation has addressed compartmental modeling with CT, inwhich enhancement data are analyzed for quantitativemeasures such as blood volume and volume-transfer con-stant (Ktrans) parametric maps.107 These parameters havebeen investigated primarily in lung cancer. Ktrans describesthe portion of blood flow that enters the extravascularspace. Despite the potential of these techniques, a trade-offexists between the number of imaging time points neededfor such techniques and the radiation exposure to thepatient. Low-dose techniques with low kVp and reducedmAs and limited coverage imaging have been used tominimize radiation exposure.107
Dual-energy (DE) CT imaging was made clinicallyfeasible by the development of dual-source and more recentkVp-switching single-source CT technology.108 Such techno-logy enables near-simultaneous or simultaneous acquisitionboth sets of kVp image data. DECT images can now beobtained at similar radiation exposures compared with atraditional single-energy CT acquisition. Image data from bothkVps can be fused so that displayed images appear similar toa traditional 120-kVp image (a weighted-average image or“mixed” image). Material-specific images can be createdusing material decomposition, including an “iodine-enhanced
image” that displays the distribution of iodine.106 The iodineimage has at times been referred to as a perfusion image, amisnomer given that the term perfusion implies the enhance-ment of tissue and blood over time, whereas the iodine imagedepicts blood volume at a single time point rather than flow.109
With DECT imaging, an image without the iodine constituentscan also be created, termed the virtual nonenhanced or virtualnoncontrast image (Fig. 15). Chae et al110 compared thevirtual nonenhanced image for the evaluation of lung nodulesto a true noncontrast image and demonstrated good interstudyagreement. The investigators also reported strong agreementbetween HU values measured on a 3-minute delayed iodine-enhanced image (as a measure of iodine enhancement) andnodule enhancement (difference in HUs between a true pre-contrast and 3-minute weighted-average images after contrast).The delayed iodine-enhanced CT image HU values had asensitivity of 92% and a specificity of 70% for malignancy.111
Although further research is necessary, such techniques maypotentially obviate patient radiation by eliminating the needfor multiple acquisitions and precontrast imaging.
PULMONARY NODULE MANAGEMENTThe approach to managing pulmonary nodules is
multidisciplinary, with input from pulmonologists, sur-geons, and radiologists. The evaluation of a pulmonarynodule has been summarized by the American College ofChest Physicians Clinical Practice Guidelines (ACCP).34
The work up of a nodule includes assessment of a patient’srisk for cancer, a weighing of the risks and benefits ofevaluation methods, and consideration of patient prefer-ences. Although the complexity of the topic necessitates afull examination of the ACCP guidelines and recommenda-tions, which are given different strengths, a summary ofmanagement aspects will be discussed briefly to overviewnodule management. Guidelines for the follow-up ofsubcentimeter pulmonary nodules incidentally detected byMDCT have been issued by the Fleischner Society andintegrated into the ACCP guidelines. The workup ofnodules that are larger than 10mm in size provides agreater challenge, in that there are more noninvasive andinvasive options for further evaluation.
Patient Risk and Nodule FactorsThe ACCP guidelines recommend the qualitative or
quantitative assessment of patient risk. Modeling hasimproved our understanding of risk factors for malig-nancy58,112 by determining the likelihood ratios of inde-pendent imaging and clinical factors. Specific clinicalfeatures determined to be significant predictors of malig-nancy are age, smoking history, and personal history ofcancer 5 or more years prior. Nodule features associatedwith a higher likelihood of malignancy are size, spiculation,and upper lobe location.113 A prediction model incorporat-ing these factors was shown to predict the likelihood ofmalignancy similar to that of experts.113 The addition of18F-FDG-PET findings to a Bayesian analysis was shownto increase the effectiveness of the model.114
Risks Versus Benefits of Management OptionsThe likelihood of malignancy is weighed along with
the risks to the patient. In terms of initial evaluation of anodule, comparison with prior imaging is very useful toidentify whether a finding is stable, and provides noadditional patient risk. If solid and stable for 2 years, thefinding is probably benign.94 If a nodule is ground glass in
Brandman and Ko J Thorac Imaging � Volume 26, Number 2, May 2011
100 | www.thoracicimaging.com r 2011 Lippincott Williams & Wilkins

attenuation on CT, longer follow-up at wider time intervalscan be considered given that ground-glass nodule growthhas been reported to be slow.46,115,116 With longer follow-up, the theoretical risk of radiation exposure requiresconsideration. A reduced-dose, low-mAs imaging techniquecan be used for follow-up studies to reduce cumulativepatient dose.117 Without prior imaging, CT scan is recom-mended by the ACCP for indeterminate nodules identifiedon chest radiography.
The pretest probability of malignancy, related topatient risk and nodule characteristics, can be used toguide management. In the appropriate settings, alternativesto CT follow-up include CT nodule enhancement, FDG-PET, transthoracic or bronchoscopic needle biopsy, andsurgical resection. Decision analysis has shown thatdifferences between management strategies are very small,and the chosen approach is typically “a close call.”118
Therefore, the patient is encouraged to actively participatein the decision-making process. An algorithm recom-mended by the ACCP considers the probability ofmalignancy when deciding whether to observe, biopsy orresect a nodule.116 When a very low clinical probability ofcancer exists (<5%) for an SPN that is at least 8 to 10mm
in diameter, ACCP guidelines mention that observationwith CT can be performed at 3, 6, 12, and 24 months.Moderate pretest probability patients can undergo furtherevaluation with FDG-PET and CT nodule enhancementwhen an SPN is at least 8 to 10mm in size.34 However,FDG-PET evaluation of subsolid nodules is prone to falsenegatives given their low metabolic activity and should notbe systematically performed for these nodules. Biopsyremains a possibility for patients with moderate pretestprobability, particularly when infection is suspected andwhen there are discordant FDG-PET findings and patientrisk factors. Nodules that are nondiagnostic by biopsy canbe observed when not hypermetabolic. However, this maynot apply to subsolid lesions given that low FDG-PETactivity frequently occurs. When FDG-PET or contrast-enhanced CT is abnormal, the risk of malignancy isincreased. The management of such lesions is challengingand depends on a case-by-case analysis considering lesionlocation and patient comorbidities. Histologic confirmationcan be obtained in this scenario via transthoracic biopsy,bronchoscopic biopsy, or thoracoscopic wedge resection byfrozen section. Patients with a moderate-to-high rate ofmalignancy (>60%) may undergo a surgical diagnosis
FIGURE 14. CT enhancement study of an enlarging nodule that was PET negative. The average HU measurement increases by 34 HUcomparing the precontrast image (left) to the peak enhancement 4 minutes after contrast injection (right).
FIGURE 15. Dual-source dual-energy CT in a patient with metastatic melanoma. A, Right lower lobe pulmonary nodule (arrow) onweighted-average image. B and C, After material decomposition, virtual non-contrast (B) and iodine-enhanced images (C) with ROIplaced on the nodule demonstrate enhancement of the nodule by 55 HU on iodine-enhanced image. The nodule was 20 HU on thevirtual non-contrast image. D, Three-dimensional segmentation of the nodule is possible, as shown on 50/50%-weighted CT/iodine-enhanced image (blue circle).
J Thorac Imaging � Volume 26, Number 2, May 2011 SPN Detection, Characterization, and Management
r 2011 Lippincott Williams & Wilkins www.thoracicimaging.com | 101

when the nodule is hypermetabolic on FDG and patientpreference is for a definitive diagnostic procedure. Biopsy isrecommended prior to any therapy, surgical or nonsurgical.
For small pulmonary nodules less than 8mm in size,the likelihood of malignancy is very low, on the order ofless than 1% in high-risk smokers.46 The Fleischner Societyrecommendation for these nodules considers nodule sizeand patient risk factors for lung cancer. However, nodulemultiplicity and distribution are not directly addressed.Relevant patient risk factors include a smoking history,prior malignancy, family history of lung cancer in a first-degree relative, and environmental exposures such asasbestos, radon, and uranium. These recommendationswere not designed for application to patients youngerthan 35 years of age, for those with known extrathoracicmalignancy, or cases with unexplained fever.46 Importantly,the guidelines also do not apply to ground-glass or mixedground-glass and solid pulmonary nodules. The guidelinessuggest that solid pulmonary nodules less than or equal to4mm in size need not be followed further in a patient withno risk factors, whereas those individuals with risk factorscan have a follow-up in 12 months, with no subsequentevaluation if the nodule is stable. The time interval at whicha follow-up CT is performed decreases and the number offollow-up CTs to determine stability increases as nodulesize increases, given the positive correlation of nodule sizewith risk of cancer. Despite the issuance of these guidelines,a lack of coherence in the management of nodules smallerthan 10mm remains,119,120 which may decrease in theensuing years as continued dissemination of these guide-lines occurs.
Formally proposed management guidelines for ground-glass and subsolid pulmonary nodules have not yet beenissued. There are limited options for assessing these lesionsnoninvasively, other than observation. Transthoracic biopsycan be performed on these lesions.121 Interim managementguidelines have been proposed by Godoy and Naidich.117
Thin-section evaluation is very useful for identifying anysolid components and evaluating the amount of ground-glass attenuation. Given the poorly-defined nature of thesenodules, the relationship of the ground glass to theanatomical structures needs to be scrutinized to assess forchange. SPNs that are smaller than 5mm and contain onlyground-glass opacity are typically AAH, and it is unclearwhether these lesions require follow-up. It has been shownthat a small (7%) portion of 5 and 10mm pure ground-glassopacities can have invasive adenocarinoma features122;therefore, CT follow-up in these cases is recommended in3 to 6 months. Pure ground-glass nodules larger than 10mmthat persist on a 3-month to 6-month follow-up CT are mostlikely BAC or invasive adenocarcinoma.117 These lesions aretypically resected, particularly if they increase in size ordevelop solid components.117 Solid components developingin a ground-glass nodule and representing greater than 50%of the nodule have been associated with increased risk fornodal metastatic disease.123 Regression of a ground-glassnodule has been described in a small proportion of nodulesthat are malignant, and therefore follow-up may bewarranted to confirm continued size decrease of a ground-glass lesion. The exact length of follow-up time requiredremains uncertain and must be weighed against the risk offurther CT radiation dose. In addition, overdiagnosis ofthese lesions remains a factor, as there is a question ofwhether nodules with indolent behavior will affect overallpatient survival. Longer intervals, such as one year follow-
up, and dose reduction techniques can be used forsurveillance of these findings.117
SUMMARYThe detection of pulmonary nodules on CT has been
aided by advances in technology. The most commonetiologies for a malignant SPN are primary lung cancerand metastasis. Infectious granulomas and hamartomas arethe most common etiologies for a benign SPN. Diagnostictools discussed in this review can be used to categorizeSPNs as benign, malignant, or indeterminate. Evidence-based clinical guidelines and expert recommendations areavailable to guide the management of indeterminate SPNs.
REFERENCES
1. Altekruse SF, Kosary CL, Krapcho M, et al. SEER CancerStatistics Review, 1975-2007. National Cancer Institute:Bethesda, MD. http://seer.cancer.gov/csr/1975_2007/, basedon November 2009 SEER data submission. Posted to theSEER web site, 2010.
2. Gould MK, Maclean CC, Kuschner WG, et al. Accuracy ofpositron emission tomography for diagnosis of pulmonarynodules and mass lesions: a meta-analysis. JAMA. 2001;285:914–924.
3. Shah PK, Austin JH, White CS, et al. Missed non-small celllung cancer: radiographic findings of potentially resectablelesions evident only in retrospect. Radiology. 2003;226:235–241.
4. Austin JH, Romney BM, Goldsmith LS. Missed broncho-genic carcinoma: radiographic findings in 27 patients with apotentially resectable lesion evident in retrospect. Radiology.1992;182:115–122.
5. Gurney JW. Missed lung cancer at CT: imaging findings innine patients. Radiology. 1996;199:117–122.
6. White CS, Romney BM, Mason AC, et al. Primary carcinomaof the lung overlooked at CT: analysis of findings in 14patients. Radiology. 1996;199:109–115.
7. Ko JP, Rusinek H, Naidich DP, et al. Wavelet compression oflow-dose chest CT data: effect on lung nodule detection.Radiology. 2003;228:70–75.
8. Kakinuma R, Ohmatsu H, Kaneko M, et al. Detectionfailures in spiral CT screening for lung cancer: analysis of CTfindings. Radiology. 1999;212:61–66.
9. Fischbach F, Knollman F, Griesshaber V, et al. Detection ofpulmonary nodules by multislice computed tomography:improved detection rate with reduced slice thickness. EurRadiol. 2003;13:2378–2383.
10. Diederich S, Semik M, Lentschig MG, et al. Helical CT ofpulmonary nodules in patients with extrathoracic malignancy:CT-surgical correlation. AJR Am J Roentgenol. 1999;172:353–360.
11. Rubin G. Data explosion: the challenge of multidetector rowCT. Eur J Radiol. 2000;36:74–80.
12. Sakai M, Murayama S, Gibo M, et al. Can MaximumIntensity Projection Images With Multidetector-Row Com-puted Tomography Help to Differentiate Between theMicronodular Distribution of Focal and Diffuse InfiltrativeLung Diseases? J Comput Assist Tomogr. 2005;29:588–591.
13. Gruden JF, Ouanounou S, Tigges S, et al. Incremental benefitof maximum-intensity-projection images on observer detec-tion of small pulmonary nodules revealed by multidetectorCT. AJR Am J Roentgenol. 2002;179:149–157.
14. Park EA, Goo JM, Lee JW, et al. Efficacy of computer-aideddetection system and thin-slab maximum intensity projectiontechnique in the detection of pulmonary nodules in patientswith resected metastases. Invest Radiol. 2009;44:105–113.
15. Valencia R, Denecke T, Lehmkuhl L, et al. Value of axial andcoronal maximum intensity projection (MIP) images in thedetection of pulmonary nodules by multislice spiral CT:
Brandman and Ko J Thorac Imaging � Volume 26, Number 2, May 2011
102 | www.thoracicimaging.com r 2011 Lippincott Williams & Wilkins

comparison with axial 1-mm and 5-mm slices. Eur Radiol.2006;16:325–332.
16. Brown MS, Goldin JG, Suh RD, et al. Lung micronodules:automated method for detection at thin-section CT—initialexperience. Radiology. 2003;226:256–262.
17. Rubin GD, Lyo JK, Paik DS, et al. Pulmonary nodules onmulti-detector row CT scans: performance comparison ofradiologists and computer-aided detection. Radiology. 2005;234:274–283.
18. White CS, Pugatch R, Koonce T, et al. Lung nodule CADsoftware as a second reader: a multicenter study. Acad Radiol.2008;15:326–333.
19. Das M, Muhlenbruch G, Mahnken AH, et al. Smallpulmonary nodules: effect of two computer-aided detectionsystems on radiologist performance. Radiology. 2006;241:564–571.
20. Sahiner B, Chan HP, Hadjiiski LM, et al. Effect of CAD onradiologists’ detection of lung nodules on thoracic CT scans:analysis of an observer performance study by nodule size.Acad Radiol. 2009;16:1518–1530.
21. Nietert PJ, Ravenel JG, Taylor KK, et al. Influence of noduledetection software on radiologists’ confidence in identifyingpulmonary nodules with computed tomography. J ThoracImaging. 2010;26:48–53.
22. Zhou J, Chang S, Metaxas DN, et al. Automatic detectionand segmentation of ground glass opacity nodules. MedImage Comput Comput Assist Interv. 2006;9(Pt 1):784–791.
23. Bastawrous HA, Nitta N, Tsudagawa M. A new CAD systemfor detecting localized ground glass opacity nodules in lungCT images using cross and coronary section images, in IEEEInternational Workshop on Medical Measurement andApplications (MeMea). Benevento, Italy. 2006:4–4.
24. Ye X, Lin X, Beddoe G, et al. Efficient computer-aideddetection of ground-glass opacity nodules in thoracic CTimages. Conf Proc IEEE Eng Med Biol Soc. 2007;2007:4449–4452.
25. Ye X, Lin X, Dehmeshki J, et al. Shape-based computer-aided detection of lung nodules in thoracic CT images. IEEETrans Biomed Eng. 2009;56:1810–1820.
26. Yanagawa M, Honda O, Yoshida S, et al. Commerciallyavailable computer-aided detection system for pulmonarynodules on thin-section images using 64 detectors-row CT:preliminary study of 48 cases. Acad Radiol. 2009;16:924–933.
27. Beigelman-Aubry C, Hill C, Boulanger X, et al. Evaluation ofa computer aided detection system for lung nodules withground glass opacity component on multidetector-row CT.J Radiol. 2009;90:1843–1849.
28. Betke M, Hong H, Thomas D, et al. Landmark detection inthe chest and registration of lung surfaces with an applicationto nodule registration. Med Image Anal. 2003;7:265–281.
29. Sun S, Rubin GD, Paik D, et al. Registration of lung nodulesusing a semi-rigid model: method and preliminary results.Med Phys. 2007;34:613–626.
30. Tao C, Gierada DS, Zhu F, et al. Automated matching ofpulmonary nodules: evaluation in serial screening chest CT.American Journal of Roentgenology. 2009;192:624–628.
31. Lee KW, Kim M, Gierada DS, et al. Performance of acomputer-aided program for automated matching of meta-static pulmonary nodules detected on follow-up chest CT.AJR Am J Roentgenol. 2007;189:1077–1081.
32. Beyer F, Wormanns D, Novak C, et al. Clinical evaluation ofa software for automated localization of lung nodules atfollow-up CT examinations. Rofo. 2004;176:829–836.
33. Ost D, Fein AM, Feinsilver SH. Clinical practice: the solitarypulmonary nodule. N Engl J Med. 2003;348:2535–2542.
34. Gould MK, Fletcher J, Iannettoni MD, et al. Evaluation ofpatients with pulmonary nodules: when is it lung cancer?ACCP evidence-based clinical practice guidelines (2nd edi-tion). Chest. 2007;132(3_suppl):108S–130S.
35. Wahidi MM, Govert JA, Goudar RK, et al. Evidence for thetreatment of patients with pulmonary nodules: when is it lung
cancer? ACCP evidence-based clinical practice guidelines (2ndedition). Chest. 2007;132(3 suppl):94S–107S.
36. Libby DM, Smith JP, Altorki NK, et al. Managing the smallpulmonary nodule discovered by CT. Chest. 2004;125:1522–1529.
37. Travis WD. Pathology of lung cancer. Clin Chest Med. 2002;23:65–81, viii.
38. Gephardt GN, Grady KJ, Ahmad M, et al. Peripheral smallcell undifferentiated carcinoma of the lung: clinicopathologicfeatures of 17 cases. Cancer. 1988;61:1002–1008.
39. Chong S, Lee KS, Chung MJ, et al. Neuroendocrine tumorsof the lung: clinical, pathologic, and imaging findings.Radiographics. 2006;26:41–57.
40. Rosado de Christenson ML, Abbott GF, Kirejczyk WM,et al. From the Archives of the AFIP. Thoracic Carcinoids:Radiologic-Pathologic Correlation. Radiographics. 1999;19:707–736.
41. Cordier JF, Valeyre D, Guillevin L, et al. PulmonaryWegener’s granulomatosis: a clinical and imaging study of77 cases. Chest. 1990;97:906–912.
42. Ginsberg MS, Griff SK, Go BD, et al. Pulmonary nodulesresected at video-assisted thoracoscopic surgery: etiology in426 patients. Radiology. 1999;213:277–282.
43. Maldonado JA, Henry T, Gutierrez FR. Congenital thoracicvascular anomalies. Radiol Clin N Am. 2010;48:85–115.
44. Henschke CI, McCauley DI, Yankelevitz DF, et al. EarlyLung Cancer Action Project: overall design and findings frombaseline screening. Lancet. 1999;354:99–105.
45. Ginsberg MS, Griff SK, Go BD, et al. Pulmonary nodulesresected at video-assisted thoracoscopic surgery: etiology in426 patients. Radiology. 1999;213:277–282.
46. MacMahon H, Austin JH, Gamsu G, et al. Guidelines formanagement of small pulmonary nodules detected on CTscans: a statement from the Fleischner Society. Radiology.2005;237:395–400.
47. Kim HY, Shim YM, Lee KS, et al. Persistent pulmonarynodular ground-glass opacity at thin-section CT: histopatho-logic comparisons. Radiology. 2007;245:267–275.
48. Aoki T, Watanabe H, Nakamura K, et al. Evolution ofperipheral lung adenocarcinomas: CT findings correlated withhistology and tumor doubling time. AJR Am J Roentgenol.2000;174:763–768.
49. Oda S, Awai K, Liu D, et al. Ground-glass opacities on thin-section helical CT: differentiation between bronchioloalveolarcarcinoma and atypical adenomatous hyperplasia. AJR Am JRoentgenol. 2008;190:1363–1368.
50. Kakinuma R, Ohmatsu H, Kaneko M, et al. Progression offocal pure ground-glass opacity detected by low-dose helicalcomputed tomography screening for lung cancer. J ComputAssist Tomogr. 2004;28:17–23.
51. Travis WD, Brambilla E, Noguchi M, et al. InternationalAssociation for the Study of Lung Cancer/American ThoracicSociety/European Respiratory Society International Multi-disciplinary Classification of Lung Adenocarcinoma.J Thorac Oncol. 2011;6:244–285.
52. Grewal RG, Austin JH. CT demonstration of calcification incarcinoma of the lung. J Comput Assist Tomogr.1994;18:867–871.
53. Mahoney M, Shipley RT, Corcoran HL, et al. CT demon-stration of calcification in carcinoma of the lung. Am JRoentgenol. 1990;154:255–258.
54. Siegelman SS, Khouri NF, Leo FP, et al. Solitary pulmonarynodules: CT assessment. Radiology. 1986;160:307–312.
55. Siegelman SS, Zerhouni EA, Leo FP, et al. CT of the solitarypulmonary nodule. AJR Am J Roentgenol. 1980;135:1–13.
56. Xu DM, van Klaveren RJ, de Bock GH, et al. Limited valueof shape, margin and CT density in the discriminationbetween benign and malignant screen detected solid pulmo-nary nodules of the NELSON trial. Eur J Radiol. 2008;68:347–352.
57. Xu DM, van der Zaag-Loonen HJ, Oudkerk M, et al. Smoothor attached solid indeterminate nodules detected at baseline
J Thorac Imaging � Volume 26, Number 2, May 2011 SPN Detection, Characterization, and Management
r 2011 Lippincott Williams & Wilkins www.thoracicimaging.com | 103
CT screening in the NELSON study: cancer risk during 1 yearof follow-up. Radiology. 2009;250:264–272.
58. Gurney JW, Lyddon DM, McKay JA. Determining thelikelihood of malignancy in solitary pulmonary nodules withBayesian analysis. Part II. Application. Radiology. 1993;186:415–422.
59. Lee YR, Choi YW, Lee KJ, et al. CT halo sign: the spectrumof pulmonary diseases. Br J Radiol. 2005;78:862–865.
60. Kim SJ, Lee KS, Ryu YH, et al. Reversed halo sign on high-resolution CT of cryptogenic organizing pneumonia: diag-nostic implications. Am J Roentgenol. 2003;180:1251–1254.
61. Lee KS, Kim Y, Han J, et al. Bronchioloalveolar carcinoma:clinical, histopathologic, and radiologic findings. Radio-graphics. 1997;17:1345–1357.
62. Woodring J, Fried A, Chuang V. Solitary cavities of the lung:diagnostic implications of cavity wall thickness. Am JRoentgenol. 1980;135:1269–1271.
63. Honda O, Tsubamoto M, Inoue A, et al. Pulmonary cavitarynodules on computed tomography: differentiation of malig-nancy and benignancy. J Comput Assist Tomogr. 2007;31:943–949.
64. Byers TE, Vena JE, Rzepka TF. Predilection of lung cancerfor the upper lobes: an epidemiologic inquiry. J Natl CancerInst. 1984;72:1271–1275.
65. Ahn MI, Gleeson TG, Chan IH, et al. Perifissural nodulesseen at CT screening for lung cancer. Radiology.2010;254:949–956.
66. Way TW, Sahiner B, Chan HP, et al. Computer-aideddiagnosis of pulmonary nodules on CT scans: improvementof classification performance with nodule surface features.Med Phys. 2009;36:3086–3098.
67. Iwano S, Nakamura T, Kamioka Y, et al. Computer-aideddifferentiation of malignant from benign solitary pulmonarynodules imaged by high-resolution CT. Comput Med ImagingGraph. 2008;32:416–422.
68. Revel MP, Bissery A, Bienvenu M, et al. Are two-dimensionalCT measurements of small noncalcified pulmonary nodulesreliable? Radiology. 2004;231:453–458.
69. Yankelevitz DF, Reeves AP, Kostis WJ, et al. Smallpulmonary nodules: volumetrically determined growth ratesbased on CT evaluation. Radiology. 2000;217:251–256.
70. Schwartz LH, Ginsberg MS, DeCorato D, et al. Evaluation oftumor measurements in oncology: use of film-based andelectronic techniques. J Clin Oncol. 2000;18:2179–2184.
71. Yankelevitz DF, Gupta R, Zhao B, et al. Small pulmonarynodules: evaluation with repeat CT—preliminary experience.Radiology. 1999;212:561–566.
72. Marchiano A, Calabro E, Civelli E, et al., Pulmonarynodules: volume repeatability at multidetector CT lung cancerscreening. Radiology. 2009;251:919–925.
73. De Hoop B, Gietema H, van Ginneken B, et al. A comparisonof six software packages for evaluation of solid lung nodulesusing semi-automated volumetry: what is the minimumincrease in size to detect growth in repeated CT examinations.Eur Radiol. 2008;19:800–808.
74. Petkovska I, Brown MS, Goldin JG, et al. The effect of lungvolume on nodule size on CT. Acad Radiol. 2007;14:476–485.
75. Gietema HA, Schaefer-Prokop CM, Mali WP, et al.Pulmonary nodules: Interscan variability of semiautomatedvolume measurements with multisection CT—influence ofinspiration level, nodule size, and segmentation performance.Radiology. 2007;245:888–894.
76. Boll DT, Gilkeson RC, Fleiter TR, et al. Volumetricassessment of pulmonary nodules with ECG-gated MDCT.AJR Am J Roentgenol. 2004;183:1217–1223.
77. Gietema HA, Wang Y, Xu D, et al. Pulmonary nodulesdetected at lung cancer screening: interobserver variability ofsemiautomated volume measurements. Radiology. 2006;241:251–257.
78. Wang Y, de Bock GH, van Klaveren RJ, et al. Volumetricmeasurement of pulmonary nodules at low-dose chest CT:
effect of reconstruction setting on measurement variability.Eur Radiol. 2010;20:1180–1187.
79. Ko JP, Marcus R, Bomsztyk E, et al. Effect of blood vesselson measurement of nodule volume in a chest phantom.Radiology. 2006;239:79–85.
80. Rampinelli C, De Fiori E, Raimondi S, et al. In vivorepeatability of automated volume calculations of smallpulmonary nodules with CT. AJR Am J Roentgenol. 2009;192:1657–1661.
81. Hein PA, Romano VC, Rogalla P, et al. Variability ofsemiautomated lung nodule volumetry on ultralow-dose CT:comparison with nodule volumetry on standard-dose CT.J Digit Imaging. 2008;23:8–17.
82. Hein PA, Romano VC, Rogalla P, et al. Linear and volumemeasurements of pulmonary nodules at different CT doselevels-intrascan and interscan analysis. RoFo. 2009;181:24–31.
83. Rampinelli C, Raimondi S, Padrenostro M, et al. Pulmonarynodules: contrast-enhanced volumetric variation at differentCT scan delays. AJR Am J Roentgenol. 2010;195:149–154.
84. Oda S, Awai K, Murao K, et al. Computer-aided volumetryof pulmonary nodules exhibiting ground-glass opacity atMDCT. AJR Am J Roentgenol. 2010;194:398–406.
85. Iwano S, Okada T, Koike W, et al. Semi-automaticvolumetric measurement of lung cancer using multi-detectorCT effects of nodule characteristics. Acad Radiol. 2009;16:1179–1186.
86. Marchiano A, Calabro E, Civelli E, et al. Pulmonary nodules:volume repeatability at multidetector CT lung cancer screen-ing. Radiology. 2009;251:919–925.
87. Rampinelli C, De Fiori E, Raimondi S, et al. In vivorepeatability of automated volume calculations of smallpulmonary nodules with CT. Am J Roentgenol.2009;192:1657–1661.
88. Nathan MH, Collins VP, Adams RA. Differentiation ofbenign and malignant pulmonary nodules by growth rate.Radiology. 1962;79:221–232.
89. Collins VP, Loeffler RK, Tivey H. Observations on growthrates of human tumors. Am J Roentgenol. 1956;76:988–1000.
90. Steele JD, Buell P. Asymptomatic solitary pulmonarynodules. Host survival, tumor size, and growth rate. J ThoracCardiovasc Surg. 1973;65:140–151.
91. Winer-Muram HT, Jennings SG, Tarver RD, et al. Volu-metric growth rate of stage I lung cancer prior to treatment:serial CT scanning. Radiology. 2002;223:798–805.
92. Girvin F, Ko J. Pulmonary nodules: detection, assessment,and CAD. Am J Roentgenol. 2008;191:1057–1069.
93. Usuda K, Saito Y, Sagawa M, et al. Tumor doubling timeand prognostic assessment of patients with primary lungcancer. Cancer. 1994;74:2239–2244.
94. Yankelevitz D, Henschke C. Does 2-year stability imply thatpulmonary nodules are benign? Am J Roentgenol.1997;168:325–328.
95. Xu DM, van Klaveren RJ, de Bock GH, et al. Role ofbaseline nodule density and changes in density and nodulefeatures in the discrimination between benign and malignantsolid indeterminate pulmonary nodules. Eur J Radiol. 2009;70:492–498.
96. De Hoop B, Gietema H, van de Vorst S, et al. Pulmonaryground-glass nodules: increase in mass as an early indicator ofgrowth. Radiology. 2010;255:199–206.
97. Vansteenkiste JF, Stroobants SS. PET scan in lung cancer:current recommendations and innovation. J Thorac Oncol.2006;1:71–73.
98. Goudarzi B, Jacene HA, Wahl RL. Diagnosis and differ-entiation of bronchioloalveolar carcinoma from adenocarci-noma with bronchioloalveolar components with metabolicand anatomic characteristics using PET/CT. J Nucl Med.2008;49:1585–1592.
99. Erasmus JJ, et al. Evaluation of primary pulmonary carcinoidtumors using FDG PET. AJR Am J Roentgenol. 1998;170:1369–1373.
Brandman and Ko J Thorac Imaging � Volume 26, Number 2, May 2011
104 | www.thoracicimaging.com r 2011 Lippincott Williams & Wilkins
100. Swensen SJ, Viggiano RW, Midthun DE, et al. Lung noduleenhancement at CT: multicenter study. Radiology. 2000;214:73–80.
101. Swensen SJ, Brown LR, Colby TV, et al. Lung noduleenhancement at CT: prospective findings. Radiology.1996;201:447–455.
102. Yi CA, Lee KS, Kim BT, et al. Tissue characterization ofsolitary pulmonary nodule: comparative study between helicaldynamic CT and integrated PET/CT. J Nucl Med. 2006;47:443–450.
103. Christensen JA, Nathan MA, Mullan BP, et al. Characteriza-tion of the solitary pulmonary nodule: 18F-FDG PET versusnodule-enhancement CT 10.2214/AJR.05.1166. Am J Roent-genol. 2006;187:1361–1367.
104. Yi CA, Lee KS, Kim EA, et al. Solitary pulmonary nodules:dynamic enhanced multi-detector row CT study and compar-ison with vascular endothelial growth factor and microvesseldensity. Radiology. 2004;233:191–199.
105. Li Y, Yang ZG, Chen TW, et al. First-pass perfusion imagingof solitary pulmonary nodules with 64-detector row CT:comparison of perfusion parameters of malignant and benignlesions. Br J Radiol. 2010;83:785–790.
106. Petkovska I, Shah SK, McNitt-Gray MF, et al. Pulmonarynodule characterization: a comparison of conventional withquantitative and visual semi-quantitative analyses usingcontrast enhancement maps. Eur J Radiol. 2006;59:244–252.
107. Tacelli N, Remy-Jardin M, Copin MC, et al. Assessment ofnon-small cell lung cancer perfusion: pathologic-CT correla-tion in 15 patients. Radiology. 2010;257:863–871.
108. Johnson TR, Krauss B, Sedlmair M, et al. Materialdifferentiation by dual energy CT: initial experience. EurRadiol. 2007;17:1510–1517.
109. Remy-Jardin M, Faivre JB, Pontana F, et al. Thoracicapplications of dual energy. Radiol Clin N Am. 2009;48:193–205.
110. Chae EJ, Song JW, Seo JB, et al. Clinical utility of dual-energy CT in the evaluation of solitary pulmonary nodules:initial experience. Radiology. 2008;249:671–681.
111. Kang MJ, Park CM, Lee CH, et al. Dual energy CT: clinicalapplications in various pulmonary diseases. Radiographics.2010;30:685–698.
112. Swensen SJ, Silverstein MD, Edell ES, et al. Solitarypulmonary nodules: clinical prediction model versus physi-cians. Mayo Clin Proc. 1999;74:319–329.
113. Swensen SJ, Silverstein MD, Ilstrup DM, et al. Theprobability of malignancy in solitary pulmonary nodules.Application to small radiologically indeterminate nodules.Arch Intern Med. 1997;157:849–855.
114. Dewan NA, Shehan CJ, Reeb SD, et al. Likelihood ofmalignancy in a solitary pulmonary nodule: comparison ofBayesian analysis and results of FDG-PET scan. Chest.1997;112:416–422.
115. Hasegawa M, Sone S, Takashima S, et al. Growth rate ofsmall lung cancers detected on mass CT screening. Br JRadiol. 2000;73:1252–1259.
116. Gould MK, Fletcher J, Iannettoni MD, et al. Evaluation ofpatients with pulmonary nodules: when is it lung cancer?Chest. 2007;132(3 suppl):108S–130S.
117. Godoy MC, Naidich DP. Subsolid pulmonary nodules andthe spectrum of peripheral adenocarcinomas of the lung:recommended interim guidelines for assessment and manage-ment. Radiology. 2009;253:606–622.
118. Cummings SR, Lillington GA, Richard RJ. Managingsolitary pulmonary nodules. The choice of strategy is a “closecall”. Am Rev Respir Dis. 1986;134:453–460.
119. Esmaili A, Munden RF, Mohammed TL. Small pulmonarynodule management: a survey of the Members of the Societyof Thoracic Radiology with Comparison to the FleischnerSociety Guidelines. J Thorac Imaging. 2011;26:27–31.
120. Prosch H, Strasser G, Oschatz E, et al. Management ofpatients with small pulmonary nodules: a survey of radiolo-gists, pulmonologists, and thoracic surgeons. Am J Roent-genol. 2006;187:143–148.
121. Kim TJ, Lee JH, Lee CT, et al. Diagnostic accuracy of CT-guided core biopsy of ground-glass opacity pulmonarylesions. Am J Roentgenol. 2008;190:234–239.
122. Nakata M, Saeki H, Takata I, et al. Focal ground-glassopacity detected by low-dose helical CT. Chest. 2002;121:1464–1467.
123. Vazquez M, Carter D, Brambilla E, et al. Solitary andmultiple resected adenocarcinomas after CT screening forlung cancer: histopathologic features and their prognosticimplications. Lung Cancer. 2009;64:148–154.
J Thorac Imaging � Volume 26, Number 2, May 2011 SPN Detection, Characterization, and Management
r 2011 Lippincott Williams & Wilkins www.thoracicimaging.com | 105