Embed Size (px)
Citation preview
Educational Patterns in Colonial MalayaAuthor(s): Charles HirschmanSource: Comparative Education Review, Vol. 16, No. 3 (Oct., 1972), pp. 486-502Published by: The University of Chicago Press on behalf of the Comparative andInternational Education SocietyStable URL: http://www.jstor.org/stable/1186779Accessed: 03-04-2016 19:55 UTC
Your use of the JSTOR archive indicates your acceptance of the Terms & Conditions of Use, available at
http://about.jstor.org/terms
JSTOR is a not-for-profit service that helps scholars, researchers, and students discover, use, and build upon a wide range of content in a trusted
digital archive. We use information technology and tools to increase productivity and facilitate new forms of scholarship. For more information about
JSTOR, please contact [email protected].
The University of Chicago Press, Comparative and International Education Society arecollaborating with JSTOR to digitize, preserve and extend access to Comparative Education Review
This content downloaded from 128.95.104.109 on Sun, 03 Apr 2016 19:55:58 UTCAll use subject to http://about.jstor.org/terms
EDUCATIONAL PATTERNS IN COLONIAL MALAYA*
CHARLES HIRSCHMAN
BACKGROUND
MOST "THIRD WORLD" NATIONS share a common past and a similar orientation to the future. Direct rule by the colonial powers of the West has given way to in- dependence only in the last decade or two. Independence has usually been ac- companied by a new emphasis on economic and social development to enhance the welfare of the people. However, the heritage of the past often constrains the future. The influence of the colonial experience upon a nation's economic, po- litical and social institutions continues long after formal independence, often to the detriment of the nation's professed social and economic objectives. Too often, social scientists interested in the problems of development ignore the colonial experience as though this occurrence is now merely of historical interest and not directly relevant to the problems of the present and the future.
This paper will examine one aspect of the colonial experience: educational patterns in the former British colony of Malaya.' The effects of the colonial educa- tional structure will continue to permeate Malayan society for a long time. This results from the fact that the majority of the present-day adult population have been conditioned by their educational experiences during the colonial era. Our analysis will focus on the trend in the expansion and distribution of formal educa- tion using data on educational attainment from the 1957 Population Census of the Federation of Malaya. Thus, we are dependent upon the variable "years of schooling" as an indicator of educational patterns. While this approach will only give a partial view of educational patterns, it will allow for a more power- ful statistical analysis than is generally the case in descriptive research. By ex- amining trends in the growth and distribution of formal schooling during the colonial era, our analysis should provide an empirical measure on the relative availability of opportunity for different races, sexes and regions of the country as well as an indicator of the character of colonial rule, and the potential for
Note: The tables upon which Figures 1-6 are based can be received from the author upon request. "* The research reported here was accomplished while the author held a traineeship in Demog-
raphy and Human Ecology at the University of Wisconsin, Madison, supported by the National Insti- tute of General Medical Science (G. M. 01190). James A. Sweet and Hal H. Winsborough provided helpful comments.
1 In this paper, Malaya will refer to that area which is presently called West Malaysia. Prior to World War II, this area included three areas known as the Straits Settlements (excluding Singapore), the Federated Malay States, and the Unfederated Malay States-although there was a great deal of shared administration and the entire area was known as British Malaya. After World War II, the various areas of British Malaya, excluding Singapore, were combined in the Malayan Union, and in 1948 became The Federation of Malaya. This last name continued after Independence (1957) until 1963 when Malaysia was formed with the inclusion of Singapore, Sabah and Sarawak which were former British colonies. In 1965 Singapore left Malaysia, and now West Malaysia refers to the former Federa- tion of Malaya, while East Malaysia refers to Sabah and Sarawak.
486 October 1972
This content downloaded from 128.95.104.109 on Sun, 03 Apr 2016 19:55:58 UTCAll use subject to http://about.jstor.org/terms
EDUCATIONAL PATTERNS IN COLONIAL MALAYA
socioeconomic change in the country. Since 1957 was the year of the Census as well as the last year of colonial rule, our vantage point is uniquely well timed.
THE PLURAL SOCIETY
Perhaps the most important aspect of Malayan society is her multi-racial composition. Of the 6.28 million people in 1957, about 50% were indigenous Malays, about 37% were Chinese, and 11% were Indians.2 There were also smaller communities of Pakistanis, Ceylonese, Thais, Aborigines, and Eurasians. As in most multi-racial societies, integration is far from complete. In addition to strong religious and cultural barriers, each community is separated by occupational and residential patterns.3 The Chinese are predominately urban while the majority of Malays are agriculturalists and live in rural villages. About half of the Indian population live and work on large rubber plantations, although there is also a sizeable proportion in the urban sector.4
This "plural society" was created in the late 19th and early 20th centuries by migration from the poorer areas of India and China. Migration was stimulated by expansion of British economic and political control. Tin mining and natural rub- ber production were the major industries and required an abundant supply of cheap labor in order to maximize profits.5 Although most of the Chinese and Indian migrants intended to stay in Malaya only for a limited period of time and then return to their homelands, a large number of Chinese and Indians became permanently settled in Malaya. By 1957, three-fourths of the Malayan Chinese, as well as two-thirds of the Malayan Indians had been born in Malaya.6 Except for a few occasional cases, most Indian and Chinese immigrants keep their language and culture even after several generations of residence in Malaya. As in most multi-racial societies, racial harmony has more often been a goal than a reality. While racial conflict has generally been avoided, there have been some rather serious racial disturbances in a few places. The most serious occurred in Kuala Lumpur, the capital city, on May 13, 1969 following a particularly bitter national election.7 Thus it is with an awareness of the current problems of socio-economic development and race relations that we turn to an examination of educational pat- terns during the colonial era.
2 H. Fell, 1957 Population Census of the Federation of Malaya, Report No. 14 (Kuala Lumpur: Department of Statistics, 1960), p. 5.
SWhile intermarriage is not unknown, it is a rather rare occurance. Judith Djamour in Malay Kin- ship and Marriage (London: The Athlone Press, 1957) reports that very few marriages occur between Malays and other races in Singapore.
4 Fell, 1957 Population Census, pp. 11, 124-126. 5 For an overall review of migration, see Saw Swee Hock, "Trends and Differerentials in Interna-
tional Migration in Malaya," Ekonomi 4 (1963): 87-113. An historical monograph on migration prior to 1920 is R. N. Jackson, Immigrant Labour and the Development of Malaya, 1786-1920 (Kuala Lumpur: Government Printer, 1961).
6 Fell, 1957 Population Census, p. 16. 7 For the official view, see the National Operations Council, The May 13 Tragedy: A Report (Kuala
Lumpur: Jabatan Chetak Kerajaan, 1969).
Comparative Education Review 487
This content downloaded from 128.95.104.109 on Sun, 03 Apr 2016 19:55:58 UTCAll use subject to http://about.jstor.org/terms
CHARLES HIRSCHMAN
THE EDUCATIONAL STRUCTURE
The educational system during colonial times was similar to the British school system but adapted considerably to local conditions. The basic educational structure consisted of six years of primary schooling, three years of lower secondary, and two years of upper secondary.8 However, this structure did vary, especially in the rural areas where primary schooling sometimes was only four years. The education system included schools teaching in four different lan- guages: Malay, Chinese, English and Tamil (language of most Indian immi- grants). There was a complex system of government schools, government-assisted schools, and private schools.9 They were not brought under one common system until independence.
Malay, Chinese, and Indian vernacular schools were usually only attended by students whose mother tongue was the same as the language of instruction. English-medium schools were mostly in the urban areas and generally had a racially mixed student population. There are few records of the racial composi- tion of English-medium schools during colonial times, but a recent survey contains data on language medium of schooling for the "past enrolled popula- tion" (those who have attended and completed their formal schooling).'0 The figures for the percent of each race ("past enrolled") who attended English- medium schools were as follows: Malay, 9%; Chinese, 14%; and Indian, 28%." The fact that most English medium schools were in the towns and cities probably facilitated Chinese and Indian attendance at such schools. Since these data were
gathered in 1967-68, we cannot be sure that this pattern of attendance was the same during the colonial era which ended in 1957.
Secondary education was only available in English and Chinese-medium schools prior to Independence with most of the enrollment in English language schools.12 There was only a small flow of students from primary vernacular schools to English secondary schools. Tertiary education was extremely limited, with most students who pursued higher studies going abroad, generally to England. However, there were several teacher training colleges which prepared teachers for primary schools.13
Information regarding the nature and purposes of the colonial educational structure is only really available from the repIorts of colonial officials during the
8 For a description of the present educational structure, see The Educational Planning and Re- search Division, Ministry of Education, Education in Malaysia (Kuala Lumpur: Dewan Bahasa dan Pustaka, 1970).
9 Ibid., pp. 6-9. 10 N. S. Choudhry, Socio-Economic Sample Survey of Households Malaysia 1967/68, Employment
and Unemployment (Kuala Lumpur: Department of Statistics, 1970). "1 Ibid., list of tables, pp. 17-18. 12 The Educational Planning and Research Division, Ministry of Education, Educational Statistics of
Malaysia, 1938 to 1967 (Kuala Lumpur: Dewan Bahasa dan Pustaka, 1968), pp. 45-46. 13 For an excellent account of the most famous of the teacher training colleges as well as other
aspects of Malay history, see William R. Roff, The Origins of Malay Nationalism (New Haven: Yale University Press, 1967).
488 October 1972
This content downloaded from 128.95.104.109 on Sun, 03 Apr 2016 19:55:58 UTCAll use subject to http://about.jstor.org/terms
EDUCATIONAL PATTERNS IN COLONIAL MALAYA
period. It was stated that the goal of village Malay schooling was to make the son of the fisherman or peasant a more intelligent fisherman or peasant than his father had been.'4 The colonial education system (as with other aspects of the colonial regime) appears to have been inherently conservative. The objective was not to change the social structure for the sake of progress, but rather to make the existing social structure a bit more efficient. A western social scientist look- ing at the situation quite recently said that the goal of the urban English-me- dium schools during the colonial era was to provide clerks for the bureaucracy.'5 The view that the educational system could effectively contribute to social change was only a perspective envisaged since Independence.
DATA
The data upon which this study is based come from the tabulations of the 1957 Census of Population. Information was gathered on the number of "years of schooling" each person had attended. Our analysis is limited to those over twenty years of age, most of whom should have completed all their formal education. One methodological problem of this analysis is that not all of these data refer to education received in Malayan schools. Some of the Chinese, Indians, and Malays (from Indonesia) in Malaya in 1957 had migrated there as adults and received their formal education in their original homelands. This is particularly true of the older age groups which contain a high percentage of Chinese and Indians who were foreign born. If we can assume that their education from China or India is probably not too different than education received in Indian or Chinese- medium schools in Malaya, this problem should not bias our analysis too much.
ANALYSIS OF TREND IN EDUCATIONAL ATTAINMENT
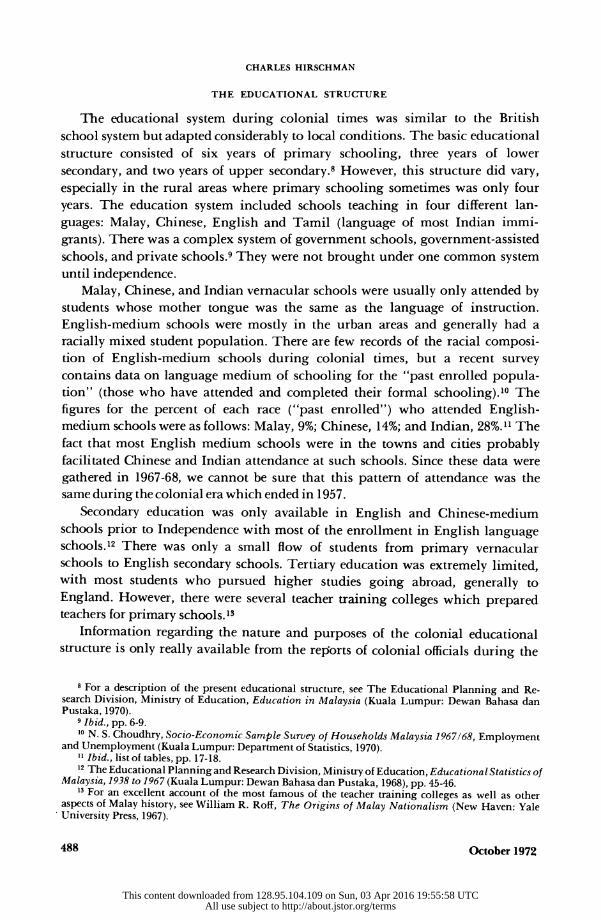
Let us now turn to an examination of trends in the growth and distribution of education during the colonial era. Figure 1 shows the mean educational attain- ment for each race by sex for nine age groups as of 1957. (See Appendix for method of calculation.)
It can be assumed that the changes in successive age groups represent trends over time. Thus, the youngest age group, 20-24, represents the educational pat- terns in the years shortly before Independence, while the older age groups repre- sent educational patterns thirty to forty years earlier.'6 For all groups, the trend toward higher educational attainment can be observed. It seems that the educa- tional attainment of younger Indian cohorts is approximately equal to that of the Chinese, while the gap between the Malay population and the other groups seems
"14 H. R. Cheesmen, "Education in Malaya 1900-1941," as cited in J. M. Gullick, Malaysia (Lon- don: Ernest Benn Limited, 1969), p. 261.
15 Gayl D. Ness, "Economic Development and the Goals of the Government in Malaya," in Wang Gungwu, ed., Malaysia, A Survey (New York: Frederick A. Praeger, 1964) p. 313.
16 This assumption is not entirely correct. Because of differential mortality, not all groups from the past are equally represented by those alive in 1957. However, this bias is probably not so great as to in- validate an interpretation of successive age cohorts as a temporal trend.
Comparative Education Review 489
This content downloaded from 128.95.104.109 on Sun, 03 Apr 2016 19:55:58 UTCAll use subject to http://about.jstor.org/terms
CHARLES HIRSCHMAN
FIGURE 1. MEAN EDUCATIONAL ATTAINMENT BY RACE, SEX, AND AGE GROUP, MALAYA, 1957
Years of
School MALES
6
5
4
3
2
1
O
20- 24 25- 29 30- 34 35- 39 40- 44 45- 49 50- 54 55- 59 60- 64
AGE
Chinese
Indians
Malays
Years of
School FEMALES
3
2
1
0
20- 24 25- 29 30- 34 35- 39 40- 44 45- 49 50- 54 55- 59 60- 64
AGE
Chinese
Indians
Malays
to have narrowed only slightly in the youngest groups. This modest trend seems to have been more the product of Chinese and Indian slippage rather than any sudden surge in the Malay trend. Perhaps the decrease in the Chinese 25 to 29 age group can be explained by the Japanese occupation during World War II which
490 October 1972
This content downloaded from 128.95.104.109 on Sun, 03 Apr 2016 19:55:58 UTCAll use subject to http://about.jstor.org/terms
EDUCATIONAL PATTERNS IN COLONIAL MALAYA
probably disrupted the educational process most in the urban areas where the majority Chinese live. The recent decrease in the educational attainment of the youngest Indian age group may be due to the "Malayan Emergency" in the late 1940's and early 1950's. Perhaps the most striking contrast is the lower educa- tional attainment for females of all races.
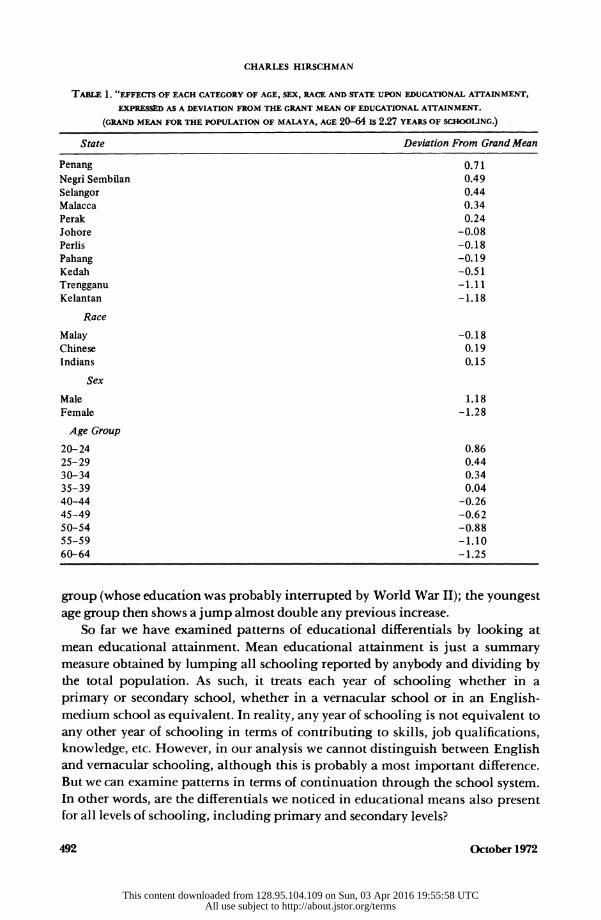
The grand mean of educational attainment for all races, all states of Malaya, all age groups, and both sexes is 2.27 years of schooling. By using "dummy variable" regression analysis (see Appendix for more details) it is possible to measure the "average deviation" from this grand mean for each state, sex, race and age group separately. Each of the deviations reflects only the "effect" of that particular category, and all other variables are held constant in this analysis. Table 1 shows the results of this regression analysis.
A number of interesting patterns emerge in Table 1. The analysis of state "effects" seems to divide the states into two groupings that are remarkably similar to the colonial administrative areas before World War II. The states of Penang and Malacca, which were part of the "Straits Settlements," were most closely tied with the colonial power and ruled directly by British governors. Another group in which the British were almost as fully in control was the "Federated Malay States" of Negri Sembilan, Selangor, Perak and Pahang. The "Unfederated Malay States," in which British control and economic investment were not as great, in- cluded Kedah, Johore, Perlis, Kelantan and Trengganu. Only Pahang among the Federated Malay States fell below the grand mean.
While the racial differences are not as large as some of the other variables, a differential of .31 to .36 of a year of schooling is not inconsequential when the entire population averages only about 2.27 years of education. The largest difference is the male-female one. On the average, males average three years of education more than females.
An official Ministry of Education publication describes the general attitude toward education for girls in the early days of education in Malaya in the following paragraph:
"There was opposition to education for girls. Parents thought that education was unnecessary for their daughters whose rightful place was in the home. While the Malay parents feared that a knowledge of reading and writing might lead their daughters to indulge in writing love letters and intrigue, their Chinese counterparts considered it a waste of money to educate a daughter who would eventually get married and belong to another family. But above all it was an age of modesty and people were ruled by the tyranny of custom. Girls were not al- lowed to be seen in public or walk along the streets. Because of this opposition there were very few girls in schools in those days.""7
The age pattern seems to reflect the earlier analysis. There seems to be an in-
crease of about 0.2 of a year of schooling every five years until the 25 to 29 age
17 The Educational Planning and Research Division, Educational Statistics, p. 25.
Comparative Education Review 491
This content downloaded from 128.95.104.109 on Sun, 03 Apr 2016 19:55:58 UTCAll use subject to http://about.jstor.org/terms
CHARLES HIRSCHMAN
TABLE 1. "EFFECTS OF EACH CATEGORY OF AGE, SEX, RACE AND STATE UPON EDUCATIONAL ATTAINMENT, EXPRESSED AS A DEVIATION FROM THE GRANT MEAN OF EDUCATIONAL ATTAINMENT.
(GRAND MEAN FOR THE POPULATION OF MALAYA, AGE 20-64 IS 2.27 YEARS OF SCHOOLING.)
State Deviation From Grand Mean
Penang Negri Sembilan Selangor Malacca
Perak
Johore
Perlis
Pahang Kedah
Trengganu Kelantan
Race
Malay Chinese
Indians
Sex
Male
Female
Age Group
20-24
25-29
30-34
35-39
40-44
45-49
50-54
55-59
60-64
0.71
0.49
0.44
0.34
0.24
-0.08
-0.18
-0.19
-0.51
-1.11
-1.18
-0.18
0.19
0.15
1.18
-1.28
0.86
0.44
0.34
0.04 -0.26
-0.62
-0.88
-1.10
-1.25
group (whose education was probably interrupted by World War II); the youngest age group then shows a jump almost double any previous increase.
So far we have examined patterns of educational differentials by looking at mean educational attainment. Mean educational attainment is just a summary measure obtained by lumping all schooling reported by anybody and dividing by the total population. As such, it treats each year of schooling whether in a primary or secondary school, whether in a vernacular school or in an English- medium school as equivalent. In reality, any year of schooling is not equivalent to any other year of schooling in terms of contributing to skills, job qualifications, knowledge, etc. However, in our analysis we cannot distinguish between English and vernacular schooling, although this is probably a most important difference. But we can examine patterns in terms of continuation through the school system. In other words, are the differentials we noticed in educational means also present for all levels of schooling, including primary and secondary levels?
492 October 1972
This content downloaded from 128.95.104.109 on Sun, 03 Apr 2016 19:55:58 UTCAll use subject to http://about.jstor.org/terms
EDUCATIONAL PATTERNS IN COLONIAL MALAYA
FIGURE 2. EDUCATIONAL CONTINUATION RATIOS, MALAYA, 1957
Proportion entering lower primary (0 to 1-3 years of schooling).
1.0
0.9
0.8
0.7
0.6
0.5
0.4
0.3
0.2
0.1
0.0 20-24 25-29 30-34 35-39 40-44 45-49 50-54 55-59 60-64
AGE
Chinese
Indians
Malays
Proportion continuing from lower to upper primary (1-3 to 4-6 years of schooling).
1.0
0.9
0.8
0.7
0.6
0.5
0.4
0.3
0.2
0.1
0.0 20-24 25-29 30-34 35-39 40-44 45-49 50-54 55-59 60-64
AGE
Chinese
Indians
Malays
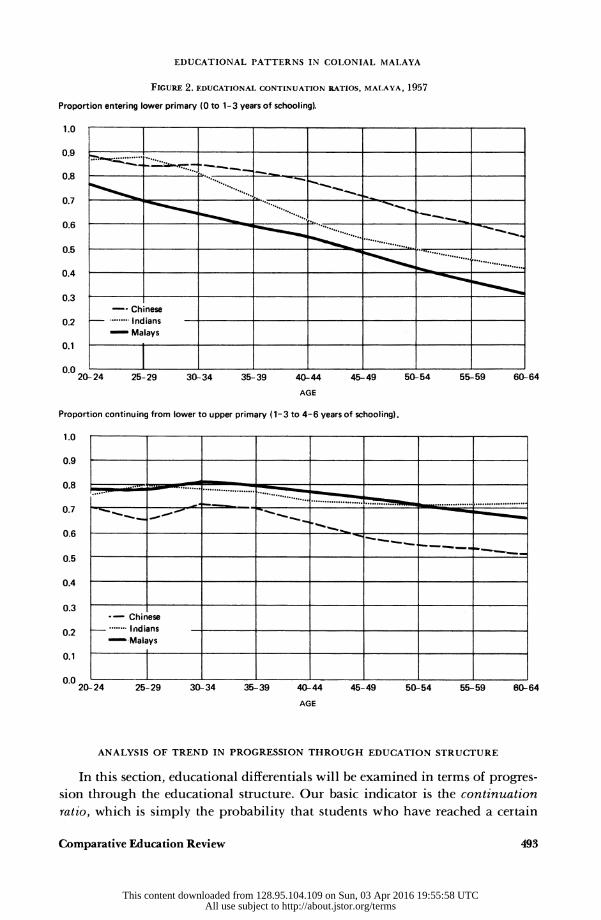
ANALYSIS OF TREND IN PROGRESSION THROUGH EDUCATION STRUCTURE
In this section, educational differentials will be examined in terms of progres- sion through the educational structure. Our basic indicator is the continuation ratio, which is simply the probability that students who have reached a certain
Comparative Education Review 493
This content downloaded from 128.95.104.109 on Sun, 03 Apr 2016 19:55:58 UTCAll use subject to http://about.jstor.org/terms
CHARLES HIRSCHMAN
FIGURE 3. EDUCATIONAL CONTINUATION RATIOS, MALAYA, 1957
Proportion continuing from upper primary to lower secondary (4-6 to 7-9 years of schooling).
1.0
0.9
0.8
0.7
0.6
0.5
0.4
0.3
0.2
0.1
0.0 20-24 25-29 30-34 35-39 40-44 45-49 50-54 55-59 60-64
AGE
Chinese
Indians
Malays
Proportion continuing from lower to upper secondary (7-9 to 10-11 years of schooling).
1.0
0.9
0.8
0.7
0.6
0.5
0.4
0.3
0.2
0.1
0.0 20-24 25-29 30-34 35-39 40-44 45-49 50-54 55-59 60-64
AGE
Chinese
Indians
Malays
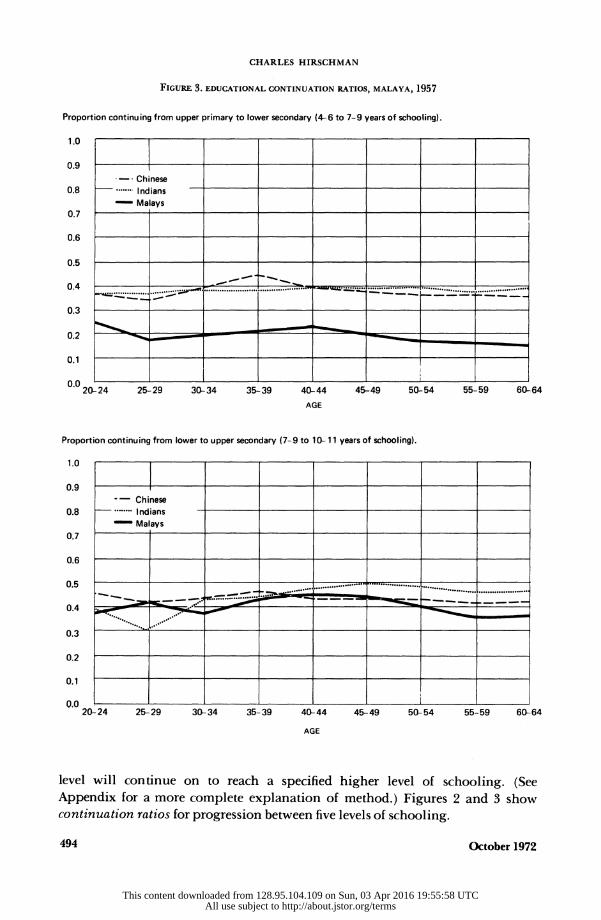
level will continue on to reach a specified higher level of schooling. (See Appendix for a more complete explanation of method.) Figures 2 and 3 show continuation ratios for progression between five levels of schooling.
494 October 1972
This content downloaded from 128.95.104.109 on Sun, 03 Apr 2016 19:55:58 UTCAll use subject to http://about.jstor.org/terms
EDUCATIONAL PATTERNS IN COLONIAL MALAYA
The levels of schooling are the following: none, lower primary (represented by 1-3 years of schooling), upper primary (represented by 4-6 years of schooling), lower secondary (represented by 7-9 years of schooling), and upper secondary (represented by 10-11 years of schooling).
The graphs in Figures 2 and 3 show continuation ratios for males only. Along the horizontal axis are the different age groups which can be interpreted as the trend over time. Along the vertical axis are the continuation ratios. The upper panel in Figure 2 shows the proportion of males for each race who achieve any schooling, (those who progress from "no education" to "1 to 3 or more years" of schooling). This trend shows the increasing opportunity for access into primary schooling for all races. The youngest age group shows that almost 80% of all stu- dents at least enter primary school. Perhaps the lower rate for Malays reflects the fact that fewer schools were in rural areas.
The lower panel of Figure 2 shows the rate of progress from lower to upper pri- mary (grades "1 to 3" to grades "4 to 6"). Basically, this represents the rate of reten-
tion in primary school. Here, the racial patterns are quite different. The Malay students do as well or better than the Chinese and Indian students in advancing through primary schooling. The upper panel in Figure 3 shows the transition from upper primary to lower secondary (from "4 to 6 years" of schooling to "7 to 9 years" of schooling). In recent years, about 37% of the Chinese and Indian stu- dents made this transfer, while only about 24% of Malay students who completed primary schooling entered secondary schooling. In addition to the lack of secondary schools in the rural areas, this may also indicate that proportionally fewer Malay boys attended English medium schools which provided the necessary language skill for secondary education. The lower panel in Figure 3 shows the rate of retention in secondary schooling (continuation from "7 to 9 years" to "10 to 11 years" of schooling). The pattern here is similar to that for continuation within primary schooling with Malays advancing within the educational struc- ture at the same rate as that of Chinese and Indians.
It seems clear that Malay students are at a disadvantage in getting into primary schools and in transferring from primary to secondary schooling, but do as well as Chinese and Indian students in completing their primary or secondary schooling once they have entered them. Thus, the logical explanation for the lower mean educational attainment among Malays seems related to problems of access to primary and secondary schools and probably to fewer numbers attending English primary schools which was almost a prerequisite to secondary education during the colonial times.
ANALYSIS OF EDUCATIONAL ATTAINMENT BY REGION
Let us now turn to an examination of the regional variation within Malaya. In the earlier regression analysis, state of residence seemed to be a rather important factor in explaining educational patterns. The eleven states were divided into two groups on the basis of whether they were above or below the grand mean of educa-
Comparative Education Review 495
This content downloaded from 128.95.104.109 on Sun, 03 Apr 2016 19:55:58 UTCAll use subject to http://about.jstor.org/terms
CHARLES HIRSCHMAN
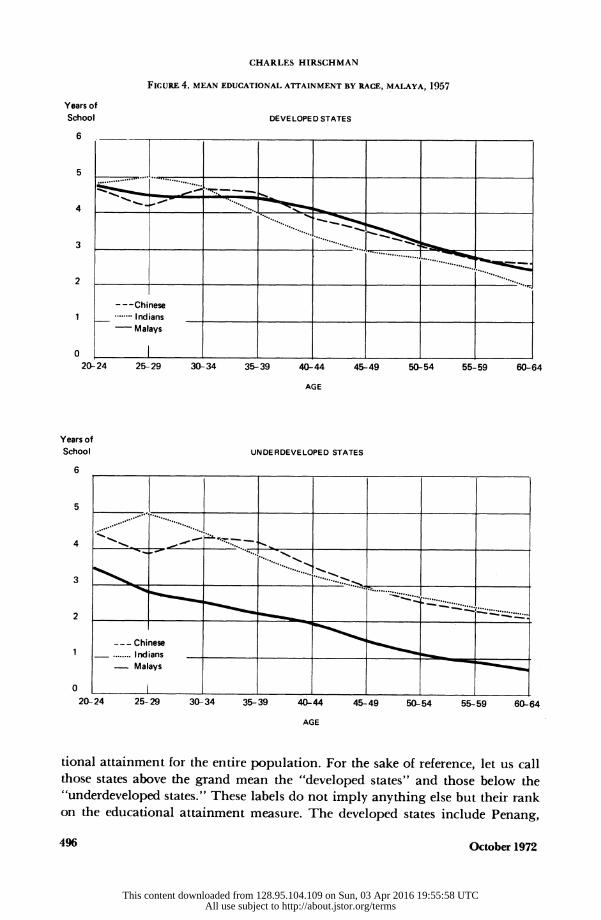
FIGURE 4. MEAN EDUCATIONAL ATTAINMENT BY RACE, MALAYA, 1957
Years of
School DEVE LOPED STATES
6
5
4
3
2
1
O
20-24 25-29 30-34 35-39 40-44 45-49 50-54 55-59 60-64
AGE
-Chinese
SIndians Malays
Years of
School UNDERDEVELOPED STATES
6
5
4
3
2
1
O
20-24 25-29 30- 34 35-39 40-44 45-49 50-54 55-59 60-64
AGE
- Chinese * Indians
Malays
tional attainment for the entire population. For the sake of reference, let us call those states above the grand mean the "developed states" and those below the "underdeveloped states." These labels do not imply anything else but their rank on the educational attainment measure. The developed states include Penang,
496 October 1972
This content downloaded from 128.95.104.109 on Sun, 03 Apr 2016 19:55:58 UTCAll use subject to http://about.jstor.org/terms
EDUCATIONAL PATTERNS IN COLONIAL MALAYA
Negri Sembilan, Selangor, Malacca, and Perak. The underdeveloped states include Johore, Perlis, Pahang, Kedah, Trengganu and Kelantan.
An analysis of mean educational attainment for each race and age group for both the developed and underdeveloped states appears in Figure 4.
There are some rather unexpected findings in these data. In the developed states, the mean educational attainment for the Malays is approximately the same as for the Chinese and the Indians. Only in the underdeveloped states are the averages for the Malays significantly lower. In fact, the educational patterns for the Chinese and Indians is virtually the same in the developed and underde- veloped states. There are two possible explanations for the disparity between the two regions. One explanation assumes that present education patterns in the dif- ferent states reflect the distribution of schools throughout the country. Thus it would seem that educational opportunity is about the same for Indians or Chi- nese throughout the country, while for Malays, educational opportunities are much more available in the developed states. The other possible explanation sug- gests that migration patterns have led better educated Malays to settle in the de- veloped region where opportunities are greater, while migration for the Chinese and Indians has not sorted people by educational background.
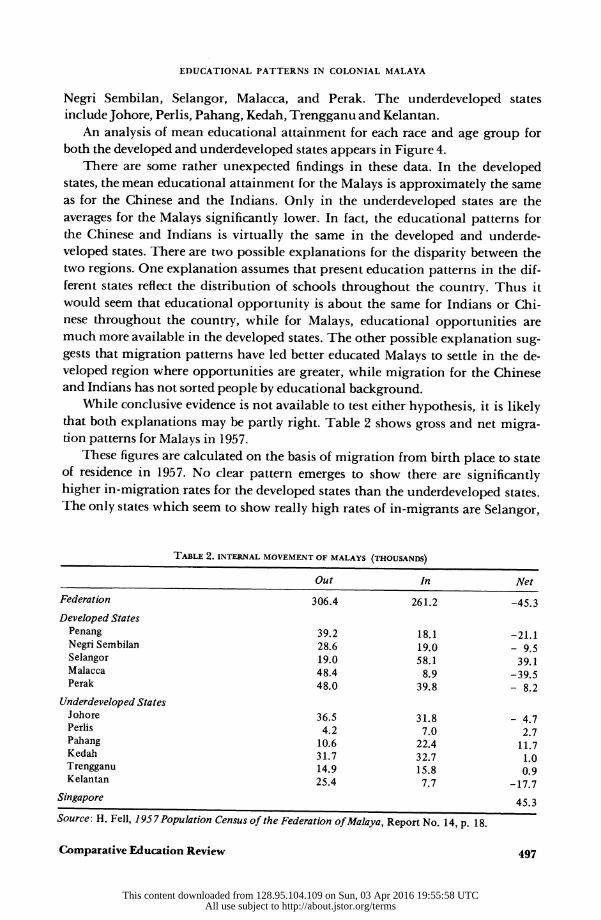
While conclusive evidence is not available to test either hypothesis, it is likely that both explanations may be partly right. Table 2 shows gross and net migra- tion patterns for Malays in 1957.
These figures are calculated on the basis of migration from birth place to state of residence in 1957. No clear pattern emerges to show there are significantly higher in-migration rates for the developed states than the underdeveloped states. The only states which seem to show really high rates of in-migrants are Selangor,
TABLE 2. INTERNAL MOVEMENT OF MALAYS (THOUSANDS)
Out In Net
Federation
Developed States Penang Negri Sembilan Selangor Malacca
Perak
Underdeveloped States Johore
Perlis
Pahang Kedah
Trengganu Kelantan
Singapore
306.4
39.2
28.6
19.0
48.4
48.0
36.5 4.2
10.6 31.7
14.9
25.4
261.2
18.1
19.0 58.1
8.9
39.8
31.8
7.0 22.4
32.7 15.8
7.7
-45.3
-21.1
- 9.5 39.1
-39.5
- 8.2
- 4.7
2.7
11.7 1.0 0.9
-17.7
45.3
Source: H. Fell, 195 7 Population Census of the Federation of Malaya, Report No. 14, p. 18.
Comparative Education Review 497
This content downloaded from 128.95.104.109 on Sun, 03 Apr 2016 19:55:58 UTCAll use subject to http://about.jstor.org/terms
CHARLES HIRSCHMAN
which contains the capital city of Kuala Lumpur, and Singapore which is outside the Federation of Malaya. These census data do not permit us to examine separately the educational characteristics of the migrants.
ANALYSIS OF EDUCATIONAL PROGRESSION BY REGION
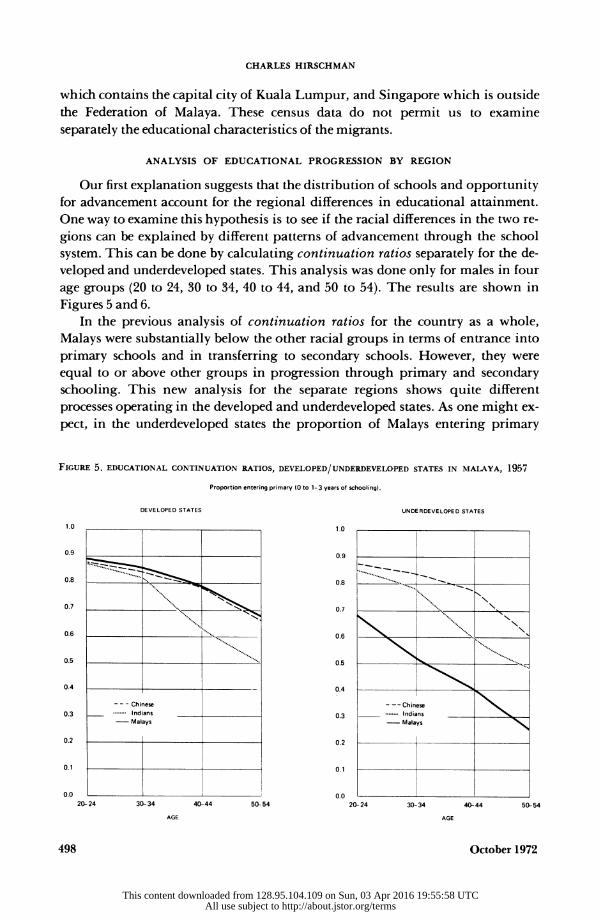
Our first explanation suggests that the distribution of schools and opportunity for advancement account for the regional differences in educational attainment. One way to examine this hypothesis is to see if the racial differences in the two re- gions can be explained by different patterns of advancement through the school system. This can be done by calculating continuation ratios separately for the de- veloped and underdeveloped states. This analysis was done only for males in four age groups (20 to 24, 30 to 34, 40 to 44, and 50 to 54). The results are shown in Figures 5 and 6.
In the previous analysis of continuation ratios for the country as a whole, Malays were substantially below the other racial groups in terms of entrance into primary schools and in transferring to secondary schools. However, they were equal to or above other groups in progression through primary and secondary schooling. This new analysis for the separate regions shows quite different processes operating in the developed and underdeveloped states. As one might ex- pect, in the underdeveloped states the proportion of Malays entering primary
FIGURE 5. EDUCATIONAL CONTINUATION RATIOS, DEVELOPED/UNDERDEVELOPED STATES IN MALAYA, 1957
Proportion entering primary (0 to 1-3 years of schooling).
DEVELOPED STATES UNDERDEVELOPED STATES
1.0
0.9
0.8
0.7
0.6
0.5
0.4
0.3
0.2
0.1
0.0
20- 24 30- 34 40-44 50- 54
AGE
"Chinese
Indians
Malays
1.0
0.9
0.8
0.7
0.6
0.5
0.4
0.3
0.2
0.1
0.0
20- 24 30-34 40- 44 50- 54
AGE
Chinese
Indians
Malays
498 October 1972
This content downloaded from 128.95.104.109 on Sun, 03 Apr 2016 19:55:58 UTCAll use subject to http://about.jstor.org/terms
EDUCATIONAL PATTERNS IN COLONIAL MALAYA
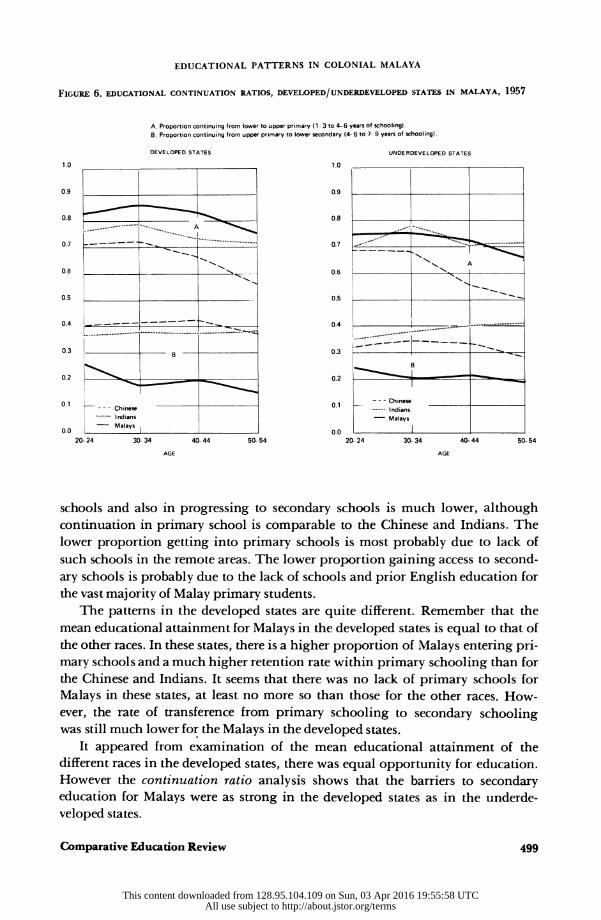
FIGURE 6. EDUCATIONAL CONTINUATION RATIOS, DEVELOPED/UNDERDEVELOPED STATES IN MALAYA, 1957
A. Proportion continuing from lower to upper primary (1 3 to 4-6 years of schooling). B. Proportion continuing from upper primary to lower secondary (4-6 to 7- 9 years of schooling).
DEVELOPED STATES UNDERDEVELOPED STATES
1.0
0.9
0.8
0.7
0.6
0.5
0.4
0.3
0.2
0.1
0.0
20- 24 30- 34 40- 44 50- 54
AGE
A
B
Chinese
Indians
Malays
1.0
0.9
0.8
0.7
0.6
0.5
0.4
0.3
0.2
0.1
0.0
20- 24 30- 34 40-44 50- 54
AGE
A
B
-Chinese
Indians
Malays
schools and also in progressing to secondary schools is much lower, although continuation in primary school is comparable to the Chinese and Indians. The lower proportion getting into primary schools is most probably due to lack of such schools in the remote areas. The lower proportion gaining access to second- ary schools is probably due to the lack of schools and prior English education for the vast majority of Malay primary students.
The patterns in the developed states are quite different. Remember that the mean educational attainment for Malays in the developed states is equal to that of the other races. In these states, there is a higher proportion of Malays entering pri- mary schools and a much higher retention rate within primary schooling than for the Chinese and Indians. It seems that there was no lack of primary schools for Malays in these states, at least no more so than those for the other races. How-
ever, the rate of transference from primary schooling to secondary schooling was still much lower for the Malays in the developed states.
It appeared from examination of the mean educational attainment of the different races in the developed states, there was equal opportunity for education. However the continuation ratio analysis shows that the barriers to secondary education for Malays were as strong in the developed states as in the underde- veloped states.
Comparative Education Review 499
This content downloaded from 128.95.104.109 on Sun, 03 Apr 2016 19:55:58 UTCAll use subject to http://about.jstor.org/terms
CHARLES HIRSCHMAN
CONCLUSIONS
There are a number of conclusions, some fully documented, some speculative that can be drawn from this study. First, there was a steady trend of increasing educational achievement for all groups during the last half century of colonial rule in Malaya. Whether the colonial rule stimulated this rise or merely responded to an increasing demand for education from the people is debatable. It seems that the colonial rulers did not see education as an investment in future development, but rather a benevolent welfare policy on their part.'s The educational differential between the Malays and the other races did not disappear over time. This differential seems to result from a lack of primary schools in the region which we have called the underdeveloped states, and to a lack of mobility from primary to secondary education everywhere in the country.
It seems clear that the lower educational averages for Malays were due to prob- lems of access. The higher rates of Malay retention in both primary and secondary schooling show that lack of motivation or desire for education to be a doubtful explanation. Yet a long time scholar of Southeast Asia comments: "Most Malays were peasants and fishermen. Their environment was not conducive to education and their culture did not induce them to want it."'"
This is a rather surprising statement when the data show that almost 90% of the Malays in the "developed states" enter primary schooling, and of those who enter, over 80% complete their primary schooling. Both of these figures are above the comparable rates for the Chinese and Indians. Yet the above quotation is not an isolated statement. It was a common belief among the British colonialists and even among locally born persons, that the Malays were of lesser ability and motivation than the other Asian communities.
However, myths do not become true because many people believe them or even if knowledgeable scholars repeat them. But myths can appear to be true if institu- tionalized policies are formed in accordance with such myths. Thus, the colonial education structure which offered secondary education only in urban English schools resulted in a situation where geographic and language barriers kept most Malay students from higher educational achievement.
APPENDIX
1. Calculation of Educational Attainment Means For Each Age Group by Race and Sex.
The date on education from the 1957 Census were contained in separate re- ports for each of the eleven states of Malaya as well as a summary report for the en-
tire nation. In each state report, "years of schooling" was reported for racial, sex,
18 See discussion by Ness, "Economic Development," pp. 307-320. 19 T. H. Silcock, "Communal and Party Structure," T. H. Silcock and E. K. Fisk, eds., The
Political Economy of Independent Malaya (Berkeley: University of California Press, 1963) p. 26.
500 October 1972
This content downloaded from 128.95.104.109 on Sun, 03 Apr 2016 19:55:58 UTCAll use subject to http://about.jstor.org/terms
EDUCATIONAL PATTERNS IN COLONIAL MALAYA
and age groupings. The racial groupings were Malaysian (we have used the term Malays in this study to avoid confusion), Chinese, Indians, and others. Data on "others," a residual category, will not be analyzed in this study because of their small number and diverse composition. The age groupings were by five year in- tervals from 0-4, 5-9, 10-14,.... 60-64, and 65 or more. The four age groups under age twenty were omitted because many of them had not completed their educa- tion. The age group "65 or more" was also omitted because it was not comparable in time span to the other groups.
The data for the number of years of school were collected in single years by requesting information on "years at school" for each person enumerated. How- ever in the published tabulations, number of years at school was grouped into the following classifications: 0, 1-3 years, 4-6 years, 7-9 years, 10-11 years, and 12 or more years. Thus, the raw data consisted of an education distribution (number of respondents in each educational category) that was cross-classified by three races, two sexes, nine age groups, and eleven states. This was a total of 594 separated educational distributions, one for each unique race-sex-age group-state grouping. In order to summarize this vast amount of data, a mean educational attainment
was calculated for each of the 594 race-sex-age-state groupings. This was done by multiplying the number of people in each educational classification times the mid-point of that classification and dividing by the total number of people in that group. For the classification "12 or more years of education," an arbitrary mid- point of 13 years was selected.
2. "Dummy Variable" Regression Analaysis
This technique is simply multiple regression analysis which uses qualitative as opposed to quantitative independent variables. This form of analysis as- sumes a linear additive model. Instead of the normal regression coefficient, our analysis gives the "effect" of each category of the independent variables (state, race, sex, age) upon the dependent variable (educational attainment) expressed as a deviation from the grand mean of the dependent variable. For an introductory explanation of regression analysis and "dummy variables," see H. M. Blalock, Jr. Social Statistics (New York: McGraw Hill, 1960), pp. 274-301, and D. B. Suits, "Use of Dummy Variables in Regression Equations" Journal of American Statistical Association 52 (December 1957): 548-551.
3. Calculation of Continuation Ratios
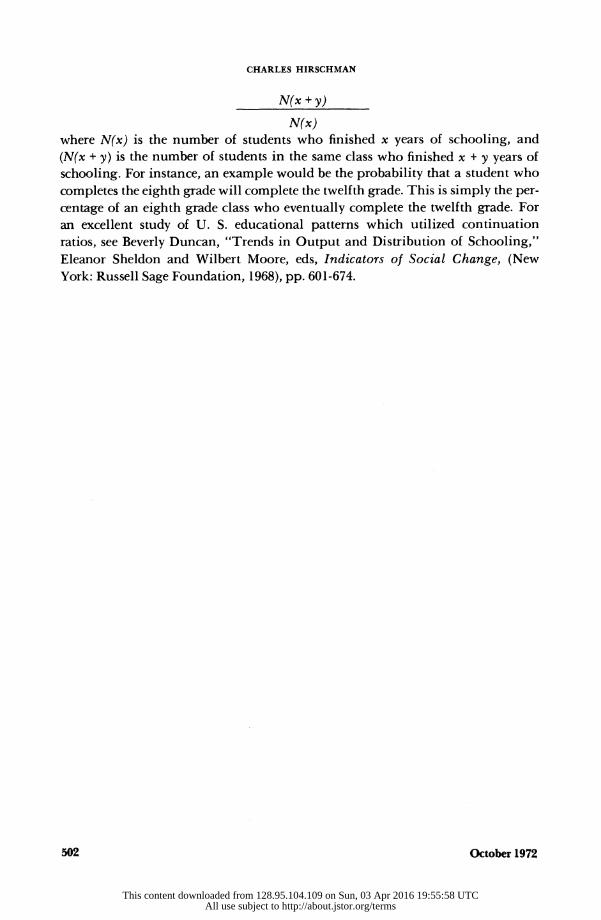
A continuation ratio is simply the probability that something will progress from one state to the next in an ordered sequence. Thus, in fertility research, the probability that a woman who has had two children will have a third is an example of continuation ratio. When applied to education, it represents the likeli- hood that a student who completes so many years of schooling will progress to a specific higher level. This can be calculated by the formula:
Comparative Education Review 501
This content downloaded from 128.95.104.109 on Sun, 03 Apr 2016 19:55:58 UTCAll use subject to http://about.jstor.org/terms
CHARLES HIRSCHMAN
N(x + y)
N(x) where N(x) is the number of students who finished x years of schooling, and (N(x + y) is the number of students in the same class who finished x + y years of schooling. For instance, an example would be the probability that a student who completes the eighth grade will complete the twelfth grade. This is simply the per- centage of an eighth grade class who eventually complete the twelfth grade. For an excellent study of U. S. educational patterns which utilized continuation ratios, see Beverly Duncan, "Trends in Output and Distribution of Schooling," Eleanor Sheldon and Wilbert Moore, eds, Indicators of Social Change, (New York: Russell Sage Foundation, 1968), pp. 601-674.
502 October 1972
This content downloaded from 128.95.104.109 on Sun, 03 Apr 2016 19:55:58 UTCAll use subject to http://about.jstor.org/terms