Embed Size (px)
Citation preview
Provincial Government Western Cape Provincial Treasury
ANNUAL REPORT 2004/2005
PR: 77/2005
ISBN: 0-621-35924-6
To obtain additional copies of this document, please contact:
Western Cape Provincial Treasury
Office of the Chief Financial Officer
Private Bag X9165
4 Dorp Street
CAPE TOWN
8000
Telephone (+27 21) 483-5365 or 483-4623
Fax: (+27 21) 483-4558
E-mail: [email protected]
This publication is also available online at http://www.capegateway.gov.za/eng/pubs/annual reports/
Printed in the Republic of South Africa
for the Government Printers Cape
by Formeset Printers Cape
Provincial Treasury
ANNUAL REPORT
Ms L Brown Minister of Finance, Economic Development and Tourism
REPORT OF THE ACCOUNTING OFFICER OF THE PROVINCIAL TREASURY FOR THE PERIOD 1 APRIL 2004 TO 31 MARCH 2005
In accordance with section 40(1)(d) of the Public Finance Management Act, 1999, the Public
Service Act, 1994 and Treasury Regulation 18, I hereby submit the Annual Report of the
Provincial Treasury, Western Cape on financial statements, performance indicators and
departmental activities for the period 1 April 2004 to 31 March 2005.
Dr JC Stegmann
ACCOUNTING OFFICER
DATE: 18 AUGUST 2005

ContentsPart 1: General Information 1
Introduction by the Accounting Officer 1
The Ministry 3
Vision and Mission Statement 4
Legislative and other mandates 5
Part 2: Programme Performance 9
1. Programme performance in summary 9
1.1 Voted funds 9
1.2 Aim of the vote 9
1.3 Summary of programmes 10
1.4 Key strategic objectives and achievements 10
1.5 Overview of the service delivery environment for 2004/05 15
1.6 Overview of the organisational environment for 2004/05 15
1.7 Strategic overview and key policy developments for the 2004/05 financial
year
16
1.8 Departmental own receipts 17
1.9 Departmental payments 18
1.10 Transfer payments 20
1.11 Conditional grants and earmarked funds 20
1.12 Capital investment, maintenance and asset management plans 20
2. Programme performance in detail 21
2.1 Programme 1: Administration 21
2.2 Programme 2: Financial Governance 29
2.3 Programme 3: Resource Management 35
2.4 Programme 4: Public Finance and Accounting 41
2.5 Programme 5: Asset Management 49
2.6 Programme 6: Contingency Provision 56
ii
Part 3: Report of the Audit Committee 57
Report of the Audit Committee 57
Part 4: Annual Financial Statements 61
Report of the Accounting Officer 65
Report of the Auditor-General 71
Accounting Policies 73
Appropriation Statement 78
Notes to the Appropriation Statement 86
Statement of Financial Performance 88
Statement of Financial Position 89
Cash Flow Statement 90
Notes to the Annual Financial Statements 91
Disclosures Notes to the Annual Financial Statements 98
Annexures to the Annual Financial Statements 100
Part 5: Human Resource Management 105
Oversight Report 105
iii
Abbreviations
Abet: Adult Basic Education and Training
AC: Audit Committee
AG: Auditor-General
AO: Accounting Officer
ASB: Accounting Standards Board
BAS: Basic Accounting System
BBBEE: Broad Based Black Economic Empowerment
BER: Bureau for Economic Research
BPO: Business Process Outsourcing
CASIDRA: Cape Agency for Sustainable Development in Rural Areas
CFO: Chief Financial Officer
CG: Conditional grant
CeI: Centre for E-Innovation
CIDB: Construction Industry Development Programme
CPD: Corporation for Public Deposits
DBC: Departmental Bid Committee
DBSA: Development Bank of Southern Africa
DORA: Division of Revenue Act
DPSA: Department of Public Service and Administration
EDU: Economic Development Unit
EPS: Electronic Purchasing System
EPWP: Expanded Public Works Programme
FASSET: Financial and Accounting Services Sector Education and Training Authority
FET: Further Education Training
FETC: Further Education and Training Certificate
FFC: Financial Fiscal Commission
FMIP: Financial Management Improvement Programme
FMS: Financial Management System
GEPF: Government Employees Pension Fund
GRAP: Generally Recognised Accounting Practice
HOT: Head Official Treasury
HRD: Human Resource Development
HRDS: Human Resource Development Strategy
HSRC: Human Sciences Research Council
IA: Internal Audit
ICS: Improvement in Conditions of Service
ICT: Information Communication Technology
IDIP: Infrastructure Delivery Improvement Programme
IDP: Integrated Development Plans
IFMS: Integrated Financial Management System
IMLC: Institutional Management and Labour Committee
IYM: In-year monitoring
iv
LOGIS: Logistical Information System
MEC: Member of Executive Council
MFMA: Municipal Finance Management Act, 2003
MSP: Master Systems Plan
MTBPS: Medium Term Budget Policy Statement 2005 -2008
MTEF: Medium Term Expenditure Framework
NGO: Non-governmental Organisation
NTR: National Treasury Regulations
PDC: Provincial Development Council
PERSAL: Personnel and Salary Administration System
PER&O: Provincial Economic Review and Outlook
PES: Provincial Equitable share
PFMA: Public Finance Management Act
PGDS: Provincial Growth and Development Summit
PGWC: Provincial Government Western Cape
PMDS: Performance Management Development System
PMU: Programme Management Unit
PPP: Public Private Partnerships
PPSC: Provincial Portfolio Steering Committee
PTC: Provincial Treasury Committee
REAL: Revenue, Expenditure, Assets, Liabilities
SAMDI: South African Management Development Institute
SARS: South African Revenue Services
SASSA: South African Social Services Authority
SCM: Supply Chain Management
SCOA: Standard Chart of Accounts
SCOF: Standing Committee on Finance
SCOPA: Standing Committee on Public Accounts
SDI: Service Delivery Improvement
SER: Socioeconomic Review
SETA: Sector Education and Training Authority
SITA: State Information Technology Agency
SMME: Small Medium and Micro Enterprise
SMS: Senior Management Service
SPMS: Staff Performance Management System
SSA: Statistics South Africa
TCF: Technical Committee on Finance
TQM: Total Quality Management
URS: User Requirement Statement
WC-MTBPS: Western Cape Medium Term Budget Policy Statement 2005 - 2008
WCED: Western Cape Education Department
WCGRB: Western Cape Gambling and Racing Board
WCSD: Western Cape Supplier Database
Part 1: General Information
1
Part1
General Information
Introduction by the Accounting Officer
A key element of the 2004/05 financial year was the drive to recruit representative and
competent individuals to give practical effect to the Provincial Treasury’s new organisational
structure brought about by phase 1 of the restructuring process – this was combined with a new
way of working which required new co-operative systems and greater openness and
communication across units and components within the Treasury. Phase 2 of the restructuring
process also commenced to further enhance the organisational structure and staffing
establishment. With the Provincial Treasury organisationally and functionally in transition, this
placed a great load on a core of dedicated and experienced staff who were called upon to not
only carry the organisation through this rather intense period, but also to upgrade their own
knowledge and skills to be able to perform at the higher demand levels of the new
organisational structure. The latter posed similar challenges to the new recruits as they literally
had to start up their respective domains within an unknown environment without any prior
working history. Therefore, to both old and new, I express my sincere appreciation for not only
pulling the Provincial Treasury through this difficult phase, but also moving us into
significantly higher operating levels. Part of these challenges were reflected by the -
High vacancy rate at the beginning of the year under review, although a marked
improvement in the filling of key and specialised positions towards the end of the financial
year did materialise; and
High personnel turnover rate (83.6%)
With this new organisational structure and given the pressures stated above, the Provincial
Treasury did its best to attain its evolving (in content and sophistication) strategic goals and to
fulfill its Constitutional mandate to address the socioeconomic challenges of the Province in co-
operation with all other provincial departments and many other stakeholders.
As change agent, the Provincial Treasury attempted to achieve specific socioeconomic objectives
through the process of resource allocation, thereby ensuring improved efficacy of spending and
fiscal discipline. In addition, the Provincial Treasury also fostered the attainment of value for
money spending and started to put measures in place pertaining to the safeguarding and
promoting of the effective utilisation of provincial assets.
2
Annual Report 2004/05
A great deal of emphasis during the year under review
was placed on the further evolvement of the provincial
growth and development strategy known as iKapa
elihlumayo, which manifested in the eight lead strategies
of which two, namely improving financial governance
and a more effective interface between the provincial and
local government spheres, were focus areas of the
Provincial Treasury.
Some of the key highlights of the financial year under
review were the following:
The Treasury moved ahead under the guidance of a
new Minister of Finance, Economic Development and
Tourism, Minister Lynne Brown.
A great deal of attention was given to the
development and articulation of the lead iKapa
elihlumayo strategies, their integration with one
another and its translation into resource allocation
across and within departments.
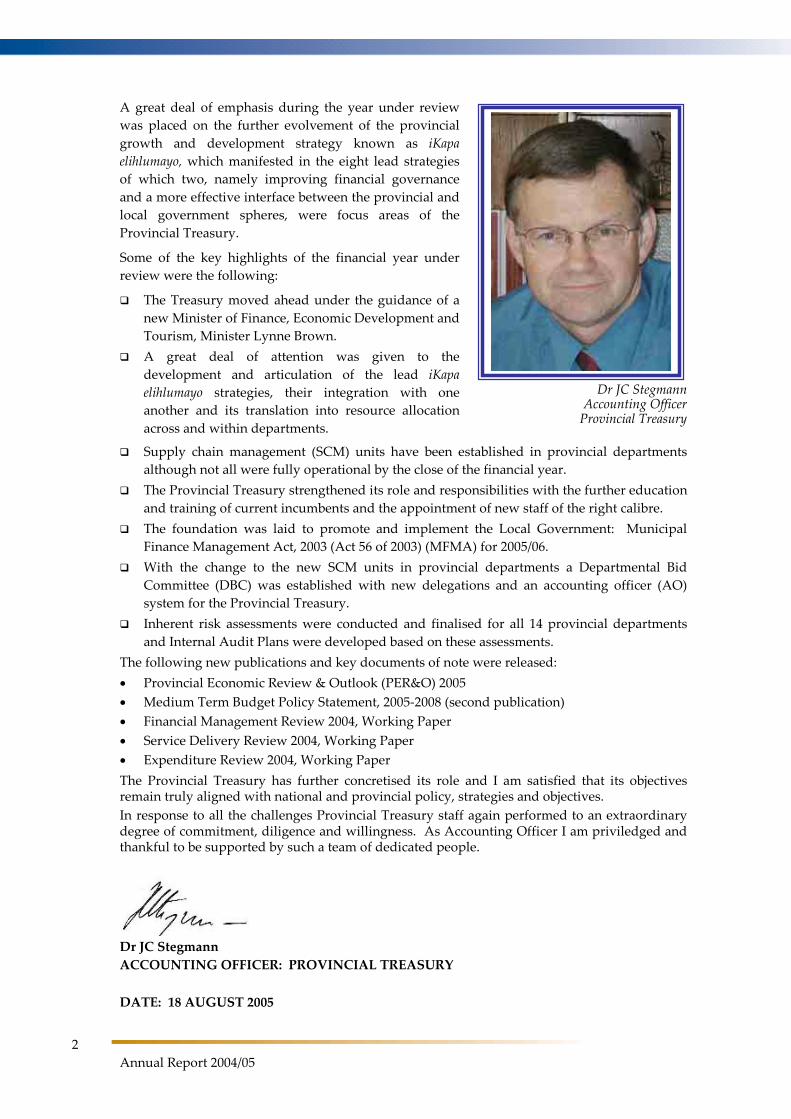
Dr JC Stegmann Accounting Officer
Provincial Treasury
Supply chain management (SCM) units have been established in provincial departments
although not all were fully operational by the close of the financial year.
The Provincial Treasury strengthened its role and responsibilities with the further education
and training of current incumbents and the appointment of new staff of the right calibre.
The foundation was laid to promote and implement the Local Government: Municipal
Finance Management Act, 2003 (Act 56 of 2003) (MFMA) for 2005/06.
With the change to the new SCM units in provincial departments a Departmental Bid
Committee (DBC) was established with new delegations and an accounting officer (AO)
system for the Provincial Treasury.
Inherent risk assessments were conducted and finalised for all 14 provincial departments
and Internal Audit Plans were developed based on these assessments.
The following new publications and key documents of note were released:
Provincial Economic Review & Outlook (PER&O) 2005
Medium Term Budget Policy Statement, 2005-2008 (second publication)
Financial Management Review 2004, Working Paper
Service Delivery Review 2004, Working Paper
Expenditure Review 2004, Working Paper
The Provincial Treasury has further concretised its role and I am satisfied that its objectives remain truly aligned with national and provincial policy, strategies and objectives.
In response to all the challenges Provincial Treasury staff again performed to an extraordinary degree of commitment, diligence and willingness. As Accounting Officer I am priviledged and thankful to be supported by such a team of dedicated people.
Dr JC Stegmann
ACCOUNTING OFFICER: PROVINCIAL TREASURY
DATE: 18 AUGUST 2005
Part 1: General Information
3
The Ministry
Ms Lynne Brown assumed duty as the Minister of Finance, Economic Development and
Tourism on 5 May 2004. As Minister responsible for financial matters, Ms L Brown was
appointed in terms of section 17(1)(a) of the Public Finance Management Act, 1999 (PFMA) as
the Head of the Provincial Treasury. Her duties as Head of
the Provincial Treasury also implies that she is a member of
the National Budget Council, operating under the auspices
of the National Treasury which is headed by the national
Minister of Finance (Minister Trevor Manuel). Minister
Brown is also responsible for the Department of Economic
Development and Tourism.
Bills
The Bills that the Executive Authority submitted to the
Western Cape Provincial Parliament during the financial
year under review are the following:
Western Cape First Finance Bill, 2004
Western Cape Provincial Youth Commission Bill, 2004
Western Cape Investment and Trade Promotion
Agency Law Amendment Bill, 2004
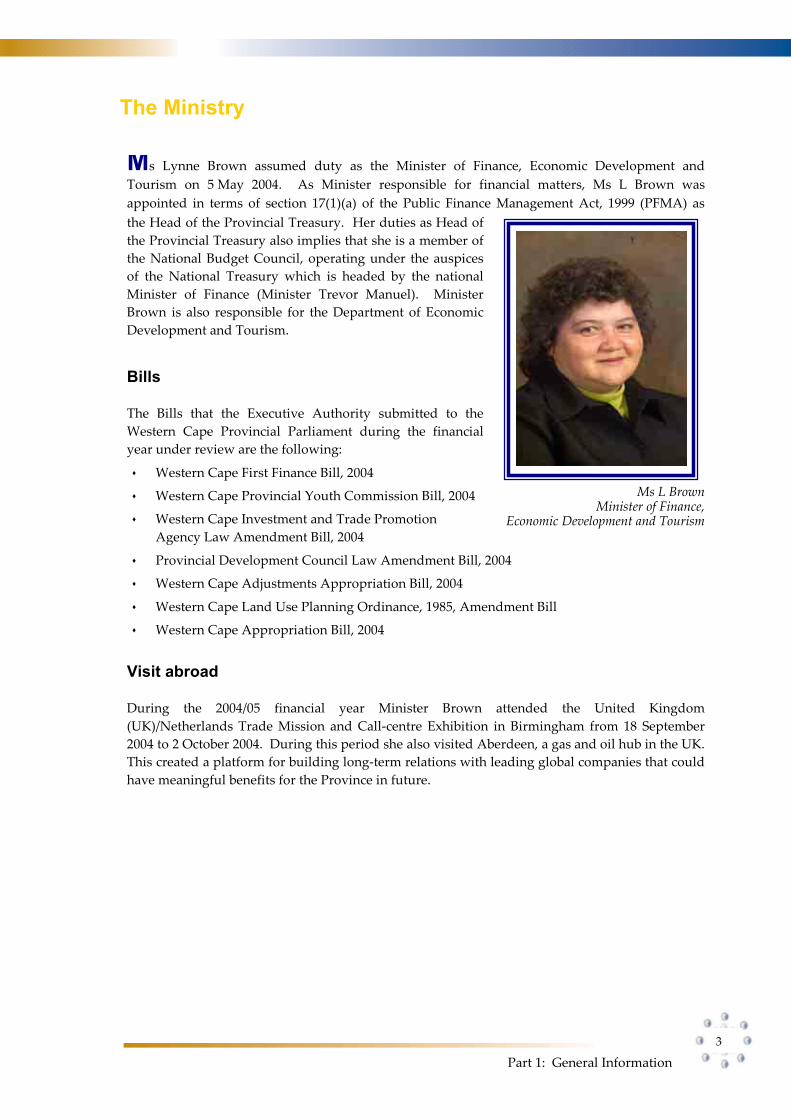
Ms L Brown Minister of Finance,
Economic Development and Tourism
Provincial Development Council Law Amendment Bill, 2004
Western Cape Adjustments Appropriation Bill, 2004
Western Cape Land Use Planning Ordinance, 1985, Amendment Bill
Western Cape Appropriation Bill, 2004
Visit abroad
During the 2004/05 financial year Minister Brown attended the United Kingdom
(UK)/Netherlands Trade Mission and Call-centre Exhibition in Birmingham from 18 September
2004 to 2 October 2004. During this period she also visited Aberdeen, a gas and oil hub in the UK.
This created a platform for building long-term relations with leading global companies that could
have meaningful benefits for the Province in future.
4
Annual Report 2004/05
As a change agent to achieve maximum well-being
To obtain financial and supportive means and utilise them to the optimum advantage of the
whole community.
To give effect to the Public Service Code of Conduct;
To be of service;
To empower people;
To be an employment equity employer; and
To be aware of, and to cultivate respect for our country’s heterogeneity.
VISION
MISSION
DEPARTMENTAL ETHOS
Part 1: General Information
5
Legislative and other mandates
The legislative mandate within which the Provincial Treasury operates, consist of the
following mix of national and provincial legislation:
Annual Division of Revenue Act
To provide for the equitable division of revenue raised nationally, inclusive of conditional
grants, amongst the three spheres of government and matters incidental thereto.
Basic Conditions of Employment Act, 1997 (Act 75 of 1997)
To provide regulatory prescripts, in addition to the Public Service Act, 1994 and the Public
Service Regulations, 2001, regarding the conditions of employment of staff in the Treasury.
Borrowing Powers of Provincial Government Act, 1996 (Act 48 of 1996)
To provide norms and conditions which the Treasury must adhere to in negotiating loans
for the Provincial Government.
Employment Equity Act, 1998 (Act 55 of 1998)
To regulate the processes and procedures of the Treasury in achieving a diverse and
competent workforce broadly representative of the demographics of the Western Cape
and eliminating unfair discrimination in employment towards implementing employment
equity.
Intergovernmental Fiscal Relations Act, 1997 (Act 97 of 1997)
To define the role of the Minister of Finance and Economic Development and that of the
Treasury as representatives of the Provincial Government, in promoting co-operation
between other spheres of government on fiscal, budgetary and financial matters; to
provide insight into the prescribed processes for the determination of the equitable share
and allocation of revenue raised nationally and for matters in connection therewith.
Labour Relations Act, 1995 (Act 66 of 1995)
To regulate and guide the Treasury in recognising and fulfilling its role in effecting labour
harmony and the democratisation of the workplace.
Local Government: Municipal Finance Management Act, 2003 (Act 56 of 2003) (MFMA)
To regulate financial management in the local sphere of government; to require that all
revenue, expenditure, assets and liabilities of municipalities and municipal entities are
managed economically, efficiently and effectively; to determine the responsibilities of
persons entrusted with municipal borrowing; to make provision for the handling of
financial emergencies in municipalities; and to provide for matters connected therewith.
Occupational Health and Safety Act, 1993 (Act 85 of 1993)
To provide for the health and safety of persons at work and for the health and safety of
persons in connection with the use of plant and machinery; the protection of persons other
than persons at work against hazards to health and safety arising out of or in connection
with the activities of person at work; to establish an advisory council for occupational
health and safety; and to provide for matters connected therewith.
Preferential Procurement Policy Framework Act, 2000 (Act 5 of 2000)
To provide the Treasury with a regulatory framework enabling and assisting departments
and potential historically disadvantaged individuals (HDIs) in the sustainable
development and implementation of a preferential procurement system.
6
Annual Report 2004/05
Promotion of Access to Information Act, 2000 (Act 2 of 2000)
To give effect to the constitutional right of access to any information held by the State and
any information that is held by another person and that is required for the exercise or
protection of any rights; and to provide for matters connected therewith.
Promotion of Administrative Justice Act, 2000 (Act 3 of 2000)
To give effect to the right to administrative action that is lawful, reasonable and
procedurally fair and to the right to request written reasons for administrative action as
contemplated in section 33 of the Constitution of the Republic of South Africa, 1996; and to
provide for matters incidental thereto.
Provincial Tax Regulation Process Act, 2001 (Act 53 of 2001)
To regulate the intergovernmental process that must be followed by provinces in the
exercise of their power in terms of section 228 of the Constitution to impose taxes, levies
and duties, and flat-rate surcharges on the tax bases of any tax, levy or duty imposed by
national legislation; and to provide for matters connected therewith.
Public Finance Management Act, 1999 (Act 1 of 1999) (PFMA)
To regulate financial management in the Treasury to ensure that all revenue, expenditure,
assets and liabilities of the Treasury are managed efficiently and effectively; to provide for
the responsibilities of persons entrusted with financial management in the Treasury and to
provide for matters connected therewith. To fulfil all Treasury responsibilities with
respect to other departments and public entities.
Public Service Act, 1994 (Act 103 of 1994)
To provide for the organisation and administration of the Treasury and for human
resource management which includes the regulation of conditions of employment, terms
of office, discipline, retirement and discharge of staff members of the Treasury and matters
connected therewith.
Skills Development Act, 1998 (Act 97 of 1998)
To provide an institutional framework to devise and implement national, sector and
workplace strategies to develop and improve the skills of the South African workforce; to
integrate those strategies within the National Qualification Framework contemplated in
the South African Qualification Authority Act, 1995; to provide for learnerships that lead
to recognised occupational qualifications; to provide for the financing of skills
development by means of a levy-grant scheme and a National Skills Fund; to provide for
and regulate employment services; and to provide for matters connected therewith.
Skills Development Levy Act, 1999 (Act 9 of 1999)
To provide for the imposition of a skills development levy; and for matters connected
therewith.
Western Cape Direct Charges Act, 2000 (Act 6 of 2000)
To provide for the withdrawal of State moneys from the Western Cape Provincial Revenue
Fund, as a direct charge, in accordance with the Constitution of the Republic of South
Africa, 1999 (Act 108 of 1996), the Constitution of the Western Cape, 1997 (Act 1 of 1998)
and the Public Finance Management Act, 1999 (Act 1 of 1999), and for matters incidental
thereof.
Western Cape Gambling and Racing Law, 1996 (Law 4 of 1996)
To provide regulatory prescripts to support the responsible Minister in ensuring sound
financial administration and management and matters incidental thereto by the Western
Cape Gambling and Racing Board.
Part 1: General Information
7
Western Cape Law on the Powers and Privileges of the Provincial Legislature
Amendment Act, 1998 (Law 3 of 1998)
To provide the Treasury with regulatory prescripts in assisting the Legislature when
necessary, in meeting their financial responsibilities as set out in legislation.
Western Cape Provincial Tender Board Law, 1994 (Law 8 of 1994)
Although this Law has been revoked, a number of period contracts concluded under this
Law and its regulations, are still valid and have to be administered in terms of this
legislation.
The Provincial Treasury has under its control the following listed provincial public entity:
Western Cape Gambling and Racing Board
The Board is established in terms of the Western Cape Gambling and Racing Law,
1996 (Law 4 of 1996). The mentioned Law provides regulatory prescripts to support
the responsible Minister in ensuring sound financial administration and management
and matters incidental thereto by the Western Cape Gambling and Racing Board.
The main function of the Board is to control all gambling, racing and activities
incidental thereto in the Province, subject to the Western Cape Gambling and Racing
Law, 1996 and any policy determinations of the Provincial Cabinet relating to the
size, nature and implementation of the industry. A more comprehensive and
detailed list of its functions appear under section 12 of the Western Cape Gambling
and Racing Law, 1996.
Clearly defined lines of communication exist between the accounting officer, the two
members of the executive authority and the management (including Board members)
of the provincial public entity. Accountability on executive authority level is shared
between the executive member responsible for the gambling portfolio and the
executive member responsible for financial matters pertaining to gambling issues.
The Western Cape Gambling and Racing Board itself acts as the accounting authority,
but has delegated most of its powers to the Chief Executive Officer of the Board. In
general, accountability arrangements for all the relevant functionaries are strictly in
line with that prescribed by the Public Finance Management Act, 1999 (Act 1 of 1999).
Part 2: Programme Performance
9
Part2
Programme Performance
1. Programme performance in summary
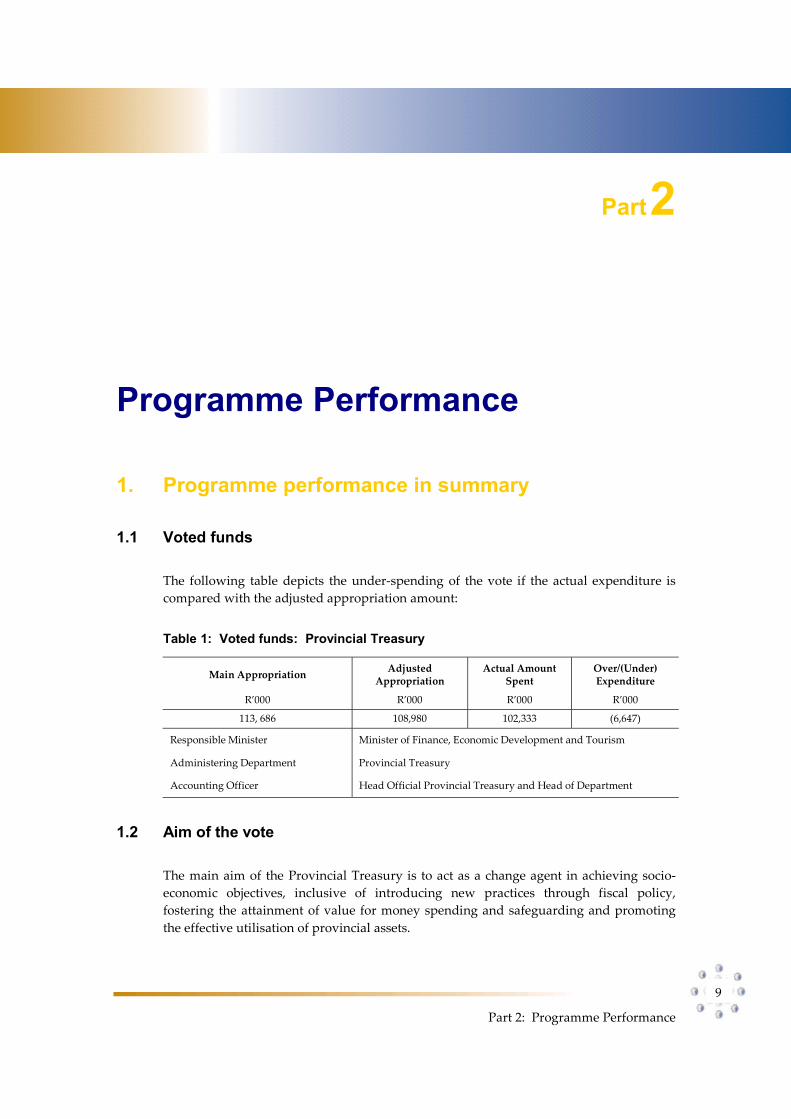
1.1 Voted funds
The following table depicts the under-spending of the vote if the actual expenditure is
compared with the adjusted appropriation amount:
Table 1: Voted funds: Provincial Treasury
Main Appropriation Adjusted
Appropriation Actual Amount
SpentOver/(Under) Expenditure
R’000 R’000 R’000 R’000
113, 686 108,980 102,333 (6,647)
Responsible Minister Minister of Finance, Economic Development and Tourism
Administering Department Provincial Treasury
Accounting Officer Head Official Provincial Treasury and Head of Department
1.2 Aim of the vote
The main aim of the Provincial Treasury is to act as a change agent in achieving socio-
economic objectives, inclusive of introducing new practices through fiscal policy,
fostering the attainment of value for money spending and safeguarding and promoting
the effective utilisation of provincial assets.
10
Annual Report 2004/05
1.3 Summary of programmes
The Provincial Treasury consisted of the following six programmes with an indication of
each programme’s aim:
Programme 1: Administration
To achieve service excellence in the provisioning and maintenance of office support
to the Minister and of sound financial administration, supply chain management and
human resource management and administration.
Programme 2: Financial Governance
To enhance performance orientated financial management.
Programme 3: Resource Management
To ensure the effective management of the Province’s fiscal resources.
Programme 4: Public Finance and Accounting
To ensure efficient budget management, delivery of any assigned responsibilities in
terms of the MFMA as well as accounting and reporting fully reflecting the financial
position of the Province.
Programme 5: Asset Management
To ensure the effective and efficient management of physical and financial assets.
Programme 6: Contingency Provision
To respond to adverse natural or economic occurrences having the potential to
threaten the budget framework of the Western Cape Government.
1.4. Key strategic objectives and achievements
1.4.1 Key strategic objectives
The Provincial Treasury set itself the following key strategic objectives which are
indicated on a per programme basis:
Programme 1: Administration
Ensure the rendering of secretarial, administrative and office support services.
Act as linkage between the Treasury and the Department of Economic Development
and Tourism.
Part 2: Programme Performance
11
Enable the Minister to realise her direct treasury and economic development
responsibilities.
Ensure management accounting within the new standard chart of accounts
framework (SCOA).
Ensure financial accounting within the new SCOA framework.
Ensure supply chain management within the newly established procurement
procedures determined by National Treasury.
Render specialised auxiliary services.
Ensure systems of risk management and internal control.
Render support on transversal financial matters.
Render personnel management services.
Manage human resource development.
Manage policy and transformation matters.
Manage labour relations.
Programme 2: Financial Governance
To determine and implement financial norms and standards and to monitor and
assist with nominal and substantive compliance.
To ensure the existence of an appropriate and dynamic financial legislative
framework.
To develop, consolidate and maintain effective internal and external communication.
To render an effective internal audit service.
To perform inherent risk assessments of the business processes in provincial
departments and build a risk profile per department and the Provincial Government
as a whole.
To develop and facilitate the implementation of effective risk management and
government governance capacity within the Provincial Government.
12
Annual Report 2004/05
Programme 3: Resource Management
Drive the MTEF and annual budget process.
Manage the annual medium-term budget policy process.
Consolidate, prepare and compile the annual medium-term budget policy statement.
Determine annual budget allocation per function.
Determine resource shifts between spheres of government and departments.
Ensure integration and synergy of budget priorities between departments and
governments.
Assessing and ensuring effective expenditure.
Ensuring that new policy proposals are costed and the relative priority determined.
Introduce measures to close gaps between macroeconomic variables and policy
priorities, budget trends, spending trends, strategies, development plans and service
delivery indicators.
Determine and analyse key economic variables, their interrelation and relevance for
the budget.
Determine the potential and constraints for growth and development and their
interaction with governmental spending end revenue patterns/trends.
Determine alternative budgeting and other revenue and expenditure impact
scenarios on selected key economic growth and development indicators.
Assess impact of previous fiscal policy objectives on selected economic variables.
Develop institutional co-ordination and sector integration.
Administer the medium-term revenue planning process.
Assess and optimise vertical and equitable shares and conditional grants.
Ensure effective and efficient development of provincial revenue, whether user
charges or provincial taxes, levies and duties.
Ensure effective and efficient management of debtors.
Ensure effective and efficient management of loans, guarantees and other financial
commitments.
Administer gambling and racing matters.
Assess revenue trends, compile and submit revenue reports.
Determine an overall financing envelope for MTEF.
Provide technical assistance and training.
Part 2: Programme Performance
13
Programme 4: Public Finance and Accounting
Administer the medium-term expenditure planning process.
Manage the adjustments budget process.
Prepare and compile the annual and adjustments budget.
Assess and enforce expenditure efficiency and liability management.
Manage, assess and control the implementation of the provincial budget.
Assess expenditure trends, compile and submit expenditure reports (IYM).
Promote budget reform.
Monitor and assess local government budgets.
Assess and advise on the optimal contribution of functions between the provincial
and local government spheres.
Ensure the development of accounting practices that will promote effective and
efficient capturing of REAL movements/accountability.
Ensure integrity of financial data.
Roll out and assess GRAP formats.
Develop and promote the use of cost accounting principles.
Improve financial performance through the development and application of
interpretive accounting.
Assess accounting trends, co-ordinate and compile reports.
Compile annual consolidated financial statements.
Provide technical assistance and training.
Programme 5: Asset Management
To identify and develop strategic sourcing methodologies in those industries where
the bulk of provincial procurement budget is spent.
To, in liaison with the National Treasury, identify a state of the art supply chain
management system to drive continuous improvement in the delivery of goods and
services and the control and the management thereof.
To develop simple standardised supply chain management processes to ensure
satisfactory delivery of goods and services and the control and management thereof.
To build a purchasing culture in the province that is performance orientated, flexible
yet, aligned to process, socially conscious but driven by customer satisfaction.
To elevate supply chain management through linking there to, the budget and
strategic plan of departments.
Promote and assess new PPP projects.
Monitor and enforce compliance with legislation.
To build the necessary capacity in the Provincial Treasury to take over all PPP related
responsibilities from the National Treasury by 1 April 2005.
Manage cash flow matters.
Manage investments.
14
Annual Report 2004/05
Develop a policy framework for the evolvement of efficient financial management
systems.
Assess and maintain the financial management system.
Roll-out and ensuring efficient implementation of transversal financial management
systems.
Develop and assess bespoke financial systems.
Determine the requirements for financial management systems to ensure efficient
and effective management of REAL.
Monitor and report on financial management system’s performance.
Monitor and verify monthly SITA costs relating to transversal financial systems
ensuring optimal management of cost drivers.
Provide technical assistance and training.
Programme 6: Contingency Provision
Provide departments with financial means for those eventualities that could not be
budgeted for but need to be addressed.
1.4.2 Summary of Achievements
The Provincial Treasury’s major achievements during 2004/05 were very diverse in
nature with most of the programmes contributing to some degree in attaining the
Provincial Government’s strategic objectives. The following paragraphs provide some
insight on those achievements. With phase 1 (the major part) of the restructuring process
of the Treasury being completed, phase 2 commenced with further enhancements to the
new organisational structure and staff establishment, mainly to accommodate the
MFMA’s requirements. Improvement in the level of service delivery was geared to raise
the experience level of recently employed staff, their education level and training. A
significant amount of effort also had to be spent in bedding down the new structure and
facilitating a new way of working, which required new co-operative systems and greater
openness and communication across units and components within the Provincial
Treasury and with all departments.
Further achievements were the compilation of the 2004 Western Cape Medium Term
Budget Policy Statement 2005 – 2008 (MTBPS) and the 2005 Provincial Economic Review
& Outlook (PER&O). Both these publications framed and gave content to the 2005
Budget and contextualised the Western Cape economy and the national macroeconomic
framework. The publications were jointly tabled with the 2005 Budget documentation on
the provincial budget day on 8 March 2005. A Financial Management Review Working
Paper was also compiled with four main purposes, namely as an instrument towards
improving financial management, a guide to key reforms in progress, an indicator of
future investment of resources in improving financial governance and to maintain
continuity in line with MTBPS and develop further concepts. Service Delivery and
Expenditure Reviews were also published for internal consumption as working papers.
Part 2: Programme Performance
15
The Western Cape Cabinet accepted the introduction of a proposed fuel levy to augment
sorely needed infrastructure financing. The proposal has subsequently been submitted
to National Treasury for approval where after it still needs to go to the Western Cape
legislature for consideration.
Although SCM units have been established in departments, they are not fully operational
according to the predetermined criteria set by National Treasury.
A great deal of attention was given to the development and articulation of the five lead
iKapa elihlumayo strategies, their integration with one another and its translation into
resource allocation across the Provincial Government and within departments.
1.5 Overview of the service delivery environment for 2004/05
The service delivery environment within which the Provincial Treasury operates, is one
characterised by change and 2004/05 was no exception.
In spite of all the initiatives regarding the new fiscal arrangements launched since 1994, a
great deal still remains to be done to improve per capita income levels, economic
disparities, general fiscal management and a range of socioeconomic circumstances.
These challenges remain and new initiatives require to be developed to effect significant
improvements over the medium to long-term.
As key agents in resource allocation, ensuring efficacy of spending and general fiscal
discipline, treasuries collectively and individually deal with significant challenges to
improve the general welfare within their respective provinces. This challenge was also
true for the Western Cape in 2004/05.
The Provincial Treasury also had to shift its focus from merely nominal compliance with
financial legislation to normative and quantifiable service delivery aspects in line with
National Treasury’s new paradigm.
As expected these challenges placed more pressure on innovative measures that still
have to be instituted between government, the private sector and other social partners
and further developed in the coming years.
1.6 Overview of the organisational environment for 2004/05
The approved organisational structure that applied for the year under review catered for
more comprehensive strategic goals and enabled the Provincial Treasury to better fulfil
its Constitutional mandate to address the socioeconomic challenges of the Province in
tandem with all other departments, municipalities and other stakeholders. Consistent
with earlier National Treasury initiatives, the Provincial Treasury has also restructured in
line with Constitutional mandates, which, apart from the strategic goals to be pursued
should also improve synergy between the national and provincial spheres of
government.
Therefore another challenge is to ensure that new staff appointed is of the right caliber
and diversity in terms of skills being performed both at a higher level and broader base
16
Annual Report 2004/05
within the new organisational structure and to attain the predetermined goals over the
short to medium-term and exceed the set goals over the long-term.
The appointment of three revenue economists and one taxation economist in the
Resource Acquisition Unit during the course of the 2004/05 financial year allowed this
unit to better meet its objectives.
The revisiting of the bid into the study of the feasibility of the bed levy has, however,
impacted on the Resource Acquisition Units’ ability to expand the provincial tax base at
this stage and will receive further attention during 2005/06.
1.7 Strategic overview and key policy developments for the 2004/05 financial year
Relevant policy developments are described under the following sub-headings:
Shift towards outcome based budget allocation
The Provincial Treasury has commenced with the assessment of provincial departments’
measurable information to ensure alignment of their strategic objectives towards the
desired outcomes of the Province, shifting the emphasis towards an outcome based
budget allocation process.
Qualitative impact of provincial service delivery
In the past the qualitative impact of provincial service delivery on provincial socio-
economic variables have not been assessed. However, during the year under review
some analytical instruments were designed to assist with such assessments.
Further increase Province’s own revenue sources
Concerted efforts were also embarked upon in pursuit of other sources of revenue to
further increase the Province’s own contribution to the resource envelope.
Extended asset management functions
The procurement and provisioning functions have been integrated and as part of the
restructuring of the Provincial Treasury, a Supply Chain Management component was
established for monitoring, setting standards and best practice policies with regard to
procurement, physical asset management, public private partnerships and related issues.
Physical Asset Management and Public Private Partnerships were new components
within the Provincial Treasury environment and most work performed was of a
developmental nature to establish a basis from which to develop policies, standards and
practices to bring about the effective and efficient utilisation of provincial assets.
Shift to substantive compliance and enhancing corporate governance and risk management
In ensuring a progressive and sustainable achievement of substantive compliance with
the PFMA, the newly created Financial Governance component focused on enhancing
corporate governance and risk management with the assistance of outside consultants.
In addition performance oriented financial management is at a starting point where
inputs relating to norms and standards inputs are to be evaluated.
Part 2: Programme Performance
17
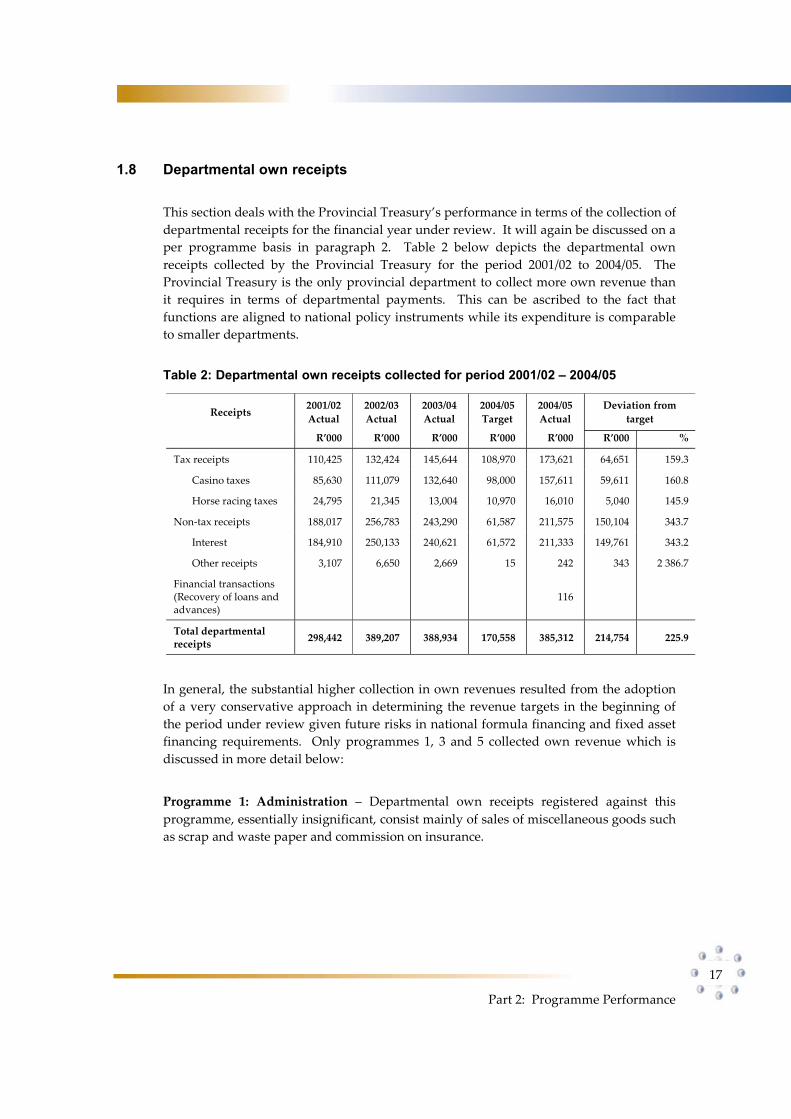
1.8 Departmental own receipts
This section deals with the Provincial Treasury’s performance in terms of the collection of
departmental receipts for the financial year under review. It will again be discussed on a
per programme basis in paragraph 2. Table 2 below depicts the departmental own
receipts collected by the Provincial Treasury for the period 2001/02 to 2004/05. The
Provincial Treasury is the only provincial department to collect more own revenue than
it requires in terms of departmental payments. This can be ascribed to the fact that
functions are aligned to national policy instruments while its expenditure is comparable
to smaller departments.
Table 2: Departmental own receipts collected for period 2001/02 – 2004/05
Receipts 2001/02
Actual
2002/03
Actual
2003/04
Actual
2004/05
Target
2004/05
Actual
Deviation from
target
R’000 R’000 R’000 R’000 R’000 R’000 %
Tax receipts 110,425 132,424 145,644 108,970 173,621 64,651 159.3
Casino taxes 85,630 111,079 132,640 98,000 157,611 59,611 160.8
Horse racing taxes 24,795 21,345 13,004 10,970 16,010 5,040 145.9
Non-tax receipts 188,017 256,783 243,290 61,587 211,575 150,104 343.7
Interest 184,910 250,133 240,621 61,572 211,333 149,761 343.2
Other receipts 3,107 6,650 2,669 15 242 343 2 386.7
Financial transactions (Recovery of loans and advances)
116
Total departmental receipts
298,442 389,207 388,934 170,558 385,312 214,754 225.9
In general, the substantial higher collection in own revenues resulted from the adoption
of a very conservative approach in determining the revenue targets in the beginning of
the period under review given future risks in national formula financing and fixed asset
financing requirements. Only programmes 1, 3 and 5 collected own revenue which is
discussed in more detail below:
Programme 1: Administration – Departmental own receipts registered against this
programme, essentially insignificant, consist mainly of sales of miscellaneous goods such
as scrap and waste paper and commission on insurance.
18
Annual Report 2004/05
Programme 3: Resource Management – Own revenue collected by this programme
relates mainly to casino and horseracing taxes. The substantial variance for which the
actual amounts exceed the targeted amounts at the tax receipts can be ascribed to higher
than anticipated gambling and betting activity, which might be caused by more
disposable income being available to households due to lower interest rates. Included
under the other receipts is an amount for fines and penalties, which due to its very nature
was not budgeted for in the first place thereby adding to the substantial variance.
Programme 5: Asset Management – This programme is responsible for managing
interest earned on investments. The over collection in interest revenue can be ascribed to
effective management of investments according to an investment and nascent asset
financing policies combined with a slower than expected expenditure pattern of
provincial departments which resulted in more cash on hand for investment purposes.
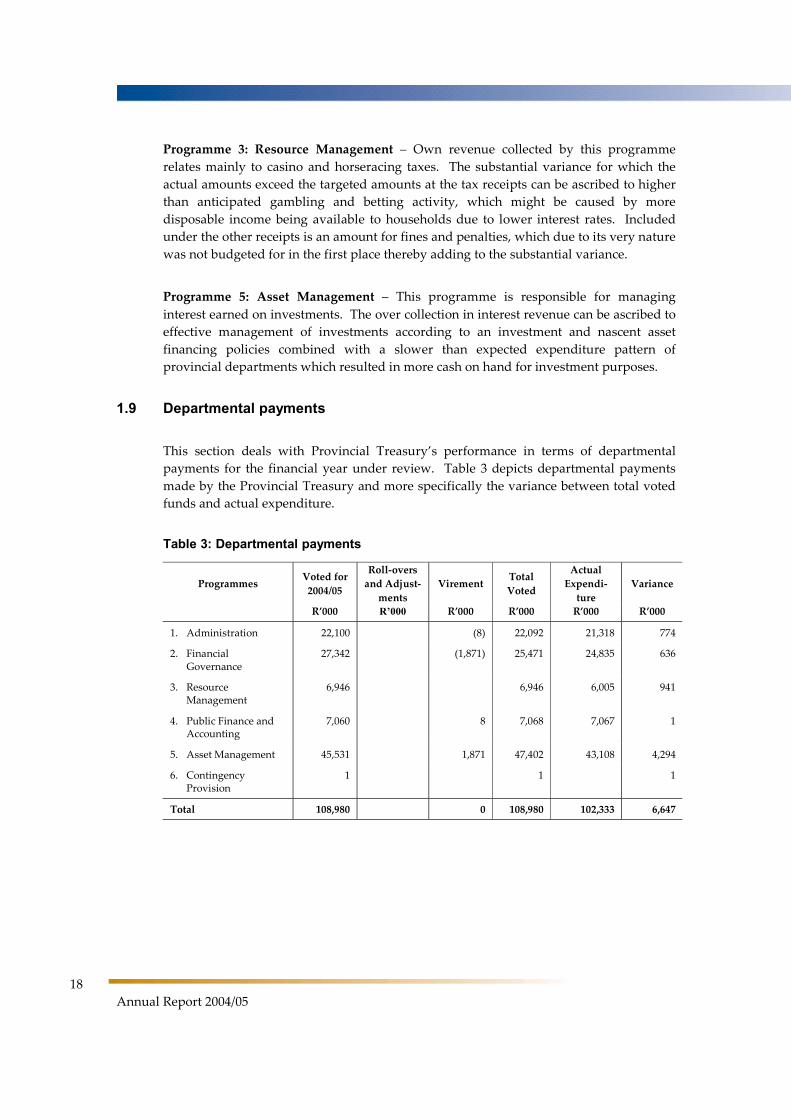
1.9 Departmental payments
This section deals with Provincial Treasury’s performance in terms of departmental
payments for the financial year under review. Table 3 depicts departmental payments
made by the Provincial Treasury and more specifically the variance between total voted
funds and actual expenditure.
Table 3: Departmental payments
Programmes Voted for
2004/05
Roll-overs
and Adjust-
ments
Virement Total
Voted
Actual
Expendi-
ture
Variance
R’000 R’000 R’000 R’000 R’000 R’000
1. Administration 22,100 (8) 22,092 21,318 774
2. Financial Governance
27,342 (1,871) 25,471 24,835 636
3. Resource Management
6,946 6,946 6,005 941
4. Public Finance and Accounting
7,060 8 7,068 7,067 1
5. Asset Management 45,531 1,871 47,402 43,108 4,294
6. Contingency Provision
1 1 1
Total 108,980 0 108,980 102,333 6,647
Part 2: Programme Performance
19
Programme 1: Administration (96,5% actual expenditure)
The under spending (3,5%) on this programme can mainly be contributed to the late
filling of vacant posts and for lower than expected resettlement costs. Other reasons
were the lower than expected spending on consulting services, lower than expected
uptake of bursaries and less overseas travel within the Office of the Minister.
Special efforts were undertaken late in the financial year to utilise the above under
expenditures by improving the physical working environment for all officials within the
Provincial Treasury. Additional plants and modifications to workstations were among
the improvements that were made. Older desktop computers and computer screens
were donated to schools and a charity organisation.
Programme 2: Financial Governance (97,5% actual expenditure )
The under spending (2,5%) on this programme was mainly due to lower than expected
expenditure on consulting services and late filling of vacant posts. A measure that was
adopted to improve service delivery and the management of expenditure was the
appointment of senior staff and consultants that assisted to deliver services.
Programme 3: Resource Management (86,5% actual expenditure)
Under spending (13,5%) on this programme was attributed to less than expected
expenditure on consulting services and the late filling of vacant posts.
Given limited historical experience, budgeting for the planned Resource Management
outputs is not an easy task. Lessons of the previous year gave an initial indication as to
consulting and personnel requirements – these are being taken into account in the
revised financial management and budgeting of the sections and in the phased
appointment of key personnel.
The Macroeconomic Analysis unit and the Resource Acquisition team have initiated
monthly IYM programme budget reports which analyse monthly movements on
expenditure component areas, such as personnel, consultancy, travel and
accommodation. This will facilitate improved financial management control as well as
budgeting going forward.
Programme 4: Public Finance and Accounting (100% actual expenditure)
There are no material variances to report on.
The Provincial Treasury in association with the Department of Local Government
established the MFMA unit, which facilitated and contributed to the implementation of
the MFMA within the province and municipalities.
In the effort to ensure compliance with the MFMA, considering the capacity constraints
and high staff turn over, human resources across the various disciplines within the
Provincial Treasury were pooled on an ad hoc basis thereby increasing output and
achieving objectives in spite of sub optimal staffing strengths.
20
Annual Report 2004/05
Programme 5: Asset Management (90,9% actual expenditure)
The under spending (9,1%) on Asset Management was mainly due to planned spending
on computer equipment related to the LOGIS implementation that did not realise in time
before the close of the financial year, the lowering in the tariffs charged for SITA
mainframe time that was only communicated by the National Treasury after the
Adjustments Estimates for 2004/05 was finalised, combined with the late filling of vacant
posts.
Service delivery was, however, not negatively impacted upon and measures adopted to
improve the efficiency and economy of spending involved the following:
More effective planning and needs analysis prior to implementation of LOGIS
ensured that spending was according to actual requirements.
The initial budget was aligned to the anticipated new SITA tariffs applicable.
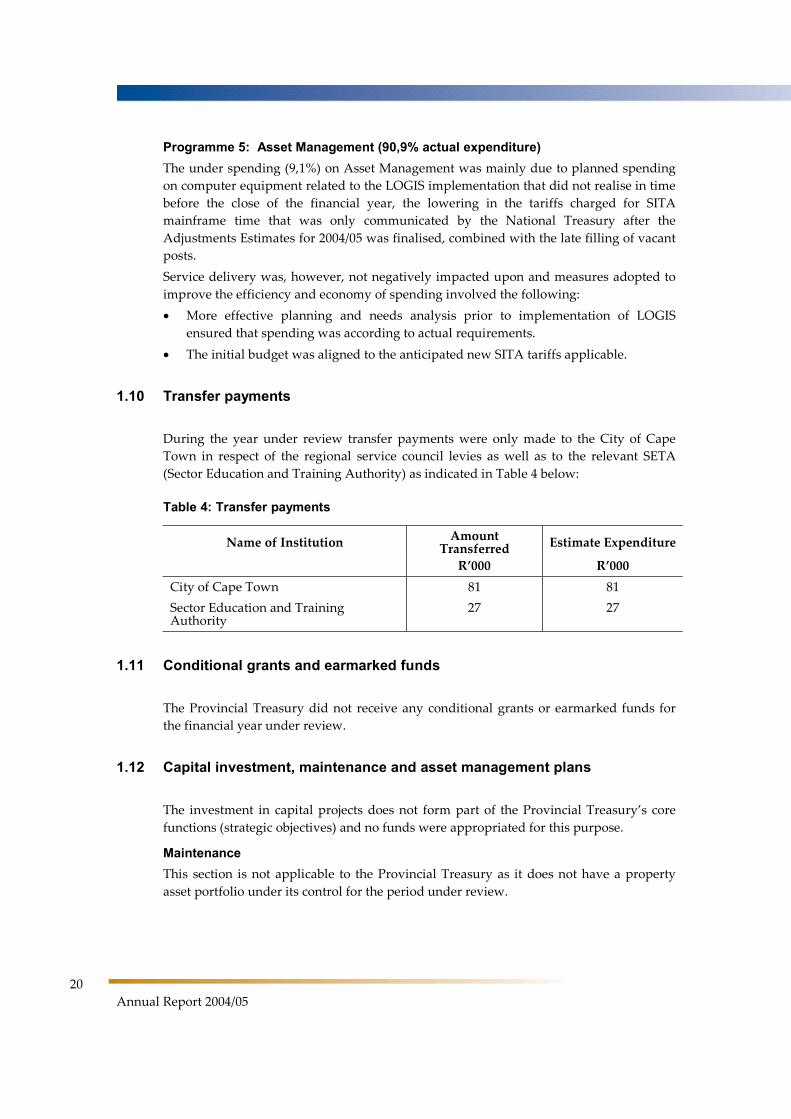
1.10 Transfer payments
During the year under review transfer payments were only made to the City of Cape
Town in respect of the regional service council levies as well as to the relevant SETA
(Sector Education and Training Authority) as indicated in Table 4 below:
Table 4: Transfer payments
Name of Institution Amount Transferred Estimate Expenditure
R’000 R’000
City of Cape Town 81 81
Sector Education and Training Authority
27 27
1.11 Conditional grants and earmarked funds
The Provincial Treasury did not receive any conditional grants or earmarked funds for
the financial year under review.
1.12 Capital investment, maintenance and asset management plans
The investment in capital projects does not form part of the Provincial Treasury’s core
functions (strategic objectives) and no funds were appropriated for this purpose.
Maintenance
This section is not applicable to the Provincial Treasury as it does not have a property
asset portfolio under its control for the period under review.
Part 2: Programme Performance
21
Asset Management
The additions in computer and related equipment as stated in Part 4, Annexure 6 could
be justified as follows -
Additional computer equipment was purchased for the LOGIS roll-out.
Laptops for the Internal Auditors and senior management staff were upgraded.
Additional computer equipment was purchased for new appointees.
As a means to alleviate radiation and to ensure more working space at workstations,
flat screens were purchased and issued to the majority of staff.
Obsolete items such as printers were replaced and the need for colour printers was
also addressed.
The loss of four (4) laptops was registered and written off by the Provincial Treasury.
This is indicated in Part 4, disclosure note 5.2. The disposal of assets as reflected in
Annexure 6 of Part 4 was mainly due to the correction of the asset register as a result of
incorrect asset descriptions.
The asset register is automatically updated when new assets are acquired or when
redundant assets are disposed of. An annual stock take has been completed but will only
be reconciled during 2005/06.
Roundabout 90% of the Department’s assets are in a good state, while the remaining ±
10% is in a fair condition.
No maintenance projects have been undertaken during the financial year under review
and no projects are being carried forward from the financial year under review to the
following financial year.
No facility was closed down or downgraded during the period under review for
whatever reason.
Where needs arise to go the route of bidding for projects, the Supply Chain Management
process outlined in this Department’s Accounting Officer’s System acts as a guideline.
2. Programme performance in detail
This section will deal with the respective programme’s performances in more detail. It
will be placed in perspective by focussing on the respective purposes or aims,
measurable objectives, service delivery objectives and indicators and service delivery
achievements of the different programmes/ sub-programmes.
2.1 Programme 1: Administration Aim: To achieve service excellence in the provisioning and maintenance of office
support to the Minister and of sound financial administration, supply chain management
and human resource management and administration.
22
Annual Report 2004/05
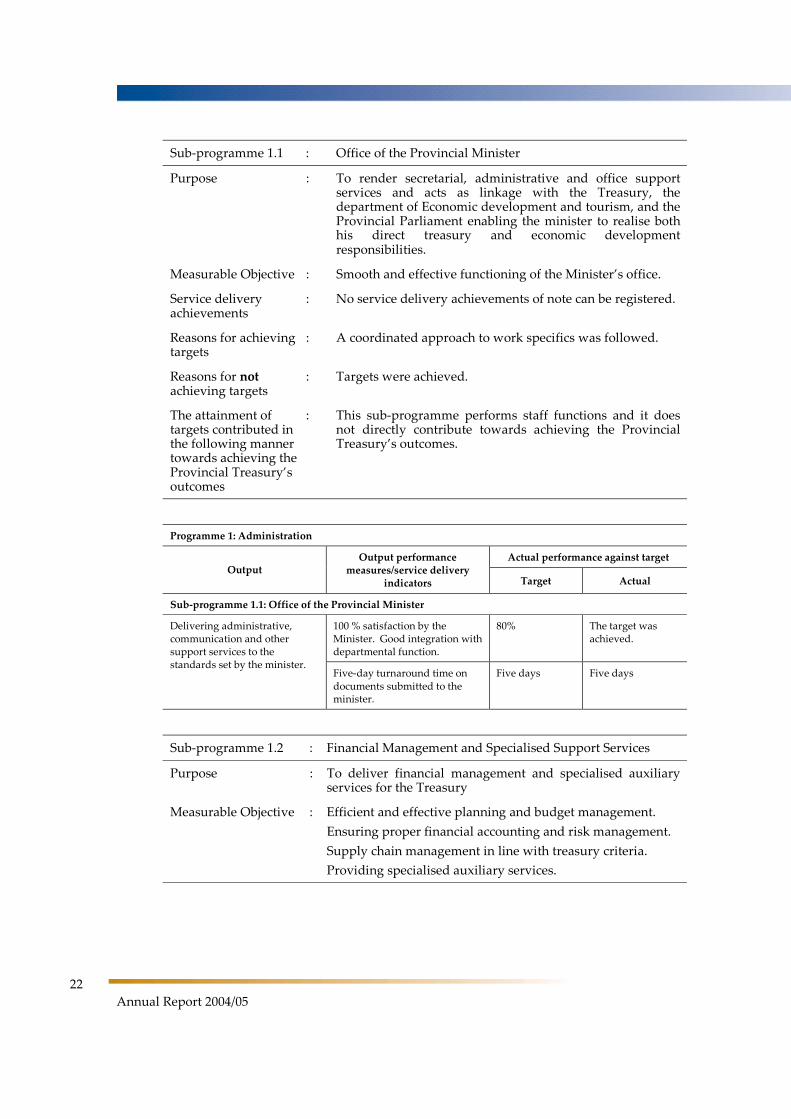
Sub-programme 1.1 : Office of the Provincial Minister
Purpose : To render secretarial, administrative and office support services and acts as linkage with the Treasury, the department of Economic development and tourism, and the Provincial Parliament enabling the minister to realise both his direct treasury and economic development responsibilities.
Measurable Objective : Smooth and effective functioning of the Minister’s office.
Service delivery achievements
: No service delivery achievements of note can be registered.
Reasons for achieving targets
: A coordinated approach to work specifics was followed.
Reasons for notachieving targets
: Targets were achieved.
The attainment of targets contributed in the following manner towards achieving the Provincial Treasury’s outcomes
: This sub-programme performs staff functions and it does not directly contribute towards achieving the Provincial Treasury’s outcomes.
Programme 1: Administration
Actual performance against target Output
Output performance measures/service delivery
indicators Target Actual
Sub-programme 1.1: Office of the Provincial Minister
100 % satisfaction by the Minister. Good integration with departmental function.
80% The target was achieved.
Delivering administrative, communication and other support services to the standards set by the minister.
Five-day turnaround time on documents submitted to the minister.
Five days Five days
Sub-programme 1.2 : Financial Management and Specialised Support Services
Purpose : To deliver financial management and specialised auxiliary services for the Treasury
Measurable Objective : Efficient and effective planning and budget management.
Ensuring proper financial accounting and risk management.
Supply chain management in line with treasury criteria.
Providing specialised auxiliary services.
Part 2: Programme Performance
23
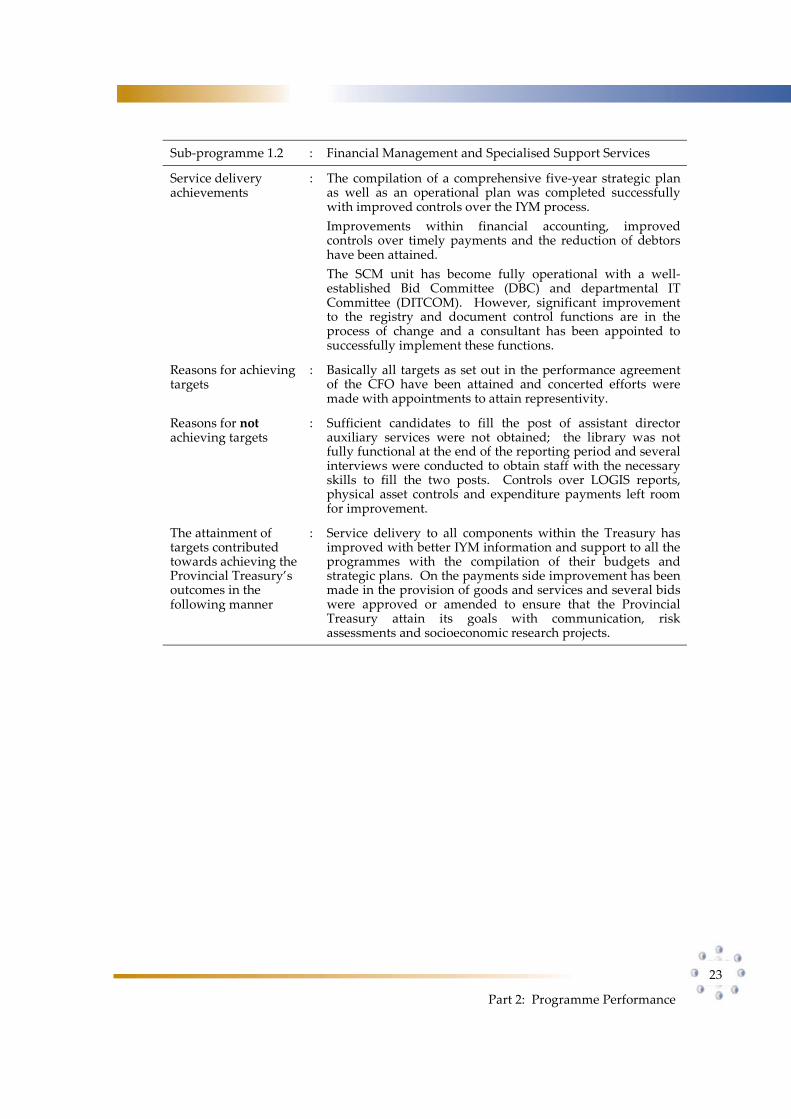
Sub-programme 1.2 : Financial Management and Specialised Support Services
Service delivery achievements
: The compilation of a comprehensive five-year strategic plan as well as an operational plan was completed successfully with improved controls over the IYM process.
Improvements within financial accounting, improved controls over timely payments and the reduction of debtors have been attained.
The SCM unit has become fully operational with a well-established Bid Committee (DBC) and departmental IT Committee (DITCOM). However, significant improvement to the registry and document control functions are in the process of change and a consultant has been appointed to successfully implement these functions.
Reasons for achieving targets
: Basically all targets as set out in the performance agreement of the CFO have been attained and concerted efforts were made with appointments to attain representivity.
Reasons for notachieving targets
: Sufficient candidates to fill the post of assistant director auxiliary services were not obtained; the library was not fully functional at the end of the reporting period and several interviews were conducted to obtain staff with the necessary skills to fill the two posts. Controls over LOGIS reports, physical asset controls and expenditure payments left room for improvement.
The attainment of targets contributed towards achieving the Provincial Treasury’s outcomes in the following manner
: Service delivery to all components within the Treasury has improved with better IYM information and support to all the programmes with the compilation of their budgets and strategic plans. On the payments side improvement has been made in the provision of goods and services and several bids were approved or amended to ensure that the Provincial Treasury attain its goals with communication, risk assessments and socioeconomic research projects.
24
Annual Report 2004/05
Programme 1: Administration
Actual performance against target Output
Output performance measures/service
delivery indicators Target Actual
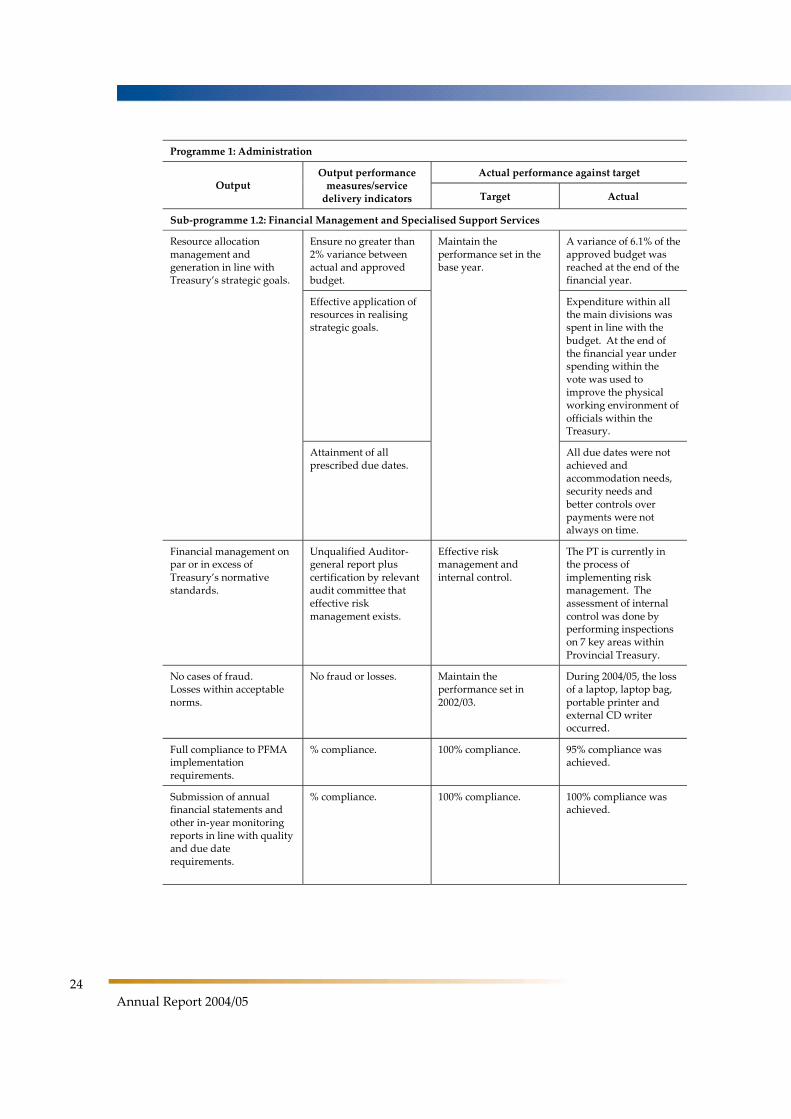
Sub-programme 1.2: Financial Management and Specialised Support Services
Ensure no greater than 2% variance between actual and approved budget.
Maintain the performance set in the base year.
A variance of 6.1% of the approved budget was reached at the end of the financial year.
Effective application of resources in realising strategic goals.
Expenditure within all the main divisions was spent in line with the budget. At the end of the financial year under spending within the vote was used to improve the physical working environment of officials within the Treasury.
Resource allocation management and generation in line with Treasury’s strategic goals.
Attainment of all prescribed due dates.
All due dates were not achieved and accommodation needs, security needs and better controls over payments were not always on time.
Financial management on par or in excess of Treasury’s normative standards.
Unqualified Auditor-general report plus certification by relevant audit committee that effective risk management exists.
Effective risk management and internal control.
The PT is currently in the process of implementing risk management. The assessment of internal control was done by performing inspections on 7 key areas within Provincial Treasury.
No cases of fraud. Losses within acceptable norms.
No fraud or losses. Maintain the performance set in 2002/03.
During 2004/05, the loss of a laptop, laptop bag, portable printer and external CD writer occurred.
Full compliance to PFMA implementation requirements.
% compliance. 100% compliance. 95% compliance was achieved.
Submission of annual financial statements and other in-year monitoring reports in line with quality and due date requirements.
% compliance. 100% compliance. 100% compliance was achieved.
Part 2: Programme Performance
25
Programme 1: Administration
Actual performance against target Output
Output performance measures/service
delivery indicators Target Actual
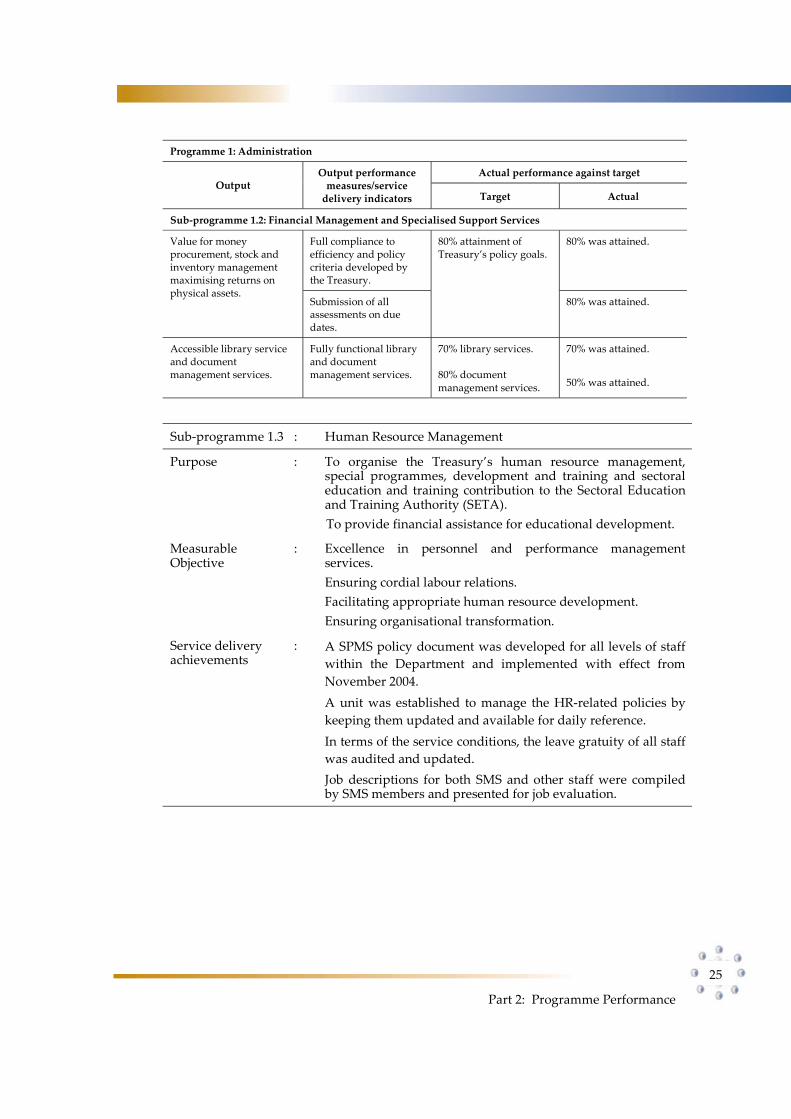
Sub-programme 1.2: Financial Management and Specialised Support Services
Full compliance to efficiency and policy criteria developed by the Treasury.
80% attainment of Treasury’s policy goals.
80% was attained. Value for money procurement, stock and inventory management maximising returns on physical assets.
Submission of all assessments on due dates.
80% was attained.
Accessible library service and document management services.
Fully functional library and document management services.
70% library services.
80% document management services.
70% was attained.
50% was attained.
Sub-programme 1.3 : Human Resource Management
Purpose : To organise the Treasury’s human resource management, special programmes, development and training and sectoral education and training contribution to the Sectoral Education and Training Authority (SETA).
To provide financial assistance for educational development.
Measurable Objective
: Excellence in personnel and performance management services.
Ensuring cordial labour relations.
Facilitating appropriate human resource development.
Ensuring organisational transformation.
Service delivery achievements
: A SPMS policy document was developed for all levels of staff
within the Department and implemented with effect from
November 2004.
A unit was established to manage the HR-related policies by
keeping them updated and available for daily reference.
In terms of the service conditions, the leave gratuity of all staff
was audited and updated.
Job descriptions for both SMS and other staff were compiled by SMS members and presented for job evaluation.
26
Annual Report 2004/05
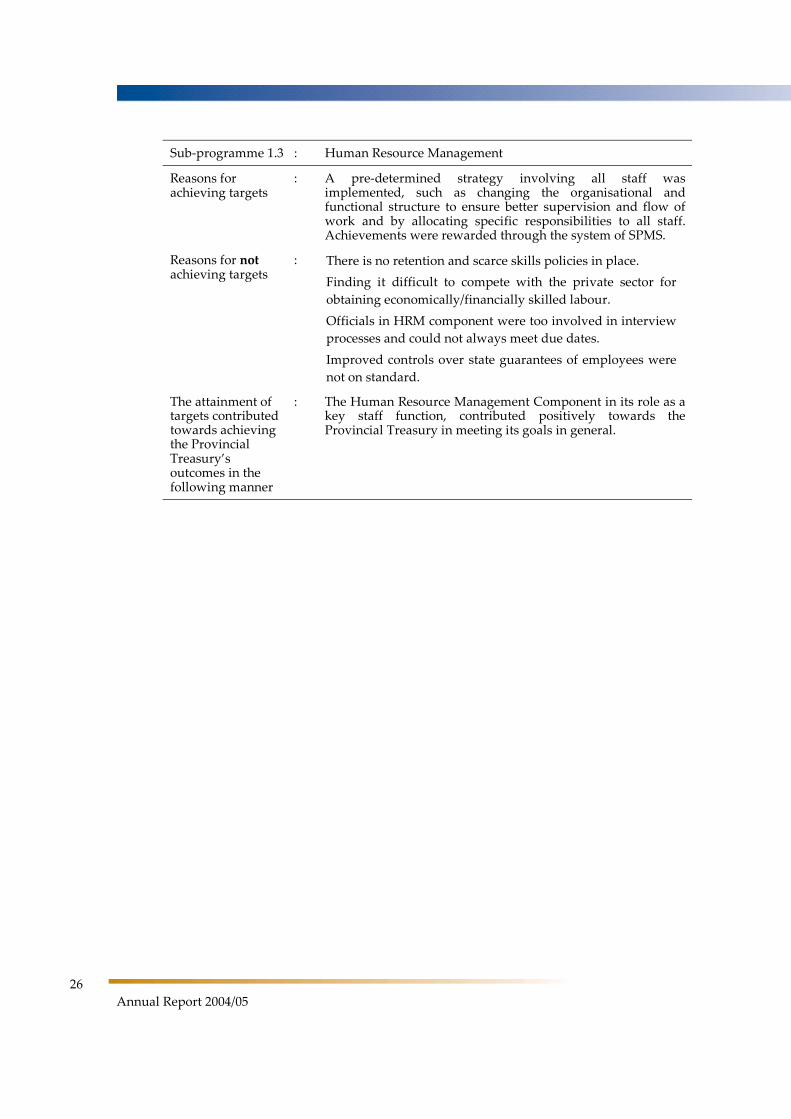
Sub-programme 1.3 : Human Resource Management
Reasons for achieving targets
: A pre-determined strategy involving all staff was implemented, such as changing the organisational and functional structure to ensure better supervision and flow of work and by allocating specific responsibilities to all staff. Achievements were rewarded through the system of SPMS.
Reasons for notachieving targets
: There is no retention and scarce skills policies in place.
Finding it difficult to compete with the private sector for
obtaining economically/financially skilled labour.
Officials in HRM component were too involved in interview
processes and could not always meet due dates.
Improved controls over state guarantees of employees were
not on standard.
The attainment of targets contributed towards achieving the Provincial Treasury’s outcomes in the following manner
: The Human Resource Management Component in its role as a key staff function, contributed positively towards the Provincial Treasury in meeting its goals in general.
Part 2: Programme Performance
27
Programme 1: Administration
Actual performance against target Output
Output performance measures/service delivery
indicators Target Actual
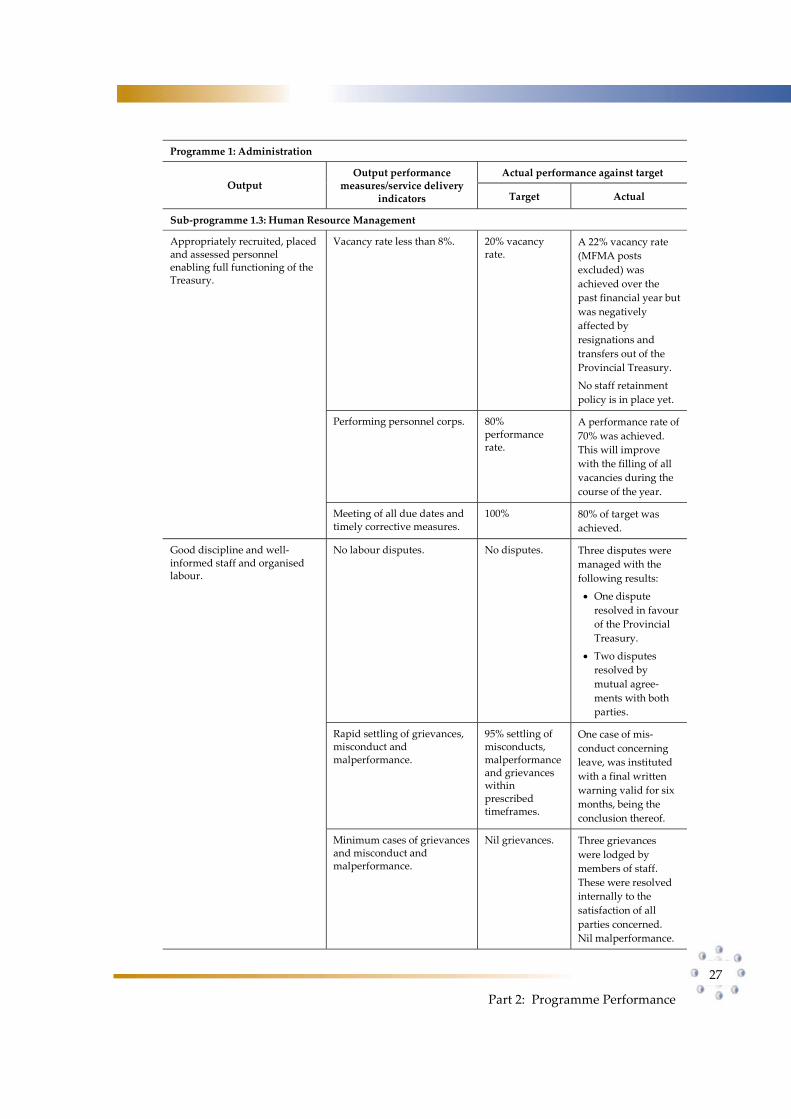
Sub-programme 1.3: Human Resource Management
Vacancy rate less than 8%. 20% vacancy rate.
A 22% vacancy rate
(MFMA posts
excluded) was
achieved over the
past financial year but
was negatively
affected by
resignations and
transfers out of the
Provincial Treasury.
No staff retainment
policy is in place yet.
Performing personnel corps. 80% performance rate.
A performance rate of
70% was achieved.
This will improve
with the filling of all
vacancies during the
course of the year.
Appropriately recruited, placed and assessed personnel enabling full functioning of the Treasury.
Meeting of all due dates and timely corrective measures.
100% 80% of target was
achieved.
No labour disputes. No disputes. Three disputes were
managed with the
following results:
One dispute
resolved in favour
of the Provincial
Treasury.
Two disputes
resolved by
mutual agree-
ments with both
parties.
Rapid settling of grievances, misconduct and malperformance.
95% settling of misconducts, malperformance and grievances within prescribed timeframes.
One case of mis-
conduct concerning
leave, was instituted
with a final written
warning valid for six
months, being the
conclusion thereof.
Good discipline and well-informed staff and organised labour.
Minimum cases of grievances and misconduct and malperformance.
Nil grievances. Three grievances
were lodged by
members of staff.
These were resolved
internally to the
satisfaction of all
parties concerned.
Nil malperformance.
28
Annual Report 2004/05
Programme 1: Administration
Actual performance against target Output
Output performance measures/service delivery
indicators Target Actual
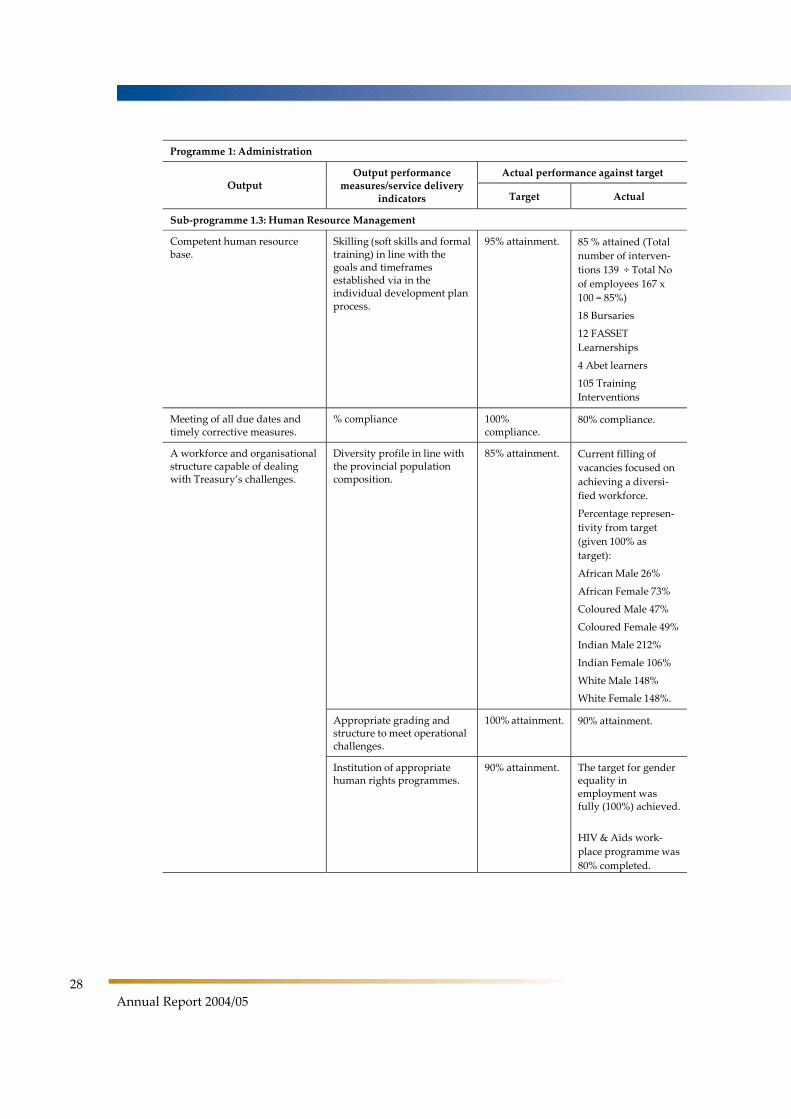
Sub-programme 1.3: Human Resource Management
Competent human resource base.
Skilling (soft skills and formal training) in line with the goals and timeframes established via in the individual development plan process.
95% attainment. 85 % attained (Total
number of interven-
tions 139 ÷ Total No
of employees 167 x
100 = 85%)
18 Bursaries
12 FASSET
Learnerships
4 Abet learners
105 Training
Interventions
Meeting of all due dates and timely corrective measures.
% compliance 100% compliance.
80% compliance.
Diversity profile in line with the provincial population composition.
85% attainment. Current filling of
vacancies focused on
achieving a diversi-
fied workforce.
Percentage represen-
tivity from target
(given 100% as
target):
African Male 26%
African Female 73%
Coloured Male 47%
Coloured Female 49%
Indian Male 212%
Indian Female 106%
White Male 148%
White Female 148%.
A workforce and organisational structure capable of dealing with Treasury’s challenges.
Appropriate grading and structure to meet operational challenges.
100% attainment. 90% attainment.
Institution of appropriate human rights programmes.
90% attainment. The target for gender equality in employment was fully (100%) achieved.
HIV & Aids work-
place programme was
80% completed.
Part 2: Programme Performance
29
2.2 Programme 2: Financial Governance Aim: To enhance performance orientated financial management.
Subprogramme 2.1 : Normative Financial Management and Communication
Purpose : To ensure that norms and standards within the legislative framework are developed, implemented and complied within provincial departments.
To develop, consolidate and maintain effective internal and external communication.
Measurable Objective
: Determination and implementation of financial management norms and standards to facilitate excellence in service delivery.
Ensuring the existence of an appropriate and dynamic financial legislative framework.
Effective internal and external communication system.
Service delivery achievements
: Compiled and drove the programme for the 2003/04 annual reporting process.
Progressive steps were taken to improve oversight by the executive and the Provincial Parliament through submissions and presentations on the content and outcome of annual reports.
Improved analysis and assessment of normative measures questionnaires and made recommendations to heads of components in the Provincial Treasury, Accounting Officers and Accounting Authorities to address shortcomings.
Analysis and follow-up of previous audit outcomes to prevent recurrence of reported deficiencies.
Coordinated provincial departments’ and Treasury responses, inclusive of own inputs, on PFMA, NTRs and other draft legislation.
Assessed cabinet submissions with financial normative implications and provided comments.
Rendered advice/comments on the interpretation of current financial legislation to departments, public entities and municipalities.
Performed an in-depth governance and financial management analysis of CASIDRA.
Actively participated in the establishment of new public entities.
Actively participated with drafting and implementation of the MFMA such as the development of a delegation framework for senior officials and political office bearers, monitoring of implementation requirements and provided interpretive guidance on MFMA enquiries.
30
Annual Report 2004/05
Subprogramme 2.1 : Normative Financial Management and Communication
Reasons for achieving targets
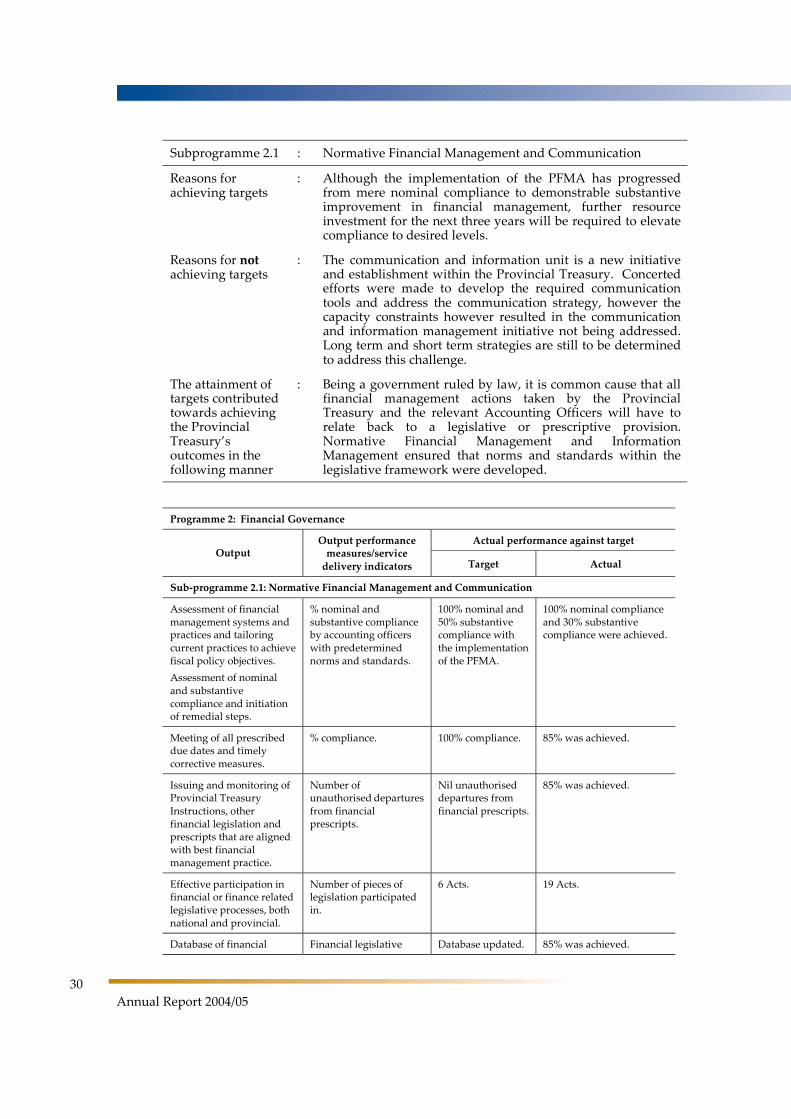
: Although the implementation of the PFMA has progressed from mere nominal compliance to demonstrable substantive improvement in financial management, further resource investment for the next three years will be required to elevate compliance to desired levels.
Reasons for notachieving targets
: The communication and information unit is a new initiative and establishment within the Provincial Treasury. Concerted efforts were made to develop the required communication tools and address the communication strategy, however the capacity constraints however resulted in the communication and information management initiative not being addressed. Long term and short term strategies are still to be determined to address this challenge.
The attainment of targets contributed towards achieving the Provincial Treasury’s outcomes in the following manner
: Being a government ruled by law, it is common cause that all financial management actions taken by the Provincial Treasury and the relevant Accounting Officers will have to relate back to a legislative or prescriptive provision. Normative Financial Management and Information Management ensured that norms and standards within the legislative framework were developed.
Programme 2: Financial Governance
Actual performance against target Output
Output performance measures/service
delivery indicators Target Actual
Sub-programme 2.1: Normative Financial Management and Communication
Assessment of financial management systems and practices and tailoring current practices to achieve fiscal policy objectives.
Assessment of nominal and substantive compliance and initiation of remedial steps.
% nominal and substantive compliance by accounting officers with predetermined norms and standards.
100% nominal and 50% substantive compliance with the implementation of the PFMA.
100% nominal compliance and 30% substantive compliance were achieved.
Meeting of all prescribed due dates and timely corrective measures.
% compliance. 100% compliance. 85% was achieved.
Issuing and monitoring of Provincial Treasury Instructions, other financial legislation and prescripts that are aligned with best financial management practice.
Number of unauthorised departures from financial prescripts.
Nil unauthorised departures from financial prescripts.
85% was achieved.
Effective participation in financial or finance related legislative processes, both national and provincial.
Number of pieces of legislation participated in.
6 Acts. 19 Acts.
Database of financial l l l d
Financial legislative d b
Database updated. 85% was achieved.
Part 2: Programme Performance
31
Programme 2: Financial Governance
Actual performance against target Output
Output performance measures/service
delivery indicators Target Actual
Sub-programme 2.1: Normative Financial Management and Communication
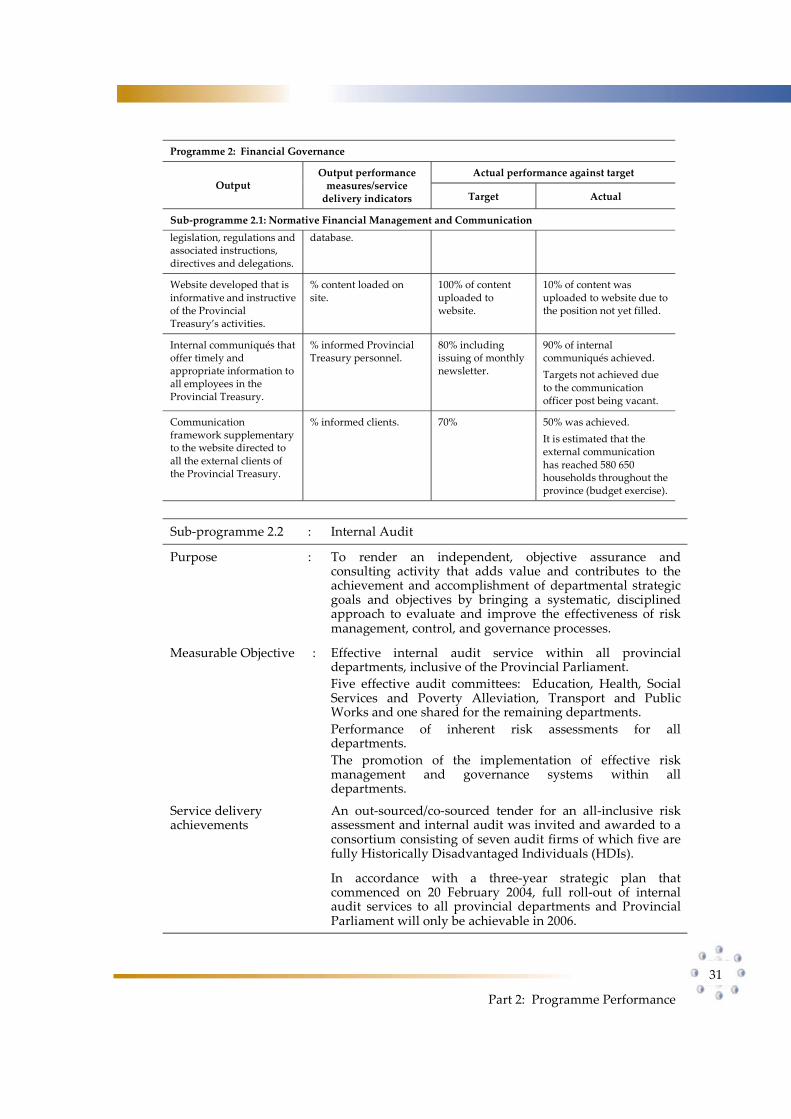
legislation, regulations and associated instructions, directives and delegations.
database.
Website developed that is informative and instructive of the Provincial Treasury’s activities.
% content loaded on site.
100% of content uploaded to website.
10% of content was uploaded to website due to the position not yet filled.
Internal communiqués that offer timely and appropriate information to all employees in the Provincial Treasury.
% informed Provincial Treasury personnel.
80% including issuing of monthly newsletter.
90% of internal communiqués achieved.
Targets not achieved due to the communication officer post being vacant.
Communication framework supplementary to the website directed to all the external clients of the Provincial Treasury.
% informed clients. 70% 50% was achieved.
It is estimated that the external communication has reached 580 650 households throughout the province (budget exercise).
Sub-programme 2.2 : Internal Audit
Purpose : To render an independent, objective assurance and consulting activity that adds value and contributes to the achievement and accomplishment of departmental strategic goals and objectives by bringing a systematic, disciplined approach to evaluate and improve the effectiveness of risk management, control, and governance processes.
Measurable Objective : Effective internal audit service within all provincial departments, inclusive of the Provincial Parliament.
Five effective audit committees: Education, Health, Social Services and Poverty Alleviation, Transport and Public Works and one shared for the remaining departments.
Performance of inherent risk assessments for all departments.
The promotion of the implementation of effective risk management and governance systems within all departments.
Service delivery achievements
An out-sourced/co-sourced tender for an all-inclusive risk assessment and internal audit was invited and awarded to a consortium consisting of seven audit firms of which five are fully Historically Disadvantaged Individuals (HDIs).
In accordance with a three-year strategic plan that commenced on 20 February 2004, full roll-out of internal audit services to all provincial departments and Provincial Parliament will only be achievable in 2006.
32
Annual Report 2004/05
Sub-programme 2.2 : Internal Audit
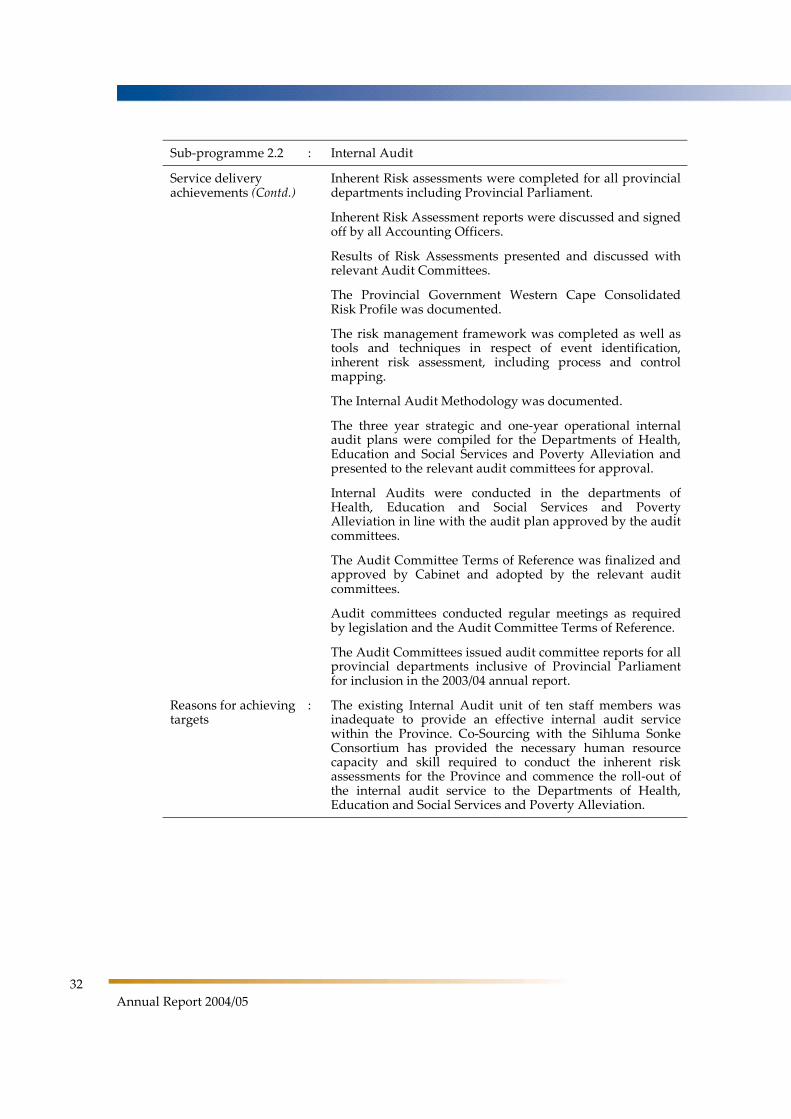
Service delivery achievements (Contd.)
Inherent Risk assessments were completed for all provincial departments including Provincial Parliament.
Inherent Risk Assessment reports were discussed and signed off by all Accounting Officers.
Results of Risk Assessments presented and discussed with relevant Audit Committees.
The Provincial Government Western Cape Consolidated Risk Profile was documented.
The risk management framework was completed as well as tools and techniques in respect of event identification, inherent risk assessment, including process and control mapping.
The Internal Audit Methodology was documented.
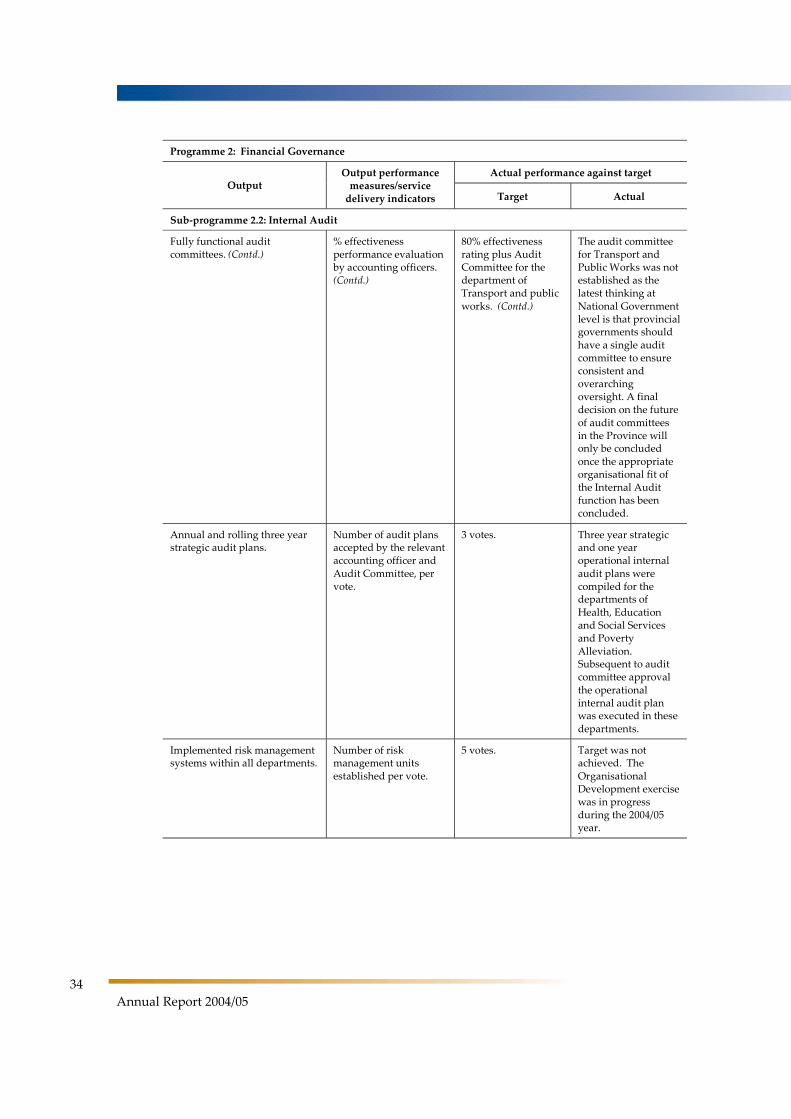
The three year strategic and one-year operational internal audit plans were compiled for the Departments of Health, Education and Social Services and Poverty Alleviation and presented to the relevant audit committees for approval.
Internal Audits were conducted in the departments of Health, Education and Social Services and Poverty Alleviation in line with the audit plan approved by the audit committees.
The Audit Committee Terms of Reference was finalized and approved by Cabinet and adopted by the relevant audit committees.
Audit committees conducted regular meetings as required by legislation and the Audit Committee Terms of Reference.
The Audit Committees issued audit committee reports for all provincial departments inclusive of Provincial Parliament for inclusion in the 2003/04 annual report.
Reasons for achieving targets
: The existing Internal Audit unit of ten staff members was inadequate to provide an effective internal audit service within the Province. Co-Sourcing with the Sihluma Sonke Consortium has provided the necessary human resource capacity and skill required to conduct the inherent risk assessments for the Province and commence the roll-out of the internal audit service to the Departments of Health, Education and Social Services and Poverty Alleviation.
Part 2: Programme Performance
33
Sub-programme 2.2 : Internal Audit
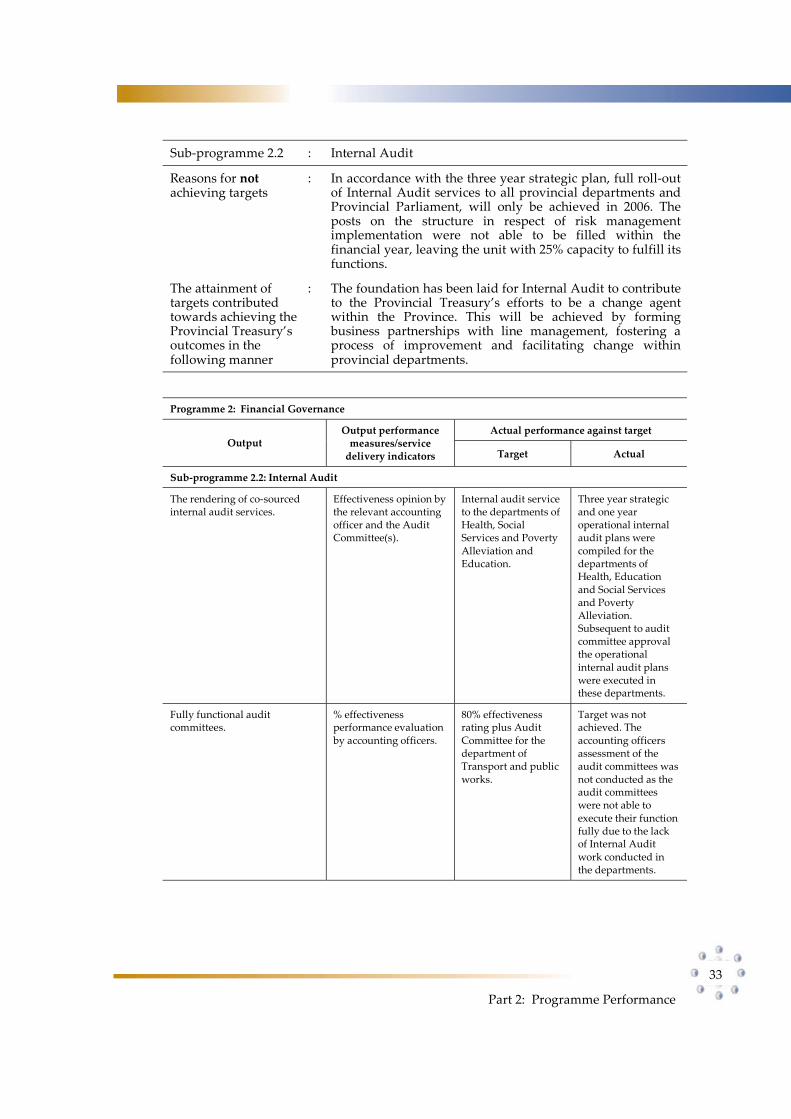
Reasons for notachieving targets
: In accordance with the three year strategic plan, full roll-out of Internal Audit services to all provincial departments and Provincial Parliament, will only be achieved in 2006. The posts on the structure in respect of risk management implementation were not able to be filled within the financial year, leaving the unit with 25% capacity to fulfill its functions.
The attainment of targets contributed towards achieving the Provincial Treasury’s outcomes in the following manner
: The foundation has been laid for Internal Audit to contribute to the Provincial Treasury’s efforts to be a change agent within the Province. This will be achieved by forming business partnerships with line management, fostering a process of improvement and facilitating change within provincial departments.
Programme 2: Financial Governance
Actual performance against target Output
Output performance measures/service
delivery indicators Target Actual
Sub-programme 2.2: Internal Audit
The rendering of co-sourced internal audit services.
Effectiveness opinion by the relevant accounting officer and the Audit Committee(s).
Internal audit service to the departments of Health, Social Services and Poverty Alleviation and Education.
Three year strategic and one year operational internal audit plans were compiled for the departments of Health, Education and Social Services and Poverty Alleviation. Subsequent to audit committee approval the operational internal audit plans were executed in these departments.
Fully functional audit committees.
% effectiveness performance evaluation by accounting officers.
80% effectiveness rating plus Audit Committee for the department of Transport and public works.
Target was not achieved. The accounting officers assessment of the audit committees was not conducted as the audit committees were not able to execute their function fully due to the lack of Internal Audit work conducted in the departments.
34
Annual Report 2004/05
Programme 2: Financial Governance
Actual performance against target Output
Output performance measures/service
delivery indicators Target Actual
Sub-programme 2.2: Internal Audit
Fully functional audit committees. (Contd.)
% effectiveness performance evaluation by accounting officers. (Contd.)
80% effectiveness rating plus Audit Committee for the department of Transport and public works. (Contd.)
The audit committee for Transport and Public Works was not established as the latest thinking at National Government level is that provincial governments should have a single audit committee to ensure consistent and overarching oversight. A final decision on the future of audit committees in the Province will only be concluded once the appropriate organisational fit of the Internal Audit function has been concluded.
Annual and rolling three year strategic audit plans.
Number of audit plans accepted by the relevant accounting officer and Audit Committee, per vote.
3 votes. Three year strategic and one year operational internal audit plans were compiled for the departments of Health, Education and Social Services and Poverty Alleviation. Subsequent to audit committee approval the operational internal audit plan was executed in these departments.
Implemented risk management systems within all departments.
Number of risk management units established per vote.
5 votes. Target was not achieved. The Organisational Development exercise was in progress during the 2004/05 year.
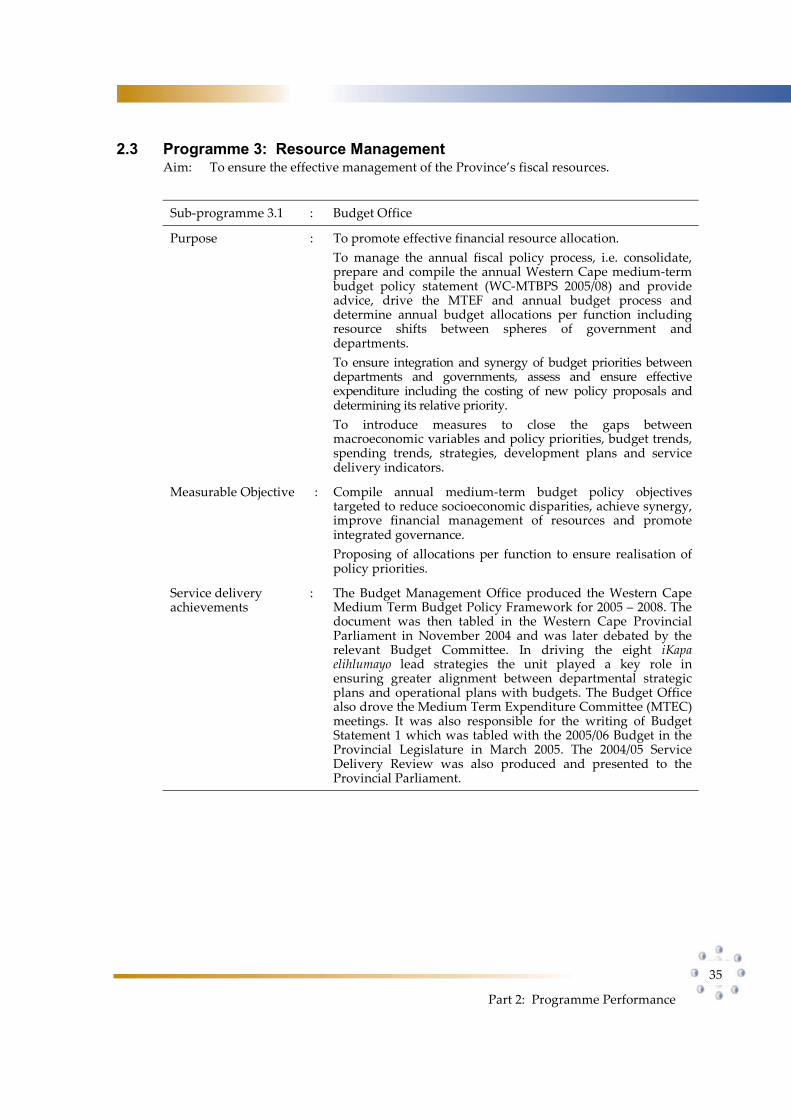
Part 2: Programme Performance
35
2.3 Programme 3: Resource Management Aim: To ensure the effective management of the Province’s fiscal resources.
Sub-programme 3.1 : Budget Office
Purpose : To promote effective financial resource allocation.
To manage the annual fiscal policy process, i.e. consolidate, prepare and compile the annual Western Cape medium-term budget policy statement (WC-MTBPS 2005/08) and provide advice, drive the MTEF and annual budget process and determine annual budget allocations per function including resource shifts between spheres of government and departments.
To ensure integration and synergy of budget priorities between departments and governments, assess and ensure effective expenditure including the costing of new policy proposals and determining its relative priority.
To introduce measures to close the gaps between macroeconomic variables and policy priorities, budget trends, spending trends, strategies, development plans and service delivery indicators.
Measurable Objective : Compile annual medium-term budget policy objectives targeted to reduce socioeconomic disparities, achieve synergy, improve financial management of resources and promote integrated governance.
Proposing of allocations per function to ensure realisation of policy priorities.
Service delivery achievements
: The Budget Management Office produced the Western Cape Medium Term Budget Policy Framework for 2005 – 2008. The document was then tabled in the Western Cape Provincial Parliament in November 2004 and was later debated by the relevant Budget Committee. In driving the eight iKapa elihlumayo lead strategies the unit played a key role in ensuring greater alignment between departmental strategic plans and operational plans with budgets. The Budget Office also drove the Medium Term Expenditure Committee (MTEC) meetings. It was also responsible for the writing of Budget Statement 1 which was tabled with the 2005/06 Budget in the Provincial Legislature in March 2005. The 2004/05 Service Delivery Review was also produced and presented to the Provincial Parliament.
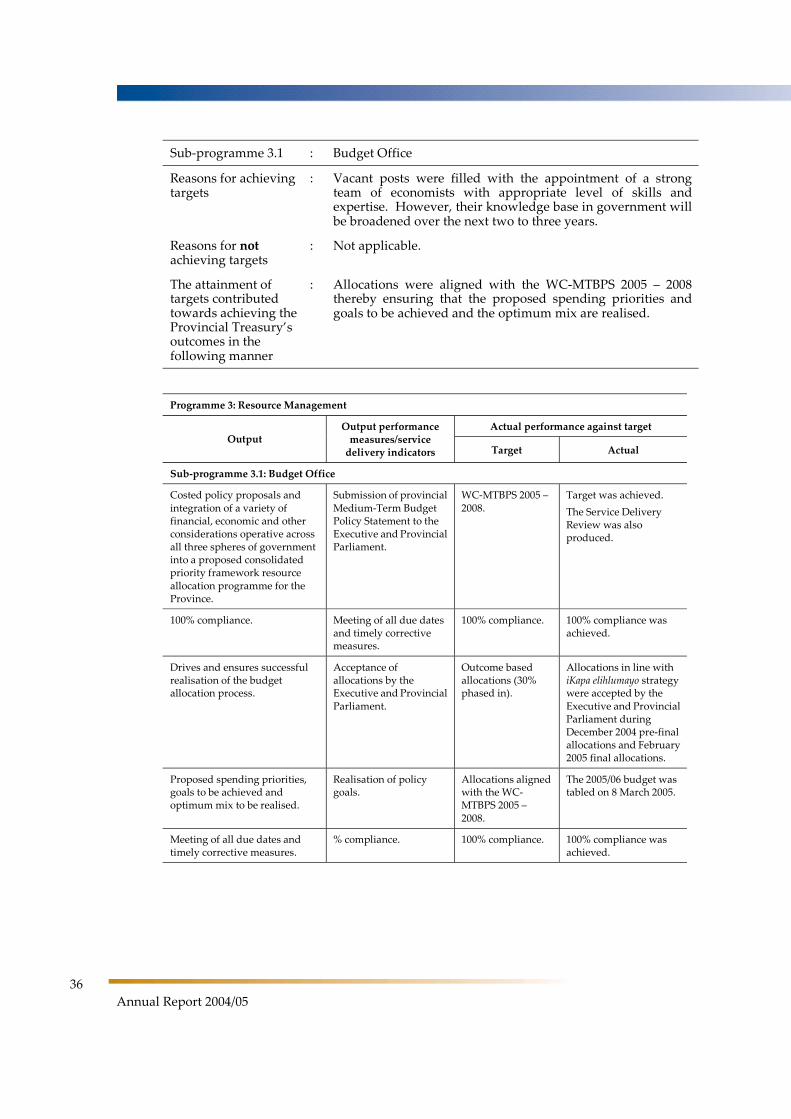
36
Annual Report 2004/05
Sub-programme 3.1 : Budget Office
Reasons for achieving targets
: Vacant posts were filled with the appointment of a strong team of economists with appropriate level of skills and expertise. However, their knowledge base in government will be broadened over the next two to three years.
Reasons for notachieving targets
: Not applicable.
The attainment of targets contributed towards achieving the Provincial Treasury’s outcomes in the following manner
: Allocations were aligned with the WC-MTBPS 2005 – 2008 thereby ensuring that the proposed spending priorities and goals to be achieved and the optimum mix are realised.
Programme 3: Resource Management
Actual performance against target Output
Output performance measures/service
delivery indicators Target Actual
Sub-programme 3.1: Budget Office
Costed policy proposals and integration of a variety of financial, economic and other considerations operative across all three spheres of government into a proposed consolidated priority framework resource allocation programme for the Province.
Submission of provincial Medium-Term Budget Policy Statement to the Executive and Provincial Parliament.
WC-MTBPS 2005 – 2008.
Target was achieved.
The Service Delivery Review was also produced.
100% compliance. Meeting of all due dates and timely corrective measures.
100% compliance. 100% compliance was achieved.
Drives and ensures successful realisation of the budget allocation process.
Acceptance of allocations by the Executive and Provincial Parliament.
Outcome based allocations (30% phased in).
Allocations in line with iKapa elihlumayo strategy were accepted by the Executive and Provincial Parliament during December 2004 pre-final allocations and February 2005 final allocations.
Proposed spending priorities, goals to be achieved and optimum mix to be realised.
Realisation of policy goals.
Allocations aligned with the WC-MTBPS 2005 – 2008.
The 2005/06 budget was tabled on 8 March 2005.
Meeting of all due dates and timely corrective measures.
% compliance. 100% compliance. 100% compliance was achieved.
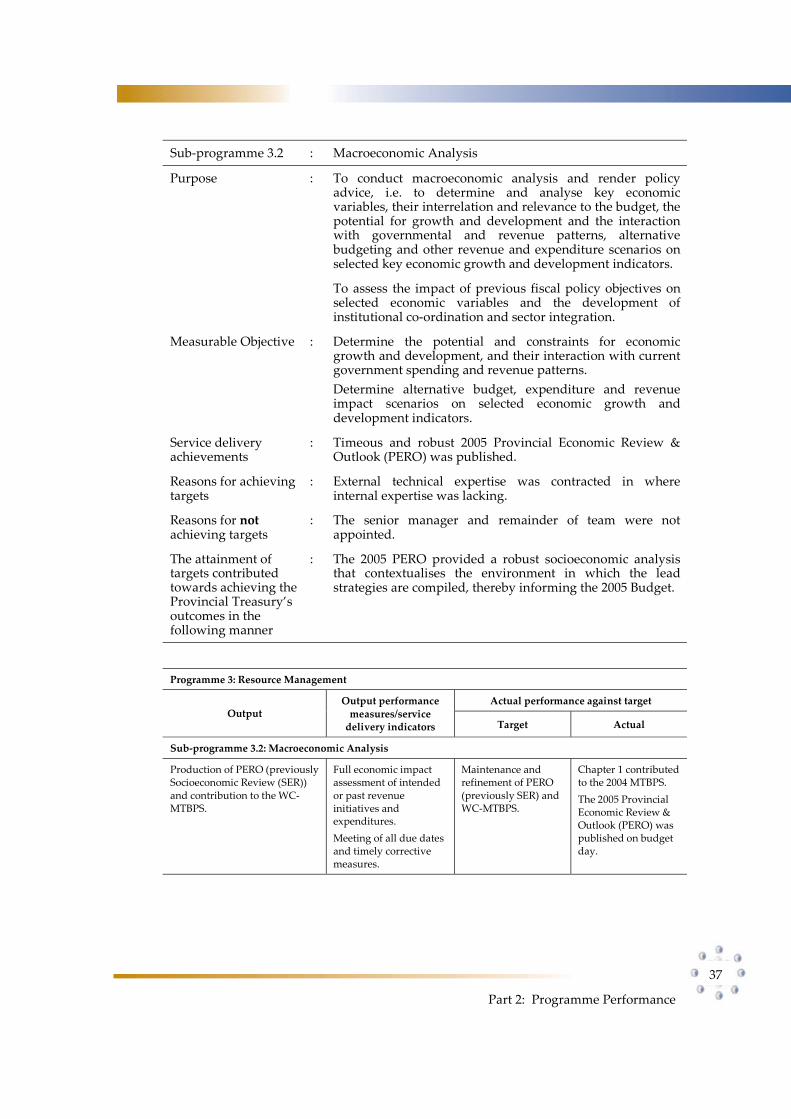
Part 2: Programme Performance
37
Sub-programme 3.2 : Macroeconomic Analysis
Purpose : To conduct macroeconomic analysis and render policy advice, i.e. to determine and analyse key economic variables, their interrelation and relevance to the budget, the potential for growth and development and the interaction with governmental and revenue patterns, alternative budgeting and other revenue and expenditure scenarios on selected key economic growth and development indicators.
To assess the impact of previous fiscal policy objectives on selected economic variables and the development of institutional co-ordination and sector integration.
Measurable Objective : Determine the potential and constraints for economic growth and development, and their interaction with current government spending and revenue patterns.
Determine alternative budget, expenditure and revenue impact scenarios on selected economic growth and development indicators.
Service delivery achievements
: Timeous and robust 2005 Provincial Economic Review & Outlook (PERO) was published.
Reasons for achieving targets
: External technical expertise was contracted in where internal expertise was lacking.
Reasons for notachieving targets
: The senior manager and remainder of team were not appointed.
The attainment of targets contributed towards achieving the Provincial Treasury’s outcomes in the following manner
: The 2005 PERO provided a robust socioeconomic analysis that contextualises the environment in which the lead strategies are compiled, thereby informing the 2005 Budget.
Programme 3: Resource Management
Actual performance against target Output
Output performance measures/service
delivery indicators Target Actual
Sub-programme 3.2: Macroeconomic Analysis
Production of PERO (previously Socioeconomic Review (SER)) and contribution to the WC-MTBPS.
Full economic impact assessment of intended or past revenue initiatives and expenditures.
Meeting of all due dates and timely corrective measures.
Maintenance and refinement of PERO (previously SER) and WC-MTBPS.
Chapter 1 contributed to the 2004 MTBPS.
The 2005 Provincial Economic Review & Outlook (PERO) was published on budget day.
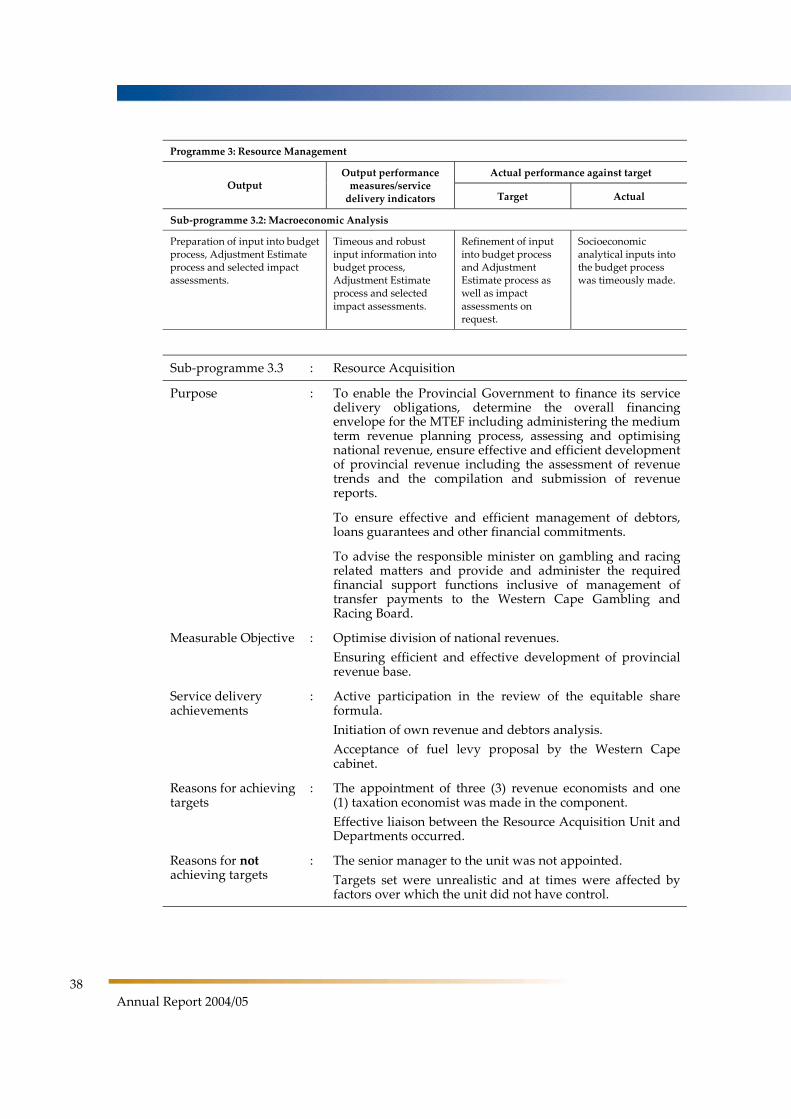
38
Annual Report 2004/05
Programme 3: Resource Management
Actual performance against target Output
Output performance measures/service
delivery indicators Target Actual
Sub-programme 3.2: Macroeconomic Analysis
Preparation of input into budget process, Adjustment Estimate process and selected impact assessments.
Timeous and robust input information into budget process, Adjustment Estimate process and selected impact assessments.
Refinement of input into budget process and Adjustment Estimate process as well as impact assessments on request.
Socioeconomic analytical inputs into the budget process was timeously made.
Sub-programme 3.3 : Resource Acquisition
Purpose : To enable the Provincial Government to finance its service delivery obligations, determine the overall financing envelope for the MTEF including administering the medium term revenue planning process, assessing and optimising national revenue, ensure effective and efficient development of provincial revenue including the assessment of revenue trends and the compilation and submission of revenue reports.
To ensure effective and efficient management of debtors, loans guarantees and other financial commitments.
To advise the responsible minister on gambling and racing related matters and provide and administer the required financial support functions inclusive of management of transfer payments to the Western Cape Gambling and Racing Board.
Measurable Objective : Optimise division of national revenues.
Ensuring efficient and effective development of provincial revenue base.
Service delivery achievements
: Active participation in the review of the equitable share formula.
Initiation of own revenue and debtors analysis.
Acceptance of fuel levy proposal by the Western Cape cabinet.
Reasons for achieving targets
: The appointment of three (3) revenue economists and one (1) taxation economist was made in the component.
Effective liaison between the Resource Acquisition Unit and Departments occurred.
Reasons for notachieving targets
: The senior manager to the unit was not appointed.
Targets set were unrealistic and at times were affected by factors over which the unit did not have control.
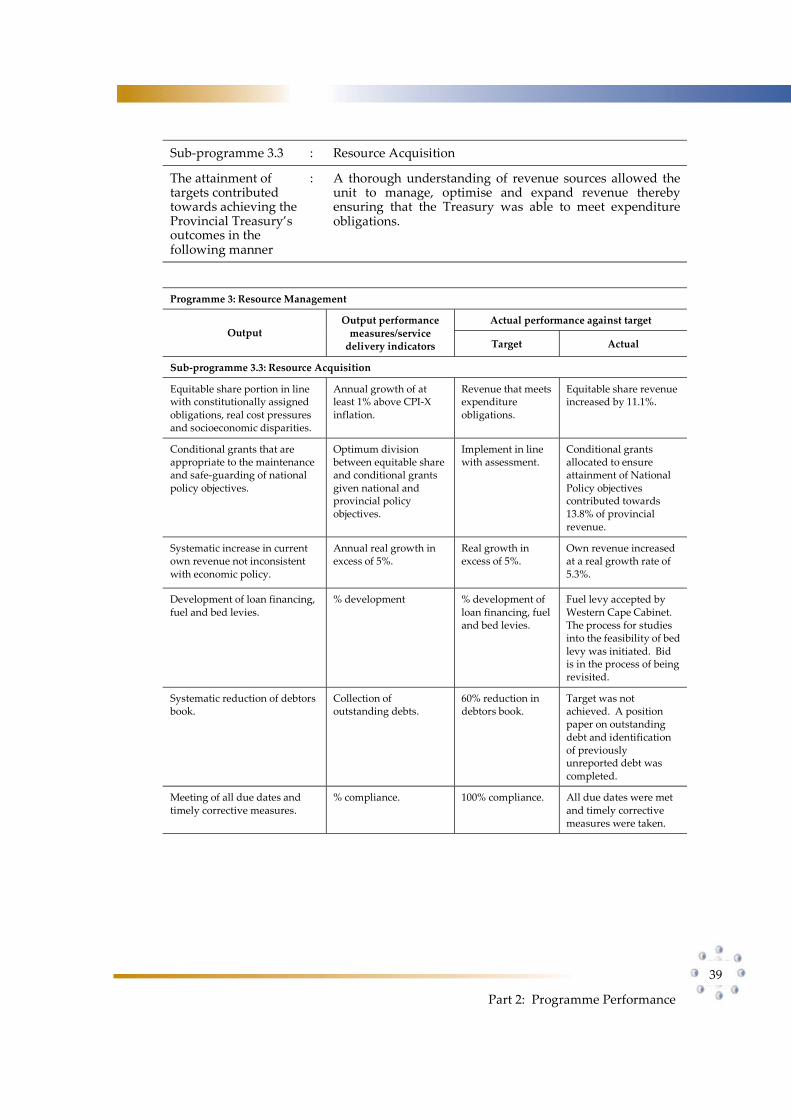
Part 2: Programme Performance
39
Sub-programme 3.3 : Resource Acquisition
The attainment of targets contributed towards achieving the Provincial Treasury’s outcomes in the following manner
: A thorough understanding of revenue sources allowed the unit to manage, optimise and expand revenue thereby ensuring that the Treasury was able to meet expenditure obligations.
Programme 3: Resource Management
Actual performance against target Output
Output performance measures/service
delivery indicators Target Actual
Sub-programme 3.3: Resource Acquisition
Equitable share portion in line with constitutionally assigned obligations, real cost pressures and socioeconomic disparities.
Annual growth of at least 1% above CPI-X inflation.
Revenue that meets expenditure obligations.
Equitable share revenue increased by 11.1%.
Conditional grants that are appropriate to the maintenance and safe-guarding of national policy objectives.
Optimum division between equitable share and conditional grants given national and provincial policy objectives.
Implement in line with assessment.
Conditional grants allocated to ensure attainment of National Policy objectives contributed towards 13.8% of provincial revenue.
Systematic increase in current own revenue not inconsistent with economic policy.
Annual real growth in excess of 5%.
Real growth in excess of 5%.
Own revenue increased at a real growth rate of 5.3%.
Development of loan financing, fuel and bed levies.
% development % development of loan financing, fuel and bed levies.
Fuel levy accepted by Western Cape Cabinet. The process for studies into the feasibility of bed levy was initiated. Bid is in the process of being revisited.
Systematic reduction of debtors book.
Collection of outstanding debts.
60% reduction in debtors book.
Target was not achieved. A position paper on outstanding debt and identification of previously unreported debt was completed.
Meeting of all due dates and timely corrective measures.
% compliance. 100% compliance. All due dates were met and timely corrective measures were taken.
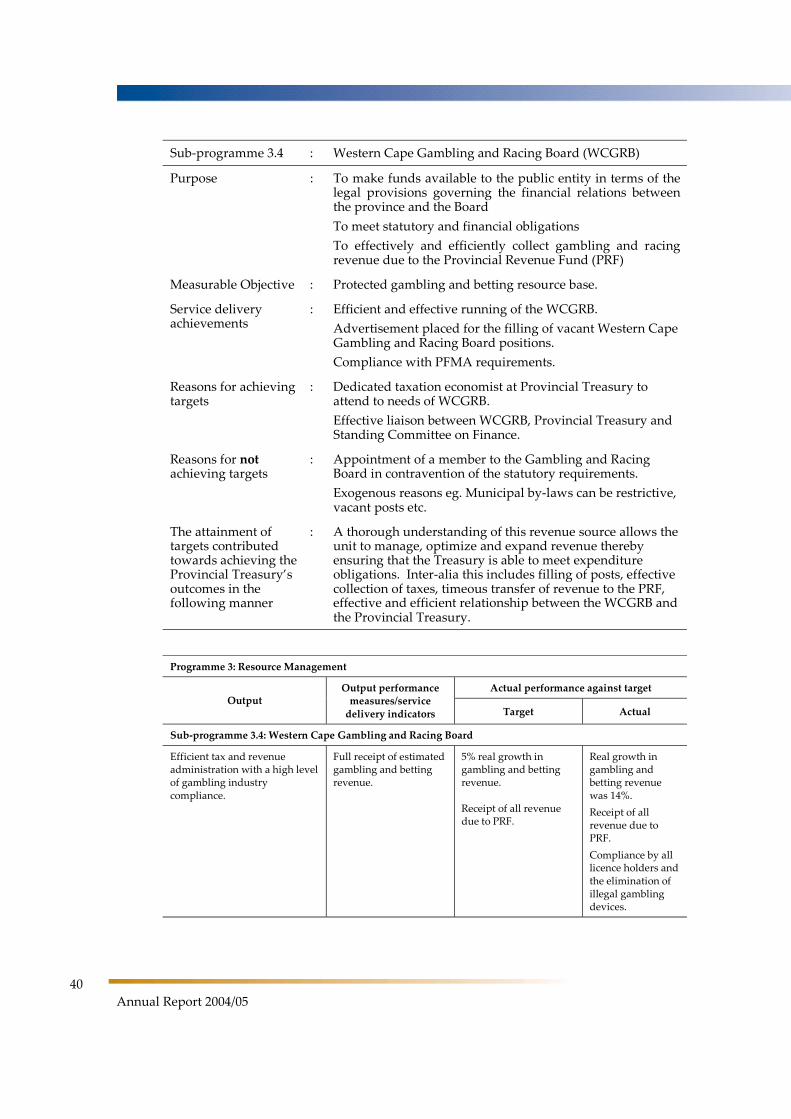
40
Annual Report 2004/05
Sub-programme 3.4 : Western Cape Gambling and Racing Board (WCGRB)
Purpose : To make funds available to the public entity in terms of the legal provisions governing the financial relations between the province and the Board
To meet statutory and financial obligations
To effectively and efficiently collect gambling and racing revenue due to the Provincial Revenue Fund (PRF)
Measurable Objective : Protected gambling and betting resource base.
Service delivery achievements
: Efficient and effective running of the WCGRB.
Advertisement placed for the filling of vacant Western Cape Gambling and Racing Board positions.
Compliance with PFMA requirements.
Reasons for achieving targets
: Dedicated taxation economist at Provincial Treasury to attend to needs of WCGRB.
Effective liaison between WCGRB, Provincial Treasury and Standing Committee on Finance.
Reasons for notachieving targets
: Appointment of a member to the Gambling and Racing Board in contravention of the statutory requirements.
Exogenous reasons eg. Municipal by-laws can be restrictive, vacant posts etc.
The attainment of targets contributed towards achieving the Provincial Treasury’s outcomes in the following manner
: A thorough understanding of this revenue source allows the unit to manage, optimize and expand revenue thereby ensuring that the Treasury is able to meet expenditure obligations. Inter-alia this includes filling of posts, effective collection of taxes, timeous transfer of revenue to the PRF, effective and efficient relationship between the WCGRB and the Provincial Treasury.
Programme 3: Resource Management
Actual performance against target Output
Output performance measures/service
delivery indicators Target Actual
Sub-programme 3.4: Western Cape Gambling and Racing Board
Efficient tax and revenue administration with a high level of gambling industry compliance.
Full receipt of estimated gambling and betting revenue.
5% real growth in gambling and betting revenue.
Receipt of all revenue due to PRF.
Real growth in gambling and betting revenue was 14%.
Receipt of all revenue due to PRF.
Compliance by all licence holders and the elimination of illegal gambling devices.
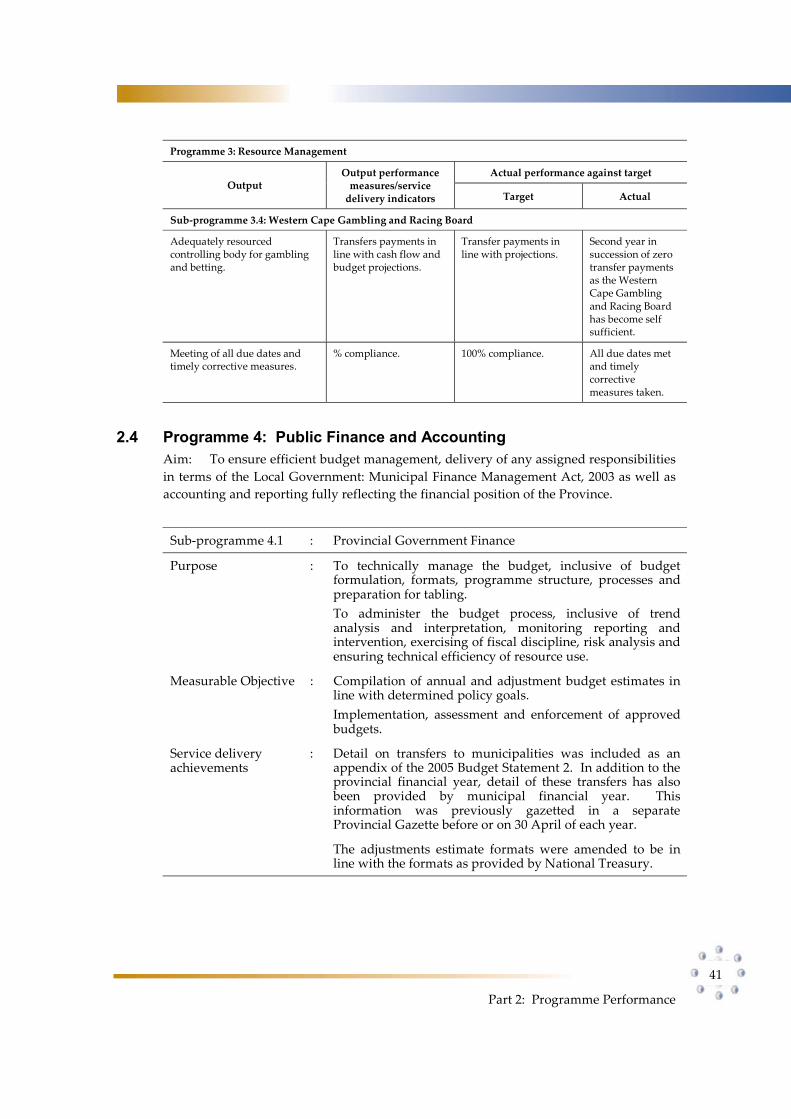
Part 2: Programme Performance
41
Programme 3: Resource Management
Actual performance against target Output
Output performance measures/service
delivery indicators Target Actual
Sub-programme 3.4: Western Cape Gambling and Racing Board
Adequately resourced controlling body for gambling and betting.
Transfers payments in line with cash flow and budget projections.
Transfer payments in line with projections.
Second year in succession of zero transfer payments as the Western Cape Gambling and Racing Board has become self sufficient.
Meeting of all due dates and timely corrective measures.
% compliance. 100% compliance. All due dates met and timely corrective measures taken.
2.4 Programme 4: Public Finance and Accounting Aim: To ensure efficient budget management, delivery of any assigned responsibilities
in terms of the Local Government: Municipal Finance Management Act, 2003 as well as
accounting and reporting fully reflecting the financial position of the Province.
Sub-programme 4.1 : Provincial Government Finance
Purpose : To technically manage the budget, inclusive of budget formulation, formats, programme structure, processes and preparation for tabling.
To administer the budget process, inclusive of trend analysis and interpretation, monitoring reporting and intervention, exercising of fiscal discipline, risk analysis and ensuring technical efficiency of resource use.
Measurable Objective : Compilation of annual and adjustment budget estimates in line with determined policy goals.
Implementation, assessment and enforcement of approved budgets.
Service delivery achievements
: Detail on transfers to municipalities was included as an appendix of the 2005 Budget Statement 2. In addition to the provincial financial year, detail of these transfers has also been provided by municipal financial year. This information was previously gazetted in a separate Provincial Gazette before or on 30 April of each year.
The adjustments estimate formats were amended to be in line with the formats as provided by National Treasury.
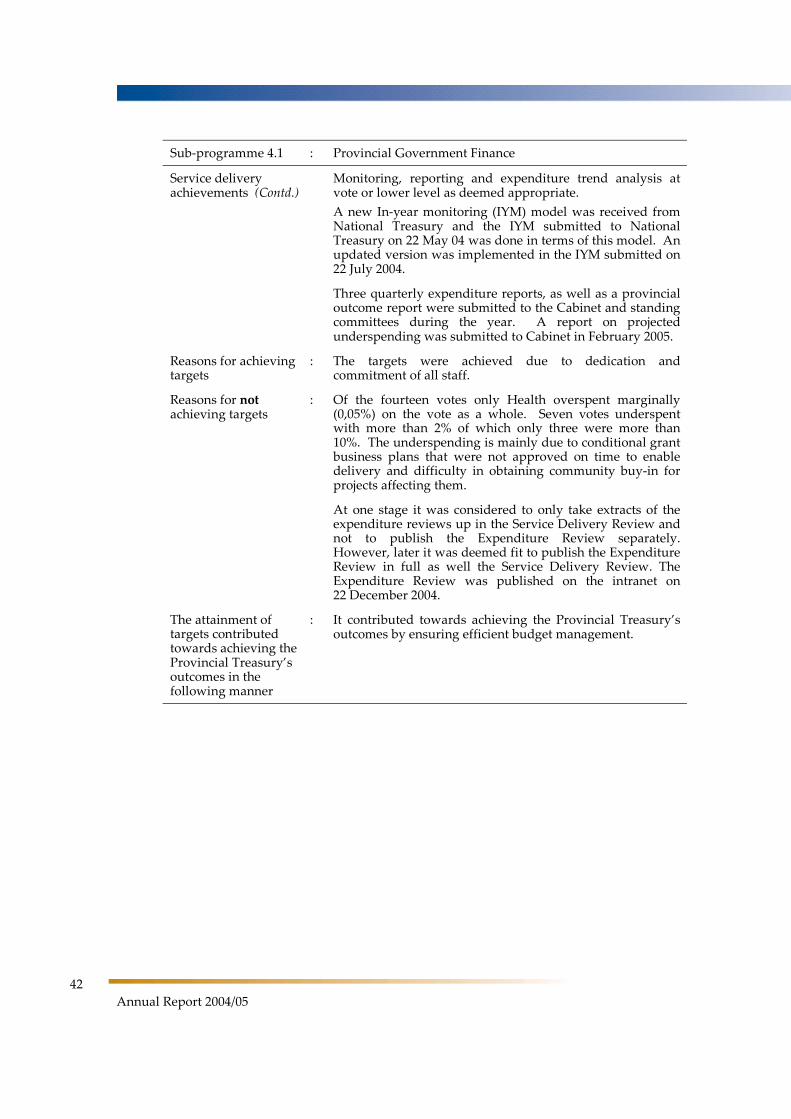
42
Annual Report 2004/05
Sub-programme 4.1 : Provincial Government Finance
Service delivery achievements (Contd.)
Monitoring, reporting and expenditure trend analysis at vote or lower level as deemed appropriate.
A new In-year monitoring (IYM) model was received from National Treasury and the IYM submitted to National Treasury on 22 May 04 was done in terms of this model. An updated version was implemented in the IYM submitted on 22 July 2004.
Three quarterly expenditure reports, as well as a provincial outcome report were submitted to the Cabinet and standing committees during the year. A report on projected underspending was submitted to Cabinet in February 2005.
Reasons for achieving targets
: The targets were achieved due to dedication and commitment of all staff.
Reasons for notachieving targets
: Of the fourteen votes only Health overspent marginally (0,05%) on the vote as a whole. Seven votes underspent with more than 2% of which only three were more than 10%. The underspending is mainly due to conditional grant business plans that were not approved on time to enable delivery and difficulty in obtaining community buy-in for projects affecting them.
At one stage it was considered to only take extracts of the expenditure reviews up in the Service Delivery Review and not to publish the Expenditure Review separately. However, later it was deemed fit to publish the Expenditure Review in full as well the Service Delivery Review. The Expenditure Review was published on the intranet on 22 December 2004.
The attainment of targets contributed towards achieving the Provincial Treasury’s outcomes in the following manner
: It contributed towards achieving the Provincial Treasury’s outcomes by ensuring efficient budget management.
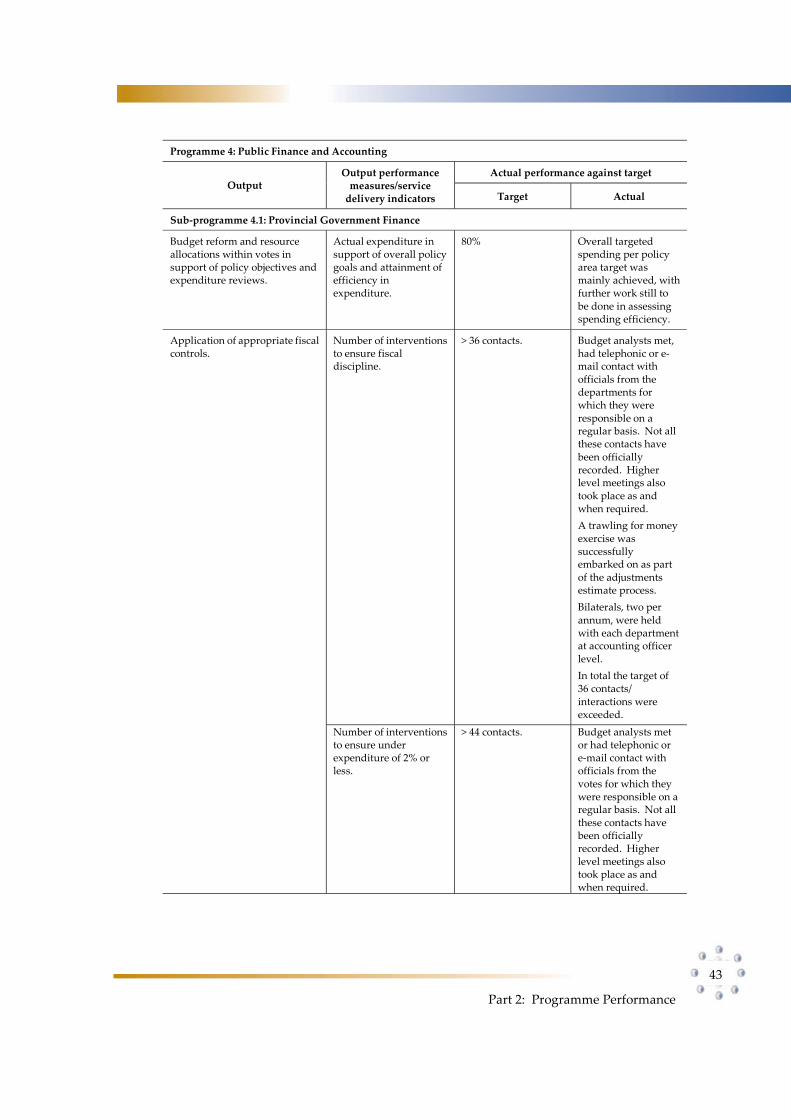
Part 2: Programme Performance
43
Programme 4: Public Finance and Accounting
Actual performance against target Output
Output performance measures/service
delivery indicators Target Actual
Sub-programme 4.1: Provincial Government Finance
Budget reform and resource allocations within votes in support of policy objectives and expenditure reviews.
Actual expenditure in support of overall policy goals and attainment of efficiency in expenditure.
80% Overall targeted spending per policy area target was mainly achieved, with further work still to be done in assessing spending efficiency.
Application of appropriate fiscal controls.
Number of interventions to ensure fiscal discipline.
> 36 contacts. Budget analysts met, had telephonic or e-mail contact with officials from the departments for which they were responsible on a regular basis. Not all these contacts have been officially recorded. Higher level meetings also took place as and when required.
A trawling for money exercise was successfully embarked on as part of the adjustments estimate process.
Bilaterals, two per annum, were held with each department at accounting officer level.
In total the target of 36 contacts/ interactions were exceeded.
Number of interventions to ensure under expenditure of 2% or less.
> 44 contacts. Budget analysts met or had telephonic or e-mail contact with officials from the votes for which they were responsible on a regular basis. Not all these contacts have been officially recorded. Higher level meetings also took place as and when required.
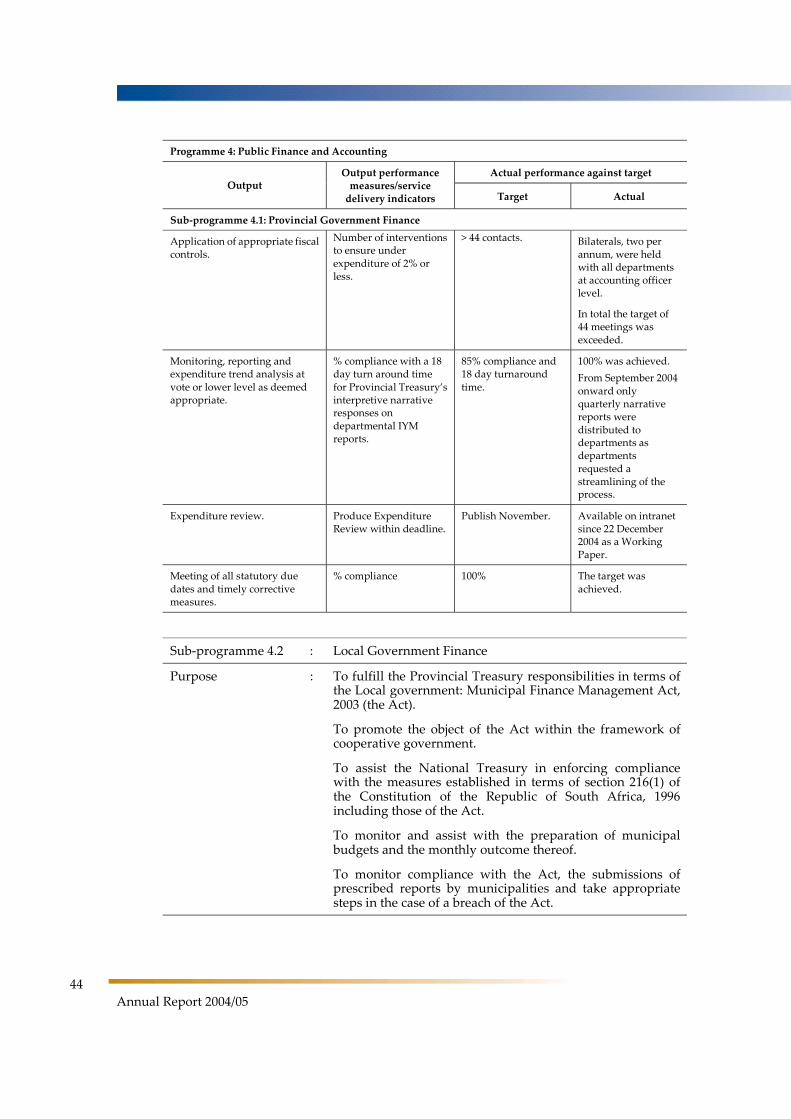
44
Annual Report 2004/05
Programme 4: Public Finance and Accounting
Actual performance against target Output
Output performance measures/service
delivery indicators Target Actual
Sub-programme 4.1: Provincial Government Finance
Application of appropriate fiscal controls.
Number of interventions to ensure under expenditure of 2% or less.
> 44 contacts. Bilaterals, two per annum, were held with all departments at accounting officer level.
In total the target of 44 meetings was exceeded.
Monitoring, reporting and expenditure trend analysis at vote or lower level as deemed appropriate.
% compliance with a 18 day turn around time for Provincial Treasury’s interpretive narrative responses on departmental IYM reports.
85% compliance and 18 day turnaround time.
100% was achieved.
From September 2004 onward only quarterly narrative reports were distributed to departments as departments requested a streamlining of the process.
Expenditure review. Produce Expenditure Review within deadline.
Publish November. Available on intranet since 22 December 2004 as a Working Paper.
Meeting of all statutory due dates and timely corrective measures.
% compliance 100% The target was achieved.
Sub-programme 4.2 : Local Government Finance
Purpose : To fulfill the Provincial Treasury responsibilities in terms of the Local government: Municipal Finance Management Act, 2003 (the Act).
To promote the object of the Act within the framework of cooperative government.
To assist the National Treasury in enforcing compliance with the measures established in terms of section 216(1) of the Constitution of the Republic of South Africa, 1996 including those of the Act.
To monitor and assist with the preparation of municipal budgets and the monthly outcome thereof.
To monitor compliance with the Act, the submissions of prescribed reports by municipalities and take appropriate steps in the case of a breach of the Act.

Part 2: Programme Performance
45
Sub-programme 4.2 : Local Government Finance
Purpose (Contd.) To perform any powers and duties delegated by the National Treasury to the Provincial Treasury.
Measurable Objective : Alignment between municipal integrated development plans and service delivery and provincial budgeting processes and service delivery.
Establishment of managerial and coordinating intergovernmental structures related to financial matters.
Fulfilment of the Provincial Treasury responsibilities of the Local Government: Municipal Finance Management Act, 2003.
Service delivery achievements
: Providing a platform for the interaction between provincial and local government finance office bearers, the establishment of a Municipal Chief Financial Officer’s forum, including the terms of reference, has been consulted with municipalities and agreed to.
A fully functioning MFMA Implementation Unit, which is a sub committee of the provincial CFO Forum, incorporates all the disciplines within the Provincial Treasury, aimed at coordinating and communicating MFMA related issues.
Extensive interaction with the Department of Local Government taking into consideration the interrelation between their roles and responsibilities in terms of the MFMA and that of the Provincial Treasury’s, in respect of the future planning and coordination of the MFMA process.
The official launch of the MFMA in the Province.
Conducted province wide workshops with municipalities on the implementation of the MFMA.
Supported and assisted National Treasury to get municipalities to conform to new prescribed processes and formats in pursuance of the implementation of the MFMA.
Assisted municipalities and provided guidance on the implementation of the MFMA.
An approved MFMA staff establishment to provide for the new treasury roles and responsibilities.
A dedicated MFMA email address.
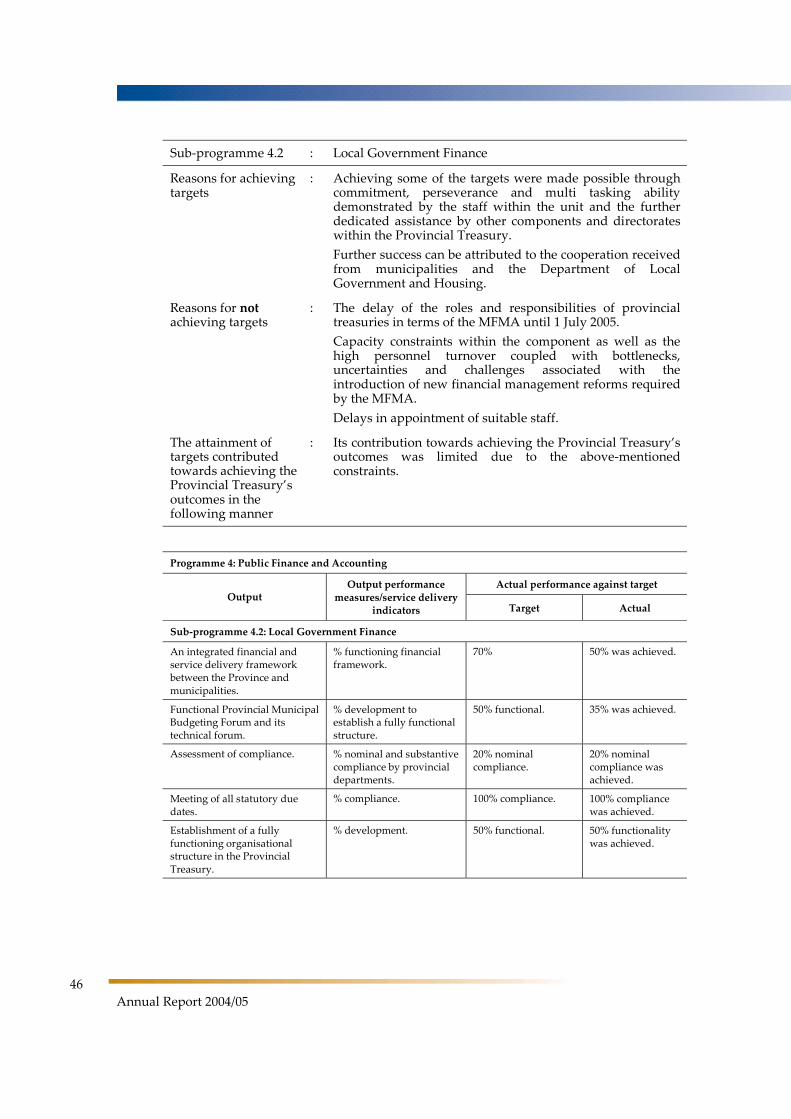
46
Annual Report 2004/05
Sub-programme 4.2 : Local Government Finance
Reasons for achieving targets
: Achieving some of the targets were made possible through commitment, perseverance and multi tasking ability demonstrated by the staff within the unit and the further dedicated assistance by other components and directorates within the Provincial Treasury.
Further success can be attributed to the cooperation received from municipalities and the Department of Local Government and Housing.
Reasons for notachieving targets
: The delay of the roles and responsibilities of provincial treasuries in terms of the MFMA until 1 July 2005.
Capacity constraints within the component as well as the high personnel turnover coupled with bottlenecks, uncertainties and challenges associated with the introduction of new financial management reforms required by the MFMA.
Delays in appointment of suitable staff.
The attainment of targets contributed towards achieving the Provincial Treasury’s outcomes in the following manner
: Its contribution towards achieving the Provincial Treasury’s outcomes was limited due to the above-mentioned constraints.
Programme 4: Public Finance and Accounting
Actual performance against target Output
Output performance measures/service delivery
indicators Target Actual
Sub-programme 4.2: Local Government Finance
An integrated financial and service delivery framework between the Province and municipalities.
% functioning financial framework.
70% 50% was achieved.
Functional Provincial Municipal Budgeting Forum and its technical forum.
% development to establish a fully functional structure.
50% functional. 35% was achieved.
Assessment of compliance. % nominal and substantive compliance by provincial departments.
20% nominal compliance.
20% nominal compliance was achieved.
Meeting of all statutory due dates.
% compliance. 100% compliance. 100% compliance was achieved.
Establishment of a fully functioning organisational structure in the Provincial Treasury.
% development. 50% functional. 50% functionality was achieved.
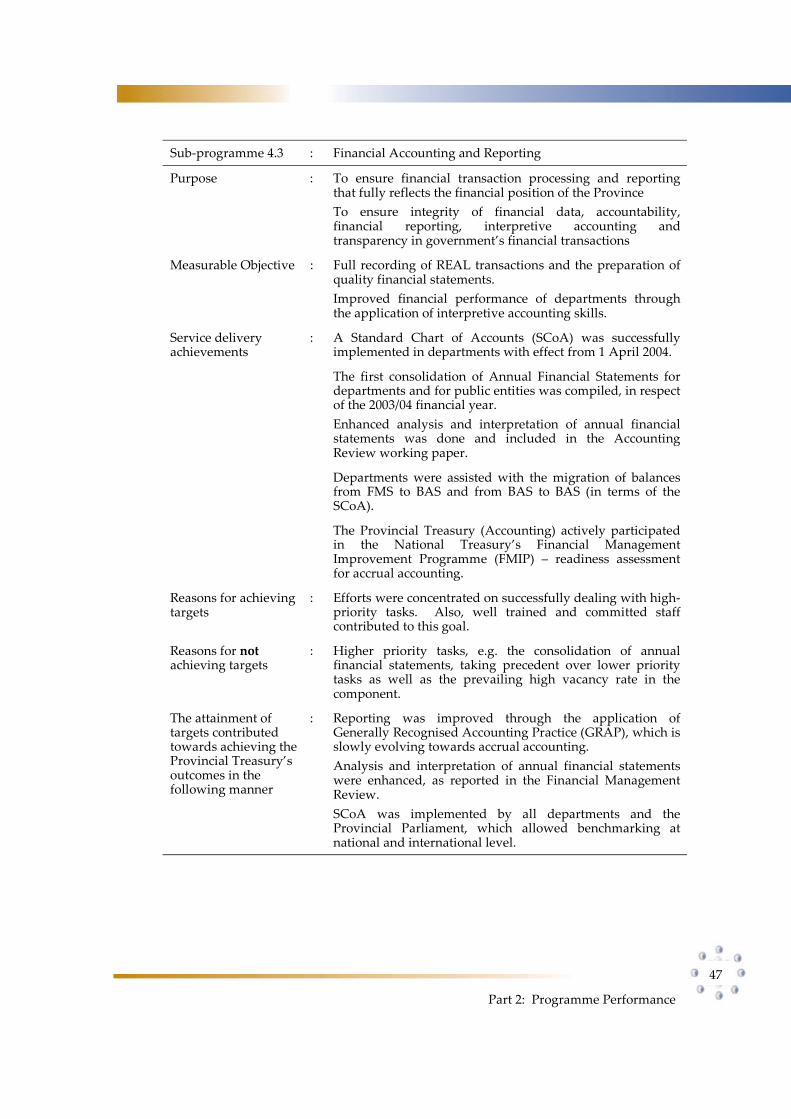
Part 2: Programme Performance
47
Sub-programme 4.3 : Financial Accounting and Reporting
Purpose : To ensure financial transaction processing and reporting that fully reflects the financial position of the Province
To ensure integrity of financial data, accountability, financial reporting, interpretive accounting and transparency in government’s financial transactions
Measurable Objective : Full recording of REAL transactions and the preparation of quality financial statements.
Improved financial performance of departments through the application of interpretive accounting skills.
Service delivery achievements
: A Standard Chart of Accounts (SCoA) was successfully implemented in departments with effect from 1 April 2004.
The first consolidation of Annual Financial Statements for departments and for public entities was compiled, in respect of the 2003/04 financial year.
Enhanced analysis and interpretation of annual financial statements was done and included in the Accounting Review working paper.
Departments were assisted with the migration of balances from FMS to BAS and from BAS to BAS (in terms of the SCoA).
The Provincial Treasury (Accounting) actively participated in the National Treasury’s Financial Management Improvement Programme (FMIP) – readiness assessment for accrual accounting.
Reasons for achieving targets
: Efforts were concentrated on successfully dealing with high-priority tasks. Also, well trained and committed staff contributed to this goal.
Reasons for notachieving targets
: Higher priority tasks, e.g. the consolidation of annual financial statements, taking precedent over lower priority tasks as well as the prevailing high vacancy rate in the component.
The attainment of targets contributed towards achieving the Provincial Treasury’s outcomes in the following manner
: Reporting was improved through the application of Generally Recognised Accounting Practice (GRAP), which is slowly evolving towards accrual accounting.
Analysis and interpretation of annual financial statements were enhanced, as reported in the Financial Management Review.
SCoA was implemented by all departments and the Provincial Parliament, which allowed benchmarking at national and international level.
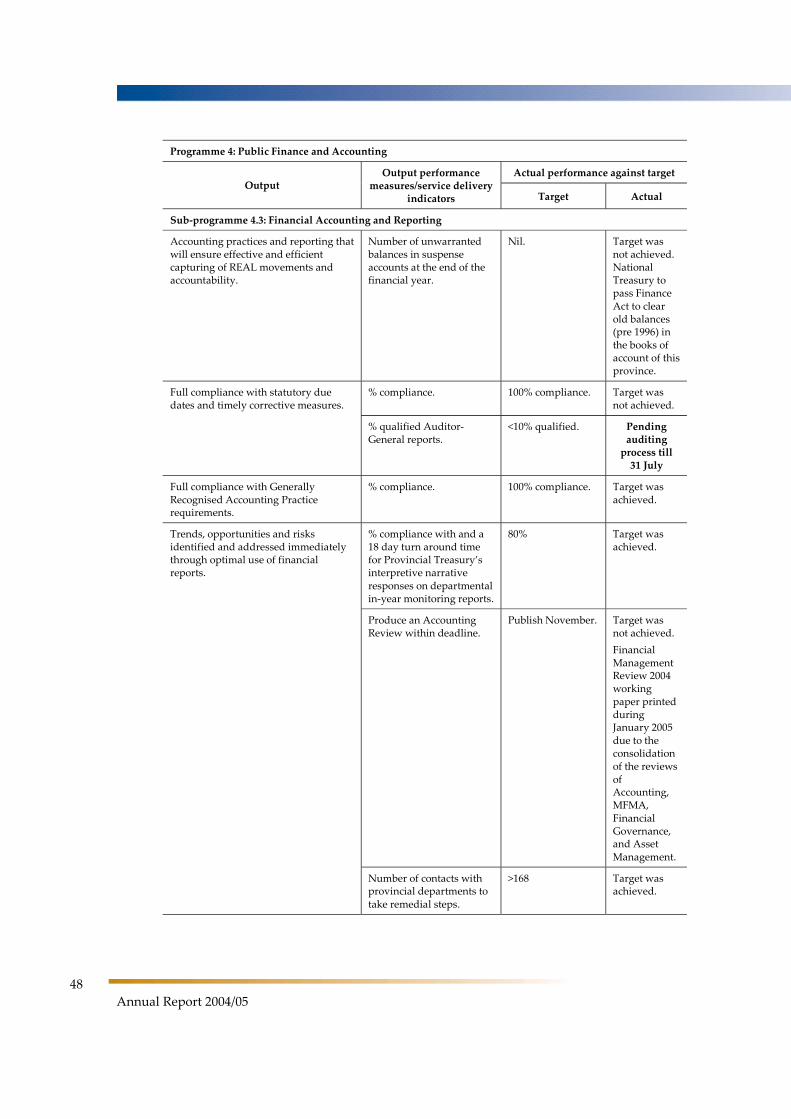
48
Annual Report 2004/05
Programme 4: Public Finance and Accounting
Actual performance against target Output
Output performance measures/service delivery
indicators Target Actual
Sub-programme 4.3: Financial Accounting and Reporting
Accounting practices and reporting that will ensure effective and efficient capturing of REAL movements and accountability.
Number of unwarranted balances in suspense accounts at the end of the financial year.
Nil. Target was not achieved. National Treasury to pass Finance Act to clear old balances (pre 1996) in the books of account of this province.
Full compliance with statutory due dates and timely corrective measures.
% compliance. 100% compliance. Target was not achieved.
% qualified Auditor-General reports.
<10% qualified. Pending auditing
process till 31 July
Full compliance with Generally Recognised Accounting Practice requirements.
% compliance. 100% compliance. Target was achieved.
Trends, opportunities and risks identified and addressed immediately through optimal use of financial reports.
% compliance with and a 18 day turn around time for Provincial Treasury’s interpretive narrative responses on departmental in-year monitoring reports.
80% Target was achieved.
Produce an Accounting Review within deadline.
Publish November. Target was not achieved.
Financial Management Review 2004 working paper printed during January 2005 due to the consolidation of the reviews of Accounting, MFMA, Financial Governance, and Asset Management.
Number of contacts with provincial departments to take remedial steps.
>168 Target was achieved.
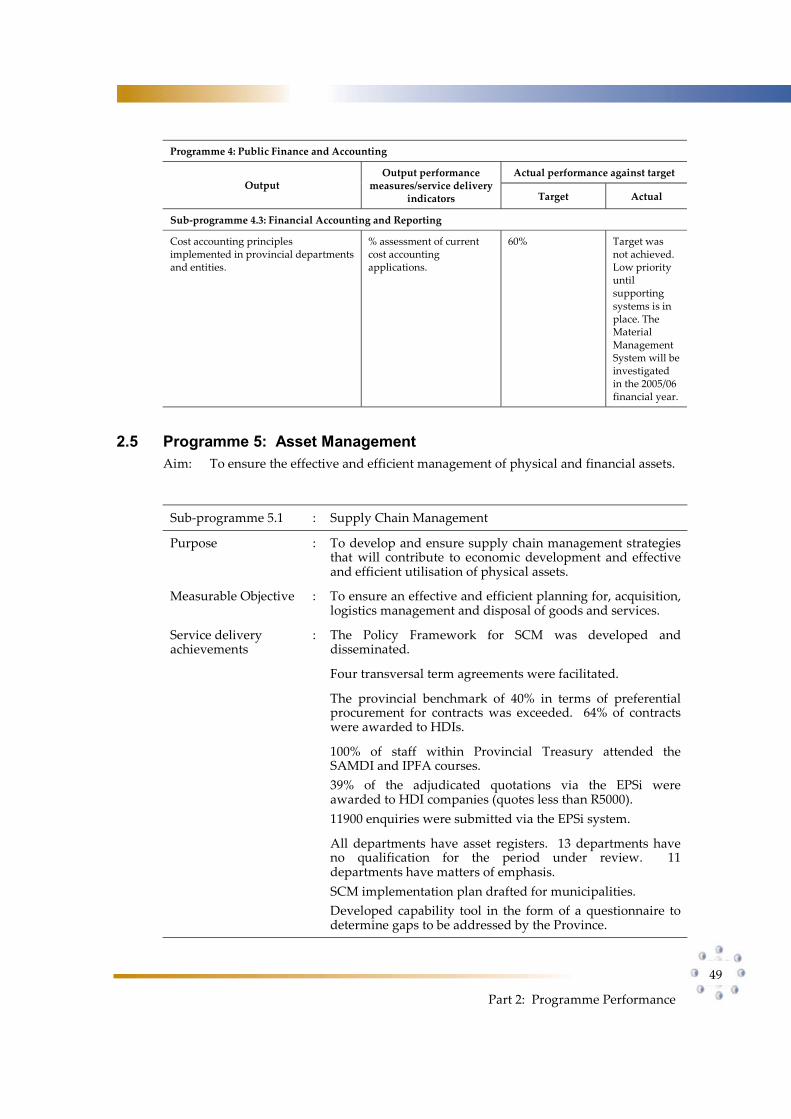
Part 2: Programme Performance
49
Programme 4: Public Finance and Accounting
Actual performance against target Output
Output performance measures/service delivery
indicators Target Actual
Sub-programme 4.3: Financial Accounting and Reporting
Cost accounting principles implemented in provincial departments and entities.
% assessment of current cost accounting applications.
60% Target was not achieved. Low priority until supporting systems is in place. The Material Management System will be investigated in the 2005/06 financial year.
2.5 Programme 5: Asset Management Aim: To ensure the effective and efficient management of physical and financial assets.
Sub-programme 5.1 : Supply Chain Management
Purpose : To develop and ensure supply chain management strategies that will contribute to economic development and effective and efficient utilisation of physical assets.
Measurable Objective : To ensure an effective and efficient planning for, acquisition, logistics management and disposal of goods and services.
Service delivery achievements
: The Policy Framework for SCM was developed and disseminated.
Four transversal term agreements were facilitated.
The provincial benchmark of 40% in terms of preferential procurement for contracts was exceeded. 64% of contracts were awarded to HDIs.
100% of staff within Provincial Treasury attended the SAMDI and IPFA courses.
39% of the adjudicated quotations via the EPSi were awarded to HDI companies (quotes less than R5000).
11900 enquiries were submitted via the EPSi system.
All departments have asset registers. 13 departments have no qualification for the period under review. 11 departments have matters of emphasis.
SCM implementation plan drafted for municipalities.
Developed capability tool in the form of a questionnaire to determine gaps to be addressed by the Province.
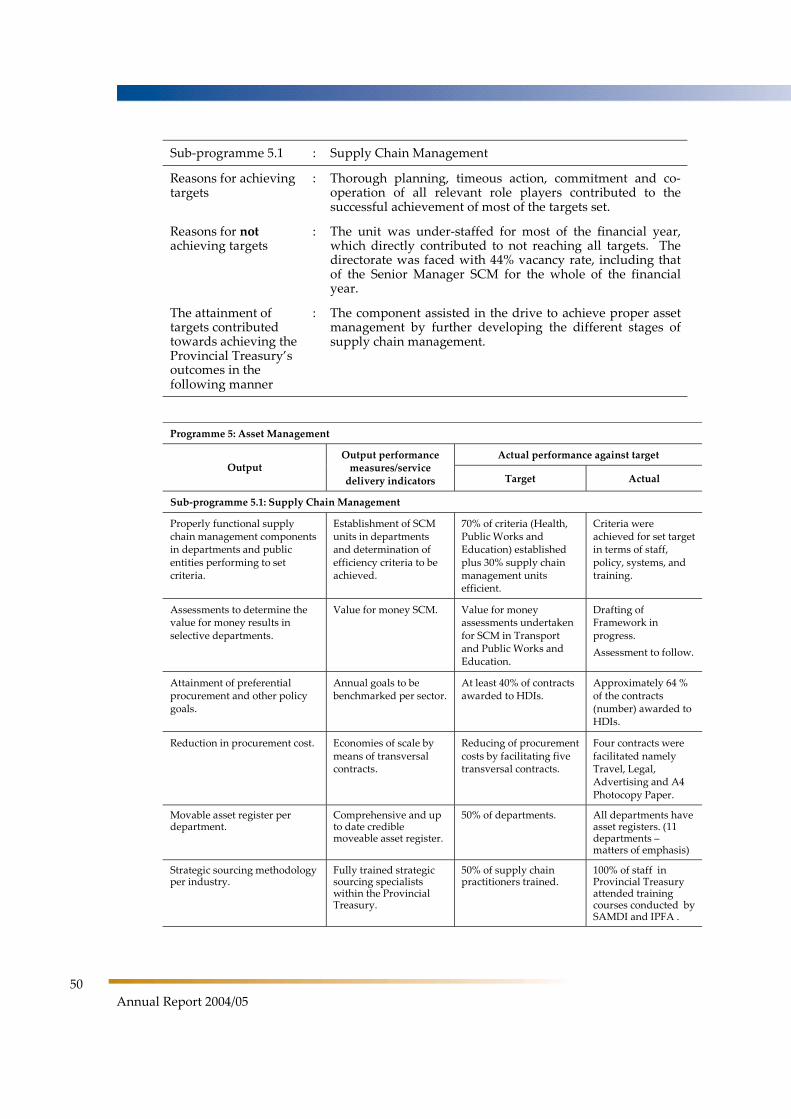
50
Annual Report 2004/05
Sub-programme 5.1 : Supply Chain Management
Reasons for achieving targets
: Thorough planning, timeous action, commitment and co-operation of all relevant role players contributed to the successful achievement of most of the targets set.
Reasons for notachieving targets
: The unit was under-staffed for most of the financial year, which directly contributed to not reaching all targets. The directorate was faced with 44% vacancy rate, including that of the Senior Manager SCM for the whole of the financial year.
The attainment of targets contributed towards achieving the Provincial Treasury’s outcomes in the following manner
: The component assisted in the drive to achieve proper asset management by further developing the different stages of supply chain management.
Programme 5: Asset Management
Actual performance against target Output
Output performance measures/service
delivery indicators Target Actual
Sub-programme 5.1: Supply Chain Management
Properly functional supply chain management components in departments and public entities performing to set criteria.
Establishment of SCM units in departments and determination of efficiency criteria to be achieved.
70% of criteria (Health, Public Works and Education) established plus 30% supply chain management units efficient.
Criteria were achieved for set target in terms of staff, policy, systems, and training.
Assessments to determine the value for money results in selective departments.
Value for money SCM. Value for money assessments undertaken for SCM in Transport and Public Works and Education.
Drafting of Framework in progress.
Assessment to follow.
Attainment of preferential procurement and other policy goals.
Annual goals to be benchmarked per sector.
At least 40% of contracts awarded to HDIs.
Approximately 64 % of the contracts (number) awarded to HDIs.
Reduction in procurement cost. Economies of scale by means of transversal contracts.
Reducing of procurement costs by facilitating five transversal contracts.
Four contracts were facilitated namely Travel, Legal, Advertising and A4 Photocopy Paper.
Movable asset register per department.
Comprehensive and up to date credible moveable asset register.
50% of departments. All departments have asset registers. (11 departments – matters of emphasis)
Strategic sourcing methodology per industry.
Fully trained strategic sourcing specialists within the Provincial Treasury.
50% of supply chain practitioners trained.
100% of staff in Provincial Treasury attended training courses conducted by SAMDI and IPFA .
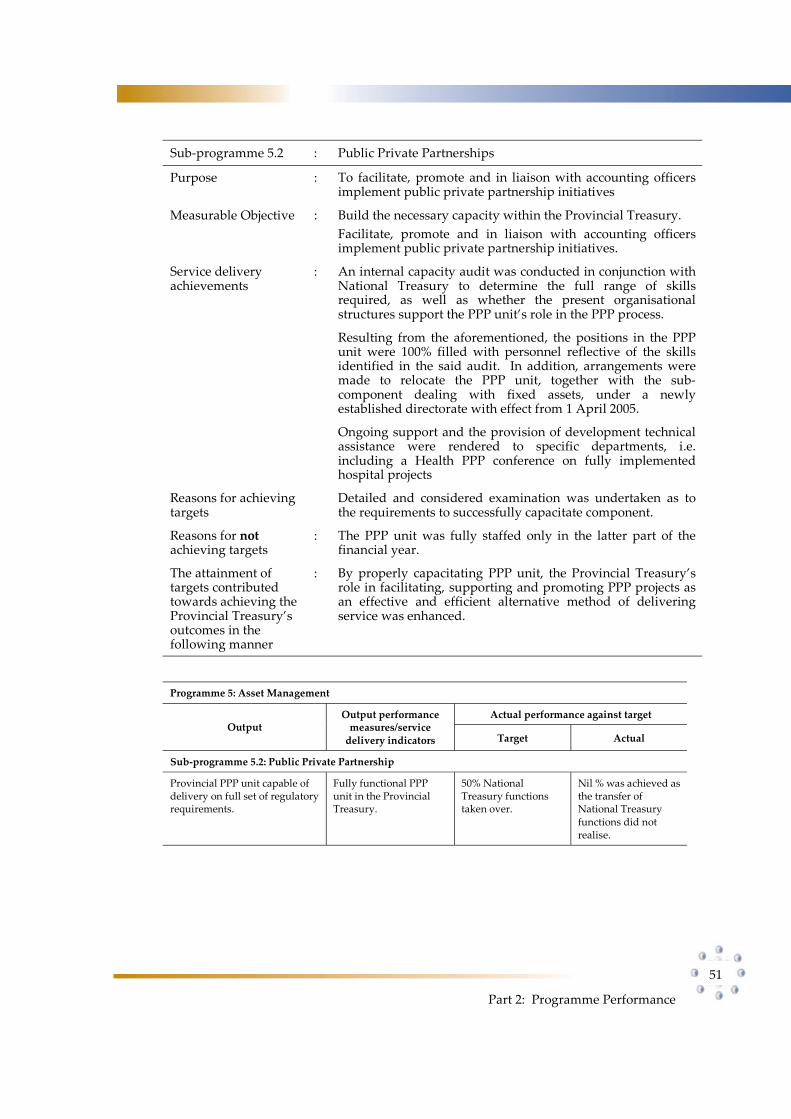
Part 2: Programme Performance
51
Sub-programme 5.2 : Public Private Partnerships
Purpose : To facilitate, promote and in liaison with accounting officers implement public private partnership initiatives
Measurable Objective : Build the necessary capacity within the Provincial Treasury.
Facilitate, promote and in liaison with accounting officers implement public private partnership initiatives.
Service delivery achievements
: An internal capacity audit was conducted in conjunction with National Treasury to determine the full range of skills required, as well as whether the present organisational structures support the PPP unit’s role in the PPP process.
Resulting from the aforementioned, the positions in the PPP unit were 100% filled with personnel reflective of the skills identified in the said audit. In addition, arrangements were made to relocate the PPP unit, together with the sub-component dealing with fixed assets, under a newly established directorate with effect from 1 April 2005.
Ongoing support and the provision of development technical assistance were rendered to specific departments, i.e. including a Health PPP conference on fully implemented hospital projects
Reasons for achieving targets
Detailed and considered examination was undertaken as to the requirements to successfully capacitate component.
Reasons for notachieving targets
: The PPP unit was fully staffed only in the latter part of the financial year.
The attainment of targets contributed towards achieving the Provincial Treasury’s outcomes in the following manner
: By properly capacitating PPP unit, the Provincial Treasury’s role in facilitating, supporting and promoting PPP projects as an effective and efficient alternative method of delivering service was enhanced.
Programme 5: Asset Management
Actual performance against target Output
Output performance measures/service
delivery indicators Target Actual
Sub-programme 5.2: Public Private Partnership
Provincial PPP unit capable of delivery on full set of regulatory requirements.
Fully functional PPP unit in the Provincial Treasury.
50% National Treasury functions taken over.
Nil % was achieved as the transfer of National Treasury functions did not realise.
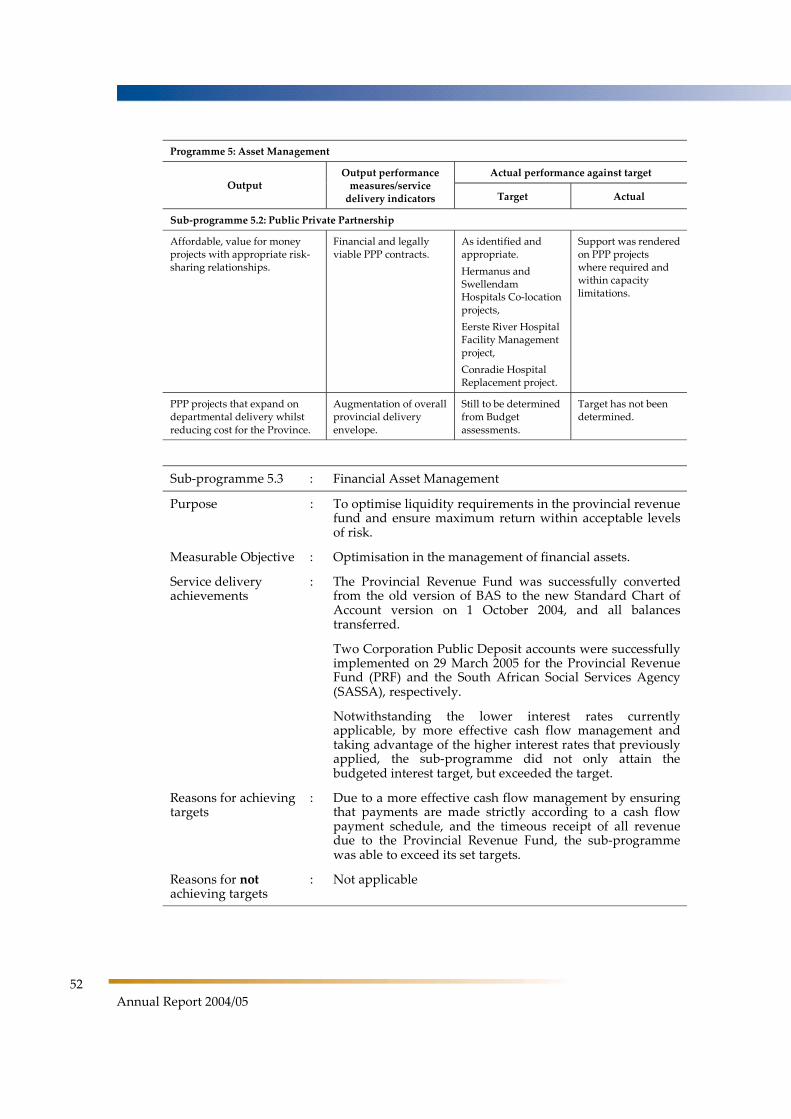
52
Annual Report 2004/05
Programme 5: Asset Management
Actual performance against target Output
Output performance measures/service
delivery indicators Target Actual
Sub-programme 5.2: Public Private Partnership
Affordable, value for money projects with appropriate risk-sharing relationships.
Financial and legally viable PPP contracts.
As identified and appropriate.
Hermanus and Swellendam Hospitals Co-location projects,
Eerste River Hospital Facility Management project,
Conradie Hospital Replacement project.
Support was rendered on PPP projects where required and within capacity limitations.
PPP projects that expand on departmental delivery whilst reducing cost for the Province.
Augmentation of overall provincial delivery envelope.
Still to be determined from Budget assessments.
Target has not been determined.
Sub-programme 5.3 : Financial Asset Management
Purpose : To optimise liquidity requirements in the provincial revenue fund and ensure maximum return within acceptable levels of risk.
Measurable Objective : Optimisation in the management of financial assets.
Service delivery achievements
: The Provincial Revenue Fund was successfully converted from the old version of BAS to the new Standard Chart of Account version on 1 October 2004, and all balances transferred.
Two Corporation Public Deposit accounts were successfully implemented on 29 March 2005 for the Provincial Revenue Fund (PRF) and the South African Social Services Agency (SASSA), respectively.
Notwithstanding the lower interest rates currently applicable, by more effective cash flow management and taking advantage of the higher interest rates that previously applied, the sub-programme did not only attain the budgeted interest target, but exceeded the target.
Reasons for achieving targets
: Due to a more effective cash flow management by ensuring that payments are made strictly according to a cash flow payment schedule, and the timeous receipt of all revenue due to the Provincial Revenue Fund, the sub-programme was able to exceed its set targets.
Reasons for notachieving targets
: Not applicable
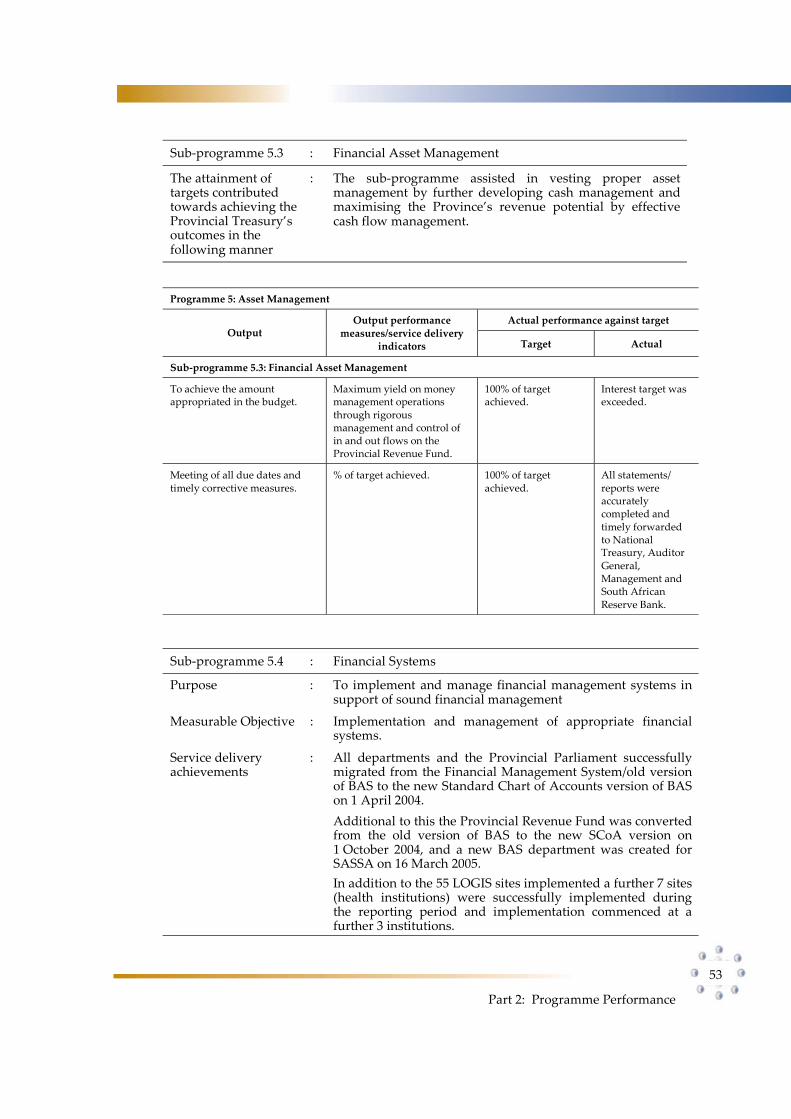
Part 2: Programme Performance
53
Sub-programme 5.3 : Financial Asset Management
The attainment of targets contributed towards achieving the Provincial Treasury’s outcomes in the following manner
: The sub-programme assisted in vesting proper asset management by further developing cash management and maximising the Province’s revenue potential by effective cash flow management.
Programme 5: Asset Management
Actual performance against target Output
Output performance measures/service delivery
indicators Target Actual
Sub-programme 5.3: Financial Asset Management
To achieve the amount appropriated in the budget.
Maximum yield on money management operations through rigorous management and control of in and out flows on the Provincial Revenue Fund.
100% of target achieved.
Interest target was exceeded.
Meeting of all due dates and timely corrective measures.
% of target achieved. 100% of target achieved.
All statements/ reports were accurately completed and timely forwarded to National Treasury, Auditor General, Management and South African Reserve Bank.
Sub-programme 5.4 : Financial Systems
Purpose : To implement and manage financial management systems in support of sound financial management
Measurable Objective : Implementation and management of appropriate financial systems.
Service delivery achievements
: All departments and the Provincial Parliament successfully migrated from the Financial Management System/old version of BAS to the new Standard Chart of Accounts version of BAS on 1 April 2004.
Additional to this the Provincial Revenue Fund was converted from the old version of BAS to the new SCoA version on 1 October 2004, and a new BAS department was created for SASSA on 16 March 2005.
In addition to the 55 LOGIS sites implemented a further 7 sites (health institutions) were successfully implemented during the reporting period and implementation commenced at a further 3 institutions.
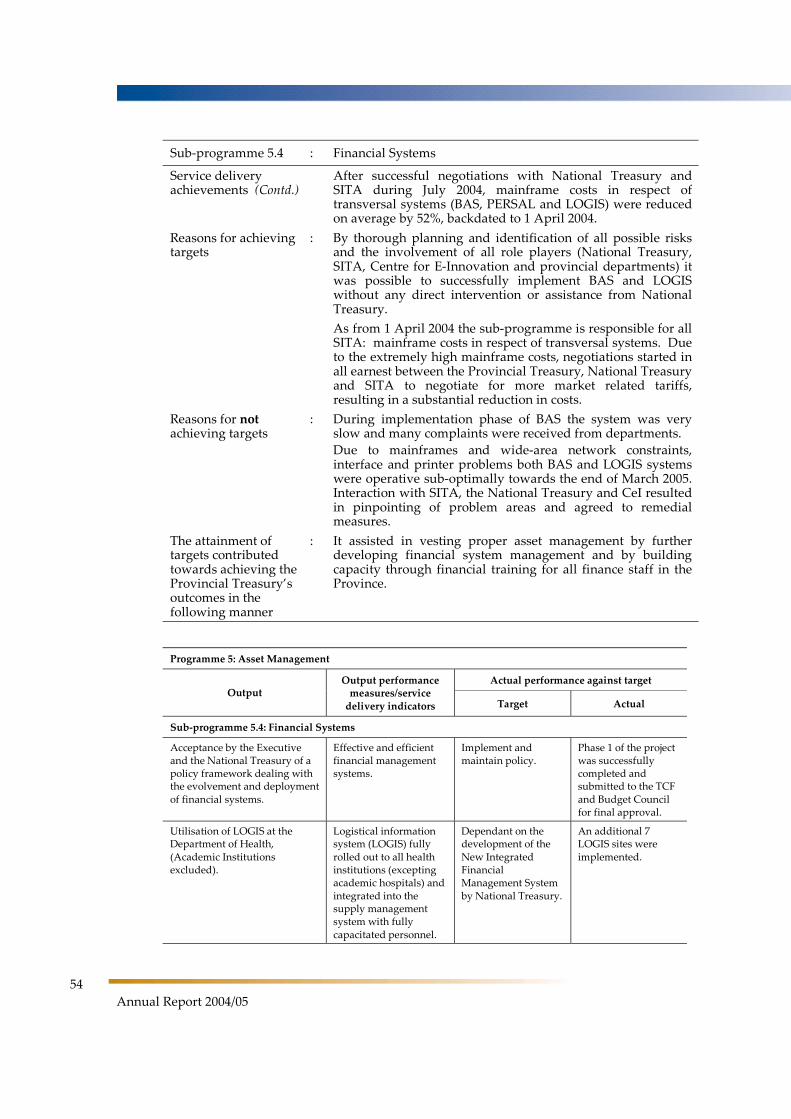
54
Annual Report 2004/05
Sub-programme 5.4 : Financial Systems
Service delivery achievements (Contd.)
After successful negotiations with National Treasury and SITA during July 2004, mainframe costs in respect of transversal systems (BAS, PERSAL and LOGIS) were reduced on average by 52%, backdated to 1 April 2004.
Reasons for achieving targets
: By thorough planning and identification of all possible risks and the involvement of all role players (National Treasury, SITA, Centre for E-Innovation and provincial departments) it was possible to successfully implement BAS and LOGIS without any direct intervention or assistance from National Treasury.
As from 1 April 2004 the sub-programme is responsible for all SITA: mainframe costs in respect of transversal systems. Due to the extremely high mainframe costs, negotiations started in all earnest between the Provincial Treasury, National Treasury and SITA to negotiate for more market related tariffs, resulting in a substantial reduction in costs.
Reasons for notachieving targets
: During implementation phase of BAS the system was very slow and many complaints were received from departments.
Due to mainframes and wide-area network constraints, interface and printer problems both BAS and LOGIS systems were operative sub-optimally towards the end of March 2005. Interaction with SITA, the National Treasury and CeI resulted in pinpointing of problem areas and agreed to remedial measures.
The attainment of targets contributed towards achieving the Provincial Treasury’s outcomes in the following manner
: It assisted in vesting proper asset management by further developing financial system management and by building capacity through financial training for all finance staff in the Province.
Programme 5: Asset Management
Actual performance against target Output
Output performance measures/service
delivery indicators Target Actual
Sub-programme 5.4: Financial Systems
Acceptance by the Executive and the National Treasury of a policy framework dealing with the evolvement and deployment of financial systems.
Effective and efficient financial management systems.
Implement and maintain policy.
Phase 1 of the project was successfully completed and submitted to the TCF and Budget Council for final approval.
Utilisation of LOGIS at the Department of Health, (Academic Institutions excluded).
Logistical information system (LOGIS) fully rolled out to all health institutions (excepting academic hospitals) and integrated into the supply management system with fully capacitated personnel.
Dependant on the development of the New Integrated Financial Management System by National Treasury.
An additional 7 LOGIS sites were implemented.
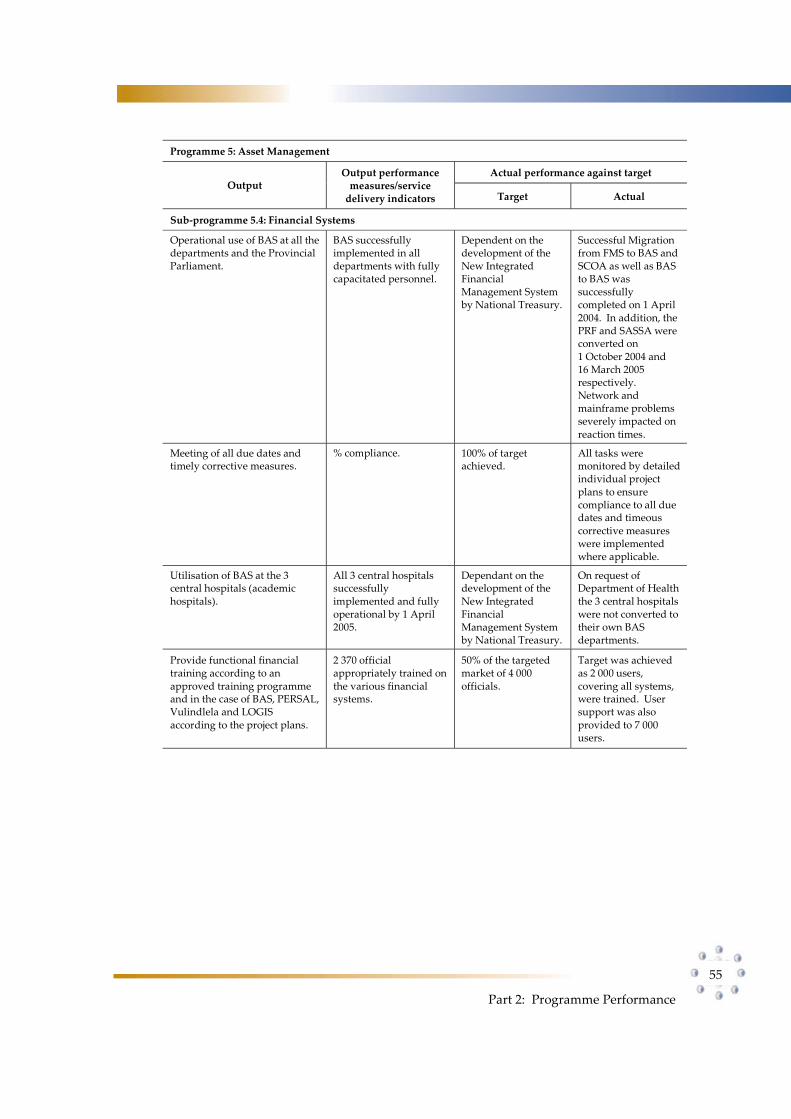
Part 2: Programme Performance
55
Programme 5: Asset Management
Actual performance against target Output
Output performance measures/service
delivery indicators Target Actual
Sub-programme 5.4: Financial Systems
Operational use of BAS at all the departments and the Provincial Parliament.
BAS successfully implemented in all departments with fully capacitated personnel.
Dependent on the development of the New Integrated Financial Management System by National Treasury.
Successful Migration from FMS to BAS and SCOA as well as BAS to BAS was successfully completed on 1 April 2004. In addition, the PRF and SASSA were converted on 1 October 2004 and 16 March 2005 respectively. Network and mainframe problems severely impacted on reaction times.
Meeting of all due dates and timely corrective measures.
% compliance. 100% of target achieved.
All tasks were monitored by detailed individual project plans to ensure compliance to all due dates and timeous corrective measures were implemented where applicable.
Utilisation of BAS at the 3 central hospitals (academic hospitals).
All 3 central hospitals successfully implemented and fully operational by 1 April 2005.
Dependant on the development of the New Integrated Financial Management System by National Treasury.
On request of Department of Health the 3 central hospitals were not converted to their own BAS departments.
Provide functional financial training according to an approved training programme and in the case of BAS, PERSAL, Vulindlela and LOGIS according to the project plans.
2 370 official appropriately trained on the various financial systems.
50% of the targeted market of 4 000 officials.
Target was achieved as 2 000 users, covering all systems, were trained. User support was also provided to 7 000 users.
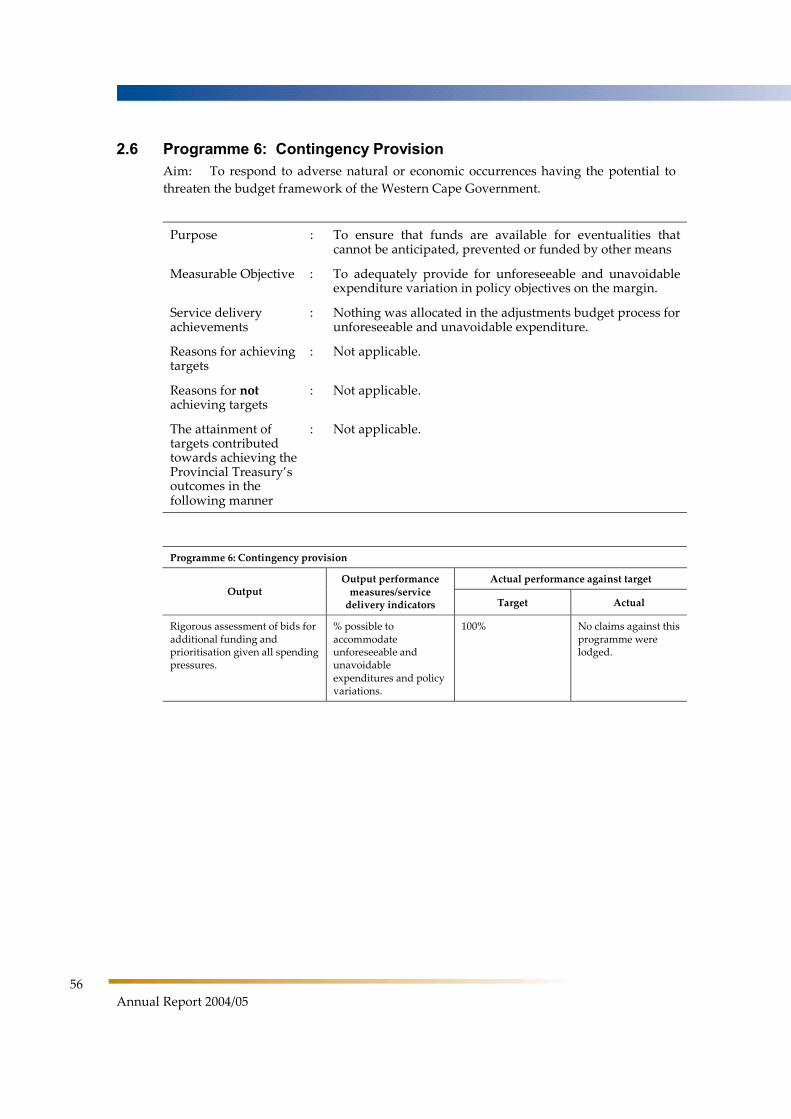
56
Annual Report 2004/05
2.6 Programme 6: Contingency Provision Aim: To respond to adverse natural or economic occurrences having the potential to
threaten the budget framework of the Western Cape Government.
Purpose : To ensure that funds are available for eventualities that cannot be anticipated, prevented or funded by other means
Measurable Objective : To adequately provide for unforeseeable and unavoidable expenditure variation in policy objectives on the margin.
Service delivery achievements
: Nothing was allocated in the adjustments budget process for unforeseeable and unavoidable expenditure.
Reasons for achieving targets
: Not applicable.
Reasons for notachieving targets
: Not applicable.
The attainment of targets contributed towards achieving the Provincial Treasury’s outcomes in the following manner
: Not applicable.
Programme 6: Contingency provision
Actual performance against target Output
Output performance measures/service
delivery indicators Target Actual
Rigorous assessment of bids for additional funding and prioritisation given all spending pressures.
% possible to accommodate unforeseeable and unavoidable expenditures and policy variations.
100% No claims against this programme were lodged.
Part 3: Report of the Audit Committee
57
Part3
Report of the Audit Committee
Report of the Provincial Government Western Cape Shared Audit Committee on the Provincial Treasury (Vote 3) for the financial year ending 31 March 2005
We are pleased to present our report for the above-mentioned financial year.
Appointment of the Shared Audit Committee
The Provincial Treasury (Vote 3) is served by a Shared Audit Committee appointed under
Cabinet Resolution 75/2003 of 23 June 2003 for the 2 year period to 31 March 2005 extended
by Resolution 95/2005 for 2 more years to 31 March 2007.
Audit Committee Members and Attendance
The Shared Audit Committee members attended meetings during the financial year under
review, in terms of their adopted Audit Charter, as indicated below:
Member Number of Meetings Attended
Mr JA Jarvis (Chairperson) 5
Mr J January 5
Mr VW Sikobi (resigned May 2005) 1
Mr R Warley 4
Mr P Jones (appointed April 2005) 0
Audit Committee Responsibility
The Audit Committee has complied with its responsibilities arising from section 38(1) (a) of
the PFMA and Treasury Regulation 3.1.13 and 27(1) (10). The Audit Committee has also
regulated its affairs and discharged it’s responsibilities in terms of the Audit Committee
Charter. However it did not address internal audit issues as envisaged in its Charter and the
PFMA, due to the suspension of Internal Audit activity in 2003 (Provincial Treasury Circular
No. 25/2003).
58
Annual Report 2004/05
Effectiveness of Internal Control
In 2004 the Sihluma Sonke Consortium was appointed to develop and transfer internal audit
skills to the Provincial Government over a three-year period.
The assessment of Internal Controls by Internal Audit was suspended in 2003 and the
Operational Audit Plan was rescheduled to commence in 2005/6, following completion of the
Risk Assessment and Process and Control Mapping exercises.
In view of the above the Audit Committee has had to rely on the opinions and work done by
the Auditor-General in preparing this report.
Accounting procedures were not consistently followed by the Department in recording
Capital Asset transactions. The Logis and BAS summary reports were not regularly
reconciled to detect incomplete or missing transactions. The consequence of such omissions
could be for Departmental assets to be lost or stolen.
The Audit Committee resolved to meet with the Accounting Officer to agree on a course of
action to address weaknesses and deficiencies that were emphasized by the Auditor-General.
During the year under review the Audit Committee has promoted better communication and
exchange of information between the Forensic Audit, Internal Control units, Internal Audit,
and the Office of the Auditor-General.
Evaluation of Financial Statements
The Audit Committee has:
Reviewed and discussed with the Auditor-General and the Accounting Officer (or his/her
representative) the audited annual financial statements to be included in the annual
report;
Reviewed the Auditor-General’s management letters and the responses thereto
Reviewed significant adjustments resulting from the audit.
Reviewed the Auditor-General’s report.
The Audit Committee concurs and accepts the Audit Opinion of the Auditor-General on the
Annual Financial Statements and is of the opinion that the audited annual financial
statements be accepted and read together with the report of the Auditor-General.
Part 3: Report of the Audit Committee
59
Appreciation
The Audit Committee wishes to express its appreciation to the Provincial Treasury, the
Auditor-General and the Sihluma Sonke Consortium for their assistance and co-operation in
compiling this report.
(JA JARVIS)
CHAIRPERSON OF THE PROVINCIAL GOVERNMENT WESTERN CAPE SHARED AUDIT COMMITTEE
DATE: 4 AUGUST 2005
Part 4: Annual Financial Statements
61
Part4
Annual Financial Statements for the year ended 31 March 2005

Part 4: Annual Financial Statements
63
Contents
Report of the Accounting Officer 65
Report of the Auditor-General 71
Accounting Policies 73
Appropriation Statement 78
Notes to the Appropriation Statement 86
Statement of Financial Performance 88
Statement of Financial Position 89
Cash Flow Statement 90
Notes to the Annual Financial Statements 91
Disclosures Notes to the Annual Financial Statements 98
Annexures to the Annual Financial Statements 100

WESTERN CAPE PROVINCE PROVINCIAL TREASURY
VOTE 3
REPORT OF THE ACCOUNTING OFFICER for the year ended 31 MARCH 2005
Part 4: Annual Financial Statements
65
Report by the Accounting Officer to the Executive Authority and the Provincial Parliament of the Western Cape Province.
1. General review of the state of financial affairs The Western Cape Provincial Government is committed to contribute to the national
goals of economic growth and development, to be competitive in a global context, to
reduce income, access and asset disparities and to provide an adequate social net to cover
those that are excluded from sustainable economic participation. The Provincial Treasury
as change agent, has an indispensable role to play in building transactional and financial
strategic management capacity in departments and public entities and through the
budget process, guiding the allocation of resources. The net result is a systematic attempt
to over time improve the living standards and compendium of services required by the
people of the Western Cape. The following internal challenges remain:
- Increasing the assessment and analytical capability of officials.
- Closing the remaining gap between skill requirements and current competency
levels.
- Recruiting and retention of appropriately skilled personnel.
- Provide ever improving and targeted policy advice within the context of more
refined economic parameters and socio-economic imperatives.
- Improving cohesion and synergy between departments and spheres of government.
In response to the above challenges, Treasury achieved the following:
- An improvement in the level and technical sophistication of service delivery by
recruiting better qualified people, including a number at masters level, and providing
a significant number of staff with the opportunity and financial support for further
education and training.
- The new organisational structure developed in 2003 has seen further refinement and
a new way of working, which required new co-operative systems and greater
openness and communication across units and components. The refinements
included provision for the demands of the MFMA1.
- Further evolvement of the practical implementation of the PFMA2 and related
legislation requirements.
1Municipal Finance Management Act, 2003 (Act 56 of 2003)
2Public Finance Management Act, 1999 (Act 1 of 1999)
WESTERN CAPE PROVINCE PROVINCIAL TREASURY
VOTE 3
REPORT OF THE ACCOUNTING OFFICER for the year ended 31 MARCH 2005
66
Annual Report 2004/05
- Promoted an understanding that current monitoring and strategic processes were not
providing sufficient performance information and direction to improve the socio-
economic conditions of the majority of our people.
- Prove the development of the iKapa elihlumayo strategic objectives, analysed the
priorities arising from Treasury’s Provincial Economic Review and Outlook 2005
(PERO), as well as those from departments’ analyses and municipalities’ IDPs3 to
compile a budget for the MTEF (2005/06 – 2007/08) that was better targeted towards
growth and development.
The following major projects were undertaken during the year:
- A Service Delivery Review that tries to assess the degree of provincial service
delivery transformation towards the growth and development objectives of the
Provincial Government, both in terms of efficacy and efficiency.
- A Medium Term Budget Policy Statement (MTBPS) as well as an Economic Review
and Outlook were compiled for the Province to provide a framework and give
content to the 2005 Budget within the country’s overall macroeconomic context.
- Similarly, a Financial Management Review was completed that covered the state of
play in the Province regarding accounting, asset management, financial governance
and key aspects of the MFMA.
- In implementing the new Supply Chain Management (SCM) policy, SCM units were
established in departments, although not all of them are as yet fully operational
according to the criteria determined by National Treasury.
- The Provincial Treasury converted from BAS (standard items) to BAS, SCOA4 with
effect from 1 April 2004.
- The entire Province was converted from the old Financial Management System (FMS)
to the realtime Basic Accounting System (BAS5) together with the new SCOA (all 14
votes) using internal personnel only. Unfortunately, this project was dogged by
varying network and mainframe problems throughout the financial year, which as
yet have not been satisfactorily resolved.
- A major advance was achieved with the completion of risk assessments for all
departments, inclusive of a draft consolidated risk assessment for the Province as a
whole, using the transferred external audit function to Treasury and combining their
resources with that of an external service provider to ensure the necessary level of
capacity and technical standards of internal audit.
Spending trends
- Spending trends per programme and standard items are discussed in more detail on
pages 78 - 87 of the financial statements.
3 Integrated Development Plans 4 Standard Chart of Accounts 5 Apart from Treasury, the Provincial Parliament and Provincial Revenue Fund, who were already on BAS, albeit an older
version.
WESTERN CAPE PROVINCE PROVINCIAL TREASURY
VOTE 3
REPORT OF THE ACCOUNTING OFFICER for the year ended 31 MARCH 2005
Part 4: Annual Financial Statements
67
- The department’s expenditure for the financial year was R102,333 million resulting in
a combined saving and underspending of R6,647 million on budget (or 6,1 per cent of
the adjusted appropriation) of which R3,98 million was requested to be rolled over to
the 2005/06 financial year. The balance will be surrendered to the Provincial Revenue
Fund.
- An underspending of R3,494 million was realised on goods and services of which
R2,178 million can be attributed to lower than expected expenditure on consulting
and specialised services.
- The remaining R3,153 million (net) underspending for Vote 3 during 2004/05 (or
2,9 per cent of the adjusted appropriation) can mainly be attributed to the late filling
of vacant posts and the slower than planned delivery on a number of projects.
2. Services rendered by the Provincial Treasury
2.1 Under the powers vested in the Minister of Finance and Economic Development as the Head of
the Provincial Treasury, the Treasury is mainly responsible for the execution of the functions
and powers as prescribed in Chapter 3 of the Public Finance Management Act, 1999 (Act 1 of
1999), as amended. However, a range of other legislative provisions in different acts and laws,
both provincial and national, add further responsibilities.
2.2 Tariff policy
• Betting and Gambling
Betting and gambling revenue consists mainly of casino taxes, limited gambling machine
taxes, bookmakers taxes, totalisator taxes, annual licence fees from casinos, limited gambling
machines, bookmakers and the totalisator. All these fees and taxes were determined in terms
of the Western Cape Gambling and Racing Board Law, 1996 (Law 4 of 1996), after
consultation with the industry, by and on advice of the Western Cape Gambling and Racing
Board.
• Functional Financial Training
The Provincial Treasury annually approves tariffs payable for functional financial training
rendered to officials from national government departments. These tariffs are calculated as
direct expenditure plus 40% to cater for overhead costs.
2.3 Free services
Due to the diverse nature of the functions within the Treasury, all services, except those in
paragraph 2.2, are rendered to departments in terms of the PFMA and other supporting
legislation as stated in paragraph 2.1 above. Per definition no free services were therefore
rendered by the Provincial Treasury.
2.4 Inventories
Two types of inventory reports are generated by LOGIS. The one consists of an inventory of
store items (RR026 LOGIS report), the other inventory of furniture and equipment (RR025
LOGIS report). Unfortunately, the last mentioned report does not distinguish between current
and capital assets.
WESTERN CAPE PROVINCE PROVINCIAL TREASURY
VOTE 3
REPORT OF THE ACCOUNTING OFFICER for the year ended 31 MARCH 2005
68
Annual Report 2004/05
Items registered on the above-mentioned inventory reports are recorded at the original
purchase price and also reflects average purchase prices.
3. Capacity constraints The vacancy rate on the organisational structure (discounting the needs of the MFMA) of 29%
as at 31 March 2005 could be regarded as the biggest capacity constraint within the Provincial
Treasury. This situation was, however, a vast improvement on the vacancy rate of 41% at the
same time last year. It remained fairly high for the most part of the financial year under review
placing great stress on the existing staff members to realise Treasury’s goals as contained in the
Strategic Plan.
An aggressive recruitment process, extended working hours, and judicious use of external
assistance addressed most of these constraints.
For the year to come, more intensive and dynamic recruiting of the appropriate mix and skill
levels will still remain a serious challenge. The implementation of the MFMA will add an
entirely new dimension for the Provincial Treasury, resulting in additional responsibilities for
an increase of its personnel establishment.
4. Utilisation of donor funds The Provincial Treasury did not receive any donor funding.
5. Trading entities and public entities The only public entity under the control of the Provincial Treasury is the Western Cape
Gambling and Racing Board whose function it is to regulate all gambling, racing and other
activities related thereto.
The accountability arrangements of the Board are dealt with in terms of the PFMA and the
Western Cape Gambling and Racing Board Law, 1996 (Law 4 of 1996) as amended, and for the
2004/05 financial year no transfer payments were made to the Board as they have become self
sufficient since the implementation of Limited Payout Machines (LPMs).
6. Organisations to whom transfer payments have been made Transfers were made to Sectoral Education and Training Authority and the City of Cape Town
for Regional Services Council levies.
7. Public private partnerships (PPPs) No public private partnerships of any kind were entered into. The PPP Unit has however
assisted departments with creating and implementing PPP policy.
WESTERN CAPE PROVINCE PROVINCIAL TREASURY
VOTE 3
REPORT OF THE ACCOUNTING OFFICER for the year ended 31 MARCH 2005
Part 4: Annual Financial Statements
69
8. Corporate governance arrangements A high level consolidated risk profile was developed for Provincial Treasury that was
completed in November 2004. This consolidated risk profile is currently being used as a
platform and foundation to manage and control certain significant risks facing the Provincial
Treasury.
A Fraud Prevention Plan was compiled for the Provincial Treasury in March 2001.
Furthermore, the Human Resource Management component completed verification audits of
all educational qualifications submitted by staff members during the process of appointment,
subsequent to the discovering of two cases at variance with real academic achievement.
The Internal Audit unit is shared amongst the 14 provincial government departments within
the Province, while an internal Audit Committee for Provincial Treasury is shared with other
provincial government departments, excluding the departments of Health, Social Services and
Education. The latter departments have their own individual audit committees.
In managing any potential conflict of interest of employees, all senior managers in the Provincial
Treasury were again requested to declare their financial and other interests and to submit these
to the Executive Authority and the PSC6.
In addition to the aforementioned, the Human Resources Management component is currently
in the process of re-familiarising all officials with the Public Service Code Of Conduct.
With regard to health and environmental issues, it can be reported that a Health and Safety
Committee was formed in July 2004. During February 2005 this committee performed a safety
audit to identify certain health and environmental issues the Provincial Treasury will have to
address in the immediate future.
9. Discontinued activities No specific activities were discontinued during the 2004/05 financial year.
10. New/proposed activities New activities were concerned with improving financial governance by implementing a risk
management approach and internal control function in line with national policy. In addition,
steps were taken to begin to comply with the statutory functions required in terms of the
Municipal Finance Management Act 2003, (Act 56 of 2003) (“MFMA”).
11. Events after the reporting date (a) Due to the BAS and LOGIS systems that did not operate effectively towards the end of the
financial year, delays and backlogs in payments occurred resulting in these payments only
being made during April 2005. The roll-over of R350,000 (amount rounded off) was
requested to fund this expenditure not provided for in 2005/06. Paragraph 1, (Spending
trends) where roll-overs are discussed, has reference.
6 Public Service Commission (PSC)
WESTERN CAPE PROVINCE PROVINCIAL TREASURY
VOTE 3
REPORT OF THE ACCOUNTING OFFICER for the year ended 31 MARCH 2005
70
Annual Report 2004/05
(b) Thefts and losses of previous years that have been accounted for against the Vote will be
taken up in Treasury’s financial records for 2005/06.
12. Progress with financial management improvement Internal control inspections ensured that financial procedures functioned in accordance with
financial prescripts. A new approach to procurement necessitated by the new Supply Chain
Management (SCM) legislation was adopted and the initial departmental bid committee was
reconfigured to achieve greater efficacy.
Significant progress was made to reconcile ledger accounts which, inter alia, included better
controls over debtors, BAS – PERSAL reconciliations and reporting to the accounting officer.
Pro-active budget planning and better IYM7 controls ensured that under expenditure was at a
much lower level than in the previous financial year. Various finance instructions were
distributed to programme and sub-programme managers to assist them to improve financial
management within the Provincial Treasury.
13. SCOPA resolutions
Reference to previous audit
report and SCOPA resolutions Subject Findings in process
The SCOPA resolutions taken
at the meeting held on
12 November 2004 did not
apply to the Provincial
Treasury.
Not applicable. Not applicable.
Approval The annual financial statements set out on pages 73 - 103 have been approved by myself as
Accounting Officer.
(DR) JC STEGMANN
ACCOUNTING OFFICER
DATE: 31 MAY 2005
7 In-Year-Monitoring on spending and revenue.
Part 4: Annual Financial Statements
71
Report of the Auditor-General to the Provincial Parliament of the Western Cape on the Financial Statements of the Provincial Treasury (Vote 3) for the year ended 31 March 2005
1. Audit Assignment The financial statements as set out on pages 73 - 103, for the year ended 31 March 2005,
have been audited in terms of section 188 of the Constitution of the Republic of South
Africa, 1996 (Act No. 108 of 1996), read with sections 4 and 20 of the Public Audit Act,
2004 (Act No. 25 of 2004). These financial statements, the maintenance of effective
control measures and compliance with relevant laws and regulations are the
responsibility of the accounting officer. My responsibility is to express an opinion on
these financial statements, based on the audit.
2. Nature and scope The audit was conducted in accordance with Statements of South African Auditing
Standards. Those standards require that I plan and perform the audit to obtain
reasonable assurance that the financial statements are free of material misstatement.
An audit includes:
examining, on a test basis, evidence supporting the amounts and disclosures in the
financial statements,
assessing the accounting principles used and significant estimates made by
management, and
evaluating the overall financial statement presentation.
Furthermore, an audit includes an examination, on a test basis, of evidence supporting
compliance in all material respects with the relevant laws and regulations which came to
my attention and are applicable to financial matters.
The audit was completed in accordance with Auditor-General Directive No. 1 of 2005.
I believe that the audit provides a reasonable basis for my opinion.
3. Audit opinion In my opinion, the financial statements fairly present, in all material respects, the
financial position of the Provincial Treasury at 31 March 2005 and the results of its
operations and cash flows for the year then ended in accordance with prescribed
accounting practice and in the manner required by the Public Finance Management Act,
1999 (Act No. 1 of 1999).
72
Annual Report 2004/05
4. Emphasis of matter Without qualifying the audit opinion expressed above, attention is drawn to the
following matters:
4.1 Asset management
A review of the department’s asset management identified the following weaknesses :
(a) The asset register maintained by the department (LOGIS) did not contain sufficient
information to facilitate an adequate verification process. Information relating to
unique asset numbers and their specific locations were not reflected in the asset
register.
(b) The asset register was not updated to reflect all assets acquired during the year. A
difference amounting to R135 000 was identified between the financial accounting
system (BAS) and the department’s asset register.
4.2 Internal audit
According to section 38(1)(a)(ii) of the Public Finance Management Act, 1999, the
accounting officer of a department must ensure that the department has and maintains a
system of internal audit under the control and direction of an audit committee
complying with and operating in accordance with regulations and instructions
prescribed in terms of sections 76 and 77 of the Public Finance Management Act, 1999.
Except for a risk assessment, no internal audits were performed at this department
during the year under review. This was mainly due to capacity constraints of the
provincial shared internal audit directorate.
5. Appreciation The assistance rendered by the staff of the Provincial Treasury during the audit is
sincerely appreciated.
I Jeewa for Auditor-General
Cape Town
29 July 2005
WESTERN CAPE PROVINCE PROVINCIAL TREASURY
VOTE 3
ACCOUNTING POLICIES for the year ended 31 March 2005
Part 4: Annual Financial Statements
73
The Annual Financial Statements have been prepared in accordance with the following policies,
which have been applied consistently in all material aspects, unless otherwise indicated.
However, where appropriate and meaningful, additional information has been disclosed to
enhance the usefulness of the Annual Financial Statements and to comply with the statutory
requirements of the Public Finance Management Act, Act 1 of 1999 (as amended by Act 29 of
1999), the Treasury Regulations for Departments and Constitutional Institutions issued in terms
of the Act and the Division of Revenue Act, Act 5 of 2004. The following issued, but not yet
effective, Standards of Generally Recognised Accounting Practice have not been fully complied
with in the Annual Financial Statements: GRAP 1, 2 and 3.
1. Basis of preparation The Annual Financial Statements have been prepared on a modified cash basis of accounting,
except where stated otherwise. The modified cash basis constitutes the cash basis of accounting
supplemented with additional disclosure items. Under the cash basis of accounting transactions
and other events are recognised when cash is received or paid. Under the accrual basis of
accounting transactions and other events are recognised when incurred and not when cash is
received or paid.
2. Revenue
Appropriated funds Voted funds are the amounts appropriated to a department in accordance with the final budget
known as the Adjusted Estimates of Provincial Expenditure. Unexpended voted funds are
surrendered to the Provincial Revenue Fund, unless otherwise stated.
Departmental revenue Tax revenue
A tax receipt is defined as compulsory, irrecoverable revenue collected by entities. Tax receipts
are recognised as revenue in the statement of financial performance on receipt of the funds.
Sale of goods and services other than capital assets
This comprises the proceeds from the sale of goods and/or services produced by the entity.
Revenue is recognised in the statement of financial performance on receipt of the funds.
Fines, penalties and forfeits
Fines, penalties and forfeits are compulsory receipts imposed by court or quasi-judicial body.
Interest, dividends and rent on land
Interest and dividends received are recognised upon receipt of the funds, and no provision is
made for interest or dividends receivable from the last receipt date to the end of the reporting
WESTERN CAPE PROVINCE PROVINCIAL TREASURY
VOTE 3
ACCOUNTING POLICIES for the year ended 31 March 2005
74
Annual Report 2004/05
period. They are recognised as revenue in the Statement of Financial Performance of the
department and then transferred to the Provincial Revenue Fund.
Revenue received from the rent of land is recognised in the statement of financial performance
on receipt of the funds.
3. Expenditure
Compensation of employees
Salaries and wages comprise payments to employees. Salaries and wages are recognised as an
expense in the statement of financial performance when the final authorisation for payment is
effected on the system. The expenditure is classified as capital where the employees were
involved, on a full time basis, on capital projects during the financial year. All other payments
are classified as current expense.
Social contributions include the entities' contribution to social insurance schemes paid on behalf
of the employee. Social contributions are recognised as an expense in the Statement of Financial
Performance when the final authorisation for payment is effected on the system.
Short-term employee benefits
The cost of short-term employee benefits is expensed in the Statement of Financial Performance
in the reporting period when the final authorisation for payment is effected on the system.
Short-term employee benefits, that give rise to a present legal or constructive obligation are
disclosed as a disclosure note to the Annual Financial Statements and are not recognised in the
Statement of Financial Performance.
Medical benefits
The department provides medical benefits for its employees through contributions to medical
aid funds. Employer contributions to the fund are incurred when money is paid to the fund.
Employment retirement benefits
The department provides retirement benefits for certain of its employees through a defined
benefit plan for government employees. These benefits are funded by both employer and
employee contributions. Employer contributions to the fund are expensed when money is paid
to the fund. No provision is made for retirement benefits in the Annual Financial Statements of
the department.
Goods and services
Payments made for goods and/or services are recognised as an expense in the Statement of
Financial Performance when the final authorisation for payment is effected on the system. The
expense is classified as capital if the goods and services were used on a capital project and when
the cost of a stand alone item is R5 000 or more.
WESTERN CAPE PROVINCE PROVINCIAL TREASURY
VOTE 3
ACCOUNTING POLICIES for the year ended 31 March 2005
Part 4: Annual Financial Statements
75
Financial transactions in assets and liabilities
Financial transactions in assets and liabilities include bad debts written off. Debts are written off
when identified as irrecoverable. Debts written off are limited to the amount of savings and/or
underspending available to the department. The write off occurs at year-end or when funds are
available. No provision is made for irrecoverable amounts.
Unauthorised expenditure
Unauthorised expenditure, is defined as:
the overspending of a vote or a main division within a vote, or
expenditure that was not made in accordance with the purpose of a vote or, in the case of a
main division, not in accordance with the purpose of the main division.
Such expenditure is treated as a current asset in the Statement of Financial Position until such
expenditure is approved by the relevant authority, recovered or written off as irrecoverable.
Irregular expenditure
Irregular expenditure, is defined as:
expenditure, other than unauthorised expenditure, incurred in contravention or not in
accordance with a requirement of any applicable legislation, including:
the Public Finance Management Act;
the State Tender Board Act, or any regulations made in terms of this act; or
any provincial legislation providing for procurement procedures in that provincial
government.
It is treated as expenditure in the Statement of Financial Performance. If such expenditure is not
condoned and it is possibly recoverable it is disclosed as receivable in the Statement of Financial
Position at year-end.
Fruitless and wasteful expenditure
Fruitless and wasteful expenditure, is defined as:
expenditure that was made in vain and would have been avoided had reasonable care been
exercised, therefore:
it must be recovered from a responsible official (a debtor account should be raised); or
the vote (if responsibility cannot be determined).
Such expenditure is treated as a current asset in the Statement of Financial Position until such
expenditure is recovered from the responsible official or written off as irrecoverable.
WESTERN CAPE PROVINCE PROVINCIAL TREASURY
VOTE 3
ACCOUNTING POLICIES for the year ended 31 March 2005
76
Annual Report 2004/05
4. Transfers and subsidies Transfers and subsidies include all irrecoverable payments made by the entity. Transfers and
subsidies are recognised as an expense when the final authorisation for payment is effected on
the system.
5. Expenditure for capital assets Capital assets are assets that can be used repeatedly and continuously in production for more
than one year and cost R5 000 or more for stand alone items. Payments made for capital assets
are recognised as an expense in the Statement of Financial Performance when the final
authorisation for payment is effected on the system.
6. Receivables Receivables are not normally recognised under the modified cash basis of accounting. However,
receivables included in the Statement of Financial Position arise from cash payments that are
recoverable from another party, when the payments are made.
Receivables for services delivered are not recognised in the Statement of Financial Position as a
current asset or as income in the Statement of Financial Performance, as the Annual Financial
Statements are prepared on a modified cash basis of accounting, but are disclosed separately as
part of the disclosure notes to enhance the usefulness of the Annual Financial Statements.
7. Cash and cash equivalentsCash and cash equivalents consists of cash on hand and balances with banks, short term
investments in money market instruments and demand deposits. Cash equivalents are short
term highly liquid investments that are readily convertible to known amounts of cash and which
are subject to an insignificant risk of changes in value.
8. Payables Payables are not normally recognised under the modified cash basis of accounting. However,
payables included in the Statement of Financial Position arise from advances received that are
due to the Provincial Revenue Fund or another party.
9. Lease commitments Lease commitments for the period remaining from the reporting date until the end of the lease
contract are disclosed as part of the disclosure notes to the Annual Financial Statements. These
commitments are not recognised in the Statement of Financial Position as a liability or as
expenditure in the Statement of Financial Performance as the Annual Financial Statements are
prepared on the modified cash basis of accounting.
Operating lease expenditure is expensed when the final authorisation for payment is effected on
the system.
WESTERN CAPE PROVINCE PROVINCIAL TREASURY
VOTE 3
ACCOUNTING POLICIES for the year ended 31 March 2005
Part 4: Annual Financial Statements
77
Finance lease expenditure is expensed when the final authorisation for payment is effected on
the system, but results in the acquisition of the asset under the lease agreement. A finance lease
is not allowed in terms of the Public Finance Management Act.
10. Accruals This amount represents goods/services that have been received, but no invoice has been received
from the supplier at the reporting date, or an invoice has been received but final authorisation
for payment has not been effected on the system. These amounts are not recognised in the
Statement of Financial Position as a liability or as expenditure in the Statement of Financial
Performance as the Annual Financial Statements are prepared on a modified cash basis of
accounting, but are however disclosed as part of the disclosure notes.
11. Contingent liability
This is a possible obligation that arises from past events and whose existence will be confirmed
only by the occurrence or non-occurrence of one or more uncertain future events not wholly
within the control of the department; or
a present obligation that arises from past events but is not recognised because:
it is not probable that an outflow of resources embodying economic benefits or service
potential will be required to settle the obligation; or
the amount of the obligation cannot be measured with sufficient reliability.
Contingent liabilities are not recognised in the Statement of Financial Position, but the
information is disclosed as part of the disclosure notes.
12. Commitments This amount represents goods/services that have been approved and/or contracted, but no
delivery has taken place at the reporting date. These amounts are not recognised in the
Statement of Financial Position as a liability or as expenditure in the Statement of Financial
Performance as the Annual Financial Statements are prepared on a modified cash basis of
accounting, but are however disclosed as part of the disclosure notes.
13. Comparative figures Where necessary, comparative figures have been restated to conform to the changes in the
presentation in the current year. The comparative figures shown in these Annual Financial
Statements are limited to the figures shown in the previous year's audited Annual Financial
Statements and such other comparative figures that the department may reasonably have
available for reporting. Reclassification of expenditure has occurred due to the implementation
of the Standard Chart of Accounts. It is not practical to present comparative amounts in the Cash
Flow Statements as this would involve reclassification of amounts dating back to the 2003/04
year-end.
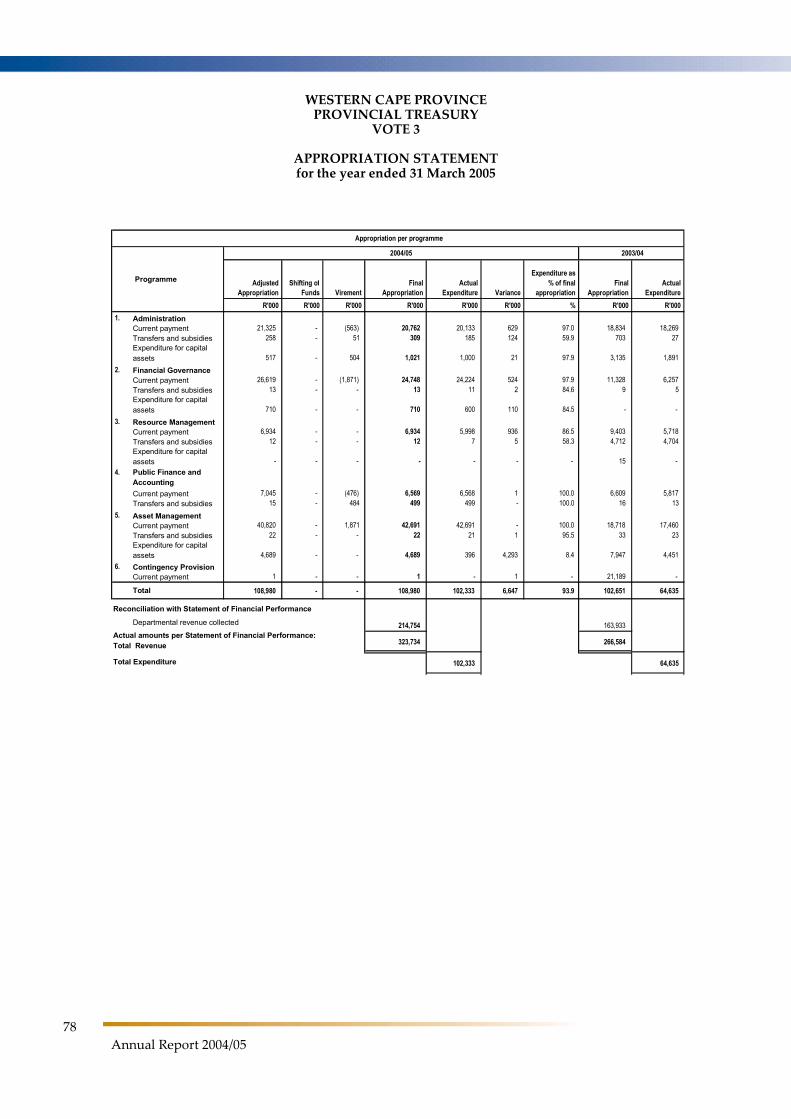
WESTERN CAPE PROVINCE PROVINCIAL TREASURY
VOTE 3
APPROPRIATION STATEMENT for the year ended 31 March 2005
78
Annual Report 2004/05
Programme AdjustedAppropriation
Shifting ofFunds Virement
FinalAppropriation
ActualExpenditure Variance
Expenditure as % of final
appropriationFinal
AppropriationActual
ExpenditureR'000 R'000 R'000 R'000 R'000 R'000 % R'000 R'000
1. Administration Current payment 21,325 - (563) 20,762 20,133 629 97.0 18,834 18,269 Transfers and subsidies 258 - 51 309 185 124 59.9 703 27
Expenditure for capital assets 517 - 504 1,021 1,000 21 97.9 3,135 1,891
2. Financial Governance Current payment 26,619 - (1,871) 24,748 24,224 524 97.9 11,328 6,257 Transfers and subsidies 13 - - 13 11 2 84.6 9 5
Expenditure for capital assets 710 - - 710 600 110 84.5 - -
3. Resource Management Current payment 6,934 - - 6,934 5,998 936 86.5 9,403 5,718 Transfers and subsidies 12 - - 12 7 5 58.3 4,712 4,704
Expenditure for capital assets - - - - - - - 15 -
4. Public Finance and Accounting
Current payment 7,045 - (476) 6,569 6,568 1 100.0 6,609 5,817 Transfers and subsidies 15 - 484 499 499 - 100.0 16 13 5. Asset Management Current payment 40,820 - 1,871 42,691 42,691 - 100.0 18,718 17,460 Transfers and subsidies 22 - - 22 21 1 95.5 33 23
Expenditure for capital assets 4,689 - - 4,689 396 4,293 8.4 7,947 4,451
6. Contingency Provision Current payment 1 - - 1 - 1 - 21,189 -
Total 108,980 - - 108,980 102,333 6,647 93.9 102,651 64,635
214,754 163,933
323,734 266,584
102,333 64,635 Total Expenditure
Reconciliation with Statement of Financial Performance
Actual amounts per Statement of Financial Performance:Total Revenue
Departmental revenue collected
2004/05
Appropriation per programme
2003/04
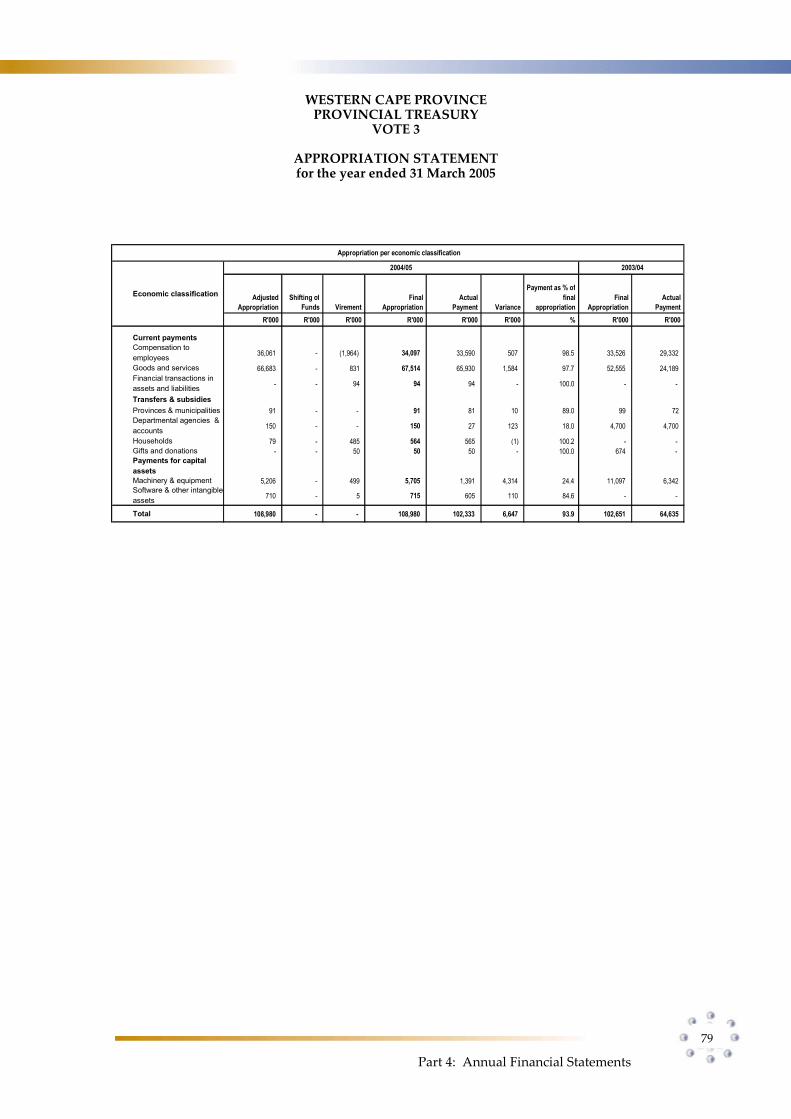
WESTERN CAPE PROVINCE PROVINCIAL TREASURY
VOTE 3
APPROPRIATION STATEMENT for the year ended 31 March 2005
Part 4: Annual Financial Statements
79
Economic classification AdjustedAppropriation
Shifting ofFunds Virement
FinalAppropriation
ActualPayment Variance
Payment as % offinal
appropriation Final
Appropriation Actual
Payment R'000 R'000 R'000 R'000 R'000 R'000 % R'000 R'000
Current payments
Compensation to employees
36,061 - (1,964) 34,097 33,590 507 98.5 33,526 29,332
Goods and services 66,683 - 831 67,514 65,930 1,584 97.7 52,555 24,189
Financial transactions in assets and liabilities
- - 94 94 94 - 100.0 - -
Transfers & subsidies
Provinces & municipalities 91 - - 91 81 10 89.0 99 72
Departmental agencies & accounts
150 - - 150 27 123 18.0 4,700 4,700
Households 79 - 485 564 565 (1) 100.2 - - Gifts and donations - - 50 50 50 - 100.0 674 -
Payments for capital assets
Machinery & equipment 5,206 - 499 5,705 1,391 4,314 24.4 11,097 6,342
Software & other intangible assets
710 - 5 715 605 110 84.6 - -
Total 108,980 - - 108,980 102,333 6,647 93.9 102,651 64,635
2004/05 2003/04
Appropriation per economic classification
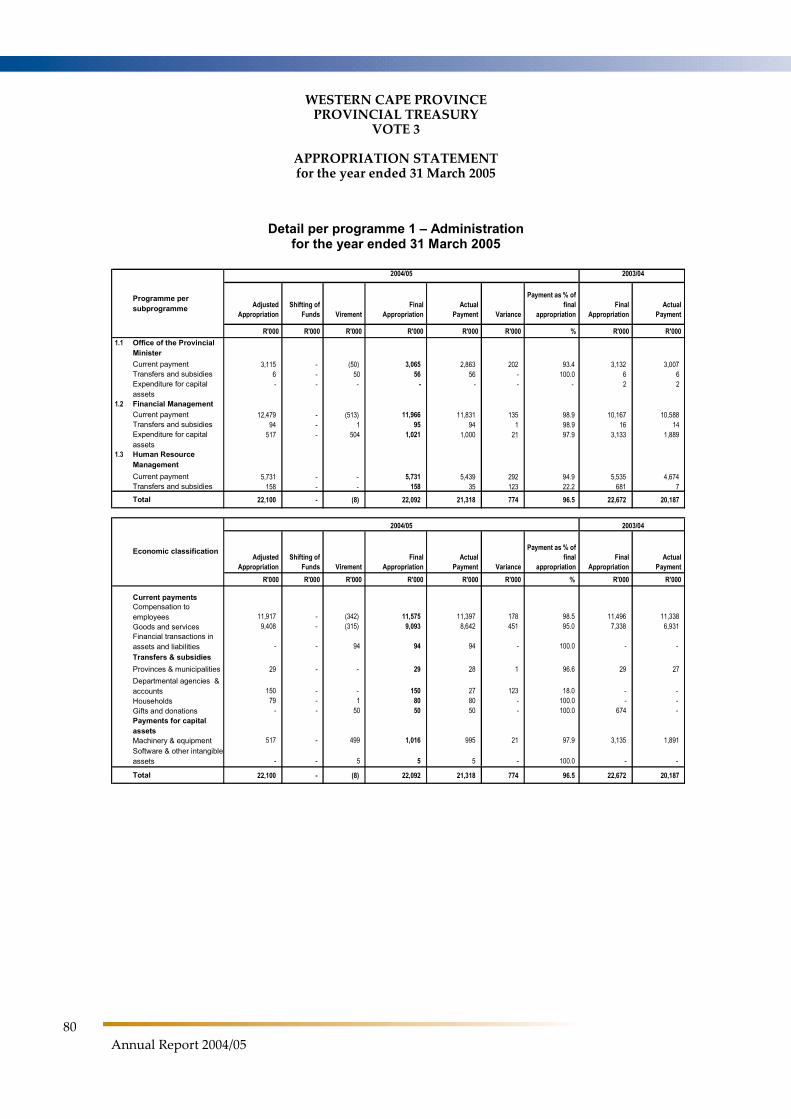
WESTERN CAPE PROVINCE PROVINCIAL TREASURY
VOTE 3
APPROPRIATION STATEMENT for the year ended 31 March 2005
80
Annual Report 2004/05
Detail per programme 1 – Administration for the year ended 31 March 2005
Programme per subprogramme Adjusted
Appropriation Shifting of
Funds Virement Final
Appropriation Actual
Payment Variance
Payment as % offinal
appropriation Final
Appropriation Actual
Payment
R'000 R'000 R'000 R'000 R'000 R'000 % R'000 R'000 1.1 Office of the Provincial
Minister
Current payment 3,115 - (50) 3,065 2,863 202 93.4 3,132 3,007 Transfers and subsidies 6 - 50 56 56 - 100.0 6 6 Expenditure for capital
assets - - - - - - - 2 2
1.2 Financial Management
Current payment 12,479 - (513) 11,966 11,831 135 98.9 10,167 10,588 Transfers and subsidies 94 - 1 95 94 1 98.9 16 14 Expenditure for capital
assets 517 - 504 1,021 1,000 21 97.9 3,133 1,889
1.3 Human Resource Management
Current payment 5,731 - - 5,731 5,439 292 94.9 5,535 4,674 Transfers and subsidies 158 - - 158 35 123 22.2 681 7 Total 22,100 - (8) 22,092 21,318 774 96.5 22,672 20,187
AdjustedAppropriation
Shifting ofFunds Virement
FinalAppropriation
ActualPayment Variance
Payment as % offinal
appropriation Final
Appropriation Actual
Payment R'000 R'000 R'000 R'000 R'000 R'000 % R'000 R'000
Current payments Compensation to
employees 11,917 - (342) 11,575 11,397 178 98.5 11,496 11,338 Goods and services 9,408 - (315) 9,093 8,642 451 95.0 7,338 6,931 Financial transactions in
assets and liabilities - - 94 94 94 - 100.0 - - Transfers & subsidies
Provinces & municipalities 29 - - 29 28 1 96.6 29 27 Departmental agencies &
accounts 150 - - 150 27 123 18.0 - - Households 79 - 1 80 80 - 100.0 - - Gifts and donations - - 50 50 50 - 100.0 674 - Payments for capital
assets Machinery & equipment 517 - 499 1,016 995 21 97.9 3,135 1,891 Software & other intangible
assets - - 5 5 5 - 100.0 - -
Total 22,100 - (8) 22,092 21,318 774 96.5 22,672 20,187
2004/05
Economic classification
2004/05 2003/04
2003/04
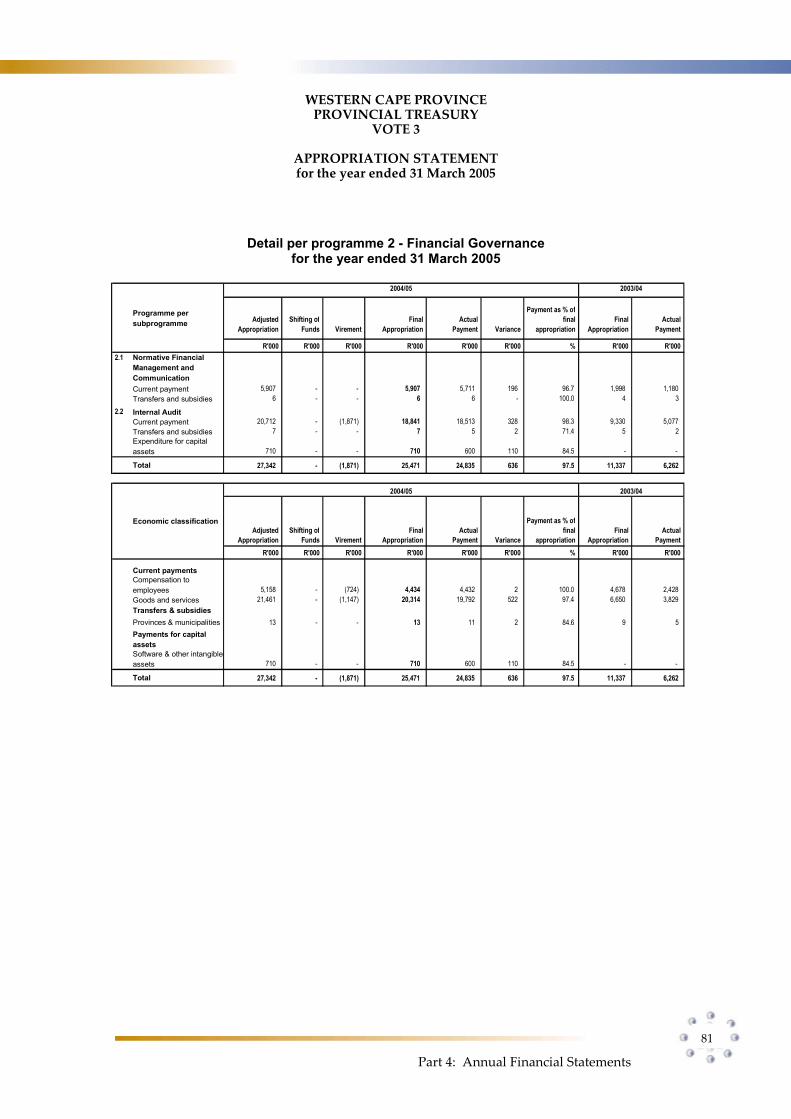
WESTERN CAPE PROVINCE PROVINCIAL TREASURY
VOTE 3
APPROPRIATION STATEMENT for the year ended 31 March 2005
Part 4: Annual Financial Statements
81
Detail per programme 2 - Financial Governance for the year ended 31 March 2005
Programme per subprogramme Adjusted
Appropriation Shifting of
Funds Virement Final
Appropriation Actual
Payment Variance
Payment as % offinal
appropriation Final
Appropriation Actual
Payment
R'000 R'000 R'000 R'000 R'000 R'000 % R'000 R'000 2.1 Normative Financial
Management and Communication
Current payment 5,907 - - 5,907 5,711 196 96.7 1,998 1,180 Transfers and subsidies 6 - - 6 6 - 100.0 4 3 2.2 Internal Audit Current payment 20,712 - (1,871) 18,841 18,513 328 98.3 9,330 5,077 Transfers and subsidies 7 - - 7 5 2 71.4 5 2
Expenditure for capital assets 710 - - 710 600 110 84.5 - -
Total 27,342 - (1,871) 25,471 24,835 636 97.5 11,337 6,262
Economic classification Adjusted
Appropriation Shifting of
Funds Virement Final
Appropriation Actual
Payment Variance
Payment as % offinal
appropriation Final
Appropriation Actual
Payment R'000 R'000 R'000 R'000 R'000 R'000 % R'000 R'000
Current payments Compensation to
employees 5,158 - (724) 4,434 4,432 2 100.0 4,678 2,428 Goods and services 21,461 - (1,147) 20,314 19,792 522 97.4 6,650 3,829 Transfers & subsidies
Provinces & municipalities 13 - - 13 11 2 84.6 9 5 Payments for capital
assets Software & other intangible
assets 710 - - 710 600 110 84.5 - -
Total 27,342 - (1,871) 25,471 24,835 636 97.5 11,337 6,262
2004/05 2003/04
2004/05 2003/04
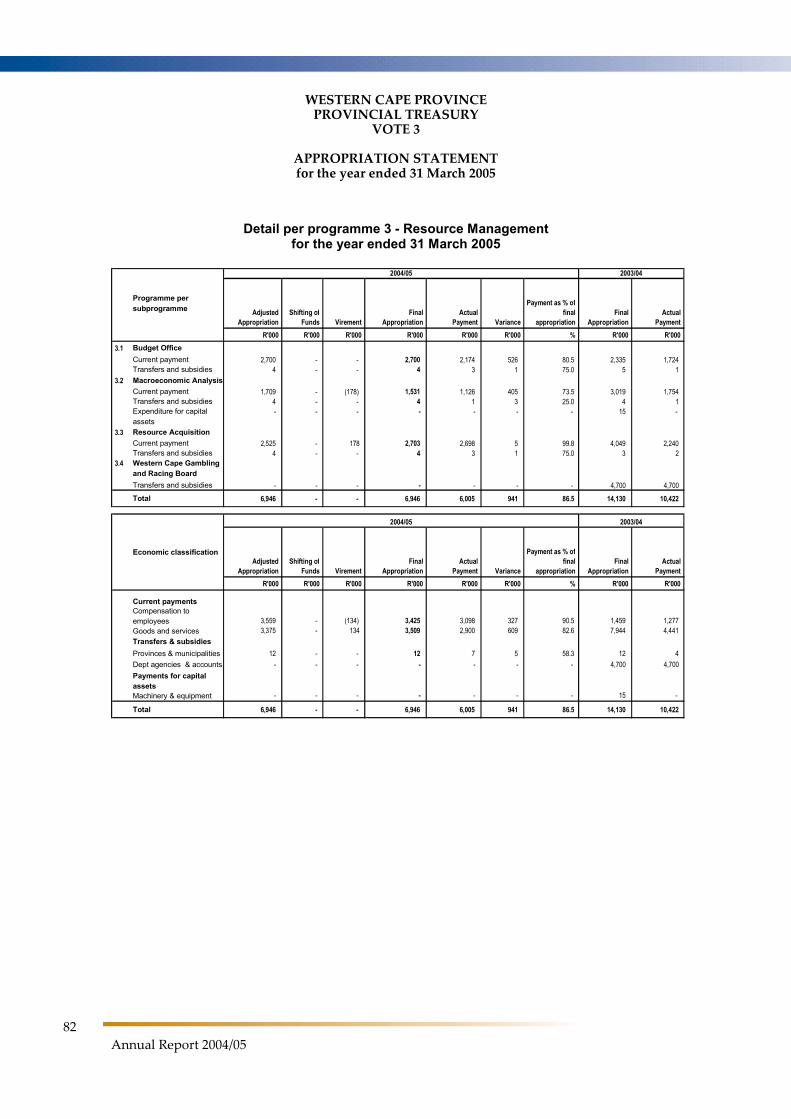
WESTERN CAPE PROVINCE PROVINCIAL TREASURY
VOTE 3
APPROPRIATION STATEMENT for the year ended 31 March 2005
82
Annual Report 2004/05
Detail per programme 3 - Resource Management for the year ended 31 March 2005
Programme per subprogramme Adjusted
Appropriation Shifting of
Funds Virement Final
Appropriation Actual
Payment Variance
Payment as % offinal
appropriation Final
Appropriation Actual
Payment R'000 R'000 R'000 R'000 R'000 R'000 % R'000 R'000 3.1 Budget Office Current payment 2,700 - - 2,700 2,174 526 80.5 2,335 1,724 Transfers and subsidies 4 - - 4 3 1 75.0 5 1 3.2 Macroeconomic Analysis
Current payment 1,709 - (178) 1,531 1,126 405 73.5 3,019 1,754 Transfers and subsidies 4 - - 4 1 3 25.0 4 1 Expenditure for capital
assets - - - - - - - 15 -
3.3 Resource Acquisition
Current payment 2,525 - 178 2,703 2,698 5 99.8 4,049 2,240 Transfers and subsidies 4 - - 4 3 1 75.0 3 2 3.4 Western Cape Gambling
and Racing Board
Transfers and subsidies - - - - - - - 4,700 4,700
Total 6,946 - - 6,946 6,005 941 86.5 14,130 10,422
Economic classification Adjusted
Appropriation Shifting of
Funds Virement Final
Appropriation Actual
Payment Variance
Payment as % offinal
appropriation Final
Appropriation Actual
Payment R'000 R'000 R'000 R'000 R'000 R'000 % R'000 R'000
Current payments Compensation to
employees 3,559 - (134) 3,425 3,098 327 90.5 1,459 1,277 Goods and services 3,375 - 134 3,509 2,900 609 82.6 7,944 4,441 Transfers & subsidies
Provinces & municipalities 12 - - 12 7 5 58.3 12 4 Dept agencies & accounts - - - - - - - 4,700 4,700 Payments for capital
assets Machinery & equipment - - - - - - - 15 -
Total 6,946 - - 6,946 6,005 941 86.5 14,130 10,422
2004/05 2003/04
2004/05 2003/04
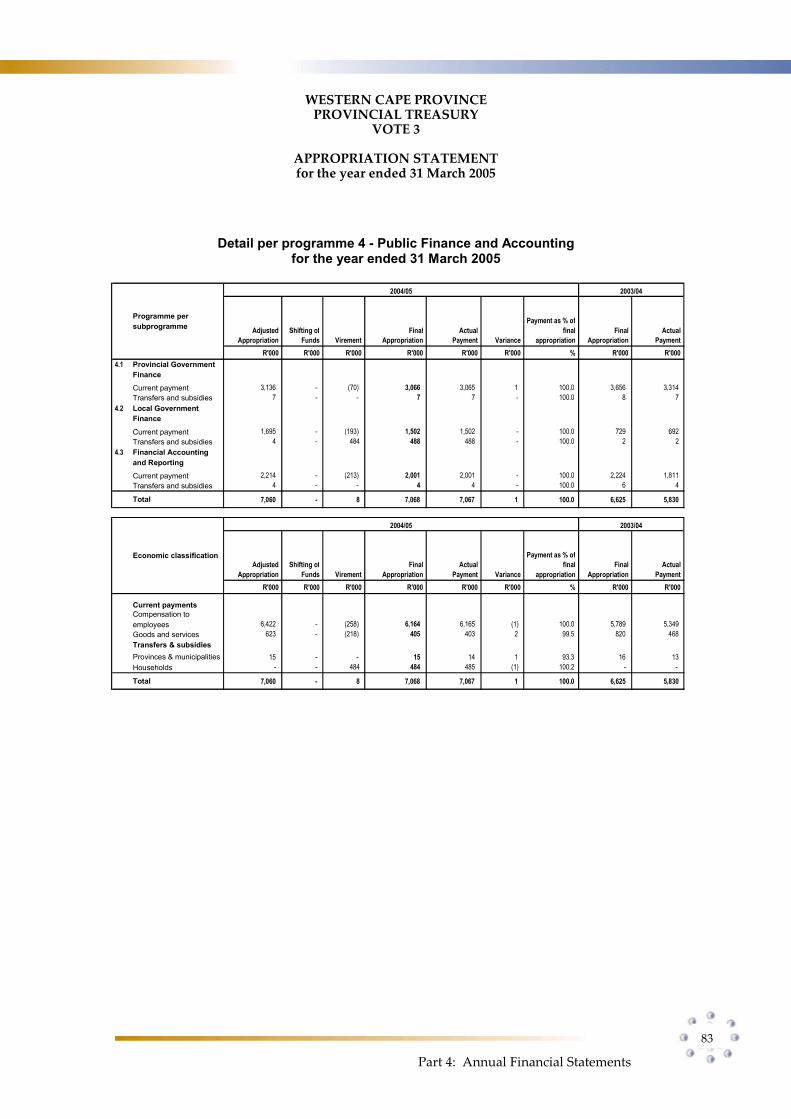
WESTERN CAPE PROVINCE PROVINCIAL TREASURY
VOTE 3
APPROPRIATION STATEMENT for the year ended 31 March 2005
Part 4: Annual Financial Statements
83
Detail per programme 4 - Public Finance and Accounting for the year ended 31 March 2005
Programme per subprogramme Adjusted
Appropriation Shifting of
Funds Virement Final
Appropriation Actual
Payment Variance
Payment as % offinal
appropriation Final
Appropriation Actual
Payment R'000 R'000 R'000 R'000 R'000 R'000 % R'000 R'000 4.1 Provincial Government
Finance
Current payment 3,136 - (70) 3,066 3,065 1 100.0 3,656 3,314 Transfers and subsidies 7 - - 7 7 - 100.0 8 7 4.2 Local Government
Finance
Current payment 1,695 - (193) 1,502 1,502 - 100.0 729 692 Transfers and subsidies 4 - 484 488 488 - 100.0 2 2 4.3 Financial Accounting
and Reporting
Current payment 2,214 - (213) 2,001 2,001 - 100.0 2,224 1,811 Transfers and subsidies 4 - - 4 4 - 100.0 6 4
Total 7,060 - 8 7,068 7,067 1 100.0 6,625 5,830
Economic classification Adjusted
Appropriation Shifting of
Funds Virement Final
Appropriation Actual
Payment Variance
Payment as % offinal
appropriation Final
Appropriation Actual
Payment R'000 R'000 R'000 R'000 R'000 R'000 % R'000 R'000
Current payments Compensation to
employees 6,422 - (258) 6,164 6,165 (1) 100.0 5,789 5,349 Goods and services 623 - (218) 405 403 2 99.5 820 468 Transfers & subsidies
Provinces & municipalities 15 - - 15 14 1 93.3 16 13 Households - - 484 484 485 (1) 100.2 - -
Total 7,060 - 8 7,068 7,067 1 100.0 6,625 5,830
2004/05 2003/04
2004/05 2003/04
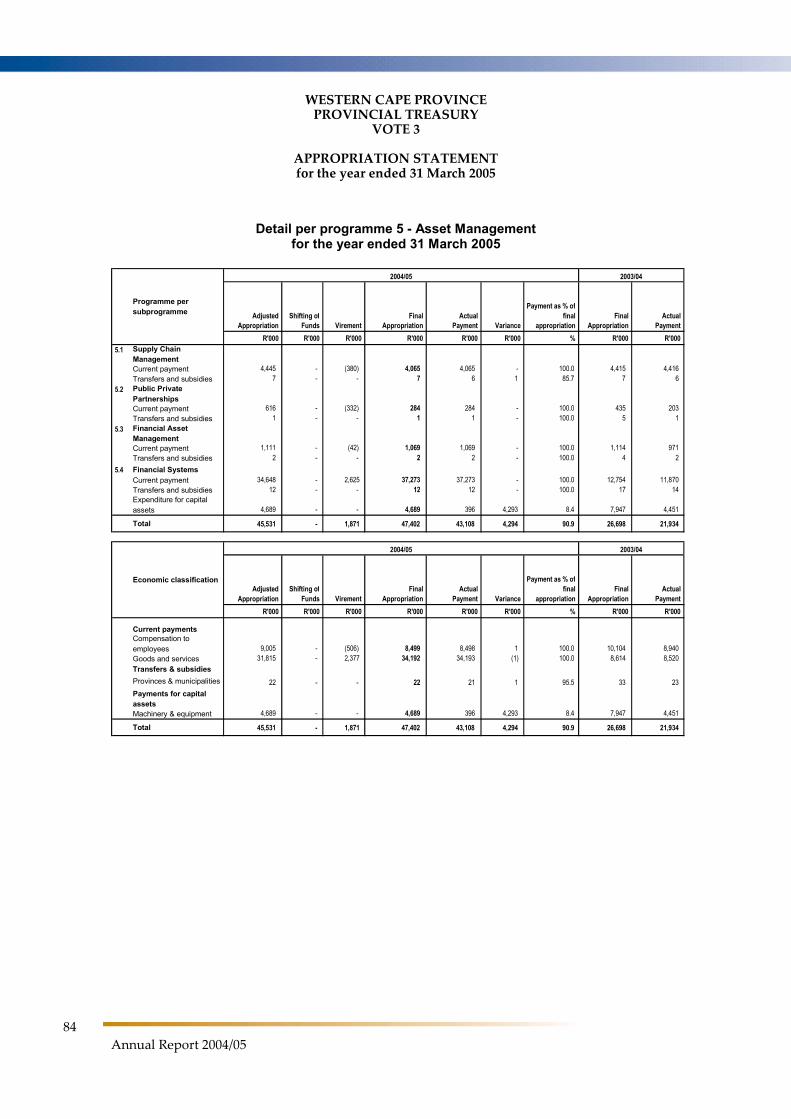
WESTERN CAPE PROVINCE PROVINCIAL TREASURY
VOTE 3
APPROPRIATION STATEMENT for the year ended 31 March 2005
84
Annual Report 2004/05
Detail per programme 5 - Asset Management for the year ended 31 March 2005
Programme per subprogramme Adjusted
Appropriation Shifting of
Funds Virement Final
Appropriation Actual
Payment Variance
Payment as % offinal
appropriation Final
Appropriation Actual
Payment R'000 R'000 R'000 R'000 R'000 R'000 % R'000 R'000 5.1 Supply Chain
Management Current payment 4,445 - (380) 4,065 4,065 - 100.0 4,415 4,416 Transfers and subsidies 7 - - 7 6 1 85.7 7 6 5.2 Public Private
Partnerships Current payment 616 - (332) 284 284 - 100.0 435 203 Transfers and subsidies 1 - - 1 1 - 100.0 5 1 5.3 Financial Asset
Management Current payment 1,111 - (42) 1,069 1,069 - 100.0 1,114 971 Transfers and subsidies 2 - - 2 2 - 100.0 4 2 5.4 Financial Systems
Current payment 34,648 - 2,625 37,273 37,273 - 100.0 12,754 11,870 Transfers and subsidies 12 - - 12 12 - 100.0 17 14
Expenditure for capital assets 4,689 - - 4,689 396 4,293 8.4 7,947 4,451
Total 45,531 - 1,871 47,402 43,108 4,294 90.9 26,698 21,934
Economic classification Adjusted
Appropriation Shifting of
Funds Virement Final
Appropriation Actual
Payment Variance
Payment as % offinal
appropriation Final
Appropriation Actual
Payment R'000 R'000 R'000 R'000 R'000 R'000 % R'000 R'000
Current payments Compensation to
employees 9,005 - (506) 8,499 8,498 1 100.0 10,104 8,940 Goods and services 31,815 - 2,377 34,192 34,193 (1) 100.0 8,614 8,520 Transfers & subsidies
Provinces & municipalities 22 - - 22 21 1 95.5 33 23 Payments for capital
assets Machinery & equipment 4,689 - - 4,689 396 4,293 8.4 7,947 4,451
Total 45,531 - 1,871 47,402 43,108 4,294 90.9 26,698 21,934
2004/05 2003/04
2004/05 2003/04
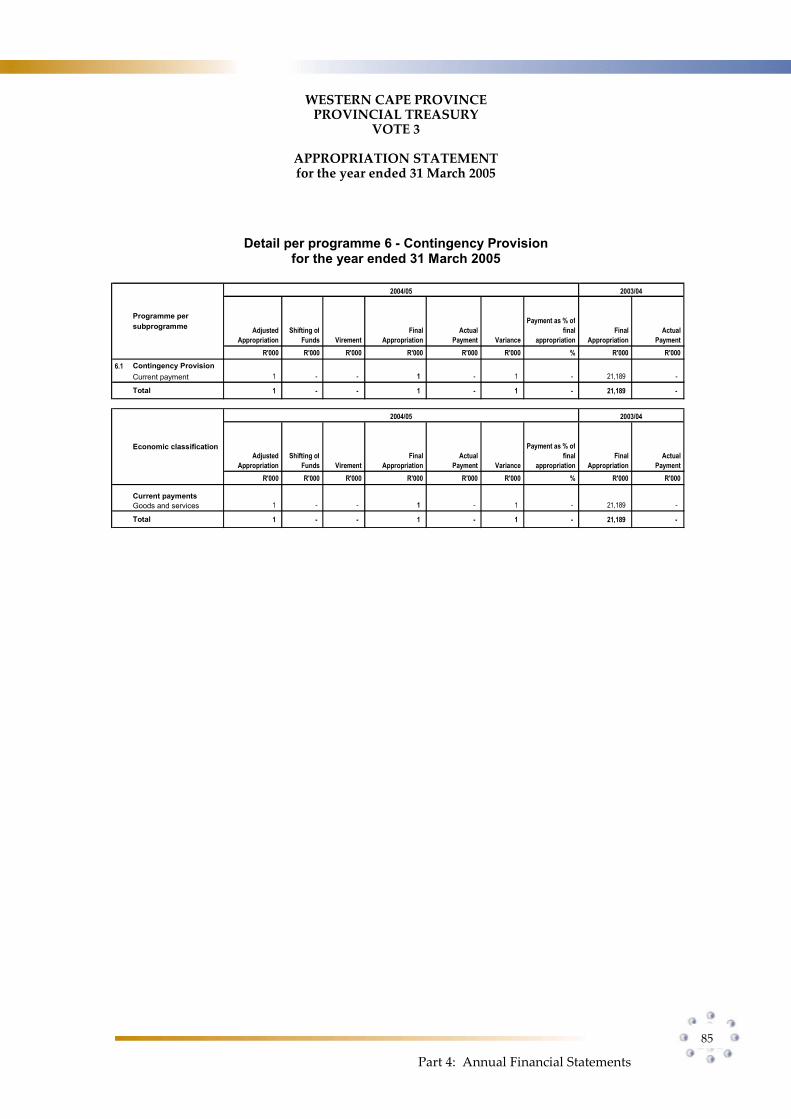
WESTERN CAPE PROVINCE PROVINCIAL TREASURY
VOTE 3
APPROPRIATION STATEMENT for the year ended 31 March 2005
Part 4: Annual Financial Statements
85
Detail per programme 6 - Contingency Provision for the year ended 31 March 2005
Programme per subprogramme Adjusted
Appropriation Shifting of
Funds Virement Final
Appropriation Actual
Payment Variance
Payment as % offinal
appropriation Final
Appropriation Actual
Payment R'000 R'000 R'000 R'000 R'000 R'000 % R'000 R'000 6.1 Contingency Provision Current payment 1 - - 1 - 1 - 21,189 -
Total 1 - - 1 - 1 - 21,189 -
Economic classification Adjusted
Appropriation Shifting of
Funds Virement Final
Appropriation Actual
Payment Variance
Payment as % offinal
appropriation Final
Appropriation Actual
Payment R'000 R'000 R'000 R'000 R'000 R'000 % R'000 R'000
Current payments Goods and services 1 - - 1 - 1 - 21,189 -
Total 1 - - 1 - 1 - 21,189 -
2004/05 2003/04
2004/05 2003/04
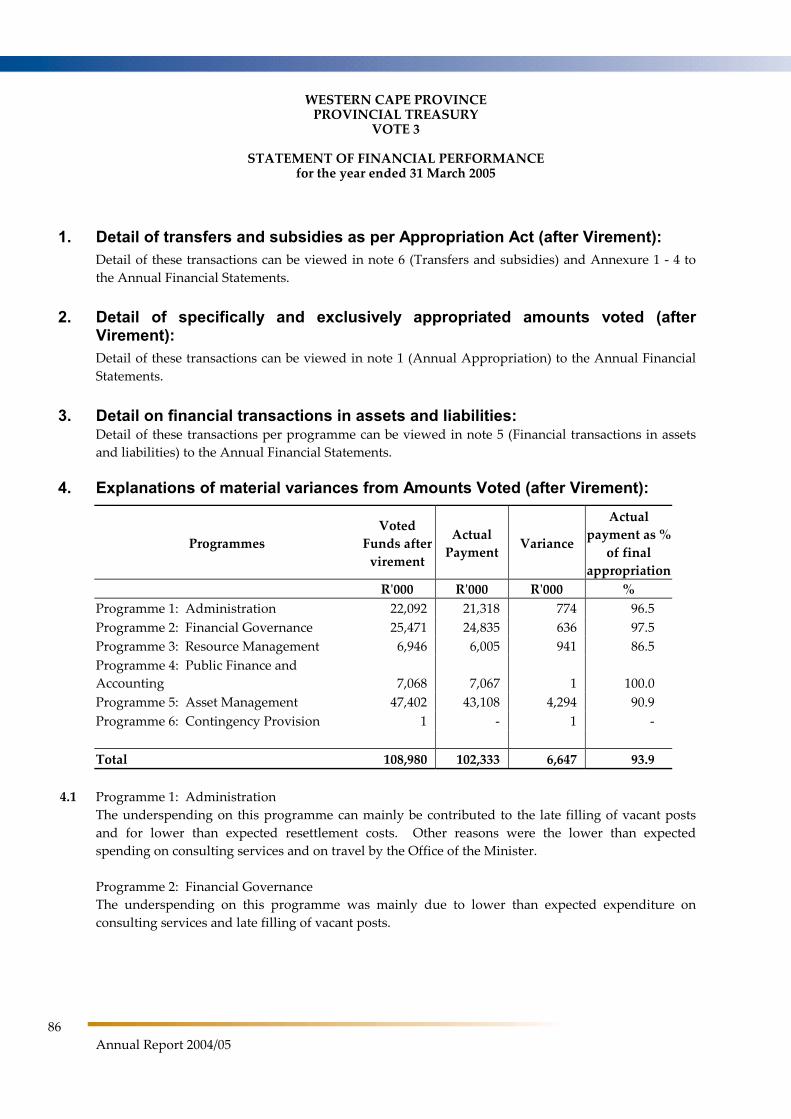
WESTERN CAPE PROVINCE PROVINCIAL TREASURY
VOTE 3
STATEMENT OF FINANCIAL PERFORMANCE for the year ended 31 March 2005
86
Annual Report 2004/05
1. Detail of transfers and subsidies as per Appropriation Act (after Virement): Detail of these transactions can be viewed in note 6 (Transfers and subsidies) and Annexure 1 - 4 to
the Annual Financial Statements.
2. Detail of specifically and exclusively appropriated amounts voted (after Virement): Detail of these transactions can be viewed in note 1 (Annual Appropriation) to the Annual Financial
Statements.
3. Detail on financial transactions in assets and liabilities: Detail of these transactions per programme can be viewed in note 5 (Financial transactions in assets
and liabilities) to the Annual Financial Statements.
4. Explanations of material variances from Amounts Voted (after Virement):
Programmes
Voted
Funds after
virement
Actual
Payment Variance
Actual
payment as %
of final
appropriation
R'000 R'000 R'000 %
Programme 1: Administration 22,092 21,318 774 96.5
Programme 2: Financial Governance 25,471 24,835 636 97.5
Programme 3: Resource Management 6,946 6,005 941 86.5
Programme 4: Public Finance and
Accounting 7,068 7,067 1 100.0
Programme 5: Asset Management 47,402 43,108 4,294 90.9
Programme 6: Contingency Provision 1 - 1 -
Total 108,980 102,333 6,647 93.9
4.1 Programme 1: Administration
The underspending on this programme can mainly be contributed to the late filling of vacant posts
and for lower than expected resettlement costs. Other reasons were the lower than expected
spending on consulting services and on travel by the Office of the Minister.
Programme 2: Financial Governance
The underspending on this programme was mainly due to lower than expected expenditure on
consulting services and late filling of vacant posts.
WESTERN CAPE PROVINCE PROVINCIAL TREASURY
VOTE 3
STATEMENT OF FINANCIAL PERFORMANCE for the year ended 31 March 2005
Part 4: Annual Financial Statements
87
Programme 3: Resource Management
Underspending on this programme was attributed to less than expected expenditure on consulting
services and the late filling of vacant posts.
Programme 4: Public Finance and Accounting
There are no material variances to report on.
Programme 5: Asset Management
The underspending on Asset Management was mainly due to planned spending on computer
equipment related to the LOGIS implementation that did not realise in time before the close of the
financial year, the lowering in the tariffs charged for SITA8 mainframe time combined with the late
filling of vacant posts.
Programme 6: Contingency Provision
The amount provided for contingencies was unutilised as no need arose during the financial year.
4.2 Per Economic classification
Current payments:
Compensation to employees
The underspending was due to delays with the recruitment process which resulted from the
restructuring process of the Provincial Treasury as well as an exodus of staff to other provincial
departments and provinces. It was also difficult to find appropriately qualified and skilled officials to
fill these vacant posts.
Goods and services
The underspending can mainly be contributed to lower than expected spending on consulting and
specialised services, specifically related to internal auditing services.
Transfers and subsidies:
Non-profit institutions
The saving was realised due to a lower than expected transfer payment to SETA9.
Payments for capital assets:
Machinery and equipment
The underspending is due to planned spending on computer equipment related to the LOGIS
implementation that did not realise in time before the close of the financial year.
Software and other intangible assets
The saving is due to a lower than expected payment for software licences related to risk management.
8 State Information Technology Agency 9 Sector Education and Training Authority
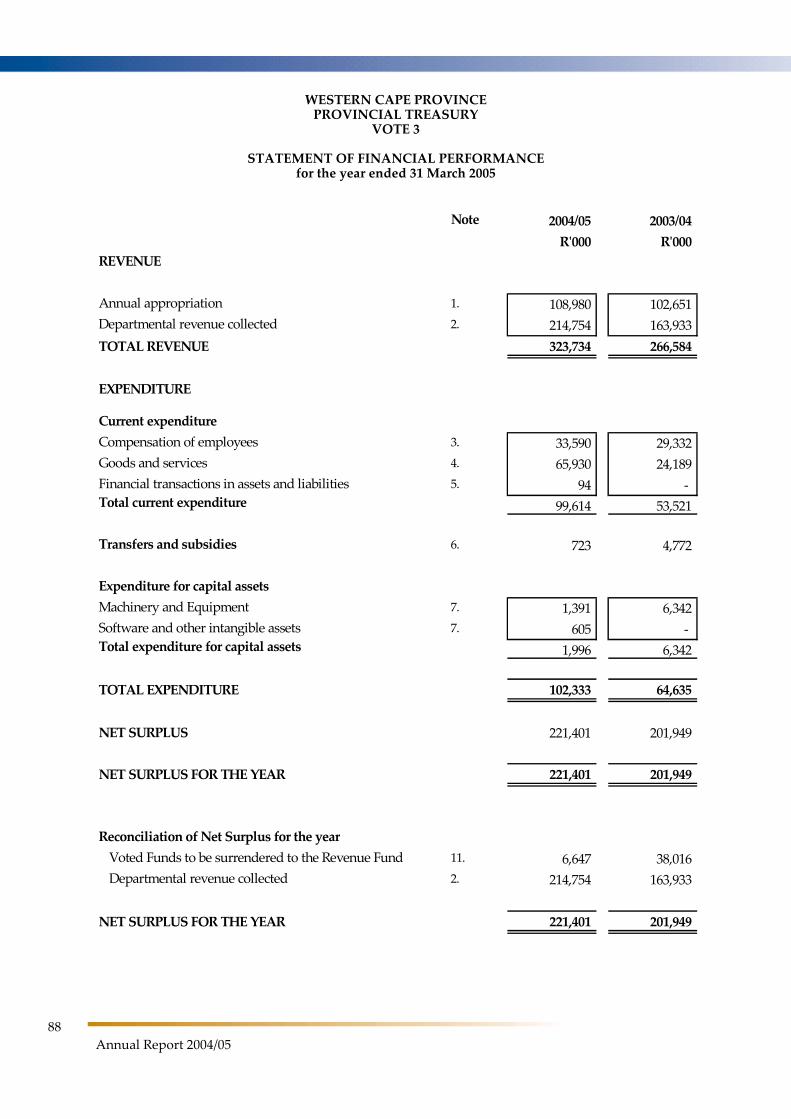
WESTERN CAPE PROVINCE PROVINCIAL TREASURY
VOTE 3
STATEMENT OF FINANCIAL PERFORMANCE for the year ended 31 March 2005
88
Annual Report 2004/05
Note 2004/05 2003/04
R'000 R'000
REVENUE
Annual appropriation 1. 108,980 102,651
Departmental revenue collected 2. 214,754 163,933
TOTAL REVENUE 323,734 266,584
EXPENDITURE
Current expenditure
Compensation of employees 3. 33,590 29,332
Goods and services 4. 65,930 24,189
Financial transactions in assets and liabilities 5. 94 - Total current expenditure 99,614 53,521
Transfers and subsidies 6. 723 4,772
Expenditure for capital assets
Machinery and Equipment 7. 1,391 6,342
Software and other intangible assets 7. 605 - Total expenditure for capital assets 1,996 6,342
TOTAL EXPENDITURE 102,333 64,635
NET SURPLUS 221,401 201,949
NET SURPLUS FOR THE YEAR 221,401 201,949
Reconciliation of Net Surplus for the year
Voted Funds to be surrendered to the Revenue Fund 11. 6,647 38,016
Departmental revenue collected 2. 214,754 163,933
NET SURPLUS FOR THE YEAR 221,401 201,949
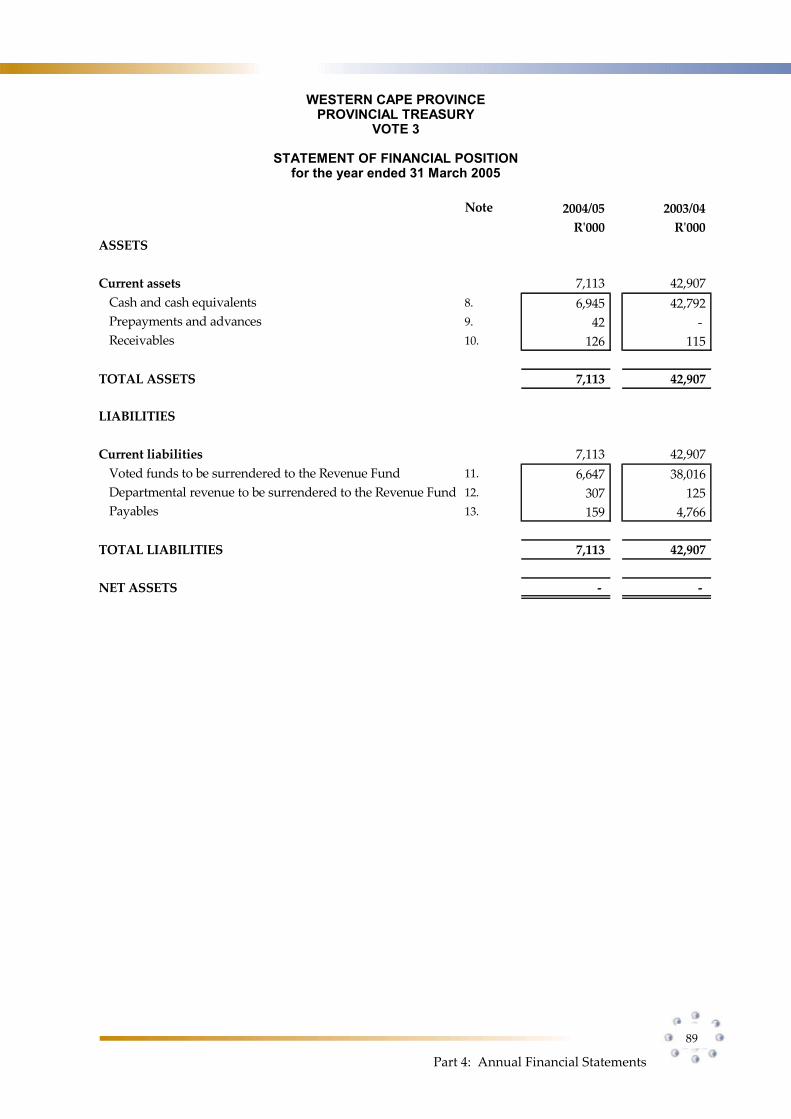
WESTERN CAPE PROVINCE PROVINCIAL TREASURY
VOTE 3
STATEMENT OF FINANCIAL POSITION for the year ended 31 March 2005
Part 4: Annual Financial Statements
89
Note 2004/05 2003/04
R'000 R'000
ASSETS
Current assets 7,113 42,907
Cash and cash equivalents 8. 6,945 42,792
Prepayments and advances 9. 42 -
Receivables 10. 126 115
TOTAL ASSETS 7,113 42,907
LIABILITIES
Current liabilities 7,113 42,907
Voted funds to be surrendered to the Revenue Fund 11. 6,647 38,016
Departmental revenue to be surrendered to the Revenue Fund 12. 307 125
Payables 13. 159 4,766
TOTAL LIABILITIES 7,113 42,907
NET ASSETS - -
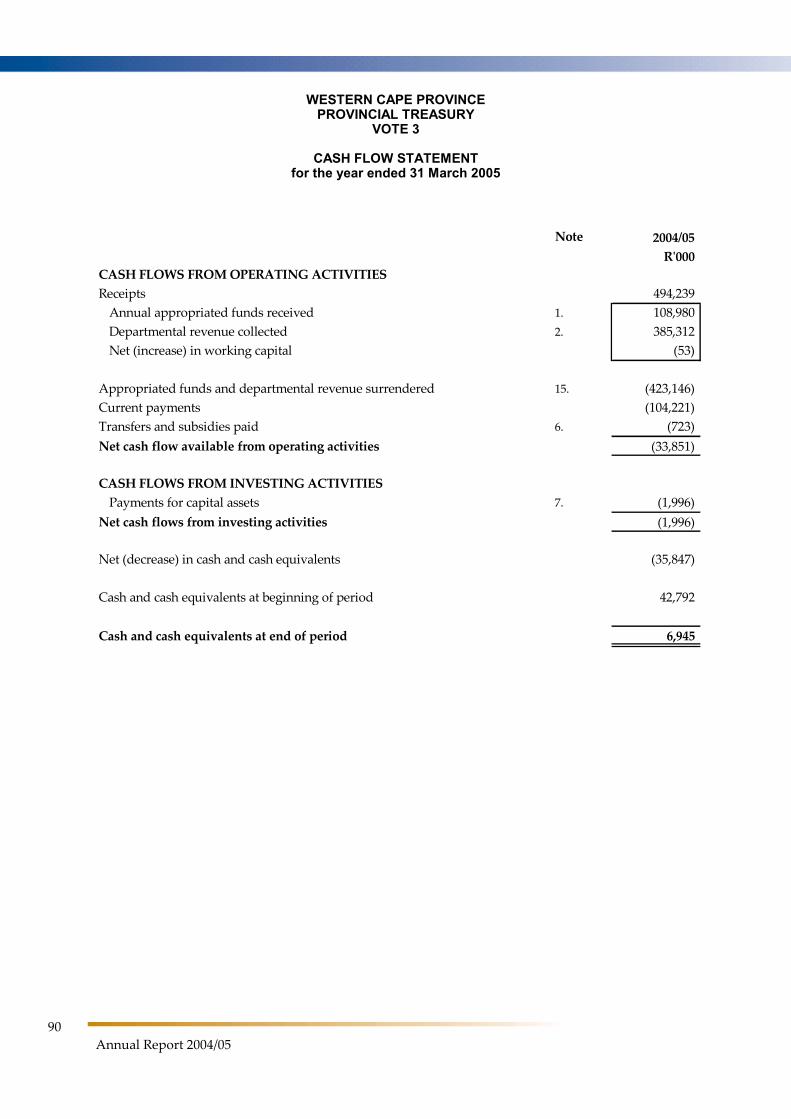
WESTERN CAPE PROVINCE PROVINCIAL TREASURY
VOTE 3
CASH FLOW STATEMENT for the year ended 31 March 2005
90
Annual Report 2004/05
Note 2004/05
R'000
CASH FLOWS FROM OPERATING ACTIVITIES
Receipts 494,239
Annual appropriated funds received 1. 108,980
Departmental revenue collected 2. 385,312
Net (increase) in working capital (53)
Appropriated funds and departmental revenue surrendered 15. (423,146)
Current payments (104,221)
Transfers and subsidies paid 6. (723)
Net cash flow available from operating activities (33,851)
CASH FLOWS FROM INVESTING ACTIVITIES
Payments for capital assets 7. (1,996)
Net cash flows from investing activities (1,996)
Net (decrease) in cash and cash equivalents (35,847)
Cash and cash equivalents at beginning of period 42,792
Cash and cash equivalents at end of period 6,945
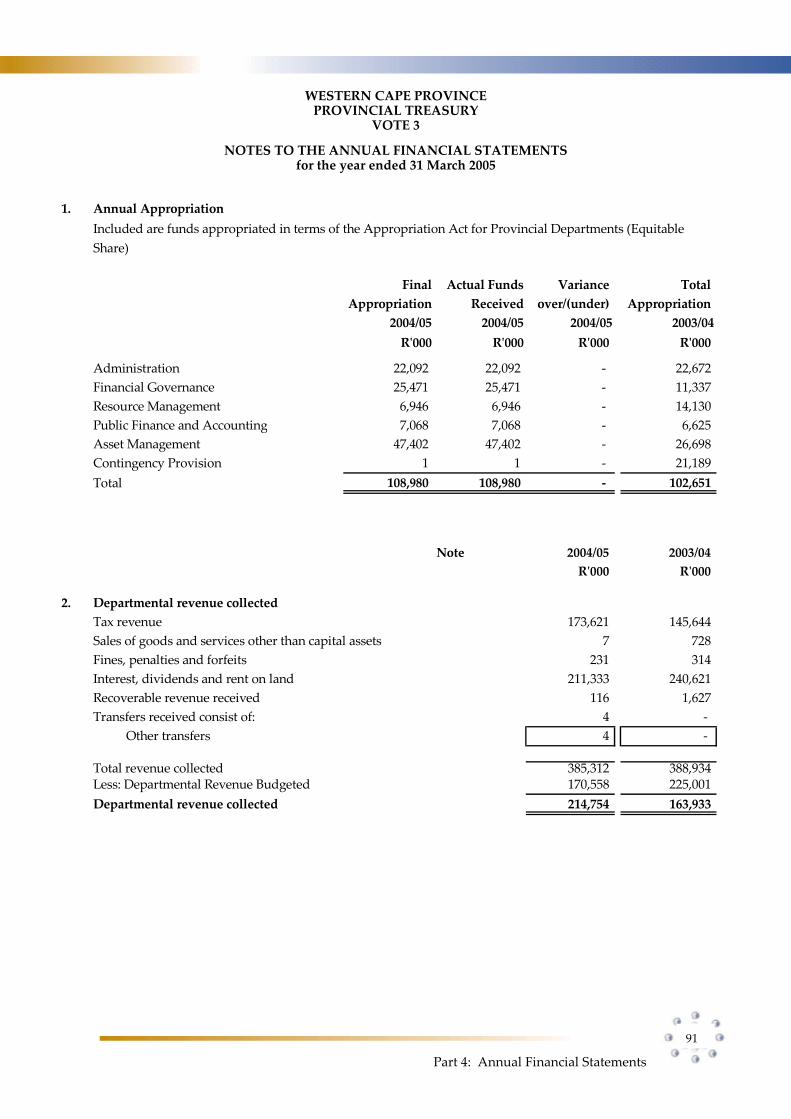
WESTERN CAPE PROVINCE PROVINCIAL TREASURY
VOTE 3
NOTES TO THE ANNUAL FINANCIAL STATEMENTS for the year ended 31 March 2005
Part 4: Annual Financial Statements
91
1. Annual Appropriation
Final Actual Funds Variance Total
Appropriation Received over/(under) Appropriation
2004/05 2004/05 2004/05 2003/04
R'000 R'000 R'000 R'000
Administration 22,092 22,092 - 22,672
Financial Governance 25,471 25,471 - 11,337
Resource Management 6,946 6,946 - 14,130
Public Finance and Accounting 7,068 7,068 - 6,625
Asset Management 47,402 47,402 - 26,698
Contingency Provision 1 1 - 21,189
Total 108,980 108,980 - 102,651
Included are funds appropriated in terms of the Appropriation Act for Provincial Departments (Equitable
Share)
Note 2004/05 2003/04
R'000 R'000
2. Departmental revenue collected
Tax revenue 173,621 145,644
Sales of goods and services other than capital assets 7 728
Fines, penalties and forfeits 231 314
Interest, dividends and rent on land 211,333 240,621
Recoverable revenue received 116 1,627
Transfers received consist of: 4 -
Other transfers 4 -
Total revenue collected 385,312 388,934Less: Departmental Revenue Budgeted 170,558 225,001
Departmental revenue collected 214,754 163,933
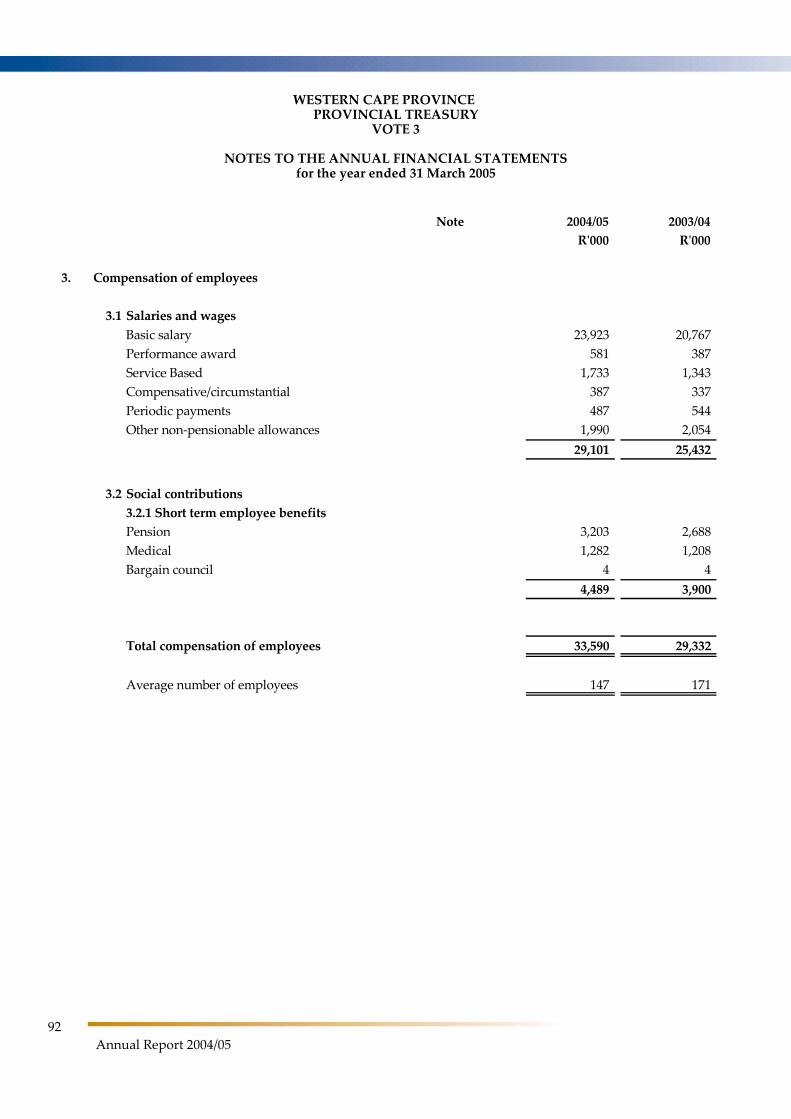
WESTERN CAPE PROVINCE PROVINCIAL TREASURY
VOTE 3
NOTES TO THE ANNUAL FINANCIAL STATEMENTS for the year ended 31 March 2005
92
Annual Report 2004/05
Note 2004/05 2003/04
R'000 R'000
3. Compensation of employees
3.1 Salaries and wages
Basic salary 23,923 20,767
Performance award 581 387
Service Based 1,733 1,343
Compensative/circumstantial 387 337
Periodic payments 487 544
Other non-pensionable allowances 1,990 2,054
29,101 25,432
3.2 Social contributions
3.2.1 Short term employee benefits
Pension 3,203 2,688
Medical 1,282 1,208
Bargain council 4 4
4,489 3,900
Total compensation of employees 33,590 29,332
Average number of employees 147 171
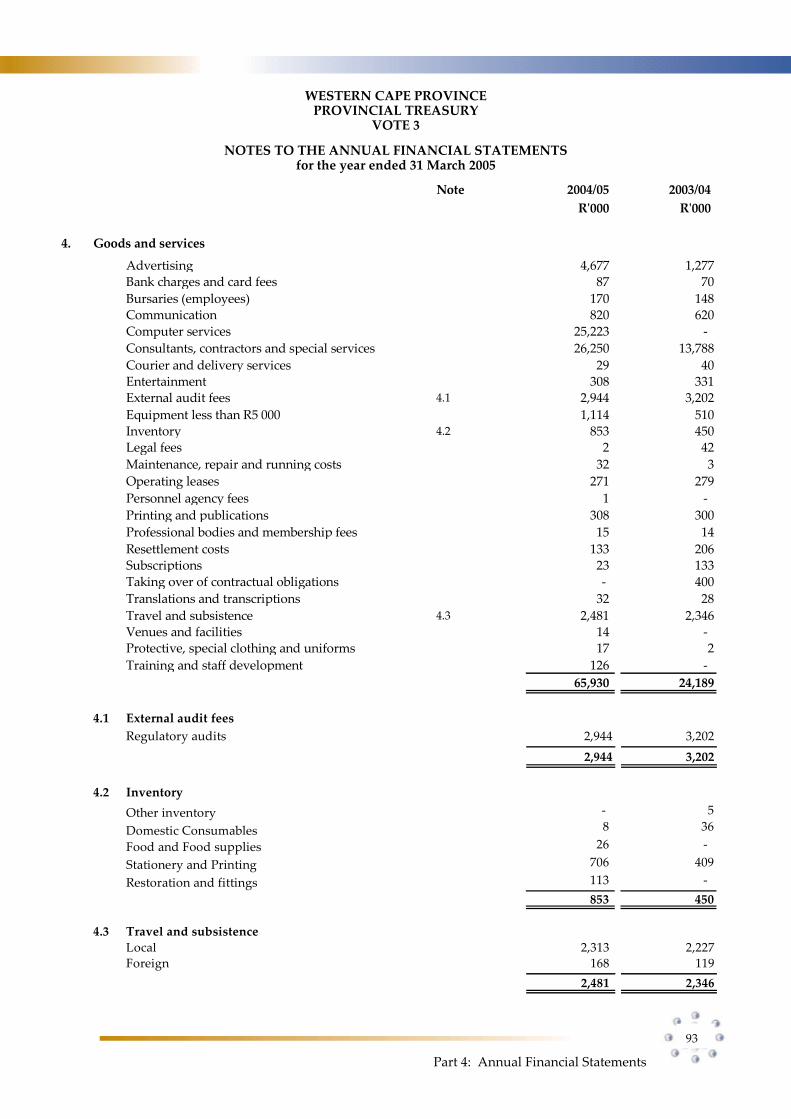
WESTERN CAPE PROVINCE PROVINCIAL TREASURY
VOTE 3
NOTES TO THE ANNUAL FINANCIAL STATEMENTS for the year ended 31 March 2005
Part 4: Annual Financial Statements
93
Note 2004/05 2003/04
R'000 R'000
4. Goods and services
Advertising 4,677 1,277Bank charges and card fees 87 70
Bursaries (employees) 170 148Communication 820 620
Computer services 25,223 -
Consultants, contractors and special services 26,250 13,788
Courier and delivery services 29 40Entertainment 308 331External audit fees 4.1 2,944 3,202
Equipment less than R5 000 1,114 510Inventory 4.2 853 450Legal fees 2 42
Maintenance, repair and running costs 32 3
Operating leases 271 279
Personnel agency fees 1 -
Printing and publications 308 300
Professional bodies and membership fees 15 14
Resettlement costs 133 206Subscriptions 23 133
Taking over of contractual obligations - 400
Translations and transcriptions 32 28
Travel and subsistence 4.3 2,481 2,346Venues and facilities 14 - Protective, special clothing and uniforms 17 2
Training and staff development 126 -
65,930 24,189
4.1 External audit fees
Regulatory audits 2,944 3,202
2,944 3,202
4.2 Inventory
Other inventory - 5
Domestic Consumables 8 36
Food and Food supplies 26 -
Stationery and Printing 706 409
Restoration and fittings 113 -
853 450
4.3 Travel and subsistence
Local 2,313 2,227
Foreign 168 119
2,481 2,346
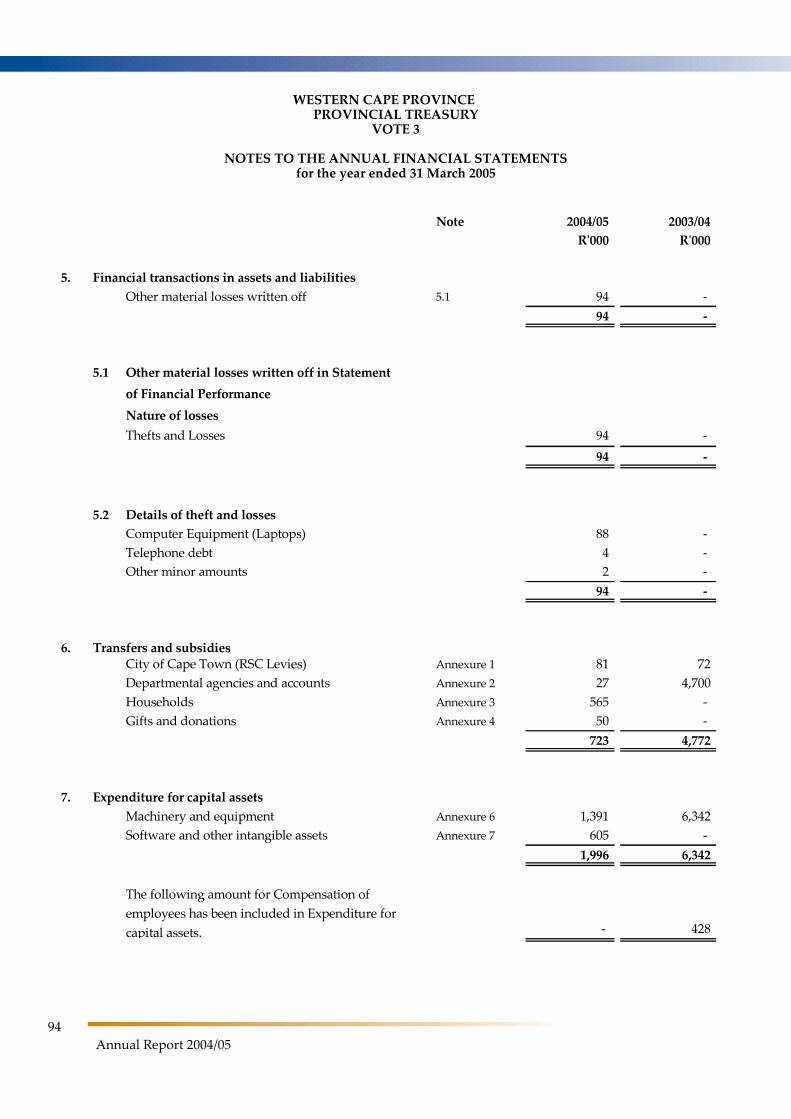
WESTERN CAPE PROVINCE PROVINCIAL TREASURY
VOTE 3
NOTES TO THE ANNUAL FINANCIAL STATEMENTS for the year ended 31 March 2005
94
Annual Report 2004/05
Note 2004/05 2003/04
R'000 R'000
5. Financial transactions in assets and liabilities
Other material losses written off 5.1 94 -
94 -
5.1 Other material losses written off in Statement
of Financial Performance
Nature of losses
94 -
94 -
Thefts and Losses
5.2 Details of theft and losses
88 -
4 -
2 -
94 -
Computer Equipment (Laptops)
Telephone debt
Other minor amounts
6. Transfers and subsidiesCity of Cape Town (RSC Levies) Annexure 1 81 72
Departmental agencies and accounts Annexure 2 27 4,700
Households Annexure 3 565 -
Gifts and donations Annexure 4 50 -
723 4,772
7. Expenditure for capital assets
Machinery and equipment Annexure 6 1,391 6,342
Software and other intangible assets Annexure 7 605 -
1,996 6,342
- 428
The following amount for Compensation of
employees has been included in Expenditure for
capital assets.
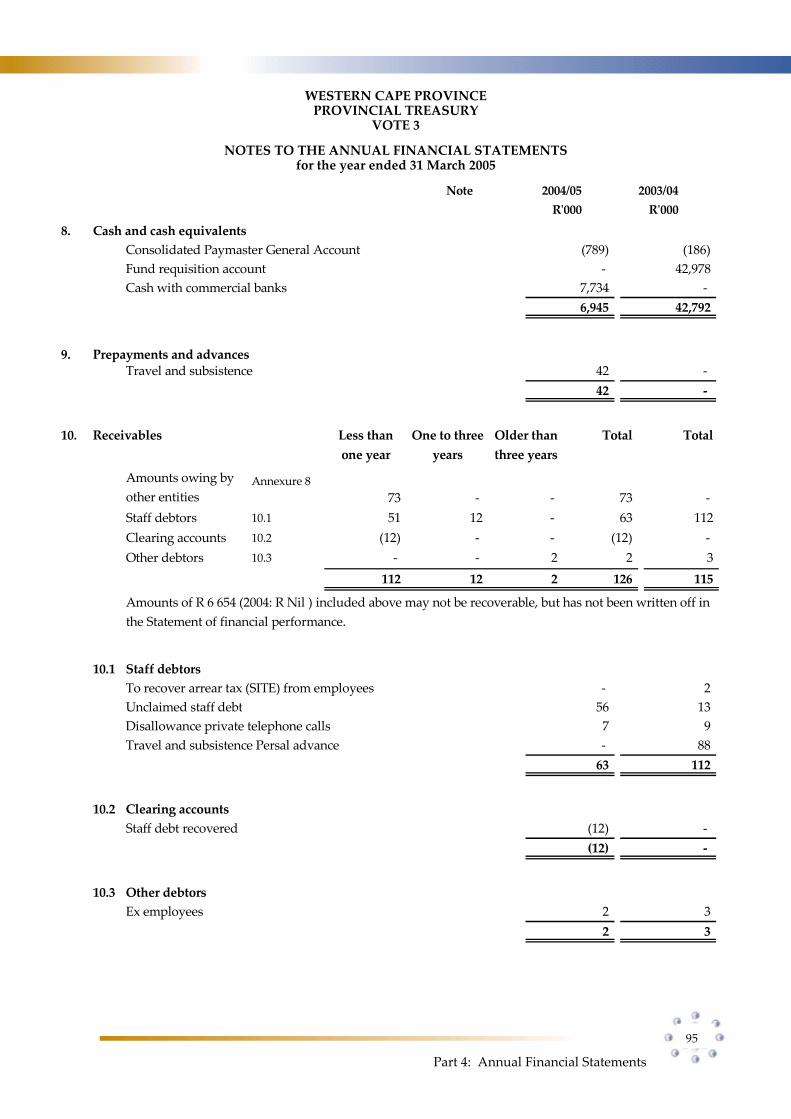
WESTERN CAPE PROVINCE PROVINCIAL TREASURY
VOTE 3
NOTES TO THE ANNUAL FINANCIAL STATEMENTS for the year ended 31 March 2005
Part 4: Annual Financial Statements
95
Note 2004/05 2003/04
R'000 R'000
8. Cash and cash equivalents
Consolidated Paymaster General Account (789) (186)
Fund requisition account - 42,978
Cash with commercial banks 7,734 -
6,945 42,792
9. Prepayments and advancesTravel and subsistence 42 -
42 -
10. Receivables Less than
one year
One to three
years
Older than
three years
Total Total
Annexure 8
73 - - 73 -
Staff debtors 10.1 51 12 - 63 112
Clearing accounts 10.2 (12) - - (12) -
Other debtors 10.3 - - 2 2 3
112 12 2 126 115
Amounts owing by
other entities
Amounts of R 6 654 (2004: R Nil ) included above may not be recoverable, but has not been written off in
the Statement of financial performance.
10.1 Staff debtors
- 2
56 13
7 9
- 88
63 112
Disallowance private telephone calls
Travel and subsistence Persal advance
To recover arrear tax (SITE) from employees
Unclaimed staff debt
10.2 Clearing accounts
(12) -
(12) -
Staff debt recovered
10.3 Other debtors
2 3
2 3
Ex employees
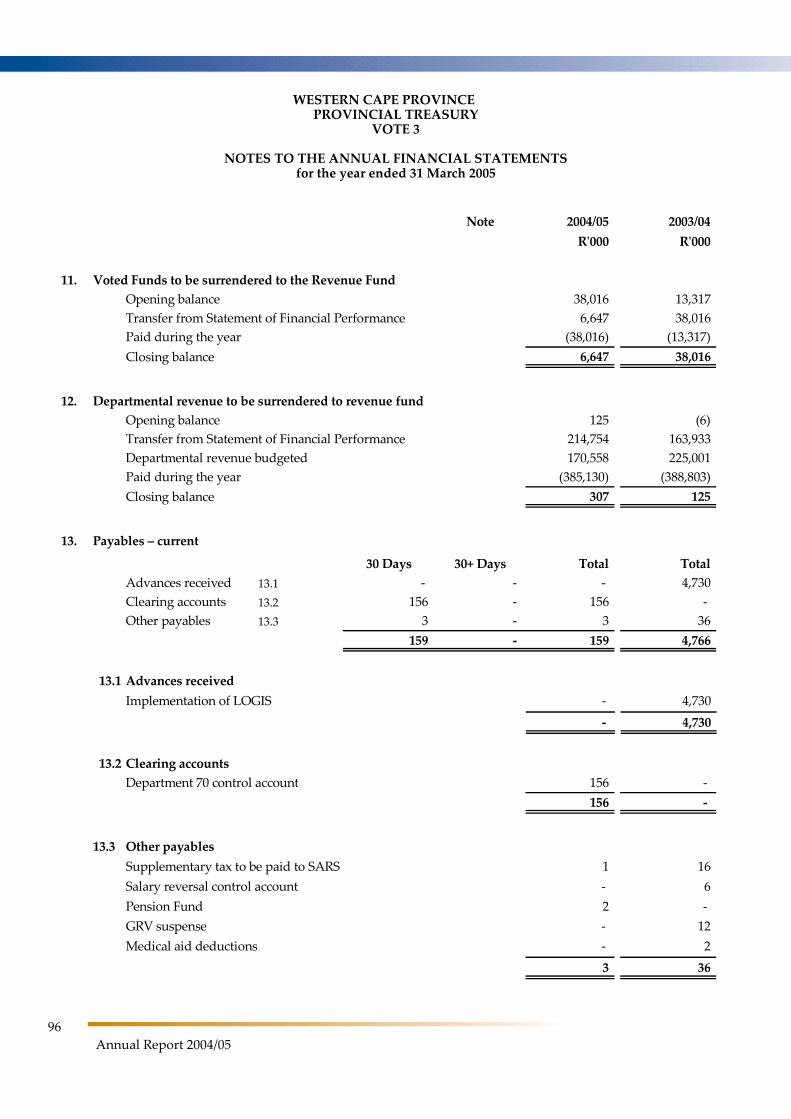
WESTERN CAPE PROVINCE PROVINCIAL TREASURY
VOTE 3
NOTES TO THE ANNUAL FINANCIAL STATEMENTS for the year ended 31 March 2005
96
Annual Report 2004/05
Note 2004/05 2003/04
R'000 R'000
11. Voted Funds to be surrendered to the Revenue Fund
Opening balance 38,016 13,317
Transfer from Statement of Financial Performance 6,647 38,016
Paid during the year (38,016) (13,317)
Closing balance 6,647 38,016
12. Departmental revenue to be surrendered to revenue fund
Opening balance 125 (6)
Transfer from Statement of Financial Performance 214,754 163,933
Departmental revenue budgeted 170,558 225,001
Paid during the year (385,130) (388,803)
Closing balance 307 125
13. Payables – current
30 Days 30+ Days Total Total
13.1 - - - 4,730
13.2 156 - 156 -
13.3 3 - 3 36
159 - 159 4,766
Advances received
Clearing accounts
Other payables
13.1 Advances received
- 4,730
- 4,730
Implementation of LOGIS
13.2 Clearing accounts
156 -
156 -
Department 70 control account
13.3 Other payables
1 16
- 6
2 -
- 12
- 2
3 36
Medical aid deductions
Supplementary tax to be paid to SARS
Salary reversal control account
Pension Fund
GRV suspense
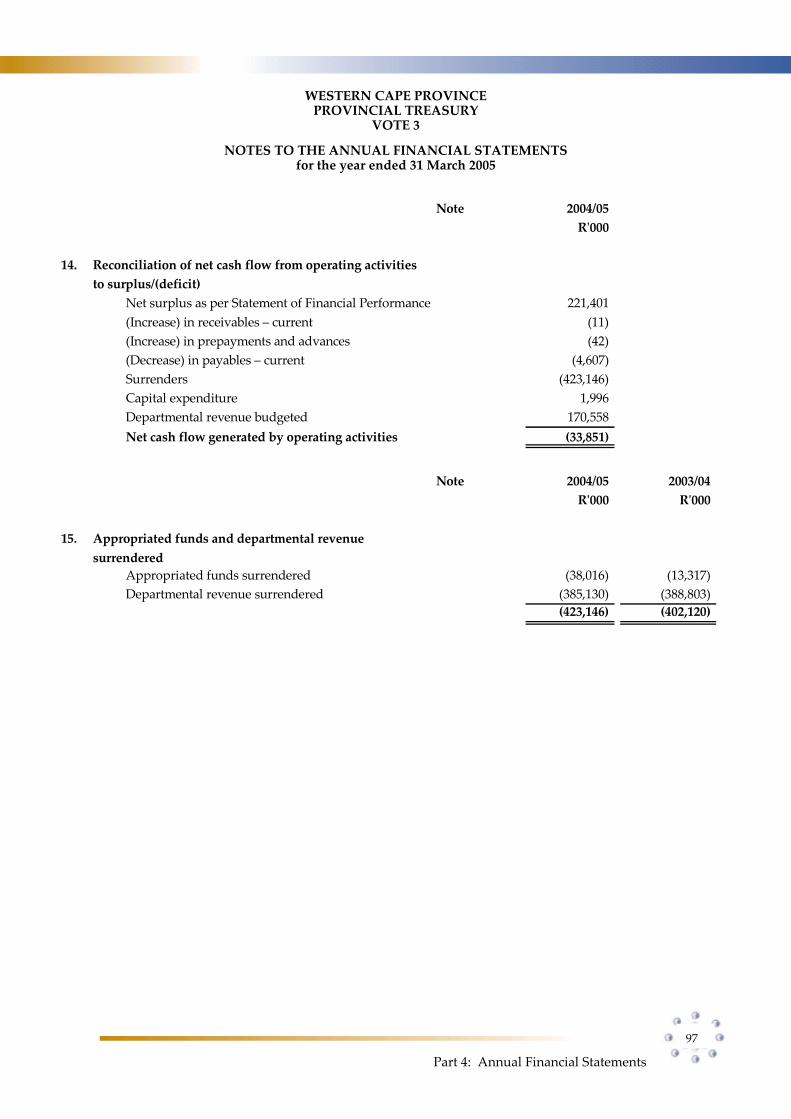
WESTERN CAPE PROVINCE PROVINCIAL TREASURY
VOTE 3
NOTES TO THE ANNUAL FINANCIAL STATEMENTS for the year ended 31 March 2005
Part 4: Annual Financial Statements
97
Note 2004/05
R'000
14. Reconciliation of net cash flow from operating activities
to surplus/(deficit)
Net surplus as per Statement of Financial Performance 221,401
(Increase) in receivables – current (11)
(Increase) in prepayments and advances (42)
(Decrease) in payables – current (4,607)
Surrenders (423,146)
Capital expenditure 1,996
Departmental revenue budgeted 170,558
Net cash flow generated by operating activities (33,851)
Note 2004/05 2003/04
R'000 R'000
15.
Appropriated funds surrendered (38,016) (13,317)
Departmental revenue surrendered (385,130) (388,803)
(423,146) (402,120)
Appropriated funds and departmental revenue
surrendered
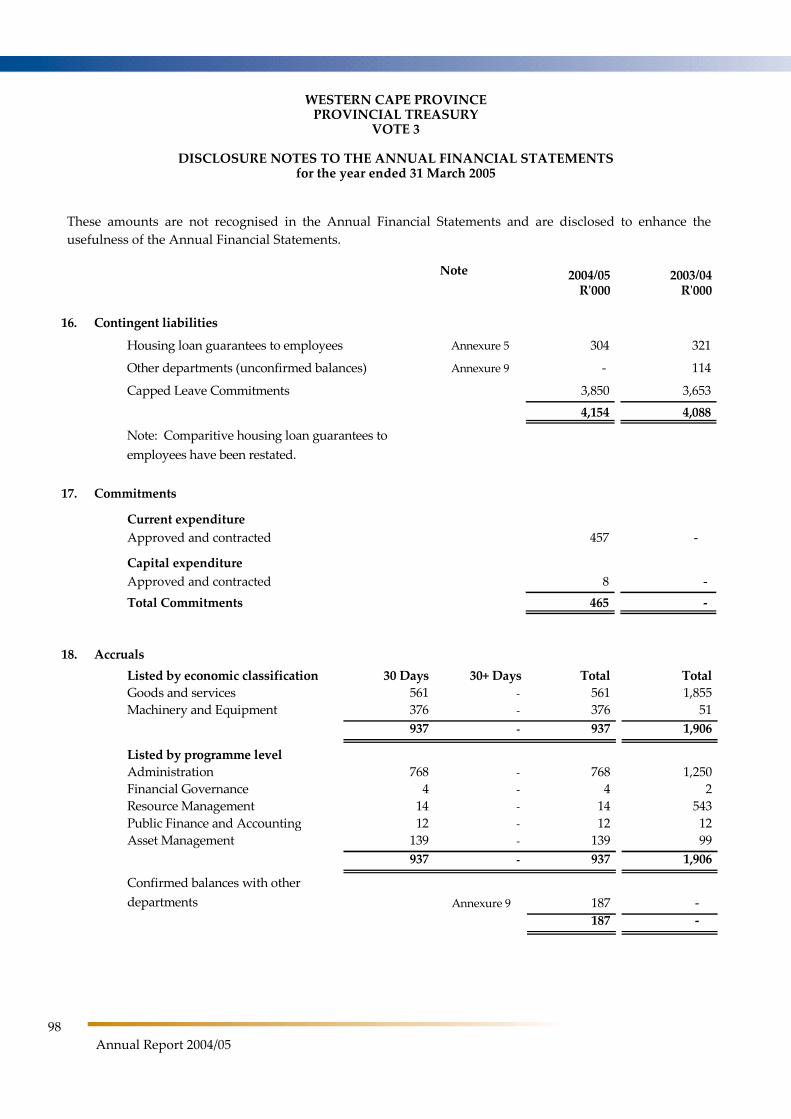
WESTERN CAPE PROVINCE PROVINCIAL TREASURY
VOTE 3
DISCLOSURE NOTES TO THE ANNUAL FINANCIAL STATEMENTS for the year ended 31 March 2005
98
Annual Report 2004/05
These amounts are not recognised in the Annual Financial Statements and are disclosed to enhance the
usefulness of the Annual Financial Statements.
Note 2004/05 2003/04R'000 R'000
16. Contingent liabilities
Housing loan guarantees to employees Annexure 5 304 321
Other departments (unconfirmed balances) Annexure 9 - 114
Capped Leave Commitments 3,850 3,653
4,154 4,088
Note: Comparitive housing loan guarantees to
employees have been restated.
17. Commitments
Current expenditure
Approved and contracted 457 -
Capital expenditure
Approved and contracted 8 -
Total Commitments 465 -
18. Accruals
Listed by economic classification 30 Days 30+ Days Total Total
Goods and services 561 - 561 1,855
Machinery and Equipment 376 - 376 51
937 - 937 1,906
Listed by programme level
Administration 768 - 768 1,250
Financial Governance 4 - 4 2
Resource Management 14 - 14 543
Public Finance and Accounting 12 - 12 12
Asset Management 139 - 139 99
937 - 937 1,906
Annexure 9 187 -
187 -
Confirmed balances with other
departments
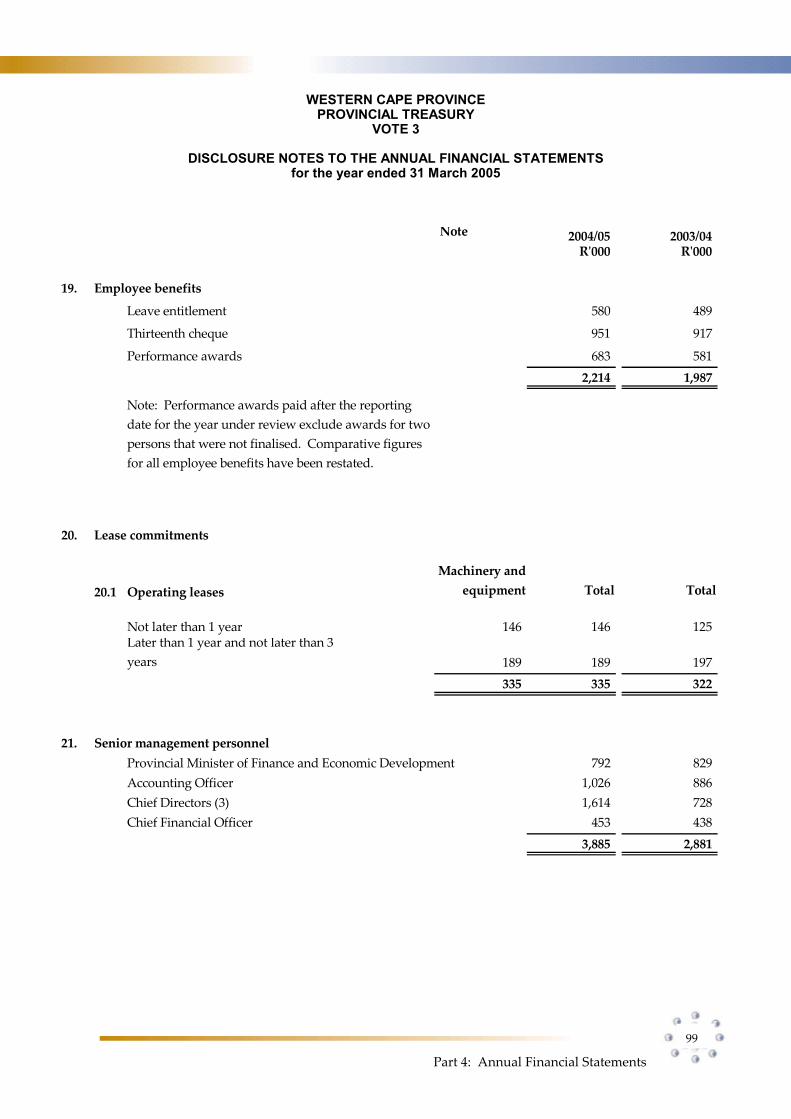
WESTERN CAPE PROVINCE PROVINCIAL TREASURY
VOTE 3
DISCLOSURE NOTES TO THE ANNUAL FINANCIAL STATEMENTS for the year ended 31 March 2005
Part 4: Annual Financial Statements
99
Note 2004/05 2003/04R'000 R'000
19. Employee benefits
Leave entitlement 580 489
Thirteenth cheque 951 917
Performance awards 683 581
2,214 1,987
Note: Performance awards paid after the reporting
date for the year under review exclude awards for two
persons that were not finalised. Comparative figures
for all employee benefits have been restated.
20. Lease commitments
20.1 Operating leases
Machinery and
equipment Total Total
Not later than 1 year 146 146 125
189 189 197
335 335 322
Later than 1 year and not later than 3
years
21. Senior management personnel
Provincial Minister of Finance and Economic Development 792 829
Accounting Officer 1,026 886
Chief Directors (3) 1,614 728
Chief Financial Officer 453 438
3,885 2,881
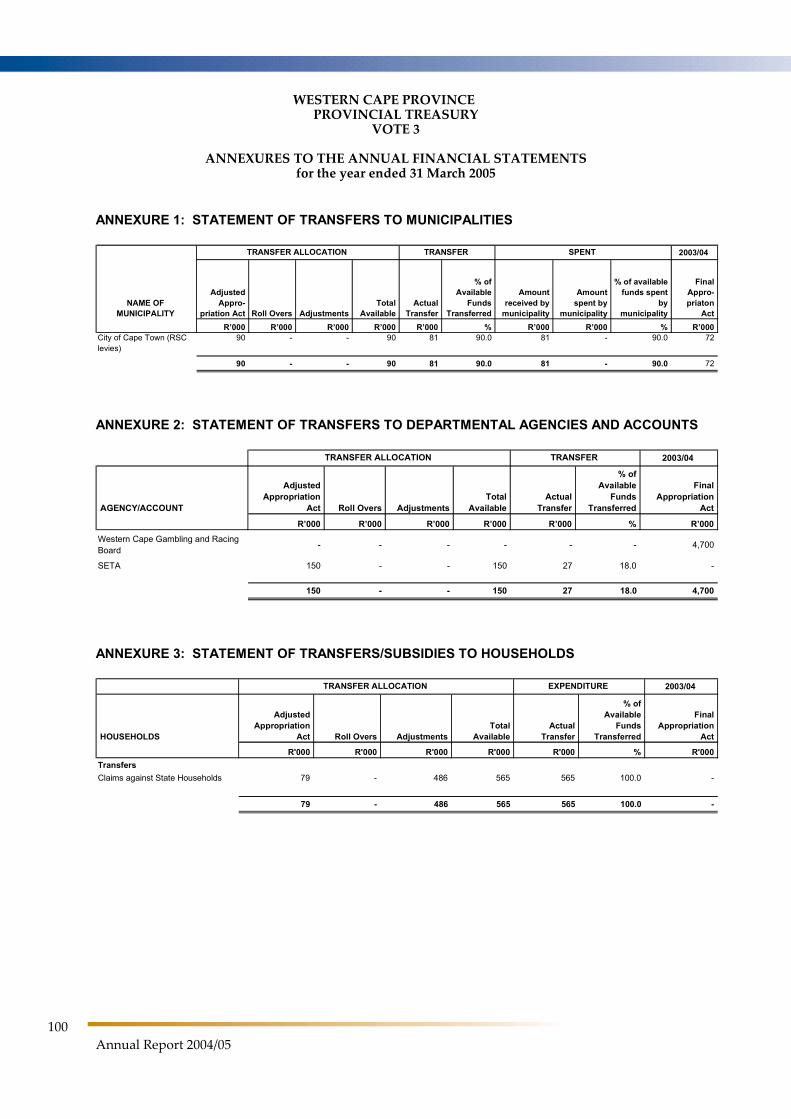
WESTERN CAPE PROVINCE PROVINCIAL TREASURY
VOTE 3
ANNEXURES TO THE ANNUAL FINANCIAL STATEMENTS for the year ended 31 March 2005
100
Annual Report 2004/05
ANNEXURE 1: STATEMENT OF TRANSFERS TO MUNICIPALITIES
2003/04
NAME OF MUNICIPALITY
Adjusted Appro-
priation Act Roll Overs AdjustmentsTotal
AvailableActual
Transfer
% of Available
Funds Transferred
Amount received by
municipality
Amount spent by
municipality
% of available funds spent
by municipality
Final Appro-priaton
Act
R’000 R’000 R’000 R’000 R’000 % R’000 R’000 % R’000City of Cape Town (RSC levies)
90 - - 90 81 90.0 81 - 90.0 72
90 - - 90 81 90.0 81 - 90.0 72
TRANSFER ALLOCATION TRANSFER SPENT
ANNEXURE 2: STATEMENT OF TRANSFERS TO DEPARTMENTAL AGENCIES AND ACCOUNTS
2003/04
AGENCY/ACCOUNT
Adjusted Appropriation
Act Roll Overs AdjustmentsTotal
AvailableActual
Transfer
% ofAvailable
Funds Transferred
Final Appropriation
Act
R’000 R’000 R’000 R’000 R’000 % R’000
Western Cape Gambling and Racing Board
- - - - - - 4,700
SETA 150 - - 150 27 18.0 -
150 - - 150 27 18.0 4,700
TRANSFER ALLOCATION TRANSFER
ANNEXURE 3: STATEMENT OF TRANSFERS/SUBSIDIES TO HOUSEHOLDS
2003/04
HOUSEHOLDS
Adjusted Appropriation
Act Roll Overs AdjustmentsTotal
AvailableActual
Transfer
% ofAvailable
FundsTransferred
Final Appropriation
Act
R'000 R'000 R'000 R'000 R'000 % R'000
Transfers
Claims against State Households 79 - 486 565 565 100.0 -
79 - 486 565 565 100.0 -
TRANSFER ALLOCATION EXPENDITURE
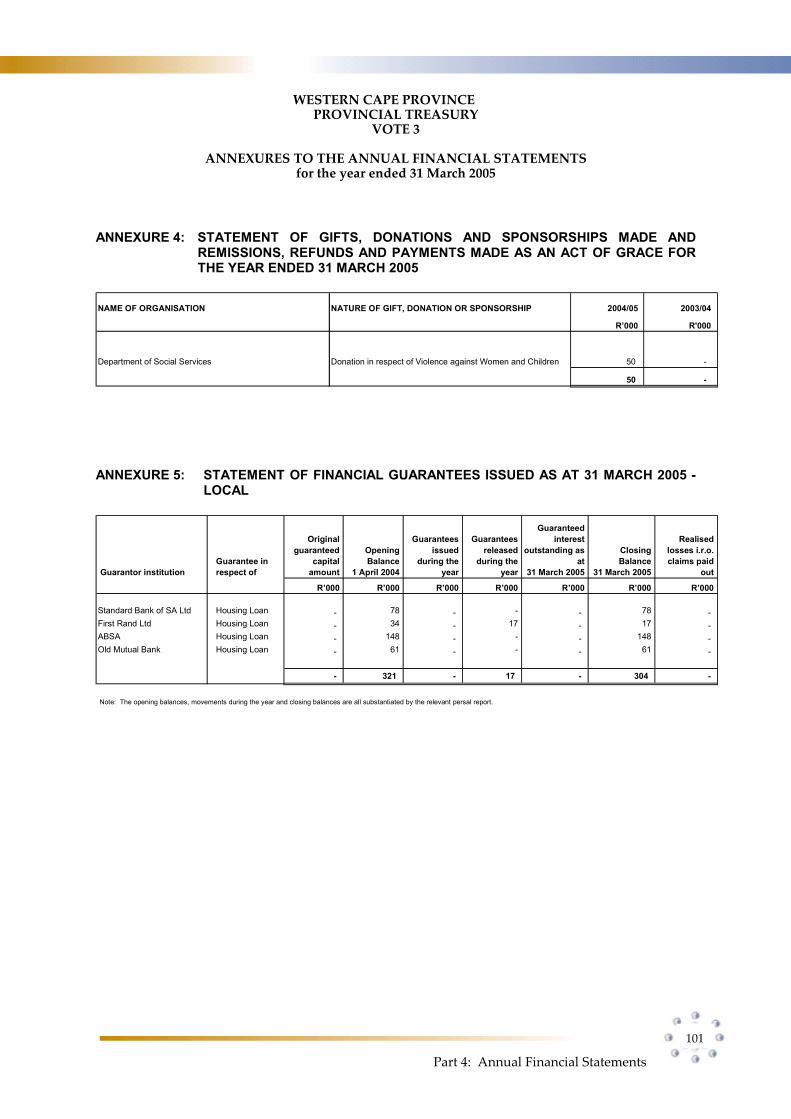
WESTERN CAPE PROVINCE PROVINCIAL TREASURY
VOTE 3
ANNEXURES TO THE ANNUAL FINANCIAL STATEMENTS for the year ended 31 March 2005
Part 4: Annual Financial Statements
101
ANNEXURE 4: STATEMENT OF GIFTS, DONATIONS AND SPONSORSHIPS MADE AND REMISSIONS, REFUNDS AND PAYMENTS MADE AS AN ACT OF GRACE FOR THE YEAR ENDED 31 MARCH 2005
NAME OF ORGANISATION NATURE OF GIFT, DONATION OR SPONSORSHIP 2004/05 2003/04
R’000 R'000
Department of Social Services Donation in respect of Violence against Women and Children 50 -
50 -
ANNEXURE 5: STATEMENT OF FINANCIAL GUARANTEES ISSUED AS AT 31 MARCH 2005 - LOCAL
Guarantor institutionGuarantee in respect of
R’000 R’000 R’000 R’000 R’000 R’000 R’000
Standard Bank of SA Ltd Housing Loan - 78 - - - 78 - First Rand Ltd Housing Loan - 34 - 17 - 17 - ABSA Housing Loan - 148 - - - 148 - Old Mutual Bank Housing Loan - 61 - - - 61 -
- 321 - 17 - 304 -
Note: The opening balances, movements during the year and closing balances are all substantiated by the relevant persal report.
Guarantees issued
during the year
Guarantees released
during the year
Guaranteed interest
outstanding as at
31 March 2005
Realised losses i.r.o. claims paid
out
Original guaranteed
capital amount
Closing Balance
31 March 2005
Opening Balance
1 April 2004
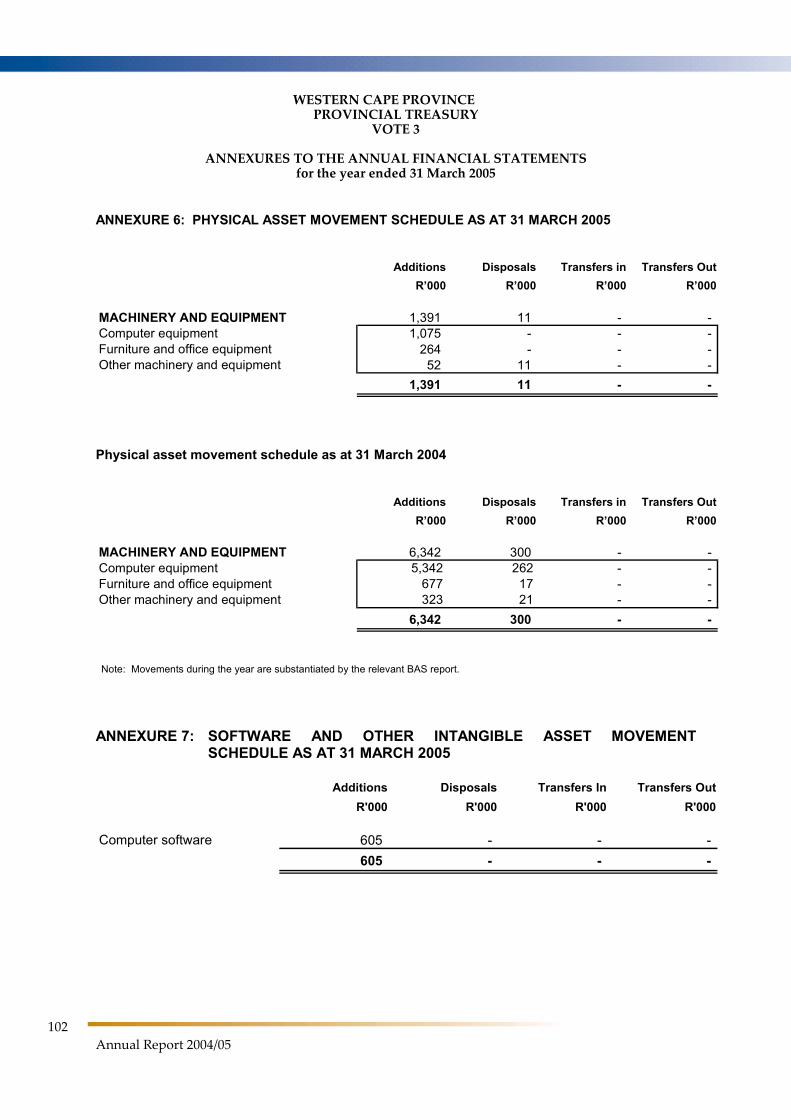
WESTERN CAPE PROVINCE PROVINCIAL TREASURY
VOTE 3
ANNEXURES TO THE ANNUAL FINANCIAL STATEMENTS for the year ended 31 March 2005
102
Annual Report 2004/05
ANNEXURE 6: PHYSICAL ASSET MOVEMENT SCHEDULE AS AT 31 MARCH 2005
Additions Disposals Transfers in Transfers Out
R’000 R’000 R’000 R’000
MACHINERY AND EQUIPMENT 1,391 11 - -Computer equipment 1,075 - - -Furniture and office equipment 264 - - -Other machinery and equipment 52 11 - -
1,391 11 - -
Physical asset movement schedule as at 31 March 2004
Additions Disposals Transfers in Transfers Out
R’000 R’000 R’000 R’000
MACHINERY AND EQUIPMENT 6,342 300 - -Computer equipment 5,342 262 - -Furniture and office equipment 677 17 - -Other machinery and equipment 323 21 - -
6,342 300 - -
Note: Movements during the year are substantiated by the relevant BAS report.
ANNEXURE 7: SOFTWARE AND OTHER INTANGIBLE ASSET MOVEMENT SCHEDULE AS AT 31 MARCH 2005
Additions Disposals Transfers In Transfers Out
R'000 R'000 R'000 R'000
Computer software 605 - - -
605 - - -

WESTERN CAPE PROVINCE PROVINCIAL TREASURY
VOTE 3
ANNEXURES TO THE ANNUAL FINANCIAL STATEMENTS for the year ended 31 March 2005
Part 4: Annual Financial Statements
103
ANNEXURE 8: INTER–GOVERNMENTAL RECEIVABLES
Confirmed balance
outstanding
Unconfirmed balance
outstanding
GOVERNMENT ENTITY 31/03/2005 31/03/2004 31/03/2005 31/03/2004
R’000 R’000 R’000 R’000
Department
National Treasury - - 39 -
Transport and Public Works 3 - - -
Enviromental Affairs and Tourism (Pretoria) 31 - - -
34 - 39 -
Note: Comparitives balances have been restated.
ANNEXURE 9: INTER–DEPARTMENTAL PAYABLES – CURRENT
GOVERNMENT ENTITY 31/03/2005 31/03/2004 31/03/2005 31/03/2004
R’000 R’000 R’000 R’000
Department
Amounts not included in Statement of financial position
Current
Western Cape Education Department - - - 3
Department of Health - - - 2
Department of Transport and Public Works 174 - - 109
Provincial Administration: Western Cape 1 - - -
South African Police Service 12 - - -
187 - - 114
Confirmed balance outstanding
Unconfirmed balance outstanding
Part 5: Human Resource Management
105
Part5
Human Resource Management
Oversight Report
The statistics and information published in this part of the annual report are required in
terms of Chapter 1, Part III J.3 of the Public Service Regulations, 2001 and have been
prescribed by the Minister for the Public Service and Administration for all departments
within the Public Service.
The statistical tables provide high-level information on key human resource issues. The
information aims to empower legislatures, the media, the public and other key stakeholders
to monitor whether departments:
Are exercising the powers granted under Public Service and Public Finance legislation in
a responsible manner, and
Are achieving national transformation priorities established by the Cabinet, for example,
affirmative action.
Annual reports produced at the end of each financial year are aimed at strengthening the
accountability of departments to key stakeholders. The tables in this report are revised on a
regular basis by the Department of Public Service and Administration (DPSA).
1. Service Delivery All departments are required to develop a Service Delivery Improvement (SDI) Plan. The
following tables reflect the components of the SDI plan as well as progress made in the
implementation of the plan. Services provided per programme are discussed in Part 2 of this
statement.
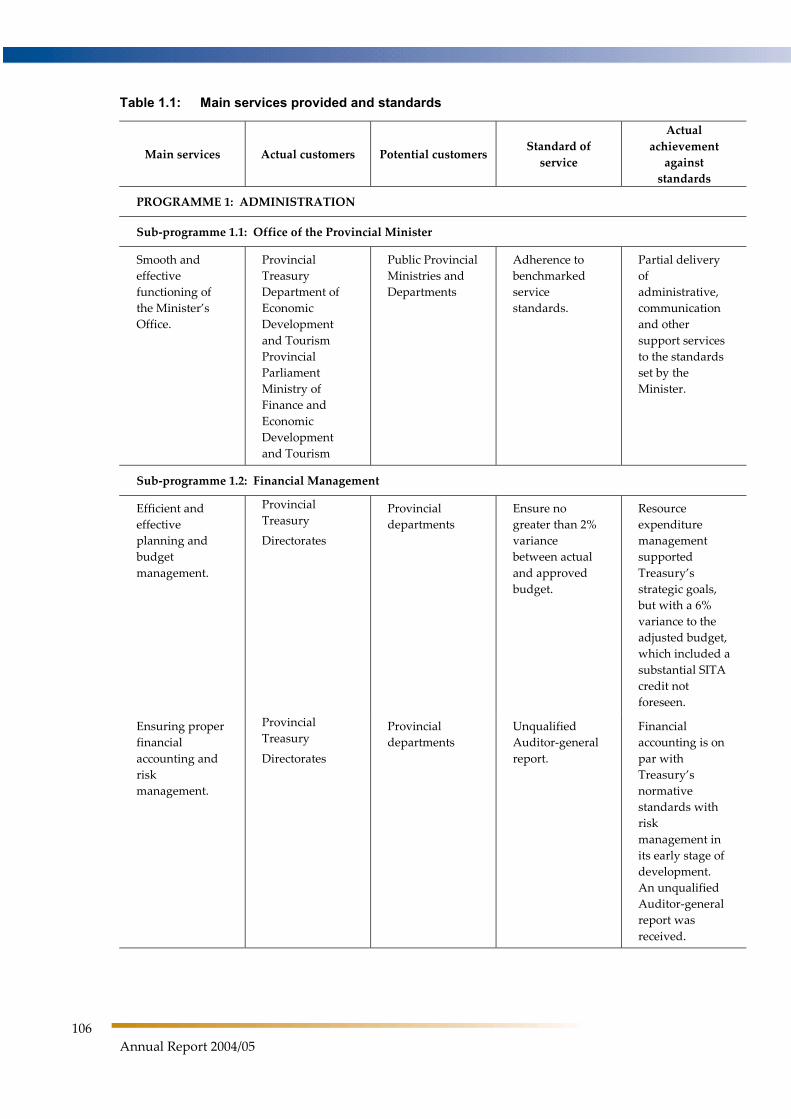
106
Annual Report 2004/05
Table 1.1: Main services provided and standards
Main services Actual customers Potential customers Standard of
service
Actual
achievement
against
standards
PROGRAMME 1: ADMINISTRATION
Sub-programme 1.1: Office of the Provincial Minister
Smooth and
effective
functioning of
the Minister’s
Office.
Provincial
Treasury
Department of
Economic
Development
and Tourism
Provincial
Parliament
Ministry of
Finance and
Economic
Development
and Tourism
Public Provincial
Ministries and
Departments
Adherence to
benchmarked
service
standards.
Partial delivery
of
administrative,
communication
and other
support services
to the standards
set by the
Minister.
Sub-programme 1.2: Financial Management
Efficient and
effective
planning and
budget
management.
Provincial
Treasury
Directorates
Provincial
departments
Ensure no
greater than 2%
variance
between actual
and approved
budget.
Resource
expenditure
management
supported
Treasury’s
strategic goals,
but with a 6%
variance to the
adjusted budget,
which included a
substantial SITA
credit not
foreseen.
Ensuring proper
financial
accounting and
risk
management.
Provincial
Treasury
Directorates
Provincial
departments
Unqualified
Auditor-general
report.
Financial
accounting is on
par with
Treasury’s
normative
standards with
risk
management in
its early stage of
development.
An unqualified
Auditor-general
report was
received.
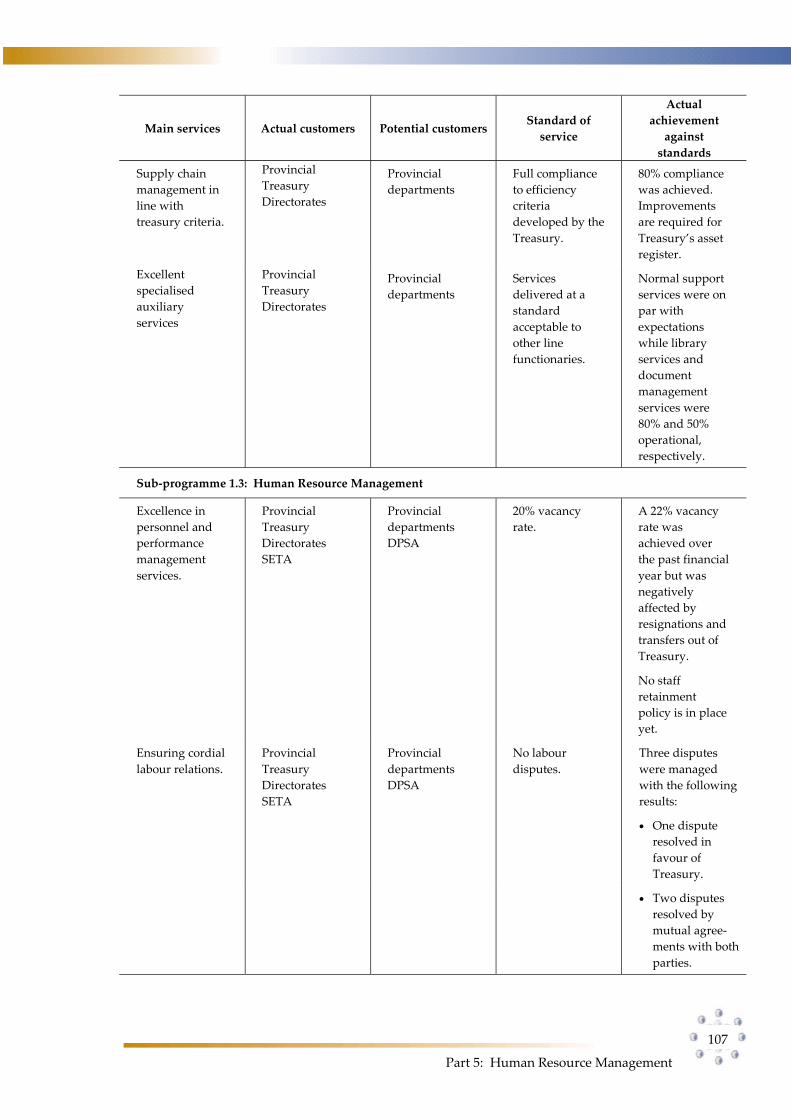
Part 5: Human Resource Management
107
Main services Actual customers Potential customers Standard of
service
Actual
achievement
against
standards
Supply chain
management in
line with
treasury criteria.
Provincial
Treasury
Directorates
Provincial
departments
Full compliance
to efficiency
criteria
developed by the
Treasury.
80% compliance
was achieved.
Improvements
are required for
Treasury’s asset
register.
Excellent
specialised
auxiliary
services
Provincial
Treasury
Directorates
Provincial
departments
Services
delivered at a
standard
acceptable to
other line
functionaries.
Normal support
services were on
par with
expectations
while library
services and
document
management
services were
80% and 50%
operational,
respectively.
Sub-programme 1.3: Human Resource Management
Excellence in
personnel and
performance
management
services.
Provincial
Treasury
Directorates
SETA
Provincial
departments
DPSA
20% vacancy
rate.
A 22% vacancy
rate was
achieved over
the past financial
year but was
negatively
affected by
resignations and
transfers out of
Treasury.
No staff
retainment
policy is in place
yet.
Ensuring cordial
labour relations.
Provincial
Treasury
Directorates
SETA
Provincial
departments
DPSA
No labour
disputes.
Three disputes
were managed
with the following
results:
One dispute
resolved in
favour of
Treasury.
Two disputes
resolved by
mutual agree-
ments with both
parties.
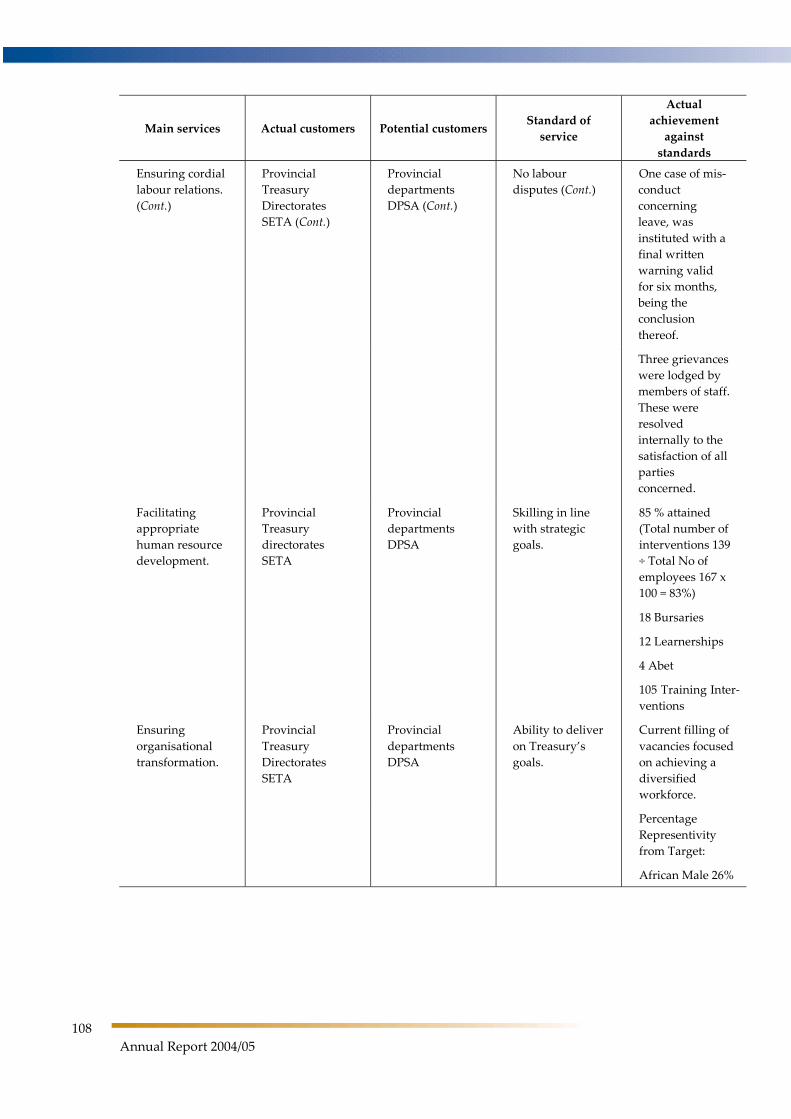
108
Annual Report 2004/05
Main services Actual customers Potential customers Standard of
service
Actual
achievement
against
standards
Ensuring cordial
labour relations.
(Cont.)
Provincial
Treasury
Directorates
SETA (Cont.)
Provincial
departments
DPSA (Cont.)
No labour
disputes (Cont.)
One case of mis-
conduct
concerning
leave, was
instituted with a
final written
warning valid
for six months,
being the
conclusion
thereof.
Three grievances
were lodged by
members of staff.
These were
resolved
internally to the
satisfaction of all
parties
concerned.
Facilitating
appropriate
human resource
development.
Provincial
Treasury
directorates
SETA
Provincial
departments
DPSA
Skilling in line
with strategic
goals.
85 % attained
(Total number of
interventions 139
÷ Total No of
employees 167 x
100 = 83%)
18 Bursaries
12 Learnerships
4 Abet
105 Training Inter-
ventions
Ensuring
organisational
transformation.
Provincial
Treasury
Directorates
SETA
Provincial
departments
DPSA
Ability to deliver
on Treasury’s
goals.
Current filling of
vacancies focused
on achieving a
diversified
workforce.
Percentage
Representivity
from Target:
African Male 26%
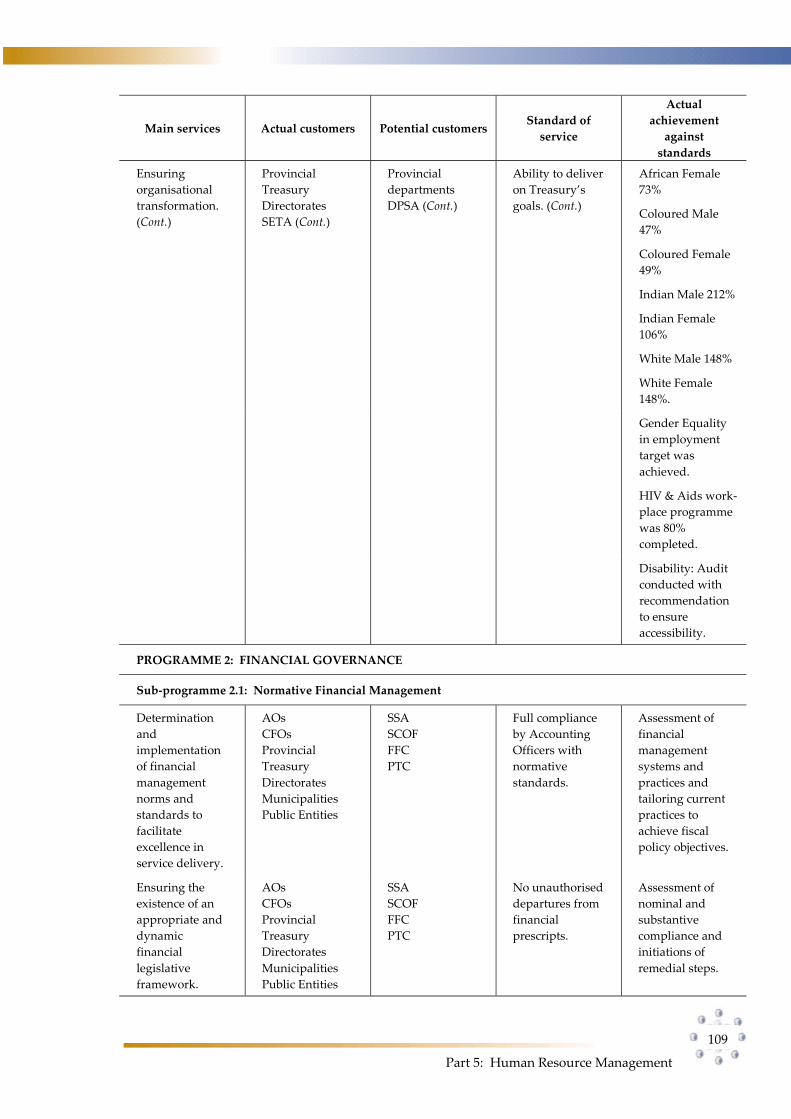
Part 5: Human Resource Management
109
Main services Actual customers Potential customers Standard of
service
Actual
achievement
against
standards
Ensuring
organisational
transformation.
(Cont.)
Provincial
Treasury
Directorates
SETA (Cont.)
Provincial
departments
DPSA (Cont.)
Ability to deliver
on Treasury’s
goals. (Cont.)
African Female
73%
Coloured Male
47%
Coloured Female
49%
Indian Male 212%
Indian Female
106%
White Male 148%
White Female
148%.
Gender Equality
in employment
target was
achieved.
HIV & Aids work-
place programme
was 80%
completed.
Disability: Audit
conducted with
recommendation
to ensure
accessibility.
PROGRAMME 2: FINANCIAL GOVERNANCE
Sub-programme 2.1: Normative Financial Management
Determination
and
implementation
of financial
management
norms and
standards to
facilitate
excellence in
service delivery.
AOs
CFOs
Provincial
Treasury
Directorates
Municipalities
Public Entities
SSA
SCOF
FFC
PTC
Full compliance
by Accounting
Officers with
normative
standards.
Assessment of
financial
management
systems and
practices and
tailoring current
practices to
achieve fiscal
policy objectives.
Ensuring the
existence of an
appropriate and
dynamic
financial
legislative
framework.
AOs
CFOs
Provincial
Treasury
Directorates
Municipalities
Public Entities
SSA
SCOF
FFC
PTC
No unauthorised
departures from
financial
prescripts.
Assessment of
nominal and
substantive
compliance and
initiations of
remedial steps.
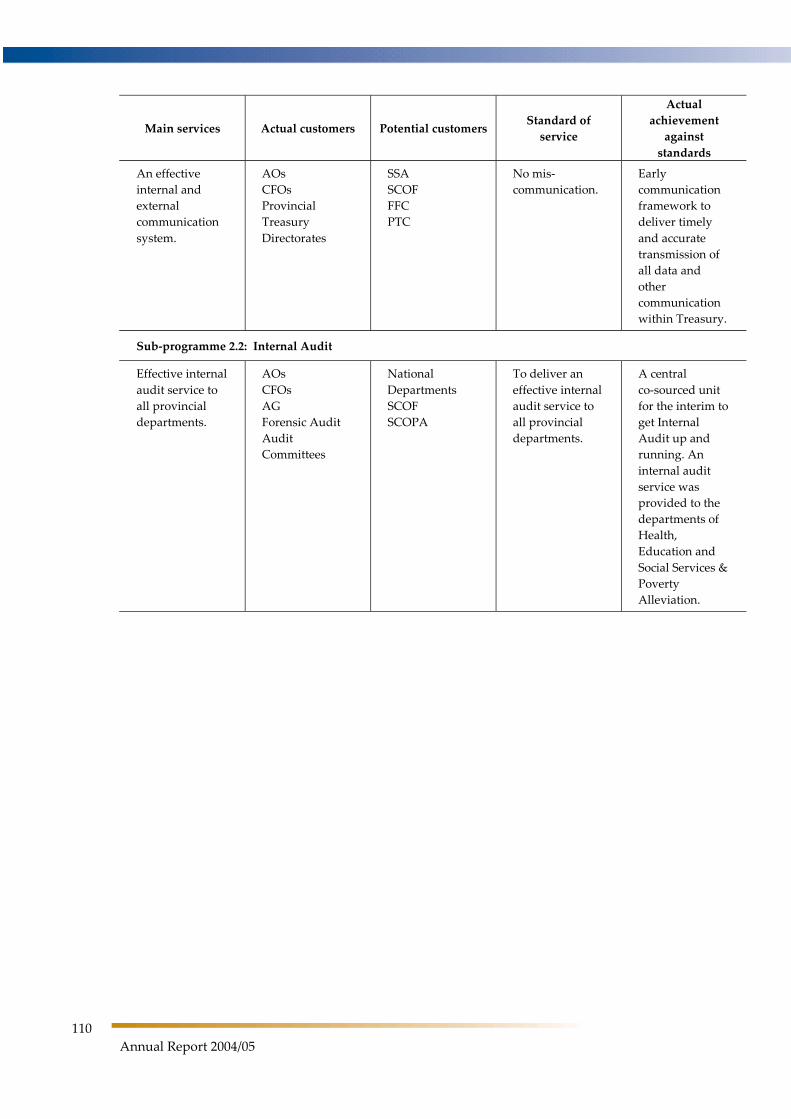
110
Annual Report 2004/05
Main services Actual customers Potential customers Standard of
service
Actual
achievement
against
standards
An effective
internal and
external
communication
system.
AOs
CFOs
Provincial
Treasury
Directorates
SSA
SCOF
FFC
PTC
No mis-
communication.
Early
communication
framework to
deliver timely
and accurate
transmission of
all data and
other
communication
within Treasury.
Sub-programme 2.2: Internal Audit
Effective internal
audit service to
all provincial
departments.
AOs
CFOs
AG
Forensic Audit
Audit
Committees
National
Departments
SCOF
SCOPA
To deliver an
effective internal
audit service to
all provincial
departments.
A central
co-sourced unit
for the interim to
get Internal
Audit up and
running. An
internal audit
service was
provided to the
departments of
Health,
Education and
Social Services &
Poverty
Alleviation.
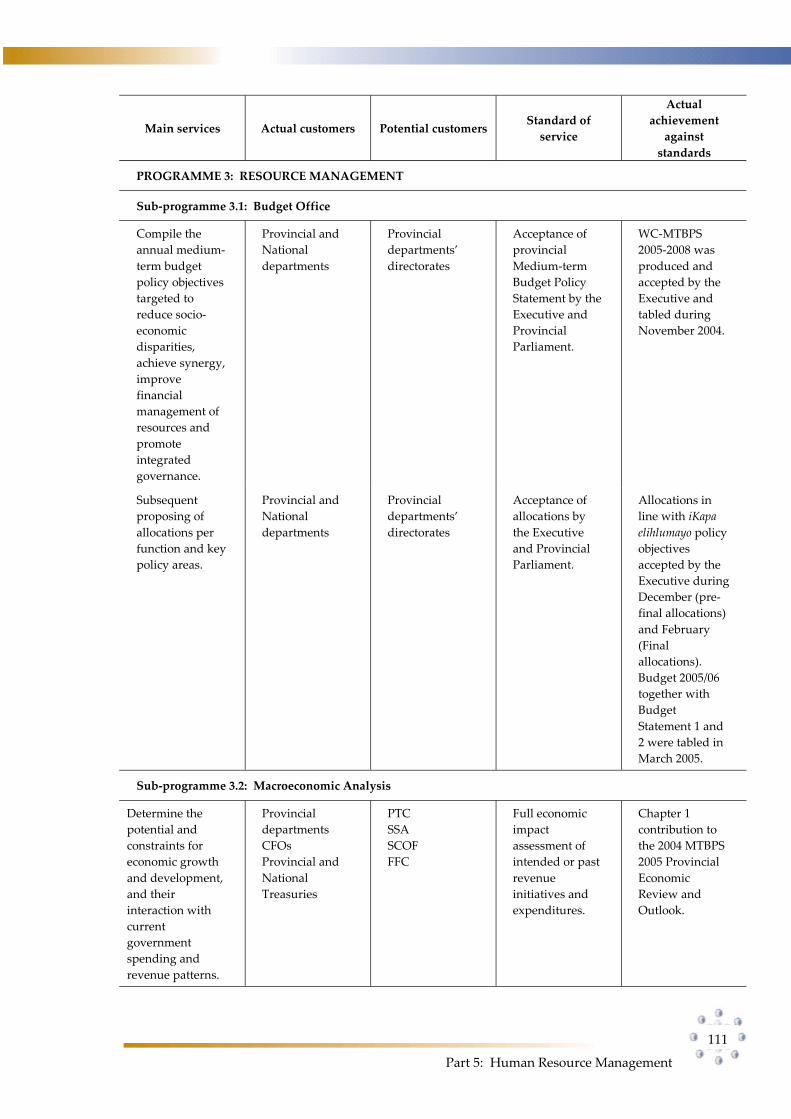
Part 5: Human Resource Management
111
Main services Actual customers Potential customers Standard of
service
Actual
achievement
against
standards
PROGRAMME 3: RESOURCE MANAGEMENT
Sub-programme 3.1: Budget Office
Compile the
annual medium-
term budget
policy objectives
targeted to
reduce socio-
economic
disparities,
achieve synergy,
improve
financial
management of
resources and
promote
integrated
governance.
Provincial and
National
departments
Provincial
departments’
directorates
Acceptance of
provincial
Medium-term
Budget Policy
Statement by the
Executive and
Provincial
Parliament.
WC-MTBPS
2005-2008 was
produced and
accepted by the
Executive and
tabled during
November 2004.
Subsequent
proposing of
allocations per
function and key
policy areas.
Provincial and
National
departments
Provincial
departments’
directorates
Acceptance of
allocations by
the Executive
and Provincial
Parliament.
Allocations in
line with iKapa
elihlumayo policy
objectives
accepted by the
Executive during
December (pre-
final allocations)
and February
(Final
allocations).
Budget 2005/06
together with
Budget
Statement 1 and
2 were tabled in
March 2005.
Sub-programme 3.2: Macroeconomic Analysis
Determine the
potential and
constraints for
economic growth
and development,
and their
interaction with
current
government
spending and
revenue patterns.
Provincial
departments
CFOs
Provincial and
National
Treasuries
PTC
SSA
SCOF
FFC
Full economic
impact
assessment of
intended or past
revenue
initiatives and
expenditures.
Chapter 1
contribution to
the 2004 MTBPS
2005 Provincial
Economic
Review and
Outlook.
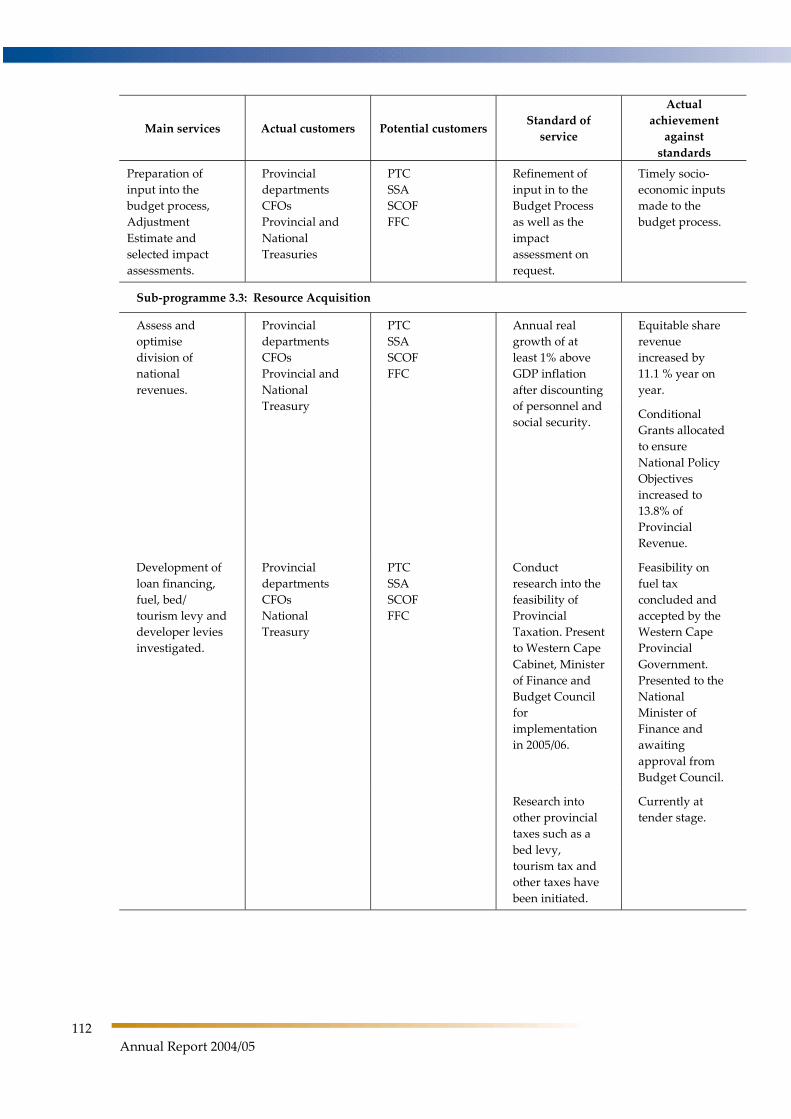
112
Annual Report 2004/05
Main services Actual customers Potential customers Standard of
service
Actual
achievement
against
standards
Preparation of
input into the
budget process,
Adjustment
Estimate and
selected impact
assessments.
Provincial
departments
CFOs
Provincial and
National
Treasuries
PTC
SSA
SCOF
FFC
Refinement of
input in to the
Budget Process
as well as the
impact
assessment on
request.
Timely socio-
economic inputs
made to the
budget process.
Sub-programme 3.3: Resource Acquisition
Equitable share
revenue
increased by
11.1 % year on
year.
Assess and
optimise
division of
national
revenues.
Provincial
departments
CFOs
Provincial and
National
Treasury
PTC
SSA
SCOF
FFC
Annual real
growth of at
least 1% above
GDP inflation
after discounting
of personnel and
social security. Conditional
Grants allocated
to ensure
National Policy
Objectives
increased to
13.8% of
Provincial
Revenue.
Development of
loan financing,
fuel, bed/
tourism levy and
developer levies
investigated.
Provincial
departments
CFOs
National
Treasury
PTC
SSA
SCOF
FFC
Conduct
research into the
feasibility of
Provincial
Taxation. Present
to Western Cape
Cabinet, Minister
of Finance and
Budget Council
for
implementation
in 2005/06.
Feasibility on
fuel tax
concluded and
accepted by the
Western Cape
Provincial
Government.
Presented to the
National
Minister of
Finance and
awaiting
approval from
Budget Council.
Research into
other provincial
taxes such as a
bed levy,
tourism tax and
other taxes have
been initiated.
Currently at
tender stage.
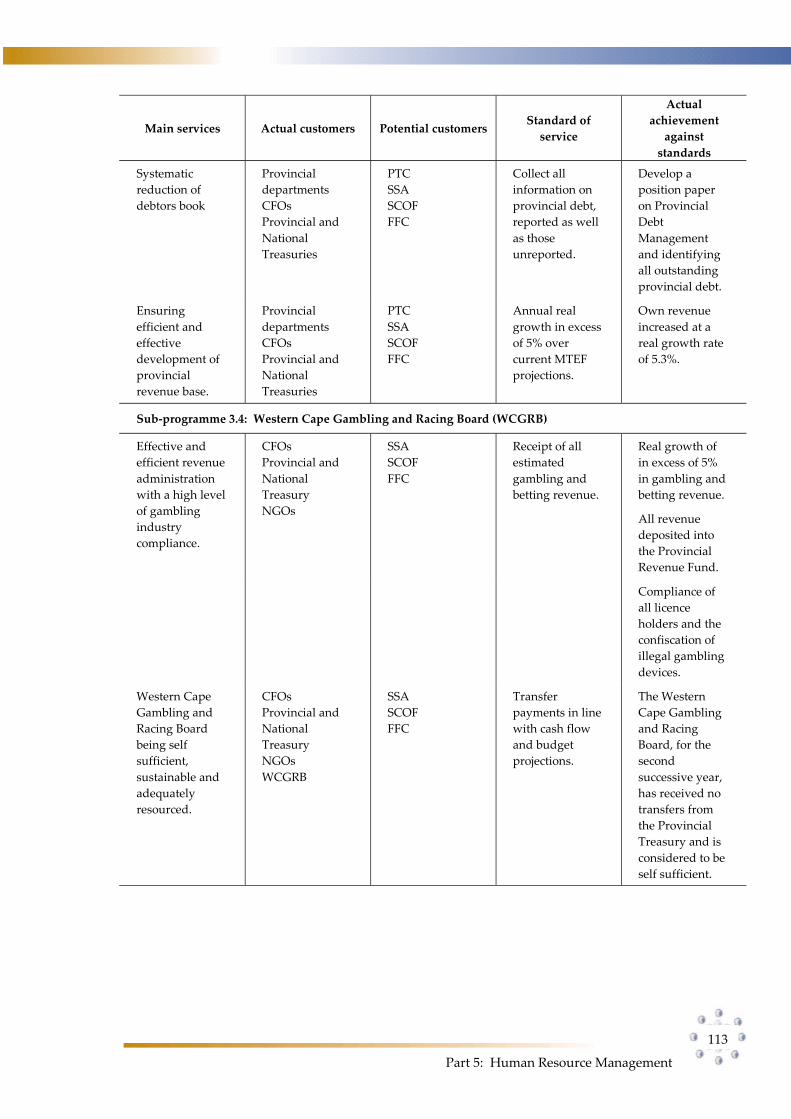
Part 5: Human Resource Management
113
Main services Actual customers Potential customers Standard of
service
Actual
achievement
against
standards
Systematic
reduction of
debtors book
Provincial
departments
CFOs
Provincial and
National
Treasuries
PTC
SSA
SCOF
FFC
Collect all
information on
provincial debt,
reported as well
as those
unreported.
Develop a
position paper
on Provincial
Debt
Management
and identifying
all outstanding
provincial debt.
Ensuring
efficient and
effective
development of
provincial
revenue base.
Provincial
departments
CFOs
Provincial and
National
Treasuries
PTC
SSA
SCOF
FFC
Annual real
growth in excess
of 5% over
current MTEF
projections.
Own revenue
increased at a
real growth rate
of 5.3%.
Sub-programme 3.4: Western Cape Gambling and Racing Board (WCGRB)
Effective and
efficient revenue
administration
with a high level
of gambling
industry
compliance.
CFOs
Provincial and
National
Treasury
NGOs
SSA
SCOF
FFC
Receipt of all
estimated
gambling and
betting revenue.
Real growth of
in excess of 5%
in gambling and
betting revenue.
All revenue
deposited into
the Provincial
Revenue Fund.
Compliance of
all licence
holders and the
confiscation of
illegal gambling
devices.
Western Cape
Gambling and
Racing Board
being self
sufficient,
sustainable and
adequately
resourced.
CFOs
Provincial and
National
Treasury
NGOs
WCGRB
SSA
SCOF
FFC
Transfer
payments in line
with cash flow
and budget
projections.
The Western
Cape Gambling
and Racing
Board, for the
second
successive year,
has received no
transfers from
the Provincial
Treasury and is
considered to be
self sufficient.
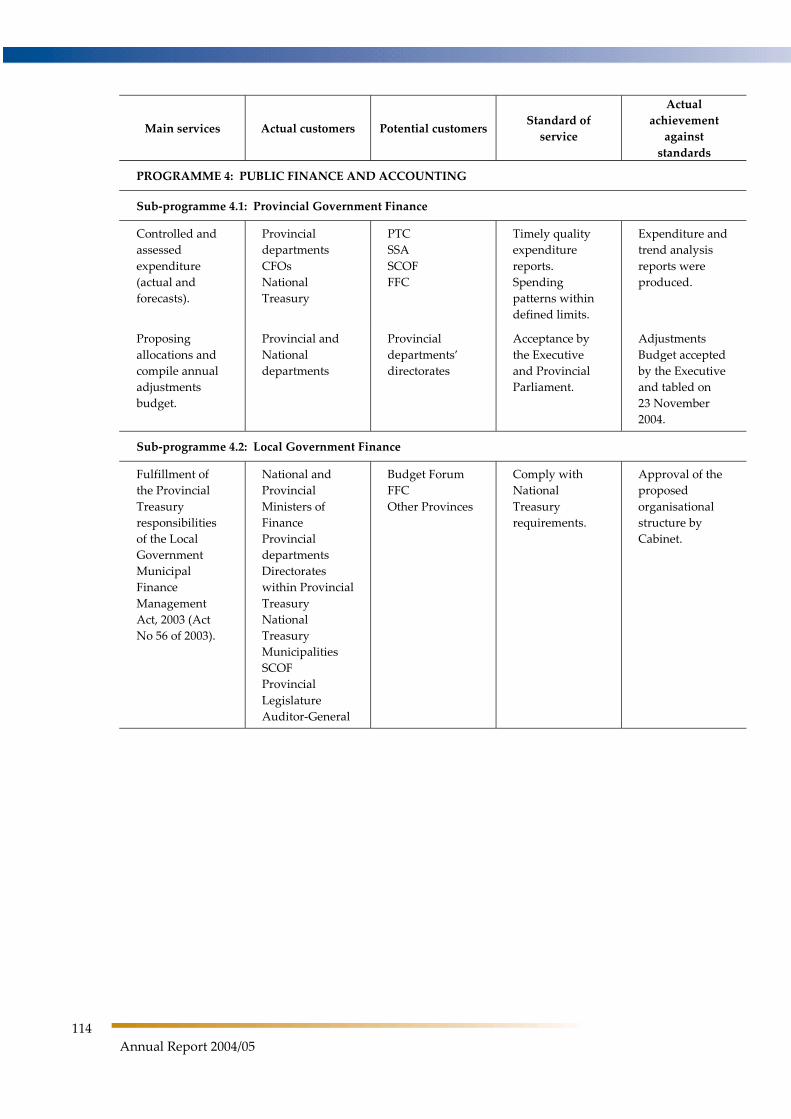
114
Annual Report 2004/05
Main services Actual customers Potential customers Standard of
service
Actual
achievement
against
standards
PROGRAMME 4: PUBLIC FINANCE AND ACCOUNTING
Sub-programme 4.1: Provincial Government Finance
Controlled and
assessed
expenditure
(actual and
forecasts).
Provincial
departments
CFOs
National
Treasury
PTC
SSA
SCOF
FFC
Timely quality
expenditure
reports.
Spending
patterns within
defined limits.
Expenditure and
trend analysis
reports were
produced.
Proposing
allocations and
compile annual
adjustments
budget.
Provincial and
National
departments
Provincial
departments’
directorates
Acceptance by
the Executive
and Provincial
Parliament.
Adjustments
Budget accepted
by the Executive
and tabled on
23 November
2004.
Sub-programme 4.2: Local Government Finance
Fulfillment of
the Provincial
Treasury
responsibilities
of the Local
Government
Municipal
Finance
Management
Act, 2003 (Act
No 56 of 2003).
National and
Provincial
Ministers of
Finance
Provincial
departments
Directorates
within Provincial
Treasury
National
Treasury
Municipalities
SCOF
Provincial
Legislature
Auditor-General
Budget Forum
FFC
Other Provinces
Comply with
National
Treasury
requirements.
Approval of the
proposed
organisational
structure by
Cabinet.
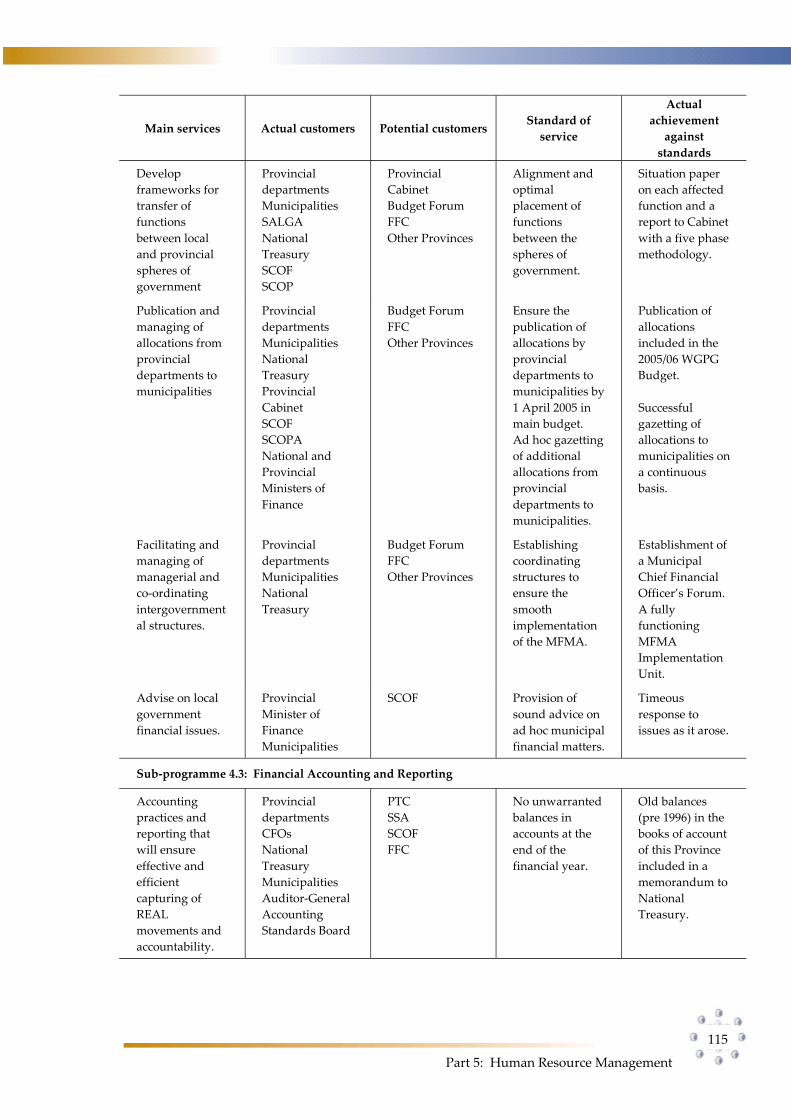
Part 5: Human Resource Management
115
Main services Actual customers Potential customers Standard of
service
Actual
achievement
against
standards
Develop
frameworks for
transfer of
functions
between local
and provincial
spheres of
government
Provincial
departments
Municipalities
SALGA
National
Treasury
SCOF
SCOP
Provincial
Cabinet
Budget Forum
FFC
Other Provinces
Alignment and
optimal
placement of
functions
between the
spheres of
government.
Situation paper
on each affected
function and a
report to Cabinet
with a five phase
methodology.
Publication and
managing of
allocations from
provincial
departments to
municipalities
Provincial
departments
Municipalities
National
Treasury
Provincial
Cabinet
SCOF
SCOPA
National and
Provincial
Ministers of
Finance
Budget Forum
FFC
Other Provinces
Ensure the
publication of
allocations by
provincial
departments to
municipalities by
1 April 2005 in
main budget.
Ad hoc gazetting
of additional
allocations from
provincial
departments to
municipalities.
Publication of
allocations
included in the
2005/06 WGPG
Budget.
Successful
gazetting of
allocations to
municipalities on
a continuous
basis.
Facilitating and
managing of
managerial and
co-ordinating
intergovernment
al structures.
Provincial
departments
Municipalities
National
Treasury
Budget Forum
FFC
Other Provinces
Establishing
coordinating
structures to
ensure the
smooth
implementation
of the MFMA.
Establishment of
a Municipal
Chief Financial
Officer’s Forum.
A fully
functioning
MFMA
Implementation
Unit.
Advise on local
government
financial issues.
Provincial
Minister of
Finance
Municipalities
SCOF Provision of
sound advice on
ad hoc municipal
financial matters.
Timeous
response to
issues as it arose.
Sub-programme 4.3: Financial Accounting and Reporting
Accounting
practices and
reporting that
will ensure
effective and
efficient
capturing of
REAL
movements and
accountability.
Provincial
departments
CFOs
National
Treasury
Municipalities
Auditor-General
Accounting
Standards Board
PTC
SSA
SCOF
FFC
No unwarranted
balances in
accounts at the
end of the
financial year.
Old balances
(pre 1996) in the
books of account
of this Province
included in a
memorandum to
National
Treasury.
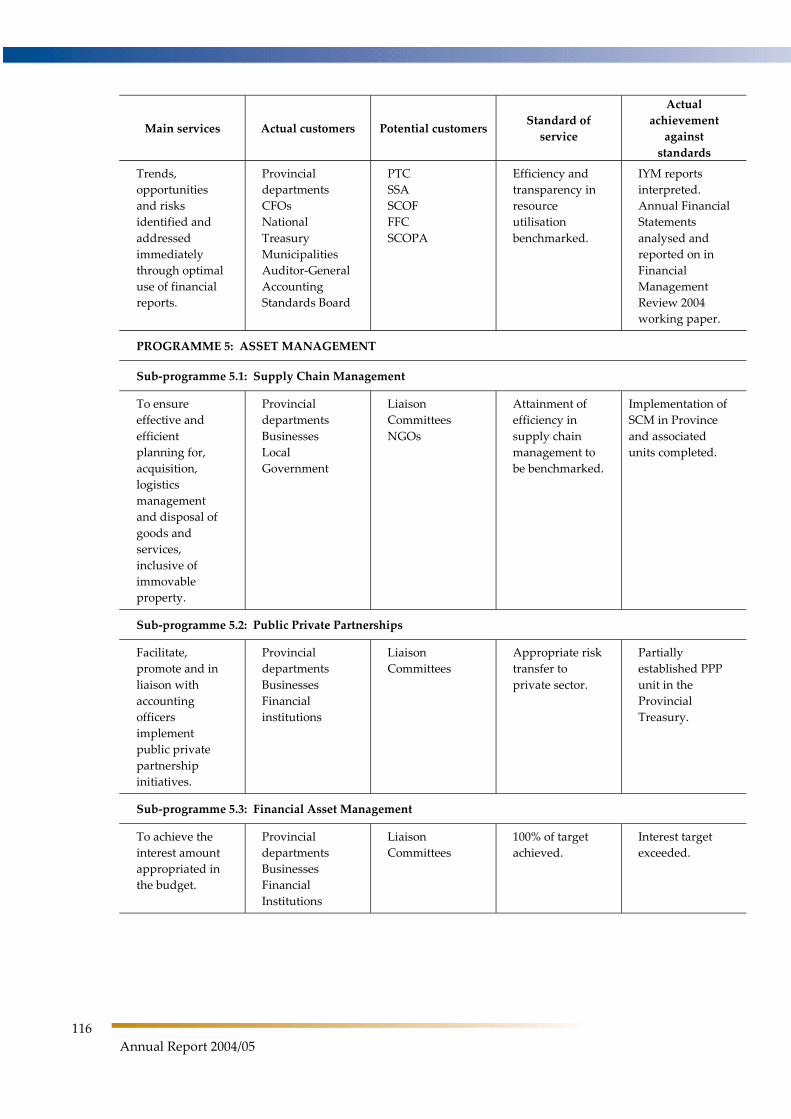
116
Annual Report 2004/05
Main services Actual customers Potential customers Standard of
service
Actual
achievement
against
standards
Trends,
opportunities
and risks
identified and
addressed
immediately
through optimal
use of financial
reports.
Provincial
departments
CFOs
National
Treasury
Municipalities
Auditor-General
Accounting
Standards Board
PTC
SSA
SCOF
FFC
SCOPA
Efficiency and
transparency in
resource
utilisation
benchmarked.
IYM reports
interpreted.
Annual Financial
Statements
analysed and
reported on in
Financial
Management
Review 2004
working paper.
PROGRAMME 5: ASSET MANAGEMENT
Sub-programme 5.1: Supply Chain Management
To ensure
effective and
efficient
planning for,
acquisition,
logistics
management
and disposal of
goods and
services,
inclusive of
immovable
property.
Provincial
departments
Businesses
Local
Government
Liaison
Committees
NGOs
Attainment of
efficiency in
supply chain
management to
be benchmarked.
Implementation of
SCM in Province
and associated
units completed.
Sub-programme 5.2: Public Private Partnerships
Facilitate,
promote and in
liaison with
accounting
officers
implement
public private
partnership
initiatives.
Provincial
departments
Businesses
Financial
institutions
Liaison
Committees
Appropriate risk
transfer to
private sector.
Partially
established PPP
unit in the
Provincial
Treasury.
Sub-programme 5.3: Financial Asset Management
To achieve the
interest amount
appropriated in
the budget.
Provincial
departments
Businesses
Financial
Institutions
Liaison
Committees
100% of target
achieved.
Interest target
exceeded.
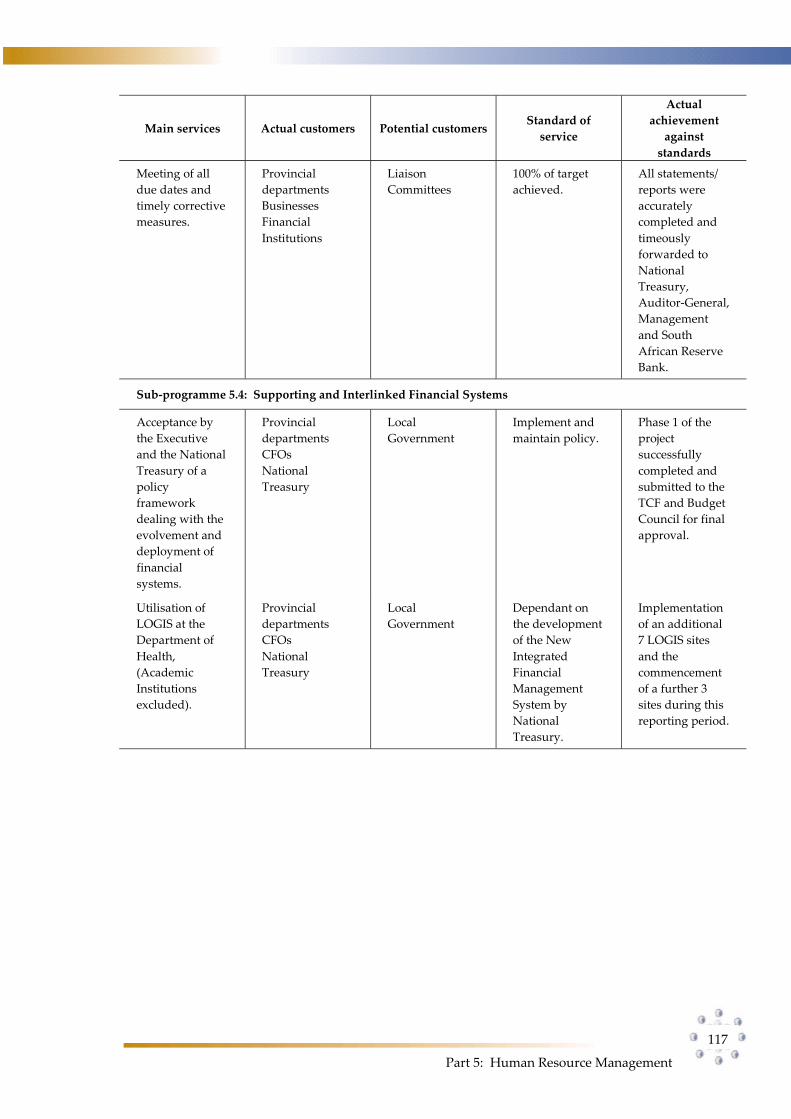
Part 5: Human Resource Management
117
Main services Actual customers Potential customers Standard of
service
Actual
achievement
against
standards
Meeting of all
due dates and
timely corrective
measures.
Provincial
departments
Businesses
Financial
Institutions
Liaison
Committees
100% of target
achieved.
All statements/
reports were
accurately
completed and
timeously
forwarded to
National
Treasury,
Auditor-General,
Management
and South
African Reserve
Bank.
Sub-programme 5.4: Supporting and Interlinked Financial Systems
Acceptance by
the Executive
and the National
Treasury of a
policy
framework
dealing with the
evolvement and
deployment of
financial
systems.
Provincial
departments
CFOs
National
Treasury
Local
Government
Implement and
maintain policy.
Phase 1 of the
project
successfully
completed and
submitted to the
TCF and Budget
Council for final
approval.
Utilisation of
LOGIS at the
Department of
Health,
(Academic
Institutions
excluded).
Provincial
departments
CFOs
National
Treasury
Local
Government
Dependant on
the development
of the New
Integrated
Financial
Management
System by
National
Treasury.
Implementation
of an additional
7 LOGIS sites
and the
commencement
of a further 3
sites during this
reporting period.
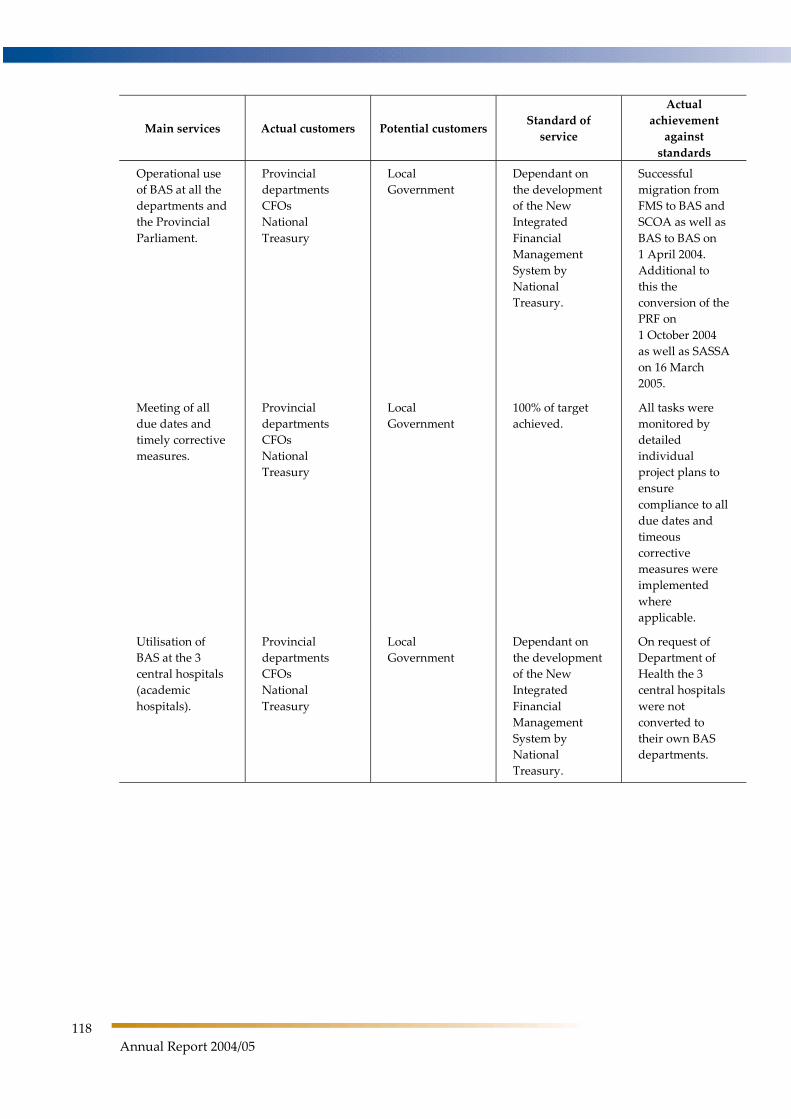
118
Annual Report 2004/05
Main services Actual customers Potential customers Standard of
service
Actual
achievement
against
standards
Operational use
of BAS at all the
departments and
the Provincial
Parliament.
Provincial
departments
CFOs
National
Treasury
Local
Government
Dependant on
the development
of the New
Integrated
Financial
Management
System by
National
Treasury.
Successful
migration from
FMS to BAS and
SCOA as well as
BAS to BAS on
1 April 2004.
Additional to
this the
conversion of the
PRF on
1 October 2004
as well as SASSA
on 16 March
2005.
Meeting of all
due dates and
timely corrective
measures.
Provincial
departments
CFOs
National
Treasury
Local
Government
100% of target
achieved.
All tasks were
monitored by
detailed
individual
project plans to
ensure
compliance to all
due dates and
timeous
corrective
measures were
implemented
where
applicable.
Utilisation of
BAS at the 3
central hospitals
(academic
hospitals).
Provincial
departments
CFOs
National
Treasury
Local
Government
Dependant on
the development
of the New
Integrated
Financial
Management
System by
National
Treasury.
On request of
Department of
Health the 3
central hospitals
were not
converted to
their own BAS
departments.
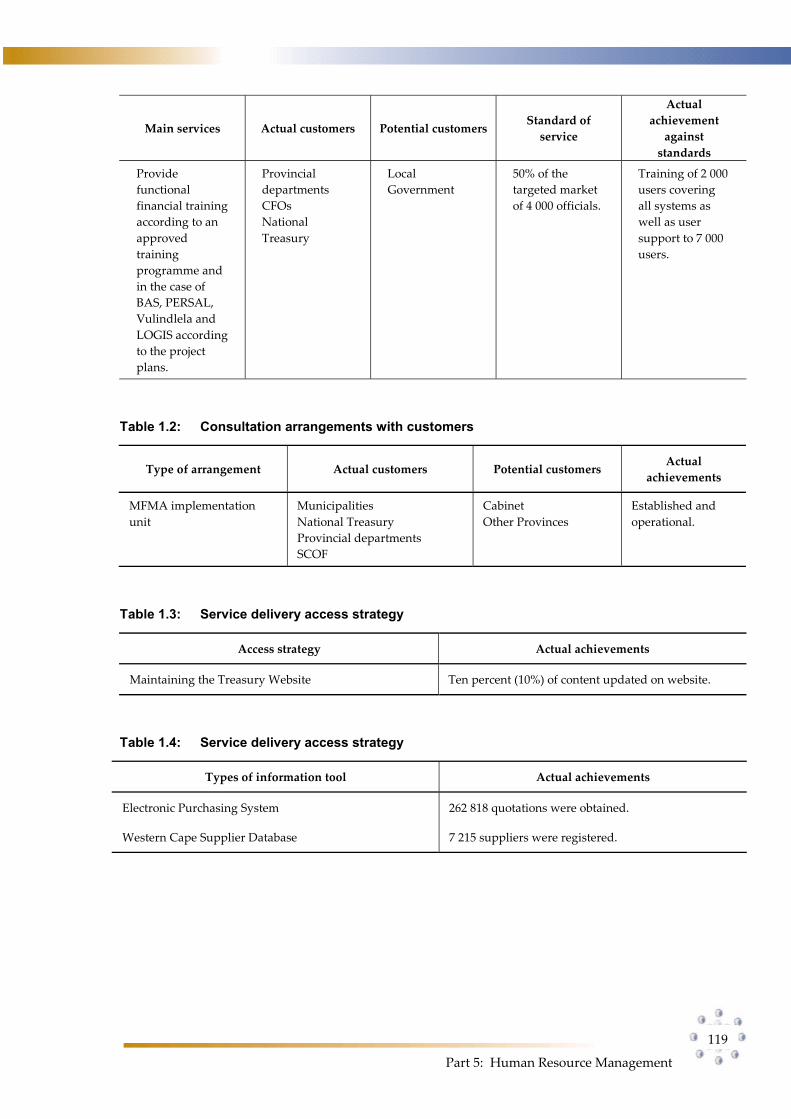
Part 5: Human Resource Management
119
Main services Actual customers Potential customers Standard of
service
Actual
achievement
against
standards
Provide
functional
financial training
according to an
approved
training
programme and
in the case of
BAS, PERSAL,
Vulindlela and
LOGIS according
to the project
plans.
Provincial
departments
CFOs
National
Treasury
Local
Government
50% of the
targeted market
of 4 000 officials.
Training of 2 000
users covering
all systems as
well as user
support to 7 000
users.
Table 1.2: Consultation arrangements with customers
Type of arrangement Actual customers Potential customers Actual
achievements
MFMA implementation
unit
Municipalities
National Treasury
Provincial departments
SCOF
Cabinet
Other Provinces
Established and
operational.
Table 1.3: Service delivery access strategy
Access strategy Actual achievements
Maintaining the Treasury Website Ten percent (10%) of content updated on website.
Table 1.4: Service delivery access strategy
Types of information tool Actual achievements
Electronic Purchasing System 262 818 quotations were obtained.
Western Cape Supplier Database 7 215 suppliers were registered.
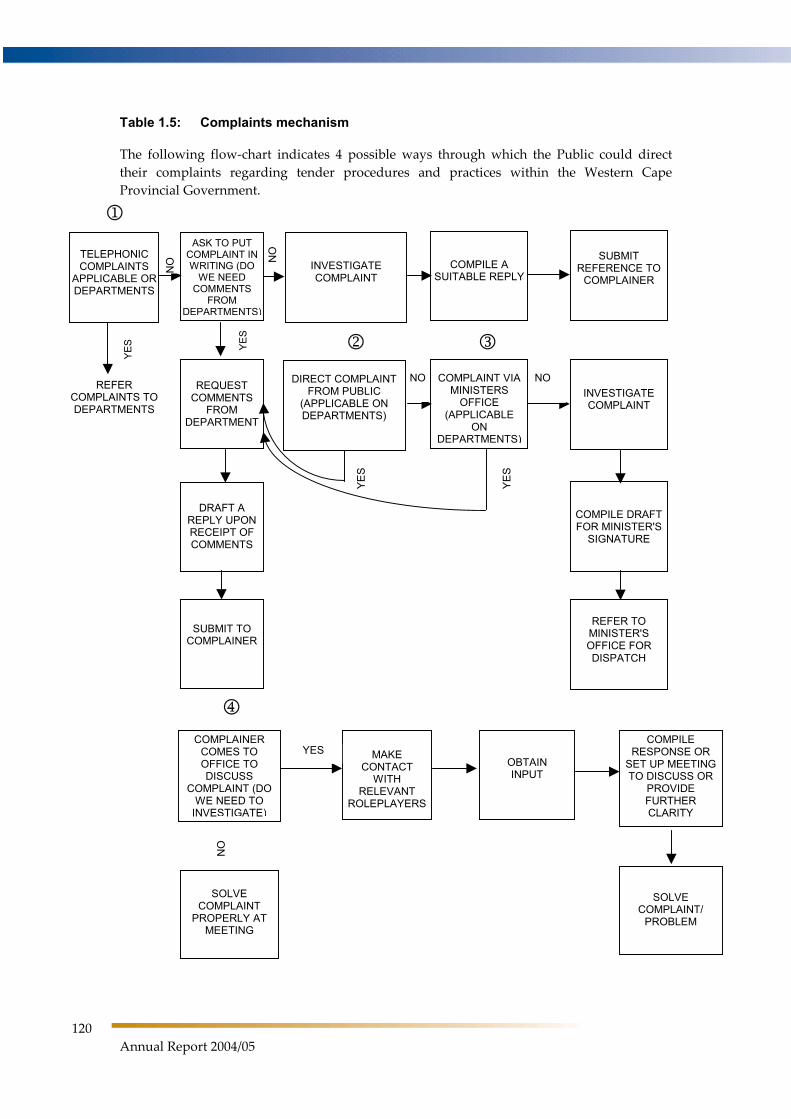
120
Annual Report 2004/05
Table 1.5: Complaints mechanism
The following flow-chart indicates 4 possible ways through which the Public could direct
their complaints regarding tender procedures and practices within the Western Cape
Provincial Government.
TELEPHONIC COMPLAINTS
APPLICABLE OR DEPARTMENTS
ASK TO PUT COMPLAINT IN WRITING (DO
WE NEED COMMENTS
FROM DEPARTMENTS)
INVESTIGATE COMPLAINT
COMPILE A SUITABLE REPLY
SUBMIT REFERENCE TO
COMPLAINER
REFER COMPLAINTS TO DEPARTMENTS
REQUEST COMMENTS
FROM DEPARTMENT
DIRECT COMPLAINT FROM PUBLIC
(APPLICABLE ON DEPARTMENTS)
COMPLAINT VIA MINISTERS
OFFICE (APPLICABLE
ONDEPARTMENTS)
INVESTIGATE COMPLAINT
DRAFT A REPLY UPON RECEIPT OF COMMENTS
COMPILE DRAFT FOR MINISTER'S
SIGNATURE
SUBMIT TO COMPLAINER
REFER TO MINISTER'S OFFICE FOR DISPATCH
COMPLAINER COMES TO OFFICE TO DISCUSS
COMPLAINT (DO WE NEED TO
INVESTIGATE)
SOLVE COMPLAINT
PROPERLY AT MEETING
MAKE CONTACT
WITH RELEVANT
ROLEPLAYERS
OBTAIN INPUT
COMPILE RESPONSE OR
SET UP MEETING TO DISCUSS OR
PROVIDE FURTHER CLARITY
SOLVE COMPLAINT/
PROBLEM
YE
S
NO
NO NO
YE
S
YE
S
YES
NO
NO
YE
S
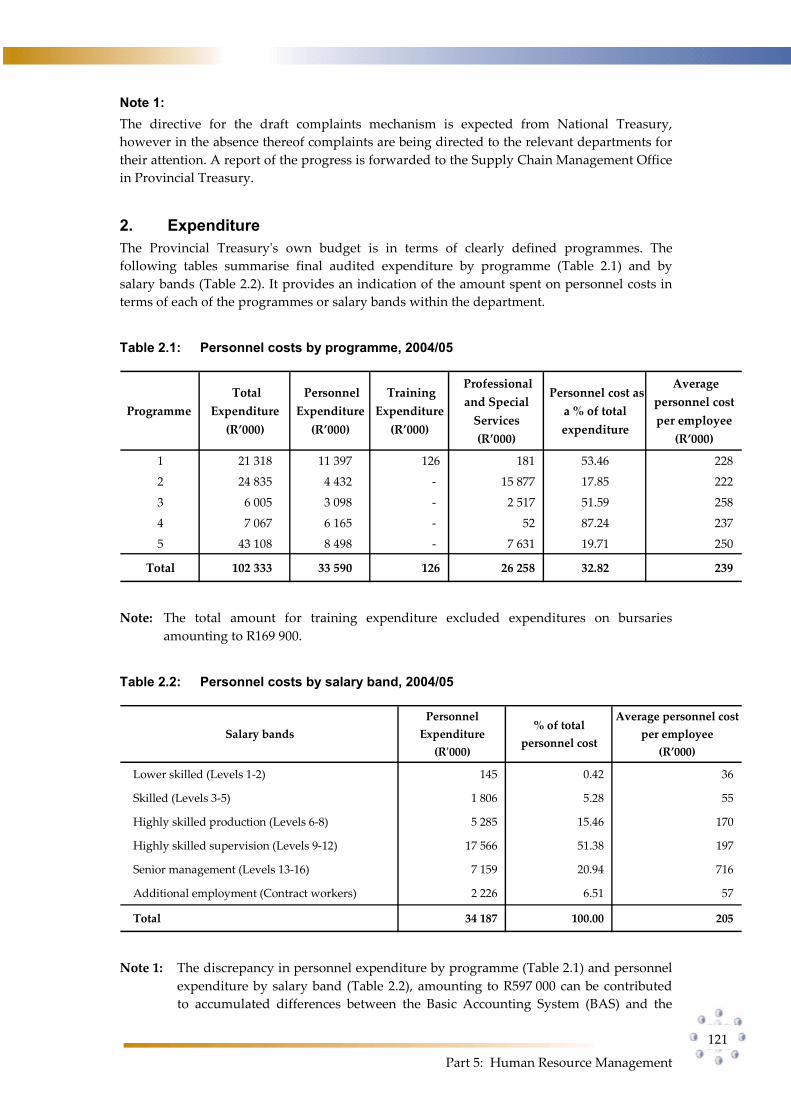
Part 5: Human Resource Management
121
Note 1:
The directive for the draft complaints mechanism is expected from National Treasury,
however in the absence thereof complaints are being directed to the relevant departments for
their attention. A report of the progress is forwarded to the Supply Chain Management Office
in Provincial Treasury.
2. Expenditure The Provincial Treasury's own budget is in terms of clearly defined programmes. The
following tables summarise final audited expenditure by programme (Table 2.1) and by
salary bands (Table 2.2). It provides an indication of the amount spent on personnel costs in
terms of each of the programmes or salary bands within the department.
Table 2.1: Personnel costs by programme, 2004/05
Programme
Total
Expenditure
(R’000)
Personnel
Expenditure
(R’000)
Training
Expenditure
(R’000)
Professional
and Special
Services
(R’000)
Personnel cost as
a % of total
expenditure
Average
personnel cost
per employee
(R’000)
1 21 318 11 397 126 181 53.46 228
2 24 835 4 432 - 15 877 17.85 222
3 6 005 3 098 - 2 517 51.59 258
4 7 067 6 165 - 52 87.24 237
5 43 108 8 498 - 7 631 19.71 250
Total 102 333 33 590 126 26 258 32.82 239
Note: The total amount for training expenditure excluded expenditures on bursaries
amounting to R169 900.
Table 2.2: Personnel costs by salary band, 2004/05
Salary bands
Personnel
Expenditure
(R'000)
% of total
personnel cost
Average personnel cost
per employee
(R’000)
Lower skilled (Levels 1-2) 145 0.42 36
Skilled (Levels 3-5) 1 806 5.28 55
Highly skilled production (Levels 6-8) 5 285 15.46 170
Highly skilled supervision (Levels 9-12) 17 566 51.38 197
Senior management (Levels 13-16) 7 159 20.94 716
Additional employment (Contract workers) 2 226 6.51 57
Total 34 187 100.00 205
Note 1: The discrepancy in personnel expenditure by programme (Table 2.1) and personnel
expenditure by salary band (Table 2.2), amounting to R597 000 can be contributed
to accumulated differences between the Basic Accounting System (BAS) and the
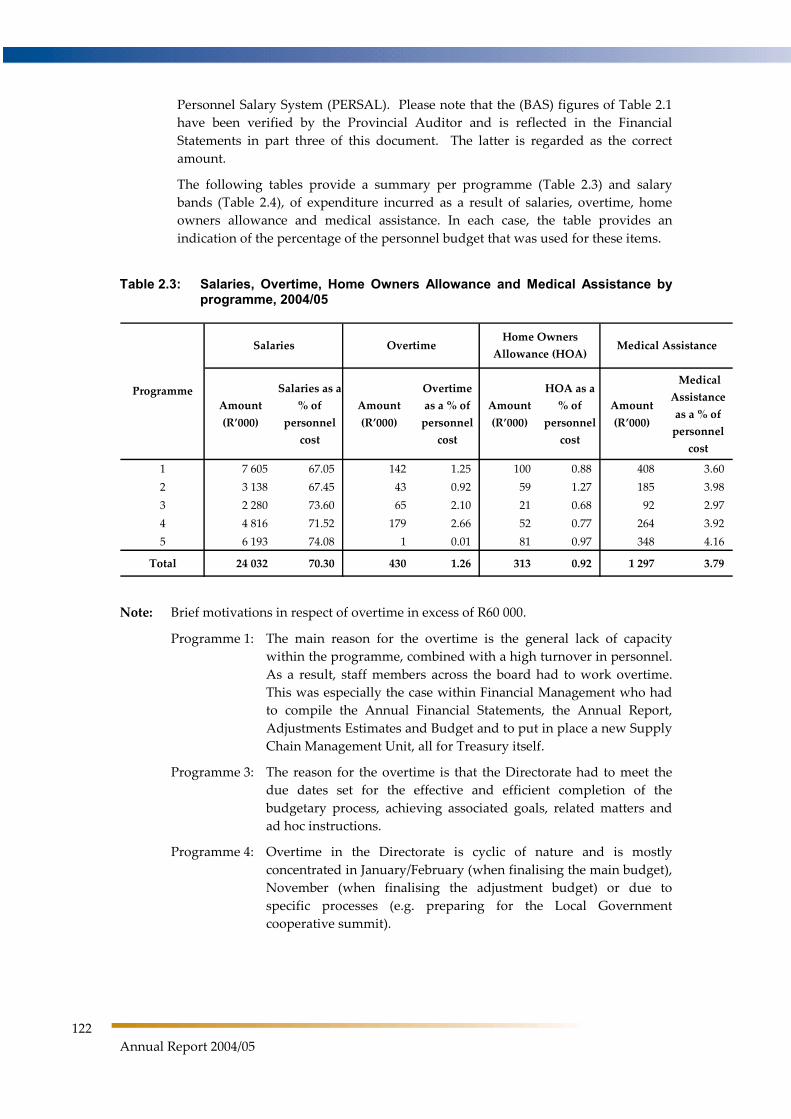
122
Annual Report 2004/05
Personnel Salary System (PERSAL). Please note that the (BAS) figures of Table 2.1
have been verified by the Provincial Auditor and is reflected in the Financial
Statements in part three of this document. The latter is regarded as the correct
amount.
The following tables provide a summary per programme (Table 2.3) and salary
bands (Table 2.4), of expenditure incurred as a result of salaries, overtime, home
owners allowance and medical assistance. In each case, the table provides an
indication of the percentage of the personnel budget that was used for these items.
Table 2.3: Salaries, Overtime, Home Owners Allowance and Medical Assistance by programme, 2004/05
Amount
(R’000)
Salaries as a
% of
personnel
cost
Amount
(R’000)
Overtime
as a % of
personnel
cost
Amount
(R’000)
HOA as a
% of
personnel
cost
Amount
(R’000)
Medical
Assistance
as a % of
personnel
cost
1 7 605 67.05 142 1.25 100 0.88 408 3.60
2 3 138 67.45 43 0.92 59 1.27 185 3.98
3 2 280 73.60 65 2.10 21 0.68 92 2.97
4 4 816 71.52 179 2.66 52 0.77 264 3.92
5 6 193 74.08 1 0.01 81 0.97 348 4.16
Total 24 032 70.30 430 1.26 313 0.92 1 297 3.79
Medical Assistance
Programme
Salaries OvertimeHome Owners
Allowance (HOA)
Note: Brief motivations in respect of overtime in excess of R60 000.
Programme 1: The main reason for the overtime is the general lack of capacity
within the programme, combined with a high turnover in personnel.
As a result, staff members across the board had to work overtime.
This was especially the case within Financial Management who had
to compile the Annual Financial Statements, the Annual Report,
Adjustments Estimates and Budget and to put in place a new Supply
Chain Management Unit, all for Treasury itself.
Programme 3: The reason for the overtime is that the Directorate had to meet the
due dates set for the effective and efficient completion of the
budgetary process, achieving associated goals, related matters and
ad hoc instructions.
Programme 4: Overtime in the Directorate is cyclic of nature and is mostly
concentrated in January/February (when finalising the main budget),
November (when finalising the adjustment budget) or due to
specific processes (e.g. preparing for the Local Government
cooperative summit).
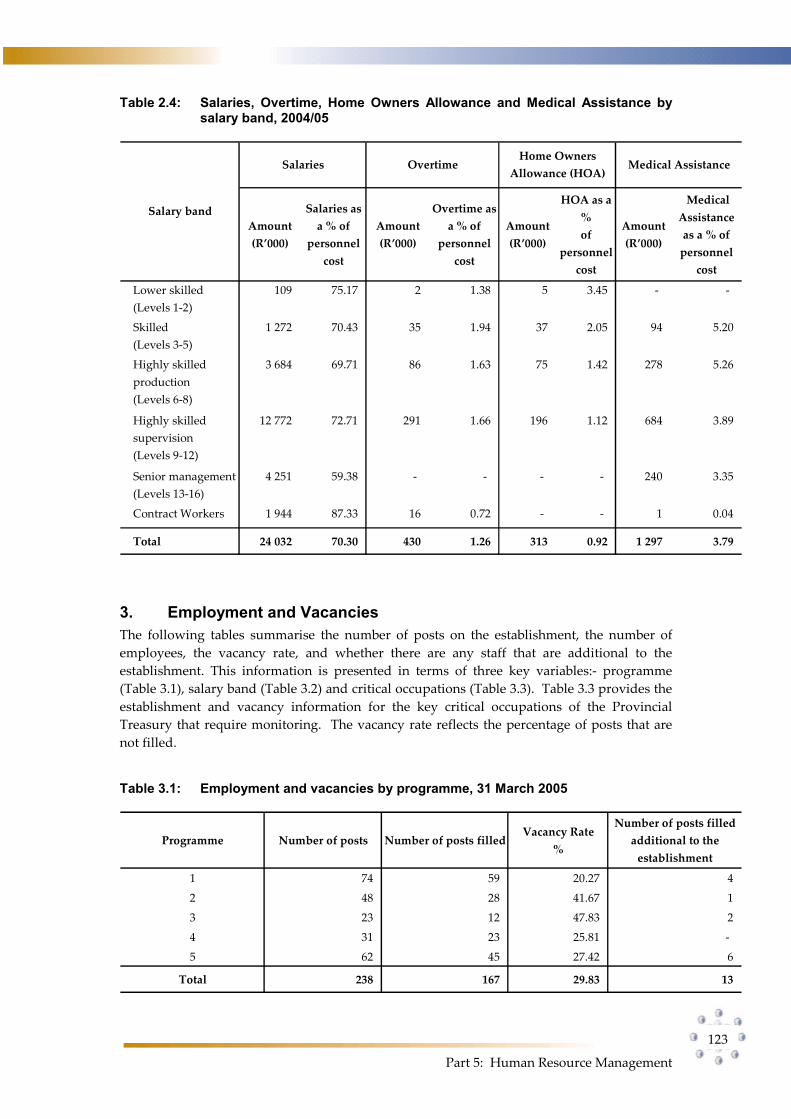
Part 5: Human Resource Management
123
Table 2.4: Salaries, Overtime, Home Owners Allowance and Medical Assistance by salary band, 2004/05
Amount
(R’000)
Salaries as
a % of
personnel
cost
Amount
(R’000)
Overtime as
a % of
personnel
cost
Amount
(R’000)
HOA as a
%
of
personnel
cost
Amount
(R’000)
Medical
Assistance
as a % of
personnel
cost
Lower skilled
(Levels 1-2)
109 75.17 2 1.38 5 3.45 - -
Skilled
(Levels 3-5)
1 272 70.43 35 1.94 37 2.05 94 5.20
Highly skilled
production
(Levels 6-8)
3 684 69.71 86 1.63 75 1.42 278 5.26
Highly skilled
supervision
(Levels 9-12)
12 772 72.71 291 1.66 196 1.12 684 3.89
Senior management
(Levels 13-16)
4 251 59.38 - - - - 240 3.35
Contract Workers 1 944 87.33 16 0.72 - - 1 0.04
Total 24 032 70.30 430 1.26 313 0.92 1 297 3.79
Medical Assistance
Salary band
Salaries OvertimeHome Owners
Allowance (HOA)
3. Employment and Vacancies The following tables summarise the number of posts on the establishment, the number of
employees, the vacancy rate, and whether there are any staff that are additional to the
establishment. This information is presented in terms of three key variables:- programme
(Table 3.1), salary band (Table 3.2) and critical occupations (Table 3.3). Table 3.3 provides the
establishment and vacancy information for the key critical occupations of the Provincial
Treasury that require monitoring. The vacancy rate reflects the percentage of posts that are
not filled.
Table 3.1: Employment and vacancies by programme, 31 March 2005
Programme Number of posts Number of posts filledVacancy Rate
%
Number of posts filled
additional to the
establishment
1 74 59 20.27 4
2 48 28 41.67 1
3 23 12 47.83 2
4 31 23 25.81 -
5 62 45 27.42 6
Total 238 167 29.83 13
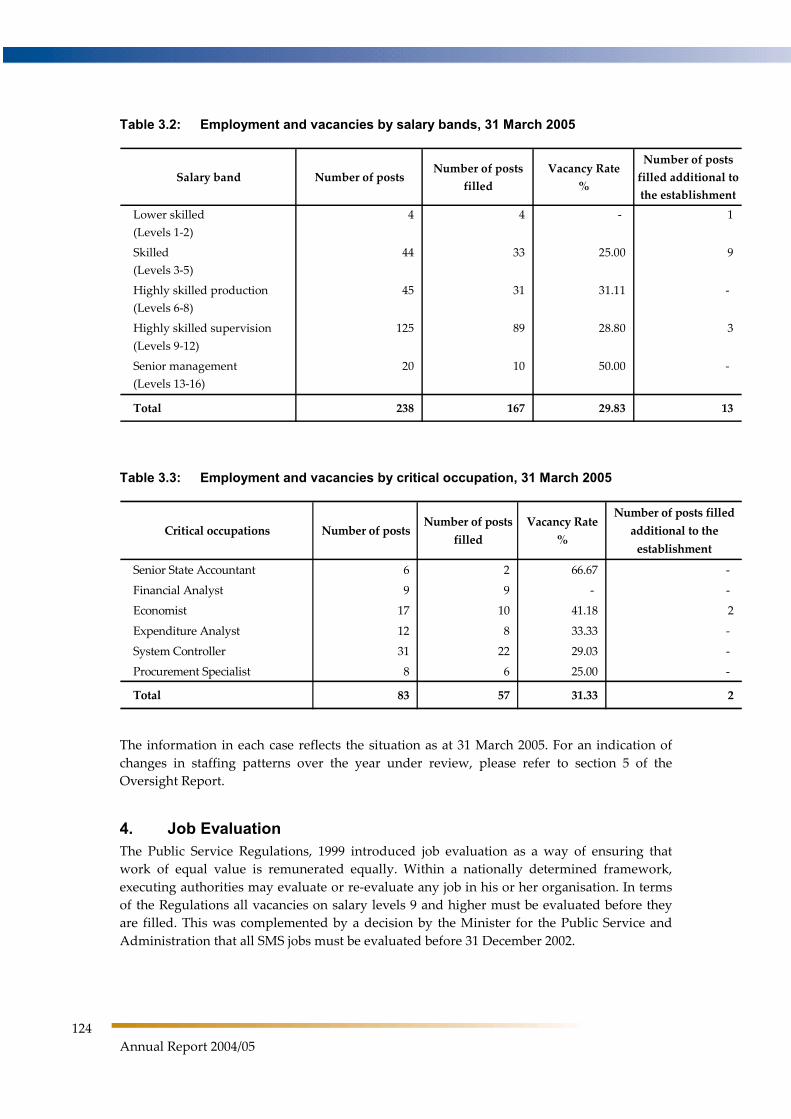
124
Annual Report 2004/05
Table 3.2: Employment and vacancies by salary bands, 31 March 2005
Salary band Number of postsNumber of posts
filled
Vacancy Rate
%
Number of posts
filled additional to
the establishment
Lower skilled
(Levels 1-2)
4 4 - 1
Skilled
(Levels 3-5)
44 33 25.00 9
Highly skilled production
(Levels 6-8)
45 31 31.11 -
Highly skilled supervision
(Levels 9-12)
125 89 28.80 3
Senior management
(Levels 13-16)
20 10 50.00 -
Total 238 167 29.83 13
Table 3.3: Employment and vacancies by critical occupation, 31 March 2005
Critical occupations Number of postsNumber of posts
filled
Vacancy Rate
%
Number of posts filled
additional to the
establishment
Senior State Accountant 6 2 66.67 -
Financial Analyst 9 9 - -
Economist 17 10 41.18 2
Expenditure Analyst 12 8 33.33 -
System Controller 31 22 29.03 -
Procurement Specialist 8 6 25.00 -
Total 83 57 31.33 2
The information in each case reflects the situation as at 31 March 2005. For an indication of
changes in staffing patterns over the year under review, please refer to section 5 of the
Oversight Report.
4. Job Evaluation The Public Service Regulations, 1999 introduced job evaluation as a way of ensuring that
work of equal value is remunerated equally. Within a nationally determined framework,
executing authorities may evaluate or re-evaluate any job in his or her organisation. In terms
of the Regulations all vacancies on salary levels 9 and higher must be evaluated before they
are filled. This was complemented by a decision by the Minister for the Public Service and
Administration that all SMS jobs must be evaluated before 31 December 2002.
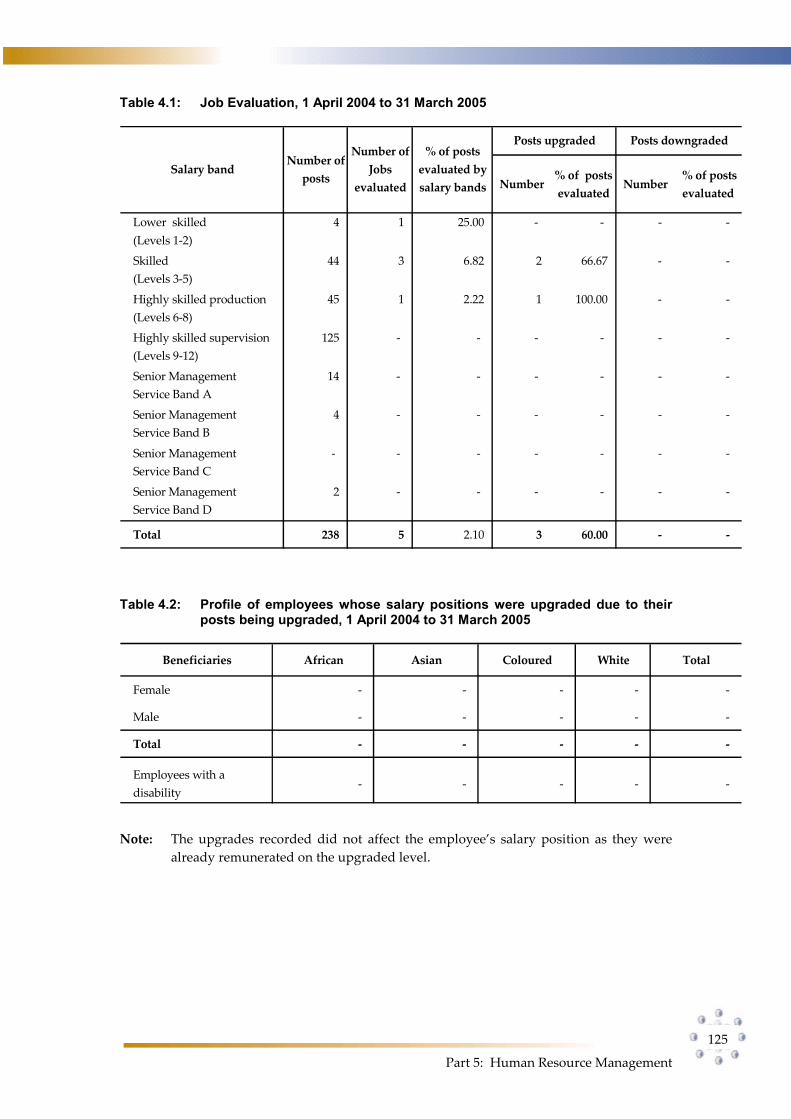
Part 5: Human Resource Management
125
Table 4.1: Job Evaluation, 1 April 2004 to 31 March 2005
Number% of posts
evaluatedNumber
% of posts
evaluated
Lower skilled
(Levels 1-2)
4 1 25.00 - - - -
Skilled
(Levels 3-5)
44 3 6.82 2 66.67 - -
Highly skilled production
(Levels 6-8)
45 1 2.22 1 100.00 - -
Highly skilled supervision
(Levels 9-12)
125 - - - - - -
Senior Management
Service Band A
14 - - - - - -
Senior Management
Service Band B
4 - - - - - -
Senior Management
Service Band C
- - - - - - -
Senior Management
Service Band D
2 - - - - - -
Total 238 5 2.10 3 60.00 - -
Posts upgraded Posts downgraded
Salary bandNumber of
posts
Number of
Jobs
evaluated
% of posts
evaluated by
salary bands
Table 4.2: Profile of employees whose salary positions were upgraded due to their posts being upgraded, 1 April 2004 to 31 March 2005
Beneficiaries African Asian Coloured White Total
Female - - - - -
Male - - - - -
Total - - - - -
Employees with a
disability- - - - -
Note: The upgrades recorded did not affect the employee’s salary position as they were
already remunerated on the upgraded level.
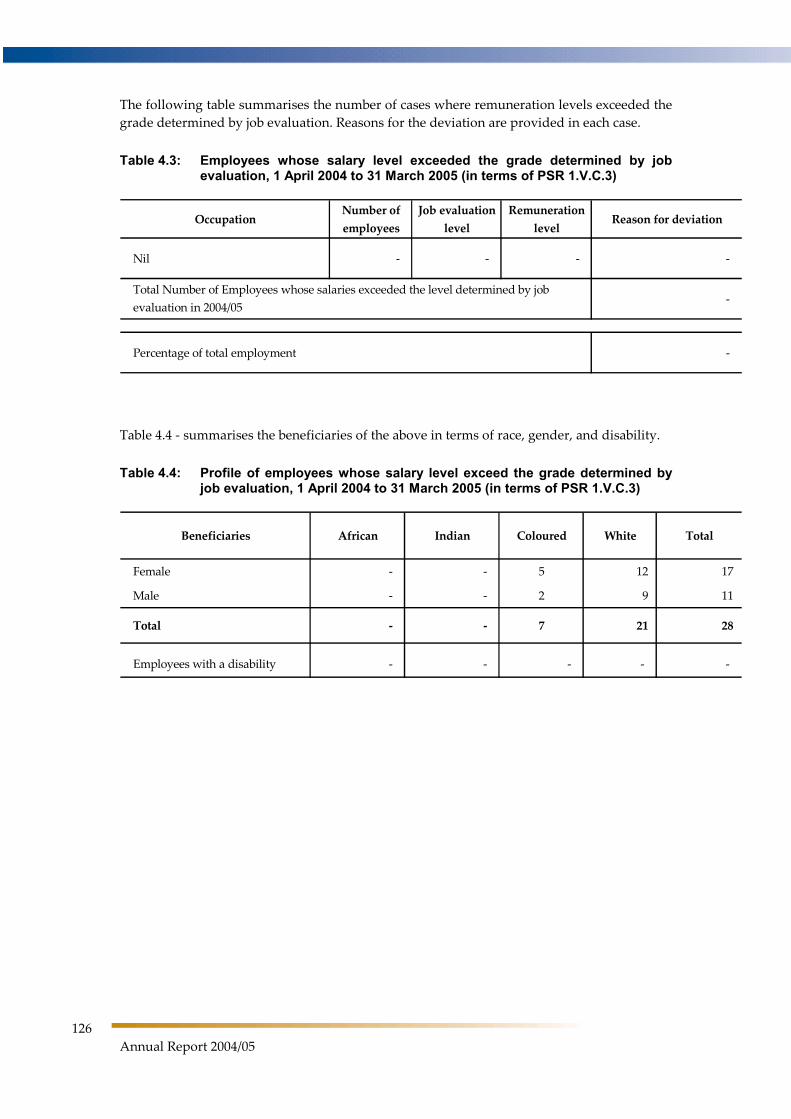
126
Annual Report 2004/05
The following table summarises the number of cases where remuneration levels exceeded the
grade determined by job evaluation. Reasons for the deviation are provided in each case.
Table 4.3: Employees whose salary level exceeded the grade determined by job evaluation, 1 April 2004 to 31 March 2005 (in terms of PSR 1.V.C.3)
OccupationNumber of
employees
Job evaluation
level
Remuneration
levelReason for deviation
Nil - - - -
-
Percentage of total employment -
Total Number of Employees whose salaries exceeded the level determined by job
evaluation in 2004/05
Table 4.4 - summarises the beneficiaries of the above in terms of race, gender, and disability.
Table 4.4: Profile of employees whose salary level exceed the grade determined by job evaluation, 1 April 2004 to 31 March 2005 (in terms of PSR 1.V.C.3)
Beneficiaries African Indian Coloured White Total
Female - - 5 12 17
Male - - 2 9 11
Total - - 7 21 28
Employees with a disability - - - - -
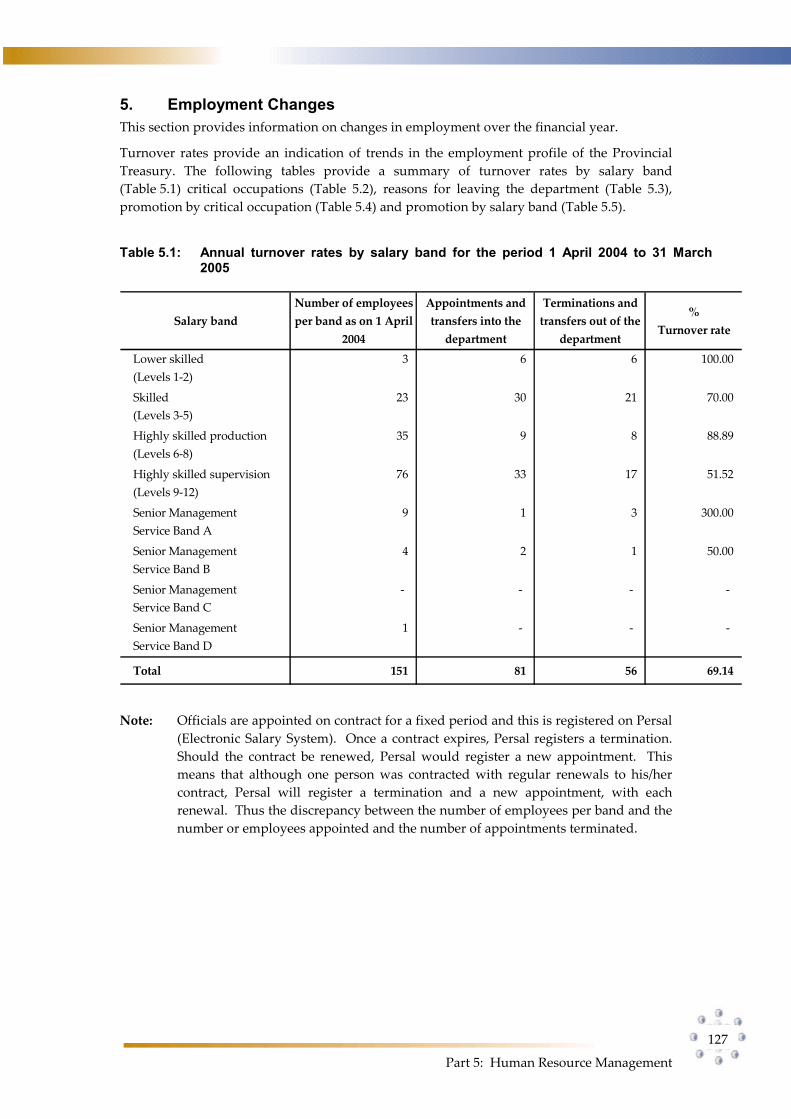
Part 5: Human Resource Management
127
5. Employment Changes This section provides information on changes in employment over the financial year.
Turnover rates provide an indication of trends in the employment profile of the Provincial
Treasury. The following tables provide a summary of turnover rates by salary band
(Table 5.1) critical occupations (Table 5.2), reasons for leaving the department (Table 5.3),
promotion by critical occupation (Table 5.4) and promotion by salary band (Table 5.5).
Table 5.1: Annual turnover rates by salary band for the period 1 April 2004 to 31 March 2005
Salary band
Number of employees
per band as on 1 April
2004
Appointments and
transfers into the
department
Terminations and
transfers out of the
department
%
Turnover rate
Lower skilled
(Levels 1-2)
3 6 6 100.00
Skilled
(Levels 3-5)
23 30 21 70.00
Highly skilled production
(Levels 6-8)
35 9 8 88.89
Highly skilled supervision
(Levels 9-12)
76 33 17 51.52
Senior Management
Service Band A
9 1 3 300.00
Senior Management
Service Band B
4 2 1 50.00
Senior Management
Service Band C
- - - -
Senior Management
Service Band D
1 - - -
Total 151 81 56 69.14
Note: Officials are appointed on contract for a fixed period and this is registered on Persal
(Electronic Salary System). Once a contract expires, Persal registers a termination.
Should the contract be renewed, Persal would register a new appointment. This
means that although one person was contracted with regular renewals to his/her
contract, Persal will register a termination and a new appointment, with each
renewal. Thus the discrepancy between the number of employees per band and the
number or employees appointed and the number of appointments terminated.
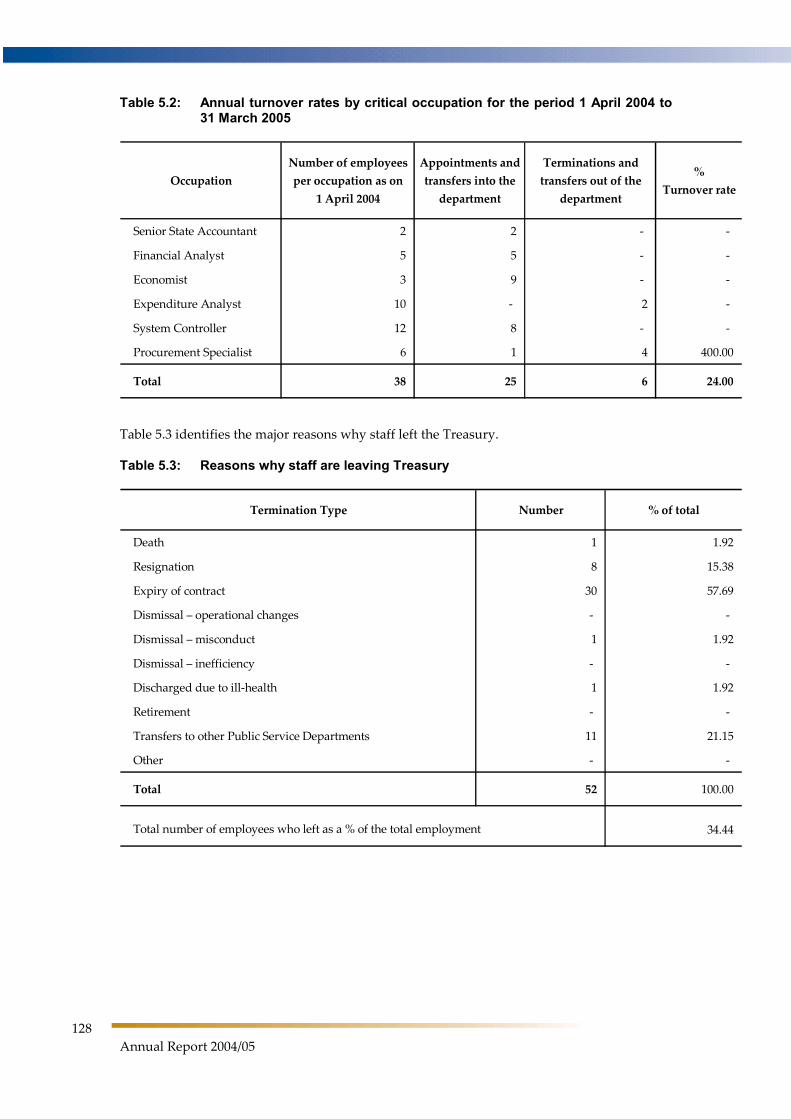
128
Annual Report 2004/05
Table 5.2: Annual turnover rates by critical occupation for the period 1 April 2004 to 31 March 2005
Occupation
Number of employees
per occupation as on
1 April 2004
Appointments and
transfers into the
department
Terminations and
transfers out of the
department
%
Turnover rate
Senior State Accountant 2 2 - -
Financial Analyst 5 5 - -
Economist 3 9 - -
Expenditure Analyst 10 - 2 -
System Controller 12 8 - -
Procurement Specialist 6 1 4 400.00
Total 38 25 6 24.00
Table 5.3 identifies the major reasons why staff left the Treasury.
Table 5.3: Reasons why staff are leaving Treasury
Termination Type Number % of total
Death 1 1.92
Resignation 8 15.38
Expiry of contract 30 57.69
Dismissal – operational changes - -
Dismissal – misconduct 1 1.92
Dismissal – inefficiency - -
Discharged due to ill-health 1 1.92
Retirement - -
Transfers to other Public Service Departments 11 21.15
Other - -
Total 52 100.00
34.44 Total number of employees who left as a % of the total employment
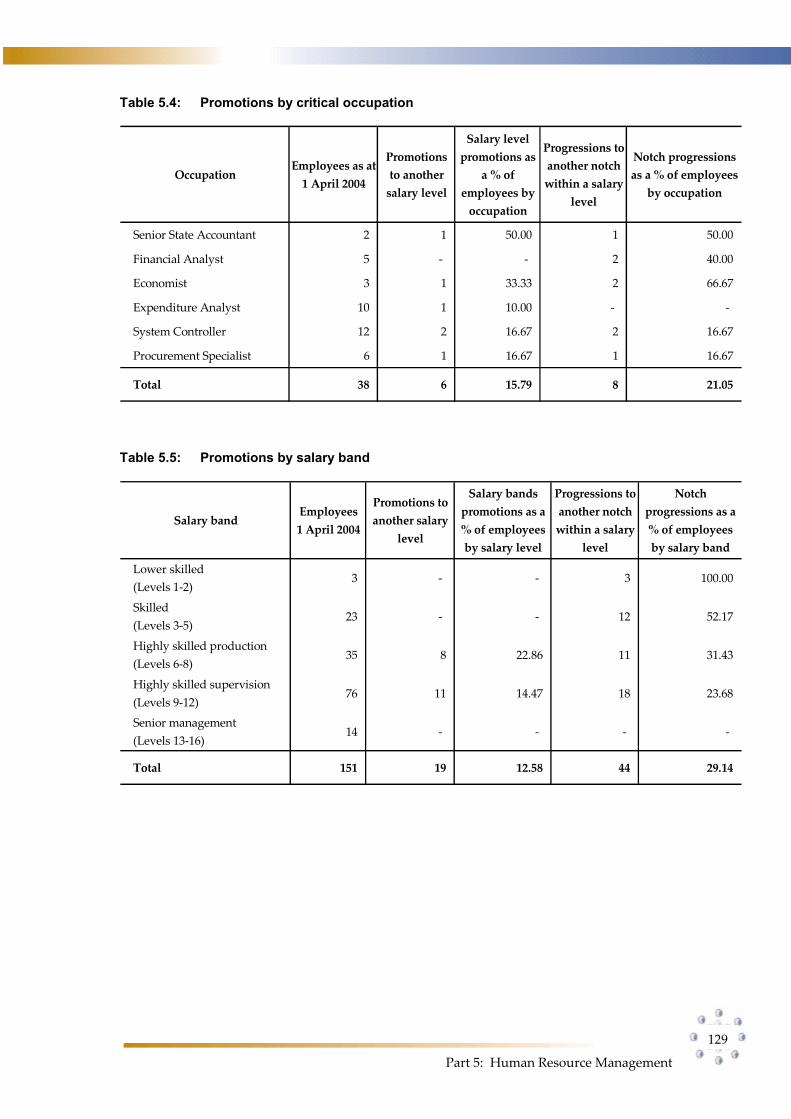
Part 5: Human Resource Management
129
Table 5.4: Promotions by critical occupation
OccupationEmployees as at
1 April 2004
Promotions
to another
salary level
Salary level
promotions as
a % of
employees by
occupation
Progressions to
another notch
within a salary
level
Notch progressions
as a % of employees
by occupation
Senior State Accountant 2 1 50.00 1 50.00
Financial Analyst 5 - - 2 40.00
Economist 3 1 33.33 2 66.67
Expenditure Analyst 10 1 10.00 - -
System Controller 12 2 16.67 2 16.67
Procurement Specialist 6 1 16.67 1 16.67
Total 38 6 15.79 8 21.05
Table 5.5: Promotions by salary band
Salary bandEmployees
1 April 2004
Promotions to
another salary
level
Salary bands
promotions as a
% of employees
by salary level
Progressions to
another notch
within a salary
level
Notch
progressions as a
% of employees
by salary band
Lower skilled
(Levels 1-2) 3 - - 3 100.00
Skilled
(Levels 3-5) 23 - - 12 52.17
Highly skilled production
(Levels 6-8) 35 8 22.86 11 31.43
Highly skilled supervision
(Levels 9-12) 76 11 14.47 18 23.68
Senior management
(Levels 13-16) 14 - - - -
Total 151 19 12.58 44 29.14
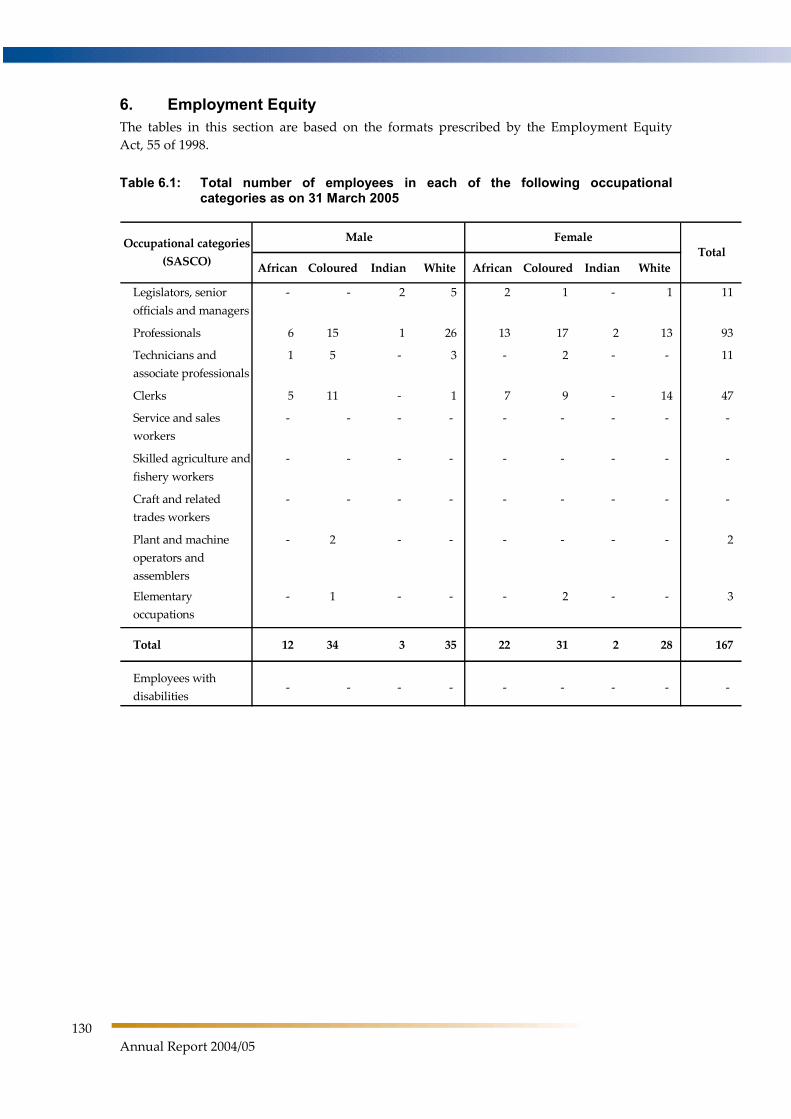
130
Annual Report 2004/05
6. Employment EquityThe tables in this section are based on the formats prescribed by the Employment Equity
Act, 55 of 1998.
Table 6.1: Total number of employees in each of the following occupational categories as on 31 March 2005
African Coloured Indian White African Coloured Indian White
Legislators, senior
officials and managers
- - 2 5 2 1 - 1 11
Professionals 6 15 1 26 13 17 2 13 93
Technicians and
associate professionals
1 5 - 3 - 2 - - 11
Clerks 5 11 - 1 7 9 - 14 47
Service and sales
workers
- - - - - - - - -
Skilled agriculture and
fishery workers
- - - - - - - - -
Craft and related
trades workers
- - - - - - - - -
Plant and machine
operators and
assemblers
- 2 - - - - - - 2
Elementary
occupations
- 1 - - - 2 - - 3
Total 12 34 3 35 22 31 2 28 167
Employees with
disabilities- - - - - - - - -
Occupational categories
(SASCO)
Male FemaleTotal
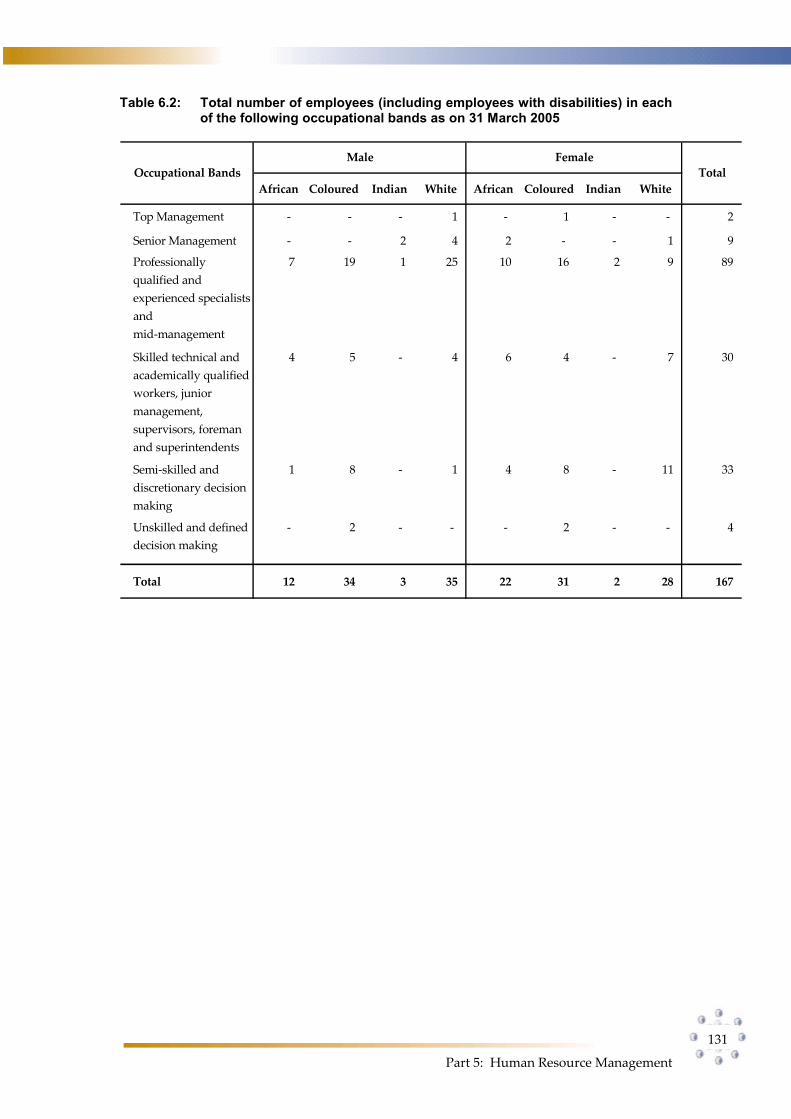
Part 5: Human Resource Management
131
Table 6.2: Total number of employees (including employees with disabilities) in each of the following occupational bands as on 31 March 2005
African Coloured Indian White African Coloured Indian White
Top Management - - - 1 - 1 - - 2
Senior Management - - 2 4 2 - - 1 9
Professionally
qualified and
experienced specialists
and
mid-management
7 19 1 25 10 16 2 9 89
Skilled technical and
academically qualified
workers, junior
management,
supervisors, foreman
and superintendents
4 5 - 4 6 4 - 7 30
Semi-skilled and
discretionary decision
making
1 8 - 1 4 8 - 11 33
Unskilled and defined
decision making
- 2 - - - 2 - - 4
Total 12 34 3 35 22 31 2 28 167
Occupational Bands
Male Female
Total
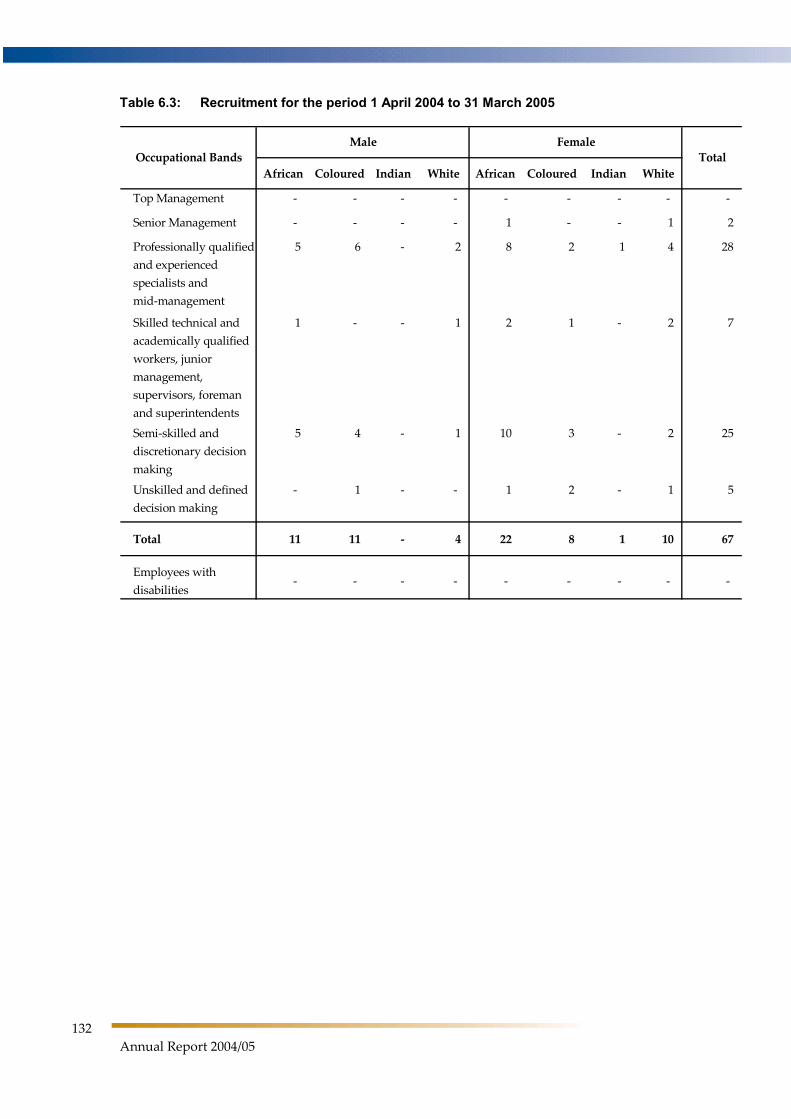
132
Annual Report 2004/05
Table 6.3: Recruitment for the period 1 April 2004 to 31 March 2005
African Coloured Indian White African Coloured Indian White
Top Management - - - - - - - - -
Senior Management - - - - 1 - - 1 2
Professionally qualified
and experienced
specialists and
mid-management
5 6 - 2 8 2 1 4 28
Skilled technical and
academically qualified
workers, junior
management,
supervisors, foreman
and superintendents
1 - - 1 2 1 - 2 7
Semi-skilled and
discretionary decision
making
5 4 - 1 10 3 - 2 25
Unskilled and defined
decision making
- 1 - - 1 2 - 1 5
Total 11 11 - 4 22 8 1 10 67
Employees with
disabilities- - - - - - - - -
Occupational Bands
Male Female
Total
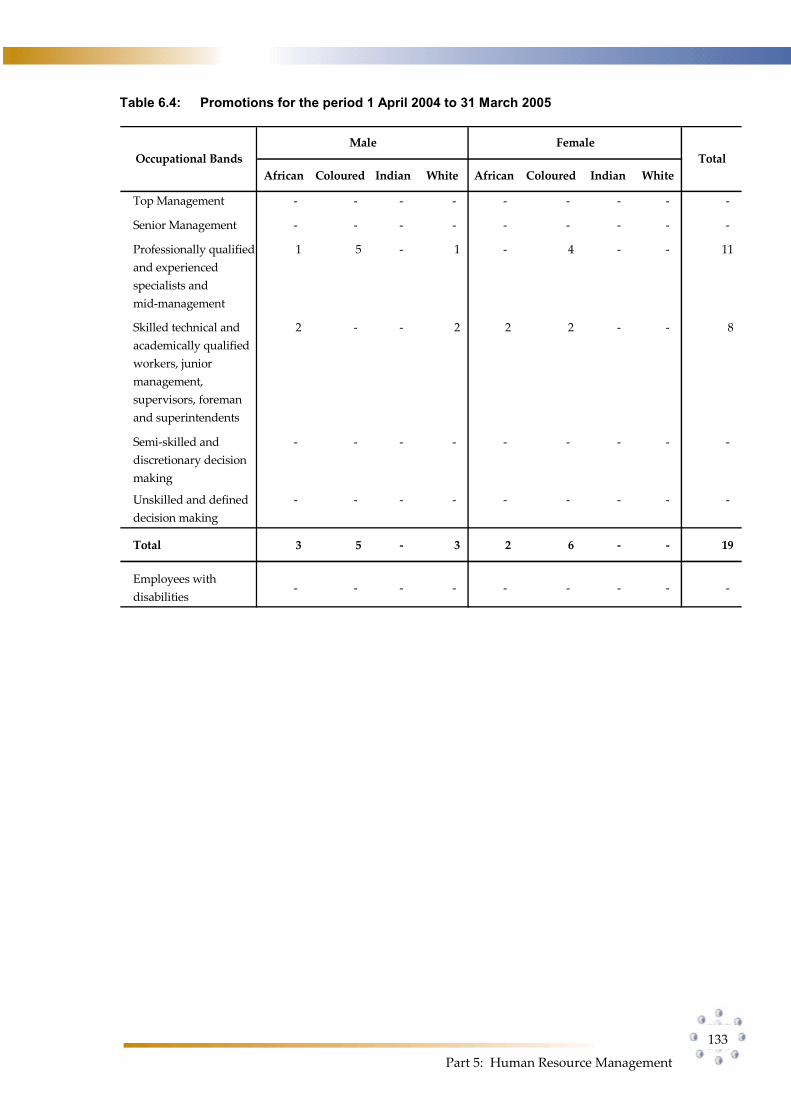
Part 5: Human Resource Management
133
Table 6.4: Promotions for the period 1 April 2004 to 31 March 2005
African Coloured Indian White African Coloured Indian White
Top Management - - - - - - - - -
Senior Management - - - - - - - - -
Professionally qualified
and experienced
specialists and
mid-management
1 5 - 1 - 4 - - 11
Skilled technical and
academically qualified
workers, junior
management,
supervisors, foreman
and superintendents
2 - - 2 2 2 - - 8
Semi-skilled and
discretionary decision
making
- - - - - - - - -
Unskilled and defined
decision making
- - - - - - - - -
Total 3 5 - 3 2 6 - - 19
Employees with
disabilities- - - - - - - - -
Occupational Bands
Male Female
Total
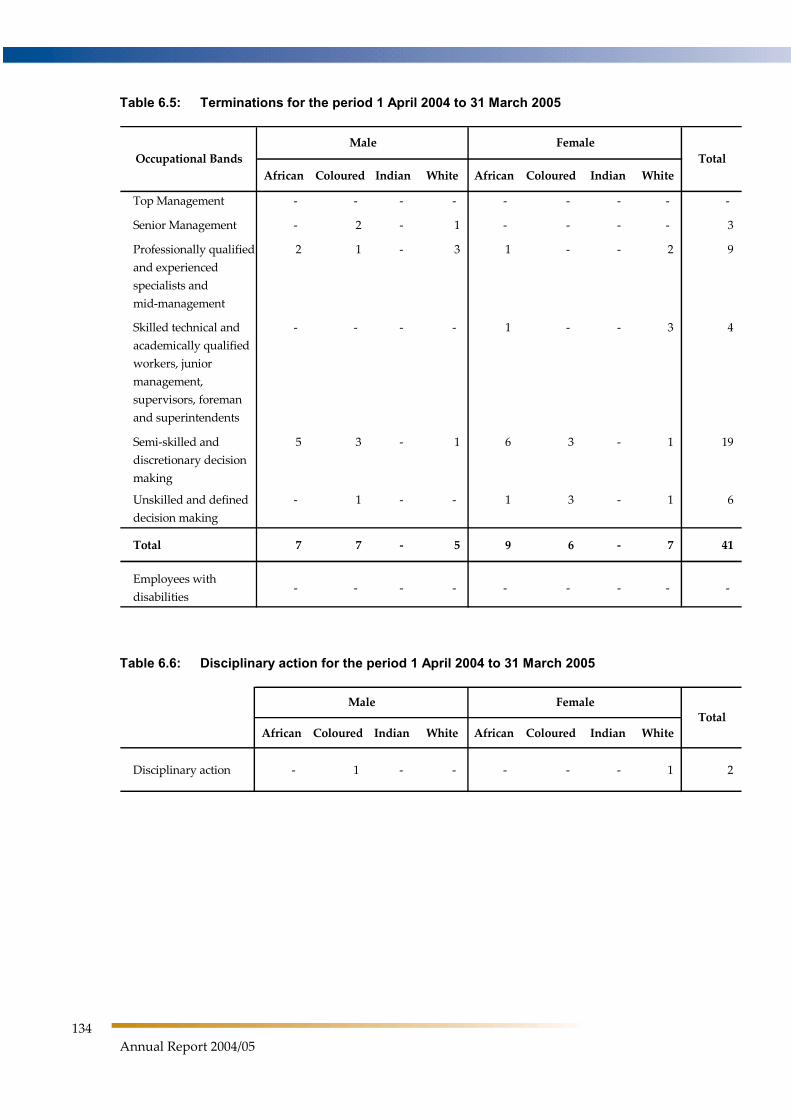
134
Annual Report 2004/05
Table 6.5: Terminations for the period 1 April 2004 to 31 March 2005
African Coloured Indian White African Coloured Indian White
Top Management - - - - - - - - -
Senior Management - 2 - 1 - - - - 3
Professionally qualified
and experienced
specialists and
mid-management
2 1 - 3 1 - - 2 9
Skilled technical and
academically qualified
workers, junior
management,
supervisors, foreman
and superintendents
- - - - 1 - - 3 4
Semi-skilled and
discretionary decision
making
5 3 - 1 6 3 - 1 19
Unskilled and defined
decision making
- 1 - - 1 3 - 1 6
Total 7 7 - 5 9 6 - 7 41
Employees with
disabilities- - - - - - - - -
Occupational Bands
Male Female
Total
Table 6.6: Disciplinary action for the period 1 April 2004 to 31 March 2005
African Coloured Indian White African Coloured Indian White
Disciplinary action - 1 - - - - - 1 2
Male FemaleTotal
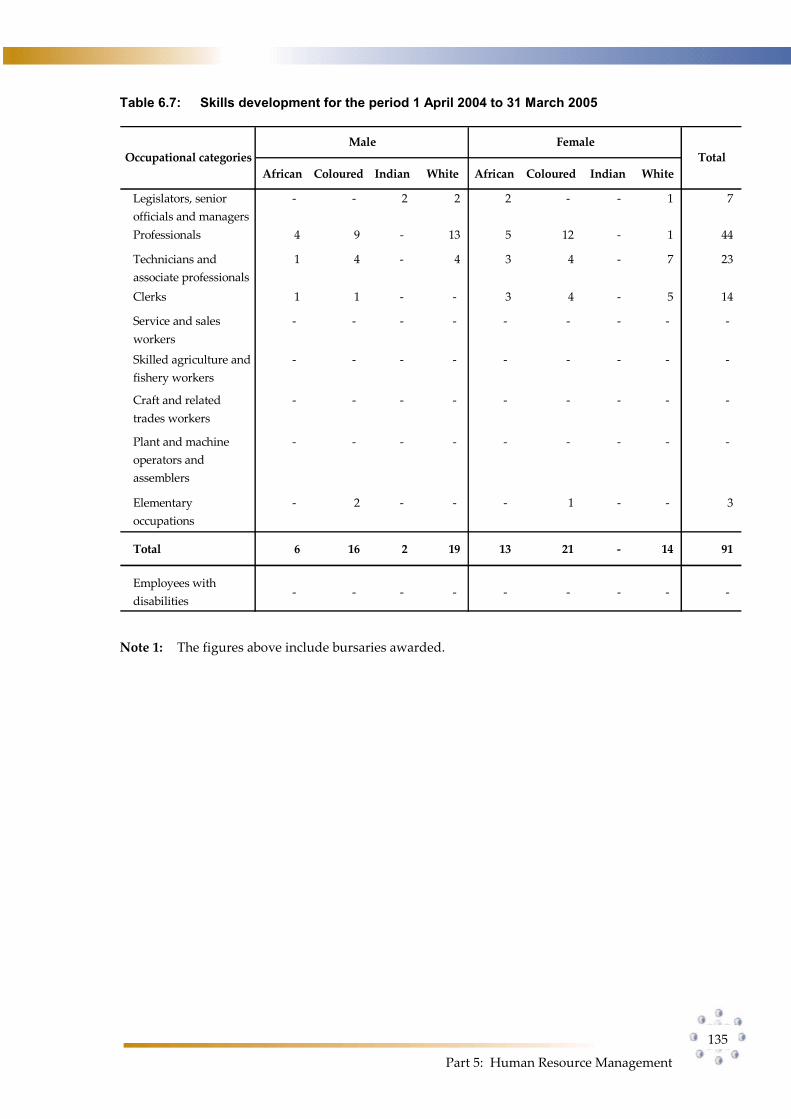
Part 5: Human Resource Management
135
Table 6.7: Skills development for the period 1 April 2004 to 31 March 2005
African Coloured Indian White African Coloured Indian White
Legislators, senior
officials and managers
- - 2 2 2 - - 1 7
Professionals 4 9 - 13 5 12 - 1 44
Technicians and
associate professionals
1 4 - 4 3 4 - 7 23
Clerks 1 1 - - 3 4 - 5 14
Service and sales
workers
- - - - - - - - -
Skilled agriculture and
fishery workers
- - - - - - - - -
Craft and related
trades workers
- - - - - - - - -
Plant and machine
operators and
assemblers
- - - - - - - - -
Elementary
occupations
- 2 - - - 1 - - 3
Total 6 16 2 19 13 21 - 14 91
Employees with
disabilities- - - - - - - - -
Occupational categories
Male Female
Total
Note 1: The figures above include bursaries awarded.
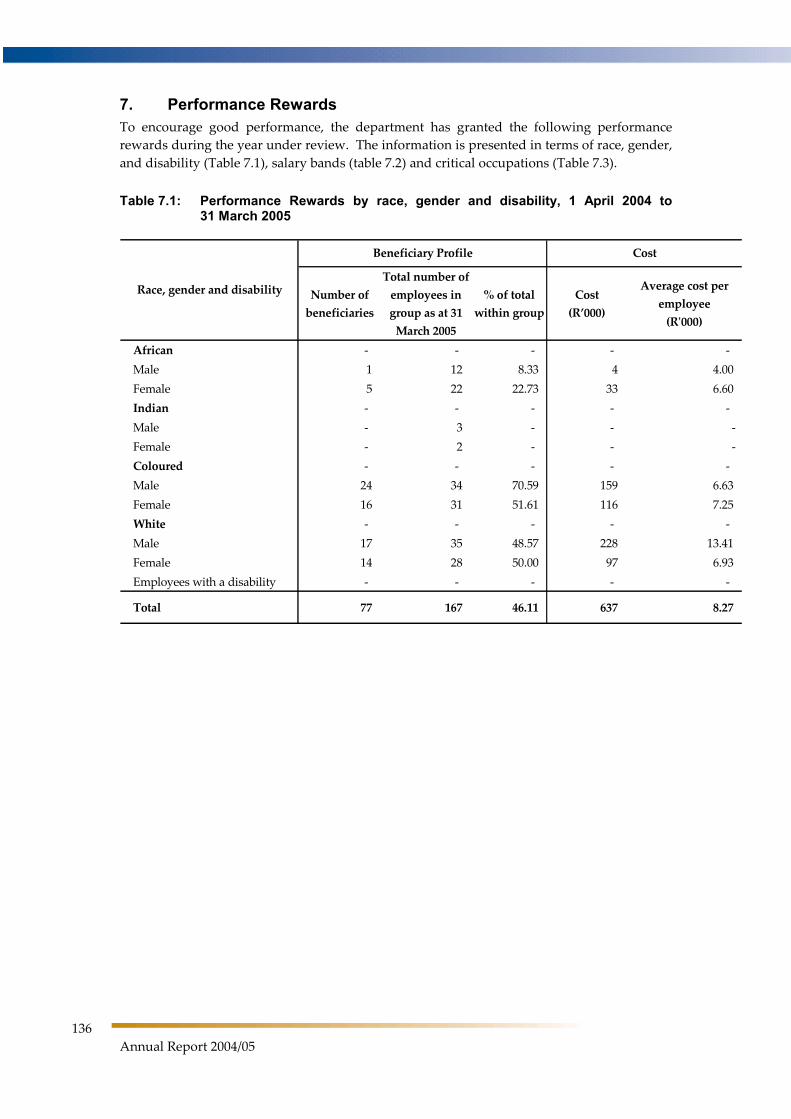
136
Annual Report 2004/05
7. Performance Rewards To encourage good performance, the department has granted the following performance
rewards during the year under review. The information is presented in terms of race, gender,
and disability (Table 7.1), salary bands (table 7.2) and critical occupations (Table 7.3).
Table 7.1: Performance Rewards by race, gender and disability, 1 April 2004 to 31 March 2005
Number of
beneficiaries
Total number of
employees in
group as at 31
March 2005
% of total
within group
Cost
(R’000)
Average cost per
employee
(R'000)
African - - - - -
Male 1 12 8.33 4 4.00
Female 5 22 22.73 33 6.60
Indian - - - - -
Male - 3 - - -
Female - 2 - - -
Coloured - - - - -
Male 24 34 70.59 159 6.63
Female 16 31 51.61 116 7.25
White - - - - -
Male 17 35 48.57 228 13.41
Female 14 28 50.00 97 6.93
Employees with a disability - - - - -
Total 77 167 46.11 637 8.27
Beneficiary Profile Cost
Race, gender and disability
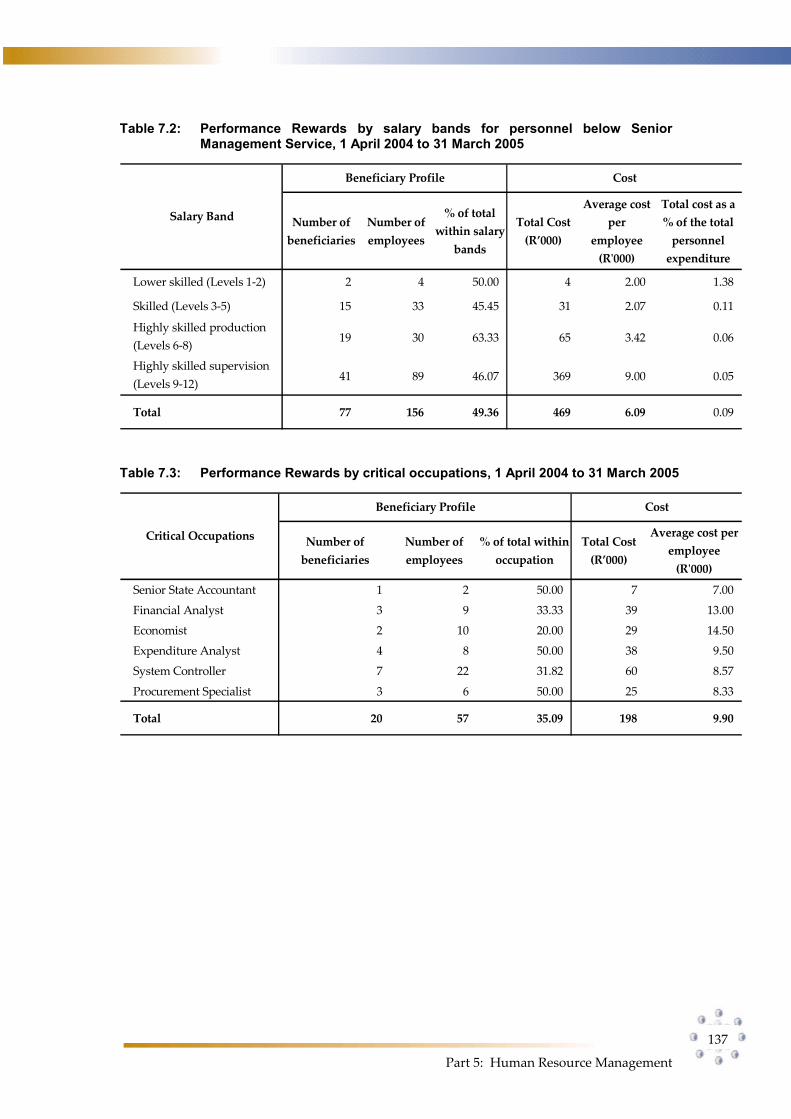
Part 5: Human Resource Management
137
Table 7.2: Performance Rewards by salary bands for personnel below Senior Management Service, 1 April 2004 to 31 March 2005
Number of
beneficiaries
Number of
employees
% of total
within salary
bands
Total Cost
(R’000)
Average cost
per
employee
(R'000)
Total cost as a
% of the total
personnel
expenditure
Lower skilled (Levels 1-2) 2 4 50.00 4 2.00 1.38
Skilled (Levels 3-5) 15 33 45.45 31 2.07 0.11
Highly skilled production
(Levels 6-8) 19 30 63.33 65 3.42 0.06
Highly skilled supervision
(Levels 9-12) 41 89 46.07 369 9.00 0.05
Total 77 156 49.36 469 6.09 0.09
Salary Band
Beneficiary Profile Cost
Table 7.3: Performance Rewards by critical occupations, 1 April 2004 to 31 March 2005
Number of
beneficiaries
Number of
employees
% of total within
occupation
Total Cost
(R’000)
Average cost per
employee
(R'000)
Senior State Accountant 1 2 50.00 7 7.00
Financial Analyst 3 9 33.33 39 13.00
Economist 2 10 20.00 29 14.50
Expenditure Analyst 4 8 50.00 38 9.50
System Controller 7 22 31.82 60 8.57
Procurement Specialist 3 6 50.00 25 8.33
Total 20 57 35.09 198 9.90
Critical Occupations
Beneficiary Profile Cost
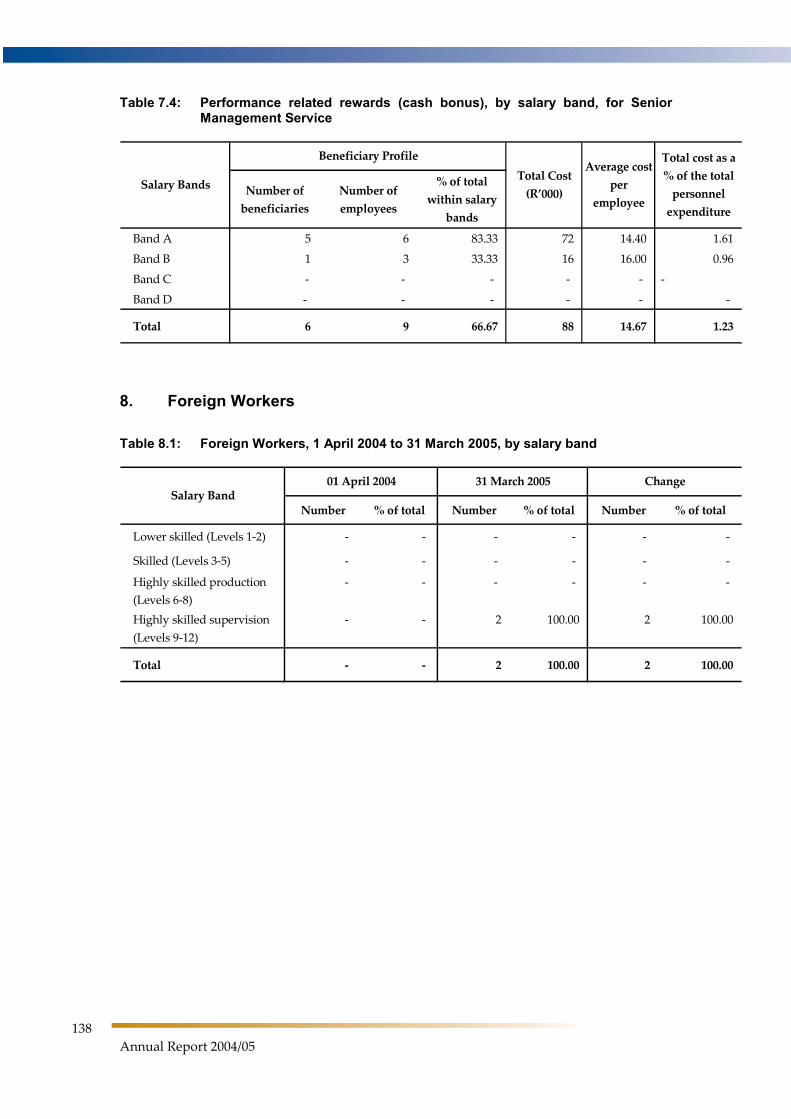
138
Annual Report 2004/05
Table 7.4: Performance related rewards (cash bonus), by salary band, for Senior Management Service
Number of
beneficiaries
Number of
employees
% of total
within salary
bands
Band A 5 6 83.33 72 14.40 1.61
Band B 1 3 33.33 16 16.00 0.96
Band C - - - - - -
Band D - - - - - -
Total 6 9 66.67 88 14.67 1.23
Total cost as a
% of the total
personnel
expenditure
Salary Bands
Beneficiary Profile
Total Cost
(R’000)
Average cost
per
employee
8. Foreign Workers
Table 8.1: Foreign Workers, 1 April 2004 to 31 March 2005, by salary band
Number % of total Number % of total Number % of total
Lower skilled (Levels 1-2) - - - - - -
Skilled (Levels 3-5) - - - - - -
Highly skilled production
(Levels 6-8)
- - - - - -
Highly skilled supervision
(Levels 9-12)
- - 2 100.00 2 100.00
Total - - 2 100.00 2 100.00
Salary Band01 April 2004 31 March 2005 Change
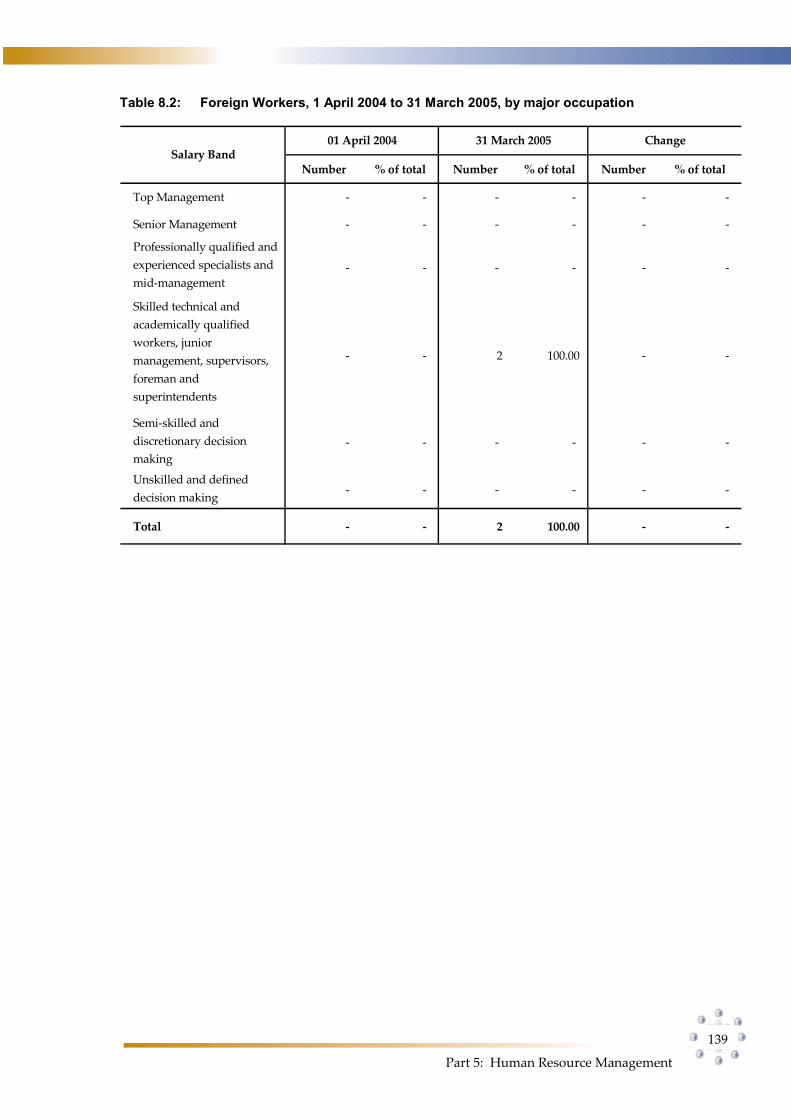
Part 5: Human Resource Management
139
Table 8.2: Foreign Workers, 1 April 2004 to 31 March 2005, by major occupation
Number % of total Number % of total Number % of total
Top Management - - - - - -
Senior Management - - - - - -
Professionally qualified and
experienced specialists and
mid-management
- - - - - -
Skilled technical and
academically qualified
workers, junior
management, supervisors,
foreman and
superintendents
- - 2 100.00 - -
Semi-skilled and
discretionary decision
making
- - - - - -
Unskilled and defined
decision making- - - - - -
Total - - 2 100.00 - -
01 April 2004 31 March 2005 ChangeSalary Band
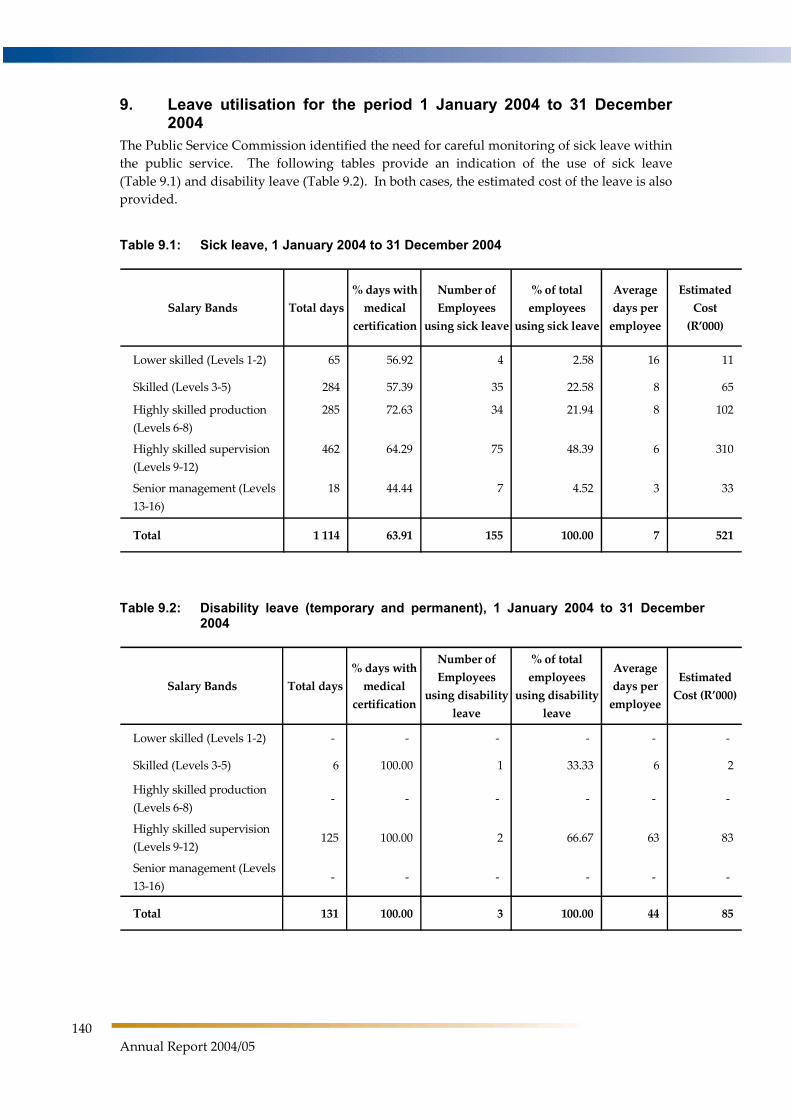
140
Annual Report 2004/05
9. Leave utilisation for the period 1 January 2004 to 31 December 2004
The Public Service Commission identified the need for careful monitoring of sick leave within
the public service. The following tables provide an indication of the use of sick leave
(Table 9.1) and disability leave (Table 9.2). In both cases, the estimated cost of the leave is also
provided.
Table 9.1: Sick leave, 1 January 2004 to 31 December 2004
Salary Bands Total days
% days with
medical
certification
Number of
Employees
using sick leave
% of total
employees
using sick leave
Average
days per
employee
Estimated
Cost
(R’000)
Lower skilled (Levels 1-2) 65 56.92 4 2.58 16 11
Skilled (Levels 3-5) 284 57.39 35 22.58 8 65
Highly skilled production
(Levels 6-8)
285 72.63 34 21.94 8 102
Highly skilled supervision
(Levels 9-12)
462 64.29 75 48.39 6 310
Senior management (Levels
13-16)
18 44.44 7 4.52 3 33
Total 1 114 63.91 155 100.00 7 521
Table 9.2: Disability leave (temporary and permanent), 1 January 2004 to 31 December 2004
Salary Bands Total days
% days with
medical
certification
Number of
Employees
using disability
leave
% of total
employees
using disability
leave
Average
days per
employee
Estimated
Cost (R’000)
Lower skilled (Levels 1-2) - - - - - -
Skilled (Levels 3-5) 6 100.00 1 33.33 6 2
Highly skilled production
(Levels 6-8)- - - - - -
Highly skilled supervision
(Levels 9-12) 125 100.00 2 66.67 63 83
Senior management (Levels
13-16)- - - - - -
Total 131 100.00 3 100.00 44 85
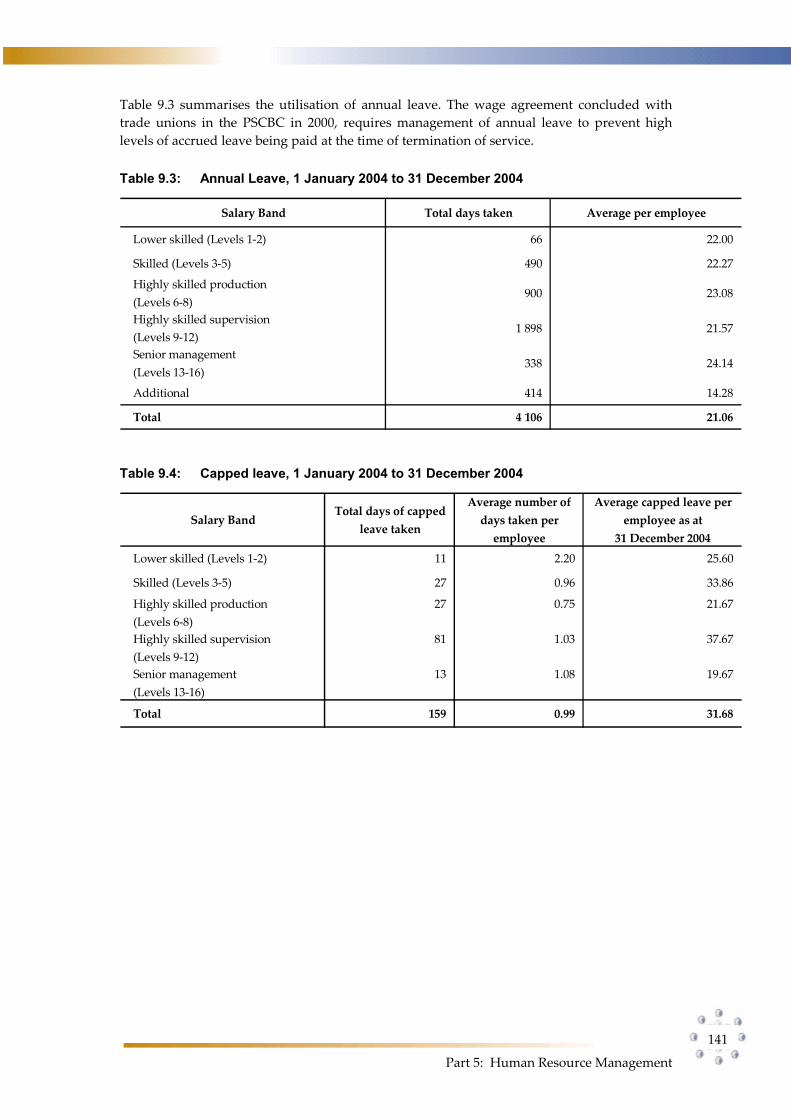
Part 5: Human Resource Management
141
Table 9.3 summarises the utilisation of annual leave. The wage agreement concluded with
trade unions in the PSCBC in 2000, requires management of annual leave to prevent high
levels of accrued leave being paid at the time of termination of service.
Table 9.3: Annual Leave, 1 January 2004 to 31 December 2004
Salary Band Total days taken Average per employee
Lower skilled (Levels 1-2) 66 22.00
Skilled (Levels 3-5) 490 22.27
Highly skilled production
(Levels 6-8) 900 23.08
Highly skilled supervision
(Levels 9-12) 1 898 21.57
Senior management
(Levels 13-16) 338 24.14
Additional 414 14.28
Total 4 106 21.06
Table 9.4: Capped leave, 1 January 2004 to 31 December 2004
Salary BandTotal days of capped
leave taken
Average number of
days taken per
employee
Average capped leave per
employee as at
31 December 2004
Lower skilled (Levels 1-2) 11 2.20 25.60
Skilled (Levels 3-5) 27 0.96 33.86
Highly skilled production
(Levels 6-8)
27 0.75 21.67
Highly skilled supervision
(Levels 9-12)
81 1.03 37.67
Senior management
(Levels 13-16)
13 1.08 19.67
Total 159 0.99 31.68
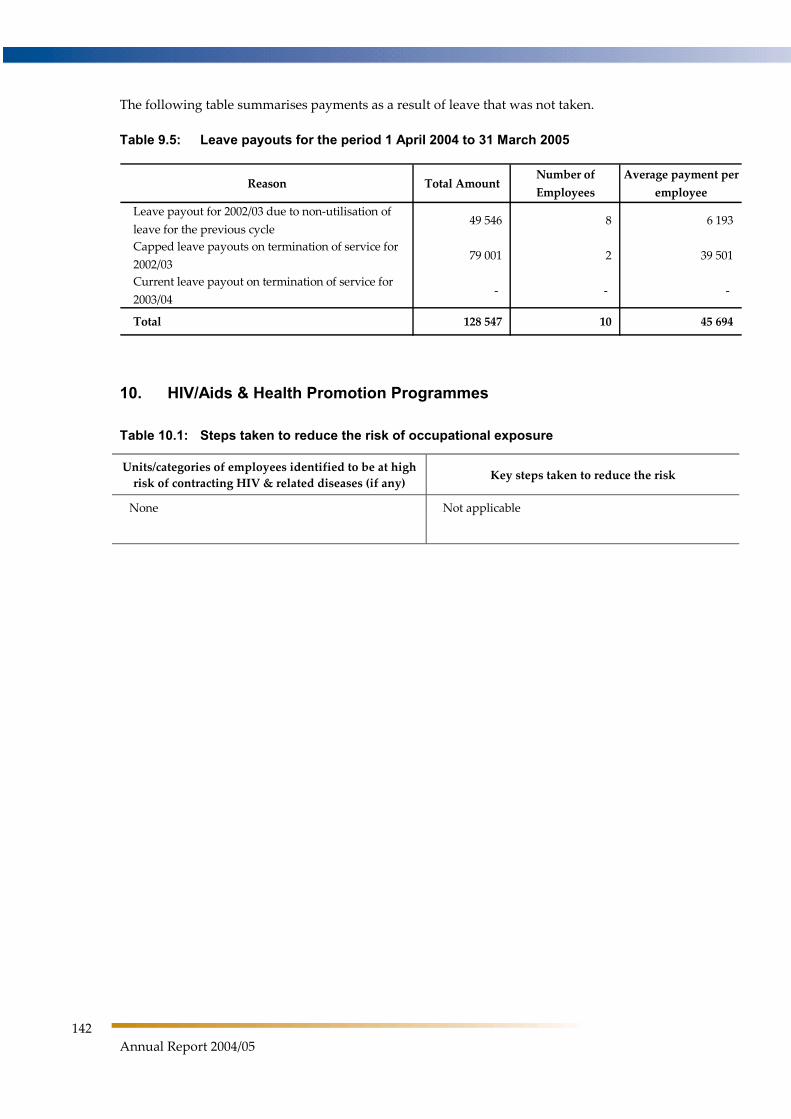
142
Annual Report 2004/05
The following table summarises payments as a result of leave that was not taken.
Table 9.5: Leave payouts for the period 1 April 2004 to 31 March 2005
Reason Total Amount Number of
Employees
Average payment per
employee
Leave payout for 2002/03 due to non-utilisation of
leave for the previous cycle 49 546 8 6 193
Capped leave payouts on termination of service for
2002/03 79 001 2 39 501
Current leave payout on termination of service for
2003/04- - -
Total 128 547 10 45 694
10. HIV/Aids & Health Promotion Programmes
Table 10.1: Steps taken to reduce the risk of occupational exposure
Units/categories of employees identified to be at high
risk of contracting HIV & related diseases (if any) Key steps taken to reduce the risk
None Not applicable
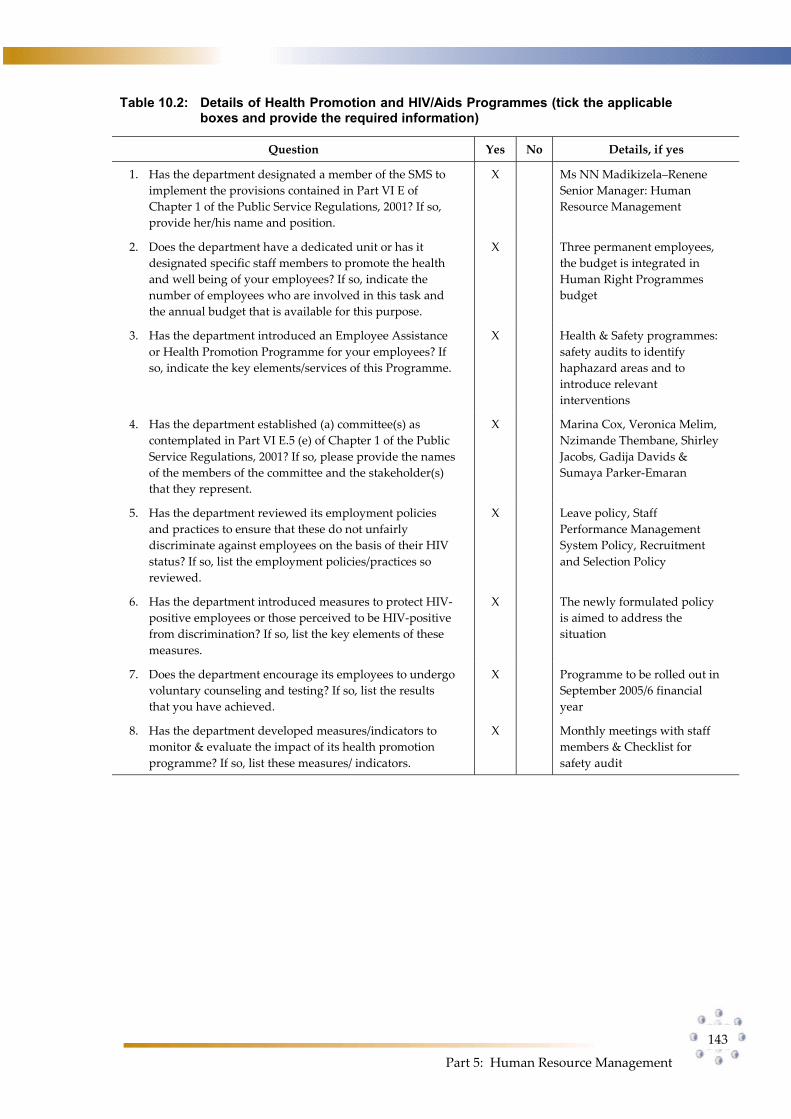
Part 5: Human Resource Management
143
Table 10.2: Details of Health Promotion and HIV/Aids Programmes (tick the applicable boxes and provide the required information)
Question Yes No Details, if yes
1. Has the department designated a member of the SMS to
implement the provisions contained in Part VI E of
Chapter 1 of the Public Service Regulations, 2001? If so,
provide her/his name and position.
X Ms NN Madikizela–Renene
Senior Manager: Human
Resource Management
2. Does the department have a dedicated unit or has it
designated specific staff members to promote the health
and well being of your employees? If so, indicate the
number of employees who are involved in this task and
the annual budget that is available for this purpose.
X Three permanent employees,
the budget is integrated in
Human Right Programmes
budget
3. Has the department introduced an Employee Assistance
or Health Promotion Programme for your employees? If
so, indicate the key elements/services of this Programme.
X Health & Safety programmes:
safety audits to identify
haphazard areas and to
introduce relevant
interventions
4. Has the department established (a) committee(s) as
contemplated in Part VI E.5 (e) of Chapter 1 of the Public
Service Regulations, 2001? If so, please provide the names
of the members of the committee and the stakeholder(s)
that they represent.
X Marina Cox, Veronica Melim,
Nzimande Thembane, Shirley
Jacobs, Gadija Davids &
Sumaya Parker-Emaran
5. Has the department reviewed its employment policies
and practices to ensure that these do not unfairly
discriminate against employees on the basis of their HIV
status? If so, list the employment policies/practices so
reviewed.
X Leave policy, Staff
Performance Management
System Policy, Recruitment
and Selection Policy
6. Has the department introduced measures to protect HIV-
positive employees or those perceived to be HIV-positive
from discrimination? If so, list the key elements of these
measures.
X The newly formulated policy
is aimed to address the
situation
7. Does the department encourage its employees to undergo
voluntary counseling and testing? If so, list the results
that you have achieved.
X Programme to be rolled out in
September 2005/6 financial
year
8. Has the department developed measures/indicators to
monitor & evaluate the impact of its health promotion
programme? If so, list these measures/ indicators.
X Monthly meetings with staff
members & Checklist for
safety audit
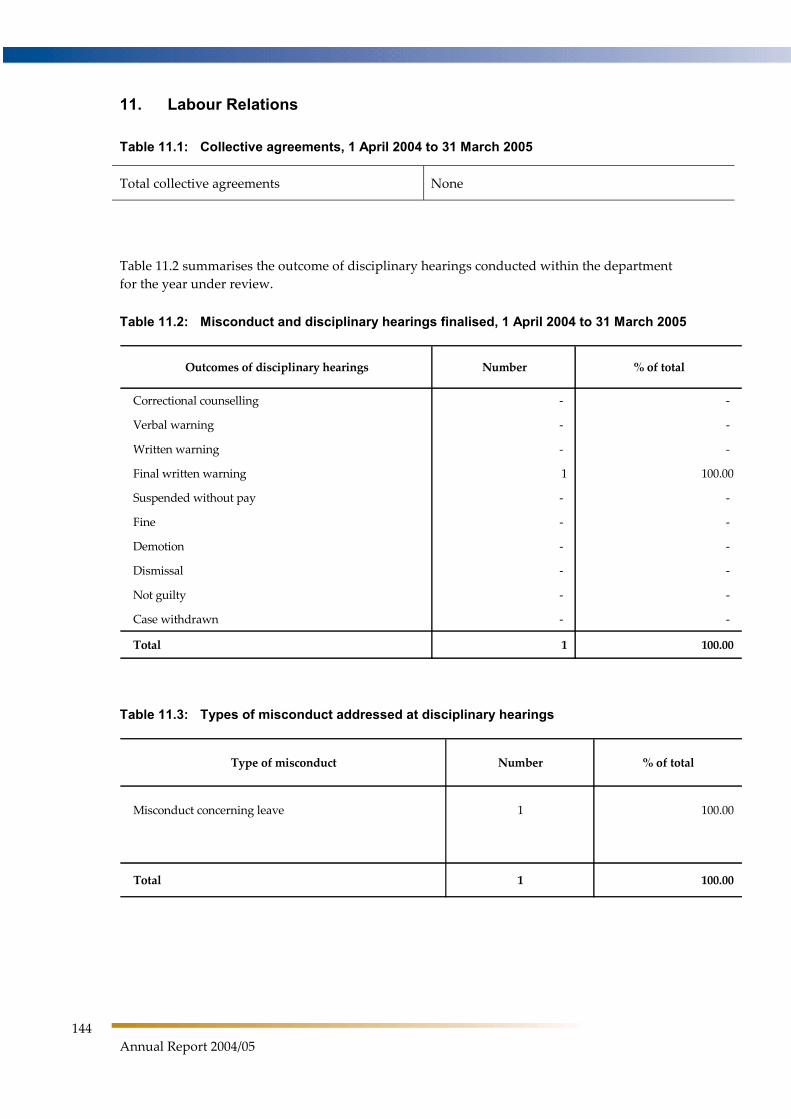
144
Annual Report 2004/05
11. Labour Relations
Table 11.1: Collective agreements, 1 April 2004 to 31 March 2005
Total collective agreements None
Table 11.2 summarises the outcome of disciplinary hearings conducted within the department
for the year under review.
Table 11.2: Misconduct and disciplinary hearings finalised, 1 April 2004 to 31 March 2005
Outcomes of disciplinary hearings Number % of total
Correctional counselling - -
Verbal warning - -
Written warning - -
Final written warning 1 100.00
Suspended without pay - -
Fine - -
Demotion - -
Dismissal - -
Not guilty - -
Case withdrawn - -
Total 1 100.00
Table 11.3: Types of misconduct addressed at disciplinary hearings
Type of misconduct Number % of total
Misconduct concerning leave 1 100.00
Total 1 100.00
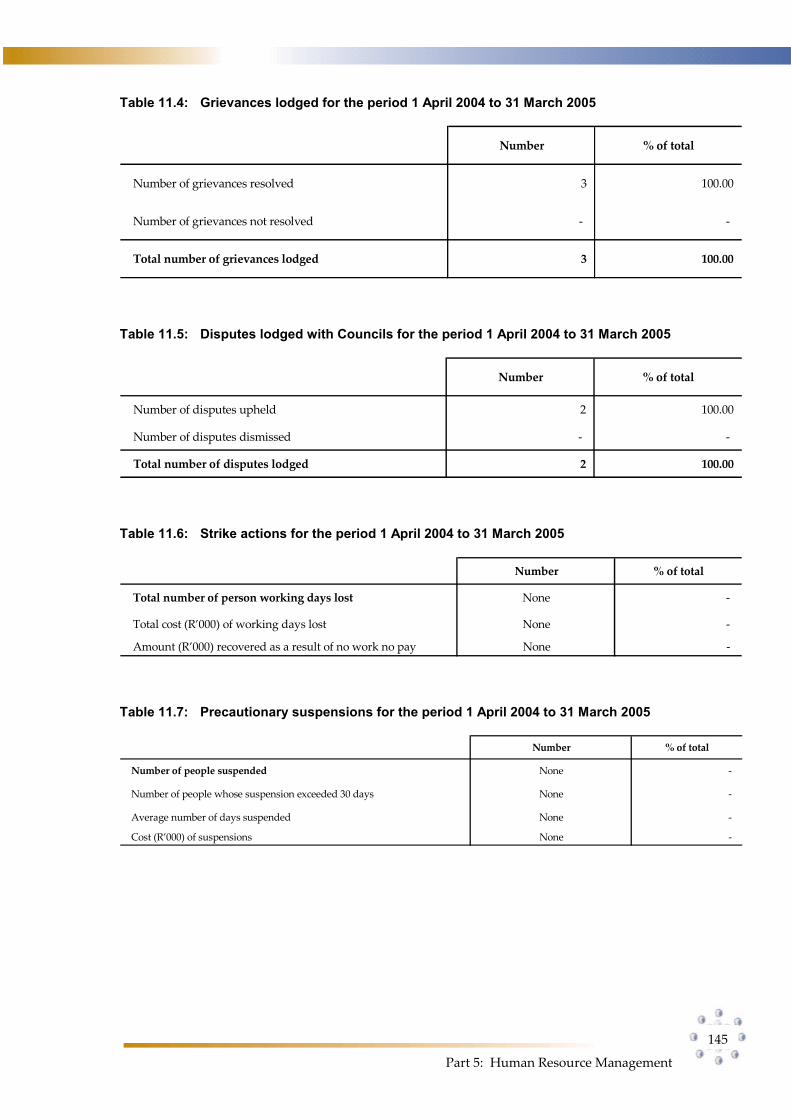
Part 5: Human Resource Management
145
Table 11.4: Grievances lodged for the period 1 April 2004 to 31 March 2005
Number % of total
Number of grievances resolved 3 100.00
Number of grievances not resolved - -
Total number of grievances lodged 3 100.00
Table 11.5: Disputes lodged with Councils for the period 1 April 2004 to 31 March 2005
Number % of total
Number of disputes upheld 2 100.00
Number of disputes dismissed - -
Total number of disputes lodged 2 100.00
Table 11.6: Strike actions for the period 1 April 2004 to 31 March 2005
Number % of total
Total number of person working days lost None -
Total cost (R’000) of working days lost None -
Amount (R’000) recovered as a result of no work no pay None -
Table 11.7: Precautionary suspensions for the period 1 April 2004 to 31 March 2005
Number % of total
Number of people suspended None -
Number of people whose suspension exceeded 30 days None -
Average number of days suspended None -
Cost (R’000) of suspensions None -
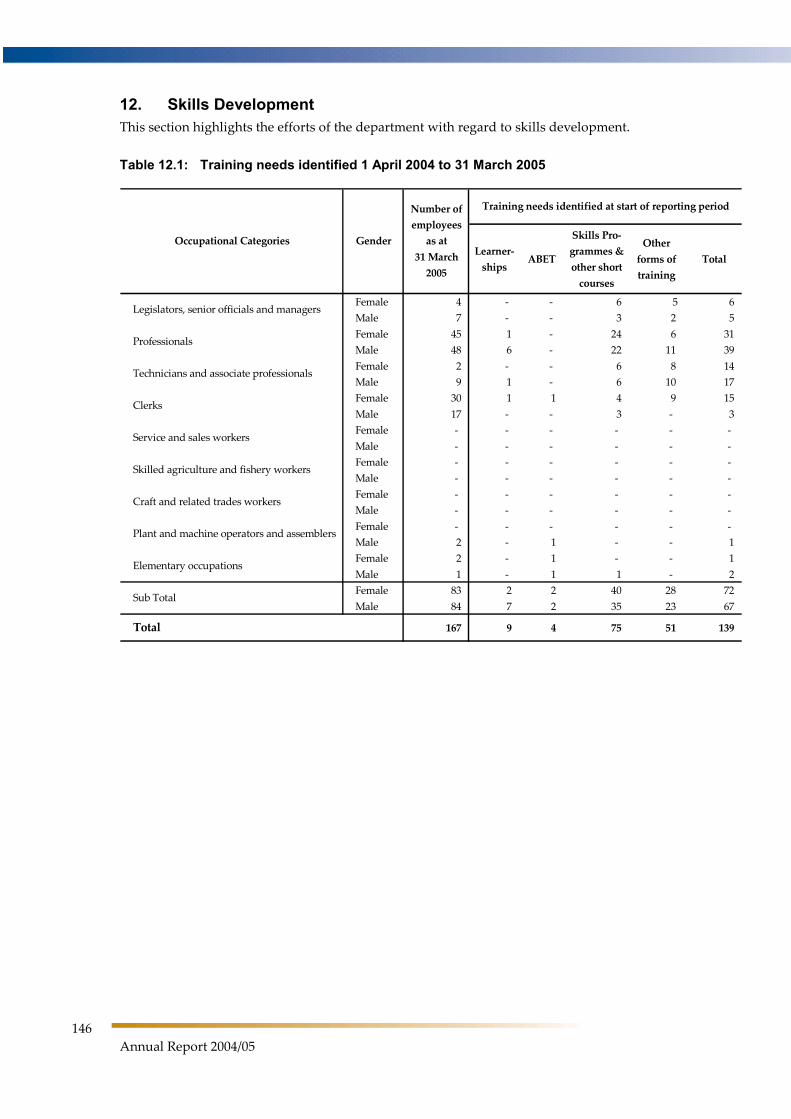
146
Annual Report 2004/05
12. Skills Development This section highlights the efforts of the department with regard to skills development.
Table 12.1: Training needs identified 1 April 2004 to 31 March 2005
Learner-
shipsABET
Skills Pro-
grammes &
other short
courses
Other
forms of
training
Total
Female 4 - - 6 5 6
Male 7 - - 3 2 5
Female 45 1 - 24 6 31
Male 48 6 - 22 11 39
Female 2 - - 6 8 14
Male 9 1 - 6 10 17
Female 30 1 1 4 9 15
Male 17 - - 3 - 3
Female - - - - - -
Male - - - - - -
Female - - - - - -
Male - - - - - -
Female - - - - - -
Male - - - - - -
Female - - - - - -
Male 2 - 1 - - 1
Female 2 - 1 - - 1
Male 1 - 1 1 - 2
Female 83 2 2 40 28 72
Male 84 7 2 35 23 67
167 9 4 75 51 139
Training needs identified at start of reporting period
Elementary occupations
Occupational Categories Gender
Number of
employees
as at
31 March
2005
Sub Total
Total
Legislators, senior officials and managers
Professionals
Technicians and associate professionals
Clerks
Service and sales workers
Skilled agriculture and fishery workers
Craft and related trades workers
Plant and machine operators and assemblers
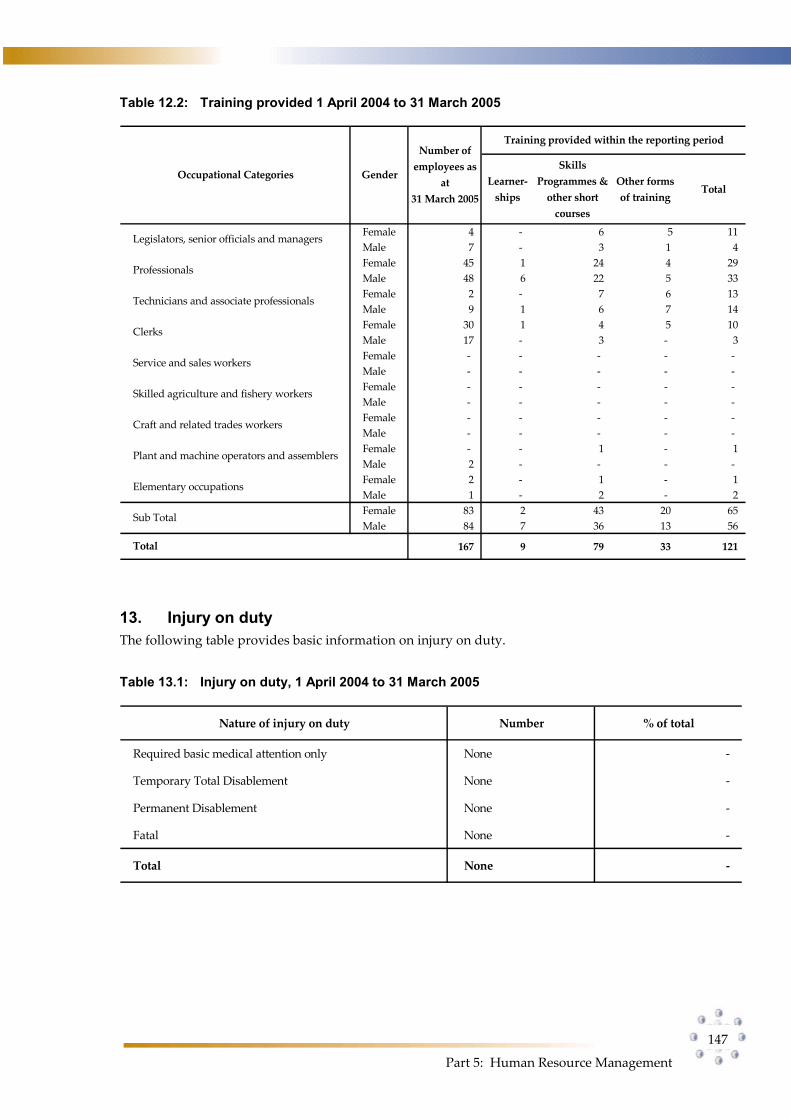
Part 5: Human Resource Management
147
Table 12.2: Training provided 1 April 2004 to 31 March 2005
Learner-
ships
Skills
Programmes &
other short
courses
Other forms
of training Total
Female 4 - 6 5 11
Male 7 - 3 1 4
Female 45 1 24 4 29
Male 48 6 22 5 33
Female 2 - 7 6 13
Male 9 1 6 7 14
Female 30 1 4 5 10
Male 17 - 3 - 3
Female - - - - -
Male - - - - -
Female - - - - -
Male - - - - -
Female - - - - -
Male - - - - -
Female - - 1 - 1
Male 2 - - - -
Female 2 - 1 - 1
Male 1 - 2 - 2
Female 83 2 43 20 65
Male 84 7 36 13 56
167 9 79 33 121
Legislators, senior officials and managers
Professionals
Technicians and associate professionals
Craft and related trades workers
Skilled agriculture and fishery workers
Service and sales workers
Clerks
Total
Sub Total
Elementary occupations
Plant and machine operators and assemblers
Occupational Categories Gender
Number of
employees as
at
31 March 2005
Training provided within the reporting period
13. Injury on duty The following table provides basic information on injury on duty.
Table 13.1: Injury on duty, 1 April 2004 to 31 March 2005
Nature of injury on duty Number % of total
Required basic medical attention only None -
Temporary Total Disablement None -
Permanent Disablement None -
Fatal None -
Total None -
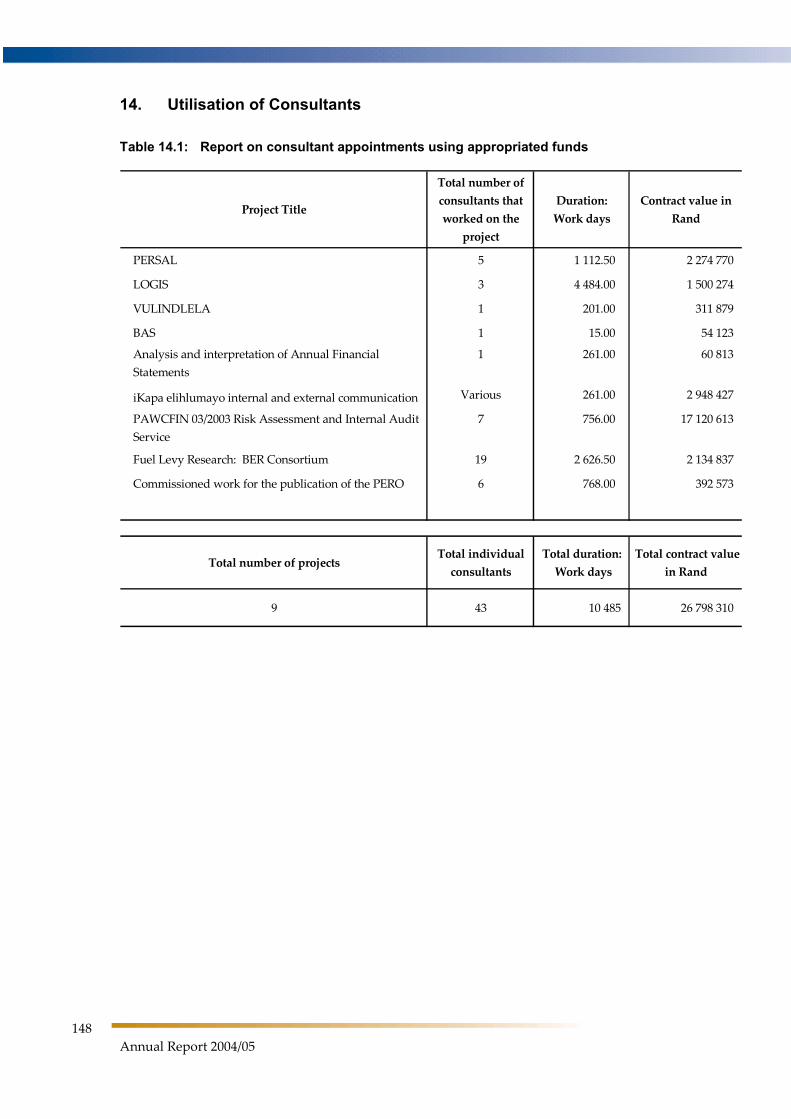
148
Annual Report 2004/05
14. Utilisation of Consultants
Table 14.1: Report on consultant appointments using appropriated funds
Project Title
Total number of
consultants that
worked on the
project
Duration:
Work days
Contract value in
Rand
PERSAL 5 1 112.50 2 274 770
LOGIS 3 4 484.00 1 500 274
VULINDLELA 1 201.00 311 879
BAS 1 15.00 54 123
Analysis and interpretation of Annual Financial
Statements
1 261.00 60 813
iKapa elihlumayo internal and external communication Various 261.00 2 948 427
PAWCFIN 03/2003 Risk Assessment and Internal Audit
Service
7 756.00 17 120 613
Fuel Levy Research: BER Consortium 19 2 626.50 2 134 837
Commissioned work for the publication of the PERO 6 768.00 392 573
Total number of projectsTotal individual
consultants
Total duration:
Work days
Total contract value
in Rand
9 43 10 485 26 798 310
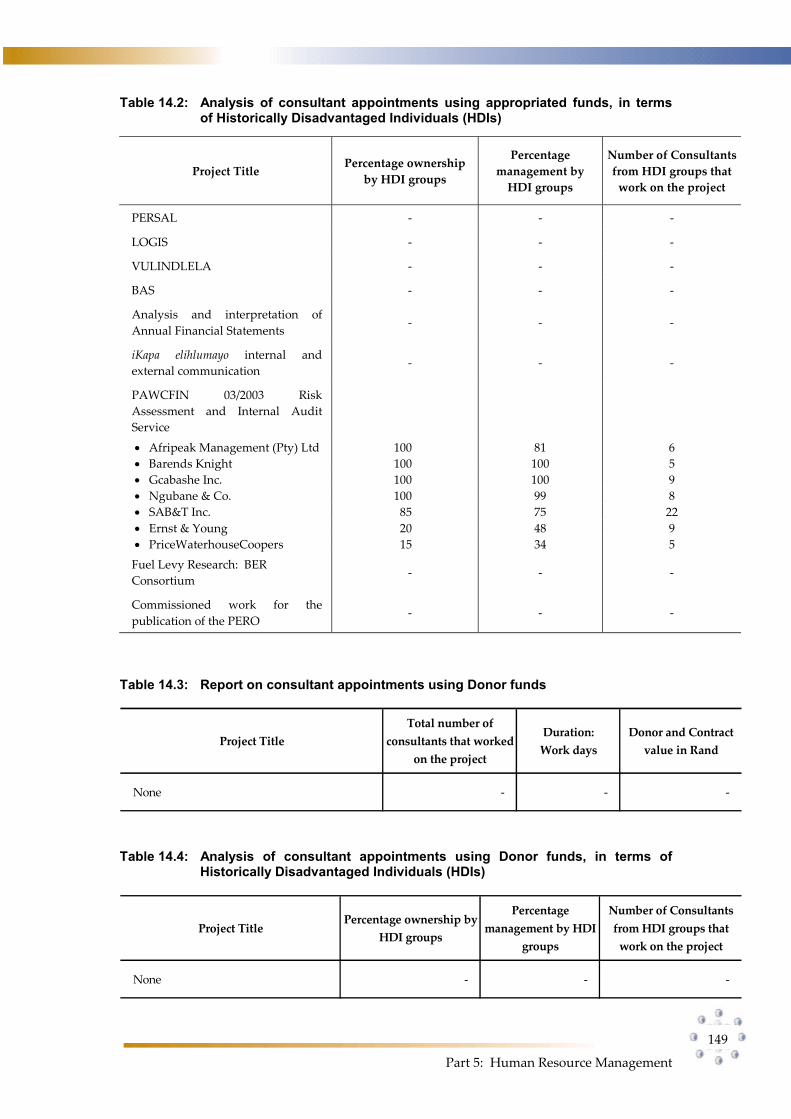
Part 5: Human Resource Management
149
Table 14.2: Analysis of consultant appointments using appropriated funds, in terms of Historically Disadvantaged Individuals (HDIs)
Project Title Percentage ownership
by HDI groups
Percentage
management by
HDI groups
Number of Consultants
from HDI groups that
work on the project
PERSAL - - -
LOGIS - - -
VULINDLELA - - -
BAS - - -
Analysis and interpretation of
Annual Financial Statements - - -
iKapa elihlumayo internal and
external communication - - -
PAWCFIN 03/2003 Risk
Assessment and Internal Audit
Service
Afripeak Management (Pty) Ltd 100 81 6
Barends Knight 100 100 5
Gcabashe Inc. 100 100 9
Ngubane & Co. 100 99 8
SAB&T Inc. 85 75 22
Ernst & Young 20 48 9
PriceWaterhouseCoopers 15 34 5
Fuel Levy Research: BER
Consortium - - -
Commissioned work for the
publication of the PERO - - -
Table 14.3: Report on consultant appointments using Donor funds
Project Title
Total number of
consultants that worked
on the project
Duration:
Work days
Donor and Contract
value in Rand
None - - -
Table 14.4: Analysis of consultant appointments using Donor funds, in terms of Historically Disadvantaged Individuals (HDIs)
Project TitlePercentage ownership by
HDI groups
Percentage
management by HDI
groups
Number of Consultants
from HDI groups that
work on the project
None - - -


![IN THE HIGH COURT OF SOUTH AFRICA (WESTERN CAPE HIGH COURT ... · relevant provincial treasury and the National Treasury.11 14]The City of Cape Town’s supply chain management policy](https://img.dokumen.tips/doc/110x75/60e4b341b526e0195070a311/in-the-high-court-of-south-africa-western-cape-high-court-relevant-provincial.jpg)