Embed Size (px)
Citation preview

Provider characteristics

provider characteristics
298J
Table J.1 . 299Certified dialysis & transplant facilities: by Medicare certification
Table J.2 . 299Transplant facilities, patients transplanted, & donor types
Table J.3 . 299Dialysis facilities, stations, & patient flow
Table J.4 . 300Dialysis & transplant facilities: by state & territory
Table J.5 . 301Dialysis & transplant facilities: by ESRD network
Table J.6 . 301Dialysis & transplant facilities: by certification type
Table J.7 . 301Dialysis & transplant facilities: by service type
Table J.8 . 302Dialysis & transplant facilities: by ownership type
Table J.9 . 302Dialysis treatments: by modality
Table J.10 . 303Median number of patients: by certification type
Table J.11 . 303Dialysis & transplant patients: by Medicare entitlement
Table J.12 . 304Dialysis patients: by state & territory
Table J.13 . 305Dialysis patients: by ESRD network
Table J.14 . 305Dialysis patients: by certification type
Table J.15 . 305Dialysis patients: by treatment modality
Table J.16 . 306Patient & treatment counts: by detailed facility survey field
Table J.17 . 308Hemodialysis patients dialyzing more than 4 times per week
Table J.18 . 308Vocational rehabilitationdialysis patients age 18–54
Table J.19 . 308Staffing: full-time & part-time staff employed as of December 31
Table J.20 . 308Staffing: full- & part-time positions open & not filled as of December 31
The following symbols are used throughout this reference section* Values for cells with ten or fewer patients are suppressed. “ . ” Zero values in this cell.
All tables are based on the Centers for Medicare and Medicaid Services Annual Facility Surveys, ending each December.

299J
2007 USRDS Annual Data ReportTable J.1Certified dialysis & transplant facilities: by Medicare certification
Certified units VA Total TotalDialysis Patients Dialysis Patients Total dialysis patients
Facilities patients transplanted Facilities patients transplanted facilities patients transplanted1991 2,148 141,942 9,997 12 546 14 2,160 142,488 10,0111992 2,292 156,834 10,090 12 520 11 2,304 157,354 10,1011993 2,456 170,958 10,903 13 521 * 2,469 171,479 10,9101994 2,624 186,316 11,295 13 506 * 2,637 186,822 11,2961995 2,876 199,711 11,885 12 451 . 2,888 200,162 11,8851996 3,083 213,731 12,179 12 372 . 3,095 214,103 12,1791997 3,344 229,834 12,367 11 356 . 3,355 230,190 12,3671998 3,576 245,365 13,316 11 345 . 3,587 245,710 13,3161999 3,833 259,159 13,479 10 334 . 3,843 259,493 13,4792000 4,013 273,009 14,300 10 324 . 4,023 273,333 14,3002001 4,175 285,645 14,608 10 337 . 4,185 285,982 14,6082002 4,379 296,322 15,055 54 2,030 22 4,433 298,352 15,0772003 4,530 307,909 15,661 61 2,186 51 4,591 310,095 15,7122004 4,673 318,170 16,488 59 2,234 41 4,732 320,404 16,5292005 4,871 330,132 17,146 71 2,658 114 4,942 332,790 17,260
Table J.2Transplant facilities, patients transplanted, & donor typesby type & year
Facilities Patients performing Patients Living Deceased Total awaiting transplants transplanted donors donors transplants transplant1991 222 10,011 2,382 7,644 10,026 18,2011992 223 10,101 2,536 7,579 10,115 21,6091993 228 10,910 2,828 8,106 10,934 22,9101994 233 11,296 3,000 8,312 11,312 26,5921995 233 11,885 3,416 8,486 11,902 28,8831996 236 12,179 3,703 8,495 12,198 32,7391997 234 12,367 3,905 8,468 12,373 35,8931998 233 13,316 4,520 8,752 13,272 38,3001999 238 13,479 4,644 8,839 13,483 40,7392000 235 14,300 5,427 8,884 14,311 41,1222001 233 14,608 5,804 8,824 14,628 47,2562002 236 15,077 5,893 9,213 15,106 47,5252003 237 15,712 6,244 9,494 15,738 51,0022004 237 16,529 6,506 10,062 16,568 52,2142005 242 17,260 6,480 10,815 17,295 57,372
Table J.3Dialysis facilities, stations, & patient flow
Facilities with Patients patients patients at beginning added lost lost to ending during year at end of year stations of year during year during year followup year1991 2,154 2,046 28,985 129,706 82,345 69,209 354 142,4881992 2,289 2,181 30,641 142,780 91,011 76,138 299 157,3541993 2,469 2,353 35,240 157,525 99,821 85,637 230 171,4791994 2,637 2,523 38,169 171,536 108,534 92,921 327 186,8221995 2,888 2,751 41,809 186,649 115,940 102,035 392 200,1621996 3,095 2,957 45,728 199,974 122,943 108,483 331 214,1031997 3,355 3,196 50,569 214,179 133,695 117,305 379 230,1901998 3,587 3,407 54,575 230,181 142,609 126,698 382 245,7101999 3,824 3,630 58,895 245,575 149,445 135,065 462 259,4932000 4,023 3,832 61,537 259,824 154,764 140,766 489 273,3332001 4,181 3,991 68,133 273,169 159,114 145,580 721 285,9822002 4,432 4,204 72,115 287,263 167,568 155,886 593 298,3522003 4,586 4,373 76,294 299,644 170,306 159,111 744 310,0952004 4,732 4,527 79,567 310,499 176,468 165,836 727 320,4042005 4,942 4,683 82,544 321,994 184,221 172,453 895 332,790
Table J.1Certified dialysis & transplant facilities: by Medicare certification
Table J.2Transplant facilities, patients transplanted, & donor types
Table J.3Dialysis facilities, stations, & patient flow

provider characteristics
300J
Table J.4Dialysis & transplant facilities: by state & territory
1991 1992 1993 1994 1995 1996 1997 1998 1999 2000 2001 2002 2003 2004 2005Alabama 42 46 49 52 66 76 80 93 96 95 99 101 106 110 110Alaska 3 3 2 2 2 2 2 2 2 2 2 2 2 4 4Arizona 43 47 55 57 64 68 76 77 80 81 87 91 94 95 99Arkansas 35 35 38 38 41 42 46 52 58 58 64 64 65 64 64California 249 250 261 276 296 313 328 346 354 355 366 383 408 421 427Colorado 21 21 20 20 22 25 28 32 34 37 39 42 42 45 52Connecticut 20 20 21 23 24 23 23 23 33 34 33 32 32 32 32Delaware 6 6 7 7 8 8 8 10 11 12 13 15 15 17 17District of Columbia 21 21 21 21 23 23 23 23 23 22 23 23 24 22 23Florida 146 157 167 177 185 201 216 228 248 253 262 264 269 279 288Georgia 84 88 97 100 115 126 140 151 165 182 199 216 219 222 237Hawaii 12 12 12 12 14 13 13 14 14 16 18 19 18 18 18Idaho 7 7 7 7 6 6 7 8 10 8 7 7 7 9 12Illinois 87 96 99 102 105 109 110 109 113 133 148 158 172 180 197Indiana 38 41 40 46 47 51 62 64 72 77 82 93 93 96 98Iowa 15 18 19 23 25 29 41 42 43 47 49 51 55 57 58Kansas 18 20 22 24 25 30 36 38 41 42 40 42 43 44 45Kentucky 28 32 32 35 36 40 45 48 49 50 51 57 65 67 72Louisiana 72 75 76 86 86 95 96 101 118 126 132 135 134 142 153Maine 6 6 6 6 7 8 9 9 13 13 13 15 18 19 19Maryland 53 57 61 63 72 73 89 92 103 106 106 115 116 115 110Massachusetts 39 46 49 51 55 61 64 66 68 66 70 73 75 77 81Michigan 54 60 65 73 81 84 92 105 107 111 118 125 139 145 150Minnesota 34 37 44 46 55 57 68 68 67 75 69 74 72 75 82Mississippi 33 39 44 47 48 50 52 56 59 64 65 66 67 68 68Missouri 52 54 59 60 64 72 77 89 98 104 102 108 111 113 119Montana 7 7 7 9 12 13 13 14 16 14 15 15 15 15 13Nebraska 12 12 14 14 14 17 18 20 21 24 25 31 36 34 35Nevada 6 7 7 6 7 8 10 12 14 17 19 22 22 25 25New Hampshire 6 6 6 6 6 6 9 9 10 10 10 11 10 10 12New Jersey 37 41 41 47 63 70 76 77 85 91 93 101 108 116 116New Mexico 19 19 20 20 25 27 27 29 28 28 30 30 31 32 33New York 116 125 124 133 142 151 164 186 204 220 223 239 239 245 249North Carolina 62 66 70 81 88 91 95 98 107 110 118 130 138 145 149North Dakota 10 11 11 11 12 13 14 14 14 13 13 14 14 14 14Ohio 53 57 65 71 86 104 123 135 141 152 160 173 186 193 202Oklahoma 34 41 46 49 52 54 57 58 67 61 58 62 62 62 67Oregon 16 18 23 25 31 32 33 42 43 44 43 46 45 45 47Pennsylvania 102 106 119 126 139 150 166 180 193 209 223 231 232 232 243Rhode Island 6 8 10 10 10 10 10 11 13 13 13 14 14 17 18South Carolina 45 47 50 53 56 62 66 66 72 77 82 86 92 93 100South Dakota 8 7 8 10 14 16 17 18 19 21 21 22 22 23 23Tennessee 64 67 73 74 78 82 92 108 113 111 116 127 130 128 127Texas 152 161 176 201 228 235 250 260 281 297 309 324 341 366 411Utah 16 16 16 16 16 16 15 19 21 21 23 27 25 24 25Vermont 2 2 2 2 2 3 4 4 4 6 6 6 6 6 6Virginia 72 78 84 91 95 100 107 109 116 122 125 126 131 133 137Washington 24 25 29 31 33 34 38 41 41 43 49 53 50 54 58West Virginia 15 15 17 18 18 21 20 23 22 23 22 23 22 23 25Wisconsin 34 39 44 45 50 53 56 63 71 79 82 90 98 102 111Wyoming 2 2 3 3 5 6 6 7 10 9 9 9 9 9 9
American Samoa 1 1 1 1 1 1 1 1 1 1 1 1 1 1 1Guam 1 1 2 2 2 3 3 3 3 3 3 3 3 3 3Northern Marianas 1 1 1 1 1 1 1 1 1 1 0 0 0 0 0Puerto Rico 18 23 26 26 28 29 31 31 31 32 34 42 42 41 38Virgin Islands 1 1 1 1 2 2 2 2 2 2 2 2 3 3 3
All 2,160 2,304 2,469 2,637 2,888 3,095 3,355 3,587 3,843 4,023 4,184 4,431 4,588 4,730 4,935
Table J.4Dialysis & transplant facilities: by state & territory

301J
2007 USRDS Annual Data ReportTable J.5Dialysis & transplant facilities: by ESRD network
1991 1992 1993 1994 1995 1996 1997 1998 1999 2000 2001 2002 2003 2004 20051 CT, MA, ME, NH, RI, VT 79 88 94 98 104 111 119 122 141 142 145 151 155 161 1682 NY 116 125 124 133 142 151 164 186 204 220 223 239 239 245 2503 NJ, PR , VI 56 65 68 74 93 101 109 110 118 125 129 145 153 160 1574 DE, PA 108 112 126 133 147 158 174 190 204 221 236 246 247 250 2605 MD, DC, VA, WV 161 171 183 193 208 217 239 247 264 273 276 287 293 293 2956 NC, SC, GA 191 201 217 234 259 279 301 315 344 369 399 432 449 460 4867 FL 146 157 167 177 185 201 216 228 248 253 262 264 269 279 2888 AL, MS, TN 139 152 166 173 192 208 224 257 268 270 280 295 304 307 3069 IN, KY, OH 119 130 137 152 169 195 230 247 262 279 293 323 345 355 37210 IL 87 96 99 102 105 109 110 109 113 133 148 157 171 179 19611 MI, MN, ND, SD, WI 140 154 172 185 212 223 247 268 278 299 303 325 345 359 38012 IA, KS, MO, NE 97 103 114 121 128 148 172 189 203 217 216 233 246 249 25813 AR, LA, OK 142 153 160 173 179 191 199 211 243 245 254 261 261 268 28514 TX 152 161 176 201 228 235 250 260 281 297 309 324 341 366 41015 AZ, CO, NV, NM, UT, WY 107 112 121 122 139 150 162 176 187 193 207 221 223 230 24316 AK, ID, MT, OR, WA 56 59 68 74 84 87 93 107 112 111 116 123 119 127 13417 N. CA, HI , Guam, AS 106 107 112 119 131 136 139 145 148 149 154 162 168 176 18118 S. CA 158 158 165 173 183 195 207 220 225 227 235 245 263 268 273
All 2,160 2,304 2,469 2,637 2,888 3,095 3,355 3,587 3,843 4,023 4,185 4,433 4,591 4,732 4,942
Table J.6Dialysis & transplant facilities: by certification type
1991 1992 1993 1994 1995 1996 1997 1998 1999 2000 2001 2002 2003 2004 2005Freestanding for-profit 1,173 1,281 1,431 1,561 1,775 1,979 2,226 2,523 2,790 2,949 3,124 3,148 3,272 3,408 3,564Freestanding non-profit 214 230 244 264 283 282 277 243 244 258 265 370 392 396 395Unknown profit status 0 0 0 0 0 0 0 0 0 0 0 32 37 27 34Hospital center 333 348 341 340 337 330 328 312 304 290 267 329 346 345 361Hospital facility 209 213 216 235 255 265 281 271 259 280 287 313 306 307 315Transplant center only 65 66 67 73 76 82 86 88 98 96 104 110 108 116 123Transplant & dialysis center 165 164 169 164 162 157 156 150 148 148 134 129 129 128 129Other 1 2 1 0 0 0 1 0 0 2 4 2 1 5 21
All 2,160 2,304 2,469 2,637 2,888 3,095 3,355 3,587 3,843 4,023 4,185 4,433 4,591 4,732 4,942
Table J.7Dialysis & transplant facilities: by service typeby ownership type #
1991 1992 1993 1994 1995 1996 1997 1998 1999 2000 2001 2002 2003 2004 2005Short stay hospitals 626 644 640 644 646 632 623 604 604 585 570 601 588 578 609Long stay hospitals 3 1 1 2 3 3 3 3 3 3 3 3 3 3 3Hospital-based chronic renal care facilities 0 0 0 0 2 0 1 1 1 2 1 1 0 0 3Renal disease treatment center (hospital satellites) 120 123 126 142 156 176 205 221 217 226 226 236 229 229 230Children's hospitals 24 25 28 28 30 30 30 30 30 31 30 31 33 32 34Non-hospital renal disease treatment centers 1,386 1,511 1,674 1,821 2,050 2,253 2,492 2,727 2,987 3,175 3,351 3,555 3,731 3,878 4,043Hospital-based special purpose renal dial. facilities 0 0 0 0 0 0 0 0 0 1 3 1 0 0 0Independent special purpose renal dialysis facilities 0 0 0 0 0 0 0 0 0 0 0 0 0 0 7Unknown
1 0 0 0 1 1 1 1 1 0 1 5 7 12 13All 2,160 2,304 2,469 2,637 2,888 3,095 3,355 3,587 3,843 4,023 4,185 4,433 4,591 4,732 4,942
Table J.5Dialysis & transplant facilities: by ESRD network
Table J.6Dialysis & transplant facilities: by certification type
Table J.7Dialysis & transplant facilities: by service type
provider characteristics
302J
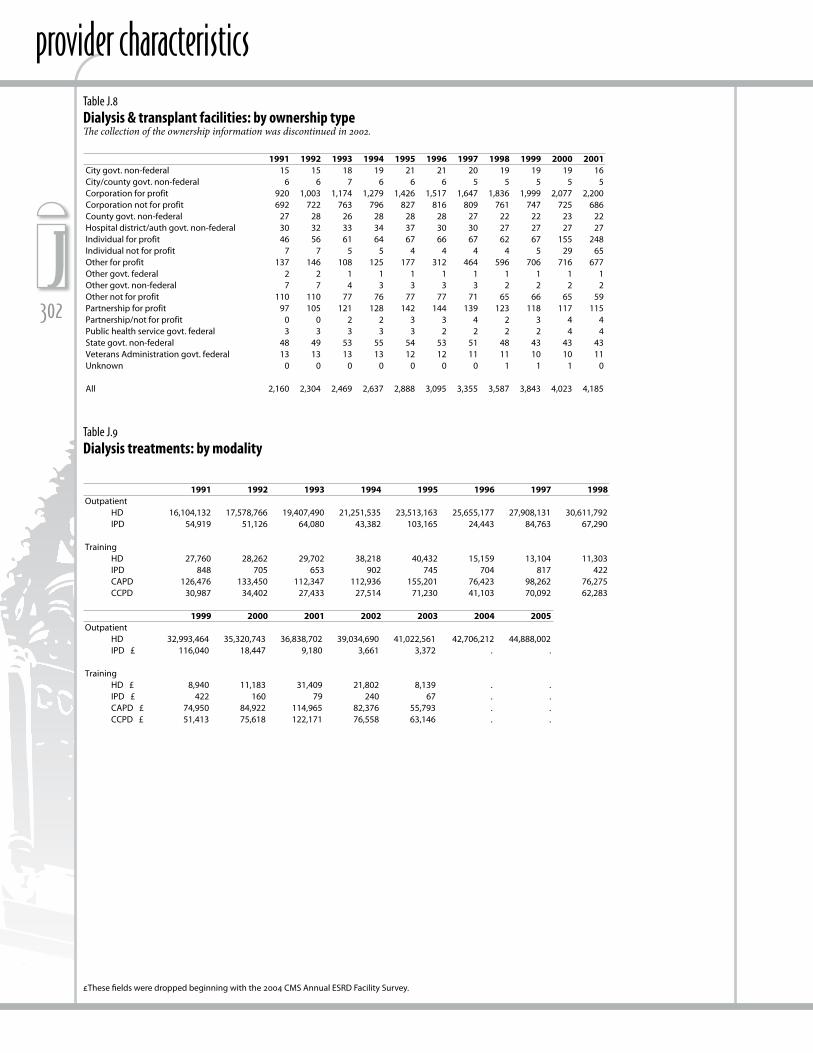
£These fields were dropped beginning with the 2004 CMS Annual ESRD Facility Survey.
Table J.8Dialysis & transplant facilities: by ownership typeThis clasification was discontinued after 2002
1991 1992 1993 1994 1995 1996 1997 1998 1999 2000 2001City govt. non-federal 15 15 18 19 21 21 20 19 19 19 16City/county govt. non-federal 6 6 7 6 6 6 5 5 5 5 5Corporation for profit 920 1,003 1,174 1,279 1,426 1,517 1,647 1,836 1,999 2,077 2,200Corporation not for profit 692 722 763 796 827 816 809 761 747 725 686County govt. non-federal 27 28 26 28 28 28 27 22 22 23 22Hospital district/auth govt. non-federal 30 32 33 34 37 30 30 27 27 27 27Individual for profit 46 56 61 64 67 66 67 62 67 155 248Individual not for profit 7 7 5 5 4 4 4 4 5 29 65Other for profit 137 146 108 125 177 312 464 596 706 716 677Other govt. federal 2 2 1 1 1 1 1 1 1 1 1Other govt. non-federal 7 7 4 3 3 3 3 2 2 2 2Other not for profit 110 110 77 76 77 77 71 65 66 65 59Partnership for profit 97 105 121 128 142 144 139 123 118 117 115Partnership/not for profit 0 0 2 2 3 3 4 2 3 4 4Public health service govt. federal 3 3 3 3 3 2 2 2 2 4 4State govt. non-federal 48 49 53 55 54 53 51 48 43 43 43Veterans Administration govt. federal 13 13 13 13 12 12 11 11 10 10 11Unknown 0 0 0 0 0 0 0 1 1 1 0
All 2,160 2,304 2,469 2,637 2,888 3,095 3,355 3,587 3,843 4,023 4,185
Table J.9Dialysis treatments: by modality
1991 1992 1993 1994 1995 1996 1997 1998Outpatient
HD 16,104,132 17,578,766 19,407,490 21,251,535 23,513,163 25,655,177 27,908,131 30,611,792IPD 54,919 51,126 64,080 43,382 103,165 24,443 84,763 67,290
TrainingHD 27,760 28,262 29,702 38,218 40,432 15,159 13,104 11,303IPD 848 705 653 902 745 704 817 422CAPD 126,476 133,450 112,347 112,936 155,201 76,423 98,262 76,275CCPD 30,987 34,402 27,433 27,514 71,230 41,103 70,092 62,283
1999 2000 2001 2002 2003 2004 2005Outpatient
HD 32,993,464 35,320,743 36,838,702 39,034,690 41,022,561 42,706,212 44,888,002IPD £ 116,040 18,447 9,180 3,661 3,372 . .
TrainingHD £ 8,940 11,183 31,409 21,802 8,139 . .IPD £ 422 160 79 240 67 . .CAPD £ 74,950 84,922 114,965 82,376 55,793 . .CCPD £ 51,413 75,618 122,171 76,558 63,146 . .
Table J.8Dialysis & transplant facilities: by ownership typeThe collection of the ownership information was discontinued in 2002.
Table J.9Dialysis treatments: by modality
303J
2007 USRDS Annual Data Report
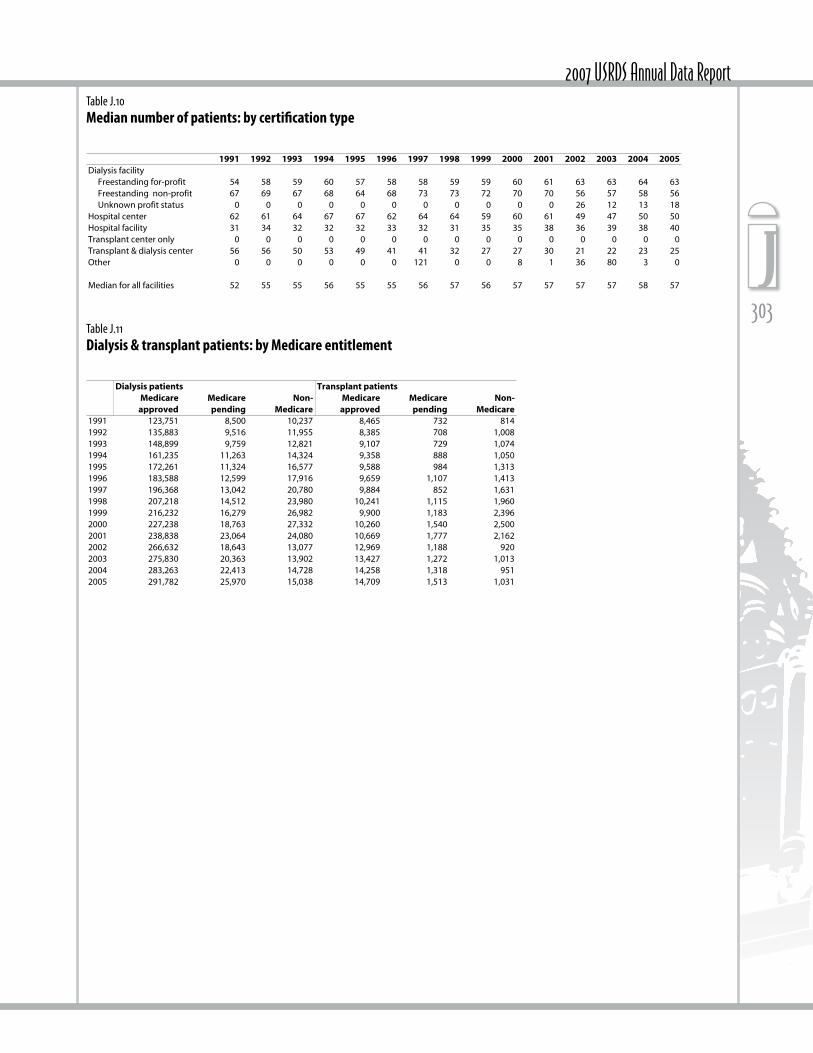
Table J.11Dialysis & transplant patients: by Medicare entitlement
Dialysis patients Transplant patients Medicare Medicare Non- Medicare Medicare Non- approved pending Medicare approved pending Medicare
1991 123,751 8,500 10,237 8,465 732 8141992 135,883 9,516 11,955 8,385 708 1,0081993 148,899 9,759 12,821 9,107 729 1,0741994 161,235 11,263 14,324 9,358 888 1,0501995 172,261 11,324 16,577 9,588 984 1,3131996 183,588 12,599 17,916 9,659 1,107 1,4131997 196,368 13,042 20,780 9,884 852 1,6311998 207,218 14,512 23,980 10,241 1,115 1,9601999 216,232 16,279 26,982 9,900 1,183 2,3962000 227,238 18,763 27,332 10,260 1,540 2,5002001 238,838 23,064 24,080 10,669 1,777 2,1622002 266,632 18,643 13,077 12,969 1,188 9202003 275,830 20,363 13,902 13,427 1,272 1,0132004 283,263 22,413 14,728 14,258 1,318 9512005 291,782 25,970 15,038 14,709 1,513 1,031
Table J.10Median number of patients: by certification type
1991 1992 1993 1994 1995 1996 1997 1998 1999 2000 2001 2002 2003 2004 2005Dialysis facility Freestanding for-profit 54 58 59 60 57 58 58 59 59 60 61 63 63 64 63 Freestanding non-profit 67 69 67 68 64 68 73 73 72 70 70 56 57 58 56 Unknown profit status 0 0 0 0 0 0 0 0 0 0 0 26 12 13 18Hospital center 62 61 64 67 67 62 64 64 59 60 61 49 47 50 50Hospital facility 31 34 32 32 32 33 32 31 35 35 38 36 39 38 40Transplant center only 0 0 0 0 0 0 0 0 0 0 0 0 0 0 0Transplant & dialysis center 56 56 50 53 49 41 41 32 27 27 30 21 22 23 25Other 0 0 0 0 0 0 121 0 0 8 1 36 80 3 0
Median for all facilities 52 55 55 56 55 55 56 57 56 57 57 57 57 58 57
Table J.11Dialysis & transplant patients: by Medicare entitlement
Table J.10Median number of patients: by certification type

provider characteristics
304J
Table J.12Dialysis patients: by state facility & territory
1991 1992 1993 1994 1995 1996 1997 1998 1999 2000 2001 2002 2003 2004 2005Alabama 3,012 3,275 3,553 3,787 4,110 4,541 4,946 5,157 5,378 5,695 5,959 6,072 6,297 6,443 6,591Alaska 89 105 96 124 134 151 184 185 191 205 230 229 264 298 288Arizona 2,186 2,559 2,881 3,114 3,350 3,570 3,902 4,219 4,564 4,859 5,105 5,315 5,619 5,837 6,143Arkansas 1,170 1,222 1,364 1,603 1,771 1,887 2,069 2,191 2,297 2,374 2,504 2,554 2,584 2,703 2,670California 16,416 17,904 19,325 21,346 22,729 24,279 25,848 27,698 29,653 31,688 34,034 36,332 38,047 39,663 40,651Colorado 1,237 1,387 1,531 1,690 1,721 1,852 1,973 2,187 2,317 2,456 2,532 2,663 2,781 2,980 3,106Connecticut 1,748 1,924 2,064 2,171 2,288 2,402 2,570 2,653 2,847 2,992 3,030 3,133 3,184 3,161 3,237Delaware 451 538 582 601 647 678 686 707 745 782 814 895 922 1,011 1,106District of Columbia 1,276 1,372 1,446 1,461 1,474 1,548 1,664 1,680 1,632 1,677 1,645 1,716 1,741 1,619 1,713Florida 7,858 8,737 9,757 10,662 11,274 12,075 12,988 13,775 14,858 15,726 16,512 17,119 17,961 18,588 19,135Georgia 4,690 5,314 5,813 6,582 7,157 7,756 8,353 8,983 9,510 10,156 10,756 11,339 11,870 12,208 12,933Hawaii 834 894 1,024 1,184 1,247 1,320 1,444 1,513 1,561 1,701 1,794 1,870 1,970 2,094 2,227Idaho 247 264 302 353 361 393 450 470 520 542 605 629 632 625 715Illinois 6,588 7,099 7,842 8,328 8,912 9,391 10,105 10,684 11,064 11,782 11,944 12,719 13,091 13,332 14,030Indiana 2,908 3,275 3,593 3,817 4,071 4,304 4,697 5,061 5,318 5,586 5,810 6,035 6,162 6,301 6,551Iowa 1,001 1,181 1,214 1,302 1,350 1,472 1,580 1,679 1,839 1,916 2,044 2,065 2,185 2,223 2,300Kansas 1,012 1,157 1,178 1,275 1,356 1,419 1,623 1,704 1,821 1,922 1,968 2,047 2,082 2,103 2,235Kentucky 1,599 1,797 1,924 2,042 2,179 2,282 2,460 2,747 2,848 3,140 3,254 3,328 3,599 3,769 4,120Louisiana 3,383 3,772 4,065 4,418 4,746 5,050 5,529 5,982 6,417 6,599 6,827 7,098 7,369 7,402 6,726Maine 317 346 410 461 517 553 630 666 711 740 754 806 870 916 927Maryland 3,172 3,445 3,724 4,174 4,544 4,920 5,376 5,652 5,801 5,877 6,186 6,505 6,870 7,211 7,496Massachusetts 2,705 3,060 3,384 3,645 3,877 4,024 4,253 4,452 4,442 4,508 4,565 4,698 4,783 4,880 4,981Michigan 4,907 5,405 5,963 6,485 6,982 7,663 8,015 8,613 8,893 9,223 9,740 10,080 10,552 10,996 11,595Minnesota 1,715 1,852 2,030 2,160 2,198 2,264 2,395 2,552 2,626 2,662 2,816 2,977 3,011 3,156 3,323Mississippi 2,072 2,286 2,533 2,824 3,019 3,298 3,553 3,786 3,993 4,154 4,373 4,570 4,712 4,863 5,083Missouri 2,829 3,104 3,428 3,621 3,872 4,227 4,504 4,901 5,230 5,447 5,725 5,904 6,032 6,134 6,410Montana 306 329 352 366 396 396 429 447 517 523 564 587 602 608 622Nebraska 619 677 776 810 832 887 973 1,071 1,134 1,159 1,269 1,357 1,170 1,334 1,413Nevada 508 560 610 693 777 893 960 1,062 1,200 1,272 1,399 1,528 1,688 1,874 1,996New Hampshire 357 377 402 421 457 451 493 531 604 648 682 732 751 732 758New Jersey 5,043 5,511 5,947 6,364 6,837 7,148 7,571 8,088 8,468 8,810 8,969 9,338 9,597 9,729 10,018New Mexico 902 1,012 1,109 1,186 1,319 1,429 1,589 1,660 1,770 1,947 2,047 2,093 2,189 2,347 2,375New York 11,541 12,655 13,653 14,579 15,359 16,148 17,131 18,228 19,391 20,407 20,749 21,438 22,040 22,357 22,714North Carolina 4,466 5,173 5,748 6,330 6,790 7,393 7,993 8,657 9,061 9,611 10,154 10,679 11,012 11,451 12,043North Dakota 260 318 326 344 370 376 406 408 420 422 462 506 514 542 590Ohio 5,340 5,850 6,296 7,032 7,586 8,231 8,994 9,614 9,994 10,989 11,668 11,797 12,445 12,808 13,352Oklahoma 1,335 1,439 1,635 1,783 1,925 2,072 2,313 2,488 2,609 2,782 2,860 2,992 3,177 3,368 3,475Oregon 1,187 1,253 1,355 1,464 1,583 1,656 1,740 1,857 1,905 2,000 2,130 2,232 2,349 2,471 2,541Pennsylvania 7,449 7,901 8,353 9,002 9,633 10,161 10,911 11,543 11,979 12,383 12,754 12,838 12,994 13,169 13,514Rhode Island 600 608 678 739 750 783 788 881 886 898 889 894 903 913 908South Carolina 2,600 2,880 3,231 3,584 3,901 4,180 4,515 4,802 5,121 5,289 5,520 5,743 6,101 6,437 6,708South Dakota 211 222 248 326 449 536 582 588 627 647 651 661 688 693 696Tennessee 3,119 3,427 3,612 4,057 4,443 4,696 5,020 5,355 5,728 5,989 6,196 6,406 6,561 6,724 6,988Texas 10,334 11,608 12,695 13,880 15,082 16,477 17,869 19,155 20,612 22,053 23,359 24,689 26,099 27,466 29,388Utah 432 465 535 581 620 634 647 731 787 863 937 960 1,010 1,027 1,189Vermont 127 127 121 134 153 165 182 221 213 241 266 272 288 277 289Virginia 3,690 4,367 4,805 5,182 5,593 5,996 6,571 7,025 7,372 7,524 7,873 8,319 8,474 8,658 8,897Washington 1,909 2,052 2,215 2,447 2,685 2,788 2,977 3,155 3,377 3,556 3,792 4,006 4,171 4,388 4,707West Virginia 797 838 929 994 1,080 1,180 1,249 1,330 1,362 1,476 1,562 1,549 1,613 1,653 1,703Wisconsin 1,793 2,016 2,200 2,412 2,590 2,762 2,940 3,171 3,370 3,469 3,627 3,806 4,087 4,354 4,605Wyoming 53 47 48 63 97 114 136 146 181 205 210 216 229 229 237
American Samoa 28 31 35 39 44 51 47 41 54 63 69 73 76 80 73Guam 83 99 121 131 153 170 205 228 259 262 287 314 319 309 308Northern Marianas 20 26 30 32 40 47 53 68 77 89 0 0 0 0 0Puerto Rico 1,926 2,174 2,349 2,575 2,657 2,875 3,005 3,146 3,207 3,236 3,300 3,366 3,484 3,587 3,700Virgin Islands 31 38 39 42 75 89 104 116 132 111 122 136 135 154 157
All 142,488 157,354 171,479 186,822 200,162 214,103 230,190 245,710 259,493 273,333 285,893 298,225 309,956 320,255 332,256
Table J.12Dialysis patients: by state facility & territory
305J
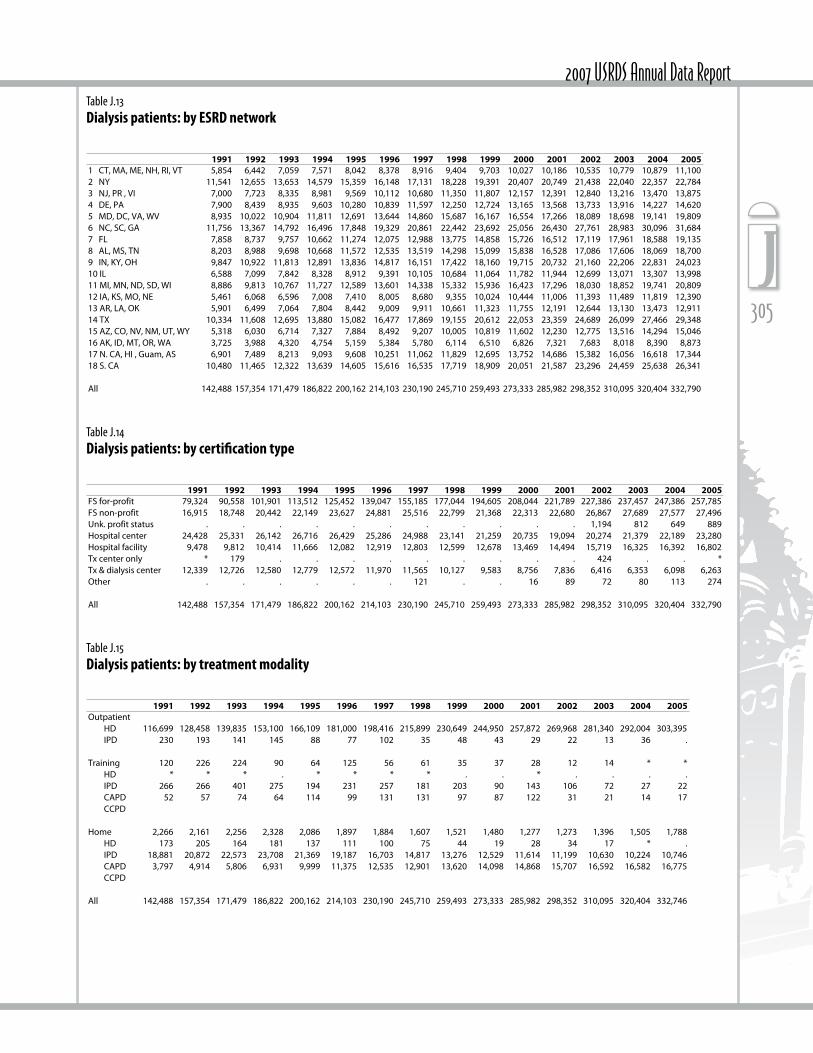
2007 USRDS Annual Data ReportTable J.13Dialysis patients: by ESRD network
1991 1992 1993 1994 1995 1996 1997 1998 1999 2000 2001 2002 2003 2004 20051 CT, MA, ME, NH, RI, VT 5,854 6,442 7,059 7,571 8,042 8,378 8,916 9,404 9,703 10,027 10,186 10,535 10,779 10,879 11,1002 NY 11,541 12,655 13,653 14,579 15,359 16,148 17,131 18,228 19,391 20,407 20,749 21,438 22,040 22,357 22,7843 NJ, PR , VI 7,000 7,723 8,335 8,981 9,569 10,112 10,680 11,350 11,807 12,157 12,391 12,840 13,216 13,470 13,8754 DE, PA 7,900 8,439 8,935 9,603 10,280 10,839 11,597 12,250 12,724 13,165 13,568 13,733 13,916 14,227 14,6205 MD, DC, VA, WV 8,935 10,022 10,904 11,811 12,691 13,644 14,860 15,687 16,167 16,554 17,266 18,089 18,698 19,141 19,8096 NC, SC, GA 11,756 13,367 14,792 16,496 17,848 19,329 20,861 22,442 23,692 25,056 26,430 27,761 28,983 30,096 31,6847 FL 7,858 8,737 9,757 10,662 11,274 12,075 12,988 13,775 14,858 15,726 16,512 17,119 17,961 18,588 19,1358 AL, MS, TN 8,203 8,988 9,698 10,668 11,572 12,535 13,519 14,298 15,099 15,838 16,528 17,086 17,606 18,069 18,7009 IN, KY, OH 9,847 10,922 11,813 12,891 13,836 14,817 16,151 17,422 18,160 19,715 20,732 21,160 22,206 22,831 24,02310 IL 6,588 7,099 7,842 8,328 8,912 9,391 10,105 10,684 11,064 11,782 11,944 12,699 13,071 13,307 13,99811 MI, MN, ND, SD, WI 8,886 9,813 10,767 11,727 12,589 13,601 14,338 15,332 15,936 16,423 17,296 18,030 18,852 19,741 20,80912 IA, KS, MO, NE 5,461 6,068 6,596 7,008 7,410 8,005 8,680 9,355 10,024 10,444 11,006 11,393 11,489 11,819 12,39013 AR, LA, OK 5,901 6,499 7,064 7,804 8,442 9,009 9,911 10,661 11,323 11,755 12,191 12,644 13,130 13,473 12,91114 TX 10,334 11,608 12,695 13,880 15,082 16,477 17,869 19,155 20,612 22,053 23,359 24,689 26,099 27,466 29,34815 AZ, CO, NV, NM, UT, WY 5,318 6,030 6,714 7,327 7,884 8,492 9,207 10,005 10,819 11,602 12,230 12,775 13,516 14,294 15,04616 AK, ID, MT, OR, WA 3,725 3,988 4,320 4,754 5,159 5,384 5,780 6,114 6,510 6,826 7,321 7,683 8,018 8,390 8,87317 N. CA, HI , Guam, AS 6,901 7,489 8,213 9,093 9,608 10,251 11,062 11,829 12,695 13,752 14,686 15,382 16,056 16,618 17,34418 S. CA 10,480 11,465 12,322 13,639 14,605 15,616 16,535 17,719 18,909 20,051 21,587 23,296 24,459 25,638 26,341
All 142,488 157,354 171,479 186,822 200,162 214,103 230,190 245,710 259,493 273,333 285,982 298,352 310,095 320,404 332,790
Table J.14Dialysis patients: by certification type
1991 1992 1993 1994 1995 1996 1997 1998 1999 2000 2001 2002 2003 2004 2005FS for-profit 79,324 90,558 101,901 113,512 125,452 139,047 155,185 177,044 194,605 208,044 221,789 227,386 237,457 247,386 257,785FS non-profit 16,915 18,748 20,442 22,149 23,627 24,881 25,516 22,799 21,368 22,313 22,680 26,867 27,689 27,577 27,496Unk. profit status . . . . . . . . . . . 1,194 812 649 889Hospital center 24,428 25,331 26,142 26,716 26,429 25,286 24,988 23,141 21,259 20,735 19,094 20,274 21,379 22,189 23,280Hospital facility 9,478 9,812 10,414 11,666 12,082 12,919 12,803 12,599 12,678 13,469 14,494 15,719 16,325 16,392 16,802Tx center only * 179 . . . . . . . . . 424 . . *Tx & dialysis center 12,339 12,726 12,580 12,779 12,572 11,970 11,565 10,127 9,583 8,756 7,836 6,416 6,353 6,098 6,263Other . . . . . . 121 . . 16 89 72 80 113 274
All 142,488 157,354 171,479 186,822 200,162 214,103 230,190 245,710 259,493 273,333 285,982 298,352 310,095 320,404 332,790
Table J.15Dialysis patients: by treatment modality
1991 1992 1993 1994 1995 1996 1997 1998 1999 2000 2001 2002 2003 2004 2005Outpatient
HD 116,699 128,458 139,835 153,100 166,109 181,000 198,416 215,899 230,649 244,950 257,872 269,968 281,340 292,004 303,395IPD 230 193 141 145 88 77 102 35 48 43 29 22 13 36 .
Training 120 226 224 90 64 125 56 61 35 37 28 12 14 * *HD * * * . * * * * . . * . . . .IPD 266 266 401 275 194 231 257 181 203 90 143 106 72 27 22CAPD 52 57 74 64 114 99 131 131 97 87 122 31 21 14 17CCPD
Home 2,266 2,161 2,256 2,328 2,086 1,897 1,884 1,607 1,521 1,480 1,277 1,273 1,396 1,505 1,788HD 173 205 164 181 137 111 100 75 44 19 28 34 17 * .IPD 18,881 20,872 22,573 23,708 21,369 19,187 16,703 14,817 13,276 12,529 11,614 11,199 10,630 10,224 10,746CAPD 3,797 4,914 5,806 6,931 9,999 11,375 12,535 12,901 13,620 14,098 14,868 15,707 16,592 16,582 16,775CCPD
All 142,488 157,354 171,479 186,822 200,162 214,103 230,190 245,710 259,493 273,333 285,982 298,352 310,095 320,404 332,746
Table J.13Dialysis patients: by ESRD network
Table J.14Dialysis patients: by certification type
Table J.15Dialysis patients: by treatment modality

provider characteristics
306J
± These fields were dropped beginning with the 2002 CMS Annual ESRD Facility Survey.£ These fields were dropped beginning with the 2004 CMS Annual ESRD Facility Survey.^ This field began with the 2004 CMS Annual ESRD Facility Survey.
Table J.16Patient & treatment counts: by detailed facility survey fieldby ownership type
1991 1992 1993 1994 1995 1996 1997 199801 Beginning in-unit 106,959 117,491 129,033 140,626 153,558 166,518 181,495 198,99302 Beginning home 22,747 25,289 28,492 30,910 33,091 33,456 32,684 31,18803 Beginning total 129,706 142,780 157,525 171,536 186,649 199,974 214,179 230,18104A In-unit - started for first time 44,515 49,604 52,699 57,407 59,077 64,366 70,884 76,27204B Home - started for first time 8,919 9,202 9,883 10,127 10,071 9,683 9,100 8,19405A In-unit - restarted 727 789 880 968 1,054 1,060 1,134 1,19105B Home - restarted 125 106 104 135 163 144 165 15606A In-Unit - transferred in 22,186 24,511 27,925 30,886 35,407 38,013 42,450 46,74606B Home - transferred in 3,242 4,187 5,404 6,059 7,139 6,639 6,772 6,60407A In-unit - returned after transplant 2,194 2,148 2,437 2,450 2,557 2,615 2,762 3,06007B Home - returned after transplant 437 464 489 502 472 423 428 38608A In-unit - deaths 26,371 29,859 32,685 34,699 37,467 41,039 44,687 49,88608B Home - deaths 4,793 5,541 6,365 6,958 7,441 7,276 7,042 6,42309A In-unit - recovered kidney function 1,696 1,774 1,962 2,260 2,409 2,464 2,721 2,84109B Home - recovered kidney function 242 261 279 302 341 284 280 19610A In-unit - received transplant 6,197 6,286 6,628 6,776 7,401 7,604 8,030 8,95010B Home - received transplant 2,412 2,442 2,785 2,958 2,950 2,957 2,803 2,75711A In-unit - transfer to other dialysis unit 22,517 24,732 28,351 31,469 34,607 37,836 42,209 46,59911B Home - transfer to other dialysis unit 3,263 3,802 5,034 5,783 7,013 6,739 7,079 6,98312A In-unit - discontinued dialysis 1,500 1,293 1,362 1,525 2,115 1,982 2,177 1,86612B Home - discontinued dialysis 218 148 186 191 291 302 277 19713A In-unit - other (lost-to-followup) 309 259 205 285 336 274 313 33713B Home - other (lost-to-followup) 45 40 25 42 56 57 66 4514In-unit patient dialysis - HD 116,699 128,458 139,835 153,100 166,109 181,000 198,416 215,89915 In-unit patient dialysis - IPD 230 193 141 145 88 77 102 3516 Patient self-dialysis training - HD 120 226 224 90 64 125 56 6117 Patient self-dialysis training - IPD * * * . * * * *18 Patient self-dialysis training - CAPD 266 266 401 275 194 231 257 18119 Patient self-dialysis training - CCPD 52 57 74 64 114 99 131 13120 Total in-unit patients, sum (14-19) 117,371 129,202 140,680 153,674 166,571 181,533 198,968 216,31021 Home patient dialysis - hemodialysis 2,266 2,161 2,256 2,328 2,086 1,897 1,884 1,60722 Home patient dialysis - IPD 173 205 164 181 137 111 100 7523 Home patient dialysis - CAPD 18,881 20,872 22,573 23,708 21,369 19,187 16,703 14,81724 Home patient dialysis - CCPD 3,797 4,914 5,806 6,931 9,999 11,375 12,535 12,90125 Total home patients, sum (21-24) 25,117 28,152 30,799 33,148 33,591 32,570 31,222 29,40026 Total patients, sum 20 & 25 142,488 157,354 171,479 186,822 200,162 214,103 230,190 245,71027 Currently enrolled in Medicare 123,751 135,883 148,899 161,235 172,261 183,588 196,368 207,21828 Medicare application pending 8,500 9,516 9,759 11,263 11,324 12,599 13,042 14,51229 Non-Medicare 10,237 11,955 12,821 14,324 16,577 17,916 20,780 23,980 HD completed training £ 681 854 651 587 524 530 422 418 IPD completed training £ 138 99 77 137 114 104 90 29 CAPD completed training £ 11,753 12,271 13,428 14,179 12,550 12,406 10,493 9,350 CCPD completed training £ 2,680 3,394 3,842 4,408 7,221 7,338 7,439 7,116 Transient patients treated £ 34,905 37,978 40,136 43,013 47,411 55,734 61,881 65,422 Transient patient treatments £ 146,016 166,669 181,041 218,517 228,668 269,015 295,798 298,62736 HD in-unit treatments 16,104,132 17,578,766 19,407,490 21,251,535 23,513,163 25,655,177 27,908,131 30,611,79237 Number of in-unit trts other than HD ^ . . . . . . . . IPD in-unit treatments £ 54,919 51,126 64,080 43,382 103,165 24,443 84,763 67,290 HD training treatments £ 27,760 28,262 29,702 38,218 40,432 15,159 13,104 11,303 IPD training treatments £ 848 705 653 902 745 704 817 422 CAPD training treatments £ 126,476 133,450 112,347 112,936 155,201 76,423 98,262 76,275 CCPD training treatments £ 30,987 34,402 27,433 27,514 71,230 41,103 70,092 62,28342 Pts tx'ed at this facility 10,011 10,101 10,910 11,296 11,885 12,179 12,367 13,31643 Pts tx'ed & enrolled in Medicare 8,465 8,385 9,107 9,358 9,588 9,659 9,884 10,24144 Pts tx'ed & Medicare app. pending 732 708 729 888 984 1,107 852 1,11545 Pts tx'ed & non-Medicare -US residents 663 860 931 957 1,201 1,227 1,497 1,79646 Pts tx'ed & non-Medicare-other 151 148 143 93 112 186 134 16447 Living-related donor tx performed 2,296 2,391 2,631 2,738 2,992 3,084 3,210 3,45348 Living-unrelated donor tx performed 86 145 197 262 424 619 705 1,06749 Cadaveric donor tx performed 7,644 7,579 8,106 8,312 8,486 8,495 8,512 8,75250 Total transplant performed 10,026 10,115 10,934 11,312 11,902 12,198 12,427 13,27251 Dialysis patients awaiting transplant 17,018 19,970 21,165 24,130 26,539 29,725 32,608 34,84552 Non-dialysis patients awaiting transplant 1,218 1,648 1,809 2,465 2,344 3,014 3,371 3,45953 Cadaver harvest & tx at this facility ± 1,108 1,055 1,072 1,036 967 864 * 5,12854 Cadaver harvest sent to other US facility ± 1,338 1,398 1,593 1,702 1,777 1,724 . .55 Cadaver harvest sent outside US ± * * * * * . . .56 Cadaver harvest & nonviable ± 188 169 213 230 270 347 . .57 Total cadaver harvest at this facility ± 2,636 2,631 2,882 2,975 3,015 2,935 * 5,128
Table J.16Patient & treatment counts: by detailed facility survey field

307J
2007 USRDS Annual Data Report
± These fields were dropped beginning with the 2002 CMS Annual ESRD Facility Survey.£ These fields were dropped beginning with the 2004 CMS Annual ESRD Facility Survey.^ This field began with the 2004 CMS Annual ESRD Facility Survey.
Table J.16Patient & treatment counts: by detby ownership type
01 Beginning in-unit02 Beginning home03 Beginning total04A In-unit - started for first time 04B Home - started for first time 05A In-unit - restarted05B Home - restarted06A In-Unit - transferred in06B Home - transferred in07A In-unit - returned after transplant07B Home - returned after transplant08A In-unit - deaths08B Home - deaths09A In-unit - recovered kidney function09B Home - recovered kidney function10A In-unit - received transplant10B Home - received transplant11A In-unit - transfer to other dialysis unit11B Home - transfer to other dialysis unit12A In-unit - discontinued dialysis12B Home - discontinued dialysis13A In-unit - other (lost-to-followup)13B Home - other (lost-to-followup)14In-unit patient dialysis - HD15 In-unit patient dialysis - IPD16 Patient self-dialysis training - HD17 Patient self-dialysis training - IPD18 Patient self-dialysis training - CAPD19 Patient self-dialysis training - CCPD20 Total in-unit patients, sum (14-19)21 Home patient dialysis - hemodialysis22 Home patient dialysis - IPD23 Home patient dialysis - CAPD24 Home patient dialysis - CCPD25 Total home patients, sum (21-24)26 Total patients, sum 20 & 2527 Currently enrolled in Medicare28 Medicare application pending29 Non-Medicare HD completed training £ IPD completed training £ CAPD completed training £ CCPD completed training £ Transient patients treated £ Transient patient treatments £36 HD in-unit treatments37 Number of in-unit trts other than HD ^ IPD in-unit treatments £ HD training treatments £ IPD training treatments £ CAPD training treatments £ CCPD training treatments £42 Pts tx'ed at this facility43 Pts tx'ed & enrolled in Medicare44 Pts tx'ed & Medicare app. pending 45 Pts tx'ed & non-Medicare -US residents46 Pts tx'ed & non-Medicare-other47 Living-related donor tx performed48 Living-unrelated donor tx performed49 Cadaveric donor tx performed50 Total transplant performed51 Dialysis patients awaiting transplant52 Non-dialysis patients awaiting transplant53 Cadaver harvest & tx at this facility ±54 Cadaver harvest sent to other US facility ± 55 Cadaver harvest sent outside US ±56 Cadaver harvest & nonviable ±57 Total cadaver harvest at this facility ±
1999 2000 2001 2002 2003 2004 2005216,324 231,248 245,072 259,125 271,322 281,661 293,379
29,251 28,576 28,097 28,138 28,322 28,838 28,615245,575 259,824 273,169 287,263 299,644 310,499 321,994
80,953 83,827 87,313 90,278 92,645 93,676 95,6717,876 7,852 7,392 6,420 6,792 7,312 7,3301,323 1,353 1,545 1,687 1,856 2,001 2,315
123 128 120 121 129 141 16449,524 50,853 51,978 57,637 57,333 61,478 66,396
5,961 6,585 6,268 6,613 6,655 6,687 6,9883,274 3,744 4,021 4,361 4,449 4,756 4,868
411 422 477 451 447 417 48955,545 58,090 61,636 65,565 68,531 70,305 71,481
5,868 5,899 5,660 5,441 5,511 5,430 4,8983,137 3,533 3,841 4,195 4,463 4,953 5,441
202 221 279 255 257 258 2689,393 9,763 10,140 10,617 10,875 11,495 11,7822,532 2,610 2,605 2,675 2,675 2,697 2,776
49,649 51,733 52,471 58,646 58,836 62,591 67,8956,283 6,760 6,528 6,927 6,745 6,863 6,5012,280 2,030 2,290 1,475 1,160 1,180 1,360
176 127 130 90 58 64 51416 441 544 547 691 671 879
46 48 177 46 53 56 16230,649 244,950 257,872 269,968 281,340 292,004 303,395
48 43 29 22 13 36 .35 37 28 12 14 * *
. . * . . . .203 90 143 106 72 27 22
97 87 122 31 21 14 17231,032 245,207 258,195 270,139 281,460 292,084 303,465
1,521 1,480 1,277 1,273 1,396 1,505 1,78844 19 28 34 17 9 0
13,276 12,529 11,614 11,199 10,630 10,224 10,74613,620 14,098 14,868 15,707 16,592 16,582 16,77528,461 28,126 27,787 28,213 28,635 28,320 29,325
259,493 273,333 285,982 298,352 310,095 320,404 332,790216,232 227,238 238,838 266,632 275,830 283,263 291,782
16,279 18,763 23,064 18,643 20,363 22,413 25,97026,982 27,332 24,080 13,077 13,902 14,728 15,038
358 309 372 241 448 . .54 17 16 35 * . .
8,519 8,619 8,728 9,140 7,704 . .6,991 7,174 7,633 7,456 8,194 . .
71,436 78,117 76,461 78,770 81,270 . .324,152 290,130 355,086 286,142 281,008 . .
32,993,464 35,320,743 36,838,702 39,034,690 41,022,561 42,706,212 44,888,002. . . . . 160,497 111,484
116,040 18,447 9,180 3,661 3,372 . .8,940 11,183 31,409 21,802 8,139 . .
422 160 79 240 67 . .74,950 84,922 114,965 82,376 55,793 . .51,413 75,618 122,171 76,558 63,146 . .13,479 14,300 14,608 15,077 15,712 16,529 17,260
9,900 10,260 10,669 12,969 13,427 14,258 14,7091,183 1,540 1,777 1,188 1,272 1,318 1,5132,262 2,381 2,042 888 994 938 1,016
134 119 120 32 19 13 153,583 4,052 4,236 4,182 4,262 4,200 3,7431,061 1,375 1,568 1,711 1,982 2,306 2,7378,839 8,884 8,824 9,213 9,494 10,062 10,815
13,483 14,311 14,628 15,106 15,738 16,568 17,29536,803 35,620 40,474 41,921 45,974 62,762 50,906
3,947 5,549 6,782 5,775 6,580 5,984 7,990226 . . . . . .
. . . . . . .
. . . . . . .
. . . . . . .206 . . . . . .
Table J.16 (continued)Patient & treatment counts: by detailed facility survey field
provider characteristics
308J
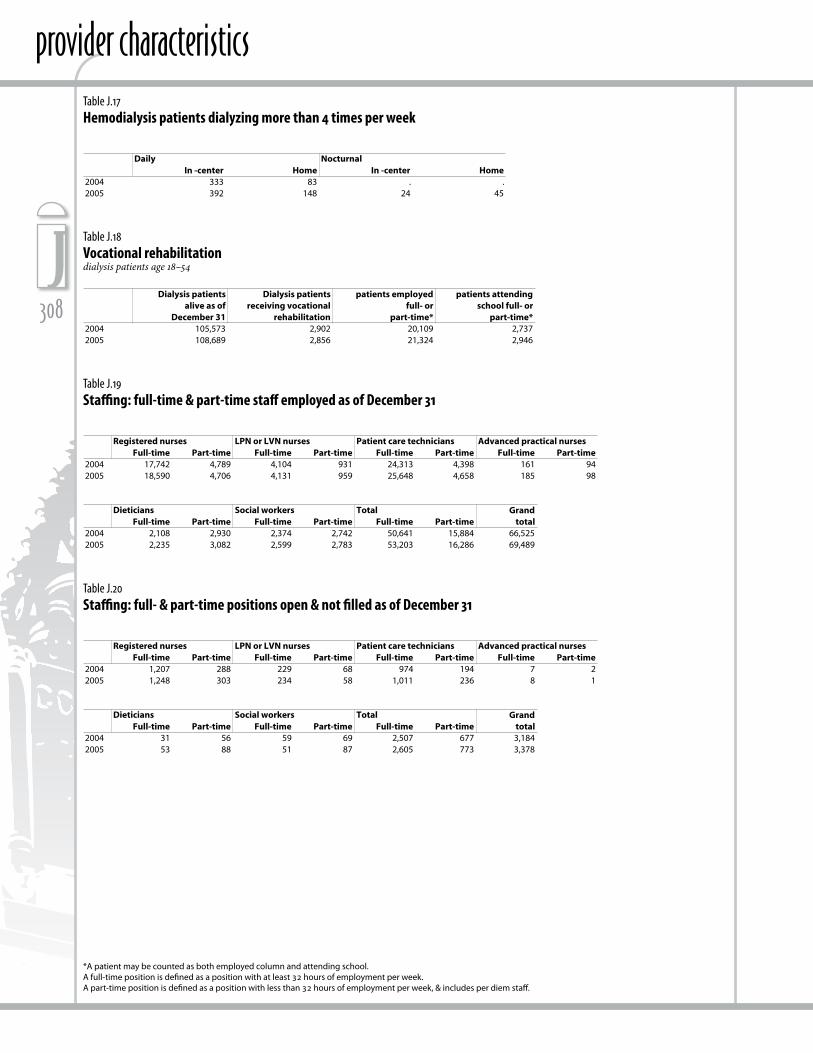
*A patient may be counted as both employed column and attending school.A full-time position is defined as a position with at least 32 hours of employment per week.A part-time position is defined as a position with less than 32 hours of employment per week, & includes per diem staff.
Table J.17Hemodialysis patients dialyzing more than 4 times per week
In -center Home In -center Home2004 333 83 . .2005 392 148 24 45
Daily Nocturnal
Table J.18Vocational rehabilitation, dialysis patients age 18-54
Dialysis patients Dialysis patients patients employed patients attendingalive as of receiving vocational full- or school full- or
December 31 rehabilitation part-time* part-time*2004 105,573 2,902 20,109 2,7372005 108,689 2,856 21,324 2,946
Table J.19Staffing: full-time & part-time staff employed as of December 31
Full-time Part-time Full-time Part-time Full-time Part-time Full-time Part-time2004 17,742 4,789 4,104 931 24,313 4,398 161 942005 18,590 4,706 4,131 959 25,648 4,658 185 98
GrandFull-time Part-time Full-time Part-time Full-time Part-time total
2004 2,108 2,930 2,374 2,742 50,641 15,884 66,5252005 2,235 3,082 2,599 2,783 53,203 16,286 69,489
Advanced practical nurses
TotalDieticians Social workers
Registered nurses LPN or LVN nurses Patient care technicians
Table J.20Staffing: full-time & part-time positions open & not filled as of December 31
Full-time Part-time Full-time Part-time Full-time Part-time Full-time Part-time2004 1,207 288 229 68 974 194 7 22005 1,248 303 234 58 1,011 236 8 1
GrandFull-time Part-time Full-time Part-time Full-time Part-time total
2004 31 56 59 69 2,507 677 3,1842005 53 88 51 87 2,605 773 3,378
Advanced practical nurses
Dieticians Social workers Total
Registered nurses LPN or LVN nurses Patient care technicians
Table J.19Staffing: full-time & part-time staff employed as of December 31
Table J.20Staffing: full- & part-time positions open & not filled as of December 31
Table J.18Vocational rehabilitationdialysis patients age 18–54
Table J.17Hemodialysis patients dialyzing more than 4 times per week