Embed Size (px)
Citation preview

RESEARCH ARTICLE
Proteomic analysis of nasal cells from cystic fibrosis
patients and non-cystic fibrosis control individuals:
Search for novel biomarkers of cystic fibrosis lung disease
Mónica Roxo-Rosa1, 2, Gonçalo da Costa3, Theo M. Luider4, Bob J. Scholte5,Ana V. Coelho3, 6, Margarida D. Amaral1, 2 and Deborah Penque1
1 Centre of Human Genetics, National Institute of Health, Lisbon, Portugal2 Department of Chemistry and Biochemistry, Faculty of Sciences, University of Lisbon, Lisbon, Portugal3 Institute of Chemical and Biological Technology, University Nova of Lisbon, Oeiras, Portugal4 Department of Neurology and Center for Biomics Center, Erasmus University Rotterdam, The Netherlands5 Department of Cell Biology, Erasmus University Rotterdam, Rotterdam, The Netherlands6 Department of Chemistry, University of Évora, Évora, Portugal
Potential biological markers for cystic fibrosis (CF) lung disease were identified by comparativeproteomics profiling of nasal cells from deletion of phenylalanine residue 508 (F508del)-homo-zygous CF patients and non-CF controls. From the non-CF 2-DE gels, 65 spots were identified byMS, and a reference 2-DE map was thus established. The majority of those correspond to ubi-quitously expressed proteins. Consistent with the epithelial origin of this tissue, some of theidentified proteins are epithelial markers (e.g. cytokeratins, palate lung and nasal epitheliumclone protein (PLUNC), and squamous cell carcinoma antigen 1). Comparison of this proteinprofile with the one similarly obtained for CF nasal cells revealed a set of differentially expressedproteins. These included proteins related to chronic inflammation and some others involved inoxidative stress injury. Alterations were also observed in the levels of cytoskeleton proteins, beingprobably implicated with cytoskeleton organization changes described to occur in CF-airways.Lower levels were found for some mitochondrial proteins suggesting an altered mitochondrialmetabolism in CF. Differential expression was also found for two more enzymes that have notbeen previously associated to CF. Further studies will clarify the involvement of such proteins inCF pathophysiology and whether they are targets for CF therapy.
Received: April 27, 2005Revised: October 25, 2005
Accepted: October 30, 2005
Keywords:
Biomarkers / Cystic Fibrosis / Lung disease / Nasal cells
2314 Proteomics 2006, 6, 2314–2325
1 Introduction
Despite recent advances in our understanding of cysticfibrosis (CF) pathophysiology mechanisms, it remainsthe most common lethal, autosomal, recessive, geneticdisease among Caucasians [1]. The gene, which whenmutated is responsible for CF, encodes the CF-trans-membrane conductance regulator (CFTR) protein, acAMP-phosphorylation dependent-regulated chloride(Cl2) channel. CFTR is expressed at the apical mem-brane of epithelial cells lining the airways, pancreaticducts, intestine, biliary tree, sweat duct, and vas deferens
Correspondence: Dr. Mónica Roxo-Rosa, Faculdade de Ciênciasda Universidade de Lisboa, Edifício C8, Laboratório 8.1.75, 1749–016 Lisboa, PortugalE-mail: [email protected]: 1351-21-750-0088
Abbreviations: CF, cystic fibrosis; CFTR, CF-transmembrane con-ductance regulator; DTE, 1,4-dithioerythritol; F508del, deletion ofphenylalanine residue 508; IL, interleukin; MGG, May-Grünwald-Giemsa; NFŒB, nuclear factor kB; PDI A3, protein disulfide iso-merase A3; PLUNC, palate lung and nasal epithelium clone pro-tein; ROS, reactive oxygen species; SCCA1, squamous cell carci-noma antigen 1; %Vol, volume of each spot over the volume of allspots in the gel
DOI 10.1002/pmic.200500273
© 2006 WILEY-VCH Verlag GmbH & Co. KGaA, Weinheim www.proteomics-journal.com

Proteomics 2006, 6, 2314–2325 Clinical Proteomics 2315
[1]. More than 1300 variants have been already reportedto occur in the CFTR gene (http://www.genet.sickkids.on.ca/cftr). The most common severe CF-causing muta-tion, occurring in 70% of CF chromosomes worldwide, isthe deletion of phenylalanine residue 508 (F508del) [1].Due to misfolding, F508del-CFTR is directly sent to ER-associated degradation (ERAD) in the proteasome [2],thus failing to be processed and to reach the cell mem-brane [3].
Although this genetic disorder affects several organsystems, chronic obstructive lung disease is the majorcause of morbidity and mortality among CF patients [4].Indeed, the airways of these individuals are clinicallycharacterized by mucostasis and mucus hypersecretionthat cause small-airway obstruction with mucus plug-ging and air trapping. This is the propitious environ-ment for successive bacterial infections, namely byPseudomonas aeruginosa, resulting in chronic airwayneutrophil-mediated inflammation, bronchiectasis, andultimately, in patient death by lung failure [5]. Untilnow, therapy approaches for CF lung disease have beenlargely symptomatic, namely through antibiotic treat-ment against bacterial lung infection, and also withanti-inflammatory drugs [6]. The finding of novel ther-apeutic strategies that can efficiently overcome thispathology is even more complex as there is no straight-forward correlation between CFTR genotype and CFlung disease severity [7]. Therefore, the identification ofproteins whose expression is consistently affected in CFtissues may be of interest to help in the diagnosis, andperhaps prognosis, of this disorder, by acting as CFbiomarkers.
Since the human nasal epithelium reflects the ionicproprieties of the characteristic CF dysfunction of thelower airways [6], we have used cells from the nasal epi-thelium to identify such CF markers. Moreover, humannasal cells can be easily obtained by a noninvasive proce-dure (i.e. nasal brushing), yielding numerous and well-preserved dissociated cells that are representative of thehuman superficial respiratory mucosa [8].
Thus, we obtained proteome profiles of nasal cellsfrom non-CF individuals through a 2-DE-based proteom-ics approach, and compared them with those of F508del-homozygous CF patients. Proteins found to be con-sistently up- or downregulated in these native cells arepotential biological markers of CF lung disease. Suchproteins may also be proven to be prognosis factors andhelpful in monitoring the evolution of the disease and/orfollowing up the effect of therapies over time. Further-more, assuming that these changes in protein levels cor-respond to those occurring in the lower airways, thesedisease-associated proteins may contribute in furtherstudies to a better understanding of CF pathophysiologyand become potential targets for novel therapeuticapproaches.
2 Materials and methods
2.1 Individuals and samples collection
After informed consent, nasal cells were collected by thepreviously described brushing procedure [8, 9], from sevenF508del-homozygous CF patients (two males, five females,mean age 6 SD: 15.1 6 6.6 years) in the absence of acutephase of respiratory inflammation and eight healthy, non-smoker and non-F508del-carrier volunteers (two males, sixfemales, mean age 6 SD: 28.8 6 5.0 years) without nasaland respiratory infection. All CF patients were underestablished airway treatments, namely nebulized recombi-nant human dornase alpha (rhDNase) (Pulmozyme® inha-lation solution, Roche, Basel, Switzerland), to reduce spu-tum viscoelasticity and Tobramycin (TOBI®, Chiron,Emeryville, CA, USA) to control respiratory infection andexacerbation.
Immediately after brushing, nasal cells were recoveredfrom the brushes and washed twice in 1 mL of Opti-MEMmedium (Invitrogen, Life Technologies, Carlsbad, CA, USA)at room temperature (RT). Before pelleting the cells by cen-trifugation at 3000 rpm for 5 min in a Picofuge (Stratagene,La Jolla, CA, USA), an aliquot of 100 mL of the cellular sus-pension was saved for further May-Grünwald-Giemsa(MGG)-staining and cell examination by conventional lightmicroscopy, as described elsewhere [9]. The pelleted cells,around 16106 to 26106 cells, were then quickly frozen andstored at 2807C until 2-DE analysis.
2.2 2-DE analysis
2-DE was performed as previously described [10]. Just priorto analysis, nasal cells were thawed and lysed in 100 mL oflysis buffer (7 M urea (Merck Diagnostic, Darmstadt, Ger-many), 2 M thiourea (Sigma-Aldrich Company, St. Louis,MO, USA), 2% w/v CHAPS (Sigma-Aldrich), 1% w/v 1,4-dithioerythritol (DTE) (Merck), 2% w/v ampholine 3.5–10.0(Amersham Biosciences, Uppsala, Sweden), supplementedwith a cocktail of protease inhibitors (1 mg/mL leupeptin,2 mg/mL aprotinin, 121 mg/mL benzamidin, 50 mg/mLPefabloc, 3.5 mg/mL E64). After addition of 250 mL of rehy-dration buffer (8 M urea, 2% w/v CHAPS, 10 mM DTE, 2%w/v ampholine 3.5–10.0 and a trace of bromophenol blue),the cell lysates were incubated for 1 h at 357C. Samples werethen clarified by centrifugation at 12 0006g for 5 min andthe supernatants containing the total extracted proteins wereloaded onto 18 cm Immobiline DryStrips with a nonlinearwide-range pH gradient (pH 3–10). After active gel striprehydration (30 V for 12 h at 207C), IEF was run on an IPG-phor IEF system (Amersham Bioscience) for a total of100 kVh, during which the voltage was gradually increasedup to 5000 V for a total of 50 h.
For SDS-PAGE, strips were incubated for 15 min at RT inequilibrating buffer (6 M urea, 50 mM Tris-HCl pH 6.8, 30%v/v glycerol, 2% v/v SDS, 2% w/v DTE) and then for another
© 2006 WILEY-VCH Verlag GmbH & Co. KGaA, Weinheim www.proteomics-journal.com

2316 M. Roxo-Rosa et al. Proteomics 2006, 6, 2314–2325
15 min in blocking buffer (6 M urea, 50 mM Tris-HClpH 6.8, 30% v/v glycerol, 2% v/v SDS, 2.5% w/v iodoacet-amide (Sigma-Aldrich) and a trace of bromophenol blue) toreduce disulfide bonds of the proteins. Strips were finallyapplied onto 7–16% w/v gradient polyacrylamide gels andrun overnight at 2.5 W/gel (Ettan DALTwelve System,Amersham Biosciences).
After electrophoresis protein visualization was carriedout by silver staining, compatible to MS analysis or CBB-staining as previously described (Roxo Rosa, M., Amaral, M.D., Penque, D., The Virtual Repository of Biological Methodsand Reagents for CFTR Expression and Functional Studies(http://central.igc.gulbenkian.pt/cftr/vr/biochemistry.html)Section C. 2004).
2.3 2-DE maps analysis
The digitalized images of the silver-stained 2-DE gels wereobtained using ImageScanner (Amersham Biosciences)and these were analyzed using the ImageMaster™ 2-D Pla-tinum software. In order to standardize the intensities ofsilver staining among spots present in several 2-DE maps,analysis was carried out by taking into account the stand-ardized relative intensity volume of spots (or %Vol, i.e. thevolume of each spot over the volume of all spots in thegel). The presence of mucus in our samples interferedwith the staining of the 2-DE gels; therefore, their analysiswas performed only in the area of the gel for which thespots were always detected, i.e. below ,60 kDa. The differ-ence in expression levels between nasal cells from CFpatients and healthy controls for a given protein was sta-tistically assessed by using the two-sample t-test, for nobservations, where n is the total number of individualsanalyzed (CF 1 non-CF). Differences were considered sta-tistically significant for p , 0.05.
2.4 Sample preparation for MS analysis
2.4.1 CBB-stained gels
Protein spots from the CBB-stained 2-DE gels weredestained with 30% ACN in 0.1 M ammonium hydrogencarbonate (Merck) and washed with Millipore water. The gelpieces were lyophilized by a Speedvac evaporator (Savant,Farmingdale, USA) for 30–60 min, followed by digestionwith 0.4 mg (2U) trypsin (Promega, Madison, WI, USA) in4 ml of 3 mM Tris-HCl (pH 8.8), overnight at RT. The peptidemixture was extracted from the gel plug with 7 mL of a 33%ACN 1 0.1% TCA (TFA) solution.
2.4.2 Silver-stained gels
Protein spots from the silver-stained 2-DE gels weredestained for 20 min in the dark with 200 mL of a 1:1 so-lution of 30 mM potassium hexacyanoferrate(III) and100 mM sodium thiosulphate. Before drying the gel pieces
in a Speedvac evaporator, they were washed with Milliporewater and shrunk in the presence of ACN for 30 min.Trypsin digestion was performed as described previouslyfor CBB-stained gels. Digested peptides present in thesupernatants were cleaned and concentrated using PorousR12 microcolumns (Applied Biosystems, Foster City, CA,USA).
2.5 Protein identification by PMF
2.5.1 CBB-stained gels
Peptide mixture of 0.5 mL was mixed on a MALDI target with0.5 mL of saturated matrix solution consisting of CHCA(Merck, twice crystallized) resuspended in 1 mL of ACN.PMF was assessed by MALDI-TOF-MS analysis, which wasperformed on a Biflex™ III (Bruker Daltonik, Bremen, Ger-many) equipped with a SCOUT 384 XY table. An anchorchipwith 400 mm anchors (Bruker Daltonik) was used to measurethe peptide profiles. Data acquisition was performed on aSUN Ultra using XACQ software, version 5.1. For externalcalibration a standard peptide mixture was used (Sigma-Aldrich).
2.5.2 Silver-stained gels
Digested peptides were eluted with 0.8 mL of 10 mg/mLCHCA, prepared in 70% ACN v/v and 0.1% v/v TFA directlyon top of the MALDI target. Sample peptides were assayedfor PMF in a Voyager-DE™ STR MALDI-TOF mass spec-trometer (Applied Biosystems). The mixture was allowed toair dry in order to promote cocrystallization. Spectra wereacquired using the Voyager Instrument Control Panel Soft-ware, version 5.10. Data Explorer version 4.4 was used forspectra processing; m/z peak evaluation was performed byMoverZ (ProteoMetrics, New York, USA). External calibra-tion was performed using peptide calibration Mix1 (LaserBioLabs, France).
In both cases PeakErazor (Lighthouse Data, Odense,Denmark) was used to filter contaminant m/z peaks and,when possible, to perform internal calibration. Mono-isotopic peptide masses were used to search for homologiesand protein identification with PMF software of MASCOT(http://www.matrixscience.com). Searches were done inMSDB (MS protein sequence DataBase) database (http://csc-fserve.hh.med.ic.ac.uk/msdb.html). A mass accuracy of50–100 ppm was considered for external calibrations andCys carbamidomethylation and Met oxidation as fixed andvariable amino acid modifications, respectively. A taxonomicrestriction to mammalian protein sequences was included.Criteria used to accept the identification were significanthomology scores achieved in MASCOT, and a minimum offour peptides matched, allowing a protein sequence cover-age above 10%.
© 2006 WILEY-VCH Verlag GmbH & Co. KGaA, Weinheim www.proteomics-journal.com

Proteomics 2006, 6, 2314–2325 Clinical Proteomics 2317
2.6 Computational analysis of the biological
association among proteins
The possible biological relationship among the proteins thatwere found to be differentially expressed between CF andnon-CF nasal cells was assessed by using the PathwayAssist™
version 3.0 software.
3 Results
3.1 Validation of nasal cell samples
As previously described [9], the great majority (around 80–95%) of the nasal cells collected by brushing are well-pre-served and dissociated epithelial cells, even when collectedfrom CF patients (data not shown). This can be easilyobserved by MGG staining (Fig. 1A), revealing the presenceof three major cell types according to previously describedclassification criteria [9], namely tall columnar (ciliated andnonciliated) cells, secretory goblet cells, and basal cells.Moreover, in agreement to the previously described evalua-tion of the cellular types recovered by nasal brushing [9], wedid not found any significant difference in the cellular typedistribution between CF and non-CF cell samples, except inthe number of inflammatory cells which are more abundantin CF (,8%) than in non-CF samples (,1–3%) (data notshown).
3.2 Computer-assisted analysis of the 2-DE gels
Total soluble protein extracts of healthy non-CF (n = 8) andF508del-homozygous CF (n = 7) nasal cells were separatedby 2-DE (Figure see Suppl. Material). After silver staining,the digitalized images of the gels were analyzed using a spe-cific Proteomics software. We observed that on average the
Figure 1. Nasal cells collected by brushing. (A) MGG-staining ofnasal cells sample from a F508del-homozygous CF patient. As insamples collected from non-CF controls, the majority of the cellsare epithelial. (B) A thick mucus layer (indicated by a black arrow)can readily be observed in a group of CF tall columnar cells.
number of spots detected per gel on 2-DE gels from CF cells(n = 541) is not significantly different from the numberdetected on 2-DE gels from non-CF (control) nasal cells(n = 591). The different appearance of the 2-DE maps obtainedfor the two groups of individuals under comparison (Fig. 2Avs. B) is explained by the fact that the protein separation of CFnasal cell samples was affected by excess mucus (Fig. 1B).Moreover, this excess mucus makes the collection of cells bybrushing more difficult in CF patients, causing a slightreduction in the number of cells obtained in these samples incomparison to those of non-CF individuals. To overcome thesetechnical problems and to obtain reliable gel-to-gel matchinganalysis, the identity of some of the same matched spots(n = 19) was confirmed by MS in several 2-DE gels.
After this preliminary procedure, computer-assistedanalysis was carried out taking into account the %Vol.Through heuristic clustering analysis, i.e. an artificial intelli-gence-based analysis to automatically classify sets of gels intodifferent classes according to their characteristic spots, the2-DE gels (n = 8 1 7) were automatically (and correctly)separated into two distinct classes. It is important to notethat the referred differences in appearance did not interferewith the heuristic clustering, as long as the preliminary gel-to-gel matching was done. After statistical evaluation of thevariations of %Vol for spots between the two classes of maps,analysis has shown that there are at least 18 spots with sig-nificantly different expression (p , 0.05) levels between CFand non-CF nasal samples. Figure 3 gives an example of thecomputer-assisted analysis for two given proteins, a lessexpressed protein (Fig. 3A) and another expressed at higherlevels (Fig. 3B) in nasal cell 2-DE gels of CF patients versuscontrols.
3.3 Nasal cells proteome profile
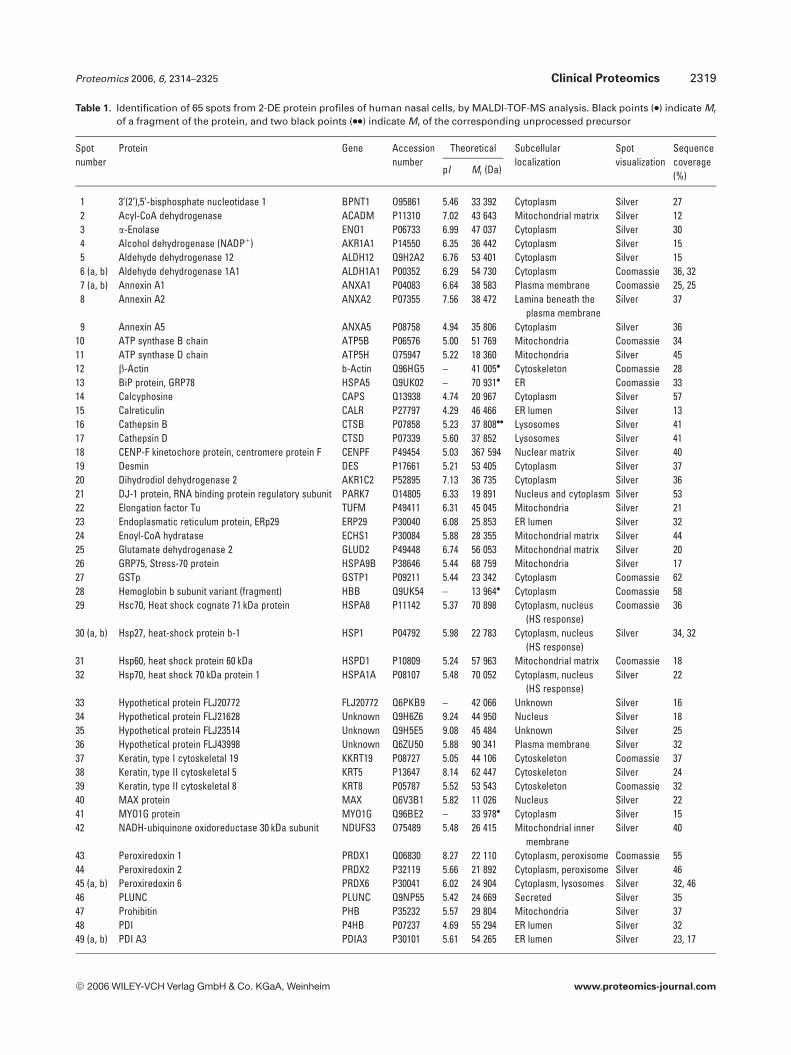
The 2-DE maps obtained for all samples were found to bereproducible and consistent, allowing the establishment of areference 2-DE map of nasal cells from non-CF individuals(Fig. 2A). From this 2-DE proteome profile, 65 of the mostrepresentative spots were analyzed, following trypsin diges-tion, by PMF, using MALDI-TOF-MS spectrometers (Fig. 2Aand Table 1). As mentioned above, 19 of these spots wereidentified in several 2-DE gels, further supporting the com-puter-assisted analysis of the gels.
The majority of protein spots identified (n = 40) werefound to be ubiquitously expressed proteins (Table 1).These include proteins in functional classes, such as: (1)molecular chaperones (binding protein (BiP) (spot 13),calreticulin (spot 15), 75 kDa glucose regulated protein(GRP75) (spot 26), Hsc70 (spot 29), Hsp60 (spot 31),Hsp70 (spot 32), protein disulfide isomerases (spots 48,49a, and 49b)); (2) cytoskeleton constituents (b-actin (spot12), tubulins a1 (spot 56), a6 (spot 57), b (spot 58)); (3)several enzymes (a-enolase (spot 3), ATP synthase b chain(spot 10), superoxide dismutase-Mn (SOD-Mn) (spot 53),etc.); and also (4) proteins that regulate cellular processes
© 2006 WILEY-VCH Verlag GmbH & Co. KGaA, Weinheim www.proteomics-journal.com

2318 M. Roxo-Rosa et al. Proteomics 2006, 6, 2314–2325
Figure 2. 2-DE reference maps of protein profiles of human nasal cells, from (A) non-CF controls and (B) F508del-homozygous CF patients.Proteins from ,16106 to 26106 nasal cells recovered by brushing were separated as described in Section 2. After MS-compatible silverstaining, gels were analyzed using ImageMaster 2-D Platinum software (see Section 2). About 600 spots were detected, of which 65 wereidentified by MS analysis. Spot numbers indicated in the 2-DE maps are the same as used for MS identification, as in Table 1. Differences inexpression levels of proteins between CF and non-CF nasal cells, observed among the various 2-DE maps, were statistically assessed. Blackarrows indicate spots with similar expression levels between the two groups (p . 0.05) or spots for which statistical analysis was notpossible. Red arrows indicate spots exhibiting different expression levels in CF vs. non-CF nasal cells ( more abundant; less abundant).Significant differences (p , 0.05) are indicated by an asterisk.
Figure 3. ImageMaster 2D Platinum output showing two representative differentially expressed spots (p , 0.05) between human nasalcells from CF patients and non-CF controls. (A) Spot no. 27, GSTp, expressed in lower levels (p = 0.021) in CF (n = 7) than in non-CF controls(n = 8) nasal cells. (B) Spot no. 55, tropomyosin a3 chain, more abundantly expressed (p = 0.024) in CF (n = 7) than in non-CF control (n = 8)nasal cells. For each spot an enlarged region of the respective 2-DE reference maps is shown which contains the referred spot (highlightedin red) and the corresponding spot volume. Each spot was identified by MALDI-TOF MS analysis.
© 2006 WILEY-VCH Verlag GmbH & Co. KGaA, Weinheim www.proteomics-journal.com
Proteomics 2006, 6, 2314–2325 Clinical Proteomics 2319
Table 1. Identification of 65 spots from 2-DE protein profiles of human nasal cells, by MALDI-TOF-MS analysis. Black points (.) indicate Mr
of a fragment of the protein, and two black points (..) indicate Mr of the corresponding unprocessed precursor
Spotnumber
Protein Gene Accessionnumber
Theoretical Subcellularlocalization
Spotvisualization
Sequencecoverage(%)pI Mr (Da)
1 3’(2’),5’-bisphosphate nucleotidase 1 BPNT1 O95861 5.46 33 392 Cytoplasm Silver 272 Acyl-CoA dehydrogenase ACADM P11310 7.02 43 643 Mitochondrial matrix Silver 123 a-Enolase ENO1 P06733 6.99 47 037 Cytoplasm Silver 304 Alcohol dehydrogenase (NADP1) AKR1A1 P14550 6.35 36 442 Cytoplasm Silver 155 Aldehyde dehydrogenase 12 ALDH12 Q9H2A2 6.76 53 401 Cytoplasm Silver 156 (a, b) Aldehyde dehydrogenase 1A1 ALDH1A1 P00352 6.29 54 730 Cytoplasm Coomassie 36, 327 (a, b) Annexin A1 ANXA1 P04083 6.64 38 583 Plasma membrane Coomassie 25, 258 Annexin A2 ANXA2 P07355 7.56 38 472 Lamina beneath the
plasma membraneSilver 37
9 Annexin A5 ANXA5 P08758 4.94 35 806 Cytoplasm Silver 3610 ATP synthase B chain ATP5B P06576 5.00 51 769 Mitochondria Coomassie 3411 ATP synthase D chain ATP5H O75947 5.22 18 360 Mitochondria Silver 4512 b-Actin b-Actin Q96HG5 – 41 005. Cytoskeleton Coomassie 2813 BiP protein, GRP78 HSPA5 Q9UK02 – 70 931. ER Coomassie 3314 Calcyphosine CAPS Q13938 4.74 20 967 Cytoplasm Silver 5715 Calreticulin CALR P27797 4.29 46 466 ER lumen Silver 1316 Cathepsin B CTSB P07858 5.23 37 808.. Lysosomes Silver 4117 Cathepsin D CTSD P07339 5.60 37 852 Lysosomes Silver 4118 CENP-F kinetochore protein, centromere protein F CENPF P49454 5.03 367 594 Nuclear matrix Silver 4019 Desmin DES P17661 5.21 53 405 Cytoplasm Silver 3720 Dihydrodiol dehydrogenase 2 AKR1C2 P52895 7.13 36 735 Cytoplasm Silver 3621 DJ-1 protein, RNA binding protein regulatory subunit PARK7 O14805 6.33 19 891 Nucleus and cytoplasm Silver 5322 Elongation factor Tu TUFM P49411 6.31 45 045 Mitochondria Silver 2123 Endoplasmatic reticulum protein, ERp29 ERP29 P30040 6.08 25 853 ER lumen Silver 3224 Enoyl-CoA hydratase ECHS1 P30084 5.88 28 355 Mitochondrial matrix Silver 4425 Glutamate dehydrogenase 2 GLUD2 P49448 6.74 56 053 Mitochondrial matrix Silver 2026 GRP75, Stress-70 protein HSPA9B P38646 5.44 68 759 Mitochondria Silver 1727 GSTp GSTP1 P09211 5.44 23 342 Cytoplasm Coomassie 6228 Hemoglobin b subunit variant (fragment) HBB Q9UK54 – 13 964. Cytoplasm Coomassie 5829 Hsc70, Heat shock cognate 71 kDa protein HSPA8 P11142 5.37 70 898 Cytoplasm, nucleus
(HS response)Coomassie 36
30 (a, b) Hsp27, heat-shock protein b-1 HSP1 P04792 5.98 22 783 Cytoplasm, nucleus(HS response)
Silver 34, 32
31 Hsp60, heat shock protein 60 kDa HSPD1 P10809 5.24 57 963 Mitochondrial matrix Coomassie 1832 Hsp70, heat shock 70 kDa protein 1 HSPA1A P08107 5.48 70 052 Cytoplasm, nucleus
(HS response)Silver 22
33 Hypothetical protein FLJ20772 FLJ20772 Q6PKB9 – 42 066 Unknown Silver 1634 Hypothetical protein FLJ21628 Unknown Q9H6Z6 9.24 44 950 Nucleus Silver 1835 Hypothetical protein FLJ23514 Unknown Q9H5E5 9.08 45 484 Unknown Silver 2536 Hypothetical protein FLJ43998 Unknown Q6ZU50 5.88 90 341 Plasma membrane Silver 3237 Keratin, type I cytoskeletal 19 KKRT19 P08727 5.05 44 106 Cytoskeleton Coomassie 3738 Keratin, type II cytoskeletal 5 KRT5 P13647 8.14 62 447 Cytoskeleton Silver 2439 Keratin, type II cytoskeletal 8 KRT8 P05787 5.52 53 543 Cytoskeleton Coomassie 3240 MAX protein MAX Q6V3B1 5.82 11 026 Nucleus Silver 2241 MYO1G protein MYO1G Q96BE2 – 33 978. Cytoplasm Silver 1542 NADH-ubiquinone oxidoreductase 30 kDa subunit NDUFS3 O75489 5.48 26 415 Mitochondrial inner
membraneSilver 40
43 Peroxiredoxin 1 PRDX1 Q06830 8.27 22 110 Cytoplasm, peroxisome Coomassie 5544 Peroxiredoxin 2 PRDX2 P32119 5.66 21 892 Cytoplasm, peroxisome Silver 4645 (a, b) Peroxiredoxin 6 PRDX6 P30041 6.02 24 904 Cytoplasm, lysosomes Silver 32, 4646 PLUNC PLUNC Q9NP55 5.42 24 669 Secreted Silver 3547 Prohibitin PHB P35232 5.57 29 804 Mitochondria Silver 3748 PDI P4HB P07237 4.69 55 294 ER lumen Silver 3249 (a, b) PDI A3 PDIA3 P30101 5.61 54 265 ER lumen Silver 23, 17
© 2006 WILEY-VCH Verlag GmbH & Co. KGaA, Weinheim www.proteomics-journal.com

2320 M. Roxo-Rosa et al. Proteomics 2006, 6, 2314–2325
Table 1. Continued
Spotnumber
Protein Gene Accessionnumber
Theoretical Subcellularlocalization
Spotvisualization
Sequencecoverage(%)pI Mr (Da)
50 Rho GDP-dissociation inhibitor 1 ARHGDIA P52565 5.03 23 207 Cytoplasm Silver 2551 (a, b) SCCA1 SERPINB3 P29508 6.35 45 565 Cytoplasm Coomassie 41, 4052 Serum albumin ALB P02768 5.67 66 472 Secreted Coomassie 2853 SOD-Mn SOD2 P04179 6.86 22 204 Mitochondrial matrix Coomassie 3854 Sorcin SRI P30626 5.32 21 676 Cytoplasm Silver 3055 Tropomyosin a3 chain TPM3 P06753 4.68 32 818 Cytoskeleton Coomassie 2756 Tubulin a1 chain TUBA1 P05209 4.94 50 136 Cytoskeleton Silver 2457 Tubulin a6 chain TUBA6 Q9BQE3 4.96 49 895 Cytoskeleton Coomassie 2258 Tubulin b chain TUBB1 P07437 4.78 49 671 Cytoskeleton Coomassie 2759 UMP-CMP kinase UCK P30085 5.44 22 222 Nucleus (mainly),
cytoplasmSilver 60
(annexins A1 (spots 7a and 7b) and A2 (spot 8); DJ-1protein or RNA binding protein regulatory subunit (spot21), etc.).
During the nasal brushing procedure some localbleeding may occur. Therefore, the identification of pro-teins characteristic of blood cells, e.g. hemoglobin b sub-unit variant (fragment) (spot 28) from red blood cells, isnot surprising. Nevertheless, the epithelial origin of mostcells obtained by that procedure was confirmed throughthe identification of epithelium-specific proteins, namelykeratins (type I cytoskeletal 19 (spot 37), type II cytoskele-tal 5 (spot 38), and 8 (spot 39)) [11], palate lung and nasalepithelium clone protein (PLUNC) (spot 46) [12], andsquamous cell carcinoma antigen 1 (SCCA1) (spots 51aand 51b) [13].
Within the same 2-DE gel, some different spots wereidentified by MS as being the same protein (viz., aldehydedehydrogenase 1A1–spots 6a and 6b; annexin A1–spots 7aand 7b; Hsp 27–spots 30a and 30b; peroxiredoxin 6–spots45a and 45b; protein disulfide isomerase A3 (PDI A3)–spots49a and 49b; and SCCA1–spots 51a and 51b). Further studiesare required to confirm whether these are isoforms of thesame protein resulting from PTMs (viz. phosphorylation,glycosylation, etc.).
3.4 Differential protein expression profile in
CF nasal cells
Figure 2B shows a typical 2-DE map obtained for F508del-homozygous CF nasal cells. From the referred 18 differen-tially expressed spots, 13 were identified by MS (Tables 1 and2) (indicated with red arrows and asterisks in Fig. 2A and B).There are five additional spots, also identified by MS, forwhich expression appears to be altered, although not signifi-cantly (p . 0.05) (Table 2).
We grouped these differentially expressed proteinsaccording to their cellular function into six classes: (1)chronic inflammation (cathepsins B (spot 17) and D (spot18), Hsp27 (spot 30b), and PLUNC (spot 46)); (2) oxidativestress (GSTp (spot 27), and peroxiredoxin 6 (spot 45b)); (3)cytoskeleton organization (b-actin (spot 12), desmin (spot19), tropomyosin a3 chain (spot 55)); (4) molecular chaper-ones (calreticulin (spot 15) and PDI A3 (spot 49b)); (5)metabolic functions (alcohol dehydrogenase (NADP1) (spot4), ATP synthase D chain (spot 11), dihydrodiol dehy-drogenase 2 (spot 20), NADH-ubiquinone oxidoreductase30 kDa subunit (spot 42), prohibitin (spot 47)); and (6)unknown (hypothetical protein FLJ43998 (spot 36), MAXprotein (spot 40)).
In order to find a relationship among these differentiallyexpressed proteins and CFTR, we built their regulatory(Fig. 4A) and biological function (Fig. 4B) pathways, using aspecific software that correlates the scientific information ofeach protein. As expected, we can observe from these highlycomplex pathways that there are many cellular mechanismsconnecting those proteins to CFTR, suggesting that, indeed,dysfunction of CFTR could have an influence on theirexpression patterns, either directly or through regulatoryeffects, etc. However, as some of the differentially expressedproteins between CF and non-CF nasal cells were not inte-grated in such pathways (viz., alcohol dehydrogenase(NADP1) (spot 4), ATP synthase D chain (spot 11), dihy-drodiol dehydrogenase 2 (spot 20), hypothetical proteinFLJ43998 (spot 36), MAX protein (spot 40), NADH-ubiqui-none oxidoreductase 30 kDa subunit (spot 42), PLUNC (spot46), and tropomyosin a3 chain (spot 55)), subsequent studieswill be required in order to clarify the roles of each in CFpathophysiology. A more restricted regulatory pathway wasbuilt (Fig. 4C) to evaluate the involvement of proteases, (e.g.,cathepsins B and D, spots 16 and 17), and their inhibitors,(e.g., SCCA1, spots 51a and 51b) during the CF chronicinflammation process.
© 2006 WILEY-VCH Verlag GmbH & Co. KGaA, Weinheim www.proteomics-journal.com

Proteomics 2006, 6, 2314–2325 Clinical Proteomics 2321
Table 2. Proteins found to be differentially expressed in nasal cells from CF patients (n = 7) versus non-CF controls (n = 8), by using the two-sample t-test. For each spot the average of the %Vol 6 M.S.D. (mean of SD) is indicated. “CF vs. non-CF” column indicates theratio values between %Vol average of spots on CF 2-DE maps and %Vol average of the same spots on non-CF 2-DE maps
Spotno.
Protein % Vol averageCF 6 M.S.D.
% Vol averagenonCF 6 M.S.D.
CF vs.non-CF
p value Cellular function
4 Alcohol dehydrogenase (NADP1) 0.303 6 0.148 0.109 6 0.037 2.774 0.023* Belongs to the aldo/keto reductase family. Catalyzesthe NADPH-dependent reduction of a variety ofaldehydes to their corresponding alcohols.
11 ATP synthase D chain 0.264 6 0.105 0.646 6 0.222 0.408 0.058 This is one of the chains of the nonenzymaticcomponent of the mitochondrial ATPase complex.It has no apparent bacterial homolog and its exactfunction is unknown.
12 b-Actin 1.297 6 0.435 0.497 6 0.126 2.612 0.049* Component of cell cytoskeleton.
15 Calreticulin 0.112 6 0.051 0.183 6 0.102 0.614 0.068 Molecular Ca21-binding chaperone.
16 Cathepsin B 0.415 6 0.072 0.655 6 0.029 0.633 0.002* Thiol-protease that has been implicated in tumorinvasion and inflammation.
17 Cathepsin D 0.460 6 0.089 0.147 6 0.061 3.122 0.013* Acid protease which is estrogen inducible, may havea role during the pathogenesis of breast tumors.
19 Desmin 0.369 6 0.153 0.133 6 0.057 2.764 0.053 Belongs to the intermediate filament family.
20 Dihydrodiol dehydrogenase 2 0.082 6 0.045 0.287 6 0.027 0.287 0.003* Belongs to the aldo/keto reductase family. Catalyzethe conversion of aldehydes and ketones to theircorresponding alcohols by utilizing NADH and/orNADPH as cofactors.
27 GSTp 0.559 6 0.100 1.544 6 0.509 0.362 0.021* GSTs are a family of enzymes that play an importantrole in detoxification by catalyzing the conjugationof many hydrophobic and electrophilic compoundswith reduced glutathione.
30b Hsp27, Heat-shock protein b-1 0.210 6 0.027 0.375 6 0.094 0.560 0.033* Involved in stress resistance and actin organization.
36 Hypothetical protein FLJ43998 0.083 6 0.024 0.177 6 0.018 0.468 0.003* Belongs to the cation transport ATPases family(P-type ATPases).
40 MAX protein 0.098 6 0.017 0.178 6 0.051 0.551 0.087 Unknown/transcription regulator.
42 NADH-ubiquinone oxidoreductase30 kDa subunit
0.113 6 0.044 0.251 6 0.080 0.451 0.040* Transfer of electrons from NADH to the respiratorychain.
45b Peroxiredoxin 6 0.124 6 0.032 0.324 6 0161 0.382 0.039* Involved in redox regulation of the cell.
46 PLUNC 1.309 6 0.580 0.250 6 0.091 5.230 0.074 Airway inflammatory response after exposure toirritants. Specifically expressed in upper airways.
47 Prohibitin 0.094 6 0.027 0.250 6 0.114 0.376 0.015* Inhibits DNA synthesis. It has a role in regulatingproliferation. It is involved in the assembly ofmitochondrial respiratory chain complexes.
49b PDI A3 0.301 6 0.078 0.192 6 0.052 1.566 0.028* Rearrangement of disulfide bonds in proteins to formtheir native structures.
55 Tropomyosin a3 chain 0.158 6 0.006 0.062 6 0.022 2.539 0.024* Binds to actin filaments in muscle and nonmusclecells. In nonmuscle cells it is implicated instabilizing cytoskeleton actin filaments.
* statistically significant differences (p , 0.05)
4 Discussion
Through the comparison of protein profiles of nasal cellsfrom F508del-homozygous CF patients and non-CF controls,we identified here a set of proteins that are differentiallyexpressed. We now discuss the possible involvement of suchproteins in CF lung disease.
4.1 Chronic inflammation
Recurrent and persistent bacterial infections of CF lung,namely by P. aeruginosa, lead to a neutrophil-mediatedchronic inflammation [4], which results from an impairedbalance between the activity of proteases and their respectiveinhibitors [14]. Interestingly, our results indicate an altered
© 2006 WILEY-VCH Verlag GmbH & Co. KGaA, Weinheim www.proteomics-journal.com

2322 M. Roxo-Rosa et al. Proteomics 2006, 6, 2314–2325
Figure 4. Correlation pathwaysbetween CFTR and the proteinsthat were found to be differen-tially expressed in CF nasal cells,in comparison to nasal cellsfrom non-CF controls. Thesepathways were built using thesoftware PathwayAssist version3.0 (see Section 2). (A) Reg-ulatory pathway, showing thecommon regulators (in green) ofthose proteins; (B) biologicalfunction pathway, showingcommon target cellular pro-cesses (yellow rectangles); (C)pathway of the proteases andrespective inhibitors involved ininflammation. Proteins identi-fied in the 2-DE nasal cell pro-teome are indicated in red(some of them were not inte-grated in these pathways as theycould not be related to any of theothers); proteins added by thesoftware to complete the path-way are shown in yellow. 2-BACA, 2-benzoxazolecarboxylicacid; CFTR; CF-transmembraneconductance regulator; GSTp,Glutathione-S-transferase p; IFNg, interferon g; IL, interleukin;JUN, proto-oncogene c-jun;NFkB, nuclear factor kB; NO,nitric oxide; PDI A3, protein di-sulfide isomerase A3; PP2A,protein phosphatase 2A; P2RY1,purinergic receptor P2Y; SRC,proto-oncogene tyrosine-pro-tein kinase Src; TNF, tumornecrosis factor. Symbols:positive regulation; nega-tive regulation; regulationof protein expression; mo-lecular transport; proteinmodification; binding;protein complexes; inter-leukins.
© 2006 WILEY-VCH Verlag GmbH & Co. KGaA, Weinheim www.proteomics-journal.com

Proteomics 2006, 6, 2314–2325 Clinical Proteomics 2323
expression pattern of two lysosome proteases, cathepsins Band D (Table 2, spots 16 and 17), in CF nasal cells incomparison to non-CF. These two enzymes are generallyinvolved in inflammatory processes (Fig. 4C) being, how-ever, regulated in a noncoordinated manner, as indicatedby lung tumor studies [15]. Our results support the latterconcept by showing that whereas cathepsin B expression isdown-regulated in CF patients, cathepsin D is up-regu-lated.
An enhanced activity of cathepsin B was reported tooccur in the sputum of inflamed CF-airways [16] and also inthe serum of CF patients [17]. However, in our studies ca-thepsin B precursor appears to be significantly less expressedin CF than in non-CF nasal cells. This is not entirely sur-prising as these CF patients were not in an acute phase ofinflammation at the time of sample collection. Additionally,they were under constant Pulmozyme treatment. ThisDNase renders the mucus more fluid, by hydrolyzing theDNA released by the neutrophils, thus reducing mucusobstruction, and breaking the inflammatory cycle. In con-trast and probably because it is regulated by different factors,cathepsin D precursor is more abundant in CF nasal cells(Fig. 4A and B).
PLUNC seems to play an important role in host defenseagainst bacteria [18] and in airway inflammatory responseafter exposure to irritants [19]. This protein (spot 46) wasfound to be up-regulated in CF cells, although not signifi-cantly (Fig. 2A and B; Table 2). Our results are therefore inagreement with the previously described higher expressionlevels of PLUNC in chronic bronchitis, emphysema, [20],and after invasive surgery [12].
It was reported that CF patients have significantlyhigher levels of serum IgG antibodies against Hsp27,Hsp 60 [21], and Hsp90 [22] than non-CF controls.However, it is not known whether this results frominduced levels of human or bacterial Hsps. Our resultsindicate that, at least, Hsp27 (spot 30b) is expressed insignificantly lower levels in CF patients versus controls(Table 2). Hsp27 is an ATP-independent chaperone thatfunctions as an inhibitor of nuclear factor kB (NFkB)pathway [23]. Therefore, the reduced levels of this nega-tive regulator might explain the increased activation ofthe NFkB and overproduction of interleukin 8 (IL8)reported to occur in CF bronchial gland cells and CFlungs ([24, 25], respectively).
Annexin A1 is a calcium-dependent phospholipid-binding protein that has been implicated in regulatingphospholipid vesicle aggregation, mediating inflammatoryresponse [26]. It was reported that the intact form of thisprotein is not detected in bronchoalveolar lavage from CFpatients, in contrast to non-CF controls [27]. Probably dueto the fact that CF patients included in this study were notin an exacerbated condition, we did not detect any differ-ence between expression levels of CF and non-CF individ-uals for either of the two annexin A1 isoforms (spots 7aand b, Fig. 2A vs. B; Table 1).
4.2 Oxidative stress
Due to the chronic inflammation, reactive oxygen species(ROS) levels are described to be highly increased in CF(reviewed in [28]), as antioxidant defenses are scarce for theamount of ROS produced. This continuous oxidative stress istherefore responsible for the substantial tissue damage thatoccurs in the airway surface of CF patients [29]. Also, con-tributing to this situation is the reduction in the levels ofglutathione (in its reduced form) that was reported to occurin the CF patients’ airway surface fluid [30], possibly becauseits efflux is also regulated through CFTR [31]. Besides itsantioxidant role, the reduced form of glutathione also con-tributes to the detoxification of oxidative stress products, as itconjugates to many hydrophobic and electrophilic com-pounds, through a reaction that is catalyzed by GSTp [32].Recently, a polymorphism of the GSTM3 gene, another GSTfamily member, was associated to CF severity [33]. Consistentwith the idea that the GST family may contribute to CF phe-notype, we found the expression of GSTp (spot 27) to be sig-nificantly lower in the 2-DE protein profile of CF nasal cells(Table 2).
Peroxiredoxin 6 (spot 45b) was also found to be lessabundant in cells from CF patients. This enzyme is a gluta-thione-dependent peroxidase which is also involved in lungoxidative stress defence. In fact, in rat kidney the levels of itsmRNA are induced after intraperitoneal administration ofchloroform [34]. Thus, in addition to the previously reporteddecrease in the CFTR-associated glutathione efflux levels[31], we determined that CF patients also have lower levels ofboth GSTp and peroxiredoxin six enzymes in their nasalcells, which therefore results in less protection against thedetrimental effects of oxidative stress. Further supportingthis idea, Hsp27 (spot 30b), which as mentioned above is lessabundant in CF nasal cells, was also described as being oneof the major protectors against the oxidative stress caused bychronic inflammation, both through its ability to raise theintracellular glutathione levels [35] and through its chaper-one activity on the enzymes involved in detoxification ofROS, such as glutathione transferases and reductases [36].
4.3 Cytoskeleton organization
The integrity and function of epithelial cells are totally de-pendent on their polarization status, in which the cytoskele-ton actin microfilaments play a crucial role [37]. Moreover, itwas demonstrated that for cAMP-dependent activation ofCFTR, a proper actin organization is required [38]. However,both chronic inflammation and oxidative stress originatefrom extensive airway tissue injury, inducing major struc-tural changes in the airway wall cells of CF patients. Cer-tainly contributing to these changes are alterations in cyto-skeleton organization of such cells. Supporting these obser-vations, we observed that b-actin (spot 12), desmin (spot 19),and tropomyosin a3 chain (spot 55) are expressed in higherlevels in nasal cells from CF patients than in non-CF controls
© 2006 WILEY-VCH Verlag GmbH & Co. KGaA, Weinheim www.proteomics-journal.com

2324 M. Roxo-Rosa et al. Proteomics 2006, 6, 2314–2325
(Table 2). Interestingly, two other isoforms of tropomyosin(Tm5a and Tm5b) were previously implicated in the regula-tion of CFTR membrane traffic [39], as decreased expressionof these proteins leads to an increase in the apical surfacetargeting of CFTR.
Besides its role in inflammation and oxidative stressprotection, Hsp27 seems to be involved in cytoskeletonorganization, through the control of actin polymerization/depolymerization processes [40]. Thus, the decrease in thelevels of this chaperone in CF nasal cells most probably con-tributes to the remodeling of this tissue.
4.4 Molecular chaperones
Calreticulin is a fairly well described calcium (Ca21)-depend-ent molecular chaperone, which also plays a role in the reg-ulation of gene expression and in cell adhesion [41]. Fur-thermore, it is well established that during infection-asso-ciated inflammation, this protein can be released fromneutrophils [42]. Here, we determined that calreticulin (spot15) is expressed in lower levels in nasal cells from CFpatients than in controls, although this difference was foundto be of no statistical significance.
Protein disulfide isomerases constitute a family of ERenzymes that catalyzes formation of native disulfide bond(s)of nascent peptides and also act as molecular chaperonesassisting in protein folding [43, 44]. The expression of oneisoform of this family, PDI A3 (spot 49b), was found to be up-regulated in nasal cells from CF patients in comparison tonon-CF controls (Fig. 2A and B; Table 2). The association ofthis observation with the fact that all patients analyzed hereexpress F508del-CFTR, a misfolded protein that is mostlyretained in the ER for degradation, remains to be investi-gated.
4.5 Metabolic functions
As mentioned above, the protein 2-DE maps that weobtained here evidenced that there are other proteins differ-entially expressed between nasal cells from CF patients andnon-CF controls. One of them is the 30 kDa subunit ofNADH-ubiquinone oxidoreductase (spot 42) that is down-regulated in these patients. Interestingly, it was early report-ed that a decrease occurs in the apparent binding substrateconstant (Km) of this enzyme in skin fibroblast [45] and bloodcells from CF patients [46]. Prohibitins, a conserved family ofproteins in eukaryotic cells with proposed functions in cellcycle progression, senescence, and apoptosis, have beenrecently reported as a novel type of membrane-associatedchaperones involved in the assembly of mitochondrialrespiratory chain complexes [47]. The lower abundance of themitochondrial proteins ATP synthase D chain (spot 11),NADH-ubiquinone oxidoreductase (spot 42), and prohibitin(spot 47) in CF nasal cells is consistent with the old notionthat mitochondrial metabolism is not fully functional in CFtissues.
We also observed that both alcohol dehydrogenase(NADP1) (spot 4) and dihydrodiol dehydrogenase 2 (spot 20)occur in significantly lower levels in CF nasal cells 2-DEmaps. As members of the aldo/keto reductases (AKRs)superfamily, these two NADP(H1)-dependent oxido-reductases catalyze the conversion of aldehydes and ketonesto alcohols during the metabolism of drugs and xenobiotics[48].
Further studies will be required to understand the rela-tionship between the changes observed here in expressionlevels of these proteins and the CF respiratory disease.
5 Conclusions
The proteome is a highly dynamic entity, being constantlyaltered during the cell lifetime. Additionally, changes in pro-tein levels do not result exclusively from up- or down-reg-ulation of their respective gene expression. It could resultfrom PTMs and different processing and/or turnover rates.Therefore, the independent validation of each protein iden-tified here as a contributor to CF pathophysiology will benecessary. Notwithstanding, at least some of those proteinsmight be associated with respiratory diseases and ultimatelywith CF pathology. Once validated, CF biomarkers could alsobe potential targets for the development of new CF therapies.
We thank CF patients, their families and doctors for theirvaluable cooperation in this study. Work presented here was sup-ported by research grants POCTI/MGI/40878/2001, POCTI/MGI/47382/2002 (FCT/FEDER, Portugal), and by Programade Financiamento Plurianual do CIGMH (FCT). MRR andGC were recipients of Ph.D. fellowships, PRAXIS BD/19869/99and PRAXIS BD/14387/2003, respectively (both from FCT,Portugal). We also thank Dr. Luka Clarke for revising themanuscript.
6 References
[1] Collins, F. S., Science 1992, 256, 774–779.
[2] Ward, C. L., Omura, S., Kopito, R. R., Cell 1995, 83, 121–127.
[3] Lukacs, G. L., Mohamed, A., Kartner, N., Chang, X. B. et al.,EMBO J. 1994, 13, 6076–6086.
[4] Welsh, M., Tsui, L.-C., Boat, T. F., Beaudet, A. L., The Metabolicand Molecular Basis of Inherited Disease, McGraw-Hill, NY,1995, pp. 3799–3876.
[5] Welsh, M. J., Ramsey, B. W., Accurso, F., Cutting, G. R., TheMetabolic and Molecular Basis of Inherited Disease, McGraw-Hill, NY, 2001, pp. 5121–5188.
[6] Ratjen, F., Doring, G., Lancet 2003, 361, 681–689.
[7] Kerem, E., Corey, M., Kerem, B. S., Rommens, J. et al., N.Engl. J. Med. 1990, 323, 1517–1522.
[8] Beck, S., Penque, D., Garcia, S., Gomes, A. et al., Hum. Mutat.1999, 14, 133–144.
© 2006 WILEY-VCH Verlag GmbH & Co. KGaA, Weinheim www.proteomics-journal.com

Proteomics 2006, 6, 2314–2325 Clinical Proteomics 2325
[9] Penque, D., Mendes, F., Beck, S., Farinha, C. et al., Lab.Invest. 2000, 80, 857–868.
[10] Roxo Rosa, M., Davezec, N., Bensalem, N., Majumder, M. etal., J. Cystic Fibrosis 2004, 3, 85–89.
[11] Upasani, O. S., Vaidya, M. M., Bhisey, A. N., Oral Oncol.2004, 40, 236–256.
[12] Bingle, C. D., Craven, C. J., Hum. Mol. Genet. 2002, 11, 937–943.
[13] Sakaguchi, Y., Kishi, F., Murakami, A., Suminami, Y. et al.,Biochim. Biophys. Acta 1999, 1444, 111–116.
[14] Birrer, P., McElvaney, N. G., Rudeberg, A., Sommer, C. W. etal., Am. J. Respir. Crit. Care Med. 1994, 150, 207–213.
[15] Ledakis, P., Tester, W. T., Rosenberg, N., Romero-Fischmann,D. et al., Clin. Cancer Res. 1996, 2, 561–568.
[16] Stockley, R. A., Bayley, D., Hill, S. L., Hill, A. T. et al., Thorax2001, 56, 366–372.
[17] Laszlo, A., Sohar, I., Karacsonyi, S., Petri, A. et al., Acta Med.Hung. 1990, 47, 107–109.
[18] Ghafouri, B., Kihlstrom, E., Tagesson, C., Lindahl, M., Bio-chim. Biophys. Acta 2004, 1699, 57–63.
[19] Lindahl, M., Stahlbom, B., Tagesson, C., Electrophoresis2001, 22, 1795–1800.
[20] Di, Y. P., Harper, R., Zhao, Y., Pahlavan, N. et al., J. Biol.Chem. 2003, 278, 1165–1173.
[21] de Graeff-Meeder, E. R., Rijkers, G. T., Voorhorst-Ogink, M.M., Kuis, W. et al., Pediatr. Res. 1993, 34, 424–428.
[22] al-Shamma, M. R., McSharry, C., McLeod, K., McCruden, E.A. et al., Thorax 1997, 52, 1056–1059.
[23] Park, K. J., Gaynor, R. B., Kwak, Y. T., J. Biol. Chem. 2003,278, 35272–35278.
[24] Tabary, O., Escotte, S., Couetil, J. P., Hubert, D. et al., PflugersArch. 2001, 443, 40–44.
[25] Knorre, A., Wagner, M., Schaefer, H. E., Colledge, W. H. et al.,Biol. Chem. 2002, 383, 271–282.
[26] Andree, H. A., Willems, G. M., Hauptmann, R., Maurer-Fogy,I. et al., Biochemistry 1993, 32, 4634–4640.
[27] Tsao, F. H., Meyer, K. C., Chen, X., Rosenthal, N. S. et al., Am.J. Respir. Cell Mol. Biol. 1998, 18, 120–128.
[28] Wood, L. G., Gibson, P. G., Garg, M. L., Eur. Respir. J. 2003,21, 177–186.
[29] Hull, J., Vervaart, P., Grimwood, K., Phelan, P., Thorax 1997,52, 557–560.
[30] Roum, J. H., Buhl, R., McElvaney, N. G., Borok, Z. et al., J.Appl. Physiol. 1993, 75, 2419–2424.
[31] Kogan, I., Ramjeesingh, M., Li, C., Kidd, J. F. et al., EMBO J.2003, 22, 1981–1989.
[32] Hayes, J. D., McLellan, L. I., Free Radic. Res. 1999, 31, 273–300.
[33] Flamant, C., Henrion-Caude, A., Boelle, P. Y., Bremont, F.,Brouard, J. et al., Pharmacogenetics 2004, 14, 295–301.
[34] Fujii, T., Fujii, J., Taniguchi, N., Eur. J. Biochem. 2001, 268,218–225.
[35] Mehlen, P., Kretz-Remy, C., Preville, X., Arrigo, A. P., EMBO J.1996, 15, 2695–2706.
[36] Preville, X., Salvemini, F., Giraud, S., Chaufour, S. et al., Exp.Cell Res. 1999, 247, 61–78.
[37] Ku, N. O., Zhou, X., Toivola, D. M., Omary, M. B., Am. J.Physiol. 1999, 277, G1108–G1137.
[38] Chasan, B., Geisse, N. A., Pedatella, K., Wooster, D. G. et al.,Eur. Biophys. J. 2002, 30, 617–624.
[39] Dalby-Payne, J. R., O’Loughlin, E. V., Gunning, P., Mol. Biol.Cell 2003, 14, 4365–4375.
[40] Landry, J., Huot, J., Biochem. Cell Biol. 1995, 73, 703–707.
[41] Ghebrehiwet, B., Peerschke, E. I., Mol. Immunol. 2004, 41,173–183.
[42] Kishore, U., Sontheimer, R. D., Sastry, K. N., Zaner, K. S. etal., Biochem. J. 1997, 322, 543–550.
[43] Noiva, R., Semin. Cell Dev. Biol. 1999, 10, 481–493.
[44] Wang, C. C., Biochemistry (Mosc.) 1998, 63, 407–412.
[45] Shapiro, B. L., Feigal, R. J., Lam, L. F., Proc. Natl. Acad. Sci.USA 1979, 76, 2979–2983.
[46] Dechecchi, M. C., Girella, E., Cabrini, G., Berton, G., Enzyme1988, 40, 45–50.
[47] Nijtmans, L. G., de Jong, L., Artal, S. M., Coates, P. J. et al.,EMBO J. 2000, 19, 2444–2451.
[48] Jez, J. M., Flynn, T. G., Penning, T. M., Biochem. Pharmacol.1997, 54, 639–647.
© 2006 WILEY-VCH Verlag GmbH & Co. KGaA, Weinheim www.proteomics-journal.com