Embed Size (px)
Citation preview
BioMed CentralProteome Science
ss
Open AcceResearchPlasma and urine biomarkers in acute viral hepatitis EShikha Taneja1, Somdutta Sen2, Vijay K Gupta3, Rakesh Aggarwal4 and Shahid Jameel*1Address: 1Virology Group, International Centre for Genetic Engineering and Biotechnology, Aruna Asaf Ali Marg, New Delhi - 110067, India, 2The Centre for genomic Applications, Okhla Industrial Area (Phase III), New Delhi - 110020, India, 3Department of Gastroenterology, Army Hospital, Delhi Cantonment, New Delhi - 110010, India and 4Department of Gastroenterology, Sanjay Gandhi Postgraduate Institute for Medical Sciences, Rae Bareilly Road, Lucknow - 226014, India
Email: Shikha Taneja - [email protected]; Somdutta Sen - [email protected]; Vijay K Gupta - [email protected]; Rakesh Aggarwal - [email protected]; Shahid Jameel* - [email protected]
* Corresponding author
AbstractBackground: Hepatitis E, caused by the hepatitis E virus (HEV), is endemic to developingcountries where it manifests as waterborne outbreaks and sporadic cases. Though generally self-limited with a low mortality rate, some cases progress to fulminant hepatic failure (FHF) with highmortality. With no identified predictive or diagnostic markers, the events leading to diseaseexacerbation are not known. Our aim is to use proteomic tools to identify biomarkers of acuteand fulminant hepatitis E.
Results: We analyzed proteins in the plasma and urine of hepatitis E patients and healthy controlsby two-dimensional Differential Imaging Gel Electrophoresis (DIGE) and mass spectrometry, andidentified over 30 proteins to be differentially expressed during acute hepatitis E. The levels of oneplasma protein, transthyretin, and one urine protein, alpha-1-microglobulin (α1m), were thenquantitated by enzyme immunoassay (EIA) in clinical samples from a larger group of patients andcontrols. The results showed decreased plasma transthyretin levels (p < 0.005) and increased urineα1m levels (p < 0.001) in acute hepatitis E patients, compared to healthy controls. Preliminaryresults also showed lower urine zinc alpha glycoprotein levels in fulminant hepatitis E compared toacute disease; this remains to be confirmed with more fulminant cases.
Conclusion: Our results demonstrate the utility of characterizing plasma and urine proteomes forsignatures of the host response to HEV infection. We predict that plasma transthyretin and urineα1m could be reliable biomarkers of acute hepatitis E. Besides the utility of this approach tobiomarker discovery, proteome-level changes in human biofluids would also guide towards a betterunderstanding of host-virus interaction and disease.
BackgroundHepatitis E is a significant public health problem inresource-limited regions of the world. The disease iscaused by the hepatitis E virus (HEV), and appears as spo-
radic cases as well as large localized outbreaks of acutehepatitis [1]. The HEV is a non-enveloped virus with a~7.2 kb positive-strand RNA genome and is classified inthe family Hepeviridae [2]. Due to a possible zoonotic
Published: 27 October 2009
Proteome Science 2009, 7:39 doi:10.1186/1477-5956-7-39
Received: 6 August 2009Accepted: 27 October 2009
This article is available from: http://www.proteomesci.com/content/7/1/39
© 2009 Taneja et al; licensee BioMed Central Ltd. This is an Open Access article distributed under the terms of the Creative Commons Attribution License (http://creativecommons.org/licenses/by/2.0), which permits unrestricted use, distribution, and reproduction in any medium, provided the original work is properly cited.
Page 1 of 14(page number not for citation purposes)
Proteome Science 2009, 7:39 http://www.proteomesci.com/content/7/1/39
association [3-5], unusually high HEV seropositivity [6]and occasional sporadic disease [7] have also beenobserved in developed countries.
The disease is mild to moderate in severity with a 0.5 to4% mortality rate [1]. However, it presents with increasedseverity and mortality approaching 15-25% in pregnantwomen, especially those infected in the third trimester ofpregnancy [8]. While the disease is largely self-limited, asmall fraction of sporadic cases progress to fulminanthepatic failure (FHF) with high mortality; this is alsoobserved in infected pregnant women [1]. The obstetricand fetal outcomes are reported to be worse for pregnantwomen infected with HEV compared to other hepatitisviruses [9]. The events leading to FHF are not known andno predictive or diagnostic markers are available. Diag-nostic tests routinely employed for HEV infection includeevaluation of circulating IgM antibodies to viral compo-nents, occasional evaluation of viral RNA by reverse tran-scription polymerase chain reaction (RT-PCR) and thebiochemical assessment of liver function [1]. None ofthese tests shed any light on disease prognosis. The avail-ability of predictive biomarkers of disease progressionwould aid in identifying those sporadic cases that aremore likely to develop severe disease, and would thus aidin patient care and management.
The outcome of an infection depends upon multiple fac-tors, both pathogen-related and host-related. Changes inthe host proteome following infection have been docu-mented for a number of human pathogens [10]. Genomicand proteomic biomarkers are proving to be particularlyuseful in understanding disease progression, staging andresponse to therapy in chronic diseases and cancers[11,12]. Since disease progression also depends upon thehost response to infection, examination of differentialprotein expression profiles from diseased versus healthyindividuals is a good starting point to search for potentialmarkers of disease progression.
Body fluids such as plasma and urine being in close con-tact with cells and tissues are good representatives of thehost physiology. Proteomic methods such as two-dimen-sional gel electrophoresis (2DGE) and differential imag-ing gel electrophoresis (DIGE) followed by the massspectrometric identification of proteins are beingemployed to compare signatures in body fluids frompatients and controls [13,14]. We have applied these pro-teomic methods to compare plasma and urine from hep-atitis E patients and healthy controls. Our results showchanges in multiple proteins from both analytes, two ofwhich were also validated in a larger sample set.
MethodsSubjectsSpecimens were obtained from patients with jaundice atthe Gastroenterology Outpatient Clinic or inpatients atthe Army Base Hospital in New Delhi, India. Specimenswere also obtained from healthy volunteers. Blood (5-6ml) was collected in EDTA-coated vacutainers (BectonDickinson), centrifuged at 800 × g for 5 min at 4°C. Theplasma was collected and stored in aliquots at -70°C. Itwas tested for various viral hepatitis markers by enzymeimmunoassays (EIA) as follows: HBsAg (Hepalisa, J Mitraand Co. Pvt. Ltd., New Delhi, India), anti-HCV (Hep-Chex-C, XCyton Diagnostic Pvt. Ltd., Bangalore, India),and IgM anti-HEV (HEV IgM ELISA, MP Biomedicals AsiaPacific Pvt. Ltd., Singapore). First morning mid-streamurine (~150 ml) was collected in an autoclaved bottlecontaining one protease inhibitor cocktail tablet (Roche,Germany), and stored at -70°C.
Plasma fractionation and dye labellingThe plasma samples were first depleted of the six mostabundant proteins using a MARS spun column (AgilentTechnologies, USA) according to the manufacturer's pro-tocol. Briefly, 15 μl of plasma was diluted in 185 μl ofBuffer A, passed through a spin pre-column and thenloaded onto the MARS column. The depleted fraction wascollected as flow through and the bound proteins wereeluted with Buffer B as recommended. The plasmadepleted of 85-90% of albumin, immunoglobulin G(IgG), IgA, haptoglobin, anti-trypsin and transferrin wasthen cleaned up using the Clean-Up kit (GE Healthcare,UK) according to the manufacturer's protocol, and theprotein content was estimated using the Bradford Reagent(Bio-Rad Laboratories). Pools of plasma specimensobtained from four patients (HEV pool) and four healthyvolunteers (NOR pool) were prepared by mixing individ-ual protein-depleted plasma in volumes that containedequal amounts of total protein. The protein pools wereseparately resuspended in DIGE buffer (8 M Urea, 4%CHAPS, 10 mM Tris-Cl, pH 8.5) to give a final proteinconcentration of 0.75 mg/ml. Cyanine dyes (Cy2, Cy3 orCy5; GE Healthcare, UK) were reconstituted in anhydrousdimethylformamide and added to labelling reactions at aratio of 400 pmoles of Cy Dye per 50 μg of protein. Thereactions were kept for 30 min on ice in the dark and wereterminated by the addition of 1 μl of 10 mM lysine for 10min. The HEV and NOR pools were labelled with Cy5 andCy3, respectively. An equal mixture of the two pools wasalso labelled with Cy2 and used as an internal control rep-resenting the total proteins. The labelled samples wereeither immediately fractionated further or were stored at -70°C.
Page 2 of 14(page number not for citation purposes)
Proteome Science 2009, 7:39 http://www.proteomesci.com/content/7/1/39
Multi Lectin Affinity Chromatography (MLAC)Equal volumes of the samples labelled with Cy2, Cy3 andCy5 dyes were mixed together and dialyzed against MLACequilibration buffer (EB; 20 mM Tris-Cl, pH 7.4, 150 mMNaCl, 1 mM CaCl2, 1 mM MnSO4) overnight at 4°C withthree changes of buffer. The MLAC column was preparedby mixing 700 μl packed bed volume each of Wheat GermAgglutinin (WGA) agarose, Concavalin A (Con A) agaroseand Jacalin agarose (Vector Laboratries, Inc., USA), andequilibrated with EB. The dialyzed proteins were appliedto the column and allowed to bind. The flow through wasrecycled through the column once and then collected asthe non-glycosylated fraction. The glycosylated proteinswere then eluted using a displacer buffer (20 mM Tris-Cl,pH 7.4, 500 mM NaCl, 170 mM methyl α-D mannopyra-noside, 270 mM galactose, 170 mM N-acetylglu-cosamine). The glycosylated and non-glycosylated plasmaprotein fractions thus obtained were either fractionatedfurther using mixed cation-anion exchange chromatogra-phy (CAX) or were resolved using two-dimensional gelelectrophoresis (2DGE).
Mixed cation-anion exchange chromatography (CAX)A mixed cation-anion exchange chromatography columnwas prepared with an equal mixture of S-Sepharose andQ-Sepharose (GE Healthcare, UK), and was equilibratedwith 20 mM Tris-HCl pH 7.5. The glycosylated and non-glycosylated fractions were first dialysed against the CAXequilibration buffer overnight at 4°C with three changesand were separately applied to the column. After binding,the column was washed with two volumes of 20 mM Tris-HCl pH 7.5, and the bound proteins eluted with two vol-umes of a gradient of 100-600 mM NaCl in 20 mM Tris-HCl pH 7.5 (in steps of 100 mM NaCl). The fractions thusobtained were resolved by SDS-12%PAGE, the gelsscanned on a Typhoon Imager (GE Healthcare, UK) andthen silver stained to pick the bands for mass spectromet-ric analysis.
Urine fractionation and dye labellingUrine samples (50 ml) were centrifuged at 3,000 × g for 5min at 4°C and the supernatant filtered through a What-mann P3 paper. The filtrate was then dialyzed using a 3.5kDa cut-off dialysis membrane (Pierce, USA) against Mil-liQ water overnight at 4°C with three changes. The dia-lysed sample was precipitated with 66% chilled acetonefor 20 min on ice, followed by centrifugation at 12,000 ×g for 20 min. The pellets were resuspended in a buffer con-taining 4 M Urea and 2% CHAPS, and the protein concen-tration estimated using the Bradford reagent (Bio-RadLaboratories, USA). Labelling of the protein samples withCy dyes was carried out as described for plasma proteins.
Two-dimensional gel electrophoresis (2DGE)The fractionated plasma proteins were precipitated withacetone at -20°C for 2 hr and then resuspended in rehy-dration buffer (8 M Urea, 2% CHAPS, 0.2% BromophenolBlue, 20 mM DTT, 0.78% Pharmalyte). An IPGphor IEFunit and precast 13 cm, pH 3-10 NL IPG strips (GEHealthcare, UK) were used for the first dimension separa-tion. The strips were rehydrated for 12 hr in rehydrationbuffer, 100 μg protein was loaded actively and resolvedfor a total focusing time of 32 KVhr. Each strip was thenequilibrated with 5 ml equilibration buffer A (30% Glyc-erol, 6 M Urea, 50 mM Tris-HCl, pH 8.8, 2% SDS, 0.2%Bromophenol blue, 10 mg/ml dithiothreitol) on a rockerfor 30 min at room temperature, followed by buffer B(30% Glycerol, 6 M Urea, 50 mM Tris-HCl, pH 8.8, 2%SDS, 0.2% Bromophenol blue, 25 mg/ml Iodoacetamide)for another 30 min at room temperature with rocking. Theproteins were resolved in the second dimension at roomtemperature on SDS-10% polyacrylamide gels at 10 mAper gel for 30 min, followed by 20 mA per gel.
For the urine samples, 100 μg of labelled proteins werepassively loaded during rehydration on 13 cm, pH 3.0-5.6NL IPG strips for 12 hr at room temperature. The sampleswere focussed in the first dimension for 31 KVhr followedby strip treatment and second dimension as describedabove for plasma proteins.
The gels were scanned with an Ettan DIGE Scanner (GEHealthcare, UK) and analysed using the DeCyder 2D v6.5software (GE Healthcare, UK). The intensity of each spotwas normalized against the Cy2 labelled control. Only thespots that were significantly changed (= 1.5 fold increaseor decrease) in the patients as compared to controls wereselected for mass spectrometric analysis after silver stain-ing of the gels.
Mass spectrometry and protein identificationThe gel plug was washed once with water, twice for 10 mineach with vortexing in destaining solution (15 mM Potas-sium Ferricyanide, 50 mM Sodium Thiosulphate), twicein water for 15 min each, and then for 5 min with 100 μlof a solution containing 10 mM Ammonium Bicarbonateand 50% Acetonitrile (ACN). The proteins were reducedwith 150 μl of 10 mM Dithiothreitol, 100 mM Ammo-nium Bicarbonate, 5% ACN for 1 hr at 55°C, followed bydehydration of the plug in 100 μl of 100% ACN for 20min, and the proteins were alkylated with 100 μl of 50mM Iodoacetamide in 100 mM Ammonium Bicarbonatefor 30 min at room temperature, in the dark. The plugswere then washed with 100 μl of 100 mM AmmoniumBicarbonate for 10 min, followed by 100 μl of 100% ACNfor 20 min. The liquid was removed and the plugs driedin a SpeedVac for 15 min. The proteins in gel plugs werethen digested at 37°C with 150-200 ng trypsin in 50 mM
Page 3 of 14(page number not for citation purposes)
Proteome Science 2009, 7:39 http://www.proteomesci.com/content/7/1/39
Ammonium Bicarbonate for 16 hr. The extracted peptideswere collected in the supernatant, the gel plugs treatedonce with 100 μl of 20 mM Ammonium Bicarbonate,twice with 100 μl of 1% Trifluoroacetic acid (TFA) in 50%ACN for 20 min, and once with 100 μl of 100% ACN for20 min. All the supernatants were pooled together andconcentrated in a SpeedVac to 10 μl. From this, 1 μl of thesample was mixed with 1 μl of α-Cyano-4-hydroxycin-namic acid (5 mg/ml in 50% acetonitrile, 0.1% TFA,Bruker Daltonics) matrix, and analyzed on the BrukerUltraflex MALDI-TOF-TOF mass spectrometer with FlexControl v2.2, and processed using Flex analysis v2.2 soft-ware. The standard peptide mixture (a mixture of ninepeptides from the m/z range of 757-3147) was used forexternal mass calibration, while self-degraded fragmentsof trypsin were used for internal calibration. Spectra wereacquired for the mass-to-charge (m/z) range of 800-4000.All samples were analyzed in reflectron mode at laserpower of 20-25%. Each spectrum was the sum of 500 lasershots with laser frequency of 50 Hz. The peak lists for MSwere generated using Flex control version 2.2 and Flexanalysis version 2.2 (Bruker Daltonics) using a proprietary"Top hat" base-line tool along with "SNAP" peak detec-tion algorithm, which was set to a signal-to-noise ratio of6, maximal number of peaks as 100 and quality factorthreshold of 50. The MS/MS was smoothed and base linesubtracted and the peptide mass list was searched againstthe MSDB database using the MASCOT search engine(BioTools v 2.2 software). MS/MS spectra were also proc-essed using Flexanalysis v 2.2 software and searched usingMASCOT. The mass spectrum data were submitted to anonline database for protein identification (MASCOT ver-sion 2.1, http://www.matrixscience.com/).
The search parameters were set as follows: Database -MASCOT; enzyme - trypsin; taxonomy - Homo sapiens;global modification of carbamidomethyl on cysteine;with variable modification of oxidation on methionine;no restrictions on protein mass; allowed up to 1 missedcleavage. The peptide tolerance was set at 100 ppm andMS/MS tolerance at ± 0.8-1.0 Da. For PMF, only those pro-teins with score >60 (p < 0.05) were accepted as identified,while for MS/MS individual ion cut off score was set as 39or 41 (p < 0.05). The false discovery rate (FDR) was calcu-lated using decoy database (MASCOT) and was 0.0% formost of the proteins (see Additional file 1). Xcorr was cal-culated for those proteins that were run on Thermo LCQDeca nano LCMS and was searched in Sequest database.The Xcorr cut off was kept at 10.0 and the same data in.mgf format was also searched in MASCOT database andFDR calculated in decoy database. As to those peptidesmatched to multiple members of a protein family, the onewith the highest score was reported. Most of the proteinsidentified were found to have more than two peptidematches in database however for few proteins with single
peptide match, the sequence provided by the databasewas manually validated and those with reasonably good'b and y' ion matches were considered (see Additional file2, Additional file 3, Additional file 4 and Additional file5). During protein identity validation due importance wasalso given to the theoretical molecular weight and isoelec-tric points of the proteins. The proteins with theoreticalmass and isoelectric points approximately equal to theexperimentally obtained values were accepted as success-fully identified.
Enzyme immunoassays (EIA)For the quantitation of transthyretin and alpha-1-microglobulin (α1m) in body fluids, commercial EIA kits(Immunology Consultants Laboratory, Inc., USA) wereused. The levels of transthyretin were assayed in plasma asper the manufacturer's protocol. To estimate α1m levels,urine was centrifuged at 3,000 × g for 5 min at 4°C. Fromthis, 10 μL of the supernatant was diluted 100-fold withthe diluent provided in the kit, and the assay carried outaccording to the manufacturer's protocols. The quantity ofa specific protein in the test sample was interpolated fromstandard curves and corrected for sample dilution.Depending upon the viral markers, the samples weredivided into five groups: Group 1, positive for HEV andnegative for other viral hepatitis markers [HEV+/Other-](n = 20); Group 2, positive for HEV and HBV [HEV+/HBV+] (n = 5); Group 3, negative for HEV but positive forHBV [HEV-/HBV+] (n = 5); Group 4, clinical diagnosis ofviral hepatitis but negative for all viral markers [All-] (n =4); Group 5, healthy controls (n = 20).
Statistical analysisStatistical significance of the data was evaluated with par-ametric as well as non-parametric methods. The formerincluded the Student's t-test and the latter included theMann-Whitney U test. These packages were part of thePast software [15]. P values of < 0.05 were considered sig-nificant. Receiver operating characteristic or ROC curvewas generated using SPSS software (version 15.0). Areaunder the curve (AUC) was calculated and AUC valuesabove 0.75 were considered.
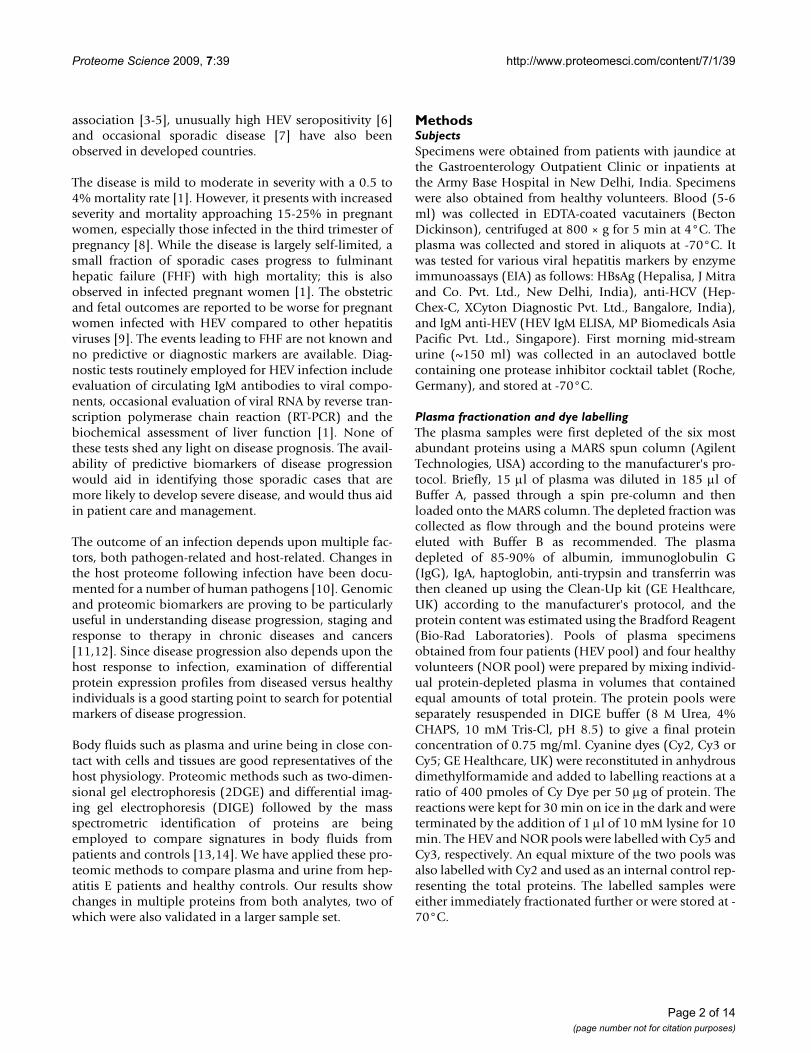
ResultsPlasma fractionation and analysisSince the dynamic range of human plasma is high, wetried different proteomic workflows using pools of patientand control plasma labelled with cyanine dyes (Fig. 1). Inworkflow A, we separated labelled proteins into glyco-sylated and non-glycosylated fractions through multi-lec-tin affinity chromatography (MLAC) followed by acharge-based separation by mixed cation-anion exchangechromatography (CAX). These fractions were then ana-lyzed by SDS-PAGE. In workflow B, the MLAC-derived
Page 4 of 14(page number not for citation purposes)
Proteome Science 2009, 7:39 http://www.proteomesci.com/content/7/1/39
glycosylated and non-glycosylated fractions were directlyanalyzed by two-dimensional gel electrophoresis (2DGE).
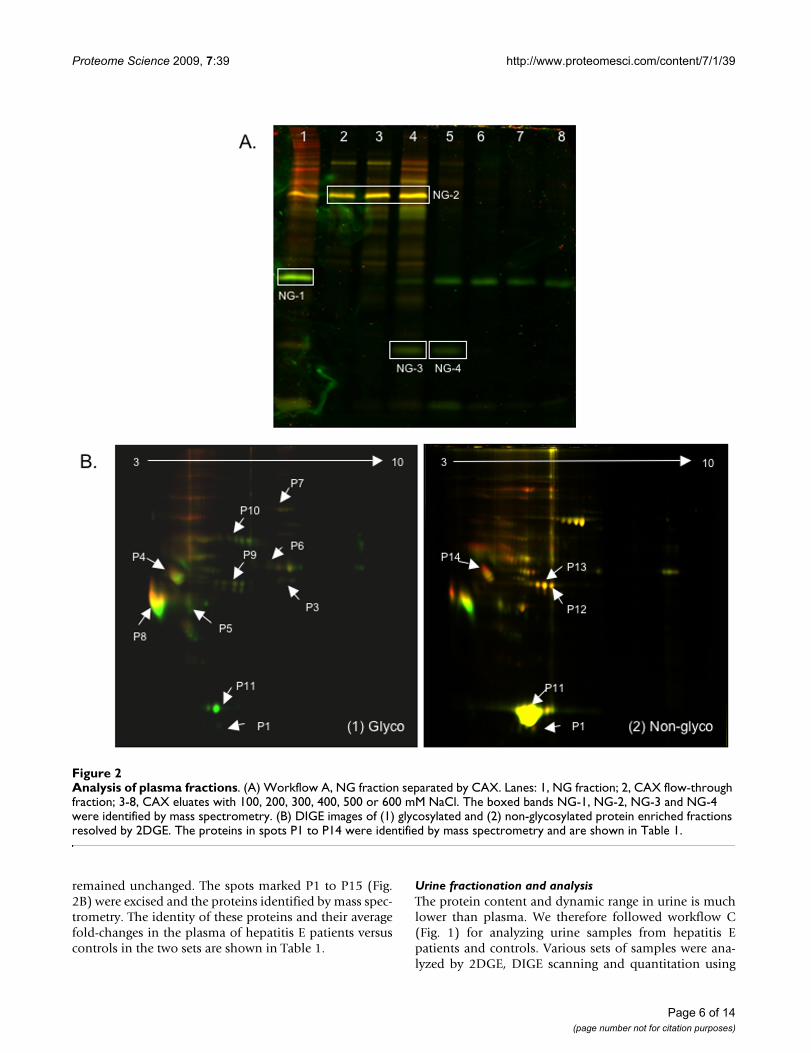
The main problem encountered with workflow A was thedilution of proteins at the end of the workflow, making itdifficult to detect many proteins following SDS-PAGE andDIGE scans. From the non-glycosylated CAX fractions, weobserved three proteins (NG-1, NG-3 and NG-4) to bedownregulated in hepatitis E patients, and one protein(NG-2) that remained unchanged between patients andhealthy controls (Fig. 2A). These were identified by massspectrometry to be apolipoprotein A1 (NG-1), vitamin Dbinding protein (NG-2), and transthyretin or prealbumin(NG-3 and NG-4) (Table 1).
For workflow B, representative 2DGE patterns for the glyc-oprotein (Fig. 2B(1)) and non-glycoprotein fractions (Fig.2B(2)) are shown. Various spots were marked using theDeCyder software and image analysis was carried outbased on spot volume and intensity. Two independentsets of experiments with different patient and controlpools were analysed. Representative gel images are shownfor one set. In the glycoprotein fraction, of the 219 spotsanalyzed, 67 (30.6%) proteins were downregulated and22 (10%) were upregulated in hepatitis E patients, while130 (59.4%) remained unchanged. In the non-glycopro-tein fraction, of the 102 spots analyzed, 34 (33.3%) pro-teins were downregulated and 33 (32.3%) wereupregulated in hepatitis E patients, while 35 (34.3%)
Workflow for proteomic analysisFigure 1Workflow for proteomic analysis. Proteins in the plasma or urine of healthy controls and hepatitis E patients were labelled with Cy2, Cy3 or Cy5 dyes as described in Methods. The labelled samples were mixed and subjected to different fractionation strategies. In workflow A, the labelled samples were first subjected to Multi Lectin Affinity Chromatography (MLAC) to obtain fractions enriched in glycoproteins (G fraction) and non-glycoproteins (NG fraction). These fractions were then separately fractionated by mixed cation-anion exchange chromatography (CAX). The six fractions obtained by step salt elution were then analysed by SDS-PAGE. In workflow B, the labelled samples were subjected to MLAC and the enriched fractions were resolved by two-dimensional gel electrophoresis (2DGE). Workflows A and B were followed for plasma samples. Workflow C was fol-lowed for urine samples for which the labelled samples were directly fractionated by 2DGE. The differentially expressed spots were analysed with DeCyder 2D v6.5, the selected spots were cut out and the proteins identified by mass spectrometry.
Page 5 of 14(page number not for citation purposes)
Proteome Science 2009, 7:39 http://www.proteomesci.com/content/7/1/39
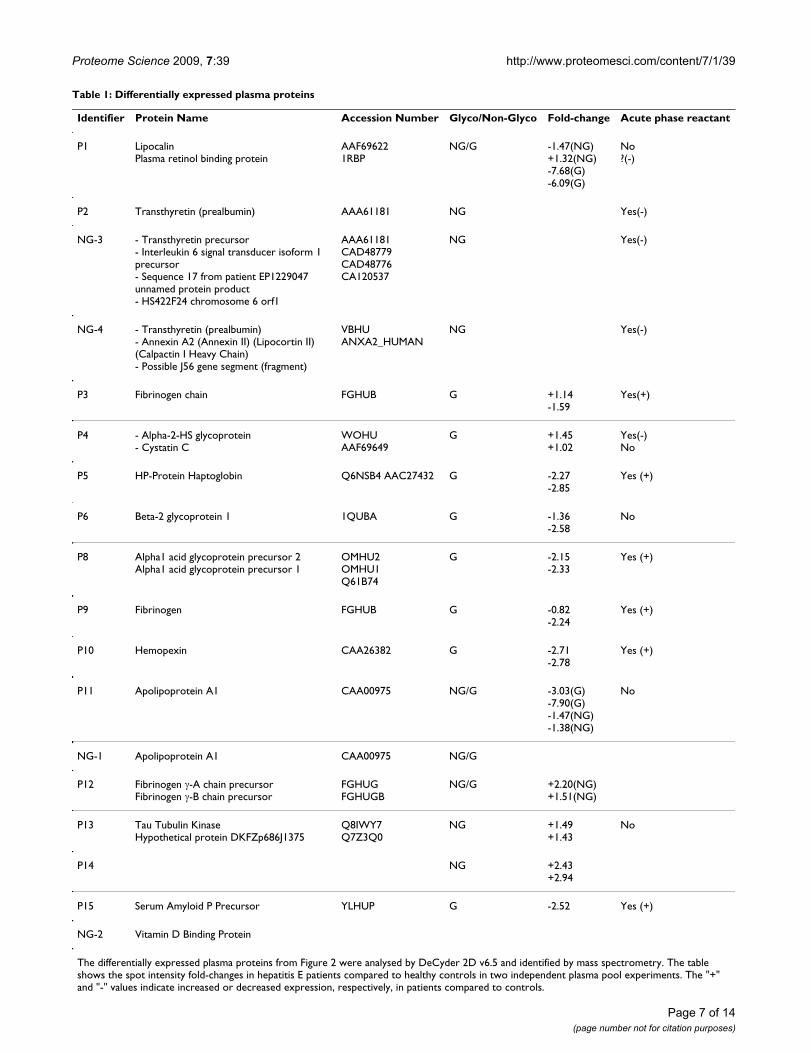
remained unchanged. The spots marked P1 to P15 (Fig.2B) were excised and the proteins identified by mass spec-trometry. The identity of these proteins and their averagefold-changes in the plasma of hepatitis E patients versuscontrols in the two sets are shown in Table 1.
Urine fractionation and analysisThe protein content and dynamic range in urine is muchlower than plasma. We therefore followed workflow C(Fig. 1) for analyzing urine samples from hepatitis Epatients and controls. Various sets of samples were ana-lyzed by 2DGE, DIGE scanning and quantitation using
Analysis of plasma fractionsFigure 2Analysis of plasma fractions. (A) Workflow A, NG fraction separated by CAX. Lanes: 1, NG fraction; 2, CAX flow-through fraction; 3-8, CAX eluates with 100, 200, 300, 400, 500 or 600 mM NaCl. The boxed bands NG-1, NG-2, NG-3 and NG-4 were identified by mass spectrometry. (B) DIGE images of (1) glycosylated and (2) non-glycosylated protein enriched fractions resolved by 2DGE. The proteins in spots P1 to P14 were identified by mass spectrometry and are shown in Table 1.
Page 6 of 14(page number not for citation purposes)
Proteome Science 2009, 7:39 http://www.proteomesci.com/content/7/1/39
Page 7 of 14(page number not for citation purposes)
Table 1: Differentially expressed plasma proteins
Identifier Protein Name Accession Number Glyco/Non-Glyco Fold-change Acute phase reactant
P1 LipocalinPlasma retinol binding protein
AAF696221RBP
NG/G -1.47(NG)+1.32(NG)-7.68(G)-6.09(G)
No?(-)
P2 Transthyretin (prealbumin) AAA61181 NG Yes(-)
NG-3 - Transthyretin precursor- Interleukin 6 signal transducer isoform 1 precursor- Sequence 17 from patient EP1229047 unnamed protein product- HS422F24 chromosome 6 orf1
AAA61181CAD48779CAD48776CA120537
NG Yes(-)
NG-4 - Transthyretin (prealbumin)- Annexin A2 (Annexin II) (Lipocortin II) (Calpactin I Heavy Chain)- Possible J56 gene segment (fragment)
VBHUANXA2_HUMAN
NG Yes(-)
P3 Fibrinogen chain FGHUB G +1.14-1.59
Yes(+)
P4 - Alpha-2-HS glycoprotein- Cystatin C
WOHUAAF69649
G +1.45+1.02
Yes(-)No
P5 HP-Protein Haptoglobin Q6NSB4 AAC27432 G -2.27-2.85
Yes (+)
P6 Beta-2 glycoprotein 1 1QUBA G -1.36-2.58
No
P8 Alpha1 acid glycoprotein precursor 2Alpha1 acid glycoprotein precursor 1
OMHU2OMHU1Q61B74
G -2.15-2.33
Yes (+)
P9 Fibrinogen FGHUB G -0.82-2.24
Yes (+)
P10 Hemopexin CAA26382 G -2.71-2.78
Yes (+)
P11 Apolipoprotein A1 CAA00975 NG/G -3.03(G)-7.90(G)-1.47(NG)-1.38(NG)
No
NG-1 Apolipoprotein A1 CAA00975 NG/G
P12 Fibrinogen γ-A chain precursorFibrinogen γ-B chain precursor
FGHUGFGHUGB
NG/G +2.20(NG)+1.51(NG)
P13 Tau Tubulin KinaseHypothetical protein DKFZp686J1375
Q8IWY7Q7Z3Q0
NG +1.49+1.43
No
P14 NG +2.43+2.94
P15 Serum Amyloid P Precursor YLHUP G -2.52 Yes (+)
NG-2 Vitamin D Binding Protein
The differentially expressed plasma proteins from Figure 2 were analysed by DeCyder 2D v6.5 and identified by mass spectrometry. The table shows the spot intensity fold-changes in hepatitis E patients compared to healthy controls in two independent plasma pool experiments. The "+" and "-" values indicate increased or decreased expression, respectively, in patients compared to controls.
Proteome Science 2009, 7:39 http://www.proteomesci.com/content/7/1/39
Page 8 of 14(page number not for citation purposes)
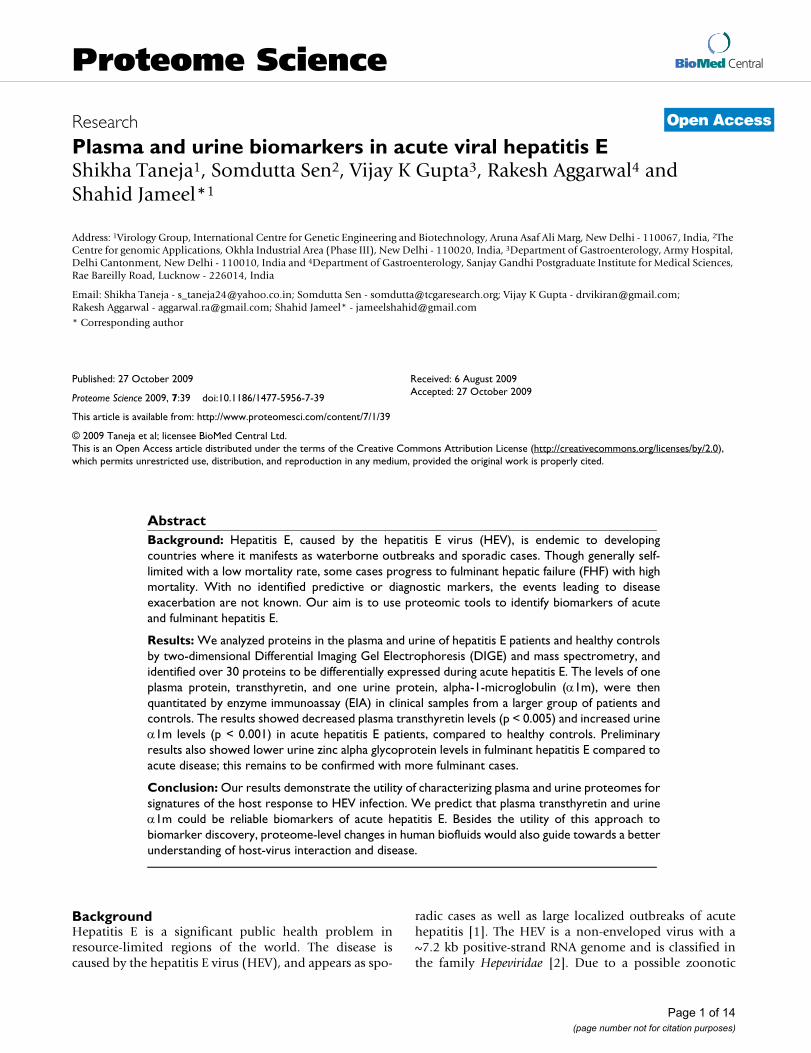
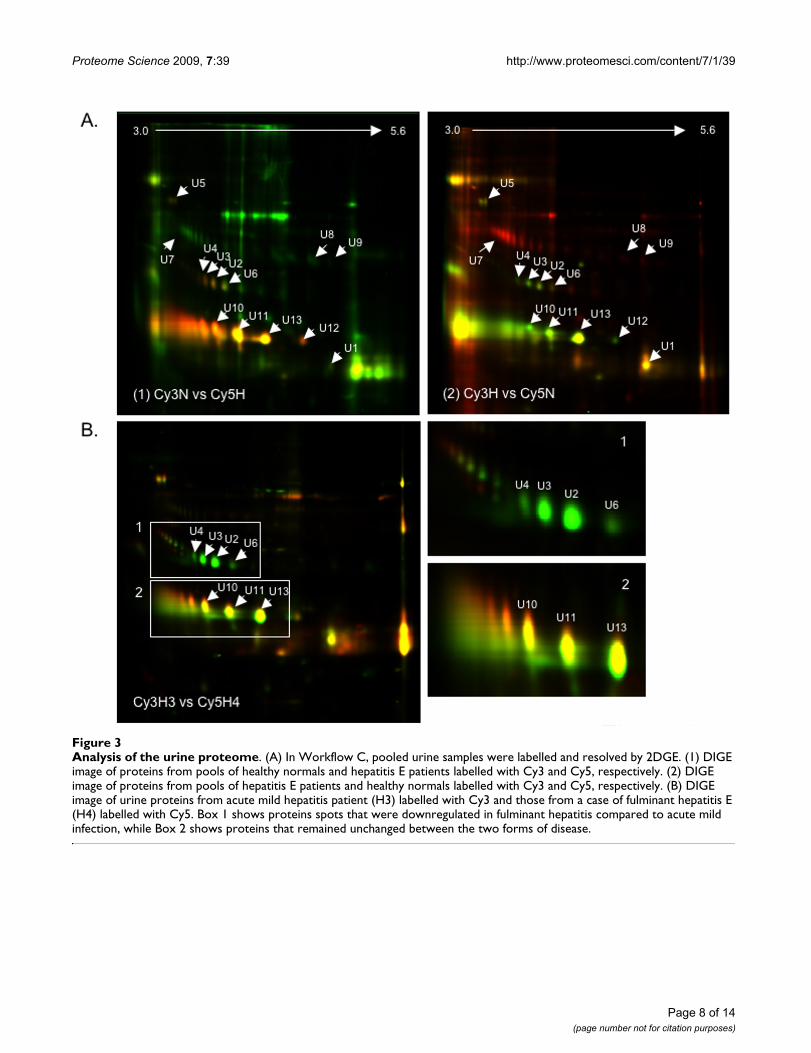
Analysis of the urine proteomeFigure 3Analysis of the urine proteome. (A) In Workflow C, pooled urine samples were labelled and resolved by 2DGE. (1) DIGE image of proteins from pools of healthy normals and hepatitis E patients labelled with Cy3 and Cy5, respectively. (2) DIGE image of proteins from pools of hepatitis E patients and healthy normals labelled with Cy3 and Cy5, respectively. (B) DIGE image of urine proteins from acute mild hepatitis patient (H3) labelled with Cy3 and those from a case of fulminant hepatitis E (H4) labelled with Cy5. Box 1 shows proteins spots that were downregulated in fulminant hepatitis compared to acute mild infection, while Box 2 shows proteins that remained unchanged between the two forms of disease.
Proteome Science 2009, 7:39 http://www.proteomesci.com/content/7/1/39
the DeCyder software, as described in Methods. Pools of6 healthy and 9 hepatitis E patient urine samples wereseparately labelled with Cy3 and Cy5, respectively andanalyzed according to workflow C. The DIGE image isshown in Fig. 3A (1). Of the 1177 spots subjected toimage analysis, 38.3% proteins were upregulated and22.5% proteins downregulated in acute hepatitis E, while39.2% remained unchanged. A dye swap experiment wasalso carried out with the same pools, except that the hep-atitis E patient samples were now labelled with Cy3 andthe normal samples with Cy5. The DIGE image for this isshown in Fig. 3A (2). For 765 spots, image analysisshowed comparable results with 33.5% proteins upregu-lated and 30.2% proteins downregulated in acute hepati-tis E, and 36.3% remaining unchanged. There was goodconcordance for individual proteins as well; this is pre-
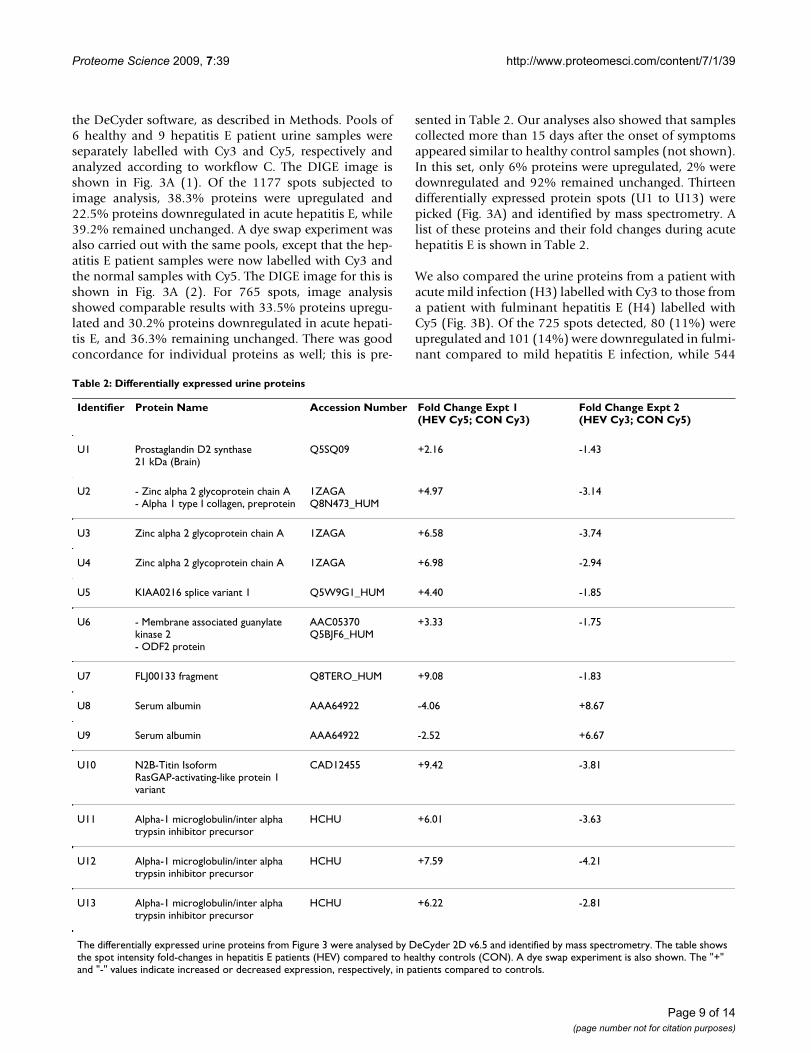
sented in Table 2. Our analyses also showed that samplescollected more than 15 days after the onset of symptomsappeared similar to healthy control samples (not shown).In this set, only 6% proteins were upregulated, 2% weredownregulated and 92% remained unchanged. Thirteendifferentially expressed protein spots (U1 to U13) werepicked (Fig. 3A) and identified by mass spectrometry. Alist of these proteins and their fold changes during acutehepatitis E is shown in Table 2.
We also compared the urine proteins from a patient withacute mild infection (H3) labelled with Cy3 to those froma patient with fulminant hepatitis E (H4) labelled withCy5 (Fig. 3B). Of the 725 spots detected, 80 (11%) wereupregulated and 101 (14%) were downregulated in fulmi-nant compared to mild hepatitis E infection, while 544
Table 2: Differentially expressed urine proteins
Identifier Protein Name Accession Number Fold Change Expt 1(HEV Cy5; CON Cy3)
Fold Change Expt 2 (HEV Cy3; CON Cy5)
U1 Prostaglandin D2 synthase21 kDa (Brain)
Q5SQ09 +2.16 -1.43
U2 - Zinc alpha 2 glycoprotein chain A- Alpha 1 type I collagen, preprotein
1ZAGAQ8N473_HUM
+4.97 -3.14
U3 Zinc alpha 2 glycoprotein chain A 1ZAGA +6.58 -3.74
U4 Zinc alpha 2 glycoprotein chain A 1ZAGA +6.98 -2.94
U5 KIAA0216 splice variant 1 Q5W9G1_HUM +4.40 -1.85
U6 - Membrane associated guanylate kinase 2- ODF2 protein
AAC05370Q5BJF6_HUM
+3.33 -1.75
U7 FLJ00133 fragment Q8TERO_HUM +9.08 -1.83
U8 Serum albumin AAA64922 -4.06 +8.67
U9 Serum albumin AAA64922 -2.52 +6.67
U10 N2B-Titin IsoformRasGAP-activating-like protein 1 variant
CAD12455 +9.42 -3.81
U11 Alpha-1 microglobulin/inter alpha trypsin inhibitor precursor
HCHU +6.01 -3.63
U12 Alpha-1 microglobulin/inter alpha trypsin inhibitor precursor
HCHU +7.59 -4.21
U13 Alpha-1 microglobulin/inter alpha trypsin inhibitor precursor
HCHU +6.22 -2.81
The differentially expressed urine proteins from Figure 3 were analysed by DeCyder 2D v6.5 and identified by mass spectrometry. The table shows the spot intensity fold-changes in hepatitis E patients (HEV) compared to healthy controls (CON). A dye swap experiment is also shown. The "+" and "-" values indicate increased or decreased expression, respectively, in patients compared to controls.
Page 9 of 14(page number not for citation purposes)
Proteome Science 2009, 7:39 http://www.proteomesci.com/content/7/1/39
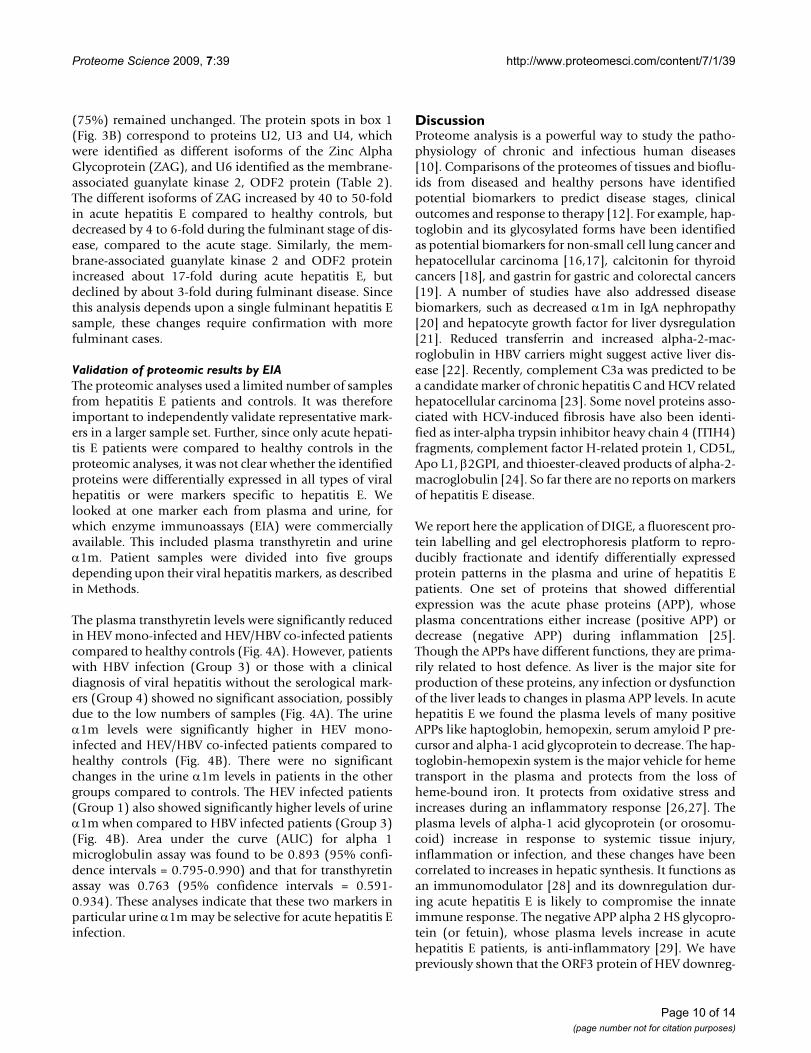
(75%) remained unchanged. The protein spots in box 1(Fig. 3B) correspond to proteins U2, U3 and U4, whichwere identified as different isoforms of the Zinc AlphaGlycoprotein (ZAG), and U6 identified as the membrane-associated guanylate kinase 2, ODF2 protein (Table 2).The different isoforms of ZAG increased by 40 to 50-foldin acute hepatitis E compared to healthy controls, butdecreased by 4 to 6-fold during the fulminant stage of dis-ease, compared to the acute stage. Similarly, the mem-brane-associated guanylate kinase 2 and ODF2 proteinincreased about 17-fold during acute hepatitis E, butdeclined by about 3-fold during fulminant disease. Sincethis analysis depends upon a single fulminant hepatitis Esample, these changes require confirmation with morefulminant cases.
Validation of proteomic results by EIAThe proteomic analyses used a limited number of samplesfrom hepatitis E patients and controls. It was thereforeimportant to independently validate representative mark-ers in a larger sample set. Further, since only acute hepati-tis E patients were compared to healthy controls in theproteomic analyses, it was not clear whether the identifiedproteins were differentially expressed in all types of viralhepatitis or were markers specific to hepatitis E. Welooked at one marker each from plasma and urine, forwhich enzyme immunoassays (EIA) were commerciallyavailable. This included plasma transthyretin and urineα1m. Patient samples were divided into five groupsdepending upon their viral hepatitis markers, as describedin Methods.
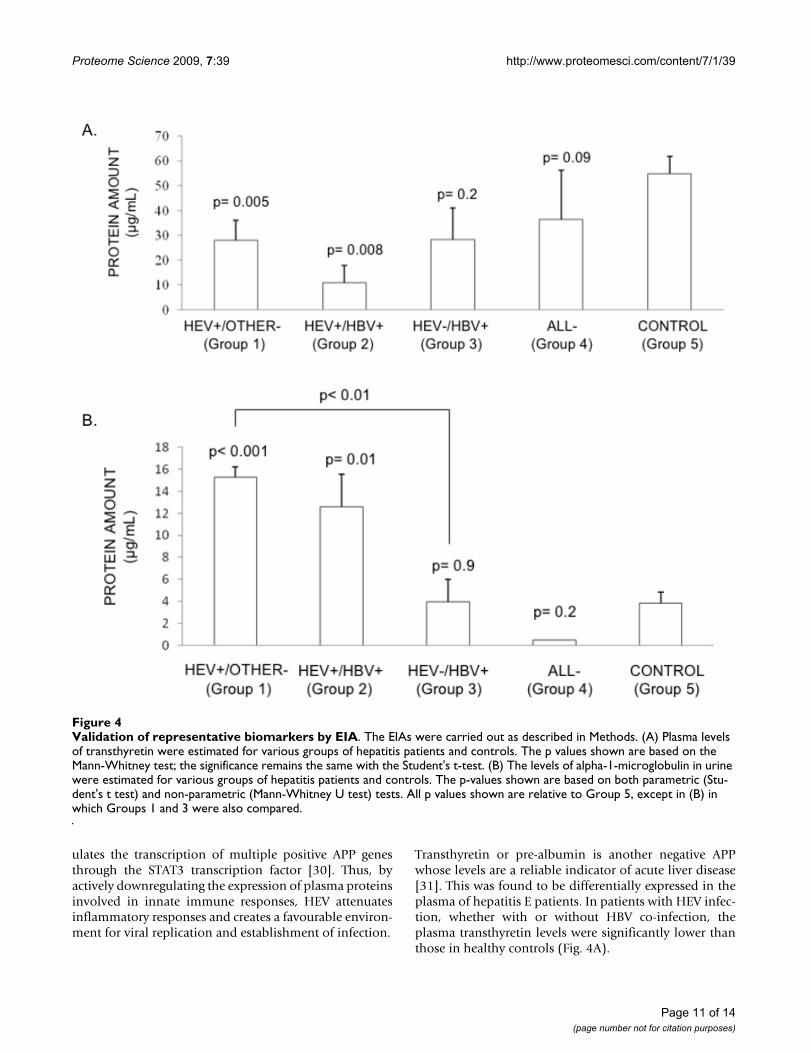
The plasma transthyretin levels were significantly reducedin HEV mono-infected and HEV/HBV co-infected patientscompared to healthy controls (Fig. 4A). However, patientswith HBV infection (Group 3) or those with a clinicaldiagnosis of viral hepatitis without the serological mark-ers (Group 4) showed no significant association, possiblydue to the low numbers of samples (Fig. 4A). The urineα1m levels were significantly higher in HEV mono-infected and HEV/HBV co-infected patients compared tohealthy controls (Fig. 4B). There were no significantchanges in the urine α1m levels in patients in the othergroups compared to controls. The HEV infected patients(Group 1) also showed significantly higher levels of urineα1m when compared to HBV infected patients (Group 3)(Fig. 4B). Area under the curve (AUC) for alpha 1microglobulin assay was found to be 0.893 (95% confi-dence intervals = 0.795-0.990) and that for transthyretinassay was 0.763 (95% confidence intervals = 0.591-0.934). These analyses indicate that these two markers inparticular urine α1m may be selective for acute hepatitis Einfection.
DiscussionProteome analysis is a powerful way to study the patho-physiology of chronic and infectious human diseases[10]. Comparisons of the proteomes of tissues and bioflu-ids from diseased and healthy persons have identifiedpotential biomarkers to predict disease stages, clinicaloutcomes and response to therapy [12]. For example, hap-toglobin and its glycosylated forms have been identifiedas potential biomarkers for non-small cell lung cancer andhepatocellular carcinoma [16,17], calcitonin for thyroidcancers [18], and gastrin for gastric and colorectal cancers[19]. A number of studies have also addressed diseasebiomarkers, such as decreased α1m in IgA nephropathy[20] and hepatocyte growth factor for liver dysregulation[21]. Reduced transferrin and increased alpha-2-mac-roglobulin in HBV carriers might suggest active liver dis-ease [22]. Recently, complement C3a was predicted to bea candidate marker of chronic hepatitis C and HCV relatedhepatocellular carcinoma [23]. Some novel proteins asso-ciated with HCV-induced fibrosis have also been identi-fied as inter-alpha trypsin inhibitor heavy chain 4 (ITIH4)fragments, complement factor H-related protein 1, CD5L,Apo L1, β2GPI, and thioester-cleaved products of alpha-2-macroglobulin [24]. So far there are no reports on markersof hepatitis E disease.
We report here the application of DIGE, a fluorescent pro-tein labelling and gel electrophoresis platform to repro-ducibly fractionate and identify differentially expressedprotein patterns in the plasma and urine of hepatitis Epatients. One set of proteins that showed differentialexpression was the acute phase proteins (APP), whoseplasma concentrations either increase (positive APP) ordecrease (negative APP) during inflammation [25].Though the APPs have different functions, they are prima-rily related to host defence. As liver is the major site forproduction of these proteins, any infection or dysfunctionof the liver leads to changes in plasma APP levels. In acutehepatitis E we found the plasma levels of many positiveAPPs like haptoglobin, hemopexin, serum amyloid P pre-cursor and alpha-1 acid glycoprotein to decrease. The hap-toglobin-hemopexin system is the major vehicle for hemetransport in the plasma and protects from the loss ofheme-bound iron. It protects from oxidative stress andincreases during an inflammatory response [26,27]. Theplasma levels of alpha-1 acid glycoprotein (or orosomu-coid) increase in response to systemic tissue injury,inflammation or infection, and these changes have beencorrelated to increases in hepatic synthesis. It functions asan immunomodulator [28] and its downregulation dur-ing acute hepatitis E is likely to compromise the innateimmune response. The negative APP alpha 2 HS glycopro-tein (or fetuin), whose plasma levels increase in acutehepatitis E patients, is anti-inflammatory [29]. We havepreviously shown that the ORF3 protein of HEV downreg-
Page 10 of 14(page number not for citation purposes)
Proteome Science 2009, 7:39 http://www.proteomesci.com/content/7/1/39
ulates the transcription of multiple positive APP genesthrough the STAT3 transcription factor [30]. Thus, byactively downregulating the expression of plasma proteinsinvolved in innate immune responses, HEV attenuatesinflammatory responses and creates a favourable environ-ment for viral replication and establishment of infection.
Transthyretin or pre-albumin is another negative APPwhose levels are a reliable indicator of acute liver disease[31]. This was found to be differentially expressed in theplasma of hepatitis E patients. In patients with HEV infec-tion, whether with or without HBV co-infection, theplasma transthyretin levels were significantly lower thanthose in healthy controls (Fig. 4A).
Validation of representative biomarkers by EIAFigure 4Validation of representative biomarkers by EIA. The EIAs were carried out as described in Methods. (A) Plasma levels of transthyretin were estimated for various groups of hepatitis patients and controls. The p values shown are based on the Mann-Whitney test; the significance remains the same with the Student's t-test. (B) The levels of alpha-1-microglobulin in urine were estimated for various groups of hepatitis patients and controls. The p-values shown are based on both parametric (Stu-dent's t test) and non-parametric (Mann-Whitney U test) tests. All p values shown are relative to Group 5, except in (B) in which Groups 1 and 3 were also compared.
Page 11 of 14(page number not for citation purposes)
Proteome Science 2009, 7:39 http://www.proteomesci.com/content/7/1/39
We also compared the urine proteomes of hepatitis Epatients and healthy controls. Urine is an easily availablenon-invasive analyte, which has been used extensively forthe diagnosis and monitoring of both renal and systemicdiseases [32]. Being a filtrate of blood, urine also carriesprotein components analogous to plasma, but with areduced diversity and dynamic range. The levels of α1mwere significantly higher in the urine of hepatitis Epatients compared to healthy controls and patients withother forms of acute viral hepatitis. Alpha-1-microglobu-lin is a 31-kDa glycoprotein, which is involved in defend-ing tissues against oxidation by heme, kynurenin andreactive oxygen species [33-35], and also functions as animmunosuppressor [35,36]. Elevated levels of α1m havealso been associated with renal tubular disorders [37]. Inearlier studies, the ORF3 protein of HEV was shown toexpedite the secretion of α1m from infected hepatocytes[38].
The levels of prostaglandin D2 synthase (PGD2S) werealso found to increase in the urine of hepatitis E patients.It is a lipocalin involved in the transport of bile pigments,retinoids, thyroid hormone, bilirubin and biliverdin, asalso a vasodilator produced by inflammatory cells (mastcells and macrophages), which suppresses the inductionof inducible nitric oxide (NO) synthase, resulting inreduced inflammation [39]. Though PGD2S levels inserum and urine have been investigated as an indicator ofrenal dysfunction [40,41], there are no reports linking itto viral hepatitis. Our proteomic observation of increasedlevels of PGD2S in the urine of hepatitis E patients awaitsfurther validation.
While a majority of HEV infections present as self-limitedacute hepatitis, occasional cases present as FHF. The levelsof zinc alpha glycoprotein (ZAG), membrane associatedguanylate kinase 2 and ODF2 were significantly lower inthe urine of a fulminant hepatitis E patient compared to apatient with mild hepatitis due to HEV. Interestingly,when compared to healthy persons, the levels of theseproteins are still higher in hepatitis E patients, but as thedisease takes a more severe fulminant form, they are par-tially cleared from the urine. Though the exact role of ZAGwith respect to viral disease has not been shown, it playsa role in lipolysis in adipocytes and is involved in the reg-ulation of body weight [42-44], besides being a solublenon-conventional major histocompatibility complexclass I molecule [45]. Whether ZAG, membrane associatedguanylate kinase 2 and ODF2 turn out to be potentialmarkers of fulminant hepatitis E, will await confirmationfrom the analysis of more fulminant cases.
We present here the first study to employ proteomic anal-ysis tools to look for potential biomarkers of hepatitis Edisease. Our results show both plasma and urine to be
analytes that are readily amenable to a differential proteinlabelling method such as DIGE followed by fractionationand mass spectrometric analysis. In a limited study wealso show validation of two potential biomarkers by EIA.We have also identified a number of host proteins that aredifferentially expressed during HEV infection, whichwould help better understand the biology of host-patho-gen interaction.
ConclusionThis study demonstrated that plasma and urine pro-teomes of hepatitis E patients were amenable to differen-tial labelling and proteomic analysis methods to discoversignatures of the host response to viral infection. Besidesidentifying a number of differentially expressed proteinsin the plasma and urine of hepatitis E patients, this studyalso showed that plasma transthyretin and urine α1mcould be reliable biomarkers of acute hepatitis E. Initialresults have also indicated urine proteome differences inpatients with mild and fulminant hepatitis E. Besides theutility of this approach to biomarker discovery, proteome-level changes in the biofluids of infected persons wouldalso guide towards a better understanding of host-virusinteraction and hepatitis E pathogenesis.
Competing interestsThe authors declare that they have no competing interests.
Authors' contributionsST and SJ planned the experiments; ST carried out theexperiments; SS did the mass spectrometric analyses; VKGand RA provided the clinical samples; RA helped with thestatistical analyses; ST and SJ wrote the manuscript. Allauthors read and approved the final manuscript.
Additional material
Additional file 1The table shows protein identification and database search parame-ters for the plasma and urine proteins.Click here for file[http://www.biomedcentral.com/content/supplementary/1477-5956-7-39-S1.XLS]
Additional file 2Spectra for single peptide assignments (TIFF files). These show the spectra for the protein identities with single peptide matches in the data-base.Click here for file[http://www.biomedcentral.com/content/supplementary/1477-5956-7-39-S2.TIFF]
Page 12 of 14(page number not for citation purposes)
Proteome Science 2009, 7:39 http://www.proteomesci.com/content/7/1/39
AcknowledgementsThis work was supported by a grant from the National Institutes of Health, USA (1R01AI076192) to SJ. ST received a NET Fellowship from CSIR, India. We thank B. Ravikumar at XCyton, Bangalore for the anti-HCV kits. We thank Dr. K.V.S. Rao and Dr. P. Sharma (ICGEB) for access to Ettan DIGE Scanner and DeCyder 2D v6.5 software, and Dr. S. Mukherjee (ICGEB) for the Typhoon Scanner.
References1. Purcell RH, Emerson SU: Hepatitis E Virus. In Fields Virology Edited
by: Knipe DM, Howley PM. Philadelphia: Lippincott Williams andWilkins; 2001:3051-3062.
2. International Committee for Taxonomy of Viruses; 2009proposals [http://talk.ictvonline.org/media/p/1194.aspx]
3. Matsuda H, Okada K, Takahashi K, Mishiro S: Severe hepatitis Evirus infection after ingestion of uncooked liver from a wildboar. J Infect Dis 2003, 188:944.
4. Tei S, Kitajima N, Ohara S, Inoue Y, Miki M, Yamatani T, Yamabe H,Mishiro S, Kinoshita Y: Consumption of uncooked deer meat asa risk factor for hepatitis E virus infection: an age- and sex-matched case-control study. J Med Virol 2004, 74:67-70.
5. Zheng Y, Ge S, Zhang J, Guo Q, Ng MH, Wang F, Xia N, Jiang Q:Swine as a principal reservoir of hepatitis E virus that infectshumans in eastern China. J Infect Dis 2006, 193:1643-1649.
6. Mansuy JM, Legrand-Abravanel F, Calot JP, Peron JM, Alric L, AgudoS, Rech H, Destruel F, Izopet J: High prevalence of anti-hepatitisE virus antibodies in blood donors from South West France.J Med Virol 2008, 80:289-293.
7. Panda SK, Jameel S: Hepatitis E virus: from epidemiology tomolecular biology. Vir Hep Rev 1997, 3:227-51.
8. Khuroo MS, Teli MR, Skidmore S, Sofi MA, Khuroo MI: Incidenceand severity of viral hepatitis in pregnancy. Am J Med 1981,70:252-255.
9. Patra S, Kumar A, Trivedi SS, Puri M, Sarin SK: Maternal and fetaloutcomes in pregnant women with acute hepatitis E virusinfection. Ann Intern Med 2007, 147:28-33.
10. Borman S: Proteomics: Taking over where genomics leavesoff. Chemical & Engineering News 2000, 78:31-7.
11. Conrads TP, Hood BL, Petricoin EF, Liotta LA, Veenstra TD: Cancerproteomics: many technologies, one goal. Expert Rev Proteomics2005, 2:693-703.
12. Petricoin E, Wulfkuhle J, Espina V, Liotta LA: Clinical proteomics:revolutionizing disease detection and patient tailoring ther-apy. J Proteome Res 2004, 3:209-217.
13. Patton WF: Detection technologies in proteome analysis. JChromatogr B Analyt Technol Biomed Life Sci 2002, 771:3-31.
14. Zhou G, Li H, DeCamp D, Chen S, Shu H, Gong Y, Flaig M, GillespieJW, Hu N, Taylor PR, et al.: 2D differential in-gel electrophoresisfor the identification of esophageal scans cell cancer-specificprotein markers. Mol Cell Proteomics 2002, 1:117-124.
15. Hammer O, Harper DAT, Ryan PD: PAST: Palaeontological Sta-tistics software package for education and data analysis. Pal-aeontologia Electronica 2001, 4(1):9.
16. Hoagland LFt, Campa MJ, Gottlin EB, Herndon JE, Patz EF Jr: Hap-toglobin and posttranslational glycan-modified derivatives asserum biomarkers for the diagnosis of nonsmall cell lungcancer. Cancer 2007, 110:2260-2268.
17. Ang IL, Poon TC, Lai PB, Chan AT, Ngai SM, Hui AY, Johnson PJ, SungJJ: Study of serum haptoglobin and its glycoforms in the diag-nosis of hepatocellular carcinoma: a glycoproteomicapproach. J Proteome Res 2006, 5:2691-2700.
18. Karanikas G, Moameni A, Poetzi C, Zettinig G, Kaserer K, BieglmayerC, Niederle B, Dudczak R, Pirich C: Frequency and relevance ofelevated calcitonin levels in patients with neoplastic and non-neoplastic thyroid disease and in healthy subjects. J Clin Endo-crinol Metab 2004, 89:515-519.
19. Triantafillidis JK, Tzourmakliotis D, Peros G, Merikas E, Barbatzas C,Cheracakis P, Gikas A, Konstandellou E: Serum gastrin levels inpatients with inflammatory bowel disease. Hepatogastroenterol-ogy 2003, 50(Suppl 2):cccxv-cccxvii.
20. Yokota H, Hiramoto M, Okada H, Kanno Y, Yuri M, Morita S, NaitouM, Ichikawa A, Katoh M, Suzuki H: Absence of increased alpha1-microglobulin in IgA nephropathy proteinuria. Mol Cell Pro-teomics 2007, 6:738-744.
21. Shiota G, Rhoads DB, Wang TC, Nakamura T, Schmidt EV: Hepato-cyte growth factor inhibits growth of hepatocellular carci-noma cells. Proc Natl Acad Sci USA 1992, 89:373-377.
22. Otegbayo JA, Arinola OG, Aje A, Oluwasola OA, Okiwelu OH, Sali-monu LS: Usefulness of acute phase proteins for monitoringdevelopment of hepatocellular carcinoma in hepatitis Bvirus carriers. West Afr J Med 2005, 24:124-127.
23. Lee IN, Chen CH, Sheu JC, Lee HS, Huang GT, Chen DS, Yu CY, WenCL, Lu FJ, Chow LP: Identification of complement C3a as a can-didate biomarker in human chronic hepatitis C and HCV-related hepatocellular carcinoma using a proteomicsapproach. Proteomics 2006, 6:2865-2873.
24. Gangadharan B, Antrobus R, Dwek RA, Zitzmann N: Novel serumbiomarker candidates for liver fibrosis in hepatitis Cpatients. Clin Chem 2007, 53:1792-1799.
25. Gabay C, Kushner I: Acute-phase proteins and other systemicresponses to inflammation. N Engl J Med 1999, 340:448-454.
26. Tolosano E, Fagoonee S, Hirsch E, Berger FG, Baumann H, Silengo L,Altruda F: Enhanced splenomegaly and severe liver inflamma-tion in haptoglobin/hemopexin double-null mice after acutehemolysis. Blood 2002, 100:4201-4208.
27. Tolosano E, Altruda F: Hemopexin: structure, function, andregulation. DNA Cell Biol 2002, 21:297-306.
28. Fournier T, Medjoubi NN, Porquet D: Alpha-1-acid glycoprotein.Biochim Biophys Acta 2000, 1482:157-171.
29. Wang H, Zhang M, Bianchi M, Sherry B, Sama A, Tracey KJ: Fetuin(alpha2-HS-glycoprotein) opsonizes cationic macrophage-deactivating molecules. Proc Natl Acad Sci USA 1998,95:14429-14434.
30. Chandra V, Kar-Roy A, Kumari S, Mayor S, Jameel S: The hepatitisE virus ORF3 protein modulates epidermal growth factorreceptor trafficking, STAT3 translocation, and the acute-phase response. J Virol 2008, 82:7100-7110.
31. Yasmin MY, Aziz B, Nazim M, Madhavan RK: Prealbumin ratherthan albumin is a more sensitive indicator of acute liver dis-ease. Malays J Pathol 1993, 15:147-150.
32. Pisitkun T, Johnstone R, Knepper MA: Discovery of urinarybiomarkers. Mol Cell Proteomics 2006, 5:1760-71.
33. Sala A, Campagnoli M, Perani E, Romano A, Labo S, Monzani E, Min-chiotti L, Galliano M: Human alpha-1-microglobulin is cova-lently bound to kynurenine-derived chromophores. J BiolChem 2004, 279:51033-51041.
Additional file 3Spectra for single peptide assignments (TIFF files). These show the spectra for the protein identities with single peptide matches in the data-base.Click here for file[http://www.biomedcentral.com/content/supplementary/1477-5956-7-39-S3.TIFF]
Additional file 4Spectra for single peptide assignments (TIFF files). These show the spectra for the protein identities with single peptide matches in the data-base.Click here for file[http://www.biomedcentral.com/content/supplementary/1477-5956-7-39-S4.TIFF]
Additional file 5Spectra for single peptide assignments (TIFF files). These show the spectra for the protein identities with single peptide matches in the data-base.Click here for file[http://www.biomedcentral.com/content/supplementary/1477-5956-7-39-S5.TIFF]
Page 13 of 14(page number not for citation purposes)
Proteome Science 2009, 7:39 http://www.proteomesci.com/content/7/1/39
Publish with BioMed Central and every scientist can read your work free of charge
"BioMed Central will be the most significant development for disseminating the results of biomedical research in our lifetime."
Sir Paul Nurse, Cancer Research UK
Your research papers will be:
available free of charge to the entire biomedical community
peer reviewed and published immediately upon acceptance
cited in PubMed and archived on PubMed Central
yours — you keep the copyright
Submit your manuscript here:http://www.biomedcentral.com/info/publishing_adv.asp
BioMedcentral
34. Olsson MG, Allhorn M, Olofsson T, Akerstrom B: Up-regulation ofalpha1-microglobulin by hemoglobin and reactive oxygenspecies in hepatoma and blood cell lines. Free Radic Biol Med2007, 42:842-851.
35. Berggard T, Oury TD, Thogersen IB, Akerstrom B, Enghild JJ:Alpha1-microglobulin is found both in blood and in most tis-sues. J Histochem Cytochem 1998, 46:887-894.
36. Falkenberg C, Blom A, Fries E, Ekstrom G, Sarnstrand B, Salier JP,Akerstrom B: Alpha1-microglobulin and bikunin in rats withcollagen II-induced arthritis: plasma levels and liver mRNAcontent. Scand J Immunol 1997, 46:122-128.
37. Yu H, Yanagisawa Y, Forbes MA, Cooper EH, Crockson RA, MacLen-nan IC: Alpha-1-microglobulin: an indicator protein for renaltubular function. J Clin Pathol 1983, 36:253-259.
38. Tyagi S, Surjit M, Roy AK, Jameel S, Lal SK: The ORF3 protein ofhepatitis E virus interacts with liver-specific alpha1-microglobulin and its precursor alpha1-microglobulin/bikunin precursor (AMBP) and expedites their export fromthe hepatocyte. J Biol Chem 2004, 279:29308-29319.
39. Nagoshi H, Uehara Y, Kanai F, Maeda S, Ogura T, Goto A, Toyo-okaT, Esumi H, Shimizu T, Omata M: Prostaglandin D2 inhibitsinducible nitric oxide synthase expression in rat vascularsmooth muscle cells. Circ Res 1998, 82:204-209.
40. Hoffmann A, Nimtz M, Conradt HS: Molecular characterizationof beta-trace protein in human serum and urine: a potentialdiagnostic marker for renal diseases. Glycobiology 1997,7:499-506.
41. Melegos DN, Grass L, Pierratos A, Diamandis EP: Highly elevatedlevels of prostaglandin D synthase in the serum of patientswith renal failure. Urology 1999, 53:32-37.
42. Burgi W, Schmid K: Preparation and properties of Zn-alpha 2-glycoprotein of normal human plasma. J Biol Chem 1961,236:1066-1074.
43. Hirai K, Hussey HJ, Barber MD, Price SA, Tisdale MJ: Biologicalevaluation of a lipid-mobilizing factor isolated from the urineof cancer patients. Cancer Res 1998, 58:2359-2365.
44. Bing C, Bao Y, Jenkins J, Sanders P, Manieri M, Cinti S, Tisdale MJ,Trayhurn P: Zinc-alpha2-glycoprotein, a lipid mobilizing fac-tor, is expressed in adipocytes and is up-regulated in micewith cancer cachexia. Proc Natl Acad Sci USA 2004,101:2500-2505.
45. Rolli V, Radosavljevic M, Astier V, Macquin C, Castan-Laurell I, Visen-tin V, Guigne C, Carpene C, Valet P, Gilfillan S, Bahram S: Lipolysisis altered in MHC class I zinc-alpha(2)-glycoprotein deficientmice. FEBS Lett 2007, 581:394-400.
Page 14 of 14(page number not for citation purposes)