Embed Size (px)
Citation preview
CHAPTER 2
Ion Activation and Mass Analysisin Protein Mass Spectrometry
CHENG LIN and PETER O’CONNOR
In this chapter we consider the various methods of activation that can be used to
fragment peptide and protein ions and thereby be used to determine their amino-acid
sequences. After a brief introduction to the terms important in mass spectrometry
(MS) analysis, we describe the methods used to activate peptide and protein ions for
sequencing by MS. This section is followed by a discussion of mass analysis,
particularly as it applies to the MS/MS experiment.
2.1 INTRODUCTION
A mass analyzer is the heart of a mass spectrometer, where ions are separated
according to their mass-to-charge ratios (m/z). Althoughm/z has a dimension of mass
over charge, it is often expressed as a dimensionless number in the MS literature,
where the mass is measured in the unified atomic mass unit, u, or dalton (Da), 1
u� 1.66� 10�27 kg, and the charge is measured as number of elementary charges, e,
1 e� 1.602� 10�19 coulombs. The performance of a mass analyzer is characterized
by a number of parameters, including its mass accuracy, mass resolving power, mass
range, scan speed, and tandem MS analysis capability.
2.1.1 Mass Accuracy
Mass accuracy describes the ability of the mass analyzer to measure the correct mass
(m/z) of an ion, and precision is a measure of the ability to reproduce the mass
measurement. Mass accuracy may be expressed as an absolute number, typically in
mDa’s, representing the difference between the theoretical and the measured masses.
Protein and Peptide Mass Spectrometry in Drug Discovery, Edited by Michael L. Gross, Guodong Chen,and Birendra N. Pramanik.� 2012 John Wiley & Sons, Inc. Published 2012 by John Wiley & Sons, Inc.
43
It is also frequently given as the relative ratio of this mass difference to the theoretical
mass value, in parts per million (ppm). Mass accuracy is closely related to the mass
resolving power of themass analyzer. For example, a low resolving power instrument,
such as a quadrupole ion trap (QIT) mass spectrometer, can only provide a typical
mass accuracy of approximately 100 ppm, whereas a high-end Fourier-transform ion
cyclotron resonance (FTICR) mass spectrometer can routinely achieve a mass
accuracy in the sub-ppm range. Other factors that affect the mass accuracy include
the stability of the instrument, mass calibration, and the peak centroid determination.
2.1.2 Mass Resolving Power
Mass resolving power is the ability of a mass analyzer to separate ions with closely
spaced m/z values. For an isolated peak the mass resolving power (RP) can be
calculated using the formula
RP ¼ m=z
Dðm=zÞFWHM
; ð2:1Þ
where D(m/z)FWHM is the full width of the peak at its half maximum, but it can also be
substituted by the peak width at other fractions of the peak maximum.Mass resolving
power may also be calculated using adjacent overlapping peaks. In this definition the
D(m/z)FWHM of equation 2.1 is replaced by Dm, or the mass resolution, which is the
smallest mass difference between two equal magnitude peaks so that the valley
between them is a specific fraction of the peak height. For Gaussian shaped peaks, a
50% valley exists when Dm is approximately 141% of the D(m/z)FWHM value. An
immediate consequence of poor mass resolving power is the inability to determine
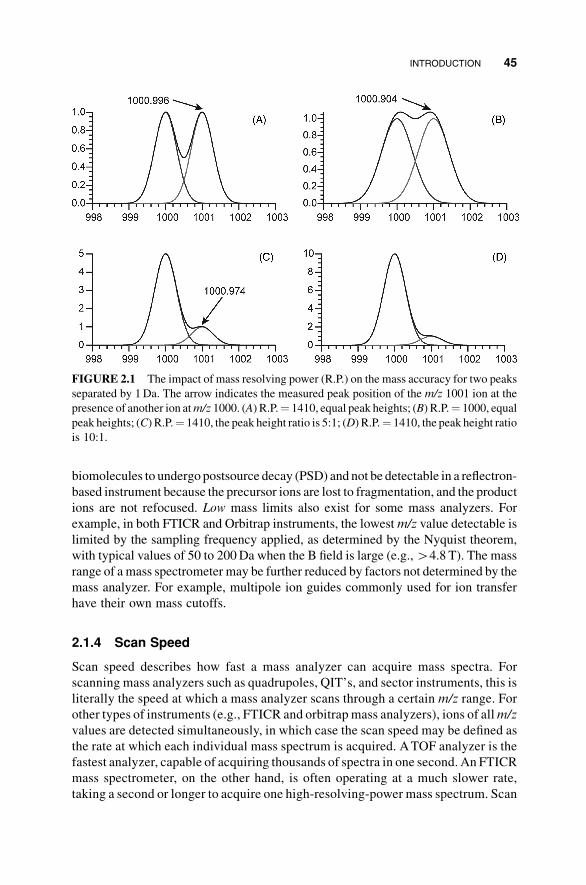
the peak position accurately in the presence of nearby peaks. Figure 2.1 illustrates the
effect of mass resolving power on the obtainable mass accuracy. For two Gaussian
shaped peaks (Figure 2.1) of equal height for ions of m/z 1000 and 1001, a mass
resolving power of 1000 results in close to a 100-mDa difference between the
observed and actual peak positions (Figure 2.1B), whereas a slight increase of RP
to 1410 improves the mass accuracy to around 4mDa (Figure 2.1A). This overlapping
problem is more severe when the nearby peak is of a higher intensity than the peak of
interest. When the “interfering” peak atm/z 1000 is five times as intense as the one of
interest atm/z 1001 and the RP is still 1410, the peak position of the latter is shifted by
26mDa (Figure 2.1C); when that ratio increases to 10, the valley disappears, and the
m/z 1001 peak cannot be identified in the spectrum (Figure 2.1D).
2.1.3 Mass Range
The mass range of a mass analyzer is the range of m/z values an ion can have to be
detected. Quadrupole mass analyzers, magnetic sectors, and quadrupole ion traps can
typically scan up to around m/z 4000, whereas FTICR mass analyzers can easily
detect ions of m/z value over 10,000. A linear time-of-flight (TOF) analyzer has no
upper mass limit in principle, but the practical upper mass limit of a reflectron TOF
instrument is approximately 10,000; the limit is due to the tendency of large
44 ION ACTIVATION AND MASS ANALYSIS IN PROTEIN MASS SPECTROMETRY
biomolecules to undergo postsource decay (PSD) and not be detectable in a reflectron-
based instrument because the precursor ions are lost to fragmentation, and the product
ions are not refocused. Low mass limits also exist for some mass analyzers. For
example, in both FTICR and Orbitrap instruments, the lowestm/z value detectable is
limited by the sampling frequency applied, as determined by the Nyquist theorem,
with typical values of 50 to 200Da when the B field is large (e.g.,44.8 T). The mass
range of a mass spectrometer may be further reduced by factors not determined by the
mass analyzer. For example, multipole ion guides commonly used for ion transfer
have their own mass cutoffs.
2.1.4 Scan Speed
Scan speed describes how fast a mass analyzer can acquire mass spectra. For
scanning mass analyzers such as quadrupoles, QIT’s, and sector instruments, this is
literally the speed at which a mass analyzer scans through a certain m/z range. For
other types of instruments (e.g., FTICR and orbitrap mass analyzers), ions of allm/z
values are detected simultaneously, in which case the scan speed may be defined as
the rate at which each individual mass spectrum is acquired. ATOF analyzer is the
fastest analyzer, capable of acquiring thousands of spectra in one second. An FTICR
mass spectrometer, on the other hand, is often operating at a much slower rate,
taking a second or longer to acquire one high-resolving-power mass spectrum. Scan
FIGURE 2.1 The impact of mass resolving power (R.P.) on the mass accuracy for two peaks
separated by 1Da. The arrow indicates the measured peak position of the m/z 1001 ion at the
presence of another ion atm/z 1000. (A) R.P.¼ 1410, equal peak heights; (B) R.P.¼ 1000, equal
peak heights; (C) R.P.¼ 1410, the peak height ratio is 5:1; (D) R.P.¼ 1410, the peak height ratio
is 10:1.
INTRODUCTION 45
speed is particularly important when the mass analysis is performed in conjunction
with online separation techniques such as high-performance liquid chromatography
(HPLC) or ionmobility, where analytes of interest are eluting only for a short period
of time. For a given mass analyzer, there is often a trade-off between scan speed and
mass resolving power, and accuracy.
2.1.5 Tandem MS Analysis
Tandem MS analysis refers to the process where a selected ion of interest (called the
precursor ion) is isolated and dissociated to generate fragment ions whosem/z values
are then measured. The masses of the fragment ions can be used to elucidate the
structure of the precursor ion or, as is relevant to this book, sequence peptides and
proteins. TandemMSexperimentsmay be performed tandem in space, which requires
the use of two separate, physically distinct mass analyzers, such as those done in a
triple quadrupole instrument or in a TOF-TOF mass spectrometer. It may also be
performed tandem in time, in which case isolation of the precursor ion and mass
analysis of the fragment ions are achieved using the same mass analyzer, but the
events of isolation, activation, and analysis are separated in time. This is usually done
in trap instruments, such as a QIT or an FTICR mass spectrometer.
Tandem MS analysis may be performed once (MS/MS), or multiple times
consecutively, with each of theMS/MS experiments done on a fragment ion generated
in the previous MS/MS step (this is known as theMSn experiment). MSn experiments
produce feature rich fingerprints of the precursor ion by providing detailed structural
information on each of the isolated fragment ions from the product-ion spectrum
acquired in an MSn�1 experiment, making them a valuable tool in metabolite
identification in drug discovery. In addition, when a product-ion spectrum is domi-
nated by just a few fragments resulting from facile cleavages, MS3 experiments are
often needed to generate more complete structural information of the precursor ion.
MSn experiments are also used to characterize carbohydrate structural isomers, based
on sequential losses of different derivatized monosaccharide units that carry frag-
mentation “scars” throughout the MSn tree [1]. MSn (n4 2) experiments can best be
performed in trapping instruments.
In tandemMS experiments, it is usually necessary to activate the precursor ion first
to induce fragmentation. Ion activation can be achieved in many ways: via collisions
with gases or surfaces, absorption of IR or UV photons, or activation by ion–electron
interactions [2].
2.2 ION ACTIVATION AND TANDEM MS ANALYSIS
2.2.1 Introduction: Fragmentation in Protein MS
Before we get into the details of various ion activation methods, it is helpful to look at
what fragment ions may be produced in tandem MS experiments of peptide ions, and
how this information can be used for their structural characterization. Throughout the
46 ION ACTIVATION AND MASS ANALYSIS IN PROTEIN MASS SPECTROMETRY
discussions in this section, the term peptide will be used in place of peptide/protein, as
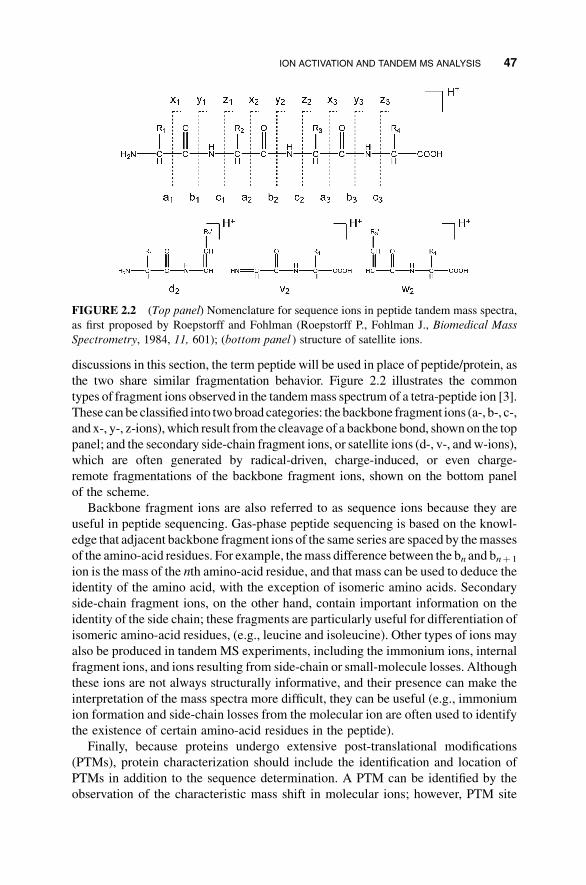
the two share similar fragmentation behavior. Figure 2.2 illustrates the common
types of fragment ions observed in the tandemmass spectrum of a tetra-peptide ion [3].
These can be classified into twobroad categories: the backbone fragment ions (a-, b-, c-,
and x-, y-, z-ions),which result from the cleavage of a backbone bond, shownon the top
panel; and the secondary side-chain fragment ions, or satellite ions (d-, v-, andw-ions),
which are often generated by radical-driven, charge-induced, or even charge-
remote fragmentations of the backbone fragment ions, shown on the bottom panel
of the scheme.
Backbone fragment ions are also referred to as sequence ions because they are
useful in peptide sequencing. Gas-phase peptide sequencing is based on the knowl-
edge that adjacent backbone fragment ions of the same series are spaced by themasses
of the amino-acid residues. For example, themass difference between the bn and bnþ 1
ion is the mass of the nth amino-acid residue, and that mass can be used to deduce the
identity of the amino acid, with the exception of isomeric amino acids. Secondary
side-chain fragment ions, on the other hand, contain important information on the
identity of the side chain; these fragments are particularly useful for differentiation of
isomeric amino-acid residues, (e.g., leucine and isoleucine). Other types of ions may
also be produced in tandem MS experiments, including the immonium ions, internal
fragment ions, and ions resulting from side-chain or small-molecule losses. Although
these ions are not always structurally informative, and their presence can make the
interpretation of the mass spectra more difficult, they can be useful (e.g., immonium
ion formation and side-chain losses from the molecular ion are often used to identify
the existence of certain amino-acid residues in the peptide).
Finally, because proteins undergo extensive post-translational modifications
(PTMs), protein characterization should include the identification and location of
PTMs in addition to the sequence determination. A PTM can be identified by the
observation of the characteristic mass shift in molecular ions; however, PTM site
FIGURE 2.2 (Top panel) Nomenclature for sequence ions in peptide tandem mass spectra,
as first proposed by Roepstorff and Fohlman (Roepstorff P., Fohlman J., Biomedical Mass
Spectrometry, 1984, 11, 601); (bottom panel ) structure of satellite ions.
ION ACTIVATION AND TANDEM MS ANALYSIS 47
location usually requires tandem MS experiments. Thus it is advantageous to retain
PTMs during ion activation and backbone bond breakage so that the PTMmass “tags”
the fragment ions to which it is attached, allowing successive localization in further
stages of MSn.
2.2.2 Collisional Activation Methods
Collisionally activated dissociation (CAD), or collision-induced dissociation (CID),
is by far the most commonly applied ion activation method in tandem MS analysis.
In a CAD experiment the precursor ion is allowed to collide with neutral gas
molecules, resulting in energy transfer and ultimately internal excitation of the
precursor ion [4–6]. Collisional activation can be achieved with a single high-energy
(typically41000 eV) collision, or with many low-energy (51 to 100 eV) collisions.
Low-energy CAD is usually implemented in trapping instruments; examples are
linear trapping quadrupoles (Q-CAD), quadrupole ion traps, and FTICR mass
spectrometers (as in sustained off-resonance irradiation, or SORI-CAD) [7–10].
Although the peptide ion has been accelerated to a kinetic energy upward to 100 eV in
the laboratory frame, it is the collisional energy in the center-of-mass frame (ECOM)
that determines the maximum amount of energy that can be transferred to excite an
ion’s internal ro-vibrational modes. Because commonly used collision partners (e.g.,
He, N2, or Ar) are much lighter than a typical peptide ion, ECOM is often orders of
magnitude smaller, as calculated by equation 2.2, wherem is the mass of the collision
gas, M is the mass of the ion to be activated, and ELab is the laboratory energy:
ECOM ¼ m
mþMELab: ð2:2Þ
Thus, a heavier collision gas such asAr orN2 is frequently used in low energyCAD,
as these gases allow a more efficient transfer of energy than does the lighter helium.
Low-energy CAD is generally considered an “ergodic” or “slow-heating”
fragmentation method, where the term “slow” is used relative to the rate of intra-
molecular vibrational energy redistribution (IVR). In low-energy CAD experiments
ion activation is achieved via multiple collisions, each depositing a small amount of
energy into the precursor ion. Because the bond dissociation is preceded by the energy
randomization, fragmentation rarely occurs at a site where the energy was first
deposited in the collision. Instead, when the overall energy of the ion is raised above a
certain dissociation threshold (activation barrier), fragmentationmay occur, typically
resulting in the rupture of theweakest bondwithin themolecule. For peptide ions, this
is usually the amide bond, leading to the formation of b- and y-ions.
Given that direct amide bond cleavage requires the precursor ion to be excited
to a substantially higher level than typically achievable in a low-energy CAD
experiment, a “mobile proton” model can explain the b/y fragmentation pathway
(Scheme 2.1) [11,12]. In essence, the fragmentation is initiated by the attachment or
movement of a mobile proton to the oxygen or the nitrogen of the amide bond to be
cleaved (the scheme shows the proton attachment to the amide nitrogen); the proton
attachment not only weakens the amide bond but also increases the electrophilicity of
48 ION ACTIVATION AND MASS ANALYSIS IN PROTEIN MASS SPECTROMETRY
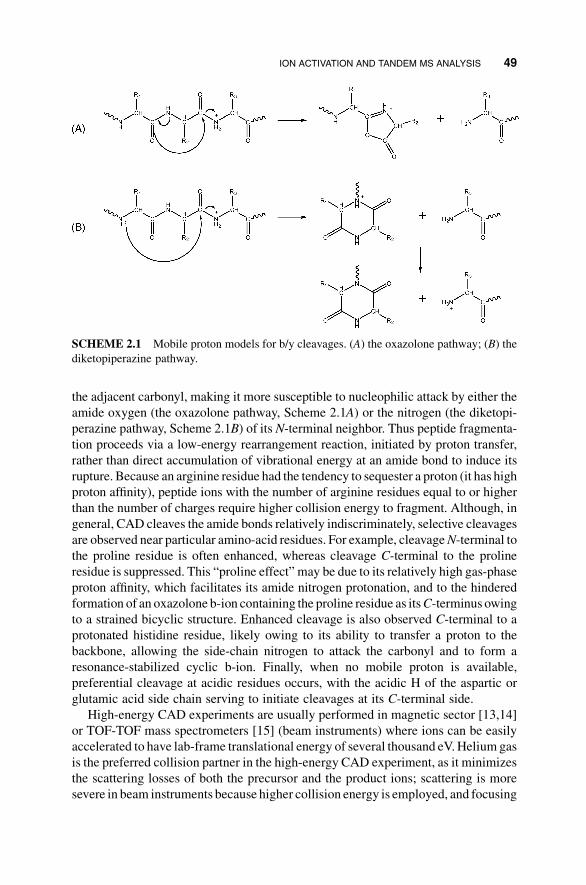
the adjacent carbonyl, making it more susceptible to nucleophilic attack by either the
amide oxygen (the oxazolone pathway, Scheme 2.1A) or the nitrogen (the diketopi-
perazine pathway, Scheme 2.1B) of its N-terminal neighbor. Thus peptide fragmenta-
tion proceeds via a low-energy rearrangement reaction, initiated by proton transfer,
rather than direct accumulation of vibrational energy at an amide bond to induce its
rupture. Because an arginine residue had the tendency to sequester a proton (it has high
proton affinity), peptide ions with the number of arginine residues equal to or higher
than the number of charges require higher collision energy to fragment. Although, in
general, CAD cleaves the amide bonds relatively indiscriminately, selective cleavages
are observed near particular amino-acid residues. For example, cleavageN-terminal to
the proline residue is often enhanced, whereas cleavage C-terminal to the proline
residue is suppressed. This “proline effect” may be due to its relatively high gas-phase
proton affinity, which facilitates its amide nitrogen protonation, and to the hindered
formation of an oxazolone b-ion containing the proline residue as itsC-terminus owing
to a strained bicyclic structure. Enhanced cleavage is also observed C-terminal to a
protonated histidine residue, likely owing to its ability to transfer a proton to the
backbone, allowing the side-chain nitrogen to attack the carbonyl and to form a
resonance-stabilized cyclic b-ion. Finally, when no mobile proton is available,
preferential cleavage at acidic residues occurs, with the acidic H of the aspartic or
glutamic acid side chain serving to initiate cleavages at its C-terminal side.
High-energy CAD experiments are usually performed in magnetic sector [13,14]
or TOF-TOF mass spectrometers [15] (beam instruments) where ions can be easily
accelerated to have lab-frame translational energy of several thousand eV.Helium gas
is the preferred collision partner in the high-energy CAD experiment, as it minimizes
the scattering losses of both the precursor and the product ions; scattering is more
severe in beam instruments because higher collision energy is employed, and focusing
SCHEME 2.1 Mobile proton models for b/y cleavages. (A) the oxazolone pathway; (B) the
diketopiperazine pathway.
ION ACTIVATION AND TANDEM MS ANALYSIS 49
methods are sparse. These focusing methods are available when collisions are carried
out in a multiple ion guide/trap. In high-energy CAD spectra, in addition to the b- and
y-type ions and/or small-molecule losses, abundant immonium ions, internal ions
and secondary fragments such as d- and w-type ions are also readily produced, the
latter of which provide useful information for side-chain differentiations [13,16].
Despite its wide implementation, CAD also has several drawbacks. One of its
major limitations is its poor applicability in PTM analysis. Many PTMs are more
labile than the backbone amide bond and are the first to fall off (whether via direct
scission or a rearrangement is not clear) when the ions are collisionally activated; this
makes PTM location a challenging task. In addition, when a labile group is present in a
peptide or protein, the CAD spectrum is often dominated by a fragment ion produced
by loss of the PTM. This loss preempts peptide bond cleavages, causing fewer
backbone fragments to form. Likewise, when a particularly labile dissociation
channel exists, such as the b/y cleavage at theAsp-Pro sequence or loss of a phosphate,
other fragmentation channels may also be suppressed, resulting in poor sequence
coverage. Furthermore, sequence scrambling can occur in CAD experiments, in
which an oxazolone b-ion can cyclize and reopen at different position; such processes
give a product that, upon further activation, can produce misleading sequence
ions [17,18]. The use of a collisional gas in CAD can compromise the high vacuum
of the spectrometer, and the gas may need to be pumped away before mass analysis,
particularly in an FTICR instrument. The pump-down time results in longer spectral
acquisition time and reduced throughputs. AdditionallyCADhas limits in quadrupole
ion traps and linear ion traps because the resonant excitation raises the low-mass
cutoff of the instrument (discussed below in Section 2.3).
Alternatively, collisional activation can be achieved by ion/surface collisions
without the use of collision gases, as implemented in surface-induced dissociation
(SID) [19,20]. In general, SID produces product-ion spectra that are similar to those
generated by CAD. Higher ratios of a- to b-ions and enhanced immonium-ion
formation, however, also occur, and this is indicative of increased access to higher
energy and secondary fragmentation channels. Unlike low-energy CAD, ion activa-
tion in SID is achieved in a single collision, rather than being slowly heated via
multiple collisions until the dissociation threshold is reached. The effective neutral
partner mass of the surface in SID (m in equation 2.2) is also much higher than that of
collisional gases, leading to a higher center-of-mass collision energy available for ion
excitation. The efficiency of translational-to-internal energy conversion for SID
depends on the kinetic energy, the size of the precursor ions, and the nature of the
surface. The most commonly used surface is metallic with a nonconducting fluori-
nated, self-assembled monolayer (SAM) to minimize ion neutralization. SID can be
implemented in a variety of mass spectrometers, including the tandem quadrupole,
TOF-reflectron, Q-TOF, and FTICR instruments [21–23].
2.2.3 Photodissociation
Peptide ions may be optically excited as well. Photodissociation (PD) is best applied
to trapped ions to allow for sufficient ion/photon interaction time, hence indicating as
50 ION ACTIVATION AND MASS ANALYSIS IN PROTEIN MASS SPECTROMETRY
instruments linear ion traps [24] or FTICR mass spectrometers [25], although
photodissociation in TOF/TOF instruments [26] can also be useful. Photodissociation
offers several advantages over CAD, including ease of implementation, better control
of energy inputs, and selectivity based on the absorption spectra of precursor ions. For
photodissociation in an FTICR instrument, the gas-free operation can dramatically
reduce the MS/MS spectral acquisition timewithout deteriorating the vacuum, which
is needed for high-resolving-power mass analysis. Compared to SORI-CAD experi-
ments, which excite ions over a narrow m/z window over time, all precursor ions of
interest and in different charge states are dissociated simultaneously in a single
photodissociation event. For photodissociation in a linear or quadrupole ion trap, there
is no low-mass cutoff because no translational excitation of the precursor ions is
involved, and removing the need for translational activation also minimizes scatter-
ing. Finally, because all product ions are produced either on axis (as in linear ion traps)
or in the center of the trap (as in FTICRs), MSn experiments can be easily performed.
Infrared Multiphoton Dissociation The photons may originate from back-
ground blackbody irradiation, as in the blackbody infrared radiative dissociation
(BIRD) experiment [27], or from a laser, with wavelengths ranging from the mid-
infrared (IR) region to the vacuum ultraviolet (VUV) end of the spectrum. The most
commonly used IR laser is the continuous wave (cw) CO2 laser operating at 10.6 mm,
which vibrationally excites peptide ions, for example. Given that a 10.6-mm photon
has an energy of around 0.117 eV, or 11.3 kJ/mol, whereas a typical chemical bond has
a bond dissociation energy (BDE) of around 400 kJ/mol, absorption of hundreds or
even thousands of IR photons is necessary before fragmentation occurs. Thus, as for
low-energyCAD, infraredmultiphoton dissociation (IRMPD) also “heats” slowly the
ionswith IVRpreceding bond dissociation.As a result IRMPDof peptide ions yields a
fragment pattern similar to that of CAD, with the exception that, because fragment
ions from IRMPD can continue to absorb photons and further fragment, secondary
fragmentation is enhanced, for good or bad.
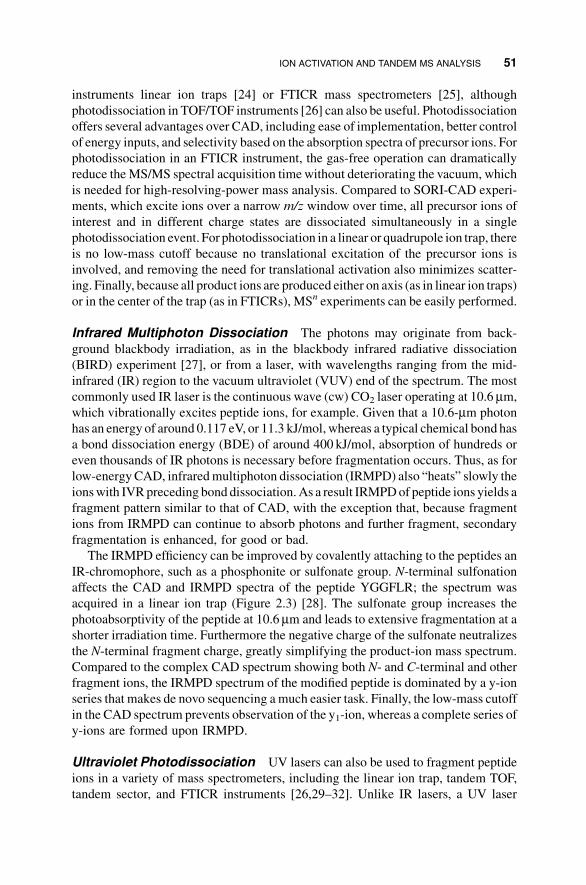
The IRMPD efficiency can be improved by covalently attaching to the peptides an
IR-chromophore, such as a phosphonite or sulfonate group. N-terminal sulfonation
affects the CAD and IRMPD spectra of the peptide YGGFLR; the spectrum was
acquired in a linear ion trap (Figure 2.3) [28]. The sulfonate group increases the
photoabsorptivity of the peptide at 10.6mm and leads to extensive fragmentation at a
shorter irradiation time. Furthermore the negative charge of the sulfonate neutralizes
the N-terminal fragment charge, greatly simplifying the product-ion mass spectrum.
Compared to the complex CAD spectrum showing both N- and C-terminal and other
fragment ions, the IRMPD spectrum of the modified peptide is dominated by a y-ion
series that makes de novo sequencing amuch easier task. Finally, the low-mass cutoff
in the CAD spectrum prevents observation of the y1-ion, whereas a complete series of
y-ions are formed upon IRMPD.
Ultraviolet Photodissociation UV lasers can also be used to fragment peptide
ions in a variety of mass spectrometers, including the linear ion trap, tandem TOF,
tandem sector, and FTICR instruments [26,29–32]. Unlike IR lasers, a UV laser
ION ACTIVATION AND TANDEM MS ANALYSIS 51
excites the peptide ions electronically. Electronic excitations are “vertical” excita-
tions that occur on a femtosecond time scale, shorter than a vibrational period.
Moreover, a UV photon contains much higher energy than an IR photon (e.g., a
193 nm photon has an energy of�620 kJ/mol, enough to break most covalent bonds).
Therefore, it is possible for dissociation induced by a single UV photon absorption to
occur rapidly prior to the IVR. As such, UV photodissociation may produce spectra
that are dramatically different from and complementary to either low-energy CAD or
IRMPD spectra. Fast absorption of high energy also permits the UVPD method to be
coupled to beam-type instruments.
CommonUV lasers employed to fragment peptide ions include excimer lasers and
various harmonics of the Nd:YAG laser. The 266 nm light (the third harmonic of the
Nd:YAG laser output, or Y4) is absorbed strongly by the side chains of tryptophan,
tyrosine, and phenylalanine and fragments peptide ions containing these chromo-
phores [32]. A near-UV chromophore may also be covalently or noncovalently
attached to the peptide ions, which enables photodissociation at longer wavelengths,
such as the 355-nm light from the Nd:YAG laser (the second harmonic, Y3) [33]. In
either case, as the absorption occurs locally at specific chromophores, the energymust
be redistributed before extensive backbone fragmentations may occur, which results
in a general fragmentation pattern similar to that observed in CAD, with enhanced
fragmentation near the chromophores. Unusual fragmentations generating radical
FIGURE 2.3 ESI-MS/MS mass spectra of YGGFLR. (A) CAD of unmodified peptide;
(B) CAD of N-terminal sulfonated peptide; (C) IRMPD of N-terminal sulfonated peptide.
Magnification scales apply to all spectra along themass range indicated.Adaptedwithpermission
from American Chemical Society (Wilson J. J., Brodbelt J. S., Anal. Chem. 2006, 78, 6855).
52 ION ACTIVATION AND MASS ANALYSIS IN PROTEIN MASS SPECTROMETRY
products sometimes occur, and are attributed to direct fragmentation near the
chromophores.
A second UVPD approach is to choose a wavelength absorbed by a universal
chromophore such as the backbone amide bond. The amide bond has several UV
absorption bands centered at near 190 nm and near 160 nm, both of which are readily
accessible with excimer lasers (ArF: 193 nm, F2: 157 nm) [34]. Of the two wave-
lengths, the 193 nm is more convenient, primarily because it can travel through air
with only small absorption [35]. Light of 157 nm must be transmitted either through
vacuum or an inert-gas-protected environment because it is strongly absorbed by
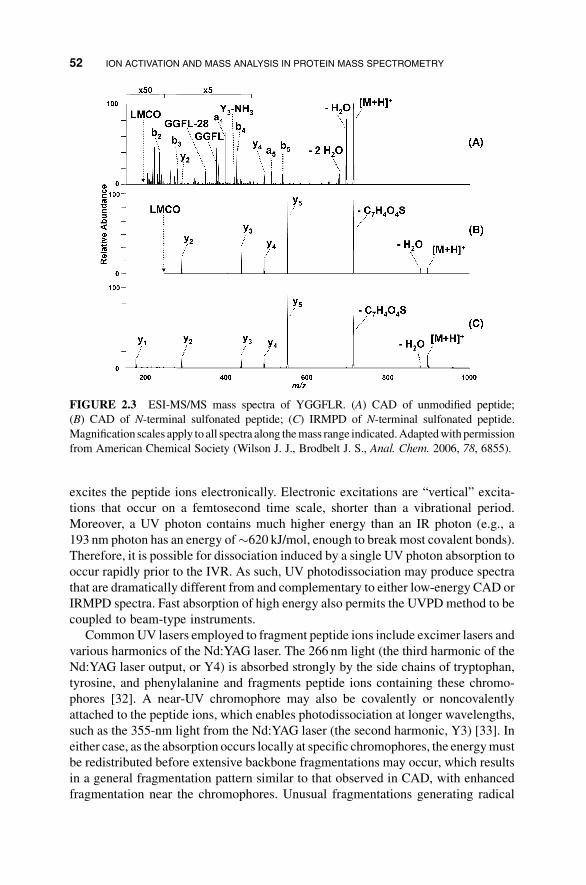
oxygen in the air. Figure 2.4 shows a typical UVPD spectrum of a tryptic peptide
containing arginine at itsC-terminus; the spectrum can be acquired by using either the
193- or the 157-nm light in a tandemTOF instrument [34].Unlike IRMPDorUVPDat
longer wavelengths, UVPD of peptide ions at these two wavelengths leads to
extensive a/x cleavages and other secondary fragmentation. UV absorption at these
FIGURE 2.4 Tandem-TOF photodissociation of Glu-Fibrinopeptide B (EGVNDNEEGFF-
SAR)using (A) 193 and (B) 157 nm light. Reproducedwith permission fromElsevier (Thompson
M. S., Cui W., Reilly J. P., J. Am. Soc. Mass Spectrom. 2007, 18, 1439).
ION ACTIVATION AND TANDEM MS ANALYSIS 53
wavelengths apparently results in the homolytic cleavage of the Ca�C(¼O) bond,
producing two radical species a þ 1 and x þ 1, both of which may either lose a
hydrogen to form the a- or x-ions, depending on the location of the charge carrier(s), or
undergo secondary radical-induced rearrangements to form d-, w-, and v-type ions.
Some b- and y-ions are also seen in the UVPD spectra, particularly when the arginine
residue is replaced by a lysine. This may be due to the higher mobility of a proton
associated with the charged lysine residue, and that mobile proton facilitates the low-
energy fragmentation processes. Finally, because UVPD may occur prior to energy
randomization, a distinct advantage of UVPD over CAD and IRMPD is its ability to
retain labile PTMs, such as phosphorylations and glycosylations, while backbone
bonds break. Although this possibly non-ergodic or nonstatistical behavior may
pertain to many electron-induced dissociation methods discussed in the next section,
UVPD offers a unique benefit in that it is applicable to singly charged ions generated
by MALDI, as it does not involve charge reduction.
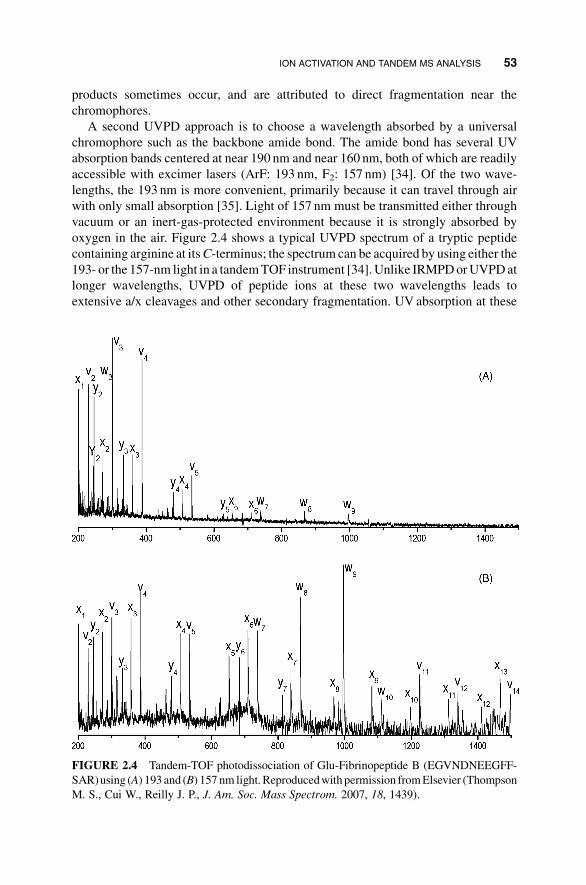
Femtosecond Laser-Induced Dissociation Very recently a new tandem MS
technique termed the femtosecond laser-induced ionization/dissociation, or fs-LID,
was developed in which an ultrafast femtosecond laser with high peak power
(41013W/cm2) and high repetition rate (kHz) fragments peptide ions in an ion trap.
Although the fs laser is often a Ti:Al2O3 laser operated in the near IR region
(�800 nm), the fs-LID spectra are very different from typical IRMPD spectra, as
exemplified in Figure 2.5 [36]. In addition to the b- and y-ions associated with ergodic
fragmentation pathways, abundant a-, c-, x-, and z-ions are produced along with
secondary fragment ions. Phosphate groups are retained in many fragment ions
produced by peptide-bond cleavages, and these ion series can be used to locate the
FIGURE 2.5 fs-LID MS/MS (200 msec irradiation) of the [M þ H]þ precursor ion of
GAILpTGAILK. Adapted with permission from American Chemical Society (Kalcic C. L.,
et al., J. Am. Chem. Soc. 2009, 131, 940).
54 ION ACTIVATION AND MASS ANALYSIS IN PROTEIN MASS SPECTROMETRY
phosphorylation site [37]. The mechanism of fs-LID involves tunneling ionization of
the precursor ion in the presence of the strong electromagnetic field produced by the
high-power femtosecond irradiation, which generates a radical species that may
undergo fragmentation induced by vibrational or electronic excitation. This hypoth-
esis is supported by the presence of a doubly charged radical species seen in the fs-LID
spectrum of a singly charged precursor ion. Like the shorter wavelength UVPD, fs-
LID also produces more nonstatistical fragmentations and is amenable to singly
charged precursor ions. This approach complements conventional CAD, IRMPD, and
electron-induced dissociation methods (next section).
2.2.4 Electron-Induced Dissociation
A third method to activate peptide ions is through ion–electron or ion–ion interac-
tions. Electron-induced dissociation has been around for many decades, but it was not
until the late 1990s with the implementation of electron-capture dissociation (ECD)
that it found broad applications in the structural analysis of biomolecules [38–41].
The first ECD spectrum was actually acquired during a UVPD study in an FTICR
instrument, where a misaligned 193-nm laser beam hit the ICR trap surface,
generating photoelectrons that induced ECDof peptide ions. Since then, conventional
electron sources (e.g., a directly heated filament, an indirectly heated dispenser
cathode, or a cold field emitting device) are being used instead of the laser.
ECD spectra of multiply charged protein ions are usually dominated by the c- and
z-ion series resulting from the N–Ca bond cleavage [38]. Preferential cleavage of
disulfide bonds in ECD also occurs [42]. An important characteristic of ECD is its
ability to generate extensive backbone cleavages while leaving the more labile PTMs
and even noncovalent interactions intact [39–41,43–45]. The cause of this putative
nonstatistical behavior of ECD is the center of an ongoing debate on the primary ECD
mechanism. Some propose that ECD is a non-ergodic process initiated by the electron
capture at a charge site, followed by hydrogen transfer to the backbone carbonyl
inducing N�Ca bond cleavages. Others argue against the non-ergodic premise and
propose that the electron capture first occurs at the backbone carbonyl, generating an
anion-radical super base stabilized by a remote charge; the newly formed species then
undergoes facile N�Ca bond cleavage prior to proton transfer, leading to the
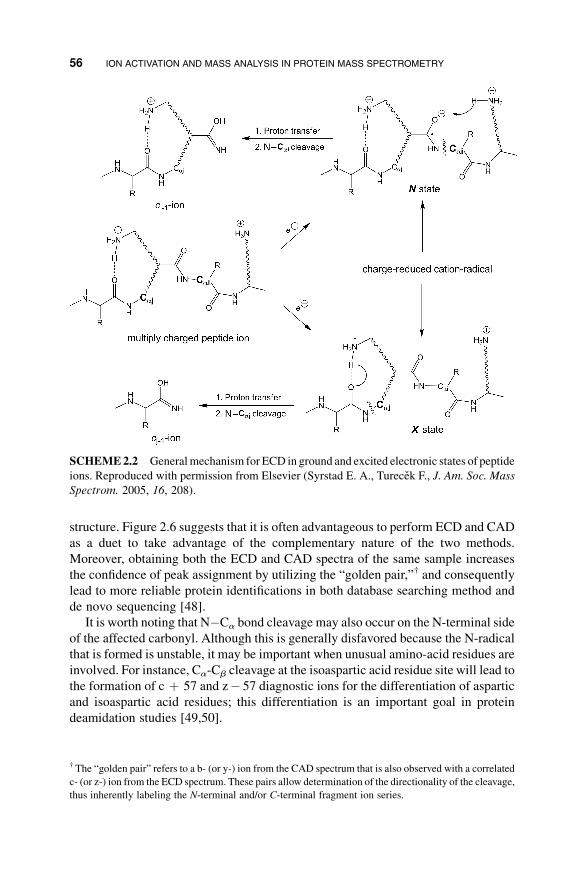
formation of c- and z-ions. A general mechanism (Scheme 2.2) proposes that the
electron capture puts the peptide ion in a Rydberg state (with �4–6 eV of excess
energy owing to recombination of opposite charges) that may sample a number of
electronic states of the charge-reduced ion as it “rattles” down the energy ladder. Both
mechanisms could be at work, depending on the electronic state of the peptide ions
from which the dissociation occurs [46].
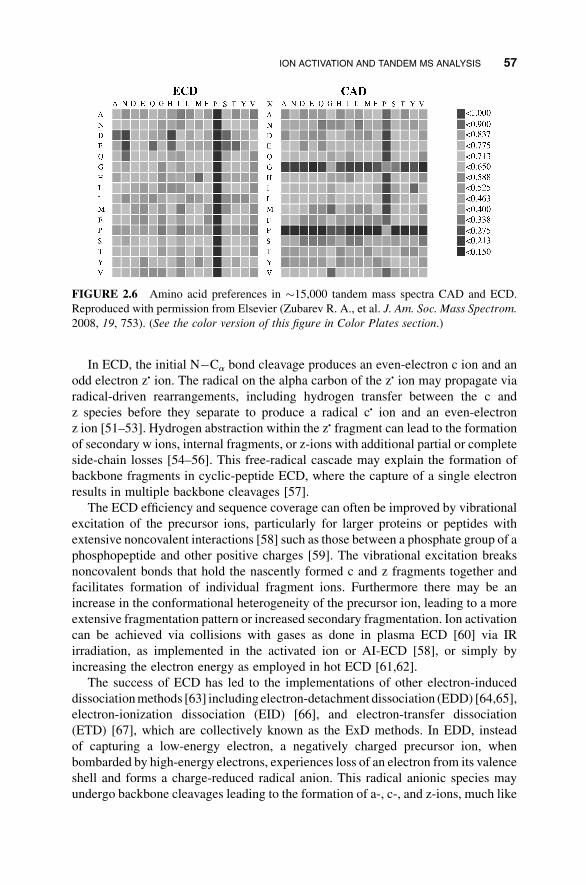
ECD is highly complementary to the conventional CAD method, as illustrated by
Figure 2.6, which is a heat map showing the frequency of fragmentation occurrence as
a function of the neighboring amino acid residues [47]. One feature that stands out is
that whereas cleavageN-terminal to proline is enhanced in CAD, it is rarely observed
in ECD, because the N�Ca bond cleavage at the proline site still leaves the N- and
C-terminal “fragments” connected by a covalent bond owing to proline’s ring
ION ACTIVATION AND TANDEM MS ANALYSIS 55
structure. Figure 2.6 suggests that it is often advantageous to perform ECD and CAD
as a duet to take advantage of the complementary nature of the two methods.
Moreover, obtaining both the ECD and CAD spectra of the same sample increases
the confidence of peak assignment by utilizing the “golden pair,”† and consequently
lead to more reliable protein identifications in both database searching method and
de novo sequencing [48].
It is worth noting that N�Ca bond cleavage may also occur on the N-terminal side
of the affected carbonyl. Although this is generally disfavored because the N-radical
that is formed is unstable, it may be important when unusual amino-acid residues are
involved. For instance, Ca-Cb cleavage at the isoaspartic acid residue site will lead to
the formation of c þ 57 and z� 57 diagnostic ions for the differentiation of aspartic
and isoaspartic acid residues; this differentiation is an important goal in protein
deamidation studies [49,50].
SCHEME2.2 Generalmechanism for ECD in ground and excited electronic states of peptide
ions. Reproduced with permission from Elsevier (Syrstad E. A., Turecek F., J. Am. Soc. Mass
Spectrom. 2005, 16, 208).
† The “golden pair” refers to a b- (or y-) ion from the CAD spectrum that is also observed with a correlated
c- (or z-) ion from the ECD spectrum. These pairs allow determination of the directionality of the cleavage,
thus inherently labeling the N-terminal and/or C-terminal fragment ion series.
56 ION ACTIVATION AND MASS ANALYSIS IN PROTEIN MASS SPECTROMETRY
In ECD, the initial N�Ca bond cleavage produces an even-electron c ion and an
odd electron z. ion. The radical on the alpha carbon of the z. ion may propagate via
radical-driven rearrangements, including hydrogen transfer between the c and
z species before they separate to produce a radical c. ion and an even-electron
z ion [51–53]. Hydrogen abstraction within the z. fragment can lead to the formation
of secondary w ions, internal fragments, or z-ions with additional partial or complete
side-chain losses [54–56]. This free-radical cascade may explain the formation of
backbone fragments in cyclic-peptide ECD, where the capture of a single electron
results in multiple backbone cleavages [57].
The ECD efficiency and sequence coverage can often be improved by vibrational
excitation of the precursor ions, particularly for larger proteins or peptides with
extensive noncovalent interactions [58] such as those between a phosphate group of a
phosphopeptide and other positive charges [59]. The vibrational excitation breaks
noncovalent bonds that hold the nascently formed c and z fragments together and
facilitates formation of individual fragment ions. Furthermore there may be an
increase in the conformational heterogeneity of the precursor ion, leading to a more
extensive fragmentation pattern or increased secondary fragmentation. Ion activation
can be achieved via collisions with gases as done in plasma ECD [60] via IR
irradiation, as implemented in the activated ion or AI-ECD [58], or simply by
increasing the electron energy as employed in hot ECD [61,62].
The success of ECD has led to the implementations of other electron-induced
dissociationmethods [63] including electron-detachment dissociation (EDD) [64,65],
electron-ionization dissociation (EID) [66], and electron-transfer dissociation
(ETD) [67], which are collectively known as the ExD methods. In EDD, instead
of capturing a low-energy electron, a negatively charged precursor ion, when
bombarded by high-energy electrons, experiences loss of an electron from its valence
shell and forms a charge-reduced radical anion. This radical anionic species may
undergo backbone cleavages leading to the formation of a-, c-, and z-ions, much like
FIGURE 2.6 Amino acid preferences in �15,000 tandem mass spectra CAD and ECD.
Reproduced with permission from Elsevier (Zubarev R. A., et al. J. Am. Soc. Mass Spectrom.
2008, 19, 753). (See the color version of this figure in Color Plates section.)
ION ACTIVATION AND TANDEM MS ANALYSIS 57
those observed in ECD. EDD is particularly useful for fragmenting peptides that can
easily generate multiply charged anions in ESI; examples are phosphorylated,
sulfated peptides, or peptides with multiple acidic residues.
Given that both ECD and EDD are initiated by a charge-reduction process, they are
only applicable to multiply charged ions. Singly charged precursor ions, as those
produced byMALDI, would be neutralized by either electron capture in the positive-
ion mode, or electron detachment in the negative-ion mode, preventing the detection
of fragments. EID, however, can be applied to singly charged precursor ions.
The exact mechanism of EID is not well understood, but it probably involves first
the ionization of the precursor ion [M þ nH]nþ by interaction with a high-energy
electron to produce a radical [M þ nH](nþ 1)þ .
, which may dissociate directly or
capture a low-energy electron and then dissociate. EID spectra are often complex;
they show ions produced both by ergodic processes and by radical pathways.
In the early stages of development, ExD was used exclusively with FTICR
instruments; the presence of a magnetic field is beneficial for trapping thermal
electrons to allow efficient ion–electron interactions. More recently the implementa-
tion of ECDhas been successfully extended to other types ofmass spectrometers (e.g.,
a linear ion trap) with a superimposed magnetic field generated by a permanent
magnet [68].
ExD in anRF-only trap remained an elusive goal until 2004, when electron transfer
dissociation was developed. ETD takes advantage of ion–ion interactions, where
electron transfer from an anion radical, rather than the capture of an unbound electron,
initiates the bond dissociation. The reagent anions are generated in a negative
chemical ionization source (nCI), and introduced into the same ion trap where
positive peptide ions are stored. Commonly used anion reagents include aromatic
compounds with low electron affinities, such as azobenzene and fluoranthene, which
also have favorable Franck–Condon factors for transition from the ground vibronic
state of the anion to the low–lying vibrational states of the ground electronic state of
the neutralmolecule.An important competing reaction in ETDof peptides is a proton-
transfer reaction (PTR) that involves the movement of a proton from the multiply
protonated peptide precursor or fragment ion to the anion radical [69,70]. Although
PTR is often an undesired competition, it does have utility in ETD experiments
performed in low–resolving-power mass spectrometers, particularly for top–down
analysis of large protein ions. For the latter, PTR can reduce the charge state of the
highly charged fragment ions, enabling the accurate determination of their charge
states, and thus the mass values, which are otherwise difficult to obtain because
achieving isotopic resolution at higher charge states is difficult [71].
ETD shares many similarities with ECD, including the preferential and extensive
N�Ca bond cleavages, preservation of labile modifications, and ability to differenti-
ate certain isomeric amino-acid residues via secondary, radical-induced rearrange-
ments [72–74]. ETD is considered to give even “colder” fragmentation than ECD,
capable of retaining even sulfations, the most labile of PTMs. Its success stems from
the smaller amount of energy deposited than by ECD. One difference is that some
energy is needed to overcome the electron affinity of the anion reagent; another is the
collisional cooling afforded by a higher pressure ion trap. Like for ECD, the initially
58 ION ACTIVATION AND MASS ANALYSIS IN PROTEIN MASS SPECTROMETRY
formed c/z ion pair in ETD may still be held together by noncovalent interactions;
these need to be ruptured before the products can be detected individually. Overcom-
ing these noncovalent interactions is usually achieved by post-ETD collisional
activation, abbreviated as ETcaD [75]. ETD efficiency also increases with the charge
state of the precursor ion. ETD efficiency and sequence coveragemay be improved by
introducing fixed charge tags to the peptides, via, for example, amidation of the
carboxylic groups or derivatization of cysteines [76].
To date, there has been only one report of the ETD analog of EDD, where xenon
radical cations react with multiply deprotonated peptide anions to generate EDD-like
spectra for which a- and x-ions are the major fragments [77]. Current research efforts
using radical cations from polycyclic aromatic hydrocarbons (PAHs) as the reverse
ETD reagent (electron acceptor) for negatively charged peptide and carbohydrates
suggest promise for reverse ETD (rETD) in the structural analysis of biomolecules.
2.2.5 Other Radical-Induced Fragmentation Methods
ExD and UVPD are just two of several classes of fragmentation methods that involve
radical-induced reactions. Other methods that generate reactive radical peptide ions
include collisional activation and interaction with metastable atoms or other free
radicals. In free-radical-initiated peptide sequencing (FRIPS), a free-radical initiator is
conjugated to theN-terminus of a peptide; the initiator can be cleaved byCAD to leave
the radical on the peptide [78]. Subsequent collisional activation induces fragmenta-
tion of the peptide, generating abundant a- and z-type ions. Two advantages of FRIPS
over ExD are its ability to fragment singly charged peptide ions and the possibility of
generating radicals with different reactivities for selective gas-phase fragmentations.
In metastable-atom fragmentation (MAF) [79] or metastable-atom dissociation
(MAD) [80], the radical on the peptide is generated by collisions with metastable
atoms, usually electronically excited He*, Ne*, Ar*, or Kr*. Metastable atom beams
may be produced by electron impact, DC plasma discharge, or RF discharge. The
MAF process likely involves Penning ionization of the precursor ion by collisionwith
the metastable atom, generating a radical cation that undergoes ExD-like fragmenta-
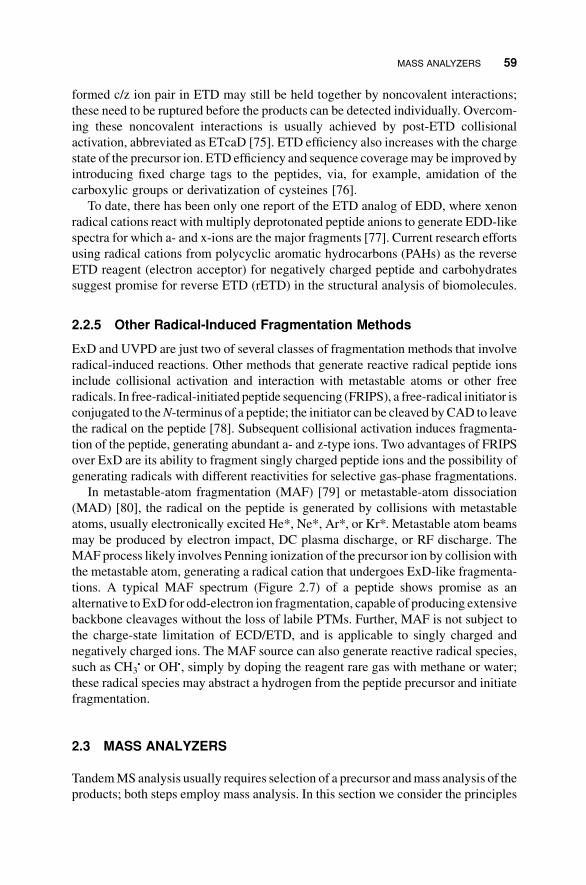
tions. A typical MAF spectrum (Figure 2.7) of a peptide shows promise as an
alternative to ExD for odd-electron ion fragmentation, capable of producing extensive
backbone cleavages without the loss of labile PTMs. Further, MAF is not subject to
the charge-state limitation of ECD/ETD, and is applicable to singly charged and
negatively charged ions. The MAF source can also generate reactive radical species,
such as CH3. or OH., simply by doping the reagent rare gas with methane or water;
these radical species may abstract a hydrogen from the peptide precursor and initiate
fragmentation.
2.3 MASS ANALYZERS
TandemMS analysis usually requires selection of a precursor andmass analysis of the
products; both steps employ mass analysis. In this section we consider the principles
MASS ANALYZERS 59
of various mass analyzers that are used inMS/MS experiments in peptide and protein
MS. Mass analyzers determine the m/z value of a charged particle based on its
trajectory in electric or magnetic field or both. Different mass analyzers influence the
ion motions in different ways; some through the application of electrostatic or
electrodynamic fields, others via the use of a combination of electric and magnetic
fields. The fundamental law that governs the ion motion is Newton’s second law of
mechanics:
F ¼ md2r
dt2; ð2:3Þ
and the force an ion experienced in electromagnetic fields can be expressed as
F ¼ qEþ qv� B; ð2:4Þ
where the two terms on the right-hand side represent the electric and magnetic
components, respectively. Many different types of mass analyzers have been devel-
oped and applied to the structural analysis of proteins; the most common are the time
of flight, quadrupole, quadrupole ion trap, orbitrap, and Fourier-transform ion
cyclotron resonance mass spectrometers.
2.3.1 Time-of-Flight Mass Analyzer
A time-of-flight instrument [81] separates ions of different m/z based on their flight
times through a field-free drift region. TOF analyzers are well suited to pulsed ion
sources such asMALDI because they operate in a pulsed ion-countingmode. A linear
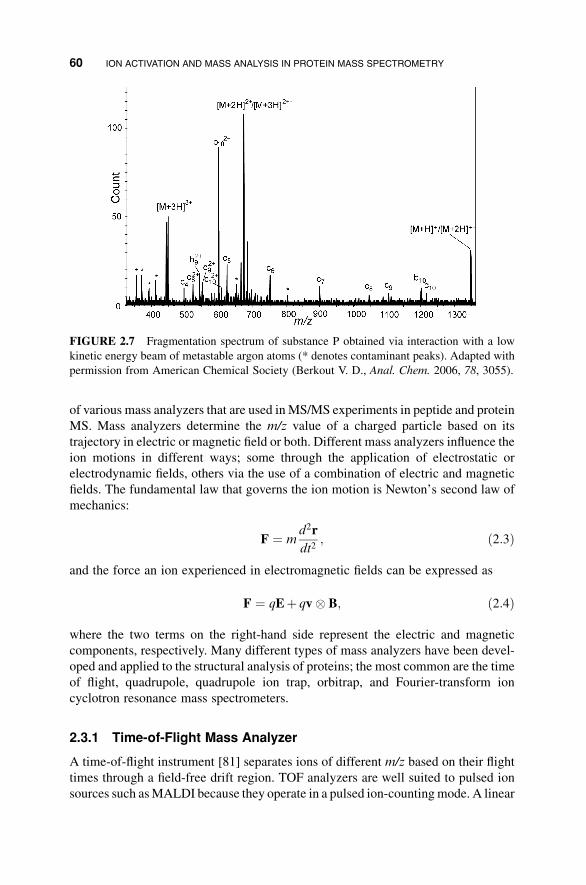
FIGURE 2.7 Fragmentation spectrum of substance P obtained via interaction with a low
kinetic energy beam of metastable argon atoms (* denotes contaminant peaks). Adapted with
permission from American Chemical Society (Berkout V. D., Anal. Chem. 2006, 78, 3055).
60 ION ACTIVATION AND MASS ANALYSIS IN PROTEIN MASS SPECTROMETRY
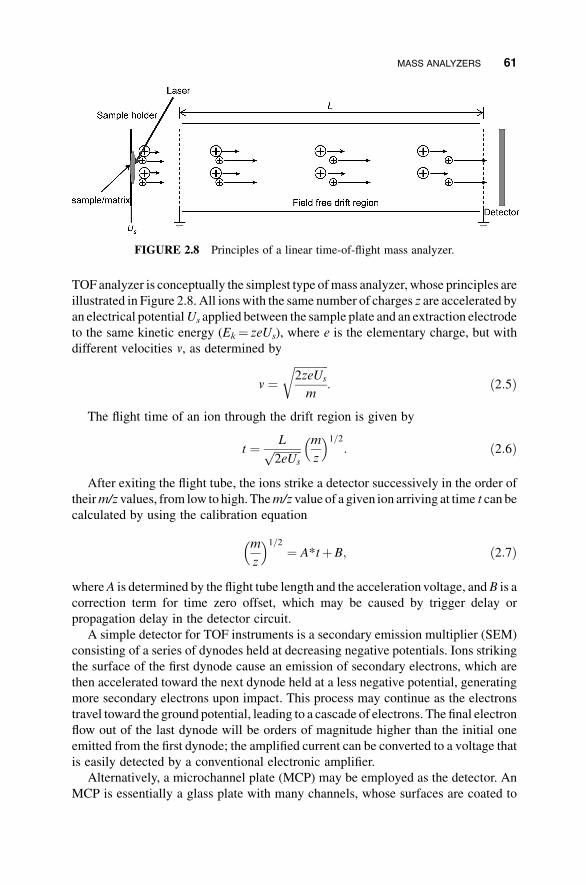
TOFanalyzer is conceptually the simplest type ofmass analyzer, whose principles are
illustrated in Figure 2.8. All ionswith the same number of charges z are accelerated by
an electrical potentialUs applied between the sample plate and an extraction electrode
to the same kinetic energy (Ek¼ zeUs), where e is the elementary charge, but with
different velocities v, as determined by
v ¼ffiffiffiffiffiffiffiffiffiffiffiffi2zeUs
m
r: ð2:5Þ
The flight time of an ion through the drift region is given by
t ¼ Lffiffiffiffiffiffiffiffiffiffi2eUs
p m
z
� �1=2
: ð2:6Þ
After exiting the flight tube, the ions strike a detector successively in the order of
theirm/z values, from low to high. Them/z value of a given ion arriving at time t can be
calculated by using the calibration equation
m
z
� �1=2
¼ A*tþB; ð2:7Þ
whereA is determined by the flight tube length and the acceleration voltage, andB is a
correction term for time zero offset, which may be caused by trigger delay or
propagation delay in the detector circuit.
A simple detector for TOF instruments is a secondary emission multiplier (SEM)
consisting of a series of dynodes held at decreasing negative potentials. Ions striking
the surface of the first dynode cause an emission of secondary electrons, which are
then accelerated toward the next dynode held at a less negative potential, generating
more secondary electrons upon impact. This process may continue as the electrons
travel toward the ground potential, leading to a cascade of electrons. The final electron
flow out of the last dynode will be orders of magnitude higher than the initial one
emitted from the first dynode; the amplified current can be converted to a voltage that
is easily detected by a conventional electronic amplifier.
Alternatively, a microchannel plate (MCP) may be employed as the detector. An
MCP is essentially a glass plate with many channels, whose surfaces are coated to
FIGURE 2.8 Principles of a linear time-of-flight mass analyzer.
MASS ANALYZERS 61
achieve a high ion/electron conversion and electron-multiplication yield. The inner
surface of each channel resembles a continuous array of dynodes; the potentials vary
from high to low negative values from near the front to the back surface of theMCP, as
sustained by applying an around 1 kV voltage difference between the two sides of the
plate. Ions hitting the front surface of the MCP will induce emission of electrons that
cascade down the channel, much like what happens in the SEM. Compared to SEMs,
MCPs have the advantage of a faster response time, but they can be easily saturated
because their recovery time is long.
The analog electron current signal can be digitized by using either a standard
analog-to-digital converter (ADC) or a time-to-digital converter (TDC). An ADC
samples the analog detector voltage at discrete intervals and stores the digitized value
in a memory from which the signal can be reconstructed or read out by the computer.
ADCs for modern TOF instruments can operate at a sampling rate of 1–4GHz, but
only with an 8-bit board, which limits the dynamic range of stored signal amplitudes
to a maximum of 256. Moreover, saturation may occur in both the digitizer and the
upstream analog current-to-voltage amplifier, leading to flat-topped peaks and
erroneous ion-abundance measurements. ATDC is like a 1-bit ADC, which records
the arrival time of ions not as an analog signal, but as an array of 1’s and 0’s. The ion
abundance information is recovered by summing over a large number of spectra. A
TDC has the advantage of ultra-fast response and data-transfer rate. ATDC, however,
suffers from its unit dynamic range; it is particularly undesirable when multiple ions
strike the detector at the same time,which results inmissing the signal from the slower
arriving ions. Further, these detectors suffer from dead-time issues, which occurs
when one ion strikes the detector so closely following another that the detector cannot
respond to the second ion. Generally, TDCs are used in orthogonal TOF instruments,
whereas the ion-extraction optics can operate at a very fast repetition rate (several
kHz), and each extracted ion packet contains only a small number of ions.
The mass resolving power of a TOF instrument scales with the length of the flight
tube. There is usually a practical limit on how long a flight tube can be, and a longer
flight tube is also associated with decreased sensitivity caused by ion loss due to
angular dispersion of the ion beam. TOF mass resolving power is also limited by the
timewidth of the ion packet arriving at the detector, which is determined by variations
in when and where they are formed, as well as their kinetic-energy spread.
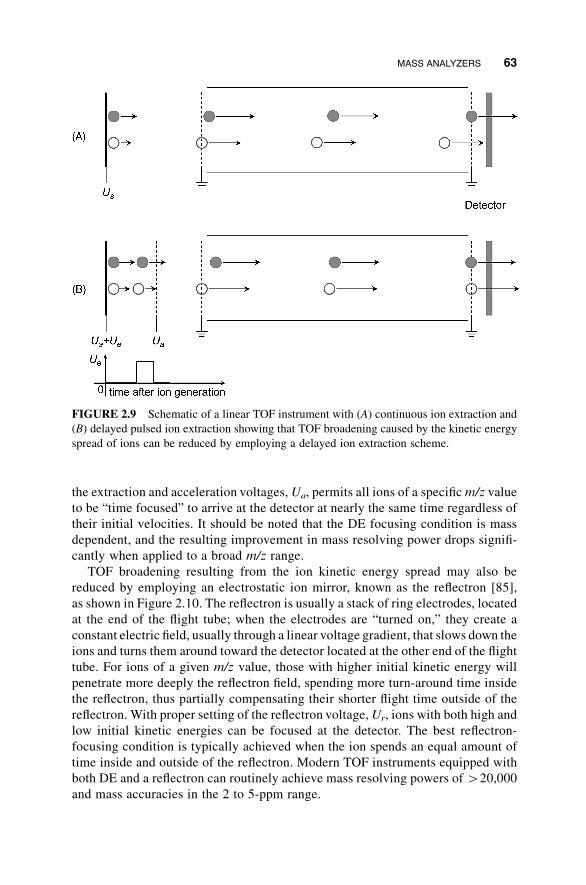
The TOFbroadening caused by the kinetic energy spread can be partially corrected
by using a delayed extraction (DE) scheme [82–84], as shown in Figure 2.9. With
continuous extraction, all ions are extracted and accelerated by the same electric
potentialUs, and the ionswith a higher initial velocitywill arrive at the detector earlier
than the ions (with the same m/z) with a lower initial velocity (Figure 2.9A). With
delayed extraction, ion extraction and acceleration are done in two stages
(Figure 2.9B). The extraction potential Ue is not applied until after a certain delay
time following the ion formation, during which time the ion packet will expand in
space. Ions with lower initial forward velocity will not move as far down the
extraction field as those with higher initial forward velocity, and consequently will
experience more acceleration when the extraction voltage is turned on, allowing
them to catch upwith the fastermoving ions. Careful selection of the delay aswell as
62 ION ACTIVATION AND MASS ANALYSIS IN PROTEIN MASS SPECTROMETRY
the extraction and acceleration voltages, Ua, permits all ions of a specificm/z value
to be “time focused” to arrive at the detector at nearly the same time regardless of
their initial velocities. It should be noted that the DE focusing condition is mass
dependent, and the resulting improvement in mass resolving power drops signifi-
cantly when applied to a broad m/z range.
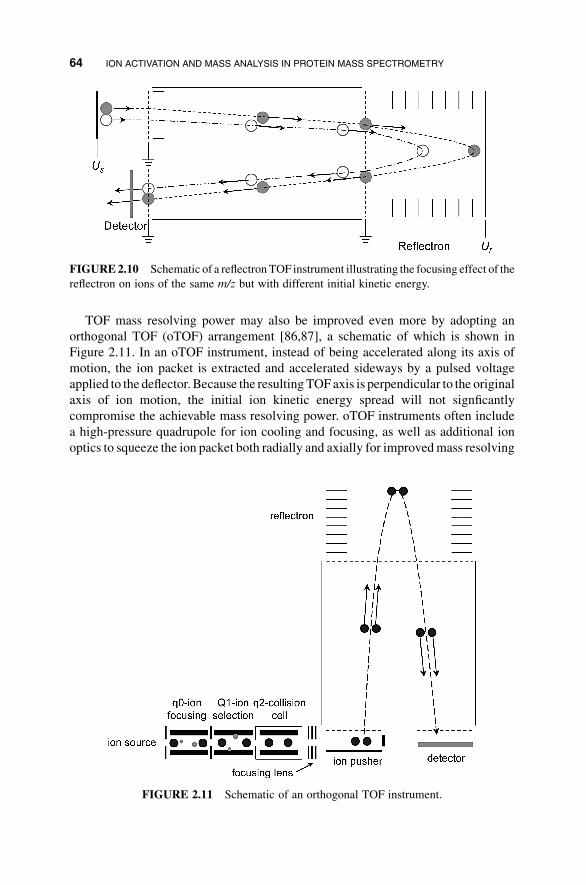
TOF broadening resulting from the ion kinetic energy spread may also be
reduced by employing an electrostatic ion mirror, known as the reflectron [85],
as shown in Figure 2.10. The reflectron is usually a stack of ring electrodes, located
at the end of the flight tube; when the electrodes are “turned on,” they create a
constant electric field, usually through a linear voltage gradient, that slows down the
ions and turns them around toward the detector located at the other end of the flight
tube. For ions of a given m/z value, those with higher initial kinetic energy will
penetrate more deeply the reflectron field, spending more turn-around time inside
the reflectron, thus partially compensating their shorter flight time outside of the
reflectron. With proper setting of the reflectron voltage, Ur, ions with both high and
low initial kinetic energies can be focused at the detector. The best reflectron-
focusing condition is typically achieved when the ion spends an equal amount of
time inside and outside of the reflectron. Modern TOF instruments equipped with
both DE and a reflectron can routinely achieve mass resolving powers of 420,000
and mass accuracies in the 2 to 5-ppm range.
FIGURE 2.9 Schematic of a linear TOF instrument with (A) continuous ion extraction and
(B) delayed pulsed ion extraction showing that TOF broadening caused by the kinetic energy
spread of ions can be reduced by employing a delayed ion extraction scheme.
MASS ANALYZERS 63
TOF mass resolving power may also be improved even more by adopting an
orthogonal TOF (oTOF) arrangement [86,87], a schematic of which is shown in
Figure 2.11. In an oTOF instrument, instead of being accelerated along its axis of
motion, the ion packet is extracted and accelerated sideways by a pulsed voltage
applied to the deflector. Because the resulting TOFaxis is perpendicular to the original
axis of ion motion, the initial ion kinetic energy spread will not signficantly
compromise the achievable mass resolving power. oTOF instruments often include
a high-pressure quadrupole for ion cooling and focusing, as well as additional ion
optics to squeeze the ion packet both radially and axially for improvedmass resolving
FIGURE2.10 Schematic of a reflectronTOF instrument illustrating the focusing effect of the
reflectron on ions of the same m/z but with different initial kinetic energy.
FIGURE 2.11 Schematic of an orthogonal TOF instrument.
64 ION ACTIVATION AND MASS ANALYSIS IN PROTEIN MASS SPECTROMETRY
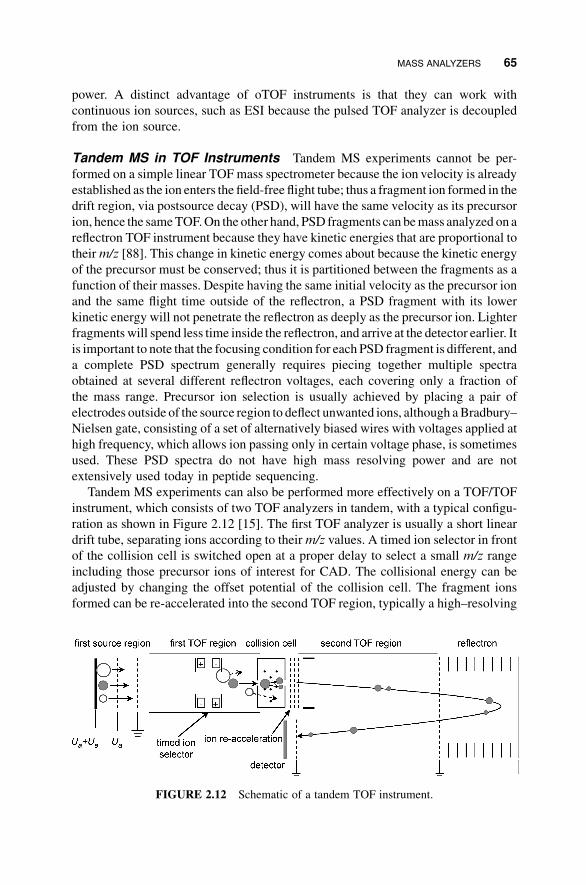
power. A distinct advantage of oTOF instruments is that they can work with
continuous ion sources, such as ESI because the pulsed TOF analyzer is decoupled
from the ion source.
Tandem MS in TOF Instruments Tandem MS experiments cannot be per-
formed on a simple linear TOF mass spectrometer because the ion velocity is already
established as the ion enters the field-free flight tube; thus a fragment ion formed in the
drift region, via postsource decay (PSD), will have the same velocity as its precursor
ion, hence the sameTOF.On the other hand, PSD fragments can bemass analyzed on a
reflectron TOF instrument because they have kinetic energies that are proportional to
theirm/z [88]. This change in kinetic energy comes about because the kinetic energy
of the precursor must be conserved; thus it is partitioned between the fragments as a
function of their masses. Despite having the same initial velocity as the precursor ion
and the same flight time outside of the reflectron, a PSD fragment with its lower
kinetic energy will not penetrate the reflectron as deeply as the precursor ion. Lighter
fragments will spend less time inside the reflectron, and arrive at the detector earlier. It
is important to note that the focusing condition for each PSD fragment is different, and
a complete PSD spectrum generally requires piecing together multiple spectra
obtained at several different reflectron voltages, each covering only a fraction of
the mass range. Precursor ion selection is usually achieved by placing a pair of
electrodes outside of the source region to deflect unwanted ions, although aBradbury–
Nielsen gate, consisting of a set of alternatively biased wires with voltages applied at
high frequency, which allows ion passing only in certain voltage phase, is sometimes
used. These PSD spectra do not have high mass resolving power and are not
extensively used today in peptide sequencing.
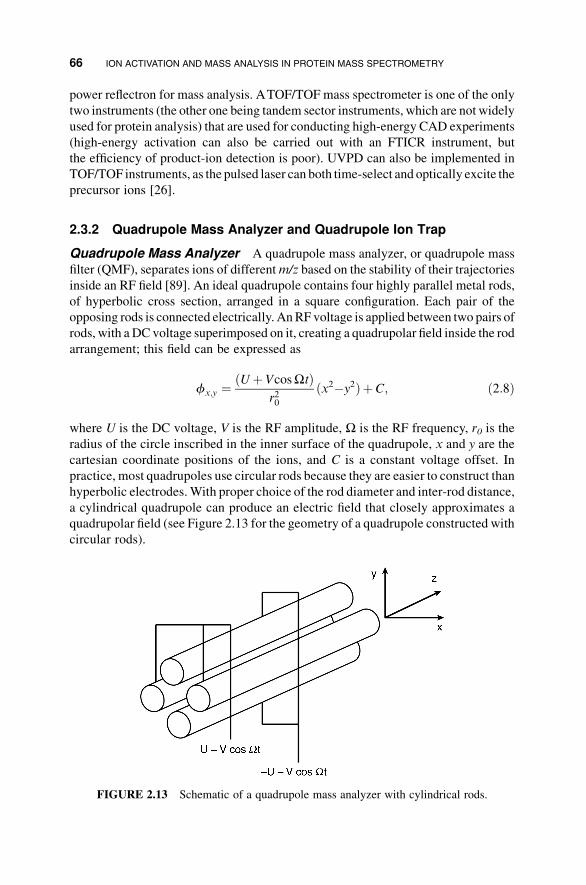
Tandem MS experiments can also be performed more effectively on a TOF/TOF
instrument, which consists of two TOF analyzers in tandem, with a typical configu-
ration as shown in Figure 2.12 [15]. The first TOF analyzer is usually a short linear
drift tube, separating ions according to theirm/z values. A timed ion selector in front
of the collision cell is switched open at a proper delay to select a small m/z range
including those precursor ions of interest for CAD. The collisional energy can be
adjusted by changing the offset potential of the collision cell. The fragment ions
formed can be re-accelerated into the second TOF region, typically a high–resolving
FIGURE 2.12 Schematic of a tandem TOF instrument.
MASS ANALYZERS 65
power reflectron for mass analysis. ATOF/TOF mass spectrometer is one of the only
two instruments (the other one being tandem sector instruments, which are not widely
used for protein analysis) that are used for conducting high-energy CAD experiments
(high-energy activation can also be carried out with an FTICR instrument, but
the efficiency of product-ion detection is poor). UVPD can also be implemented in
TOF/TOF instruments, as the pulsed laser can both time-select and optically excite the
precursor ions [26].
2.3.2 Quadrupole Mass Analyzer and Quadrupole Ion Trap
Quadrupole Mass Analyzer A quadrupole mass analyzer, or quadrupole mass
filter (QMF), separates ions of differentm/z based on the stability of their trajectories
inside an RF field [89]. An ideal quadrupole contains four highly parallel metal rods,
of hyperbolic cross section, arranged in a square configuration. Each pair of the
opposing rods is connected electrically. AnRF voltage is applied between two pairs of
rods, with a DC voltage superimposed on it, creating a quadrupolar field inside the rod
arrangement; this field can be expressed as
fx;y ¼ðUþVcosWtÞ
r20ðx2�y2ÞþC; ð2:8Þ
where U is the DC voltage, V is the RF amplitude, W is the RF frequency, r0 is the
radius of the circle inscribed in the inner surface of the quadrupole, x and y are the
cartesian coordinate positions of the ions, and C is a constant voltage offset. In
practice, most quadrupoles use circular rods because they are easier to construct than
hyperbolic electrodes.With proper choice of the rod diameter and inter-rod distance,
a cylindrical quadrupole can produce an electric field that closely approximates a
quadrupolar field (see Figure 2.13 for the geometry of a quadrupole constructed with
circular rods).
FIGURE 2.13 Schematic of a quadrupole mass analyzer with cylindrical rods.
66 ION ACTIVATION AND MASS ANALYSIS IN PROTEIN MASS SPECTROMETRY
The ion motion inside a quadrupolar field can be described by the following
equations:
md2x
dt2¼ �e
df
dx¼�2ze
ðUþVcosWtÞr20
x ð2:9aÞ
and
md2y
dt2¼�e
df
dy¼ 2ze
ðUþVcosWtÞr20
y; ð2:9bÞ
where z is the number of charges the ion carries, rather than the cartesian coordinate.
Equations (2.9) can be rewritten in the more familiar form of theMathieu equation
by expressing the instrumental parameters as four dimensionless numbers:
ax ¼�ay ¼ 8zeU
mr20W2
ð2:10aÞ
and
qx ¼�qy ¼ �4zeV
mr20W2: ð2:10bÞ
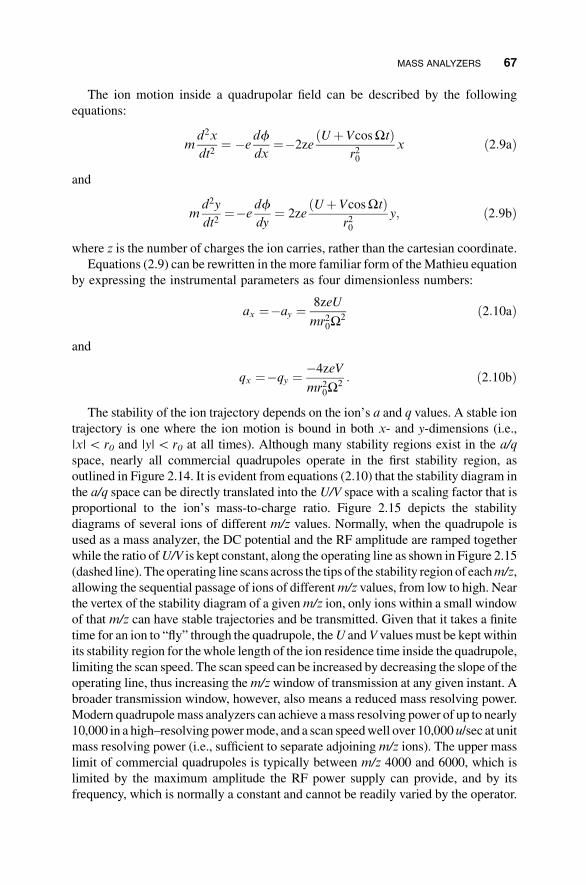
The stability of the ion trajectory depends on the ion’s a and q values. A stable ion
trajectory is one where the ion motion is bound in both x- and y-dimensions (i.e.,
|x|5 r0 and |y|5 r0 at all times). Although many stability regions exist in the a/q
space, nearly all commercial quadrupoles operate in the first stability region, as
outlined in Figure 2.14. It is evident from equations (2.10) that the stability diagram in
the a/q space can be directly translated into the U/V space with a scaling factor that is
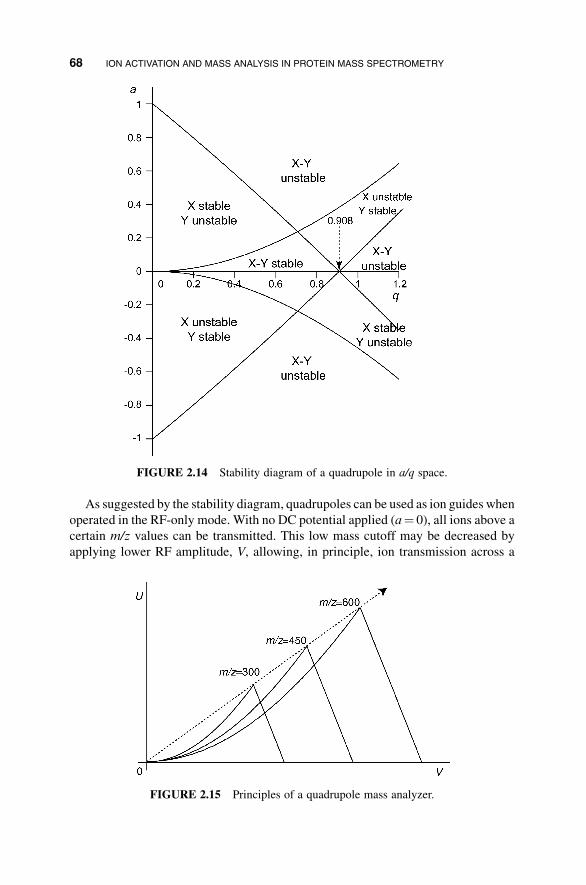
proportional to the ion’s mass-to-charge ratio. Figure 2.15 depicts the stability
diagrams of several ions of different m/z values. Normally, when the quadrupole is
used as a mass analyzer, the DC potential and the RF amplitude are ramped together
while the ratio ofU/V is kept constant, along the operating line as shown in Figure 2.15
(dashed line). Theoperating line scans across the tips of the stability region of eachm/z,
allowing the sequential passage of ions of differentm/z values, from low to high. Near
the vertex of the stability diagram of a givenm/z ion, only ions within a small window
of that m/z can have stable trajectories and be transmitted. Given that it takes a finite
time for an ion to “fly” through the quadrupole, theU andV valuesmust be kept within
its stability region for thewhole length of the ion residence time inside the quadrupole,
limiting the scan speed. The scan speed can be increased by decreasing the slope of the
operating line, thus increasing them/zwindow of transmission at any given instant. A
broader transmission window, however, also means a reduced mass resolving power.
Modern quadrupolemass analyzers can achieve amass resolving power of up to nearly
10,000 in a high–resolving powermode, and a scan speedwell over 10,000 u/sec at unit
mass resolving power (i.e., sufficient to separate adjoiningm/z ions). The upper mass
limit of commercial quadrupoles is typically between m/z 4000 and 6000, which is
limited by the maximum amplitude the RF power supply can provide, and by its
frequency, which is normally a constant and cannot be readily varied by the operator.
MASS ANALYZERS 67
As suggested by the stability diagram, quadrupoles can be used as ion guides when
operated in the RF-only mode. With no DC potential applied (a¼ 0), all ions above a
certain m/z values can be transmitted. This low mass cutoff may be decreased by
applying lower RF amplitude, V, allowing, in principle, ion transmission across a
FIGURE 2.14 Stability diagram of a quadrupole in a/q space.
FIGURE 2.15 Principles of a quadrupole mass analyzer.
68 ION ACTIVATION AND MASS ANALYSIS IN PROTEIN MASS SPECTROMETRY
wider mass range. In practice, however, the ion transmission efficiency is also limited
by the focusing ability of the quadrupole. Ion dispersion in an angular way toward the
quadrupole rods may be caused by a number of reasons, including the initial ion
velocity, which often contains a radial component, space-charge effects, which
originate from the mutual repulsion of ions of like charge within the ion packet,
and scattering collisions with residual or background gas molecules. The focusing
ability of the quadrupole is characterized by the depth of the effective radial trapping
potential well, which is proportional to V2. Ions with a higher m/z value are less
affected by the electric field, requiring a deeper trapping well to be efficiently
focused and transferred. When transferring ions across a broad mass range, there is
often a compromise in choosing the RF amplitude to avoid the loss of low-mass ions,
owing to their unstable trajectories, and to reduce the loss of high mass ions, owing
to inefficient focusing.
Tandem MS in Triple-Quadrupole Mass Spectrometers Tandem MS
experiments cannot be performed on a stand-alone quadrupolemass analyzer because
it lacks ion-trapping capability. Spectrometers employing multiple quadrupoles in
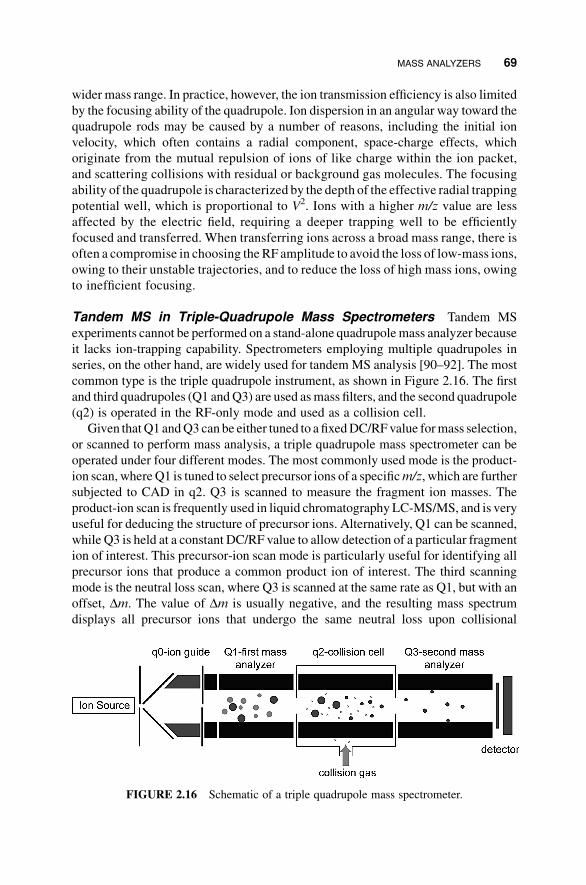
series, on the other hand, are widely used for tandemMS analysis [90–92]. The most
common type is the triple quadrupole instrument, as shown in Figure 2.16. The first
and third quadrupoles (Q1 andQ3) are used asmass filters, and the second quadrupole
(q2) is operated in the RF-only mode and used as a collision cell.
Given thatQ1 andQ3 can be either tuned to a fixedDC/RFvalue formass selection,
or scanned to perform mass analysis, a triple quadrupole mass spectrometer can be
operated under four different modes. The most commonly used mode is the product-
ion scan, whereQ1 is tuned to select precursor ions of a specificm/z, which are further
subjected to CAD in q2. Q3 is scanned to measure the fragment ion masses. The
product-ion scan is frequently used in liquid chromatography LC-MS/MS, and is very
useful for deducing the structure of precursor ions. Alternatively, Q1 can be scanned,
while Q3 is held at a constant DC/RF value to allow detection of a particular fragment
ion of interest. This precursor-ion scan mode is particularly useful for identifying all
precursor ions that produce a common product ion of interest. The third scanning
mode is the neutral loss scan, where Q3 is scanned at the same rate as Q1, but with an
offset, Dm. The value of Dm is usually negative, and the resulting mass spectrum
displays all precursor ions that undergo the same neutral loss upon collisional
FIGURE 2.16 Schematic of a triple quadrupole mass spectrometer.
MASS ANALYZERS 69
activation in q2. The neutral loss scan is often used to screen for a class of compounds
that contain a similar labile group (e.g., a phosphate group that is eliminated as neutral
phosphoric acid from phosphorylated peptides). The final mode is the selected
reaction monitoring (SRM), sometimes also referred to as the multiple reaction
monitoring (MRM)mode, where Q1 and Q3 are both operated at fixedDC/RF values,
with Q1 allowing passage of a particular precursor ion and Q3 allowing transmission
of an expected fragment ion from the selected precursor [93]. SRM is usually
performed when the instrument is coupled with LC, producing a chromatogram of
a specific precursor ion corresponding to a specific analyte of interest. Because both
mass analyzers are operated at fixedm/z values, SRM is a highly specific and sensitive
method for identifying compounds, provided that their fragmentation behaviors are
known.
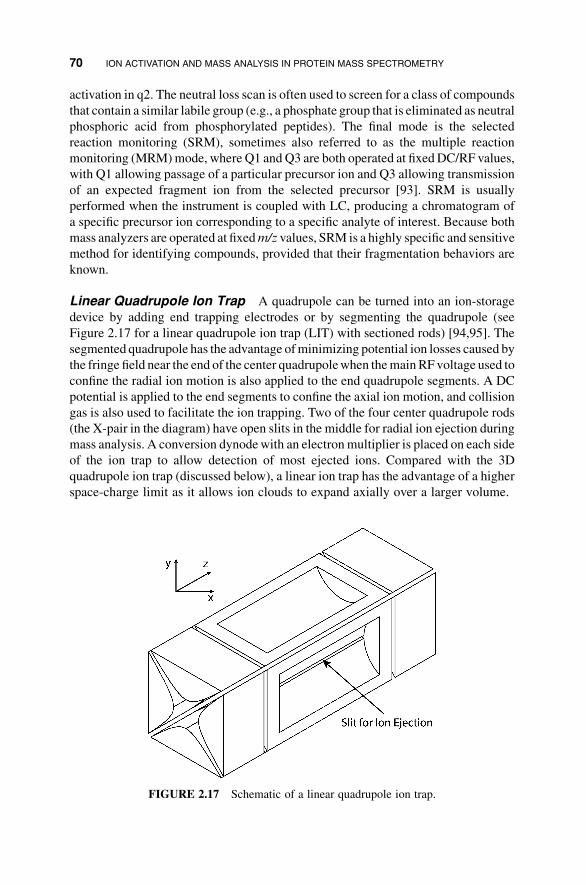
Linear Quadrupole Ion Trap A quadrupole can be turned into an ion-storage
device by adding end trapping electrodes or by segmenting the quadrupole (see
Figure 2.17 for a linear quadrupole ion trap (LIT) with sectioned rods) [94,95]. The
segmented quadrupole has the advantage ofminimizing potential ion losses caused by
the fringe field near the end of the center quadrupolewhen themainRF voltage used to
confine the radial ion motion is also applied to the end quadrupole segments. A DC
potential is applied to the end segments to confine the axial ion motion, and collision
gas is also used to facilitate the ion trapping. Two of the four center quadrupole rods
(the X-pair in the diagram) have open slits in the middle for radial ion ejection during
mass analysis. A conversion dynodewith an electronmultiplier is placed on each side
of the ion trap to allow detection of most ejected ions. Compared with the 3D
quadrupole ion trap (discussed below), a linear ion trap has the advantage of a higher
space-charge limit as it allows ion clouds to expand axially over a larger volume.
FIGURE 2.17 Schematic of a linear quadrupole ion trap.
70 ION ACTIVATION AND MASS ANALYSIS IN PROTEIN MASS SPECTROMETRY
Unlike a quadrupole mass analyzer which uses a combination of RF and DC
voltages to achieve mass selection, an LIT performsmass analysis by scanning the RF
amplitude alone, without anyDC potential applied between the two sets of quadrupole
rods. As evident from the stability diagram of a quadrupole trap, Figure 2.14, only ions
with q5 0.908 have stable trajectories along the q-axis (where a¼ 0). Recall that q is
proportional to V/(m/z); as the RF amplitude is ramped up, lowm/z ions will reach the
edge of the stability region first, and they are ejected from the trap. Although
conceptually simple and easy to implement, such mass-selective instability scan has
several drawbacks, including slow ion ejection near the edge of the stability region and
low detection efficiency because only a portion of the ions actually exit from the slits.
An improved way to perform mass analysis using an LIT is through resonance
ejection. Each ion has its unique oscillation frequency inside a quadrupolar field,
known as the secular frequency fs, which differs from the fundamental RF frequency.
Because heavier ions have slower response to the change of the electric field, they
oscillate at lower frequencies than those of lighter ions. The secular frequency is
related to the ion q value (defined in equation 2.10), and fs increases as q increases.
During the mass analysis, a small auxiliary AC voltage at a fixed frequency is applied
between the two X-rods only. As the main RF amplitude is ramped up, all ions
experience an increase in their q values and consequently their secular frequencies.
When the secular frequency of a certain ion reaches the frequency of the auxiliary AC,
it will be resonantly ejected from the trap and detected. The AC frequency chosen
allows ions to reach resonance at a q value slightly below 0.908, which permits faster
ejection than allowing the ions reach the edge of the stability region; the outcome is
improved mass resolving power. Furthermore, the sensitivity is also improved via
resonance ejection because ions exit the trap almost exclusively along the x-axis, with
minimal scattering loss.
Given that an LIT is an ion-trapping device, tandemMS analysis is possible using a
single LIT. Precursor ion selection is achieved by applying a tailored RF waveform to
the X-rods, which contains RF power at the secular frequencies of all ions except for
the ion of interest. Selected ions are then activated by applying a resonant dipolar
excitation waveform along the X-rods, with the amplitude kept low to avoid ion
ejection. Collision energy can be increased by performing resonance excitation at a
higher q. A higher q, however,means a smallerm/z range for detectable fragment ions.
For example, for a precursor ion of around m/z 908 excited at around q 0.30, all
fragment ions with m/z less than 300 will have a q value above 0.908, and thus be
unstable and undetectable. A pulsed Q dissociation (PQD) scheme can be imple-
mented to alleviate this problem. In PQD, precursor ions are first resonantly excited at
a higher q value and held there for a short period of time for collisional excitation, but
not long enough for significant dissociation to occur.After this short excitation period,
the main RF amplitude is dropped to bring the q values down before or as the ions
dissociate, and the fragment ions are trapped at low q values.
Alternatively, photodissociation, either UVPD or IRMPD, or ETD can be used to
circumvent the compromise between ion activation and fragment-ion trapping. The
geometry of an LITallows easy axial introduction of the laser beam, and the extended
ion-storage time permits extensive ion–photon interactions for efficient precursor-ion
MASS ANALYZERS 71
excitation [24]. The elevated pressure in an LIT is sometimes undesirable for IRMPD
as the rapid collisional cooling can compete with ion activation. For ETD, simulta-
neous axial trapping of analyte cations and ETD reagent anions is achieved by
applying an RF trapping voltage to the end lenses of the linear trap.
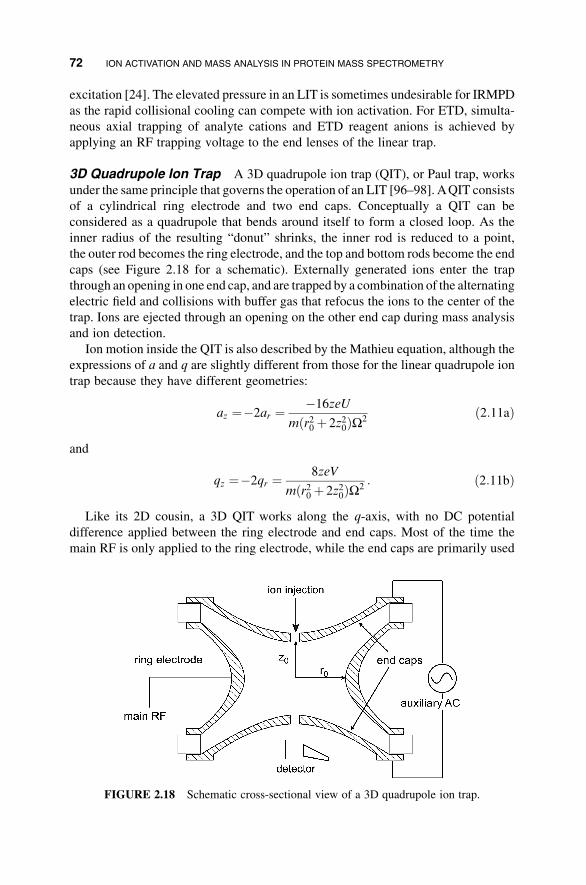
3D Quadrupole Ion Trap A 3D quadrupole ion trap (QIT), or Paul trap, works
under the same principle that governs the operation of an LIT [96–98]. AQIT consists
of a cylindrical ring electrode and two end caps. Conceptually a QIT can be
considered as a quadrupole that bends around itself to form a closed loop. As the
inner radius of the resulting “donut” shrinks, the inner rod is reduced to a point,
the outer rod becomes the ring electrode, and the top and bottom rods become the end
caps (see Figure 2.18 for a schematic). Externally generated ions enter the trap
through an opening in one end cap, and are trapped by a combination of the alternating
electric field and collisions with buffer gas that refocus the ions to the center of the
trap. Ions are ejected through an opening on the other end cap during mass analysis
and ion detection.
Ion motion inside the QIT is also described by the Mathieu equation, although the
expressions of a and q are slightly different from those for the linear quadrupole ion
trap because they have different geometries:
az ¼�2ar ¼ �16zeU
mðr20 þ 2z20ÞW2ð2:11aÞ
and
qz ¼�2qr ¼ 8zeV
mðr20 þ 2z20ÞW2: ð2:11bÞ
Like its 2D cousin, a 3D QIT works along the q-axis, with no DC potential
difference applied between the ring electrode and end caps. Most of the time the
main RF is only applied to the ring electrode, while the end caps are primarily used
FIGURE 2.18 Schematic cross-sectional view of a 3D quadrupole ion trap.
72 ION ACTIVATION AND MASS ANALYSIS IN PROTEIN MASS SPECTROMETRY
for resonant-ion ejection and excitation. Mass analysis can be performed either by
mass-selective instability scan or by resonance ejection. The upper mass limit is once
again limited by the ability of the RF power supply to provide a sufficiently high
voltage to drive the qz over 0.908. Although a reduction in trap dimension can lead to
an increase in its upper mass limit, it is also associated with reduced ion-storage
capacity due to coulomb repulsion between like charges. Alternatively, the upper
mass limit can be increased by performing resonance ejection at a frequency
corresponding to a lower q.
CAD experiments can be similarly carried out on a 3D QIT, but loss of low mass
fragment ions can occur as the V is increased for precursor-ion activation. Alternative
fragmentationmethods employing ion/ion interactionsmay benefit because a 3DQIT
is a charge-sign-independent trapping device, which makes it particularly suitable for
ETD tandem MS analysis. Consecutive tandem MS analysis (MSn) can be easily
performed on aQIT, by alternating the ion-selection and ion-fragmentation steps. The
low cost, compact size, rapid analysis time, andMSn capability of aQITmake it one of
the most common instruments for LC/MS-MS analysis.
2.3.3 Fourier-Transform Ion Cyclotron Resonance Mass Spectrometer
The Fourier-transform ion cyclotron resonance (FTICR) MS was developed in the
1970s by Comisarow and Marshall [99,100]. An FTICR mass spectrometer deter-
mines the m/z value of ions based on their cyclotron frequencies in a homogeneous
magnetic field. The Lorentz force an ion experienced in a magnetic field of strength B
is normal to its velocity v and the magnetic field lines, causing the ion to undergo
cyclotron motion, with the Lorentz force balancing the centrifugal force:
F ¼ zevB ¼ mv2
r: ð2:12Þ
Thus the unperturbed angular cyclotron frequencyvc of an ion of a givenm/z value
in a fixed magnetic field is given by
vc ¼ v
r¼ Be
m=zð2:13Þ
where e is the elemental charge, and z is the charge in integers.
In practice, because a homogeneous magnetic field can only confine the ion
motion in the radial direction (i.e., the direction perpendicular to the magnetic field
line), an inhomogeneous electrostatic field is also applied to trap ions in the axial
direction. The axial electrical trapping results in an axial oscillation with the
frequency vz, given by
vz ¼ffiffiffiffiffiffiffiffiffiffiffiffiffiffiffiffiffi2zVtrapa
ma2
r; ð2:14Þ
where Vtrap is the trapping potential applied, a is the dimension of the ICR trap, and
a is a constant that depends on the geometry of the trap. The electric field and the
MASS ANALYZERS 73
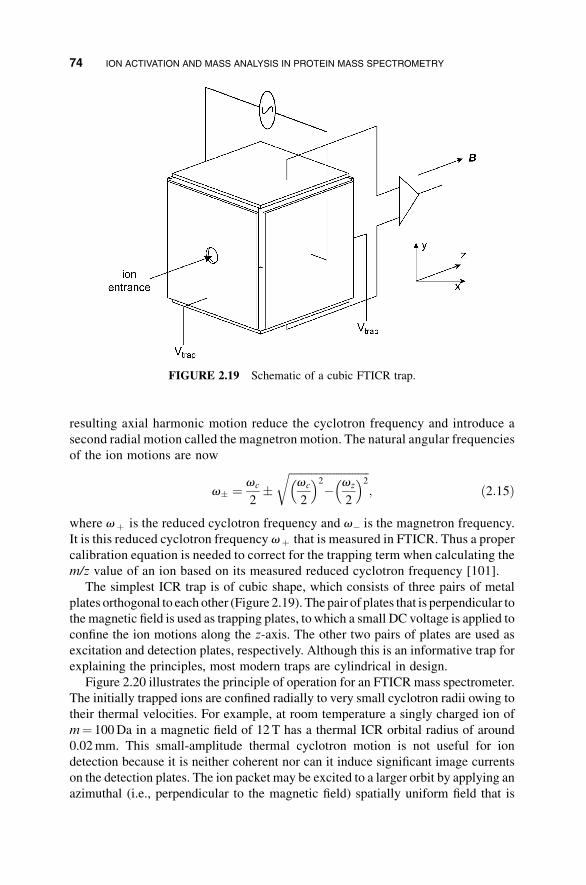
resulting axial harmonic motion reduce the cyclotron frequency and introduce a
second radial motion called the magnetron motion. The natural angular frequencies
of the ion motions are now
v� ¼ vc
2�
ffiffiffiffiffiffiffiffiffiffiffiffiffiffiffiffiffiffiffiffiffiffiffiffiffiffiffiffiffivc
2
� �2
� vz
2
� �2r
; ð2:15Þ
where vþ is the reduced cyclotron frequency and v� is the magnetron frequency.
It is this reduced cyclotron frequency vþ that is measured in FTICR. Thus a proper
calibration equation is needed to correct for the trapping term when calculating the
m/z value of an ion based on its measured reduced cyclotron frequency [101].
The simplest ICR trap is of cubic shape, which consists of three pairs of metal
plates orthogonal to each other (Figure 2.19). The pair of plates that is perpendicular to
the magnetic field is used as trapping plates, to which a small DC voltage is applied to
confine the ion motions along the z-axis. The other two pairs of plates are used as
excitation and detection plates, respectively. Although this is an informative trap for
explaining the principles, most modern traps are cylindrical in design.
Figure 2.20 illustrates the principle of operation for an FTICR mass spectrometer.
The initially trapped ions are confined radially to very small cyclotron radii owing to
their thermal velocities. For example, at room temperature a singly charged ion of
m¼ 100Da in a magnetic field of 12 T has a thermal ICR orbital radius of around
0.02mm. This small-amplitude thermal cyclotron motion is not useful for ion
detection because it is neither coherent nor can it induce significant image currents
on the detection plates. The ion packet may be excited to a larger orbit by applying an
azimuthal (i.e., perpendicular to the magnetic field) spatially uniform field that is
FIGURE 2.19 Schematic of a cubic FTICR trap.
74 ION ACTIVATION AND MASS ANALYSIS IN PROTEIN MASS SPECTROMETRY
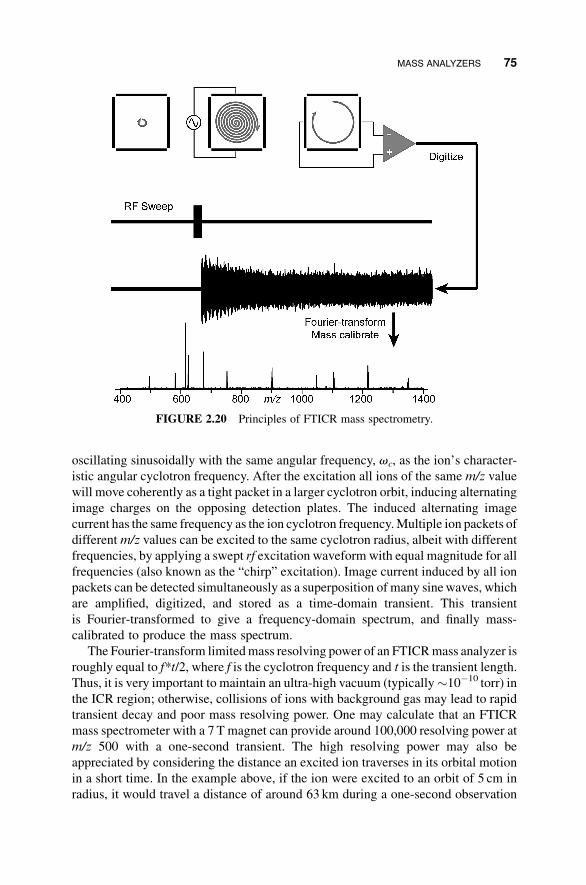
oscillating sinusoidally with the same angular frequency, vc, as the ion’s character-
istic angular cyclotron frequency. After the excitation all ions of the same m/z value
will move coherently as a tight packet in a larger cyclotron orbit, inducing alternating
image charges on the opposing detection plates. The induced alternating image
current has the same frequency as the ion cyclotron frequency.Multiple ion packets of
differentm/z values can be excited to the same cyclotron radius, albeit with different
frequencies, by applying a swept rf excitation waveform with equal magnitude for all
frequencies (also known as the “chirp” excitation). Image current induced by all ion
packets can be detected simultaneously as a superposition of many sinewaves, which
are amplified, digitized, and stored as a time-domain transient. This transient
is Fourier-transformed to give a frequency-domain spectrum, and finally mass-
calibrated to produce the mass spectrum.
The Fourier-transform limitedmass resolving power of an FTICRmass analyzer is
roughly equal to f*t/2, where f is the cyclotron frequency and t is the transient length.
Thus, it is very important to maintain an ultra-high vacuum (typically�10�10 torr) in
the ICR region; otherwise, collisions of ions with background gas may lead to rapid
transient decay and poor mass resolving power. One may calculate that an FTICR
mass spectrometer with a 7 T magnet can provide around 100,000 resolving power at
m/z 500 with a one-second transient. The high resolving power may also be
appreciated by considering the distance an excited ion traverses in its orbital motion
in a short time. In the example above, if the ion were excited to an orbit of 5 cm in
radius, it would travel a distance of around 63 km during a one-second observation
FIGURE 2.20 Principles of FTICR mass spectrometry.
MASS ANALYZERS 75
time. Given that the frequencies can be measured with high accuracy, their corre-
spondingm/z can also be calculated with high accuracy.With a well-constructed ICR
trap and careful control of experimental conditions, a modern FTICR mass analyzer
can routinely achieve mass accuracy of52 ppm with external mass calibration, and
into the ppb region with internal calibration.
TandemMS in FTICRMass Spectrometers Because an FTICR trap can store
ions, tandemMSanalysis can be easily performedwith an FTICRmass spectrometer.
A precursor ion may be isolated by applying tailored excitation waveforms, such as
the SWIFT (stored waveform inverse Fourier transform) [102]. Precise ion isolation
down to a 0.1Da m/z window as well as multiple precursor-ion selection can be
achievedwith SWIFT. The ICR trap is particularlywell suited for performing several
tandem MS experiments, including IRMPD and ECD. IRMPD in an ICR trap
benefits from its long ion-storage time, which allows extensive ion–photon interac-
tion, and its ultra-high vacuum, which minimizes collisional cooling. Until very
recently an FTICR instrument is the only type ofmass spectrometer that is capable of
performing ECD analysis, primarily because of its ability to guide and trap electrons
with magnetic field.
CAD can also be used to fragment ions in an FTICR mass spectrometer, but
generally not with resonant excitation because ions can be lost owing to the high-
energy collisions, and collisional damping is required if one to bring the product ions
back to the center of the trap for re-excitation for mass analysis. With resonant
excitation, fragment ions tend to be formed off-axis and, given large magnetron
motion amplitudes, produce poor spectra and extensive fragment-ion losses. Instead,
selected ions are usually excited by a slightly off-resonance waveform that periodi-
cally excites and de-excites the ions, ensuring ample collisions while keeping the ions
relatively close to the center of the ICR trap [9]. Although such sustained off-
resonance irradiation (SORI) can produce product-ion spectra similar to those
obtained by other low energy CAD methods, direct introduction of the collision gas
into the ICR trap is undesirable, as a long pump-down delay is usually needed after the
fragmentation event to achieve the low pressure that is suitable for high-resolving-
power mass analysis. The extra delay leads to low duty cycles, and thus SORI-CAD is
not suitable for high-throughput tandem MS analysis, particularly when the mass
spectrometer is coupled with LC.
Nearly all modern commercial FTICR instruments are hybrid instruments that
employ either a linear ion trap or a QMF-collision cell setup as the front end. Given
that CAD performed in the front end does not compromise the vacuum in the ICR
trap, these hybrid instruments are ideal for performing high-throughput, high-
mass-accuracy LC-MS/MS analyses. In addition, the front end can also be used to
isolate ions, without inducing significant magnetron motions. The LIT offers the
possibility of automatic gain control (AGC) for maintaining constant ion popula-
tions in the ICR trap, which is crucial for achieving high mass accuracies. The
QMF-collision cell setup, on the other hand, allows selected ion accumulation,
which is beneficial for analysis of low-abundance ions, leading to dramatically
increased dynamic range.
76 ION ACTIVATION AND MASS ANALYSIS IN PROTEIN MASS SPECTROMETRY
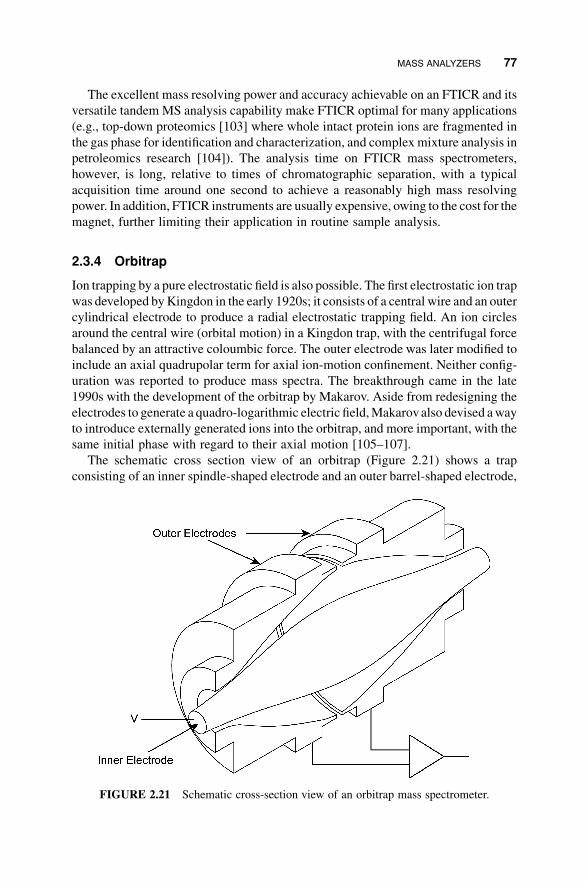
The excellent mass resolving power and accuracy achievable on an FTICR and its
versatile tandem MS analysis capability make FTICR optimal for many applications
(e.g., top-down proteomics [103] where whole intact protein ions are fragmented in
the gas phase for identification and characterization, and complex mixture analysis in
petroleomics research [104]). The analysis time on FTICR mass spectrometers,
however, is long, relative to times of chromatographic separation, with a typical
acquisition time around one second to achieve a reasonably high mass resolving
power. In addition, FTICR instruments are usually expensive, owing to the cost for the
magnet, further limiting their application in routine sample analysis.
2.3.4 Orbitrap
Ion trapping by a pure electrostatic field is also possible. The first electrostatic ion trap
was developed byKingdon in the early 1920s; it consists of a central wire and an outer
cylindrical electrode to produce a radial electrostatic trapping field. An ion circles
around the central wire (orbital motion) in a Kingdon trap, with the centrifugal force
balanced by an attractive coloumbic force. The outer electrode was later modified to
include an axial quadrupolar term for axial ion-motion confinement. Neither config-
uration was reported to produce mass spectra. The breakthrough came in the late
1990s with the development of the orbitrap by Makarov. Aside from redesigning the
electrodes to generate a quadro-logarithmic electric field,Makarovalso devised away
to introduce externally generated ions into the orbitrap, and more important, with the
same initial phase with regard to their axial motion [105–107].
The schematic cross section view of an orbitrap (Figure 2.21) shows a trap
consisting of an inner spindle-shaped electrode and an outer barrel-shaped electrode,
FIGURE 2.21 Schematic cross-section view of an orbitrap mass spectrometer.
MASS ANALYZERS 77
which is sectioned in the middle. The electrostatic field inside the orbitrap can be
described by a quadro-logarithmic distribution:
Uðr; zÞ ¼ k
2z2� r2
2
� �þ k
2R2mln
r
Rm
� �þC; ð2:16Þ
where z and r are cylindrical coordinates, with z ¼ 0 being the plane that bisects the
outer electrode,k is the field curvature,Rm is the characteristic radius of the trap, andC
is a constant voltage offset. Stable ion trajectories inside the orbitrap combine orbital
rotations around the inner electrode and harmonic oscillations along it. Several m/z-
dependent characteristic frequencies exist, including the frequency of rotationvf, the
frequency of radial oscillationvr, and the frequency of axial oscillationvz. Recall that
the restoring force along the z-axis can be calculated as
Fz ¼�qqUqz
¼�qkz ¼ md2zdt2
; ð2:17Þ
which describes a simple harmonic oscillator, with the frequency of oscillation being
vz ¼ffiffiffiffiffiffiffiffiffik
m=q
s¼
ffiffiffiffiffiffiffiffiffike
m=z
s; ð2:18Þ
where e is the elemental charge.
Ion oscillation along the z-axis induces an image current between the two parts of
the sectioned outer electrode. As for FTICR MS, this image current can be Fourier-
transformed to generate the frequency domain spectrum, and further mass-calibrated
to produce the mass spectrum.
Successful generation of mass spectra by using an orbitrap hinges on the ability to
introduce the externally generated ions as a tight packet into the orbitrap, so that the
axial motion of ions of the samem/z is coherent. The original orbitrap design adopted
a high voltage pulsed ion deflector to achieve this purpose, although only a small
fraction of the ions made their way into the orbitrap. The latest commercial orbitrap,
the LTQ-Orbitrap, employs a C-trap, which is a curved quadrupole that can be pulsed
to push all trapped ions into the orbitrap, all with the same initial phase axial motion
(Figure 2.22) [108,109].
As for all Fourier-transform mass analyzers, the Fourier-transform limited mass
resolving power of an orbitrap is approximately equal to the product of the measured
frequency (in this case the frequency of ion oscillation along the z-axis) and the
transient length. The commercial orbitrap can routinely achieve a mass resolving
power of around 100,000 atm/z 400 for a 1.25 s transient. This mass resolving power
is similar to that obtainable on an FTICR mass analyzer with a 4.3 T magnet at the
samem/z and with the same transient length. Because the z-axis oscillation frequencyof an ion inside an orbitrap has a weaker dependence onm/z (equation 2.18) than the
cyclotron frequency of an ion inside an ICR trap (equation 2.13), the mass resolving
power of an orbitrap does not decrease as fast as that of an FTICR as them/z increases,
and can exceed that of a commercial FTICRwith a higher field (7 or 9.4 T)magnet for
78 ION ACTIVATION AND MASS ANALYSIS IN PROTEIN MASS SPECTROMETRY
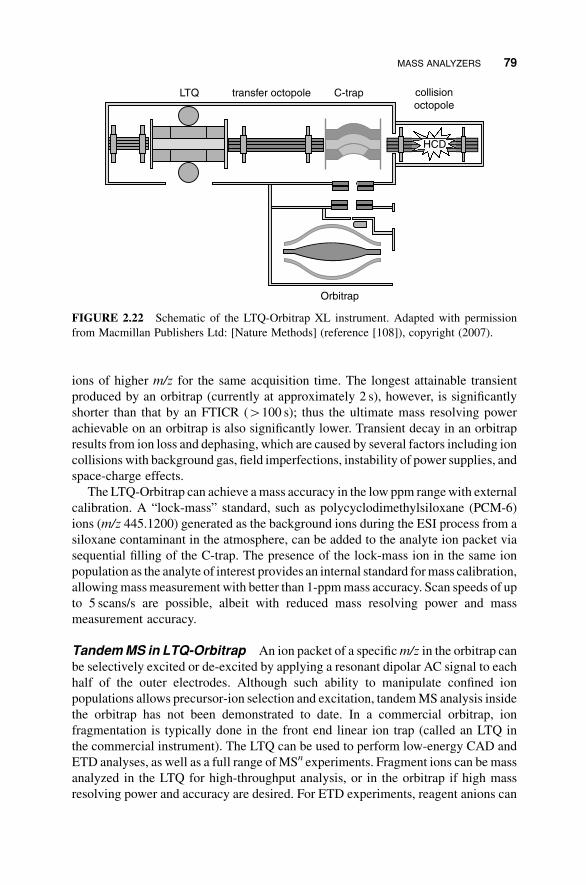
ions of higher m/z for the same acquisition time. The longest attainable transient
produced by an orbitrap (currently at approximately 2 s), however, is significantly
shorter than that by an FTICR (4100 s); thus the ultimate mass resolving power
achievable on an orbitrap is also significantly lower. Transient decay in an orbitrap
results from ion loss and dephasing, which are caused by several factors including ion
collisions with background gas, field imperfections, instability of power supplies, and
space-charge effects.
The LTQ-Orbitrap can achieve amass accuracy in the low ppm rangewith external
calibration. A “lock-mass” standard, such as polycyclodimethylsiloxane (PCM-6)
ions (m/z 445.1200) generated as the background ions during the ESI process from a
siloxane contaminant in the atmosphere, can be added to the analyte ion packet via
sequential filling of the C-trap. The presence of the lock-mass ion in the same ion
population as the analyte of interest provides an internal standard formass calibration,
allowingmassmeasurement with better than 1-ppmmass accuracy. Scan speeds of up
to 5 scans/s are possible, albeit with reduced mass resolving power and mass
measurement accuracy.
TandemMS in LTQ-Orbitrap An ion packet of a specificm/z in the orbitrap can
be selectively excited or de-excited by applying a resonant dipolar AC signal to each
half of the outer electrodes. Although such ability to manipulate confined ion
populations allows precursor-ion selection and excitation, tandemMS analysis inside
the orbitrap has not been demonstrated to date. In a commercial orbitrap, ion
fragmentation is typically done in the front end linear ion trap (called an LTQ in
the commercial instrument). The LTQ can be used to perform low-energy CAD and
ETD analyses, as well as a full range ofMSn experiments. Fragment ions can be mass
analyzed in the LTQ for high-throughput analysis, or in the orbitrap if high mass
resolving power and accuracy are desired. For ETD experiments, reagent anions can
LTQ transfer octopole C-trap collisionoctopole
HCD
Orbitrap
FIGURE 2.22 Schematic of the LTQ-Orbitrap XL instrument. Adapted with permission
from Macmillan Publishers Ltd: [Nature Methods] (reference [108]), copyright (2007).
MASS ANALYZERS 79
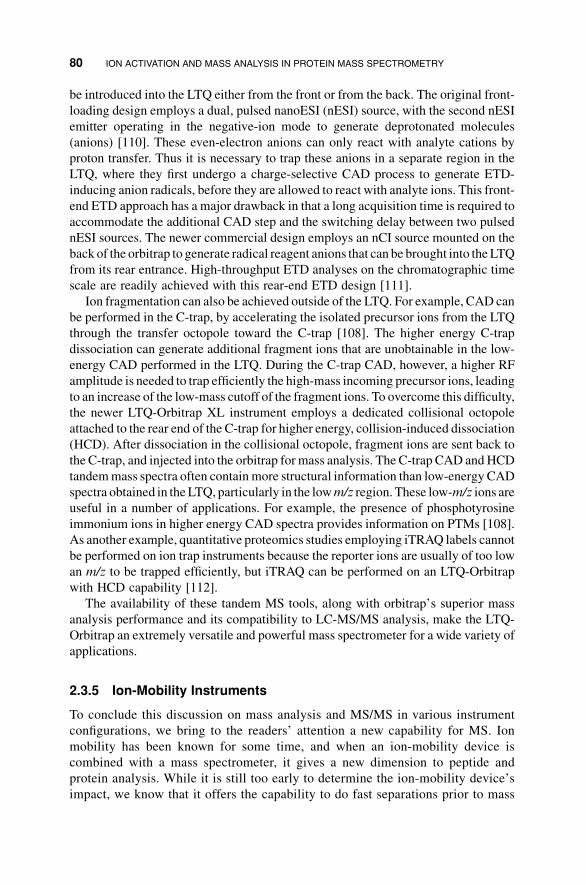
be introduced into the LTQ either from the front or from the back. The original front-
loading design employs a dual, pulsed nanoESI (nESI) source, with the second nESI
emitter operating in the negative-ion mode to generate deprotonated molecules
(anions) [110]. These even-electron anions can only react with analyte cations by
proton transfer. Thus it is necessary to trap these anions in a separate region in the
LTQ, where they first undergo a charge-selective CAD process to generate ETD-
inducing anion radicals, before they are allowed to react with analyte ions. This front-
end ETD approach has a major drawback in that a long acquisition time is required to
accommodate the additional CAD step and the switching delay between two pulsed
nESI sources. The newer commercial design employs an nCI source mounted on the
back of the orbitrap to generate radical reagent anions that can be brought into theLTQ
from its rear entrance. High-throughput ETD analyses on the chromatographic time
scale are readily achieved with this rear-end ETD design [111].
Ion fragmentation can also be achieved outside of the LTQ. For example, CAD can
be performed in the C-trap, by accelerating the isolated precursor ions from the LTQ
through the transfer octopole toward the C-trap [108]. The higher energy C-trap
dissociation can generate additional fragment ions that are unobtainable in the low-
energy CAD performed in the LTQ. During the C-trap CAD, however, a higher RF
amplitude is needed to trap efficiently the high-mass incoming precursor ions, leading
to an increase of the low-mass cutoff of the fragment ions. To overcome this difficulty,
the newer LTQ-Orbitrap XL instrument employs a dedicated collisional octopole
attached to the rear end of the C-trap for higher energy, collision-induced dissociation
(HCD). After dissociation in the collisional octopole, fragment ions are sent back to
the C-trap, and injected into the orbitrap for mass analysis. The C-trap CAD andHCD
tandemmass spectra often contain more structural information than low-energy CAD
spectra obtained in theLTQ, particularly in the lowm/z region. These low-m/z ions are
useful in a number of applications. For example, the presence of phosphotyrosine
immonium ions in higher energy CAD spectra provides information on PTMs [108].
As another example, quantitative proteomics studies employing iTRAQ labels cannot
be performed on ion trap instruments because the reporter ions are usually of too low
an m/z to be trapped efficiently, but iTRAQ can be performed on an LTQ-Orbitrap
with HCD capability [112].
The availability of these tandem MS tools, along with orbitrap’s superior mass
analysis performance and its compatibility to LC-MS/MS analysis, make the LTQ-
Orbitrap an extremely versatile and powerful mass spectrometer for a wide variety of
applications.
2.3.5 Ion-Mobility Instruments
To conclude this discussion on mass analysis and MS/MS in various instrument
configurations, we bring to the readers’ attention a new capability for MS. Ion
mobility has been known for some time, and when an ion-mobility device is
combined with a mass spectrometer, it gives a new dimension to peptide and
protein analysis. While it is still too early to determine the ion-mobility device’s
impact, we know that it offers the capability to do fast separations prior to mass
80 ION ACTIVATION AND MASS ANALYSIS IN PROTEIN MASS SPECTROMETRY
analysis and to investigate ion conformations, which are of key importance in the
biophysics of peptides and proteins.
Most mass spectrometers operate at 10�6 to 10�9 mbar background gas pressure
so that the perturbations on ion motion caused by collisions with neutral gas
molecules do not greatly affect their trajectories. Ion-mobility devices operate on
a different principle, at around 1mbar. Ions in an ion-mobility device are subjected
to a constant electric field at this high pressure so that they accelerate and quickly
achieve a terminal velocity, relying on the “drag” force from background gas
collisions to separate ions based on the balance between their acceleration (depen-
dent on their mass/charge ratio) and the drag (dependent on their cross-sectional
area and the mass of the background gas). Thus ion-mobility devices are not strictly
mass analyzers, the separation of the masses is also dependent on average cross-
sectional area [113,114]. Ion-mobility devices, however, have become quite useful
as quick gas-phase separation tools when combined with traditional mass analyzers
such as time-of-flight instruments [114–116].
For example, recently a mass-spectrometer manufacturer, Waters, released a new
instrument, called the Synapt, that employs an ion-mobility separator prior to a
quadrupole/time-of-flight instrument. In this case the ion-mobility separator uses a
stacked-ring geometry ion guide to keep the beam radially confined, but is still clearly
capable of separating ions by their rotationally averaged cross-sectional area. When
combined with a high-speed quadrupole/time-of-flight instrument, there are substan-
tial improvements in peak capacity, baseline chemical noise levels, and the ability to
perform conformation-dependent MS and tandem MS experiments, thus providing
interesting new capabilities. Other instrument manufacturers are also currently
working to develop similar, competing instruments.
REFERENCES
1. Ashline, D. J., Lapadula, A. J., Liu, Y.-H., Lin,M., Grace,M., Pramanik, B., Reinhold, V.
N. (2007). Carbohydrate structural isomers analyzed by sequential mass spectrometry.
Anal Chem 79, 3830–3842.
2. Sleno, L., Volmer, D. A. (2004). Ion activation methods for tandem mass spectrometry.
J Mass Spectrom 39, 1091–1112.
3. Roepstorff, P., Fohlman, J. (1984). Proposal for a common nomenclature for sequence
ions in mass-spectra of peptides. Biomed Mass Spectrom 11, 601–601.
4. Shukla, A. K., Futrell, J. H. (2000). Tandem mass spectrometry: Dissociation of ions by
collisional activation. J Mass Spectrom 35, 1069–1090.
5. Papayannopoulos, I. A. (1995). The interpretation of collision-induced dissociation
tandem mass spectra of peptides. Mass Spectrom Rev 14, 49–73.
6. Hayes, R. N., Gross, M. L. (1990). Collision-induced dissociation. Meth Enzymol, 193,237–263.
7. Yost, R. A., Enke, C. G., McGilvery, D. C., Smith, D., Morrison, J. D. (1979). High
efficiency collision-induced dissociation in an RF-only quadrupole. Int J Mass Spectrom
Ion Phys 30, 127–136.
REFERENCES 81
8. Louris, J. N., Brodbelt-Lustig, J. S., Graham Cooks, R., Glish, G. L., van Berkel, G.
J., McLuckey, S. A. (1990). Ion isolation and sequential stages of mass spectrometry
in a quadrupole ion trap mass spectrometer. Int J Mass Spectrom Ion Processes 96,117–137.
9. Gauthier, J. W., Trautman, T. R., Jacobson, D. B. (1991). Sustained off-resonance
irradiation for collision-activated dissociation involving Fourier-transform mass-
spectrometry: Collision-activated dissociation technique that emulates infrared multi-
photon dissociation. Anal Chim Acta 246, 211–225.
10. Laskin, J., Futrell, J. H. (2003). Collisional activation of peptide ions in Ft-Icr mass
spectrometry. Mass Spectrom Rev 22, 158–181.
11. Wysocki, V. H., Tsaprailis, G., Smith, L. L., Breci, L. A. (2000). Special feature:
Commentary—Mobile and localized protons: A framework for understanding peptide
dissociation. J Mass Spectrom 35, 1399–1406.
12. Paizs, B., Suhai, S. (2005). Fragmentation pathways of protonated peptides. Mass
Spectrom Rev 24, 508–548.
13. Fabris, D., Michele, K., Constance, M., Zhuchun, W., Catherine, F. (1993). High-energy
collision-induced dissociation of multiply charged polypeptides produced by electro-
spray. J Am Soc Mass Spectrom 4, 652–661.
14. Medzihradszky, K. F., Burlingame, A. L. (1994). The advantages and versatility of a high-
energy collision-induced dissociation-based strategy for the sequence and structural
determination of proteins. Methods 6, 284–303.
15. Medzihradszky, K. F., Campbell, J. M., Baldwin, M. A., Falick, A. M., Juhasz, P., Vestal,
M. L., Burlingame, A. L. (2000). The characteristics of peptide collision-induced
dissociation using a high-performance MALDI-TOF/TOF tandem mass spectrometer.
Anal Chem 72, 552–558.
16. Falick,A.M., Hines,W.M.,Medzihradszky, K. F., Baldwin,M.A., Gibson, B.W. (1993).
Low-mass ions produced from peptides by high-energy collision-induced dissociation in
tandem mass spectrometry. J Am Soc Mass Spectrom 4, 882–893.
17. Harrison, A. G., Young, A. B., Bleiholder, C., Suhai, S., Paizs, B. (2006). Scrambling of
sequence information in collision-induced dissociation of peptides. J Am Chem Soc 128,10364–10365.
18. Bleiholder, C., Osburn, S., Williams, T. D., Suhai, S., Van Stipdonk, M., Harrison, A. G.,
Paizs, B. (2008). Sequence-scrambling fragmentation pathways of protonated peptides.
J Am Chem Soc 130, 17774–17789.
19. Dongr�e, A. R., Somogyi, �A., Wysocki, V. H. (1996). Surface-induced dissociation: An
effective tool to probe structure, energetics and fragmentation mechanisms of protonated
peptides. J Mass Spectrom 31, 339–350.
20. Wysocki, V. H., Joyce, K. E., Jones, C. M., Beardsley, R. L. (2008). Surface-induced
dissociation of small molecules, peptides, and non-covalent protein complexes. J Am Soc
Mass Spectrom 19, 190–208.
21. Wysocki, V. H., Ding, J.-M., Jones, J. L., Callahan, J. H., King, F. L. (1992). Surface-
induced dissociation in tandem quadrupole mass spectrometers: A comparison of three
designs. J Am Soc Mass Spectrom 3, 27–32.
22. Williams, E. R., Fang, L., Zare, R. N. (1993). Surface-induced dissociation for tandem
time-of-flight mass spectrometry. Int J Mass Spectrom Ion Processes 123, 233–241.
82 ION ACTIVATION AND MASS ANALYSIS IN PROTEIN MASS SPECTROMETRY
23. Laskin, J., Denisov, E. V., Shukla, A. K., Barlow, S. E., Futrell, J. H. (2002). Surface-
induced dissociation in a Fourier transform ion cyclotron resonance mass spectrometer:
Instrument design and evaluation. Anal Chem 74, 3255–3261.
24. Brodbelt, J. S., Wilson, J. J. (2009). Infrared multiphoton dissociation in quadrupole ion
traps. Mass Spectrom Rev 28, 390–424.
25. Little, D. P., Speir, J. P., Senko,M.W., O’Connor, P. B.,McLafferty, F.W. (1994). Infrared
multiphoton dissociation of large multiply charged ions for biomolecule sequencing.
Anal Chem 66, 2809–2815.
26. Zhang, L., Reilly, J. P. (2009). Peptide photodissociation with 157Nm light in a
commercial tandem time-of-flight mass spectrometer. Anal Chem 81, 7829–7838.
27. Dunbar, R. C. (2004). Bird (blackbody infrared radiative dissociation): Evolution,
principles, and applications. Mass Spectrom Rev 23, 127–158.
28. Wilson, J. J., Brodbelt, J. S. (2006). Infrared multiphoton dissociation for enhanced de
novo sequence interpretation of N-terminal sulfonated peptides in a quadrupole ion trap.
Anal Chem 78, 6855–6862.
29. Kim, T.-Y., Thompson,M. S., Reilly, J. P. (2005). Peptide photodissociation at 157Nm in
a linear ion trap mass spectrometer. Rapid Commun Mass Spectrom 19, 1657–1665.
30. Bowers, W. D., Delbert, S. S., Hunter, R. L., McIver, R. T. (1984). Fragmentation of
oligopeptide ions using ultraviolet laser radiation and Fourier transform mass spectrom-
etry. J Am Chem Soc 106, 7288–7289.
31. Martin, S. A., Hill, J. A., Kittrell, C., Biemann, K. Photon-induced dissociation with a
four-sector tandem mass spectrometer. J Am Soc Mass Spectrom 1, 107–109.
32. Oh, J. Y.,Moon, J. H., Kim,M. S. (2004). Sequence- and site-specific photodissociation at
266Nm of protonated synthetic polypeptides containing a tryptophanyl residue. Rapid
Commun Mass Spectrom 18, 2706–2712.
33. Wilson, J. J., Brodbelt, J. S. (2007). Ms/Ms simplification by 355Nm ultraviolet
photodissociation of chromophore-derivatized peptides in a quadrupole ion trap. Anal
Chem 79, 7883–7892.
34. Reilly, J. P. (2009). Ultraviolet photofragmentation of biomolecular ions.Mass Spectrom
Rev 28, 425–447.
35. Madsen, J. A., Boutz, D. R., Brodbelt, J. S. Ultrafast ultraviolet photodissociation at
193Nm and its applicability to proteomic workflows. J Proteome Res 9, 4205–4214.
36. Kalcic, C. L., Gunaratne, T. C., Jones, A.D., Dantus,M., Reid, G. E. (2009). Femtosecond
laser-induced ionization/dissociation of protonated peptides. J Am Chem Soc 131,940–942.
37. Smith, S. A., Kalcic, C. L., Safran, K. A., Stemmer, P. M., Dantus, M., Reid, G. E. (2010).
Enhanced characterization of singly protonated phosphopeptide ions by femtosecond
laser-induced ionization/dissociation tandem mass spectrometry (fs-LID-MS/MS).
J Am Soc Mass Spectrom 21, 2031–2040.
38. Zubarev, R.A., Kelleher, N. L.,McLafferty, F.W. (1998). Electron capture dissociation of
multiply charged protein cations:A nonergodic process. JAmChemSoc 120, 3265–3266.
39. Cooper, H. J., Ha�kansson, K., Marshall, A. G. (2005). The role of electron capture
dissociation in biomolecular analysis. Mass Spectrom Rev 24, 201–222.
40. Zubarev, R. A. (2004). Electron-capture dissociation tandem mass spectrometry.
Curr Opin Biotechnol 15, 12–16.
REFERENCES 83
41. Meng, F., Forbes, A. J.,Miller, L.M.,Kelleher, N. L. (2005).Detection and localization of
protein modifications by high resolution tandem mass spectrometry.Mass Spectrom Rev
24, 126–134.
42. Zubarev, R.A., Kruger,N.A., Fridriksson, E.K., Lewis,M.A.,Horn,D.M.,Carpenter, B.
K., McLafferty, F. W. (1999). Electron capture dissociation of gaseous multiply-charged
proteins is favored at disulfide bonds and other sites of high hydrogen atom affinity.
J Am Chem Soc 121, 2857–2862.
43. Kelleher, N. L., Zubarev, R. A., Bush, K., Furie, B., Furie, B. C., McLafferty, F. W.,
Walsh, C. T. (1999). Localization of labile posttranslational modifications by electron
capture dissociation: The case of g-carboxyglutamic acid. Anal Chem 71, 4250–4253.
44. Shi, S.D.H.,Hemling,M.E., Carr, S.A.,Horn,D.M., Lindh, I.,McLafferty, F.W. (2000).
Phosphopeptide/phosphoprotein mapping by electron capture dissociation mass spec-
trometry. Anal Chem 73, 19–22.
45. Mirgorodskaya, E., Roepstorff, P., Zubarev, R. A. (1999). Localization of O-glycosyla-
tion sites in peptides by electron capture dissociation in a Fourier transform mass
spectrometer. Anal Chem 71, 4431–4436.
46. Syrstad, E. A., Turecek, F. (2005). Toward a general mechanism of electron capture
dissociation. J Am Soc Mass Spectrom 16, 208–224.
47. Zubarev, R. A., Zubarev, A. R., Savitski, M. M. (2008). Electron capture/transfer versus
collisionally activated/induced dissociations: Solo or duet? J Am Soc Mass Spectrom 19,753–761.
48. Savitski,M.M., Nielsen, M. L., Kjeldsen, F., Zubarev, R. A. (2005). Proteomics-grade de
novo sequencing approach. J Proteome Res 4, 2348–2354.
49. Cournoyer, J. J., Pittman, J. L., Ivleva, V. B., Fallows, E., Waskell, L., Costello, C. E.,
O’Connor, P. B. (2005). Deamidation: Differentiation of aspartyl from isoaspartyl
products in peptides by electron capture dissociation. Protein Sci 14, 452–463.
50. Cournoyer, J. J., Lin, C., Bowman,M. J., O’Connor, P. B. (2007). Quantitating the relative
abundance of isoaspartyl residues in deamidated proteins by electron capture dissocia-
tion. J Am Soc Mass Spectrom 18, 48–56.
51. O’Connor, P. B., Lin, C., Cournoyer, J. J., Pittman, J. L., Belyayev, M., Budnik, B. A.
(2006). Long-lived electron capture dissociation product ions experience radical migra-
tion via hydrogen abstraction. J Am Soc Mass Spectrom 17, 576–585.
52. Savitski, M. M., Kjeldsen, F., Nielsen, M. L., Zubarev, R. A. (2007). Hydrogen
rearrangement to and from radical Z fragments in electron capture dissociation of
peptides. J Am Soc Mass Spectrom 18, 113–120.
53. Tsybin, Y. O., He, H., Emmett, M. R., Hendrickson, C. L., Marshall, A. G. (2007).
Ion activation in electron capture dissociation to distinguish between N-terminal and
C-terminal product ions. Anal Chem 79, 7596–7602.
54. Cooper, H. J., Hudgins, R. R., Hakansson, K., Marshall, A. G. (2003). Secondary
fragmentation of linear peptides in electron capture dissociation. Int J Mass Spectrom
228, 723–728.
55. Savitski, M. M., Nielsen, M. L., Zubarev, R. A. (2007). Side-chain losses in electron
capture dissociation to improve peptide identification. Anal Chem 79, 2296–2302.
56. Li, X., Lin, C., Han, L., Costello, C. E., O’Connor, P. B. (2010). Charge remote
fragmentation in electron capture and electron transfer dissociation. J Am Soc Mass
Spectrom 21, 646–656.
84 ION ACTIVATION AND MASS ANALYSIS IN PROTEIN MASS SPECTROMETRY
57. Leymarie, N., Costello, C. E., O’Connor, P. B. (2003). Electron capture dissociation
initiates a free radical reaction cascade. J Am Chem Soc 125, 8949–8958.
58. Horn, D.M., Ge, Y.,McLafferty, F.W. (2000). Activated ion electron capture dissociation
for mass spectral sequencing of larger (42 kDa) proteins. Anal Chem 72, 4778–4784.
59. Creese, A. J., Cooper, H. J. (2008). The effect of phosphorylation on the electron capture
dissociation of peptide ions. J Am Soc Mass Spectrom 19, 1263–1274.
60. Sze, S. K., Ge, Y., Oh, McLafferty, F.W. (2003). Plasma electron capture dissociation for
the characterization of large proteins by top down mass spectrometry. Anal Chem 75,1599–1603.
61. Kjeldsen, F., Haselmann, K. F., Budnik, B. A., Jensen, F., Zubarev, R. A. (2002).
Dissociative capture of hot (3–13Ev) Electrons by polypeptide polycations: An efficient
process accompanied by secondary fragmentation. Chem Phys Lett 356, 201–206.
62. Tsybin, Y. O., Witt, M., Baykut, G., Ha�kansson, P. (2004). Electron capture dissociation
Fourier transform ion cyclotron resonancemass spectrometry in the electron energy range
0–50 Ev. Rapid Commun Mass Spectrom 18, 1607–1613.
63. Zubarev,R.A. (2003). Reactions of polypeptide ionswith electrons in the gas phase.Mass
Spectrom Rev 22, 57–77.
64. Budnik, B.A.,Haselmann,K. F., Zubarev, R.A. (2001). Electron detachment dissociation
of peptide di-anions: An electron-hole recombination phenomenon.ChemPhys Lett 342,299–302.
65. Wolff, J. J., Amster, I. J., Chi, L., Linhardt, R. J. (2007). Electron detachment dissociation
of glycosaminoglycan tetrasaccharides. J Am Soc Mass Spectrom 18, 234–244.
66. Fung, Y. M. E., Adams, C. M., Zubarev, R. A. (2009). Electron ionization dissociation of
singly and multiply charged peptides. J Am Chem Soc 131, 9977–9985.
67. Syka, J. E. P., Coon, J. J., Schroeder, M. J., Shabanowitz, J., Hunt, D. F. (2004). Peptide
and protein sequence analysis by electron transfer dissociation mass spectrometry. Proc
Nat Acad Sci USA 101, 9528–9533.
68. Satake, H., Hasegawa, H., Hirabayashi, A., Hashimoto, Y., Baba, T., Masuda, K. (2007).
Fastmultiple electron capture dissociation in a linear radio frequencyquadrupole ion trap.
Anal Chem 79, 8755–8761.
69. Gunawardena, H. P., He, M., Chrisman, P. A., Pitteri, S. J., Hogan, J. M., Hodges, B. D.
M.,McLuckey, S. A. (2005). Electron transfer versus proton transfer in gas-phase ion/ion
reactions of polyprotonated peptides. J Am Chem Soc 127, 12627–12639.
70. Xia, Y., Gunawardena, H. P., Erickson, D. E., McLuckey, S. A. (2007). Effects of cation
charge-site identity and position on electron-transfer dissociation of polypeptide cations.
J Am Chem Soc 129, 12232–12243.
71. Coon, J. J., Ueberheide, B., Syka, J. E. P., Dryhurst, D. D., Ausio, J., Shabanowitz, J.,
Hunt, D. F. (2005). Protein identification using sequential ion/ion reactions and tandem
mass spectrometry. Proc Nat Acad Sci USA 102, 9463–9468.
72. Mikesh, L. M., Ueberheide, B., Chi, A., Coon, J. J., Syka, J. E. P., Shabanowitz, J., Hunt,
D. F. (2006). The utility of ETD mass spectrometry in proteomic analysis. Biochim
Biophys Acta (BBA)–Proteins Proteomics 1764, 1811–1822.
73. O’Connor, P. B., Cournoyer, J. J., Pitteri, S. J., Chrisman, P. A., McLuckey, S. A. (2006).
Differentiation of aspartic and isoaspartic acids using electron transfer dissociation. J Am
Soc Mass Spectrom 17, 15–19.
REFERENCES 85
74. Wiesner, J., Premsler, T., Sickmann, A. (2008). Application of electron transfer dissocia-
tion (ETD) for the analysis of posttranslational modifications. Proteomics 8, 4466–4483.
75. Swaney, D. L., McAlister, G. C., Wirtala, M., Schwartz, J. C., Syka, J. E. P., Coon, J. J.
(2006). Supplemental activation method for high-efficiency electron-transfer dissocia-
tion of doubly protonated peptide precursors. Anal Chem 79, 477–485.
76. Vasicek, L., Brodbelt, J. S. (2009). Enhanced electron transfer dissociation through fixed
charge derivatization of cysteines. Anal Chem 81, 7876–7884.
77. Coon, J. J., Shabanowitz, J., Hunt, D. F., Syka, J. E. P. (2005). Electron transfer
dissociation of peptide anions. J Am Soc Mass Spectrom 16, 880–882.
78. Hodyss, R., Cox, H. A., Beauchamp, J. L. (2005). Bioconjugates for tunable peptide
fragmentation: Free radical initiated peptide sequencing (FRIPS). J Am Chem Soc 127,12436–12437.
79. Berkout, V. D. (2006). Fragmentation of protonated peptide ions via interaction with
metastable atoms. Anal Chem 78, 3055–3061.
80. Cook, S. L., Collin, O. L., Jackson, G. P. (2009). Metastable atom-activated dissociation
mass spectrometry: Leucine/isoleucine differentiation and ring cleavage of proline
residues. J Mass Spectrom 44, 1211–1223.
81. Weickhardt, C., Moritz, F., Grotemeyer, J. (1996). Time-of-flight mass spectrometry:
State-of-the-art in chemical analysis and molecular science. Mass Spectrom Rev 15,139–162.
82. Wiley, W. C., McLaren, I. H. (1955). Time-of-flight mass spectrometer with improved
resolution. Rev Sci Instr 26, 1150–1157.
83. Brown, R. S., Lennon, J. J. (1995). Mass resolution improvement by incorporation of
pulsed ion extraction in a matrix-assisted laser desorption/ionization linear time-of-flight
mass spectrometer. Anal Chem 67, 1998–2003.
84. Vestal, M. L., Juhasz, P., Martin, S. A. (1995). Delayed extraction matrix-assisted laser
desorption time-of-flight mass spectrometry. Rapid Commun Mass Spectrom 9,1044–1050.
85. Mamyrin, B. A., Karataev, V. I., Shmikk, D. V., Zagulin, V. A. (1973). The mass-
reflectron, a new nonmagnetic time-of-flight mass spectrometer with high resolution.
Soviet Phys JETP 37, 45–48.
86. Morris, H. R., Paxton, T., Dell, A., Langhorne, J., Berg, M., Bordoli, R. S., Hoyes, J.,
Bateman, R. H. (1996). High sensitivity collisionally-activated decomposition tandem
mass spectrometry on a novel quadrupole/orthogonal-acceleration time-of-flight mass
spectrometer. Rapid Commun Mass Spectrom 10, 889–896.
87. Chernushevich, I. V., Loboda, A. V., Thomson, B. A. (2001). An introduction to
quadrupole–time-of-flight mass spectrometry. J Mass Spectrom 36, 849–865.
88. Spengler, B. (1997). Post-source decay analysis in matrix-assisted laser desorption/
ionization mass spectrometry of biomolecules. J Mass Spectrom 32, 1019–1036.
89. Dawson, P. H. (1995) Quadrupole Mass Spectrometry and Its Applications. Springer,
New York.
90. Hunt, D. F., Shabanowitz, J., Giordani, A. B. (1980). Collision activated decompositions
in mixture analysis with a triple quadrupole mass spectrometer. Anal Chem 52, 386–390.
91. Perchalski, R. J., Yost, R. A., Wilder, B. J. (1982). Structural elucidation of drug
metabolites by triple-quadrupole mass spectrometry. Anal Chem 54, 1466–1471.
86 ION ACTIVATION AND MASS ANALYSIS IN PROTEIN MASS SPECTROMETRY
92. Hunt, D. F., Yates, J. R., Shabanowitz, J., Winston, S., Hauer, C. R. (1986). Protein
sequencing by tandem mass-spectrometry. Proc Nat Acad Sci USA 83, 6233–6237.
93. Lange, V., Picotti, P., Domon, B., Aebersold, R. (2008). Selected reaction monitoring for
quantitative proteomics: A tutorial. Mol Syst Biol 4, 222.
94. Schwartz, J. C., Senko, M. W., Syka, J. E. P. (2002). A two-dimensional quadrupole ion
trap mass spectrometer. J Am Soc Mass Spectrom 13, 659–669.
95. Douglas, D. J., Frank, A. J., Mao, D. (2005). Linear ion traps in mass spectrometry.
Mass Spectrom Rev 24, 1–29.
96. March, R. E. (1992). Ion trap mass spectrometry. Int J Mass Spectrom Ion Processes
118–119, 71–135.
97. March, R. E. (1997). An introduction to quadrupole ion trap mass spectrometry. J Mass
Spectrom 32, 351–369.
98. March, R. E. (2000). Quadrupole ion trap mass spectrometry: A view at the turn of the
century. Int J Mass Spectrom 200, 285–312.
99. Amster, I. J. (1996). Fourier transform mass spectrometry. J Mass Spectrom 31,1325–1337.
100. Marshall, A. G., Hendrickson, C. L., Jackson, G. S. (1998). Fourier transform ion
cyclotron resonance mass spectrometry: A primer. Mass Spectrom Rev 17, 1–35.
101. Zhang, L.-K., Rempel, D., Pramanik, B. N., Gross, M. L. (2005). Accurate mass
measurements by fourier transformmass spectrometry.Mass Spectrom Rev 24, 286–309.
102. Guan, S.,Marshall, A.G. (1996). Storedwaveform inverse fourier transform (SWIFT) ion
excitation in trapped-ion mass spectometry: Theory and applications. Int J Mass
Spectrom Ion Processes 157–158, 5–37.
103. Bogdanov, B., Smith, R. D. (2005). Proteomics by FTICR mass spectrometry: Top down
and bottom up. Mass Spectrom Rev 24, 168–200.
104. Marshall, A. G., Rodgers, R. P. (2003). Petroleomics: The next grand challenge for
chemical analysis. Accounts Chem Res 37, 53–59.
105. Hardman, M., Makarov, A. A. (2003). Interfacing the orbitrap mass analyzer to an
electrospray ion source. Anal Chem 75, 1699–1705.
106. Hu, Q., Noll, R. J., Li, H., Makarov, A., Hardman, M., Graham Cooks, R. (2005). The
orbitrap: A new mass spectrometer. J Mass Spectrom 40, 430–443.
107. Perry, R. H., Cooks, R. G., Noll, R. J. (2008). Orbitrap mass spectrometry: Instrumenta-
tion, ion motion and applications. Mass Spectrom Rev 27, 661–699.
108. Olsen, J. V., Macek, B., Lange, O., Makarov, A., Horning, S., Mann, M. (2007). Higher-
energy C-trap dissociation for peptide modification analysis. Nat Meth 4, 709–712.
109. Olsen, J. V., Schwartz, J. C., Griep-Raming, J., Nielsen, M. L., Damoc, E., Denisov, E.,
Lange, O., Remes, P., Taylor, D., Splendore, M.,Wouters, E. R., Senko, M., Makarov, A.,
Mann, M., Horning, S. (2009). A dual pressure linear ion trap orbitrap instrument with
very high sequencing speed. Mol Cell Proteomics 8, 2759–2769.
110. McAlister, G. C., Phanstiel, D., Good, D. M., Berggren, W. T., Coon, J. J. (2007).
Implementation of electron-transfer dissociation on a hybrid linear ion trap-orbitrapmass
spectrometer. Anal Chem 79, 3525–3534.
111. McAlister, G. C., Berggren,W. T., Griep-Raming, J., Horning, S.,Makarov, A., Phanstiel,
D., Stafford, G., Swaney, D. L., Syka, J. E. P., Zabrouskov, V., Coon, J. J. (2008). A
REFERENCES 87
proteomics grade electron transfer dissociation-enabled hybrid linear ion trap-orbitrap
mass spectrometer. J Proteome Res 7, 3127–3136.
112. Bantscheff, M., Boesche, M., Eberhard, D., Matthieson, T., Sweetman, G., Kuster, B.
(2008). Robust and sensitive iTRAQ quantification on an LTQ-orbitrap mass spectrome-
ter. Mol Cell Proteomics 7, 1702–1713.
113. Clemmer, D. E., Jarrold, M. F. (1997). Ion mobility measurements and their applications
to clusters and biomolecules. J Mass Spectrom 32, 577–592.
114. Kanu, A. B., Dwivedi, P., Tam, M., Matz, L., Hill, H. H. (2008). Ion mobility–mass
spectrometry. J Mass Spectrom 43, 1–22.
115. Tang, K., Shvartsburg, A. A., Lee, H.-N., Prior, D. C., Buschbach, M. A., Li, F.,
Tolmachev, A. V., Anderson, G. A., Smith, R. D. (2005). High-sensitivity ion mobility
spectrometry/mass spectrom using electrodynamic ion funnel interfaces. Anal Chem 77,3330–3339.
116. Pringle, S. D., Giles, K., Wildgoose, J. L., Williams, J. P., Slade, S. E., Thalassinos, K.,
Bateman, R. H., Bowers, M. T., Scrivens, J. H. (2007). An investigation of the mobility
separation of some peptide and protein ions using a new hybrid quadrupole/travelling
wave IMS/oa-TOF instrument. Int J Mass Spectrom 261, 1–12.
88 ION ACTIVATION AND MASS ANALYSIS IN PROTEIN MASS SPECTROMETRY