Embed Size (px)
Citation preview
IJESR Volume 2, Issue 4 ISSN: 2347-6532 __________________________________________________________
A Monthly Double-Blind Peer Reviewed Refereed Open Access International e-Journal - Included in the International Serial Directories Indexed & Listed at: Ulrich's Periodicals Directory ©, U.S.A., Open J-Gage as well as in Cabell’s Directories of Publishing Opportunities, U.S.A.
International Journal of Engineering & Scientific Research http://www.ijmra.us
143
April 2014
PROTECTION AND INDIGENIZATION LEVELS IN
PAKISTAN AUTOMOBILE INDUSTRY FROM 1995 TO
2005
Muhammad Aqil*
Seemab Qadeer**
Dr. Rizwan Raheem Ahmed***
Munawar Ali Qureshi****
ABSTRACT
The automobile industry in Pakistan is one of the most significant sectors in large scale
manufacturing industries. The industry was given protection against the foreign competition up
to a large extent. This paper gives a detailed analysis on degree of protection from 1995 to 2005.
In addition to this, it studies the level of indigenization the automobile firms achieved over a
period of time. The investigation reveals that despite the high degree of protection, the industry
could not achieve the deletion objectives as set by the authorities. Therefore, this is inevitable to
review the policy and set new objectives.
Key Words: Automobile, Indigenization, Protection, Deletion, industry
* Assistant Professor, Commerce Department, Defence Authority Degree College, Karachi, Pakistan
** Assistant Professor, Economics Department, Defence Authority Degree College, Karachi, Pakistan
*** Professor, Department of Business Administration & Commerce, Indus University, Karachi, Pakistan.
**** Assistant Professor, Commerce Department, Defence Authority Degree College, Karachi, Pakistan
IJESR Volume 2, Issue 4 ISSN: 2347-6532 __________________________________________________________
A Monthly Double-Blind Peer Reviewed Refereed Open Access International e-Journal - Included in the International Serial Directories Indexed & Listed at: Ulrich's Periodicals Directory ©, U.S.A., Open J-Gage as well as in Cabell’s Directories of Publishing Opportunities, U.S.A.
International Journal of Engineering & Scientific Research http://www.ijmra.us
144
April 2014
1. BACKGROUND
Automobile industry is one of the important industries in large scale manufacturing sector
of Pakistan. The history of the industry started when General Motors and Sales Company was
established in 1949. Bedford truck was the first vehicle which was assembled in the country.
After tha, many other firms entered the market and the industry grew rapidly during pre-
nationalization period. In 1970s, the industry was nationalized along with many other industries.
Though, the nationalization period proved to be a good era for auto sector, the size of state-
owned enterprises expanded to an unmanageable extent. Therefore, there was a demand for
privatization.
During the regime of Gen.(r) Ziaul Haq, the process of denationalization and deregulation
started. Although the efforts were more directed towards political benefits, they opened the door
for for foreign investment and liberalization of the industrial sector. During 1990s, the
privatization process started and eight out of fifteen automobile units were sold out to private
sector. That privatization brought about many positive and negative changes in the auto industry.
The policies of government exposed the industry to open market competition when it allowed
zero-rated import of cars under the Yellow-Cab scheme. As a result, the output of vehicles
declined drastically from 65,000 units per year to 45,000 units per annum. The positive aspect of
privatization was the entry of foreign firms.
The industry struggled a lot during 1995-2000. However, the post 2000 scenario was
good as the sector got many the supporting factors to boost up the industry. These factors
included the availability of auto finance, rise in foreign remittances, rapid economic growth and
the efforts made by the government. The industry experienced a very high growth rate from 2001
to 2005. However, the growth process was interrupted by tight monetary policy, political
instability and decline in home remittances.
2. PROTECTIONISM IN PAKISTAN
The automobile industry of Pakistan had been well protected by means of tariff and non-
tariff barriers. The objective of this protectionism was to enable the industry to achieve the
desired level of indigenization. Following is the analysis of protection policy of the industry
from 1995 to 2005.
IJESR Volume 2, Issue 4 ISSN: 2347-6532 __________________________________________________________
A Monthly Double-Blind Peer Reviewed Refereed Open Access International e-Journal - Included in the International Serial Directories Indexed & Listed at: Ulrich's Periodicals Directory ©, U.S.A., Open J-Gage as well as in Cabell’s Directories of Publishing Opportunities, U.S.A.
International Journal of Engineering & Scientific Research http://www.ijmra.us
145
April 2014
2.1 History of Protection Policy
The industrial sector in Pakistan had been protected against the foreign competition
immediately independence. This protectionism continued even during 1995-2005. The
authorities imposed various tariff and non-tariff barriers. In addition to this, the import of new or
used vehicles was discouraged by high import duties. Nevertheless, in 1990, the government
started liberalization process when Mr. Nawaz Sharif announced the Yellow Cab Scheme. The
industry could no able bear the shock of open competition. As a result, the government was once
again forced to take measures to protect the industry. The steps included imposing a ban on
import of used cars, charging high rate of custom duty on Completely Built Units (CBU) and the
creating a gap between the duty structures of CBU and CKD kits. The same policy carried on
with some minor changes till 1994. After 1994, the Economic Committee of Cabinet (ECC)
decided to reduce the import duty on CKD units of 1000 cc, 1300 cc and 1600 cc from 40% to
10%. However, the committee suggested carrying on the complete ban on the import of used cars
which were older for two or more years. In addition to this, a 25% depreciation allowance on
second hand cars was also withdrawn. In 1995, the tax rate on CKD and CBU was also
simplified. Different categories of import duties and taxes were converted into one category of
duty to 30% on CKD and assembled vehicles. Sales tax at the rate of 15% was imposed on the
total cost. On the other hand, the minimum import duty on CBU of 1000 cc was set to 100%.
2.2 Import of Used Vehicles
Theoretically, the import of new or used vehicles was not banned in the country during
1995-2005. In practice, however, the high tariff structure discouraged the importers. So, the
imports of completely built up units became very difficult. The issue for importing used cars had
been a very debatable topic in the country since the introduction of Yellow Cab Scheme.
2.3 Tariff Barriers
Tariff barrier is a very effective conventional tool against the competition of foreign
manufacturers. Although, the tool was losing its effectiveness in a post WTO scenario, the
custom duty had been sheltering the domestic Original Equipment Manufacturers to a great
extent. However, the government kept on reducing tariff barriers from 2001 to 2005 in
compliance with the WTO regulations.
IJESR Volume 2, Issue 4 ISSN: 2347-6532 __________________________________________________________
A Monthly Double-Blind Peer Reviewed Refereed Open Access International e-Journal - Included in the International Serial Directories Indexed & Listed at: Ulrich's Periodicals Directory ©, U.S.A., Open J-Gage as well as in Cabell’s Directories of Publishing Opportunities, U.S.A.
International Journal of Engineering & Scientific Research http://www.ijmra.us
146
April 2014
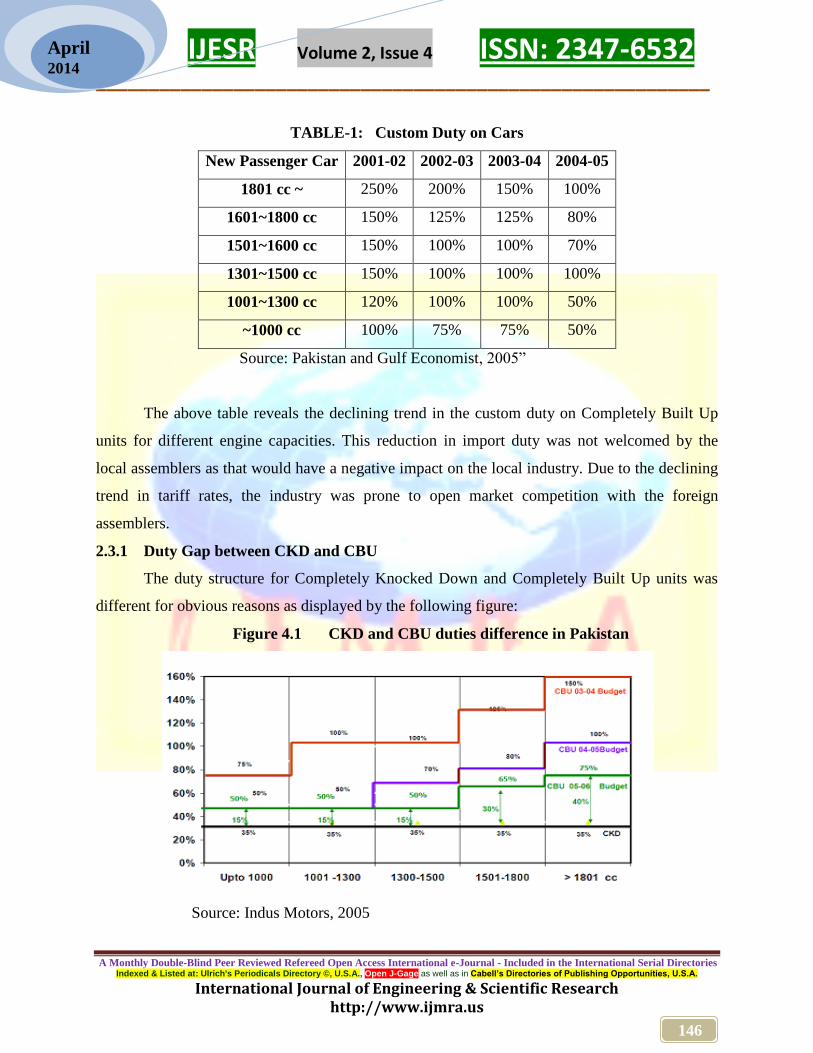
TABLE-1: Custom Duty on Cars
New Passenger Car 2001-02 2002-03 2003-04 2004-05
1801 cc ~ 250% 200% 150% 100%
1601~1800 cc 150% 125% 125% 80%
1501~1600 cc 150% 100% 100% 70%
1301~1500 cc 150% 100% 100% 100%
1001~1300 cc 120% 100% 100% 50%
~1000 cc 100% 75% 75% 50%
Source: Pakistan and Gulf Economist, 2005”
The above table reveals the declining trend in the custom duty on Completely Built Up
units for different engine capacities. This reduction in import duty was not welcomed by the
local assemblers as that would have a negative impact on the local industry. Due to the declining
trend in tariff rates, the industry was prone to open market competition with the foreign
assemblers.
2.3.1 Duty Gap between CKD and CBU
The duty structure for Completely Knocked Down and Completely Built Up units was
different for obvious reasons as displayed by the following figure:
Figure 4.1 CKD and CBU duties difference in Pakistan
Source: Indus Motors, 2005

IJESR Volume 2, Issue 4 ISSN: 2347-6532 __________________________________________________________
A Monthly Double-Blind Peer Reviewed Refereed Open Access International e-Journal - Included in the International Serial Directories Indexed & Listed at: Ulrich's Periodicals Directory ©, U.S.A., Open J-Gage as well as in Cabell’s Directories of Publishing Opportunities, U.S.A.
International Journal of Engineering & Scientific Research http://www.ijmra.us
147
April 2014
So, the policy makers attempted to discourage the import of vehicles and encouraged the
localization of parts. However, the government had a tendency to reducing the gap between CBU
and CKD. The narrow gap of tariffs between Completely Built Up and Completely Knocked
Down had dual impact on the industry. One aspect was that the local Original Equipment
Manufacturers were also forced to achieve maximum indigenization level. The other aspect was
that the local industry would be exposed to free market competition.
2.3.2 A Comparative analysis of Duty Structure with Regional Countries
At this point, it would be of value to compare the duty structure prevailing in the
domestic industry with the Indian auto sector. The following picture summarizes the duty
structure for CBU and CKD from 2004 to 2005.
Figure 1 Comparison of Trade Barriers – Pakistan & India
Source: Indus Motors, 2005
The above figure reveals that the automobile industry of India was also protected by tariff
and non-tariff barriers. The non-tariff barriers were the establishment of testing agency, higher
registration charges and submission of pre-shipment certificate. Therefore, the Indian industry,
unlike Pakistan’s auto sector, had greater reliance on non-tariff barriers. Further, the Indian
Industry had higher custom duty rate on new cars.
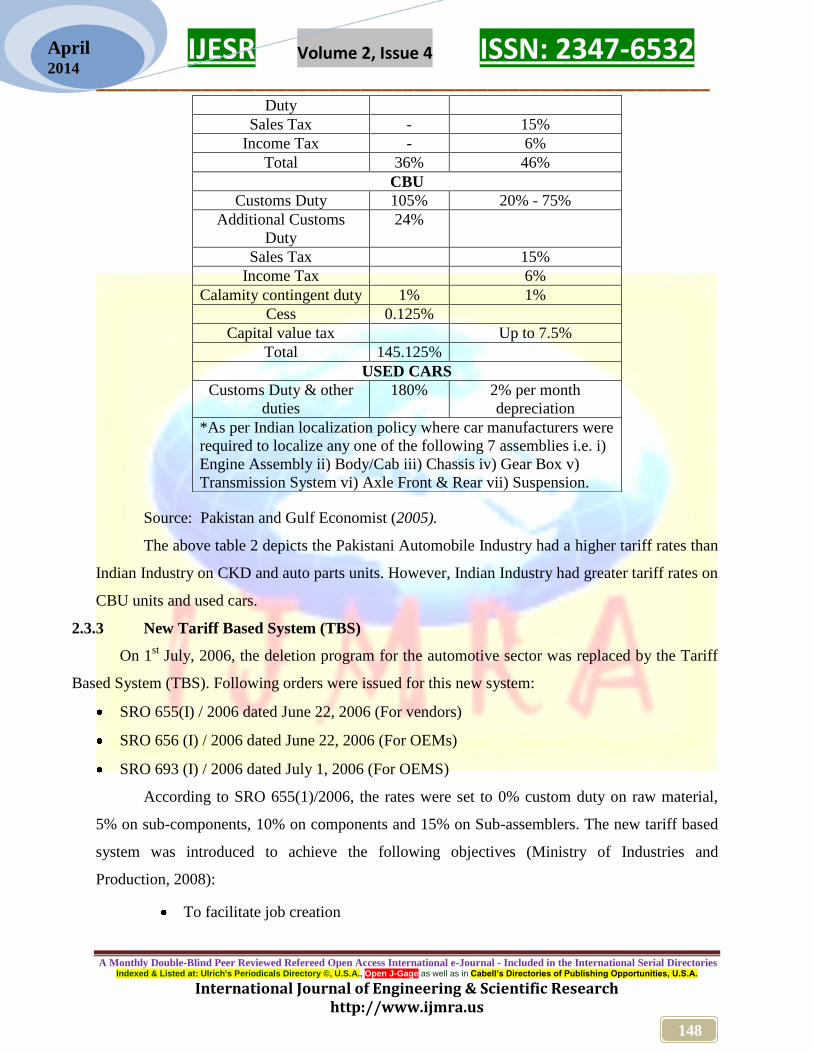
Table 2: Comparative Analysis of Duties in Pakistan and India-2005
CKD DUTY INDIA PAKISTAN
Customs Duty *20% 35 %
Sales Tax/VAT *16% 15%
Total 36% 50%
PARTS- FOR MANUFACTURERS
Customs Duty 20% 35%
Additional Customs 16% -
IJESR Volume 2, Issue 4 ISSN: 2347-6532 __________________________________________________________
A Monthly Double-Blind Peer Reviewed Refereed Open Access International e-Journal - Included in the International Serial Directories Indexed & Listed at: Ulrich's Periodicals Directory ©, U.S.A., Open J-Gage as well as in Cabell’s Directories of Publishing Opportunities, U.S.A.
International Journal of Engineering & Scientific Research http://www.ijmra.us
148
April 2014
Source: Pakistan and Gulf Economist (2005).
The above table 2 depicts the Pakistani Automobile Industry had a higher tariff rates than
Indian Industry on CKD and auto parts units. However, Indian Industry had greater tariff rates on
CBU units and used cars.
2.3.3 New Tariff Based System (TBS)
On 1st July, 2006, the deletion program for the automotive sector was replaced by the Tariff
Based System (TBS). Following orders were issued for this new system:
SRO 655(I) / 2006 dated June 22, 2006 (For vendors)
SRO 656 (I) / 2006 dated June 22, 2006 (For OEMs)
SRO 693 (I) / 2006 dated July 1, 2006 (For OEMS)
According to SRO 655(1)/2006, the rates were set to 0% custom duty on raw material,
5% on sub-components, 10% on components and 15% on Sub-assemblers. The new tariff based
system was introduced to achieve the following objectives (Ministry of Industries and
Production, 2008):
To facilitate job creation
Duty
Sales Tax - 15%
Income Tax - 6%
Total 36% 46%
CBU
Customs Duty 105% 20% - 75%
Additional Customs
Duty
24%
Sales Tax 15%
Income Tax 6%
Calamity contingent duty 1% 1%
Cess 0.125%
Capital value tax Up to 7.5%
Total 145.125%
USED CARS
Customs Duty & other
duties
180% 2% per month
depreciation
*As per Indian localization policy where car manufacturers were
required to localize any one of the following 7 assemblies i.e. i)
Engine Assembly ii) Body/Cab iii) Chassis iv) Gear Box v)
Transmission System vi) Axle Front & Rear vii) Suspension.

IJESR Volume 2, Issue 4 ISSN: 2347-6532 __________________________________________________________
A Monthly Double-Blind Peer Reviewed Refereed Open Access International e-Journal - Included in the International Serial Directories Indexed & Listed at: Ulrich's Periodicals Directory ©, U.S.A., Open J-Gage as well as in Cabell’s Directories of Publishing Opportunities, U.S.A.
International Journal of Engineering & Scientific Research http://www.ijmra.us
149
April 2014
To Protect the existing & planned investment by the OEMs & Vendors
To attract new investment
To encourage value addition
To introduce new technologies
To widen the consumer base so as to create economies of large scale
The basic framework of tariff based system was as under:
Only those assemblers would be allowed to Import units in CKD condition who had
required assembly facilities and who were registered with the sales tax department.
If the localized parts were imported in CKD form, the duty would be charged at a
high rate.
Those parts which were yet to be indigenized would be allowed at CKD rate of
custom duty.
2.3.4 Effective Protection Rate
Effective Protection Rate is used to determine the degree of protection for an industry.
The automobile industry was one of the most protected industries in the country. The industry
comparatively enjoyed a very high effective protection rate. Following table reveals the effective
protection rate for the industry in 1997:
TABLE-4: Effective Protection Rate to Auto Industry
Vehicle Type IMPORT
%
CKD/ RM
TARIFF
CBU
TARIFF
CKD/
RM
EPR
1500 CC 70% 150% 32% 425%
800 CC 40% 110% 32% 162%
TRACTOR 20% 35% 32% 36%
Vendors using S-Form 30% 45% 20% 56%
Without S-Form 30% 45% 65% 36%
Without S- Form and competing against
smuggled items
30% 20% 65% 1%
Source: Centre for Management and Economic Research, (1997)
Besides the effective protection rate shown in the table 4, the effective protection rate
(EPR) for the industry in 2001 increased quite substantially which ranged from 701 per cent to
5,000 per cent (Sharif and Ahmad, 2001).The rationale for that high protection rate was just to
IJESR Volume 2, Issue 4 ISSN: 2347-6532 __________________________________________________________
A Monthly Double-Blind Peer Reviewed Refereed Open Access International e-Journal - Included in the International Serial Directories Indexed & Listed at: Ulrich's Periodicals Directory ©, U.S.A., Open J-Gage as well as in Cabell’s Directories of Publishing Opportunities, U.S.A.
International Journal of Engineering & Scientific Research http://www.ijmra.us
150
April 2014
enable the industry to achieve targeted indigenization level in compliance with the policies of the
World Trade Organization. Unfortunately, the industry could not meet the commitments and it
indulged in short term benefits for maximization of profit. The high EPR made the local industry
dull, uncompetitive and profit oriented. Regarding profitability, only one example is enough that
Pak Suzuki Motor Company booked the profit of Rs.148.716 million in 2002 as against Rs.52.97
million in 2001. Therefore, the sector was rightly criticized for creating monopoly, offering few
choices to consumers, selling vehicles on higher prices and booking very high rate of profits.
Furthermore, the industry was also entering into the post WTO scenario especially with the
provisions of Trade Related Investment Measures (TRIMS) and Trade Related Intellectual
Property Rights (TRIPS). In those circumstances, the sector was not likely to sustain such a high
rate of protection and the industry had to face a very tough time from the giants of world’s auto
manufacturers. Regardless of the threats from WTO, there was immense pressure from the
dealers of used cars who persuaded the authorities to allow the import of old and reconditioned
vehicles. The dealers had always been attempting in the past to influence the authorities to get a
favorable decision. Once they succeeded in their efforts, the government would be forced to
allow the import of used vehicles with certain relaxed conditions. Therefore, the industry was
required to take serious measures so as to stand confidently on it own toes to cope with the
challenges.
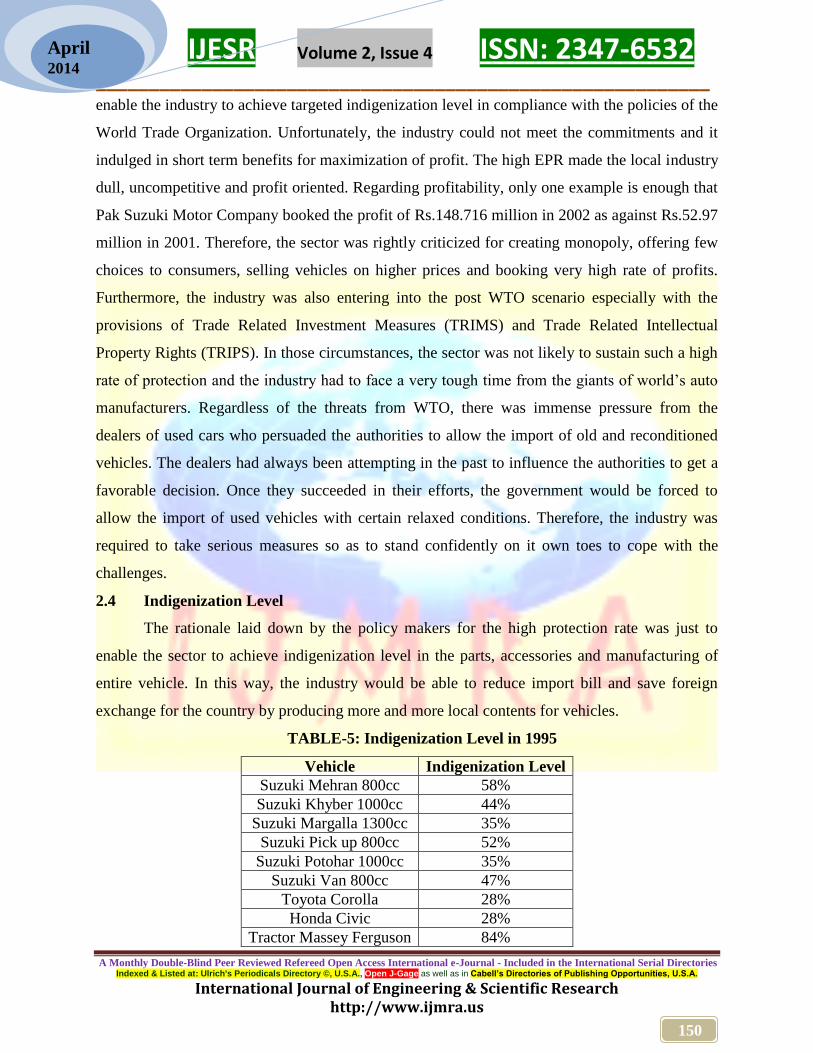
2.4 Indigenization Level
The rationale laid down by the policy makers for the high protection rate was just to
enable the sector to achieve indigenization level in the parts, accessories and manufacturing of
entire vehicle. In this way, the industry would be able to reduce import bill and save foreign
exchange for the country by producing more and more local contents for vehicles.
TABLE-5: Indigenization Level in 1995
Vehicle Indigenization Level
Suzuki Mehran 800cc 58%
Suzuki Khyber 1000cc 44%
Suzuki Margalla 1300cc 35%
Suzuki Pick up 800cc 52%
Suzuki Potohar 1000cc 35%
Suzuki Van 800cc 47%
Toyota Corolla 28%
Honda Civic 28%
Tractor Massey Ferguson 84%
IJESR Volume 2, Issue 4 ISSN: 2347-6532 __________________________________________________________
A Monthly Double-Blind Peer Reviewed Refereed Open Access International e-Journal - Included in the International Serial Directories Indexed & Listed at: Ulrich's Periodicals Directory ©, U.S.A., Open J-Gage as well as in Cabell’s Directories of Publishing Opportunities, U.S.A.
International Journal of Engineering & Scientific Research http://www.ijmra.us
151
April 2014
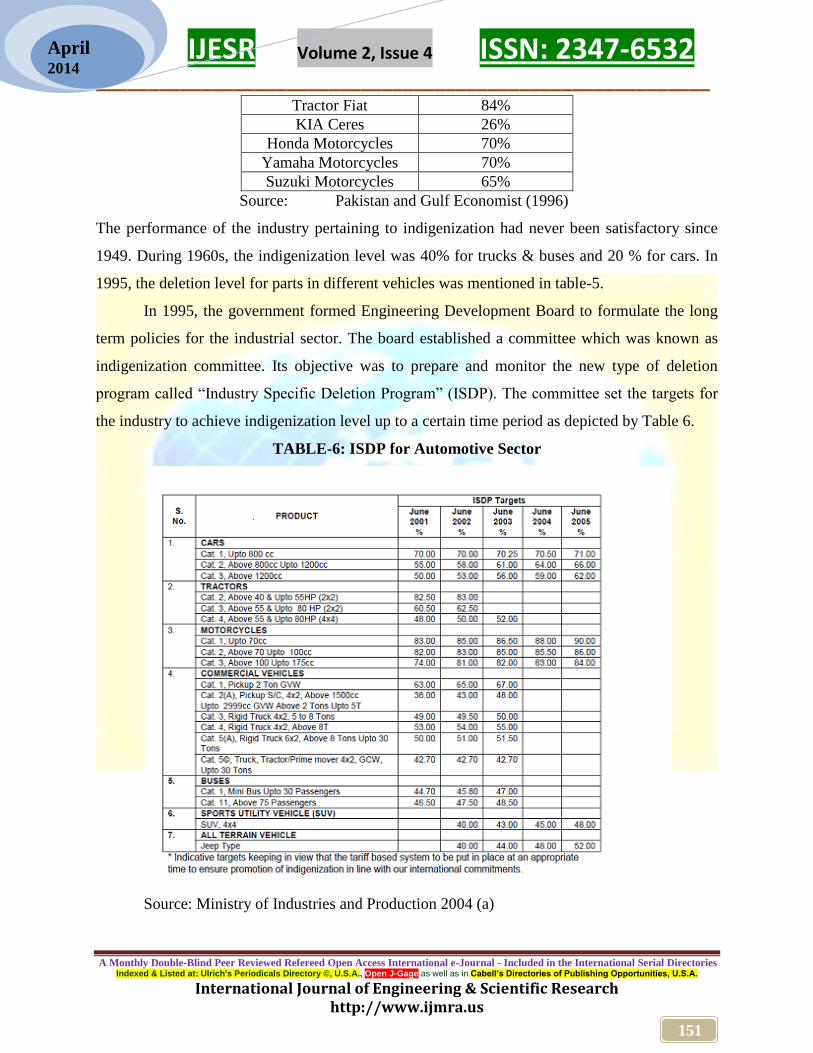
Tractor Fiat 84%
KIA Ceres 26%
Honda Motorcycles 70%
Yamaha Motorcycles 70%
Suzuki Motorcycles 65%
Source: Pakistan and Gulf Economist (1996)
The performance of the industry pertaining to indigenization had never been satisfactory since
1949. During 1960s, the indigenization level was 40% for trucks & buses and 20 % for cars. In
1995, the deletion level for parts in different vehicles was mentioned in table-5.
In 1995, the government formed Engineering Development Board to formulate the long
term policies for the industrial sector. The board established a committee which was known as
indigenization committee. Its objective was to prepare and monitor the new type of deletion
program called “Industry Specific Deletion Program” (ISDP). The committee set the targets for
the industry to achieve indigenization level up to a certain time period as depicted by Table 6.
TABLE-6: ISDP for Automotive Sector
Source: Ministry of Industries and Production 2004 (a)
IJESR Volume 2, Issue 4 ISSN: 2347-6532 __________________________________________________________
A Monthly Double-Blind Peer Reviewed Refereed Open Access International e-Journal - Included in the International Serial Directories Indexed & Listed at: Ulrich's Periodicals Directory ©, U.S.A., Open J-Gage as well as in Cabell’s Directories of Publishing Opportunities, U.S.A.
International Journal of Engineering & Scientific Research http://www.ijmra.us
152
April 2014
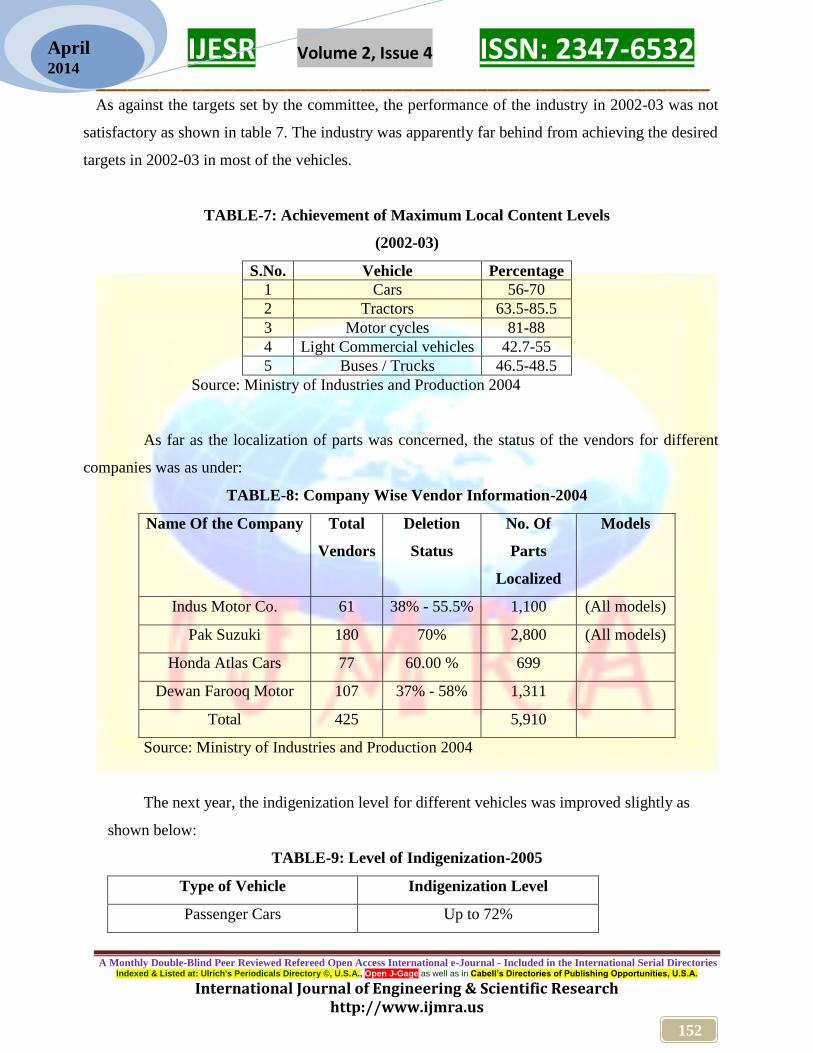
As against the targets set by the committee, the performance of the industry in 2002-03 was not
satisfactory as shown in table 7. The industry was apparently far behind from achieving the desired
targets in 2002-03 in most of the vehicles.
TABLE-7: Achievement of Maximum Local Content Levels
(2002-03)
S.No. Vehicle Percentage
1 Cars 56-70
2 Tractors 63.5-85.5
3 Motor cycles 81-88
4 Light Commercial vehicles 42.7-55
5 Buses / Trucks 46.5-48.5
Source: Ministry of Industries and Production 2004
As far as the localization of parts was concerned, the status of the vendors for different
companies was as under:
TABLE-8: Company Wise Vendor Information-2004
Name Of the Company Total
Vendors
Deletion
Status
No. Of
Parts
Localized
Models
Indus Motor Co. 61 38% - 55.5% 1,100 (All models)
Pak Suzuki 180 70% 2,800 (All models)
Honda Atlas Cars 77 60.00 % 699
Dewan Farooq Motor 107 37% - 58% 1,311
Total 425 5,910
Source: Ministry of Industries and Production 2004
The next year, the indigenization level for different vehicles was improved slightly as
shown below:
TABLE-9: Level of Indigenization-2005
Type of Vehicle Indigenization Level
Passenger Cars Up to 72%
IJESR Volume 2, Issue 4 ISSN: 2347-6532 __________________________________________________________
A Monthly Double-Blind Peer Reviewed Refereed Open Access International e-Journal - Included in the International Serial Directories Indexed & Listed at: Ulrich's Periodicals Directory ©, U.S.A., Open J-Gage as well as in Cabell’s Directories of Publishing Opportunities, U.S.A.
International Journal of Engineering & Scientific Research http://www.ijmra.us
153
April 2014
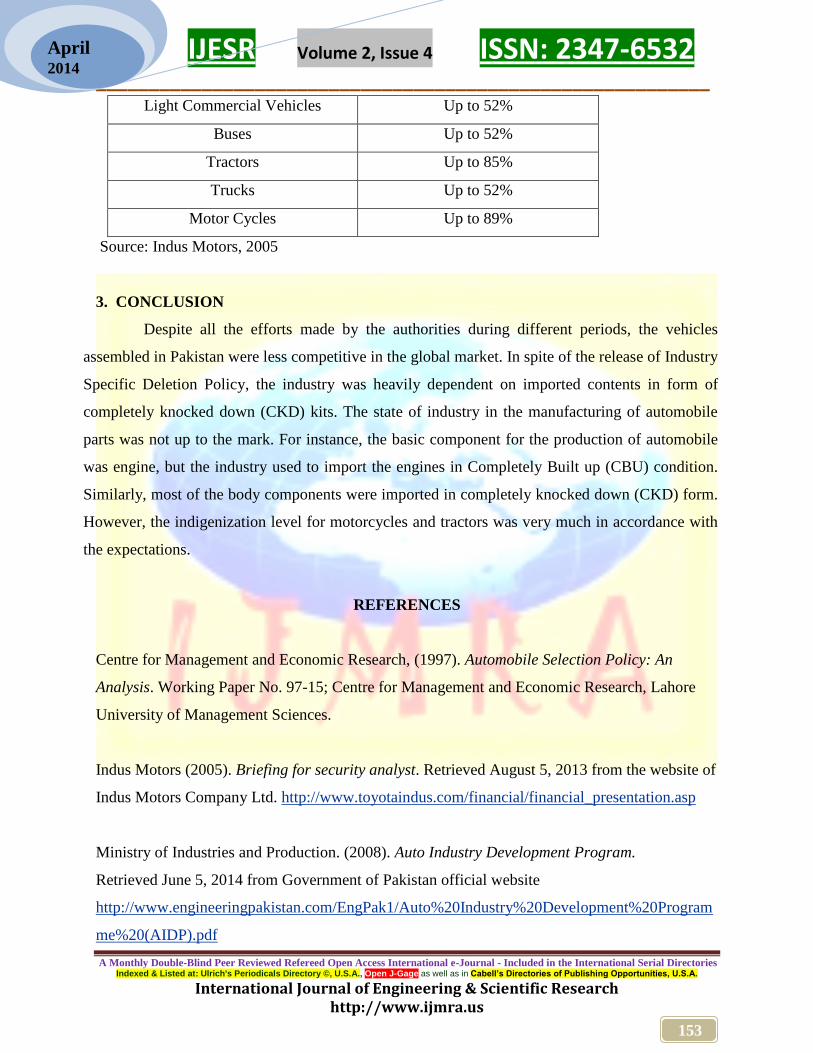
Light Commercial Vehicles Up to 52%
Buses Up to 52%
Tractors Up to 85%
Trucks Up to 52%
Motor Cycles Up to 89%
Source: Indus Motors, 2005
3. CONCLUSION
Despite all the efforts made by the authorities during different periods, the vehicles
assembled in Pakistan were less competitive in the global market. In spite of the release of Industry
Specific Deletion Policy, the industry was heavily dependent on imported contents in form of
completely knocked down (CKD) kits. The state of industry in the manufacturing of automobile
parts was not up to the mark. For instance, the basic component for the production of automobile
was engine, but the industry used to import the engines in Completely Built up (CBU) condition.
Similarly, most of the body components were imported in completely knocked down (CKD) form.
However, the indigenization level for motorcycles and tractors was very much in accordance with
the expectations.
REFERENCES
Centre for Management and Economic Research, (1997). Automobile Selection Policy: An
Analysis. Working Paper No. 97-15; Centre for Management and Economic Research, Lahore
University of Management Sciences.
Indus Motors (2005). Briefing for security analyst. Retrieved August 5, 2013 from the website of
Indus Motors Company Ltd. http://www.toyotaindus.com/financial/financial_presentation.asp
Ministry of Industries and Production. (2008). Auto Industry Development Program.
Retrieved June 5, 2014 from Government of Pakistan official website
http://www.engineeringpakistan.com/EngPak1/Auto%20Industry%20Development%20Program
me%20(AIDP).pdf
IJESR Volume 2, Issue 4 ISSN: 2347-6532 __________________________________________________________
A Monthly Double-Blind Peer Reviewed Refereed Open Access International e-Journal - Included in the International Serial Directories Indexed & Listed at: Ulrich's Periodicals Directory ©, U.S.A., Open J-Gage as well as in Cabell’s Directories of Publishing Opportunities, U.S.A.
International Journal of Engineering & Scientific Research http://www.ijmra.us
154
April 2014
Ministry of Industries and Production. (2004 ). Digest of Industrial Sector. Retrieved June 5,
2013 from Government of Pakistan official website
http://www.pakistan.gov.pk/divisions/industriesandproductiondivision/media/SectorsFile.pdf
Pakistan and Gulf Economist (2005). Auto Industry continues to grow. (July 18 - 24, 2005).
Retrieved August 6, 2013, from http://www.pakistaneconomist.com/
Pakistan and Gulf Economist (1996). Indigenization: Only a matter of will.. Retrieved August 6,
Pakistan and Gulf Economist (Jul 13 - 19, 1996)
Sharif A. (2001). Automobile Industry in Pakistan. Economic Review journal April ,2001