Embed Size (px)
Citation preview
Fibre Chemisto; Vol. 32, No. 5, 2000
P R O P E R T I E S O F P O L Y P H O S P H O R I C A C I D
V. A. Platonov UDC 546.185.325.03/04
The temperamre--viscosi~ curves were obtained for polyphosphoric acid with a phosphoric anhydride eontent o f 72 to 90. 75%. It was found that the composition o f PPA remains constant for an industrially sufficient time. The molecular-weight distribution of PPA with a different phosphoric anhvdt4de content was detelwined with the published data and a scheme of the mechanism o f hydrolytic degradation of PPA was plvposed.
Polyphosphoric acid (PPA), used in laboratory practice in the development of new polymers and fibers made from them as reaction medium or polymer solvent, is a complex mixture of products of the orthophosphoric acid (OPA) homologous series [1]. Its composition is designated by the percentage content of phosphoric anhydride (PA). This designation does not reveal the important technological properties of PPA caused by the fractional composition of a mixture of homologs. In addition, as a function of the method of synthesis of PPA and the conditions of storage of the PA used for its preparation, products of a different homologous series can f o r m - - metaphosphoric acid (MPA) derivatives, which have different chemical
properties than PPA. Some physicochemical and temperature--viscosity properties of PPA with a different PA content are examined in the present article.
One of two methods is used for preparation of PPA: a) evaporation of OPA, i.e., elimination of a small amount of bound water, and b) dissolution of PA in OPA [1]. In the case examined, PPA was prepared by dissolving PA in PPA [2]. The temperature--viscosity properties of samples of PPA were investigated on a PIRSP-31 setup with a cone-plate working unit in the temperature range from 50 to 180~ with a shear rate gradient of 18 sec -1 . This temperature range is due to the conditions
of use of PPA in synthesis of poly-(p-phenylenebenzobisthiazole) (PPT) and preparation and processing of its solutions in laboratory conditions [2].
The temperature--viscosity indexes of PPA with a PA content of 72 to 90% and higher are showaa in Fig. l. The viscosity of PPA in this concentration range varies by more than 6 orders of magnitude, while it only varies by 2-2.5 orders of magnitude in the temperature range under 130~ for this reason, it is not always possible to reduce the viscosity by increasing the temperature and bring it to the desired level in working with PPA with a high PA content.
The data in Fig. 1 show that samples of solutions of similar composition (within the limits of experimental precision) prepared at different times reproduce the predicted viscosity of the synthesized PPA relatively well.
The behavior of samples with a 76 and 72% PA content deviate from the general trend of the temperature---viscosity properties. This could be the consequence of the characteristics of the equilibrium of pyro- and orthophosphoric acid with water ofpolycondensation, discussed in more detail below.
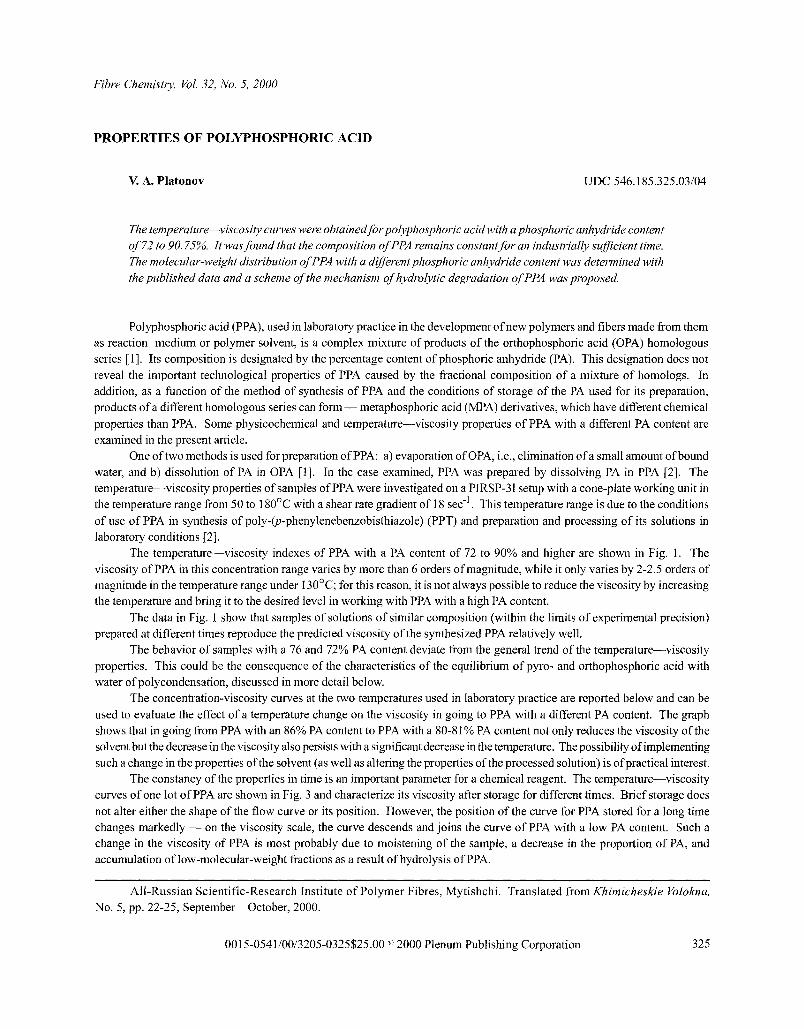
The concentration-viscosity curves at the two temperatures used in laboratory practice are reported below and can be
used to evaluate the effect of a temperature change on the viscosity in going to PPA with a different PA content. The graph shows that in going from PPA with an 86% PA content to PPA with a 80-81% PA content not only reduces the viscosity of the solvent but the decrease in the viscosity also persists with a significant decrease in the temperature. The possibility of implementing such a change in the properties of the solvent (as well as altering the properties of the processed solution) is of practical interest.
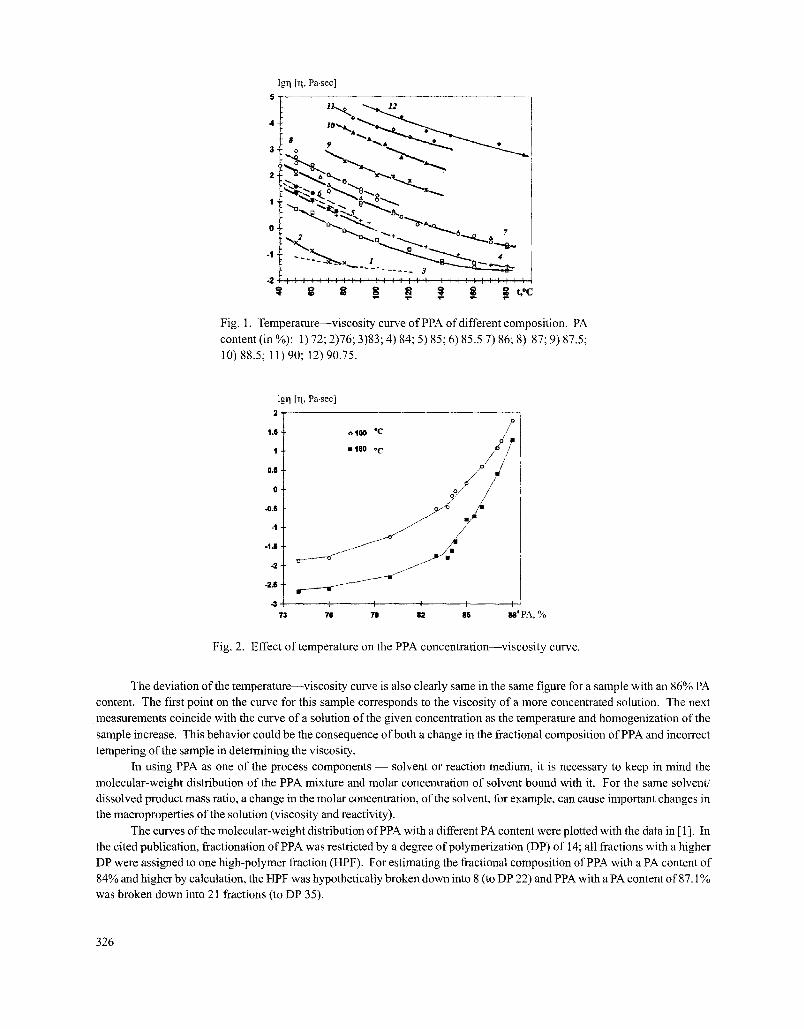
The constancy of the properties in time is an important parameter for a chemical reagent. The temperature--viscosity curves of one lot of PPA are shown in Fig. 3 and characterize its viscosity after storage for different times. Brief storage does
not alter either the shape of the flow curve or its position. However, the position of the curve for PPA stored for a long time changes markedly - - on the viscosity scale, the curve descends and joins the curve of PPA with a low PA content. Such a change in the viscosity of PPA is most probably due to moistening of the sample, a decrease in the proportion of PA, and accumulation of low-molecular-weight fractions as a result of hydrolysis of PPA.
All-Russian Scientific-Research Institute of Polymer Fibres, Mytishchi. Translated from Khimicheskie Volokna, No. 5, pp. 22-25, September--October, 2000.
0015-0541/00/3205-0325525.00 ~: 2000 Plenum Publishing Corporation 325
lg-q [rl, Pa.sec]
--..2
- , ~ ~ _ ~ -'---, ~ -~,,.~ ~ ='~,~,.,. ~ ,~ ,~
. . . . . . 3
Fig. 1. Temperature--viscosity curve of PPA of different composition. PA content (in %): 1) 72; 2)76; 3)83; 4) 84; 5) 85; 6) 85.5 7) 86; 8) 87; 9) 87.5; 10) 88.5; l l ) 90; 12) 90.75.
lgrl [rl, Pa.sec]
2
1.6
1
0.5
0
-0.6
-1
-t.5
- 2
-2.6,
,.3 73
o100 *C / . / .
�9 180 �9 C / / "
/ o /r
t I ! [ I 711 7g 82 86 88' PA, %
Fig. 2. Effect of temperature on the PPA concentration--viscosity curve.
The deviation of the temperature--viscosity curve is also clearly same in the same figure for a sample with an 86% PA content. The first point on the curve for this sample corresponds to the viscosity of a more concentrated solution. The next measurements coincide with the curve of a solution of the given concentration as the temperature and homogenization of the sample increase. This behavior could be the consequence of both a change in the fractional composition of PPA and incorrect tempering of the sample in determining the viscosity.
In using PPA as one of the process components - - solvent or reaction medium, it is necessary to keep in mind the molecular-weight distribution of the PPA mixture and molar concentration of solvent bound with it. For the same solvent/ dissolved product mass ratio, a change in the molar concentration, of the solvent, for example, can cause important changes in the macroproperties of the solution (viscosity and reactivity).
The curves of the molecular-weight distribution of PPA with a different PA content were plotted with the data in [1]. In the cited publication, fractionation of PPA was restricted by a degree of polymerization (DP) of 14; a l l fractions with a higher DP were assigned to one high-polymer fraction (HPF). For estimating the fractional composition of PPA with a PA content of 84% and higher by calculation, the HPF was hypothetically broken down into 8 (to DP 22) and PPA with a PA content of87.1% was broken down into 21 fractions (to DP 35).
326
lg~l [11, Pa.sec]
3 �9 ~ N A 0 t
2.,j~ N , .2
o 2
..0.5-
~ ~ ~ ~ ~ ~ ~ t.oc
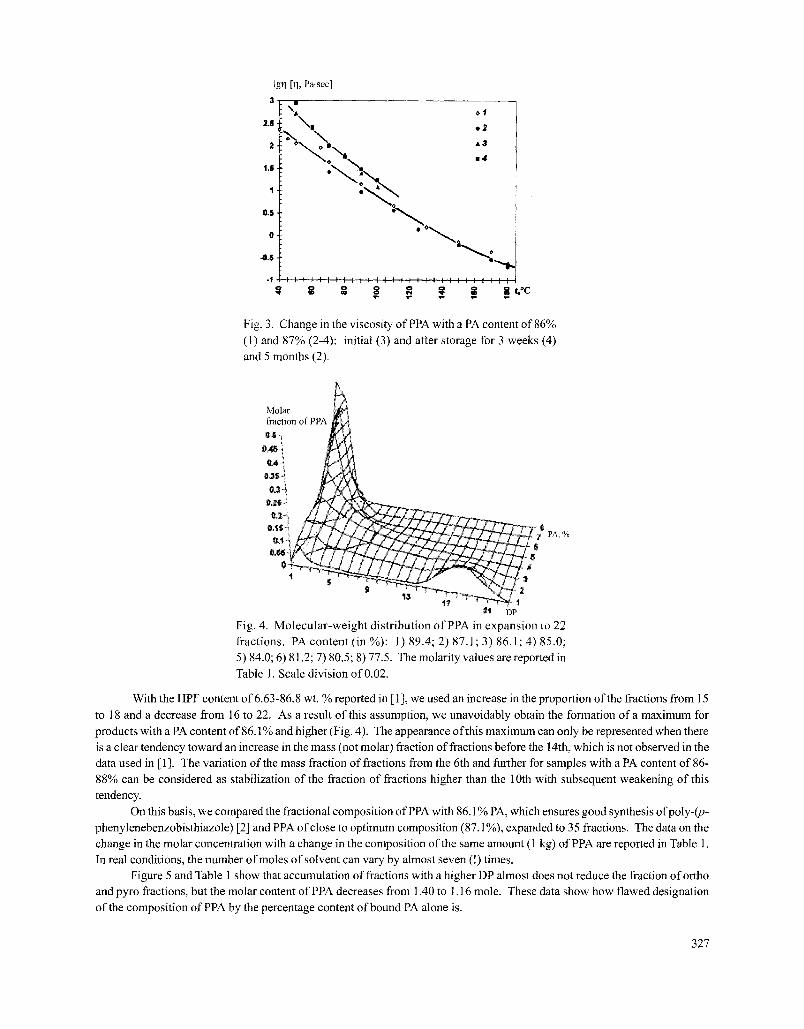
Fig. 3. Change in the viscosity of PPA with a PA content of 86% (1) and 87% (2-4): initial (3) and after storage for 3 weeks (4) and 5 months (2).
Mo] ffac
O~ 0~5
0.1 I)olt
2t DP
PA,%
Fig. 4. Molecular-weight distribution of PPA in expansion to 22 fractions. PA content (in %): 1) 89.4; 2) 87.1; 3) 86.1; 4) 85.0; 5) 84.0; 6) 81.2; 7) 80.5; 8) 77.5. The molarity values are reported in Table 1. Scale division of 0.02.
With the HPF content of 6.63-86.8 wt. % reported in [1], we used an increase in the proportion of the fractions fi'om 15
to 18 and a decrease from 16 to 22. As a result of this assumption, we unavoidably obtain the fomaation of a maximum for products with a PA content of 86.1% and higher (Fig. 4). The appearance of this maximum can only be represented when there is a clear tendency toward an increase in the mass (not molar) fraction of fractions before the 14th, which is not observed in the data used in [1]. The variation of the mass fraction of fractions from the 6th and further for samples with a PA content of 86- 88% can be considered as stabilization of the fraction of fractions higher than the 10th with subsequent weakening of this tendency.
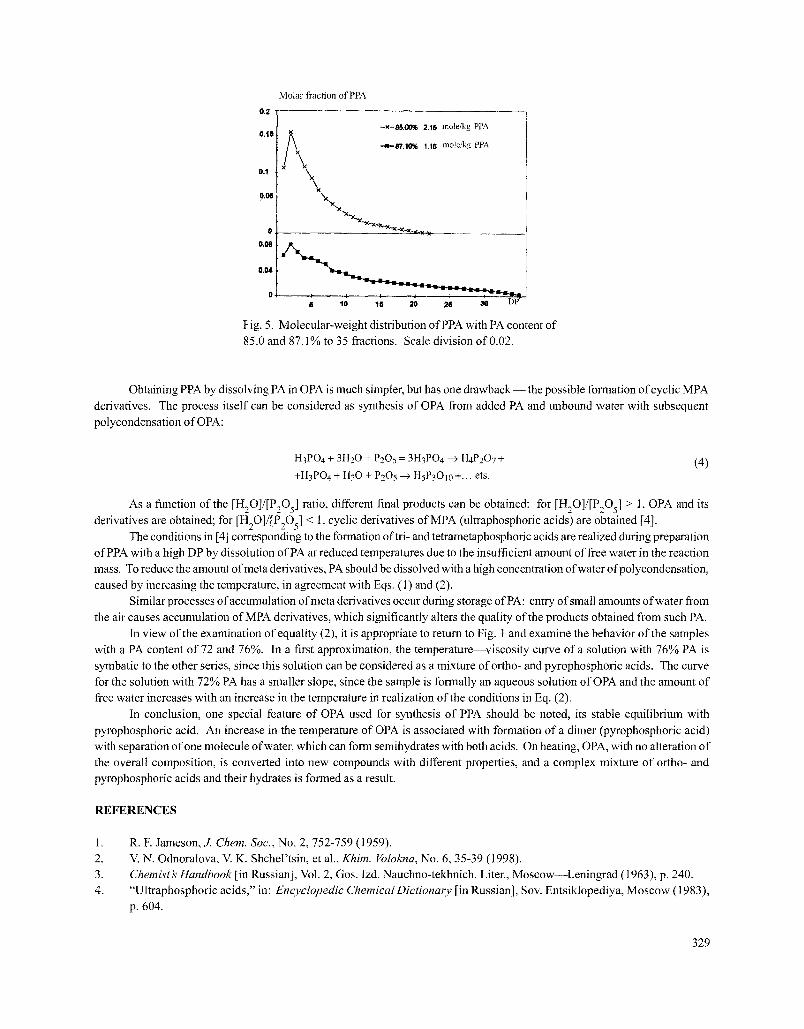
On this basis, we compared the fractional composition of PPA with 86.1% PA, which ensures good synthesis ofpoly-(p- phenylenebenzobisthiazole) [2] and PPA of close to optimum composition (87.1%), expanded to 35 fractions. The data on the change in the molar concentration with a change in the composition of the same amount (1 kg) of PPA are reported in Table 1. In real conditions, the number of moles of solvent can vary by almost seven (!) times.
Figure 5 and Table 1 show that accumulation of fractions with a higher DP almost does not reduce the fraction ofortho and pyro fractions, but the molar content of PPA decreases from 1.40 to 1.16 mole. These data show how flawed designation of the composition of PPA by the percentage content of bound PA alone is.
327
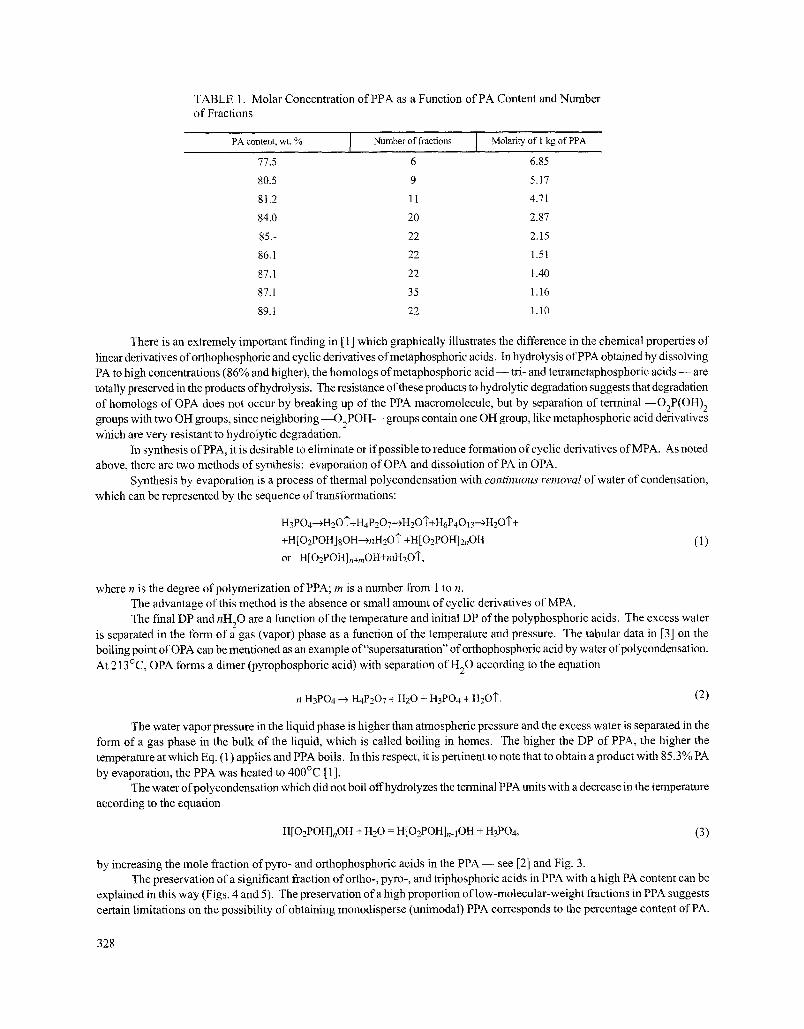
TABLE 1. Molar Concentration of PPA as a Function of PA Content and Number of Fractions
PA content, wt. % . I Number of fractions I Molarity of I kg of PPA
77.5 6 6.85
80.5 9 5.17
81.2 11 4.71
84.0 20 2.87
85.- 22 2.15
86.1 22 1.51
87.1 22 1.40
87.l 35 1.16
89.1 22 1.10
There is an extremely important finding in [ 1 ] which graphically illustrates the difference in the chemical properties of linear derivatives of orthophosphoric and cyclic derivatives ofmetaphosphoric acids. In hydrolysis of PPA obtained by dissolving PA to high concentrations (86% and higher), the homologs ofmetaphosphoric a c i d - - tri- and tetrametaphosphoric acids - - are totally preserved in the products of hydrolysis. The resistance of these products to hydrolytic degradation suggests that degradation of homologs of OPA does not occur by breaking up of the PPA macromolecule, but by separation of terminal --O2P(OH) 2 groups witb two OH groups, since neighboring--O2POH-- groups contain one OH group, like metaphosphoric acid derivatives which are ve12r resistant to hydrolytic degradation.
In synthesis of PPA, it is desirable to eliminate or if possible to reduce formation of cyclic derivatives of MPA. As noted above, there are two methods of synthesis: evaporation of OPA and dissolution of PA in OPA.
Synthesis by evaporation is a process of thermal polycondensation with continuous removal of water of condensation, which can be represented by the sequence of transformations:
H3PO4--+H2Oq'+H4P207-+H2Oq'+H6P4013 --+H20]'+
+H [O2POH] 8OH-~rtH20"[" +H[O2POH]2nOH ( 1 )
or H[O2POtt] n+mOH+mH 20]',
where n is the degree of polymerization ofPPA; m is a number from 1 to n. The advantage of this method is the absence or small amount of cyclic derivatives of MPA. The final DP and nH20 are a function of the temperature and initial DP of the polyphosphoric acids. The excess water
is separated in the form of a gas (vapor) phase as a function of the temperature and pressure. The tabular data in [3] on the boiling point of OPA can be mentioned as an example of"supersaturation" of orthophosphoric acid by water ofpolycondensation. At 213~ OPA forms a dimer (pyrophosphoric acid) with separation of H20 according to tbe equation
n H3PO4 ---> H4P207 + H20 + H3PO4 + H20"]'. (2)
The water vapor pressure in the liquid phase is higher than atmospheric pressure and the excess water is separated in the form of a gas phase in the bulk of the liquid, which is called boiling in homes. The higher the DP of PPA, the higher the temperature at which Eq. ( 1 ) applies and PPA boils. In this respect, it is pertinent to note that to obtain a product with 85.3% PA by evaporation, the PPA was heated to 400~ [ 1 ].
The water ofpolycondensation which did not boil offhydrolyzes the terminal PPA units with a decrease in the temperature according to the equation
H[O2POH],,OH + H20 = H[O2POH]n_IOH + H3PO4, (3)
by increasing the mole fraction of pyro- and orthophosphoric acids in the P P A - see [2] and Fig. 3. The preservation of a significant fraction ofortho-, pyro-, and triphosphoric acids in PPA with a high PA content can be
explained in this way (Figs. 4 and 5). The preservation of a high proportion of low-molecular-weight fractions in PPA suggests certain limitations on the possibility of obtaining monodisperse (unimodal) PPA corresponds to the percentage content of PA.
328
Molar fi'action of PPA 0 .2
-x-~..00% 2.15 mole/kg PPA 0.16 ~\
x / x "4-87.10% 1.16 mole/kg PPA
0.1 k,x
,o~f \ Nb~
"g"x.,x..X_x.x 0. "x "x"x-x_r~.~
0.08 ~
0.04
0 . 1 B 10 15 lO 25 30 DP ~
Fig. 5. Molecular-weight distribution of PPA with PA content of 85.0 and 87.1% to 35 fractions. Scale division of 0.02.
Obtaining PPA by dissolving PA in OPA is much simpler, but has one drawback-- the possible formation of cyclic MPA derivatives. The process itself can be considered as synthesis of OPA from added PA and unbound water with subsequent polycondensation of OPA:
H3PO4 + 3H20 + P205 = 3H3PO4 --9 H4P207 +
+H3PO4 + H20 + P205 --9 HsP3OI0 +... ets. (4)
As a function of the [HzO]/[P2Os] ratio, different final products can be obtained: for [H2O]/[P205] > l, OPA and its derivatives are obtained; for [HzO]/[P2Os] < 1, cyclic derivatives ofMPA (ultraphosphoric acids) are obtained [4].
The conditions in [4] corresponding to the fornlation oftri- and tetrametaphosphoric acids are realized during preparation of PPA with a high DP by dissolution of PA at reduced temperatures due to the insufficient amount of free water in the reaction mass. To reduce the amount ofmeta derivatives, PA should be dissolved with a high concentration of water ofpolycondensation, caused by increasing the temperature, in agreement with Eqs. (1) and (2).
Similar processes of accumulation of recta derivatives occur during storage of PA: entry of small amounts of water from the air causes accumulation of MPA derivatives, which significantly alters the quality of the products obtained from such PA.
In view of the examination of equality (2), it is appropriate to return to Fig. 1 and examine the behavior of the samples with a PA content of 72 and 76%. In a first approximation, the temperature--viscosity curve of a solution with 76% PA is symbatic to the other series, since this solution can be considered as a mixture of ortho- and pyrophosphoric acids. The curve for the solution with 72% PA has a smaller slope, since the sample is fornaally an aqueous solution of OPA and the amount of free water increases with an increase in the temperature in realization of the conditions in Eq. (2).
In conclusion, one special feature of OPA used for synthesis of PPA should be noted, its stable equilibrium with pyrophosphoric acid. An increase in the temperature of OPA is associated with formation of a dimer (pyrophosphoric acid) with separation of one molecule of water, which can foma semihydrates with both acids. On heating, OPA, with no alteration of the overall composition, is converted into new compounds with different properties, and a complex mixture of ortho- and pyrophosphoric acids and their hydrates is formed as a result.
REFERENCES
1. 2. 3. 4.
R. F. Jameson, J. Chem. Sot., No. 2, 752-759 (1959). V. N. Odnoralova, V. K. Shchel'tsin, et al., Khim. Volokna, No. 6, 35-39 (1998). Chemist's Handbook [in Russian], Vol. 2, Gos. Izd. Nauchno-tekhnich. Liter., Moscow--Leningrad (1963), p. 240. "Ultraphosphorie acids," in: Encyclopedic ChemicalDictionary [in Russian], Sov. Entsiklopediya, Moscow (1983), p. 604.
329