Embed Size (px)
Citation preview
© Copyright 2015 RBN Energy
Propane Winter Outlook
Kelly Van HullOctober 6, 2015
2015 Winter Energy Outlook Conference

2© Copyright 2015 RBN Energy
» Propane Market Overview Crude Oil, Natural Gas, and Natural Gas Liquids
Production
Trends – Historical and Post Crude Oil Price Collapse
» Propane Outlook Propane Supply/Demand Balance
Project Developments
Weather Sensitivities
Pricing & Price Relationships
Conclusions
3© Copyright 2015 RBN Energy
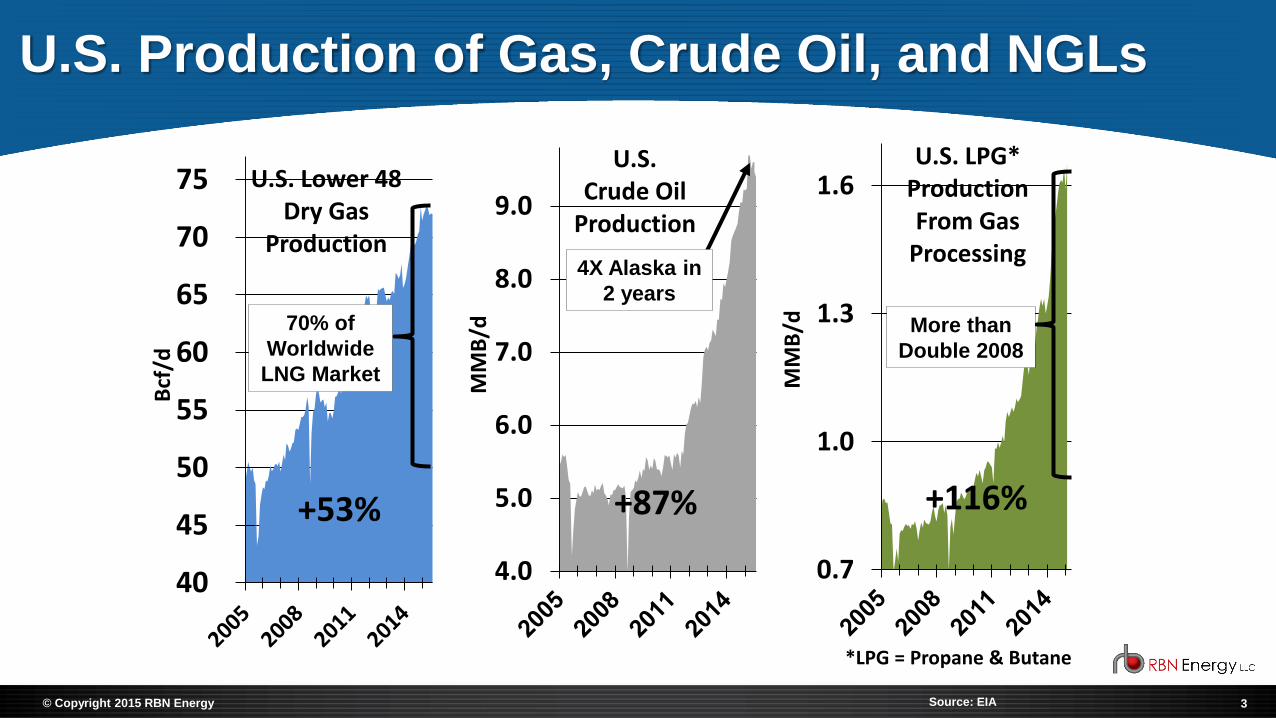
U.S. Production of Gas, Crude Oil, and NGLs
4.0
5.0
6.0
7.0
8.0
9.0
MM
B/d
U.S. Crude Oil
Production
+87%
4X Alaska in
2 years
Source: EIA
40
45
50
55
60
65
70
75B
cf/d
U.S. Lower 48 Dry Gas
Production
70% of
Worldwide
LNG Market
+53%
0.7
1.0
1.3
1.6
MM
B/d
U.S. LPG* Production From Gas
Processing
+116%
*LPG = Propane & Butane
More than
Double 2008
4© Copyright 2015 RBN Energy
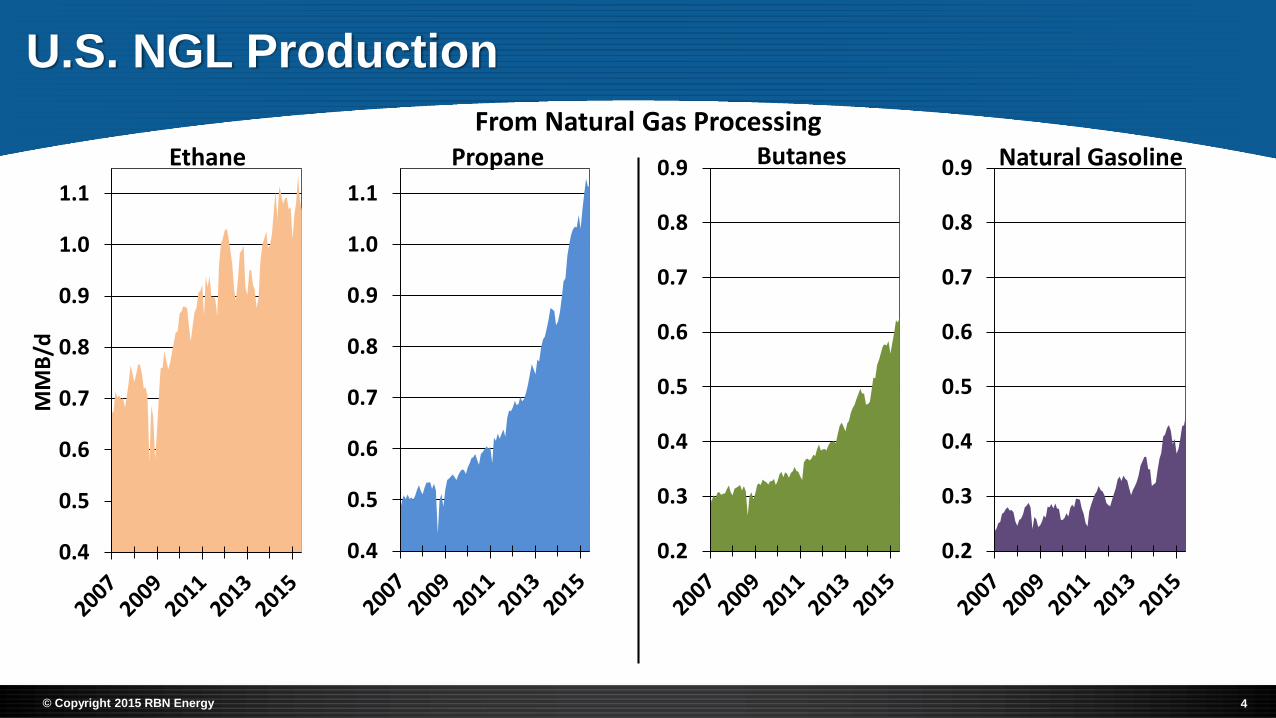
U.S. NGL Production
0.2
0.3
0.4
0.5
0.6
0.7
0.8
0.9 Butanes
From Natural Gas Processing
0.2
0.3
0.4
0.5
0.6
0.7
0.8
0.9 Natural Gasoline
0.4
0.5
0.6
0.7
0.8
0.9
1.0
1.1
Propane
0.4
0.5
0.6
0.7
0.8
0.9
1.0
1.1
MM
B/d
Ethane

5© Copyright 2015 RBN Energy
PADD 1 (Northeast) Gas Plant NGL Production Through June 2015
0
25
50
75
100
125
MB
/d
Ethane and Propane
Propane
Ethane
0
5
10
15
20
25
30
35
40
45
MB
/d
Butanes
Normal Butane
Isobutane
0
5
10
15
20
25
30
35
MB
/d
Pentanes+
6© Copyright 2015 RBN Energy
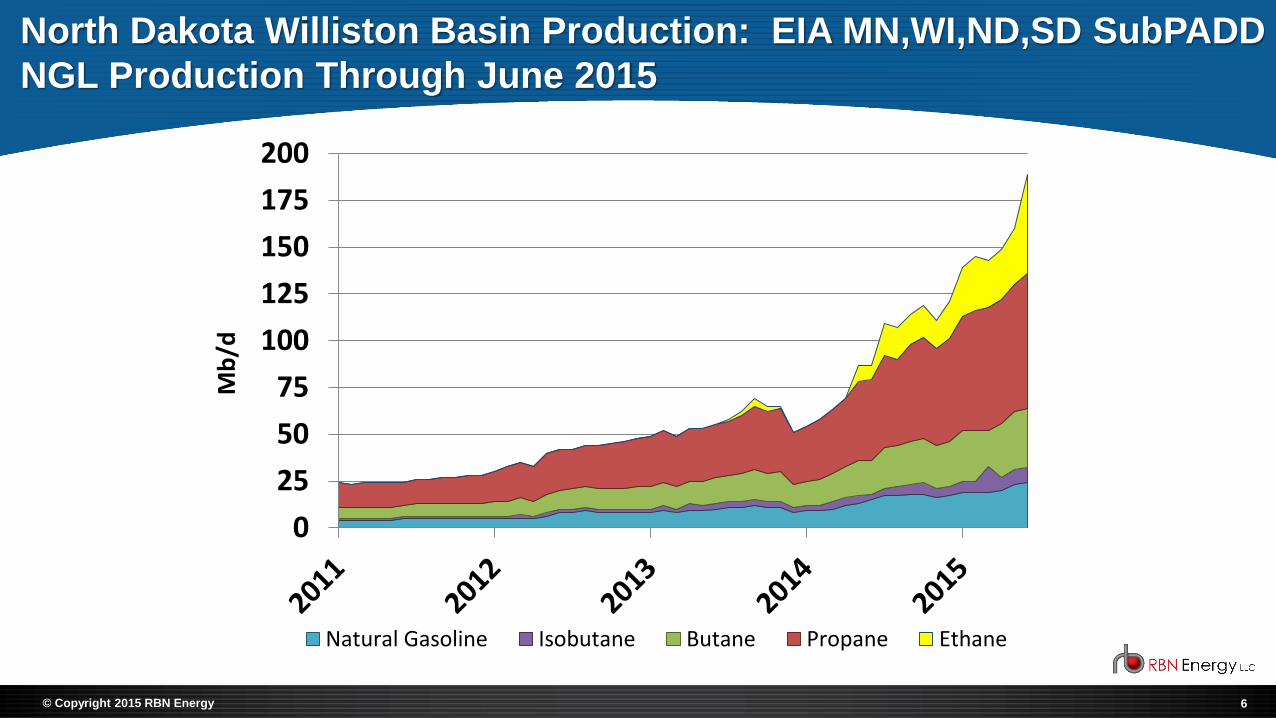
North Dakota Williston Basin Production: EIA MN,WI,ND,SD SubPADD
NGL Production Through June 2015
0
25
50
75
100
125
150
175
200
Mb
/d
Natural Gasoline Isobutane Butane Propane Ethane
7© Copyright 2015 RBN Energy
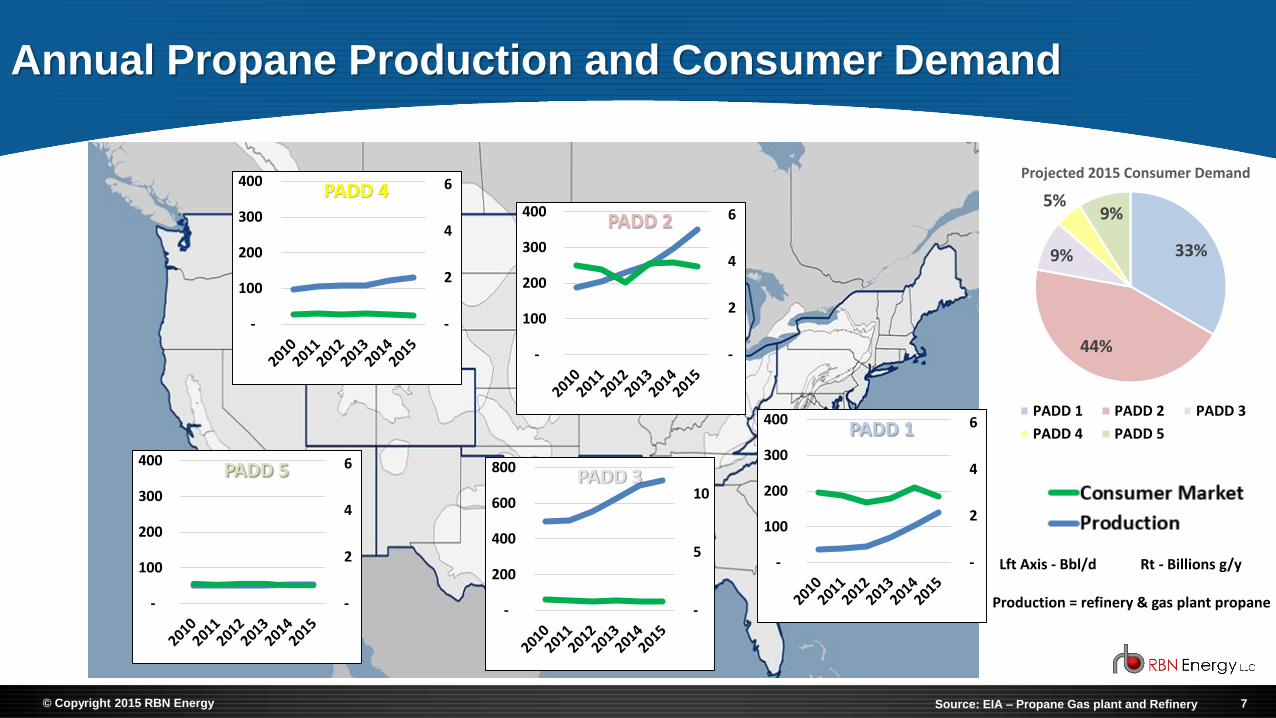
Annual Propane Production and Consumer Demand
-
2
4
6
-
100
200
300
400
Mill
ion
sPADD 1
-
2
4
6
-
100
200
300
400
Mill
ion
sPADD 2
-
5
10
-
200
400
600
800
Mill
ion
sPADD 3
-
2
4
6
-
100
200
300
400
Mill
ion
sPADD 4
-
2
4
6
-
100
200
300
400
Mill
ion
sPADD 5
33%
44%
9%
5%9%
Projected 2015 Consumer Demand
PADD 1 PADD 2 PADD 3
PADD 4 PADD 5
Lft Axis - Bbl/d Rt - Billions g/y
Source: EIA – Propane Gas plant and Refinery
Production = refinery & gas plant propane

8© Copyright 2015 RBN Energy
U.S. Gas Plant and Refinery Supply of Propane
0
200
400
600
800
1000
1200
1400
1600
Mb
/d
Gas Plants Refineries

9© Copyright 2015 RBN Energy
Mont Belvieu Propane Prices 2012-15 YTD
0
20
40
60
80
100
120
140
160
180
c/ga
l
Propane

10© Copyright 2015 RBN Energy
0
100
200
300
400
500
c/g
al
Mont Belvieu
Propane Prices 2012-15 YTD
0
100
200
300
400
500
c/g
al
Conway

11© Copyright 2015 RBN Energy
U.S. Propane Market Developments 2011 to 2014
0
200
400
600
800
1,000
1,200
1,400
1,600
Mb
/d
Petchem Demand PDH Heating Demand Exports
12© Copyright 2015 RBN Energy
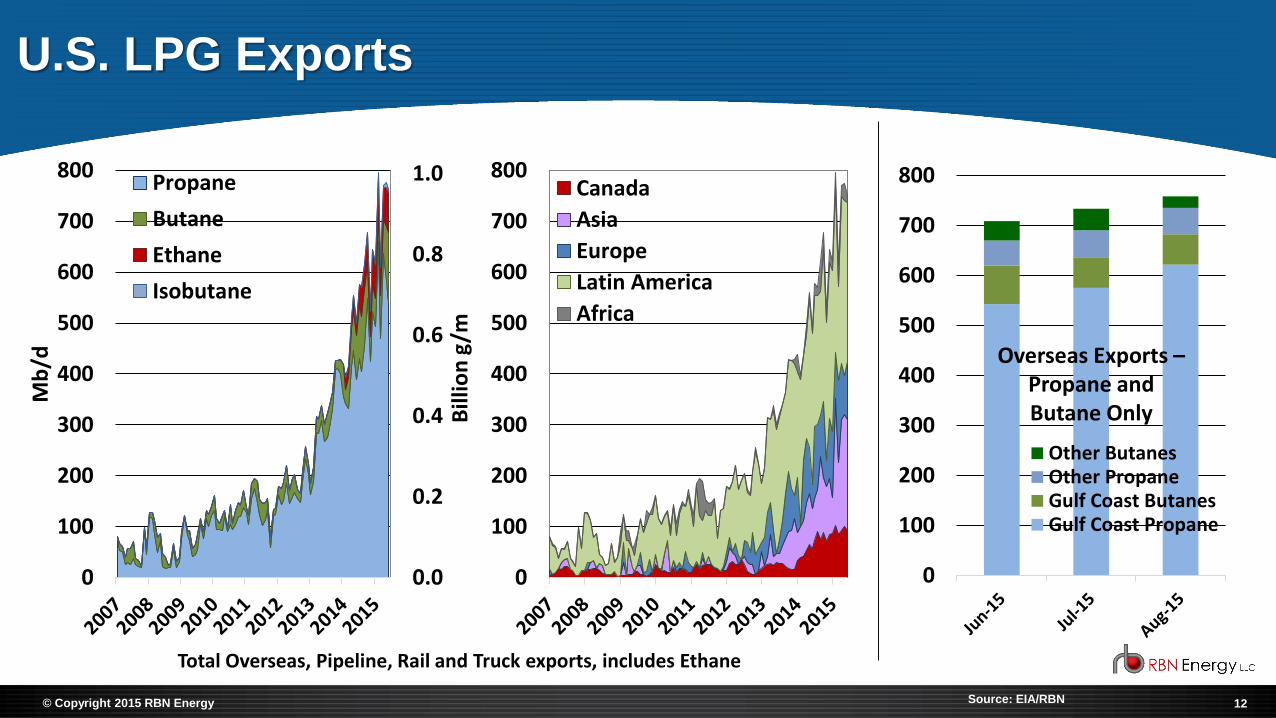
U.S. LPG Exports
Source: EIA/RBN
0
100
200
300
400
500
600
700
800Canada
Asia
Europe
Latin America
Africa
0.0
0.2
0.4
0.6
0.8
1.0
0
100
200
300
400
500
600
700
800
Mb
/d
Propane
Butane
Ethane
Isobutane
Bill
ion
g/m
0
100
200
300
400
500
600
700
800
Tho
usa
nd
s
Other ButanesOther PropaneGulf Coast ButanesGulf Coast Propane
Overseas Exports –Propane and Butane Only
Total Overseas, Pipeline, Rail and Truck exports, includes Ethane

13© Copyright 2015 RBN Energy
Petrochemical Cracker Margins 2007 - 09/2015
0
10
20
30
40
50
60
0
10
20
30
40
50
60
Cn
ts/l
b
Ethane
Propane
Butane
Natural Gasoline (Naphtha)

14© Copyright 2015 RBN Energy
Percent of U.S. Feedstocks
0%
10%
20%
30%
40%
50%
60%
70%
80%
90%
100%
Vo
l% o
f Fe
ed
U.S. Ethylene Feedstocks
Ethane Propane Butane Naphtha Gas Oil

15© Copyright 2015 RBN Energy
Flexible Steam Crackers Can Switch Feedstocks Relatively
Quickly as Market Dynamics Shift
0
200
400
600
800
1,000
Mb
/d
Ethane Propane Butane Naphtha Gas Oil
• Propane consumption fell 100 Mb/d in 3 months and nearly 200 Mb/d in 7 months in 2013
• Butane consumption has not exceeded 150 Mb/d despite being a favored feedstock most of 2015

16© Copyright 2015 RBN Energy
The Perfect Storm: Res/Com Propane Demand 2013-14
0
1
2
3
4
5
6
7
0
50
100
150
200
250
300
350
400
450
500
Bill
ion
s g
/y
Mb
/d
PADD II
Agriculture Residential and Commercial
0
1
2
3
4
5
6
7
0
50
100
150
200
250
300
350
400
450
500
Bill
ion
s g
/y
Mb
/d
PADD I
Agriculture Residential and Commercial
17© Copyright 2015 RBN Energy
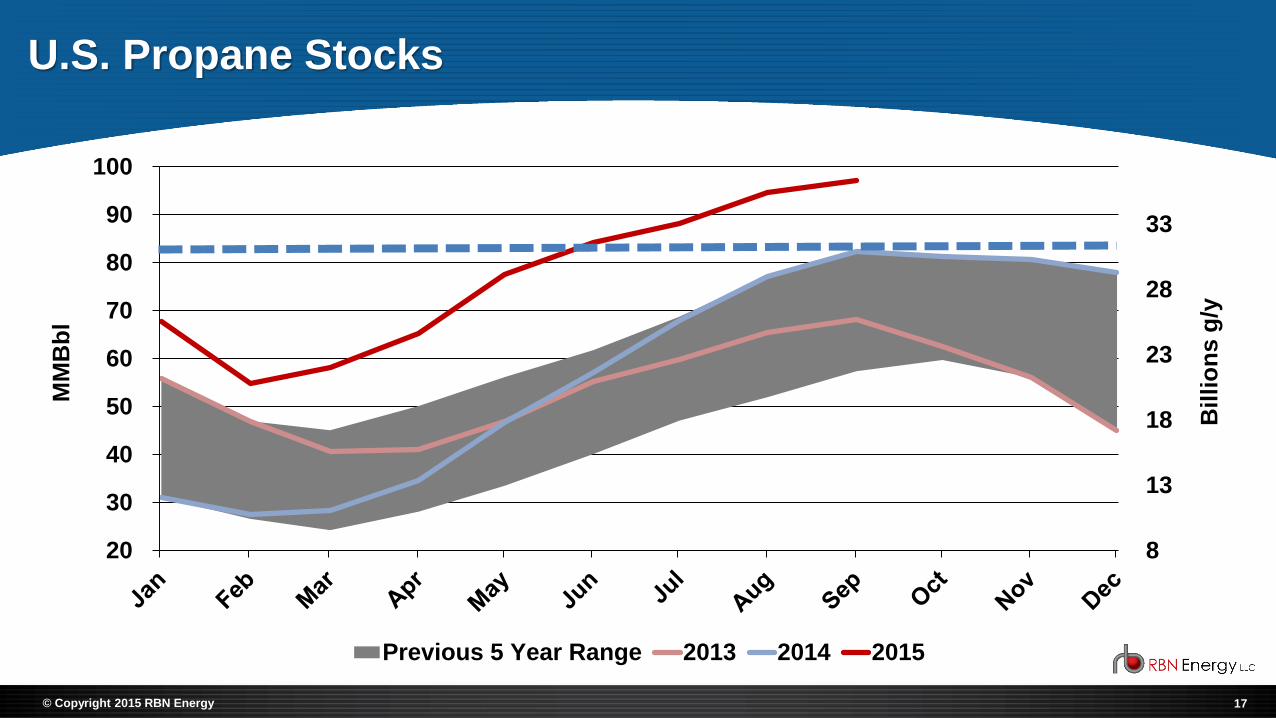
U.S. Propane Stocks
8
13
18
23
28
33
20
30
40
50
60
70
80
90
100
Billi
on
s g
/y
Previous 5 Year Range 2013 2014 2015
MM
Bb
l
18© Copyright 2015 RBN Energy
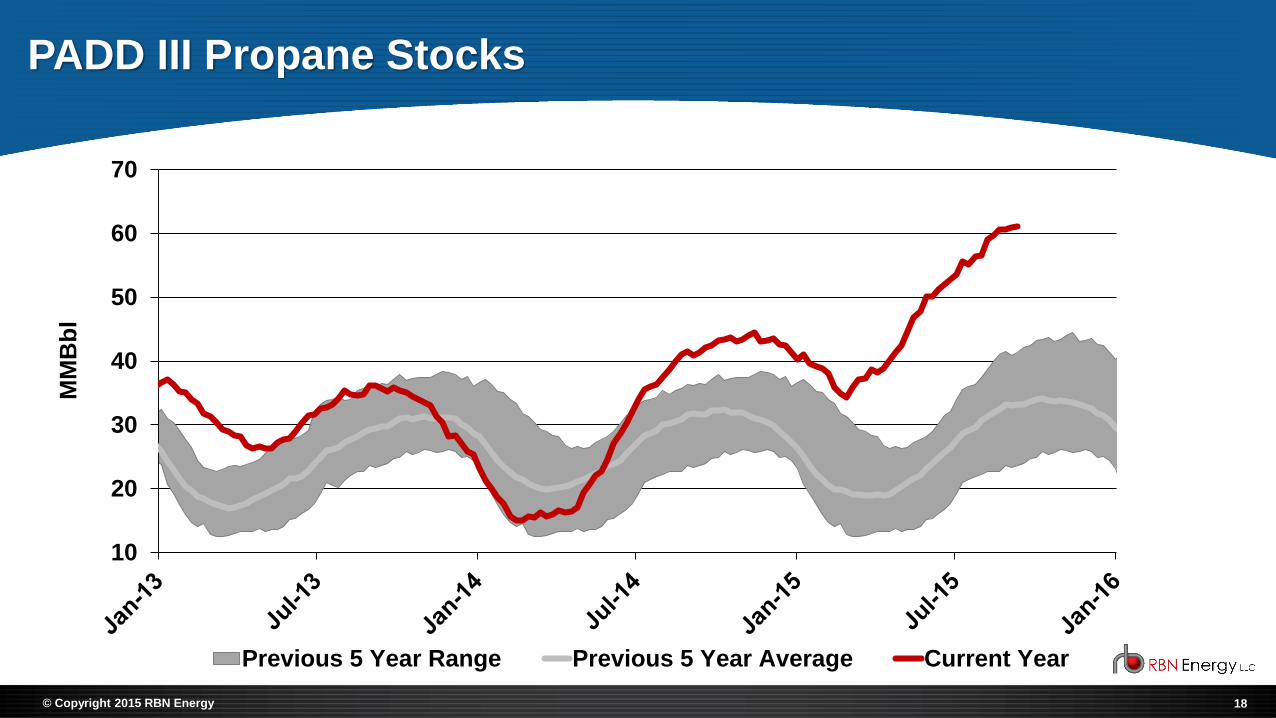
PADD III Propane Stocks
10
20
30
40
50
60
70
Previous 5 Year Range Previous 5 Year Average Current Year
MM
Bb
l
19© Copyright 2015 RBN Energy
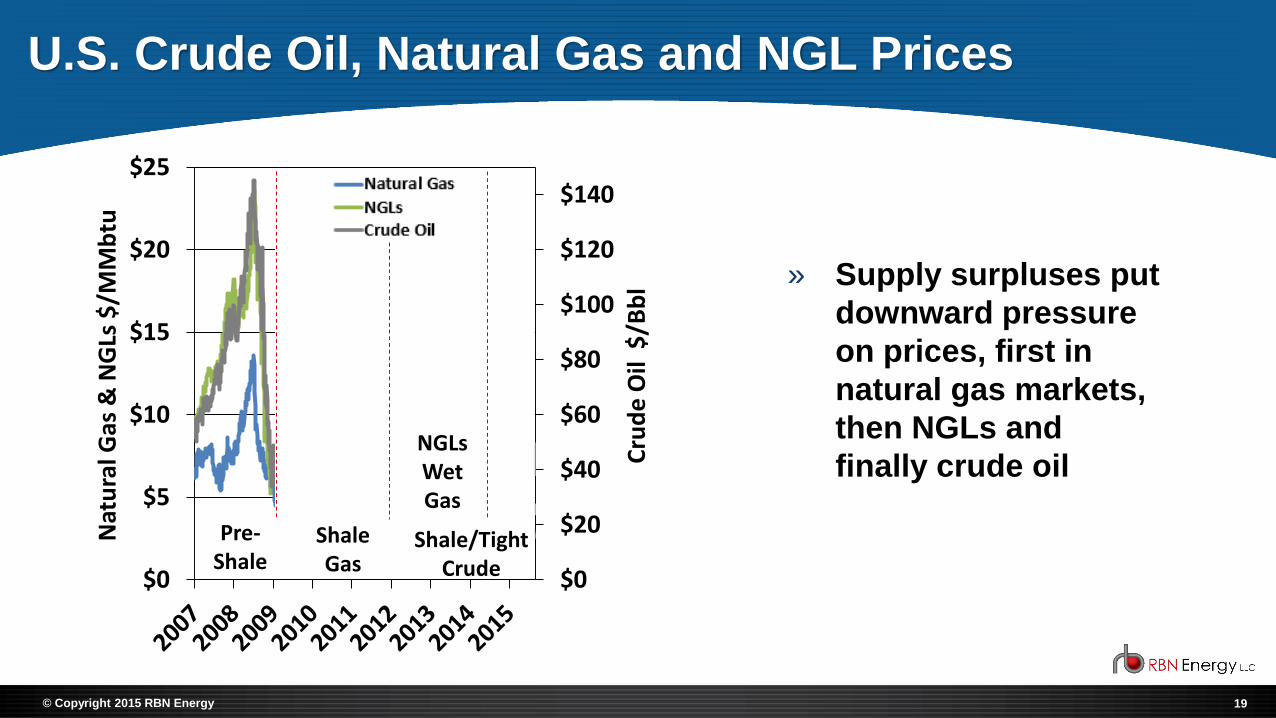
U.S. Crude Oil, Natural Gas and NGL Prices
$0
$20
$40
$60
$80
$100
$120
$140
$0
$5
$10
$15
$20
$25
Cru
de
Oil
$/B
bl
Nat
ura
l Gas
& N
GLs
$/M
Mb
tu
Natural GasNGLsCrude Oil
Pre-Shale
Shale Gas
NGLs Wet Gas
Shale/Tight Crude
» Supply surpluses put
downward pressure
on prices, first in
natural gas markets,
then NGLs and
finally crude oil
20© Copyright 2015 RBN Energy
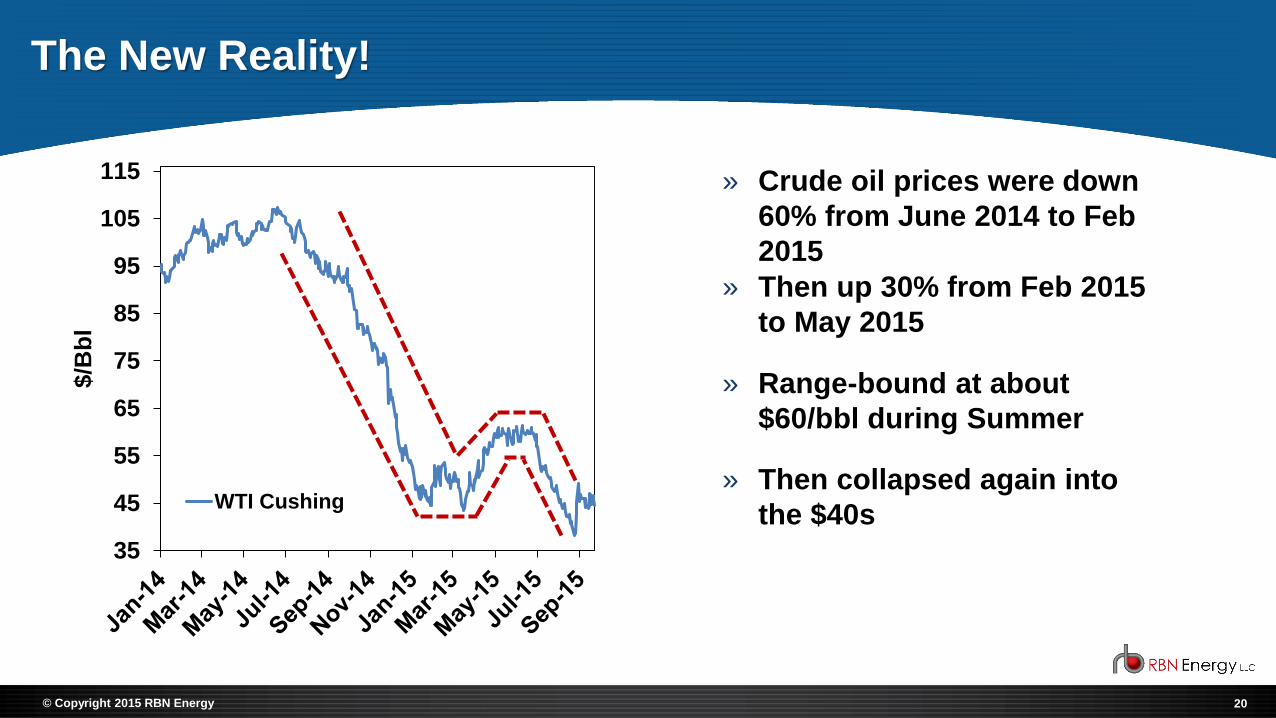
The New Reality!
35
45
55
65
75
85
95
105
115
$/B
bl
WTI Cushing
» Crude oil prices were down
60% from June 2014 to Feb
2015
» Then up 30% from Feb 2015
to May 2015
» Range-bound at about
$60/bbl during Summer
» Then collapsed again into
the $40s
21© Copyright 2015 RBN Energy
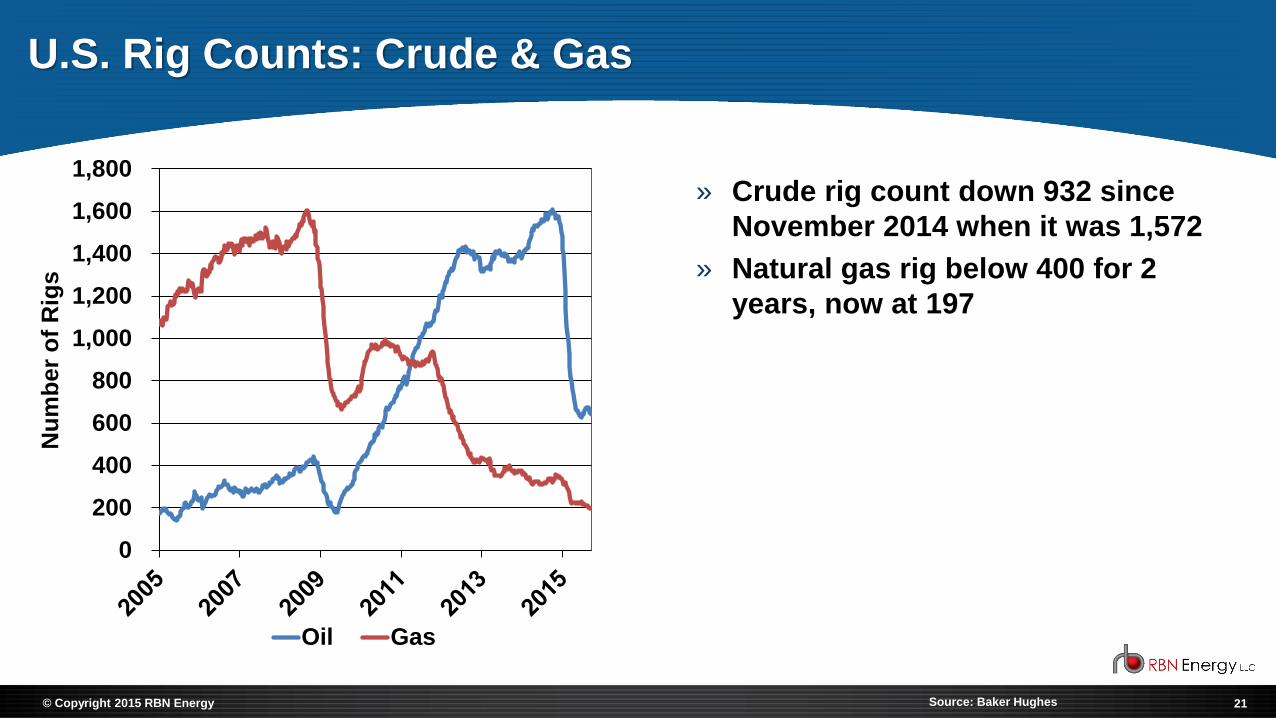
U.S. Rig Counts: Crude & Gas
0
200
400
600
800
1,000
1,200
1,400
1,600
1,800
Nu
mb
er
of
Rig
s
Oil Gas
» Crude rig count down 932 since
November 2014 when it was 1,572
» Natural gas rig below 400 for 2
years, now at 197
Source: Baker Hughes

22© Copyright 2015 RBN Energy
Gas Production Added Per Rig
0.2
0.6
0.0
0.5
1.0
1.5
2.0
Bakken
+223%
1.1
1.9
0.0
0.5
1.0
1.5
2.0
Eagle Ford
0.2
0.5
0.0
0.5
1.0
1.5
2.0
Permian
4.5
5.8
0
1
2
3
4
5
6
Haynesville
+69%
+113%
+29%
1.4
7.3
0
1
2
3
4
5
6
7
MM
cf/d
Marcellus/Utica
+417%
Source: EIA

23© Copyright 2015 RBN Energy
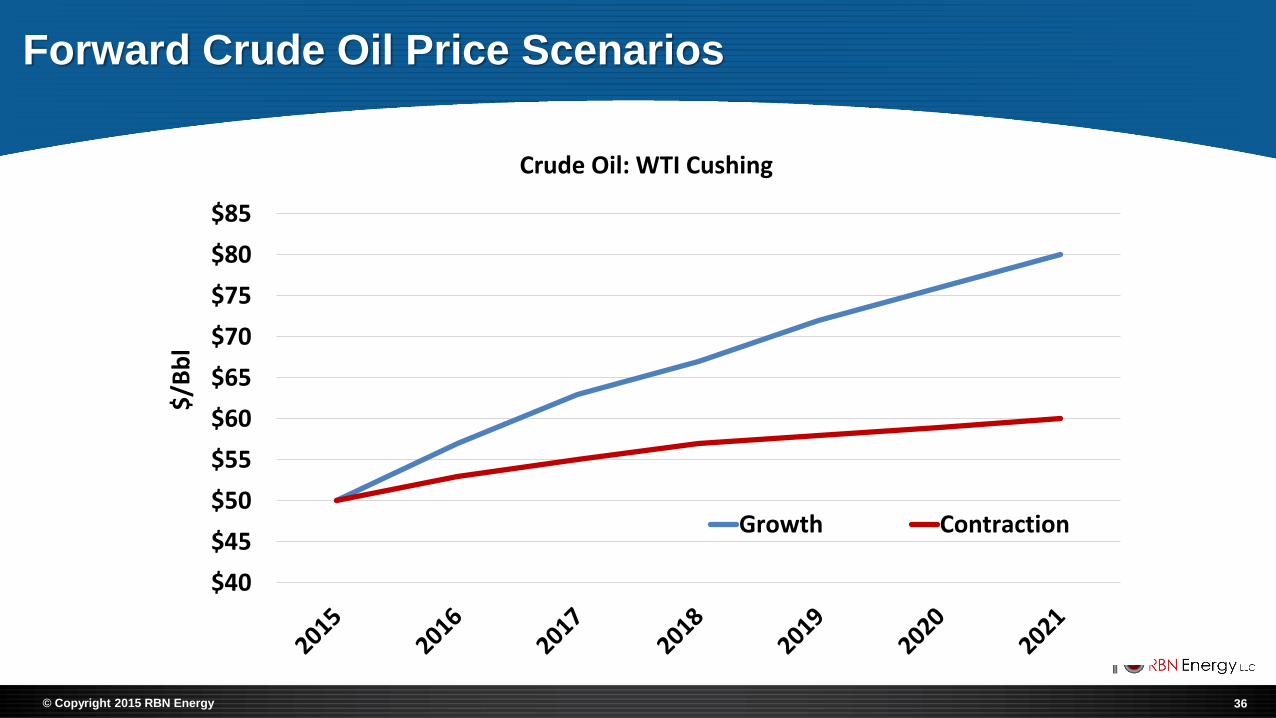
Five Year Crude and Gas Price Scenarios
» Growth Scenario -- WTI
prices return to the $80/bbl
range by 2021; Natural gas
increases to $4.00/MMbtu
» Contraction Scenario -- WTI
prices increase, but only to
average $60/bbl in 2021;
Natural gas prices flat at
$2.75/Mmbtu
» Note: These are not
forecasts; nor are they high
and low cases. They are
possible scenarios used to
understand market responses
$40
$45
$50
$55
$60
$65
$70
$75
$80
$85
$/B
bl
Crude Oil: WTI Cushing
Growth
Contraction$2.00
$2.50
$3.00
$3.50
$4.00
$4.50
$/M
Mb
tu
Natural Gas: Henry Hub
Growth
Contraction

24© Copyright 2015 RBN Energy
U.S. Propane Market Length to be Relieved by Petrochemical Demand
and Exports
0.00
0.20
0.40
0.60
0.80
1.00
1.20
1.40
1.60
1.80
2.00
MM
b/d
Petchem Demand PDH Heating Demand Exports
Growth Scenario
Contraction Scenario

25© Copyright 2015 RBN Energy
Propane Dehydrogenation Capacity
0
50
100
150
200
250P
rop
ane
De
man
d M
b/d
Petrologistics Enterprise Dow Formosa REXpro Sunoco - Marcus Hook Ascend
Contraction Scenario
Growth Scenario

26© Copyright 2015 RBN Energy
Growth Case - Gulf Coast LPG Export Capacity vs. Gulf Coast
Export Volumes
0
200
400
600
800
1,000
1,200
1,400
MB
/D
Propane Butane Pre-Existing
Enterprise Targa Other
Other:• ETC Mariner South - 2015• Oxy - 2015• Phillips -2016
27© Copyright 2015 RBN Energy
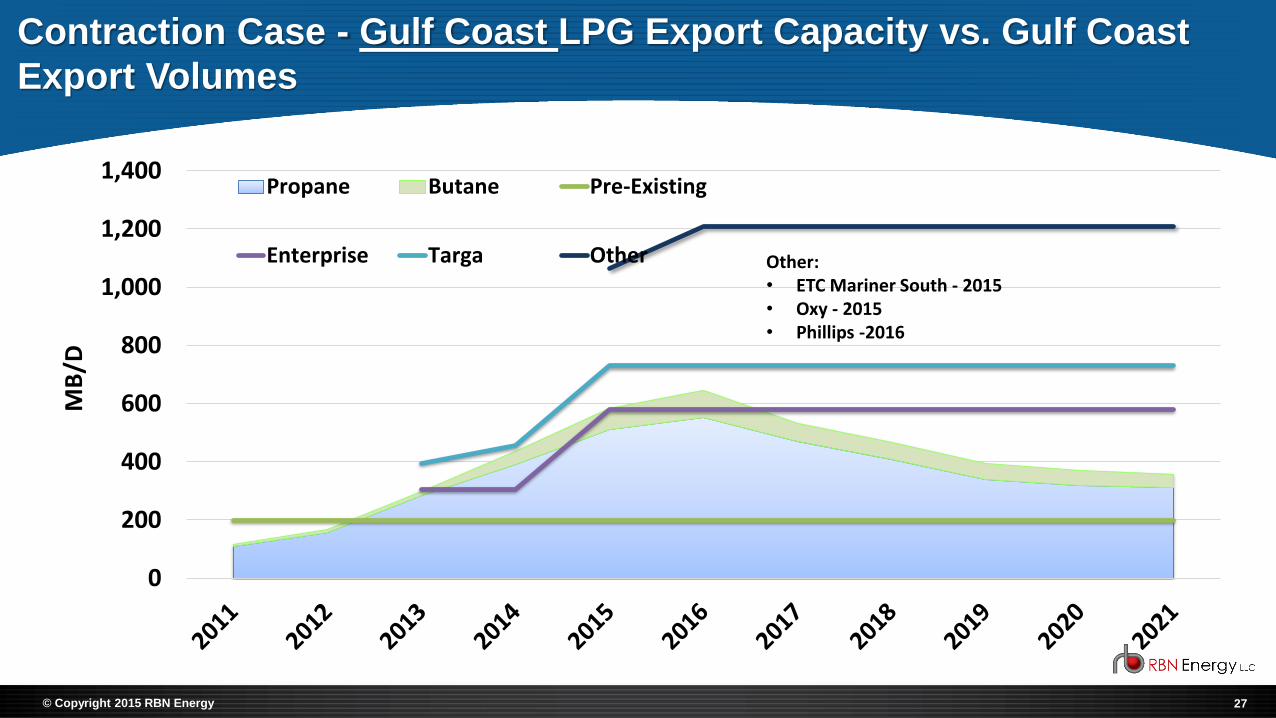
Contraction Case - Gulf Coast LPG Export Capacity vs. Gulf Coast
Export Volumes
0
200
400
600
800
1,000
1,200
1,400
MB
/D
Propane Butane Pre-Existing
Enterprise Targa Other Other:• ETC Mariner South - 2015• Oxy - 2015• Phillips -2016

28© Copyright 2015 RBN Energy
Marcus Hook LPG Export Capacity vs. Volumes - Growth
0
50
100
150
200
250
300
MB
/D
Propane
Butane
Existing Mariner East
Mariner East II Expansion
* Contracted and forecasted ethane volumes removed from capacity and volumes

29© Copyright 2015 RBN Energy
Marcus Hook LPG Export Capacity vs. Volumes - Contraction
0
50
100
150
200
250
300
MB
/D
Propane
Butane
Existing Mariner East
Mariner East II Expansion
* Contracted and forecasted ethane volumes removed from capacity and volumes
30© Copyright 2015 RBN Energy
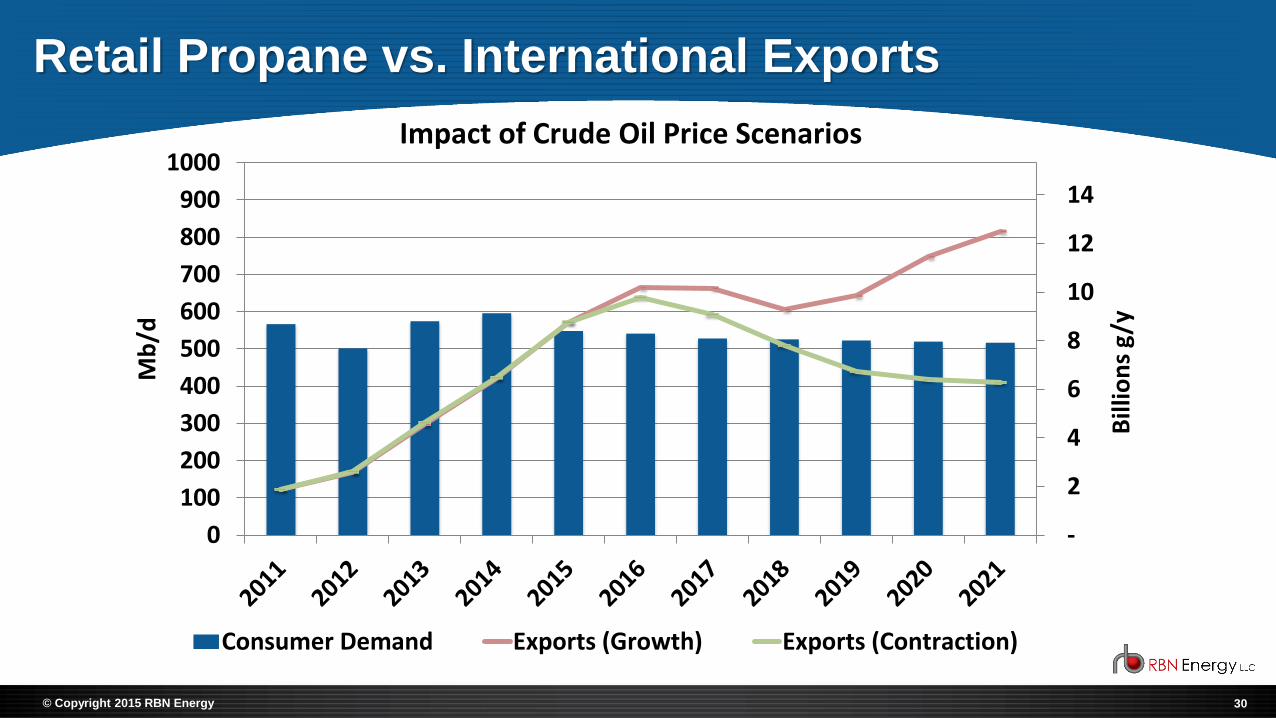
Retail Propane vs. International Exports
-
2
4
6
8
10
12
14
0
100
200
300
400
500
600
700
800
900
1000
Bill
ion
s g
/y
Mb
/d
Consumer Demand Exports (Growth) Exports (Contraction)
Impact of Crude Oil Price Scenarios
31© Copyright 2015 RBN Energy
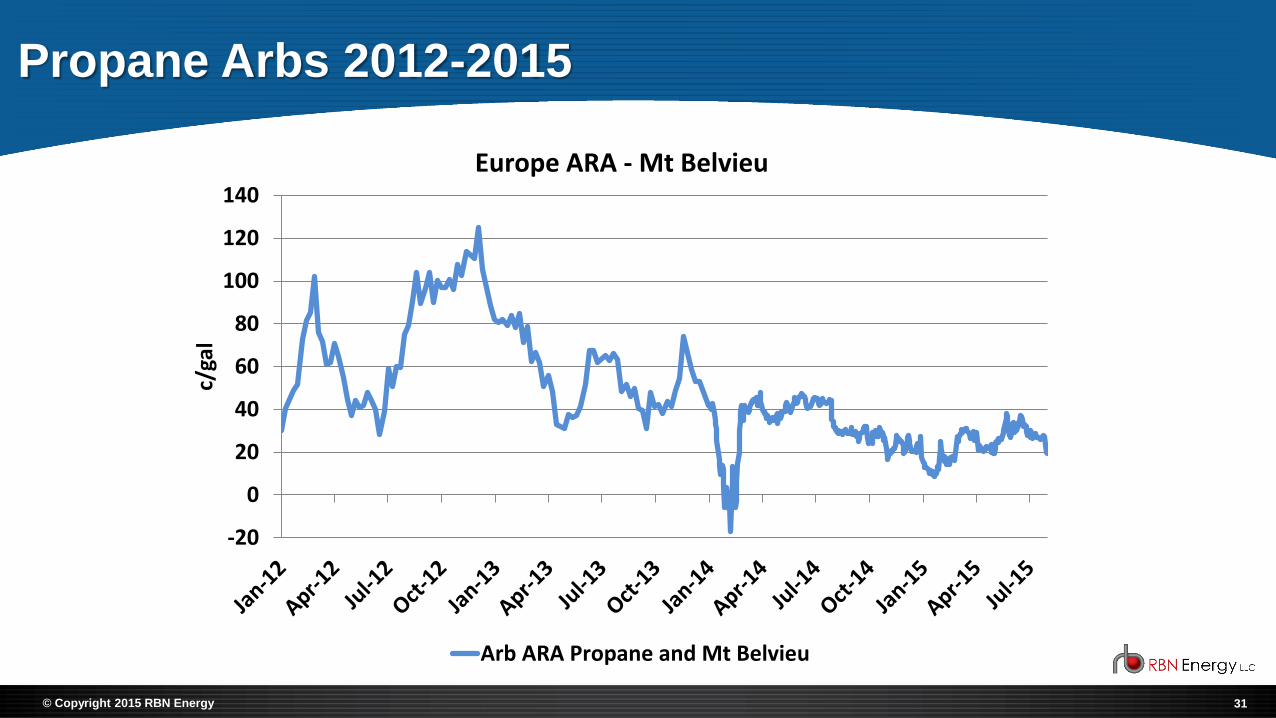
Propane Arbs 2012-2015
-20
0
20
40
60
80
100
120
140c/
gal
Europe ARA - Mt Belvieu
Arb ARA Propane and Mt Belvieu
32© Copyright 2015 RBN Energy
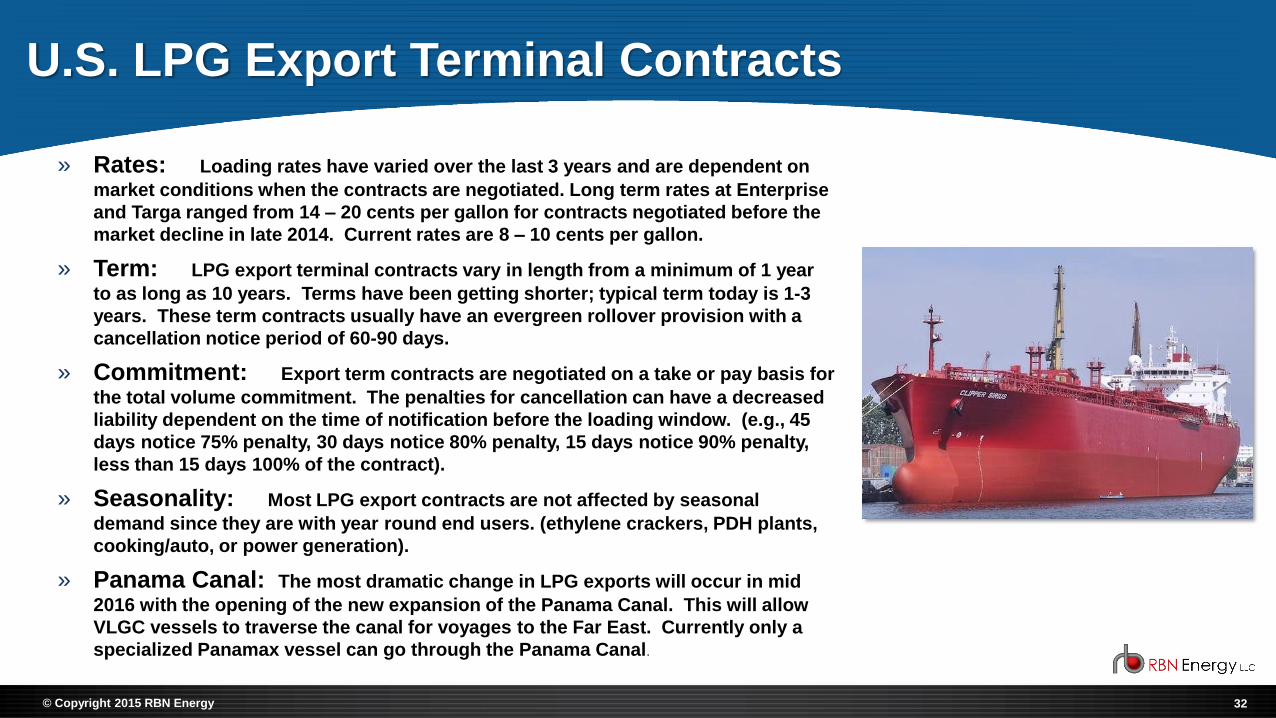
U.S. LPG Export Terminal Contracts
» Rates: Loading rates have varied over the last 3 years and are dependent on
market conditions when the contracts are negotiated. Long term rates at Enterprise
and Targa ranged from 14 – 20 cents per gallon for contracts negotiated before the
market decline in late 2014. Current rates are 8 – 10 cents per gallon.
» Term: LPG export terminal contracts vary in length from a minimum of 1 year
to as long as 10 years. Terms have been getting shorter; typical term today is 1-3
years. These term contracts usually have an evergreen rollover provision with a
cancellation notice period of 60-90 days.
» Commitment: Export term contracts are negotiated on a take or pay basis for
the total volume commitment. The penalties for cancellation can have a decreased
liability dependent on the time of notification before the loading window. (e.g., 45
days notice 75% penalty, 30 days notice 80% penalty, 15 days notice 90% penalty,
less than 15 days 100% of the contract).
» Seasonality: Most LPG export contracts are not affected by seasonal
demand since they are with year round end users. (ethylene crackers, PDH plants,
cooking/auto, or power generation).
» Panama Canal: The most dramatic change in LPG exports will occur in mid
2016 with the opening of the new expansion of the Panama Canal. This will allow
VLGC vessels to traverse the canal for voyages to the Far East. Currently only a
specialized Panamax vessel can go through the Panama Canal.

33© Copyright 2015 RBN Energy
VLGC Fleet (60,000-85,000 CBM)
» Fleet: 170 units
» Fleet age 25+: 4%
» Orderbook: 96 units
19%
38%15%
9%
15%
1% 3%VLGC Age Profile
0-4
5-9
10-14
15-20
21-25
26-30
30+
170
26
55
11 40246810121416
020406080
100120140160180
Mill
ion
CB
M
Nu
mb
er
VLGC Fleet and Orderbook
Number Cbm

34© Copyright 2015 RBN Energy
PADD 1 – Weather Sensitivities - Contraction
-60
-10
40
90
140
190
240
-50
0
50
100
150
200
Mill
ion
s g/
m
Mb
bl/
d
Net Receipts*
Net Receipts - Normal Weather
Net Receipts - Polar Vortex
0
1
2
3
4
5
6
7
MM
bb
l
Inventories
Last 5 year Range 13-14
14-15 15-16
16-17 PV - 16-17
* Or decreased exports

35© Copyright 2015 RBN Energy
PADD 2 – Weather Sensitivities - Contraction
50
70
90
110
130
150
170
190
210
40
60
80
100
120
140
160
180
Mill
ion
s g/
m
Mb
bl/
d
Net Deliveries
Net Deliveries - Normal Weather
Net Deliveries - Polar Vortex
0
5
10
15
20
25
30
35
MM
bb
l
Inventories
Last 5 year Range 13-14
14-15 15-16
16-17 PV - 16-17
36© Copyright 2015 RBN Energy
Forward Crude Oil Price Scenarios
$40
$45
$50
$55
$60
$65
$70
$75
$80
$85$
/Bb
lCrude Oil: WTI Cushing
Growth Contraction

37© Copyright 2015 RBN Energy
Propane Price and Ratio to WTI
$0.50
$0.60
$0.70
$0.80
$0.90
$1.00
$1.10
$1.20
$1.30
$1.40
$1.50
$/G
al
Price
Growth
Contraction
20%
25%
30%
35%
40%
45%
50%
55%
60%
65%
70%Ratio to Crude Oil
Growth Contraction
38© Copyright 2015 RBN Energy
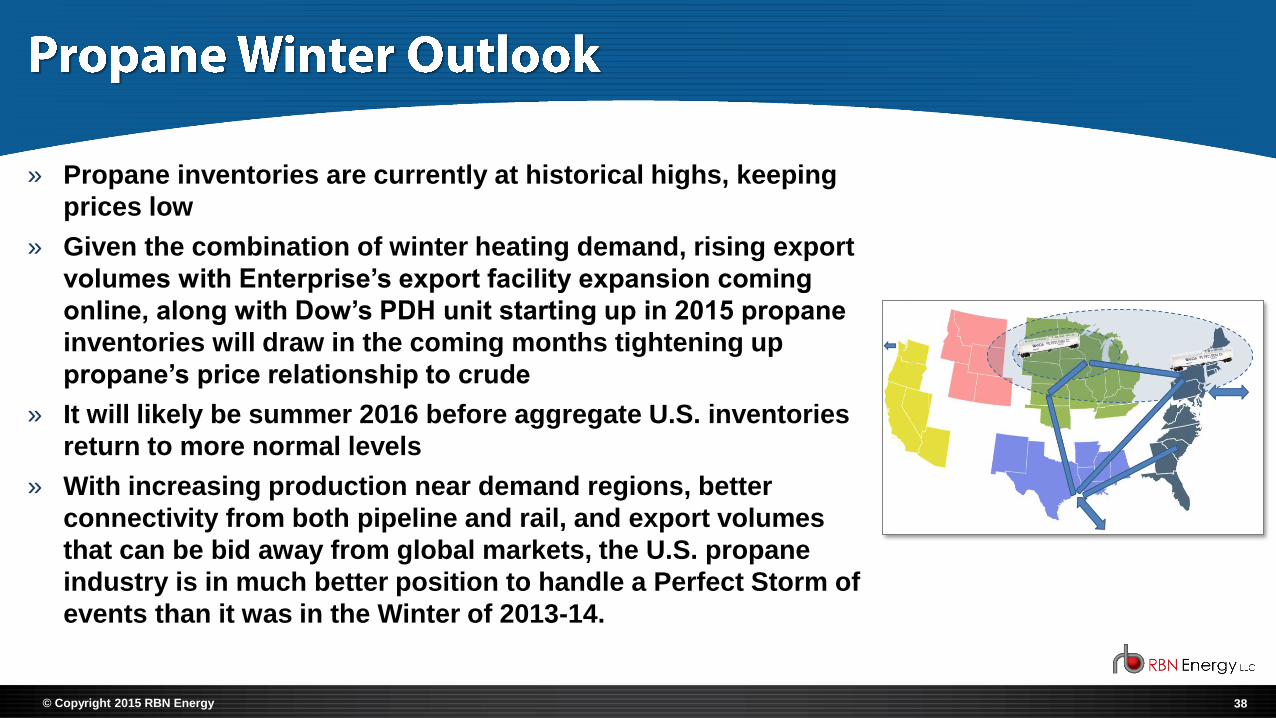
» Propane inventories are currently at historical highs, keeping
prices low
» Given the combination of winter heating demand, rising export
volumes with Enterprise’s export facility expansion coming
online, along with Dow’s PDH unit starting up in 2015 propane
inventories will draw in the coming months tightening up
propane’s price relationship to crude
» It will likely be summer 2016 before aggregate U.S. inventories
return to more normal levels
» With increasing production near demand regions, better
connectivity from both pipeline and rail, and export volumes
that can be bid away from global markets, the U.S. propane
industry is in much better position to handle a Perfect Storm of
events than it was in the Winter of 2013-14.

39© Copyright 2015 RBN Energy
Kelly Van Hull2323 South Shepherd, Suite 1010
Houston, TX, 77019www.rbnenergy.com