Embed Size (px)
Citation preview
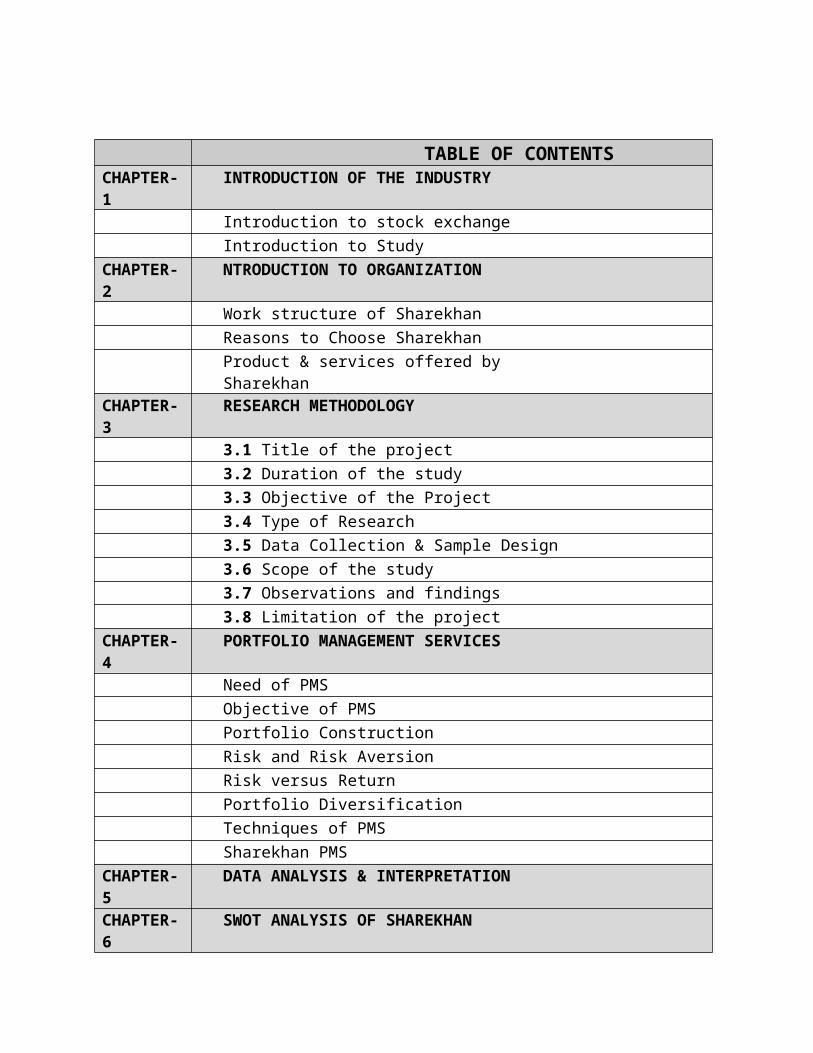
TABLE OF CONTENTSCHAPTER-1 INTRODUCTION OF THE INDUSTRY
Introduction to stock exchange
Introduction to Study
CHAPTER-2 NTRODUCTION TO ORGANIZATION
Work structure of Sharekhan
Reasons to Choose SharekhanProduct & services offered by Sharekhan
CHAPTER-3 RESEARCH METHODOLOGY
3.1 Title of the project
3.2 Duration of the study3.3 Objective of the Project3.4 Type of Research3.5 Data Collection & Sample Design
3.6 Scope of the study3.7 Observations and findings3.8 Limitation of the project
CHAPTER-4 PORTFOLIO MANAGEMENT SERVICES
Need of PMS
Objective of PMS
Portfolio Construction
Risk and Risk Aversion
Risk versus Return
Portfolio Diversification
Techniques of PMS
Sharekhan PMS
CHAPTER-5 DATA ANALYSIS & INTERPRETATION
CHAPTER-6 SWOT ANALYSIS OF SHAREKHAN
CHAPTER-7 CONCLUSION
CHAPTER-8 RECOMMENDATIONS & SUGGESTIONS
ANNEXURE
BIBLIOGRAPHY
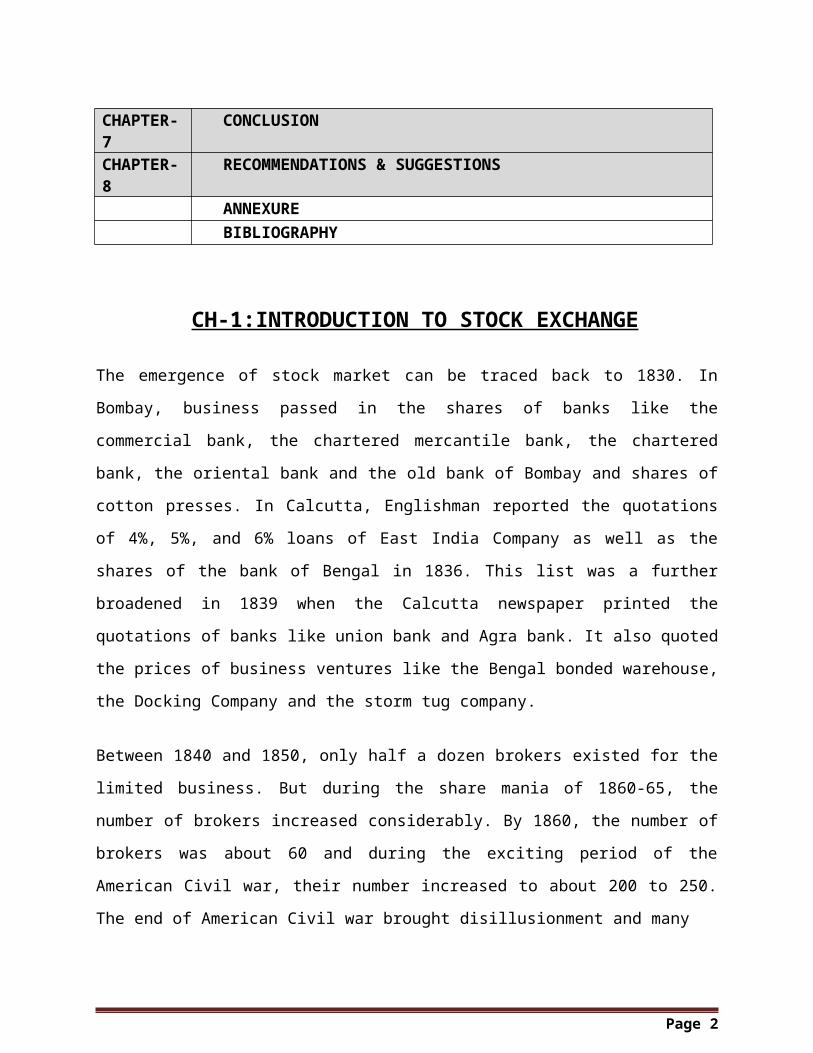
CH-1:INTRODUCTION TO STOCK EXCHANGE
The emergence of stock market can be traced back to 1830. In Bombay, business
passed in the shares of banks like the commercial bank, the chartered mercantile bank,
the chartered bank, the oriental bank and the old bank of Bombay and shares of cotton
presses. In Calcutta, Englishman reported the quotations of 4%, 5%, and 6% loans of
East India Company as well as the shares of the bank of Bengal in 1836. This list was a
further broadened in 1839 when the Calcutta newspaper printed the quotations of banks
like union bank and Agra bank. It also quoted the prices of business ventures like the
Bengal bonded warehouse, the Docking Company and the storm tug company.
Between 1840 and 1850, only half a dozen brokers existed for the limited business. But
during the share mania of 1860-65, the number of brokers increased considerably. By
1860, the number of brokers was about 60 and during the exciting period of the
American Civil war, their number increased to about 200 to 250. The end of American
Civil war brought disillusionment and many
Failures and the brokers decreased in number and prosperity. It was in those
troublesome times between 1868 and 1875 that brokers organized an informal
association and finally as recited in the Indenture constituting the “Articles of
Association of the Exchange”.
On or about 9th day of July,1875, a few native brokers doing brokerage business in
shares and stocks resolved upon forming in Bombay an association for protecting the
character, status and interest of native share and stock brokers and providing a hall or
building for the use of the Members of such association.
As a meeting held in the broker’ Hall on the 5th day of February, 1887, it was resolved
to execute a formal deal of association and to constitute the first managing committee
and to appoint the first trustees. Accordingly, the Articles of Association of the Exchange
and the Stock Exchange was formally established in Bombay on 3rd day of December,
1887. The Association is now known as “The Stock Exchange”
Page 2
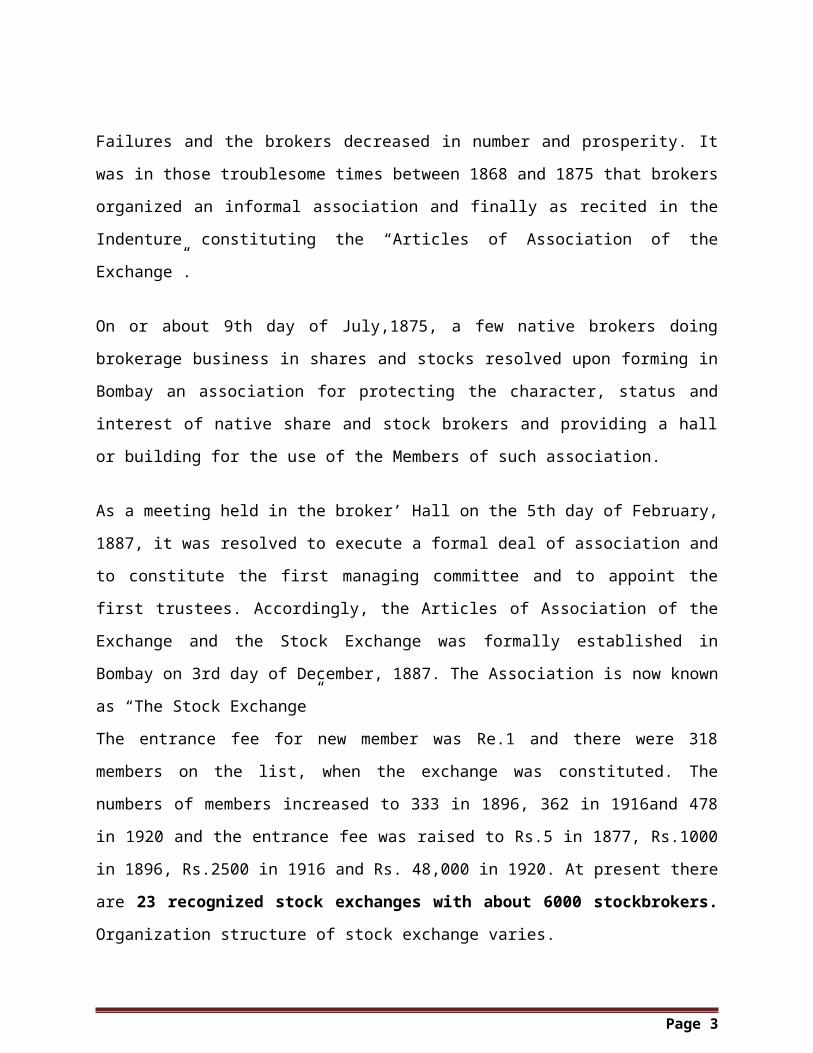
The entrance fee for new member was Re.1 and there were 318 members on the list,
when the exchange was constituted. The numbers of members increased to 333 in
1896, 362 in 1916and 478 in 1920 and the entrance fee was raised to Rs.5 in 1877,
Rs.1000 in 1896, Rs.2500 in 1916 and Rs. 48,000 in 1920. At present there are 23
recognized stock exchanges with about 6000 stockbrokers. Organization structure
of stock exchange varies.
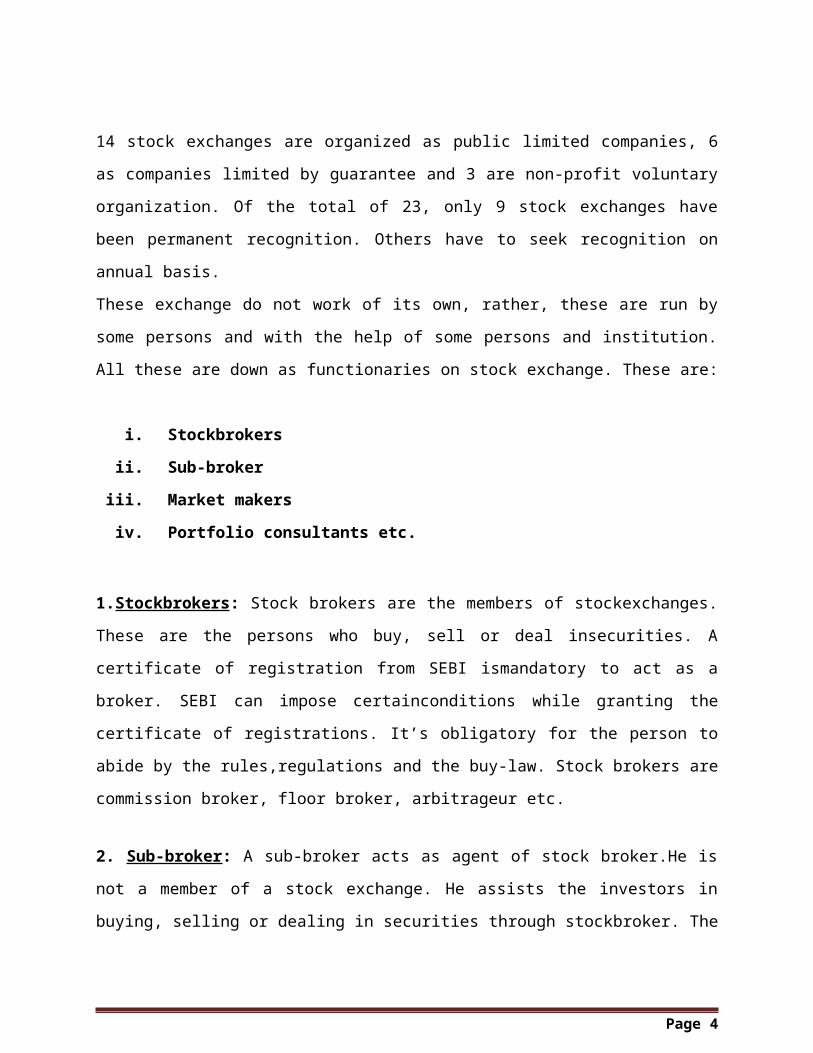
14 stock exchanges are organized as public limited companies, 6 as companies limited
by guarantee and 3 are non-profit voluntary organization. Of the total of 23, only 9 stock
exchanges have been permanent recognition. Others have to seek recognition on
annual basis.
These exchange do not work of its own, rather, these are run by some persons and with
the help of some persons and institution. All these are down as functionaries on stock
exchange. These are:
i. Stockbrokers
ii. Sub-broker
iii. Market makers
iv. Portfolio consultants etc.
1.Stockbrokers: Stock brokers are the members of stockexchanges. These are the
persons who buy, sell or deal insecurities. A certificate of registration from SEBI
ismandatory to act as a broker. SEBI can impose certainconditions while granting the
certificate of registrations. It’s obligatory for the person to abide by the rules,regulations
and the buy-law. Stock brokers are commission broker, floor broker, arbitrageur etc.
2. Sub-broker: A sub-broker acts as agent of stock broker.He is not a member of a
stock exchange. He assists the investors in buying, selling or dealing in securities
through stockbroker. The broker and sub-broker should enter into an agreement in
which obligations of both should be specified. Sub-broker must be registered SEBI for a
Page 3
dealing in securities. For getting registered with SEBI, he must fulfill certain rules and
regulation.
3. Market Makers: Market maker is a designated specialist in the specified securities.
They make both bid and offer at the same time. A market maker has to abide by bye-
laws, rules regulations of the concerned stock exchange. He is exempt from the margin
requirements. As per the listing requirements, a company where the paid-up capital is
Rs. 3 Crore but not more than Rs. 5 Crore and having a commercial operation for less
than 2 years should appoint a market maker at the time of issue of securities.
4. Portfolio Consultants: A combination of securities such as stocks, bonds and
money market instruments is collectively called as portfolio. Whereas the portfolio
consultants are the persons, firms or companies who advise, direct or undertake the
management or administration of securities or funds on behalf of their clients.
Traditionally stock trading is done through stock brokers, personally or through
telephones.
As number of people trading in stock market increase enormously in last few years,
some issues like location constrains, busy phone lines, miss communication etc start
growing in stock broker offices. Information technology (Stock Market Software) helps
stock brokers in solving these problems with Online Stock Trading.
Online Stock Market Trading is an internet based stock trading facility. Investor can
trade shares through a website without any manual intervention from Stock Broker.
Various Stock Exchanges in India
Page 4
Page 5
At present there are 23 stock exchange recognized under the securities contract
(regulation),Act 1956. Those are………..
1. .Ahmadabad Stock Exchange Association Ltd.
2. Bangalore Stock Exchange (BSE)
3. Bhubaneswar Stock Exchange Association(BSEA)
4. Bombay Stock Exchange (BSEA
5. Calcutta Stock Exchange(CSE)
6. Cochin Stock Exchange Ltd (CSE)
7. Coimbatore Stock Exchange (CSX)
8. Delhi Stock Exchange Association (DSE)
9. Guwahati Stock Exchange Ltd (GSE)
10. Hyderabad Stock Exchange Ltd.
11. Jaipur Stock Exchange Ltd (JSE)
12. Ludhiana Stock Exchange Association Ltd
13. Madras Stock Exchange
14. Madhya Pradesh Stock Exchange Ltd.
15 .Magadh Stock Exchange Limited
16. Manglore Stock Exchange
17. Meerut Stock Exchange Ltd.
18.National Stock Exchange of India (NSE)
19.OTC Exchange of India
20.Pune Stock Exchange Ltd.
Page 6

Advantages of Stocks Trading
Better returns : Actively trading stocks can produce better overall returns than
simply buying and holding.
Huge Choice : There are thousands of stocks listed on markets around the
world. There is always a stock whose price is moving - it’s just a matter of finding
them.
Familiarity : The most traded stocks are in the largest companies that most of us
have heard of and understand - Microsoft, IBM, and Cisco etc.
Disadvantages of Stocks Trading
Leverage : With a margined account the maximum amount of leverage available
for stock trading is usually 4:1. Meaning a $25,000 could trade up to $100,000 of
stock. This is pretty low compared to Forex trading or futures trading.
Pattern Day Trader Rules : It requires at least $25,000 to be held in a trading
account if the trader completes more than 4 trades in a 5 day period. No such
rule applies to Forex trading or futures trading.
Uptick Rule on Short Selling : A trader must wait until a stock price ticks up
before they can short sell it. Again there are no such rules in Forex trading or
futures trading where going short are as easy as going long.
Need to Borrow Stock to Short : Stocks are physical commodities and if a
trader wishes to go short then the broker must have arrangements in place to
borrow that stock from a shareholder until the trader closes their position. This
limits the opportunities available for short selling. Contrast this to futures trading
where selling is as easy as buying.
Costs : Although online trading costs for stock trading are low they still add
considerably to the costs of day trading. Online futures trading are about 1/4 of
the cost for the equivalent value. In the UK 0.5% stamp duty is also levied on all
share purchases making trading virtually impossible, hence the popularity of
spread betting.
Page 7
INTRODUCTION TO STUDY
The field of investment traditionally divided into security analysis and portfolio
management. The heart of security analysis is valuation of financial assets. Value in
turn is the function of risk and return. These two concepts are in the study of investment
.Investment can be defined the commitment of funds to one or more assets that will be
held over for some future time period.
In today fast growing world many opportunities are available, so in order to move with
changes and grab the best opportunities in the field of investments a professional fund
manager is necessary.
Therefore, in the present scenario the Portfolio Management Services (PMS) is fast
gaining importance as an investment alternative for the High Net worth Investors.
Portfolio Management Services (PMS) is an investment portfolio in stocks, fixed income,
debt, cash, structured products and other individual securities, managed by a
professional money manager that can potentially be tailored to meet specific investment
objectives.
When you invest in PMS, you own individual securities unlike a mutual fund investor,
who owns units of the entire fund. You have the freedom and flexibility to tailor your
portfolio to address personal preferences and financial goals. Although portfolio
managers may oversee hundreds of portfolio, your account may be unique.
Investment Management Solution in PMS can be provided in the following ways:
i. Discretionary
ii. Non Discretionary
iii. Advisory
Discretionary: Under these services, the choice as well as the timings of the
investment decisions rest solely with the Portfolio Manager.
Page 8
Non-Discretionary: Under these services, the portfolio manager only suggests the
investment ideas. The choice as well as the timings of the investment decisions rest
solely with the Investor .However the execution of trade is done by the portfolio
manager.
Advisory: Under these services, the portfolio manager only suggests the investment
ideas. The choice as well as the execution of the investment decisions rest solely with
the Investor.
Rule 2, clause (d) of the SEBI (portfolio managers) Rules, 1993 defines the term
“Portfolio” as “total holding of securities belonging to any person”.
As a matter of fact, portfolio is combination of assets the outcomes of which cannot be
defined with certainty new assets could be physical assets, real estates, land, building,
gold etc. or financial assets like stocks, equity, debenture, deposits etc.
Portfolio management refers to managing efficiently the investment in the securities
held by professional for others.
Merchant banker and the portfolio management with a view to ensure maximum return
by such investment with minimum risk of loss of return on the money invested in
securities held
by them for their clients. The aim Portfolio management is to achieve the maximum
return from a portfolio, which has been delegated to be managed by manger or financial
institution.
There are lots of organization in the market on the lookout for the people like you who
need their portfolios managed for them .They have trained and skilled talent will work on
your money to make it do more for you.
Therefore, if any investors still insist on managing their own portfolio, then ensure you
build discipline into their investment. Work out their strategy and stand by it.
Page 9
MYTHS ABOUT PMS
There are two most common myths found about Portfolio Management Services (PMS)
which we found among most of the Investors. They are as follows.
Myth No. 1:“PMS and Mutual Fund are Similar as the investment option”
As in the Finance Basket both the PMS and Mutual Fund are used for minimizing
risk and maximize the profit of the Investors. The objectives are similar as in both the
product but they are different from each other in certain aspects. They are as follows.
Management Side : In PMS, it’s ongoing personalized access to professional money
management services. Whereas, in Mutual fund gives personalize access to money.
Customization : In PMS, Portfolio can be tailored to address each investor's specific
needs. Whereas in Mutual Fund Portfolio structured to meet the fund's stated
investment objectives.
Ownership : In PMS, Investors directly own the individual securities in their portfolio,
allowing for tax management flexibility, whereas in Mutual Fund Shareholders own
shares of the fund and cannot influence buy and sell decisions or control their
exposure to incurring tax liabilities.
Liquidity : In PMS, managers may hold cash; they are not required to hold cash to
meet redemptions, whereas, Mutual funds generally hold some cash to meet
redemptions.
Minimums : PMS generally gives higher minimum investments than mutual funds.
Generally, minimum ranges from: Rs. 1 Crore + for Equity Options Rs. 5 Crore + for
Fixed Income Options Rs. 20 Lacs + for Structured Products, whereas in Mutual
Fund Provide ongoing, personalized access to professional money management
services.
Page 10
Sharekhan is one of the leading retail brokerage of Citi Venture which is running
successfully since 1922 in the country. Earlier it was the retail broking arm of the
Mumbai-based SSKI Group, which has over eight decades of experience in the stock
broking business. Share khan offers its customers a wide range of equity related
services including trade execution on BSE, NSE, Derivatives, depository services,
online trading, investment advice etc.
Earlier with a legacy of more than 80 years in the stock markets, the SSKI group
ventured into institutional broking and corporate finance 18 years ago. SSKI is one of
the leading players in institutional broking and corporate finance activities. SSKI holds a
sizeable portion of the market in each of these segments. SSKI’s institutional broking
arm accounts for 7% of the market for Foreign Institutional portfolio investment and 5%
of all Domestic Institutional portfolio investment in the country.
It has 60 institutional clients spread over India, Far East, UK and US. Foreign
Institutional Investors generate about 65% of the organization’s revenue, with a daily
turnover of over US$ 2 million. The content-rich and research oriented portal has stood
out among its contemporaries because of its steadfast dedication to offering customers
best-of-breed technology and superior market information. The objective has been to let
customers make informed decisions and to simplify the process of investing in stocks
Mission of the Sharekhan is
“To educate and empower the individual investor to make better investment
decisions through
QUALITY ADVICE
INNOVATIVE PRODUCTS
SUPERIOR SERVICES
Page 11
PROFILE OF THE COMPANY
Name of the company : Sharekhan ltd.
Year of Establishment : 1925
Headquarter : Sharekhan SSKI A-206 Phoenix House Phoenix Mills Compound Nature of Business : Service Provider
Services : Depository Services, Online Services and
Technical Research.
Number of Employees : Over 5500
Revenue : Data Not Available
Website : www.sharekhan.com
Slogan : Your Guide to The Financial Jungle.
Vision
To be the best retail brokering Brand in the retail business of stock market.
Mission
To educate and empower the individual investor to make better investment
decisions through quality advice and superior service.
Sharekhan is infact-
• Among the top 3 branded retail service providers
• No. 1 player in online business
• Largest network of branded broking outlets in the country serving more
Than 13,00,000 clients.
Page 12
WORK STRUCUTRE OF SHAREKHAN
Sharekhan has always believed in investing in technology to build its business. The
company has used some of the best-known names in the IT industry, like Sun
Microsystems, Oracle, Microsoft, Cambridge Technologies, Nexgenix, Vignette,
Verisign Financial Technologies India Ltd, Spider Software Pvt. Ltd. to build its trading
engine and content. The Citi Venture holds a majority stake in the company. HSBC,
Intel & Carlyle are the other investors.
On April 17, 2002 Sharekhan launched Speed Trade and Trade Tiger, are net-based
executable application stimulates the broker terminals along with host of other
information relevant to the Day Traders. This was for the first time that a net-based
trading station of this caliber was offered to the traders. In the last six months Speed
Trade has become a de facto standard for the Day Trading community over the net.
Sharekhan’s ground network includes over 700+Shareshops in 130+ cities in India.
The firm’s online trading and investment site www.sharekhan.com - was launched on
Feb 8, 2000. The site gives access to superior content and transaction facility to retail
customers across the country. Known for it’s jargon-free, investor friendly language and
high quality research, the site has a registered base of over 3 Lacs customers. The
number of trading members currently stands at over 7 Lacs. While online trading
currently accounts for just over 5 per cent of the daily trading in stocks in India,
Sharekhan alone accounts for 27 percent of the volumes traded online.
The Corporate Finance section has a list of very prestigious clients and has many ‘firsts’
to its credit, in terms of the size of deal, sector tapped etc. The group has placed over
US$ 5 billion in private equity deals.Some of the clients include BPL Cellular Holding,
Gujarat Pipavav, Essar, Hutchison, Planetasia, and Shopper’s Stop.Finally, Sharekhan
shifted hands and Citi venture get holds on it.
Page 13
MANAGEMENT TEAM OF SHAREKHAN
DINESH MURIKYA : OWNER OF THE COMPANY
TARUN SHAH : CEO OF THE COMPANY
SHANKAR VAILAYA : DIRECTOR (OPERATIONS)
JAIDEEP ARORA : DIRECTOR (PRODUCTS & TECHNOLOGY)
PATHIK GANDOTRA : HEAD OF RESEARCH
RISHI KOHLI : VICE PRESIDENT OF EQUITY DERIVATIVE
NIKHIL VORA : VICE PRESIDENT OF RESEARCH
ACHIEVEMENTS OF SHAREKHAN
Rated among the top 20 wired companies along with Reliance, HUJl, Infosys, etc by ‘Business Today’, January 2004 edition
. Awarded ‘Top Domestic Brokerage House’ four times by Euro money
and Asia money.
Pioneers of online trading in India amongst the top 3 online trading websites from India. Most preferred financial destination amongst online broking customers.
Winners of “Best Financial Website” award.
India’s most preferred brokers within 5 years. “Awaaz customers
Award 2005”.
Page 14
REASON TO CHOOSE SHAREKHAN LIMITED
Experience
SSKI has more than eight decades of trust and credibility in the Indian stock market. In
the Asia Money broker's poll held recently, SSKI won the 'India's best broking house for
2004' award. Ever since it launched Sharekhan as its retail broking division in February
2000, it has been providing institutional-level research and broking services to individual
investors.
Technology
With their online trading account one can buy and sell shares in an instant from any PC
with an internet connection. Customers get access to the powerful online trading tools
that will help them to take complete control over their investment in shares.
Accessibility
Sharekhan provides ADVICE, EDUCATION, TOOLS AND EXECUTION services for
investors. These services are accessible through many centers across the country
(Over 650 locations in 150 cities), over the Internet (through the website
www.sharekhan.com) as well as over the Voice Tool.
Knowledge
In a business where the right information at the right time can translate into direct
profits, investors get access to a wide range of information on the content-rich portal,
www.sharekhan.com. Investors will also get a useful set of knowledge-based tools that
will empower them to take informed decisions.
Convenience
One can call Sharekhan’s Dial-N-Trade number to get investment advice and execute
his/her transactions. They have a dedicated call-center to provide this service via a Toll
Free Number 1800 22-7500 & 39707500 from anywhere in India.
Page 15
Customer Service
Its customer service team assist their customer for any help that they need relating to
transactions, billing, demat and other queries. Their customer service can be contacted
via a toll-free number, email or live chat on www.sharekhan.com.
Investment Advice
Sharekhan has dedicated research teams of more than 30 people for fundamental and
technical research. Their analysts constantly track the pulse of the market.
BENEFITS FROM SHAREKHAN LIMITED
Free Depository A/c
Instant Cash Transfer
Multiple Bank Option.
Secure Order by Voice Tool Dial-n-Trade.
Automated Portfolio to keep track of the value of your actual purchases.
24x7 Voice Tool access to your trading account.
Personalized Price and Account Alerts delivered instantly to your Mobile Phone
& E-mail address.
Live Chat facility with Relationship Manager on Yahoo Messenger
Special Personal Inbox for order and trade confirmations.
On-line Customer Service via Web Chat.
Enjoy Automated Portfolio.
Buy or sell even single share
Anytime Ordering.
Page 16
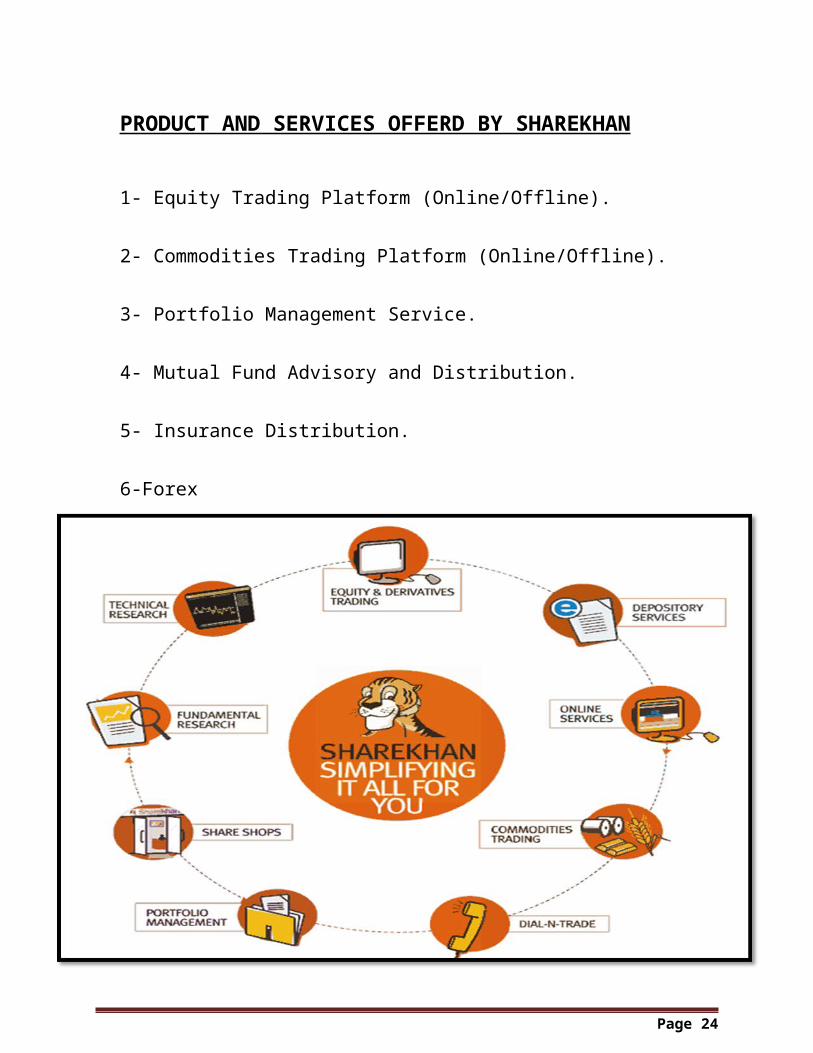
PRODUCT AND SERVICES OFFERD BY SHAREKHAN
1- Equity Trading Platform (Online/Offline).
2- Commodities Trading Platform (Online/Offline).
3- Portfolio Management Service.
4- Mutual Fund Advisory and Distribution.
5- Insurance Distribution.
6-Forex
6. Forex.
Page 17
Sharekhan offers the following products
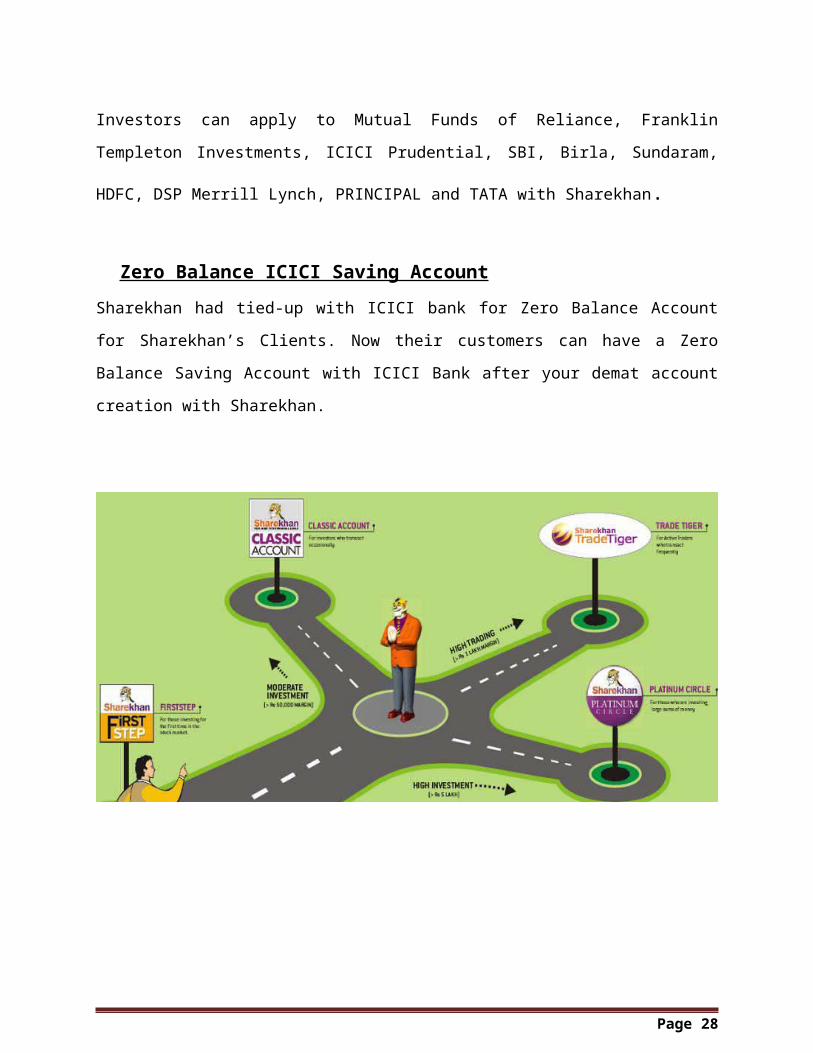
CLASSIC ACCOUNT
This is a User Friendly Product which allows the client to trade through website
www.sharekhan.com and issuitable for the retail investors who is risk-averse and hence
prefers to invest in stocks or who does not trade too frequently.
Features
Online trading account for investing in Equity and Derivatives via
www.sharekhan.com
Live Terminal and Single terminal for NSE Cash, NSE, F&O & BSE.
Integration of On-line trading, Saving Bank and Demat Account.
Instant cash transfer facility against purchase & sale of shares.
Competitive transaction charges.
Instant order and trade confirmation by E-mail.
Streaming Quotes (Cash & Derivatives).
Personalized market watch.
Single screen interface for Cash and derivatives and more.
Provision to enter price trigger and view the same online in market watch.
SPEEDTRADE
SPEEDTRADE is an internet-based software application that enables you to buy and
sell in an instant.It is ideal for active traders and jobbers who transact frequently during
day’s session to capitalize on intra-day price movement.
Features
Instant order Execution and Confirmation.
Single screen trading terminal for NSE Cash, NSE F&O& BSE.
Technical Studies.
Multiple Charting.
Page 18
Real-time streaming quotes, tic-by-tic charts.
Market summary (Cost traded scrip, highest clue etc.)
Hot keys similar to broker’s terminal.
Alerts and reminders.
Back-up facility to place trades on Direct Phone lines.
Live market debts.
DIAL-N-TRADE
Along with enabling access for trade online, the CLASSIC and SPEEDTRADE
ACCOUNT also gives Dial-n-trade services. With this service, one can dial Sharekhan’s
dedicated phone lines 1800-22-7500, 3970-7500.Beside this, Relationship Managers
are always available on Office Phone and Mobile to resolve customer queries.
SHARE MOBILE
Sharekhan had introduced Share Mobile, mobile based software where one can watch
Stock Prices, Intraday Charts, Research & Advice and Trading Calls live on the Mobile.
(As per SEBI regulations, buying-selling shares through a mobile phone are not yet
permitted.)
PREPAID ACCOUNT
Customers pay Advance Brokerage on trading Account and enjoy uninterrupted trading
in their Account Beside this, great discount are also available (up to 50%)on brokerage.
Prepaid Classic Account: - Rs. 2000
Prepaid Speed trade Account: - Rs. 6000
IPO ON-LINE
Customers can apply to all the forthcoming IPOs online. This is quite hassle-free,
paperless and time saving. Simply allocate fund to IPO Account, Apply for the IPO and
Sit Back & Relax.
Page 19
Mutual Fund Online
Investors can apply to Mutual Funds of Reliance, Franklin Templeton Investments, ICICI
Prudential, SBI, Birla, Sundaram, HDFC, DSP Merrill Lynch, PRINCIPAL and TATA with
Sharekhan.
Zero Balance ICICI Saving Account
Sharekhan had tied-up with ICICI bank for Zero Balance Account for Sharekhan’s
Clients. Now their customers can have a Zero Balance Saving Account with ICICI Bank
after your demat account creation with Sharekhan.
Page 20
HOW TO OPEN AN ACCOUNT WITH SHAREKHAN LIMITED?
For online trading with Sharekhan Ltd., investor has to open an account. Following are
the ways to open an account with Sharekhan Ltd.:
One need to call them at phone number provided below and asks that he want
to open an account with them.
a. One can call on the Toll Free Number: 1-800-22-7500 to speak to a Customer
Service executive
b. Or If one stays in Mumbai, he can call on 022-66621111
One can visit any one of Sharekhan Limited’s nearest branches. Sharekhan has
a huge network all over India (640 centers in 280 cities). One can also log on to
“http://sharekhan.com/Locateus.aspx” link to find out the nearest branch.
One can send them an email at [email protected] to know about their
products and services.
One can also visit the site www.sharekhan.com and click on the option “Open an
Account” to fill a small query form which will ask the individual to give details regarding
his name, city he lives in, his email address, phone number, pin code of the city, his
nearest Sharekhan Ltd. shop and his preferences regarding the type of account he
wants.
Page 21
DOCUMENTS REQUIREDFOR ACCOUNT OPENING
Apart from two passport size photographs, one needs to provide with the following
documents in order to open an account with Sharekhan Limited.:
Photocopy of the clients’ PAN Card which should be duly attached
Photo copy of any of the following documents duly attached which will serve as
Correspondence address proof:
a. Passport (valid)
b. Voter’s ID CARD
c. Ration Card
d. Driving License (valid)
e. Electricity Bill (should be latest and should be in the name of the client)
f. Telephone Bill (should be latest and should be in the name of the client)
g. Flat Maintenance Bill (should be latest and should be in the name of the
client)
h. Insurance Policy (should be latest and should be in the name of the client)
i. Lease or Rent Agreement.
j. Saving Bank Statement** (should be latest)
Two cheques drawn in favour of Sharkhan Limited, one for the Account
Opening Fees and the other for the Margin Money (the minimum margin money
is Rs. 5000).
A cancelled cheque should be given by the client if he provides Saving Bank
Statement as a proof for correspondence address.
NOTE: Only Saving Bank Account cheques are accepted for the purpose of
Opening an Account
Page 22
CH-3 RESEARCH METHADOLOGY
3.1 Title of the project
Portfolio Management Services- An Investment option
3.2 Duration of the study-:The Study was carried out for the period of one
and half months from 21th june to 5th August 2010.
3.3 Objective of the project-:Each research study has its own specific
purpose. It is like to discover to Question through the application of scientific procedure.
But the main aim of our research to find out the truth that is hidden and which has not
been discovered as yet. Our research study has two objectives:-
OBJECTIVES
To know the concept of Portfolio Management.
To know about the schemes offered by the different insurance companies, new
IPO’s, Mutual Funds.
To know in depth about Insurance, Mutual Funds, Stock, Bonds etc.
To know about the awareness towards stock brokers and share market.
To study about the competitive position of Sharekhan Ltd in Competitive Market.
To study about the effectiveness & efficiency of Sharekhan Ltd in relation to it’s
competitors.
To study about whether people are satisfied with Sharekhan Services &
Management System or not.
To study about the difficulties faced by persons while Trading in Sharekhan.
To study about the need of improvement in existing Trading system.
Page 23
3.4 Type of Research
RESEARCH DESISGN OF THE STUDY
This report is based on primary as well secondary data, however primary data collection
was given more importance since it is overhearing factor in attitude studies. One of the
most important users of research methodology is that it helps in identifying the problem,
collecting, analyzing the required information data and providing an alternative solution
to the problem .It also helps in collecting the vital information that is required by the top
management to assist them for the better decision making both day to day decision and
critical ones.
The study consists of analysis about Investors Perception about the Portfolio
Management Services offered by Sharekhan Limited. For the purpose of the study 100
customers were picked up at random and their views solicited on different parameters.
The methodology adopted includes
Questionnaire
Random sample survey of customers
Discussions with the concerned
Page 24
3.5 Data collection & Sample Design
Sources of Data
Primary data: Questionnaire
Secondary data: Published materials of Sharekhan Limited. Such as periodicals, journals, news papers, and website.
Sampling Plan
Sampling :
Since Sharekhan Limited has many segments I selected Portfolio Management
Services (PMS) segment as per my profile to do market research. 100% coverage was
difficult within the limited period of time. Hence sampling survey method was adopted
for the purpose of the study.
Population : (Universe) customers & non consumers of Sharekhan limited
Sampling size:
A sample of hundred was chosen for the purpose of the study. Sample consisted of
Investor as based on their Income and Profession as well as Educational Background.
Sampling Methods:
Probability sampling requires complete knowledge about all sampling units in the
universe. Due to time constraint non-probability sampling was chosen for the study.
Sampling procedure:
From large number of customers & non consumers sample lot were randomly picked
up by me.
Page 25
3.6 Scope of the Study
The study of the Portfolio Management Services is helpful in the following
areas.
In today's complex financial environment, investors have unique needs which are
derived from their risk appetite and financial goals. But regardless of this, every
investor seeks to maximize his returns on investments without capital erosion.
Portfolio Management Services (PMS) recognize this, and manage the
investments professionally to achieve specific investment objectives, and not to
forget, relieving the investors from the day to day hassles which investment
require.
It is offers professional management of equity investment of the investor with an
aim to deliver consistent return with an eye on risk.
Identify the key Stock in each portfolio.
To look out for new prospective customers who are willing to invest in PMS.
To find out the Sharekhan, PMS services effectiveness in the current situation.
It also covers the scenario of the Investment Philosophy of a Fund Manager.
Page 26

3.7 OBSERVATION AND FINDING
About 85% Respondents knows about the Investment Option, because
remaining 15% take his /her residential property as Investment, but in actual it
not an investment philosophy carries that all the Investment does not create any
profit for the owner.
More than 75% Investors are investing their money for Liquidity, Return and Tax
benefits.
At the time of Investment the Investors basically considered the both Risk and
Return in more %age around 65%.
As among all Investment Option for Investor the most important area to get more
return is share around 22%after that Mutual Fund and other comes into
existence.
More than 76% of Investors feels that PMS is less risky than investing money in
Mutual Funds.
As expected return from the Market more than 48% respondents expect the rise
in Income more than 15%, 32% respondents are expecting between 15-25%
return.
As the experience from the Market more than 34% Investor had lose their money
during the concerned year, whereas 20% respondents have got satisfied return.
About 45% respondents do the Trade in the Market with Derivatives Tools
Speculation compare to 24% through Hedging .And the rest 31% trade their
money in Investments.
Around 57% residents manage their Portfolio through the different company
whereas 43%Investor manage their portfolio themselves.
The most important reasons for doing trade with Sharekhan limited is ‘Sharekhan
Research Department’ than its Brokerage rate Structure.
Page 27
Out of hundred respondents 56% respondents are using Sharekhan PMs
services.
Investors preferred more than 45% equity Portfolio, 28%Balanceed Portfolio and
about 27% Debt Portfolio with Sharekhan PMS.
About 52% Respondents earned through Sharekhan PMS product, whereas 18%
investor faced loses also.
More than 63% Investor are happy with the Transparency system of Sharekhan
limited.
As based on the good and bad experience with Sharekhan limited around 86%
are ready to recommended the PMS of Sharekhan to their peers, relatives etc.
Page 28

3.8 LIMITATION OF THE PROJECT
As only Jaipur was dealt in the survey so it does not represent the view of the
total Indian market.
The sample size was restricted with hundred respondents.
There was lack of time on the part of respondents.
The survey was carried through questionnaire and the questions were based on
perception.
There may be biasness in information by market participant.
Complete data was not available due to company privacy and secrecy.
Some people were not willing to disclose the investment profile.
Page 29
PORTFOLIO MANGEMNT SERVICES (PMS)
Portfolio (finance) means a collection of investments held by an institution or a private
individual. Holding a portfolio is often part of an investment and risk-limiting strategy
called diversification. By owning several assets, certain types of risk (in particular
specific risk) can be reduced. There are also portfolios which are aimed at taking high
risks – these are called concentrated portfolios.
Investment management is the professional management of various securities (shares,
bonds etc) and other assets (e.g. real estate), to meet specified investment goals for the
benefit of the investors. Investors may be institutions (insurance companies, pension
funds, corporations etc.) or private investors (both directly via investment contracts and
more commonly via collective investment schemes e.g. mutual funds).
The term asset management is often used to refer to the investment management of
collective investments, whilst the more generic fund management may refer to all forms
of institutional investment as well as investment management for private investors.
Investment managers who specialize in advisory or discretionary management on
behalf of (normally wealthy) private investors may often refer to their services as wealth
management or portfolio management often within the context of so-called "private
banking
NEED OF PMS
As in the current scenario the effectiveness of PMS is required. As the PMS gives
investors periodically review their asset allocation across different assets as the portfolio
can get skewed over a period of time. This can be largely due to appreciation /
depreciation in the value of the investments.
As the financial goals are diverse, the investment choices also need to be different to
meet those needs. No single investment is likely to meet all the needs, so one should
keep some money in bank deposits and / liquid funds to meet any urgent need for cash
and keep the balance in other investment products/ schemes that would maximize the
Page 30
return and minimize the risk. Investment allocation can also change depending on one’s
risk-return profile.
OBJECTIVE OF PMS
There are the following objective which is fulfilled by Portfolio Management Services.
1. Safety Of Fund : The investment should be preserved, not be lost, and should
remain in the returnable position in cash or kind.
2. Marketability : The investment made in securities should be marketable that means,
the securities must be listed and traded in stock exchange so as to avoid difficulty in
their encashment.
3. Liquidity : The portfolio must consist of such securities, which could be en-cashed
without any difficulty or involvement of time to meet urgent need for funds.
Marketability ensures liquidity to the portfolio.
4. Reasonable return : The investment should earn a reasonable return upto keep the
declining value of money and be compatible with opportunity cost of the money in
terms of current income in the form of interest or dividend.
5. Appreciation in Capital : The money invested in portfolio should grow and result
into capital gains.
6. Tax planning : Efficient portfolio management is concerned with composite tax
planning covering income tax, capital gain tax, wealth tax and gift tax.
7. Minimize risk : Risk avoidance and minimization of risk are important objective of
portfolio management. Portfolio managers achieve these objectives by effective
Page 31

investment planning and periodical review of market, situation and economic
environment affecting the financial market.
PORTFOLIO CONSTRUCTION
The Portfolio Construction of Rational investors wish to maximize the returns on their
funds for a given level of risk. All investments possess varying degrees of risk. Returns
come in the form of income, such as interest or dividends, or through growth in capital
values (i.e. capital gains).
The portfolio construction process can be broadly characterized as comprising the
following steps:
1.Setting objectives.
The first step in building a portfolio is to determine the main objectives of the fund given
the constraints (i.e. tax and liquidity requirements) that may apply. Each investor has
different objectives, time horizons and attitude towards risk. Pension funds have long-
term obligations and, as a result, invest for the long term. Their objective may be to
maximize total returns in excess of the inflation rate. A charity might wish to generate
the highest level of income whilst maintaining the value of its capital received from
bequests. An individual may have certain liabilities and wish to match them at a future
date. Assessing a client’s risk tolerance can be difficult. The concepts of efficient
portfolios and diversification must also be considered when setting up the investment
objectives.
2. Defining Policy .
Once the objectives have been set, a suitable investment policy must be established.
The standard procedure is for the money manager to ask clients to select their preferred
mix of assets, for example equities and bonds, to provide an idea of the normal mix
desired. Clients are then asked to specify limits or maximum and minimum amounts
they will allow to be invested in the different assets available. The main asset classes
Page 32
are cash, equities, gilts/bonds and other debt instruments, derivatives, property and
overseas assets. Alternative investments, suchas private equity, are also growing in
popularity, and will be discussed in a later chapter. Attaining the optimal asset mix over
time is one of the key factors of successful investing.
3. Applying portfolio strategy.
At either end of the portfolio management spectrum of strategies are active and passive
strategies. An active strategy involves predicting trends and changing expectations
about the likely future performance of the various asset classes and actively dealing in
and out of investments to seek a better performance. For example, if the manager
expects interest rates to rise, bond prices are likely to fall and so bonds should be sold,
unless this expectation is already factored into bond prices. At this stage, the active
fund manager should also determine the style of the portfolio. For example, will the fund
invest primarily in companies with large market capitalizations, in shares of companies
expected to generate high growth rates, or in companies whose valuations are low? A
passive strategy usually involves buying securities to match a preselected market index.
Alternatively, a portfolio can be set up to match the investor’s choice of tailor-made
index. Passive strategies rely on diversification to reduce risk. Out performance versus
the chosen index is not expected. This strategy requires minimum input from the
portfolio manager. In practice, many active funds are managed somewhere between the
active and passive extremes, the core holdings of the fund being passively managed
and the balance being actively managed.
4.Asset selections .
Once the strategy is decided, the fund manager must select individual assets in which
to invest. Usually a systematic procedure known as an investment process is
established, which sets guidelines or criteria for asset selection. Active strategies
require that the fund managers apply analytical skills and judgment for asset selection in
order to identify undervalued assets and to try to generate superior performance.
Page 33
5.Performance assessments.
In order to assess the success of the fund manager, the performance of the fund is
periodically measured against a pre-agreed benchmark – perhaps a suitable stock
exchange index or against a group of similar portfolios (peer group comparison).The
portfolio construction process is continuously iterative, reflecting changes internally and
externally. For example, expected movements in exchange rates may make overseas
investment more attractive, leading to changes in asset allocation. Or, if many large-
scale investors simultaneously decide to switch from passive to more active strategies,
pressure will be put on the fund managers to offer more active funds. Poor performance
of a fund may lead to modifications in individual asset holdings or, as an extreme
measure; the manager of the fund may be changed altogether.
TYPES OF ASSETS
The structure of a portfolio will depend ultimately on the investor’s objectives and on the
asset selection decision reached. The portfolio structure takes into account a range of
factors, including the investor’s time horizon, attitude to risk, liquidity requirements, tax
position and availability of investment’s. The main asset classes are cash, bonds and
other fixed income securities, equities, derivatives, property and overseas assets.
Cash and cash instruments
Cash can be invested over any desired period, to generate interest income,in a range of
highly liquid or easily redeemable instruments, from simple bank deposits, negotiable
certificates of deposits, commercial paper (short-term corporate debt) and Treasury bills
(short term government debt) to money market funds, which actively manage cash
resources across a range of domestic and foreign markets. Cash is normally held over
the short term pending use elsewhere (perhaps for paying claims by a non-life
insurance company or for paying pensions), but may be held over the longer term as
well. Returns on cash are driven by the general demand for funds in an economy,
interest rates, and the expected rate of inflation.
Page 34
Bonds
Bonds are debt instruments on which the issuer (the borrower) agrees to make interest
payments at periodic intervals over the life of the bond – this can be for two to thirty
years or, sometimes, in perpetuity. Interest payments can be fixed or variable, the latter
being linked to prevailing levels of interest rates.Bond markets are international and
have grown rapidly over recent years.The bond markets are highly liquid, with many
issuers of similar standing,including governments (sovereigns) and state-guaranteed
organizations.Corporate bonds are bonds that are issued by companies.To assist
investors and to help in the efficient pricing of bond issues, many bond issues are given
ratings by specialist agencies such as Standard & Poor’s and Moody’s. The highest
investment grade is AAA, going all the way down to D, which is graded as in
default.Depending on expected movements in future interest rates, the capital values of
bonds fluctuate daily, providing investors with the potential for capital gains or losses.
Future interest rates are driven by the likely demand/supply of money in an economy,
future inflation rates, political events and interest rates elsewhere in world markets.
Investors with short-term horizons and liquidity requirements may choose to invest in
bonds because of their relatively higher return than cash and their prospects for
possible capital appreciation. Long-term investors, such as pension funds, may acquire
bonds for the higher income and may hold them until redemption – for perhaps seven or
fifteen years. Because of the greater risk, long bonds (over ten years to maturity) tend to
be more volatile in price than medium- and short-term bonds, and have a higher yield.
Equities
Equity consists of shares in a company representing the capital originally provided by
shareholders. An ordinary shareholder owns a proportional share of the company and
an ordinary share carries the residual risk and rewards after all liabilities and costs have
been paid.Ordinary shares carry the right to receive income in the form of
dividends(once declared out of distributable profits) and any residual claim on the
company’s assets once its liabilities have been paid in full. Preference shares are an
other type of share capital. They differ from ordinary shares in that the dividend on a
Page 35
preference share is usually fixed at some amount and does not change. Also,
preference shares usually do not carry voting rights and, in the event of firm failure,
preference share holders are paid before ordinary share holders.Returns from investing
in equities are generated in the form of dividend income and capital gain arising from
the ultimate sale of the shares. The level of dividends may vary from year to year,
reflecting the changing profitability of a company. Similarly, the market price of a share
will change from day to day to reflect all relevant available information. Although not
guaranteed, equity prices generally rise over time, reflecting general economic growth,
and have been found over the long term to generate growing levels of income in excess
of the rate of inflation. Granted, there may be periods of time, even years, when equity
prices trend downwards – usually during recessionary times. The overall long-term
prospect, however, for capital appreciation makes equities an attractive investment
proposition for major institutional investors.
Derivatives
Derivative instruments are financial assets that are derived from existing primary assets
as opposed to being issued by a company or government entity. The two most popular
derivatives are futures and options. The extent to which a fund may incorporate
derivatives products in the fund will be specified in the fund rules and, depending on the
type of fund established for the client and depending on the client, may not be allowable
at all.
A futures contract is an agreement in the form of a standardized contract between
two counter parties to exchange an asset at a fixed price and date in the future. The
underlying asset of the futures contract can be a commodity or a financial security. Each
contract specifies the type and amount of the asset to be exchanged, and where it is to
be delivered (usually one of a few approved locations for that particular asset). Futures
contracts can be set up for the delivery of cocoa, steel, oil or coffee. Likewise, financial
futures contracts can specify the delivery of foreign currency or a range of government
bonds.The buyer of a futures contract takes a ‘long position’, and will make a profit if the
value of the contract rises after the purchase. The seller of the futures contract takes a
‘short position’ and will, in turn, make a profit if the price of the futures contract falls.
Page 36
When the futures contract expires, the seller of the contract is required to deliver the
underlying asset to the buyer of the contract. Regarding financial futures contracts,
however, in the vast majority of cases no physical delivery of the underlying asset takes
place as many contracts are cash settled or closed out with the offsetting position
before the expiry date.
An option contract is an agreement that gives the owner the right, but not obligation,
to buy or sell (depending on the type of option) a certain asset for a specified period of
time. A call option gives the holder the right to buy the asset. A put option gives the
holder the right to sell the asset. European options can be exercised only on the
options’ expiry date. US options can be exercised at any time before the contract’s
maturity date. Option contracts on stocks or stock indices are particularly popular.
Buying an option involves paying a premium; selling an option involves receiving the
premium. Options have the potential for large gains or losses, and are considered to be
high-risk instruments. Sometimes, however, option contracts are used to reduce risk.
For example, fund managers can use a call option to reduce risk when they own an
asset. Only very specific funds are allowed to hold options.
Risk and Risk Aversion
Portfolio theory also assumes that investors are basically risk averse, meaning that,
given a choice between two assets with equal rates of return they will select the asset
with lower level of risk.
For example, they purchased various type of insurance including life insurance, Health
insurance and car insurance. The Combination of risk preference and risk aversion can
be explained by an attitude toward risk that depends on the amount of money involved.
A discussion of portfolio or fund management must include some thought given to the
concept of risk. Any portfolio that is being developed will have certain risk constraints
specified in the fund rules, very often to cater to a particular segment of investor who
possesses a particular level of risk appetite. It is, therefore, important to spend some
time discussing the basic theories of quantifying the level of risk in an investment, and
to attempt to explain the way in which market values of investments are determined
Page 37
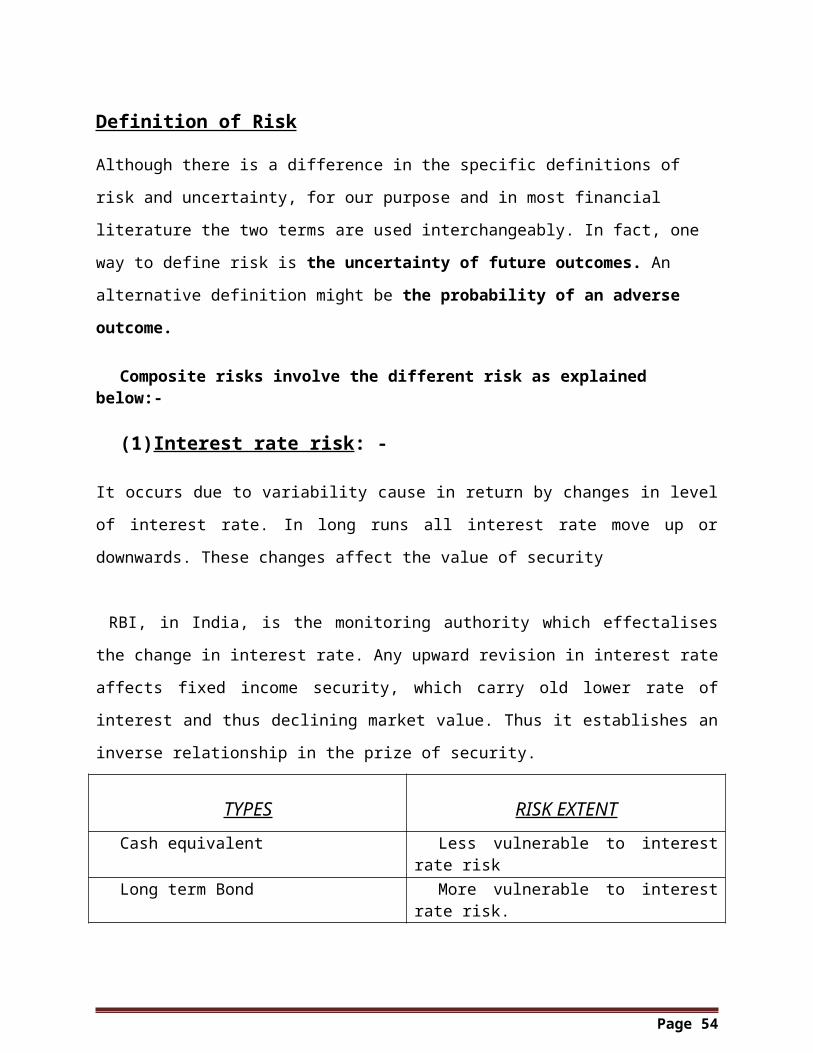
Definition of Risk
Although there is a difference in the specific definitions of risk and uncertainty, for our
purpose and in most financial literature the two terms are used interchangeably. In fact,
one way to define risk is the uncertainty of future outcomes. An alternative definition
might be the probability of an adverse outcome.
Composite risks involve the different risk as explained below:-
(1)Interest rate risk: -
It occurs due to variability cause in return by changes in level of interest rate. In long
runs all interest rate move up or downwards. These changes affect the value of security
RBI, in India, is the monitoring authority which effectalises the change in interest rate.
Any upward revision in interest rate affects fixed income security, which carry old lower
rate of interest and thus declining market value. Thus it establishes an inverse
relationship in the prize of security.
TYPES RISK EXTENT
Cash equivalent Less vulnerable to interest rate risk
Long term Bond More vulnerable to interest rate risk.
(2) Purchasing power risk:
It is known as inflation risk also. This risk emanates from the very fact that inflation
affects the purchasing power adversely. Purchasing power risk is more in inflationary
times in bonds and fixed income securities. It is desirable to invest in such securities
during deflationary period or a period of decelerating inflation. Purchasing power risk is
less in flexible income securities like equity shares or common stuffs where rise in
Page 38
dividend income offset increase in the rate of inflation and provide advantage of capital
gains.
(3) Business risk:
Business risk emanates from sale and purchase of securities affected by business
cycles, technological change etc. Business cycle affects all the type of securities viz.
there is cheerful movement in boom due to bullish trend in stock prizes where as
bearish trend in depression brings downfall in the prizes of all types of
securities.Flexible income securities are nearly affected than fixrate securities during
depression due to decline n the market prize.
(4) Financial risk:
Financial risk emanates from the changes in the capital structure of the company. It is
also known as leveraged risk and expressed in term of debt equity ratio. Excess of
debts against equity in the capital structure indicates the company to be highly geared
or highly levered. Although leveraged company’s earnings per share (EPS) are more
but dependence on borrowing exposes it to the risk of winding up. For, its inability to
the honor it’s commitments towards the creditors are most important.
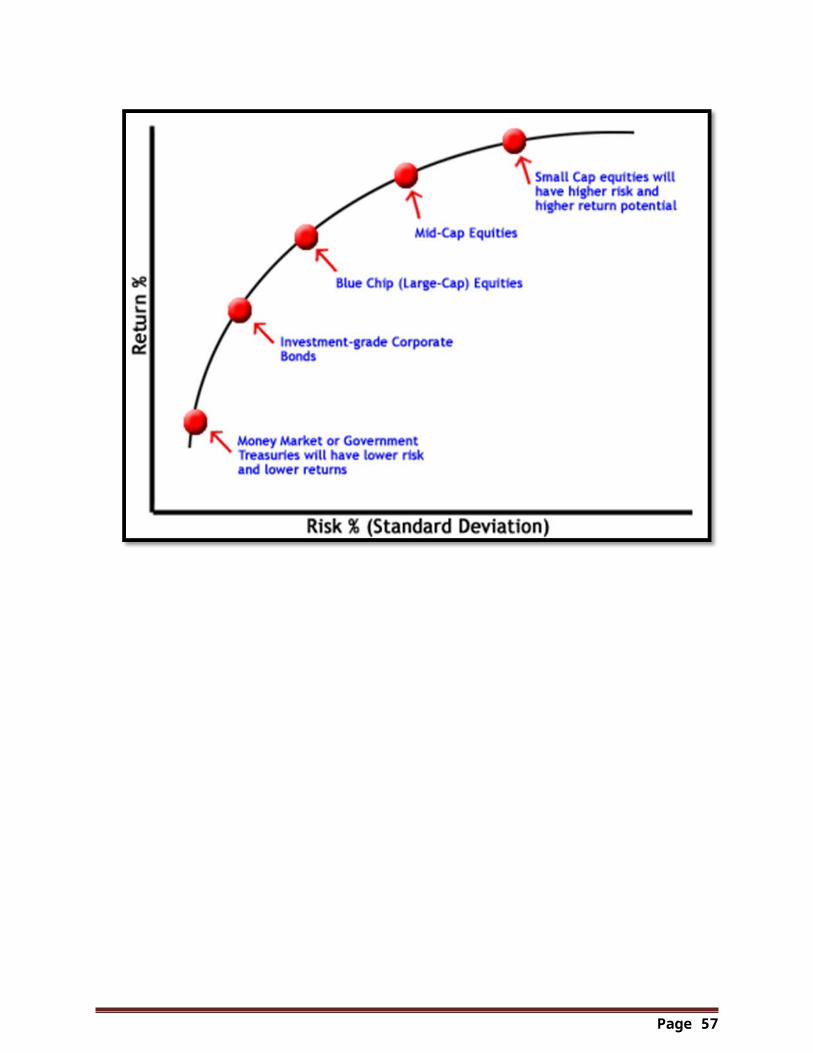
Here it is imperative to express the relationship between risk and return, which is
depicted graphically below
Page 39
Maximize returns, minimize risks
Page 40
RISK VERSUS RETURN
Risk versus return is the reason why investors invest in portfolios. The ideal goal in
portfolio management is to create an optimal portfolio derived from the best risk–return
opportunities available given a particular set of risk constraints. To be able to make
decisions, it must be possible to quantify the degree of risk in a particular opportunity.
The most common method is to use the standard deviation of the expected returns. This
method measures spreads, and it is the possible returns of these spreads that provide
the measure of risk.The presence of risk means that more than one outcome is
possible. An investment is expected to produce different returns depending on the set of
circumstances that prevail.
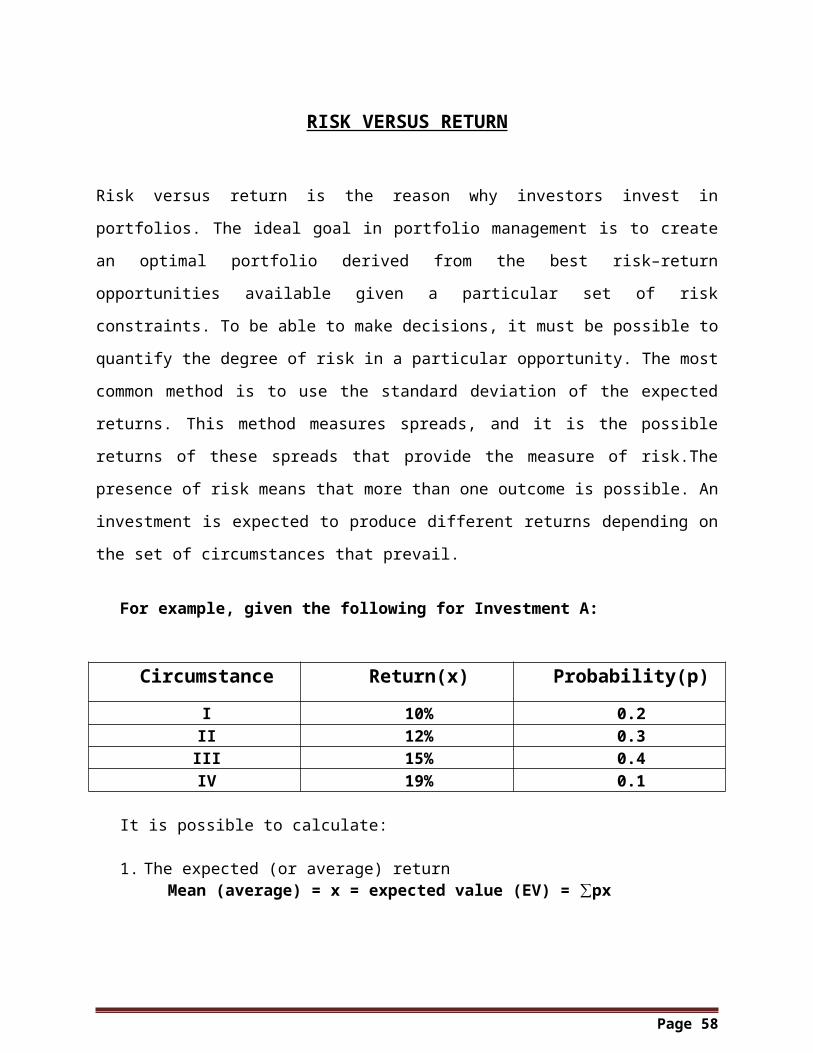
For example, given the following for Investment A:
Circumstance Return(x) Probability(p)
I 10% 0.2II 12% 0.3III 15% 0.4IV 19% 0.1
It is possible to calculate:
1. The expected (or average) returnMean (average) = x = expected value (EV) = ∑px
Circumstance Return(x) Probability(p) Px
I 10% 0.2 2.0II 12% 0.3 3.6III 15% 0.4 6.0IV 19% 0.1 1.9
Expected Return (∑px) = 13.5%
Page 41
2. The Standard deviation
Standard deviation(σ) = √ ∑p(x- x) 2
Also. Variance (VAR) is equal to the standard deviation squared or σ2
Circumstance Return ProbabilityDeviation
from expected
Return (x -x)
p(x -x)2
I 10% 0.2 -3.5% 2.45
II 12% 0.3 -1.5% .68
III 15% 0.4 +1.5% 1.90
IV 19% 0.1 +5.5% 3.03
VARAIANCE= 7.06
Standard deviation (σ) = √Variance
= √ 7.06
= 2.66%
The standard deviation is a measure of risk, whereby the greater the standard deviation,
the greater the spread, and the greater the spread, the greater the risk.
If the above exercise were to be performed using an other investment that offered the
same expected return, but a different standard deviation, then the following result might
occur:
Page 42
If the above exercise were to be performed using another investment that offered the
same expected return, but a different standard deviation, then the following result might
occur:
Plan Expected Return Risk(standard deviation)
Investment A 9% 2.5%
Investment B 9% 4.0%
Since both investments have the same expected return, the best selection of investment
would be Investment A, which provides the lower risk. Similarly, if there are two
investments presenting the same risk, but one has a higher return than the other, that
investment would be chosen over the investment with the lower return for the same risk.
In the real world, there are all types of investors. Some investors are completely risk
averse and others are willing to take some risk, but expect a higher return for that risk.
Different investors will also have different tolerances or threshold levels for risk–return
trade-offs – i.e. for a given level of risk, one investor may demand a higher rate of return
than another investor.
Portfolio Diversification
There are several different factors that cause risk or lead to variability in returns on an
individual investment. Factors that may influence risk in any given investment vehicle
include uncertainty of income, interest rates,inflation, exchange rates, tax rates, the
state of the economy, default risk and liquidity risk (the risk of not being able to sell on
the investment). In addition, an investor will assess the risk of a given investment
(portfolio) within the context of other types of investments that may already be
owned ,i.e. stakes in pension funds, life insurance policies with savings components,
and property
Page 43
Covariance and Correlation
The goal is to hold a group of investments or securities within a portfolio potentially to
reduce the risk level suffered without reducing the level of return. To measure the
success of a potentially diversified portfolio, covariance and correlation are
considered. Covariance measures to what degree the returns of two risky assets move
in tandem. A positive covariance means that the returns of the two assets move
together, whilst a negative covariance means that they move in inverse directions.
Covariance
COV(x, y) = ∑p(x-x) (y-y)for two investments x and y, where p is the probability.
Covariance is an absolute measure, and covariance cannot be compared with one
another. To obtain a relative measure, the formula for correlation coefficient [r] is used.
Correlation coefficient
r = COVxy
σxσy
To illustrate the above, here is the example:
Circumstance Probability x-x y-y∑p(x-x) (y-y)
I 0.2 +1.0 -3.5 -0.7
II 0.3 0 -1.5 0
III 0.4 +1.5 +1.5 0.9
IV 0.1 -4 +5.5 -2.2
COVxy=-2.0
Page 44
For data regarding (y – y), see earlier example. Assume that a similar exercise has been run for data regarding (x – x). Assume the variance or σ2 of x=2.45, and the variance or σ2 of y = 7.06. Thus, the correlation coefficient would be
-2.0 r = √ 2.45 √7.056
= -0.481
If, the same example is run again, but using a different set of numbers for y, a different
correlation coefficient might result of say, –0.988. It can be concluded that a large
negative correlation confirms the strong tendency of the two investments to move
inversely.
Perfect positive correlation (correlation coefficient = +1) occurs when the
returns from two securities move up and down together in proportion. If these
securities were combined in a portfolio, the ‘offsetting’ effect would not occur.
Perfect negative correlation (correlation coefficient = –1) takes place when one
security moves up and the other one down in exact proportion. Combining these
two securities in a portfolio would increase the diversification effect.
Uncorrelated (correlation coefficient = 0) occurs when returns from two
securities move independently of each other – that is, if one goes up, the other
may go up or down or may not move at all. As a result, the combination of these
two securities in a portfolio may or may not create a diversification effect.
However, it is still better to be in this position than in a perfect positive correlation
situation.
Unsystematic and systematic risk As mentioned previously, diversification diminishes risk: the more shares or assets held
in a portfolio or in investments, the greater the risk reduction. However, it is impossible
to eliminate all risk completely even with extensive diversification. The risk that remains
Page 45
is called market risk; the risk that is caused by general market influences. This risk is
also known as systematic risk or non-diversifiable risk. The risk that is associated with a
specific asset and that can be abolished with diversification is known as unsystematic
risk, unique risk or diversifiable risk.
Total risk = Systematic risk + Unsystematic risk
Systematic risk = the potential variability in the returns offered by a security or
asset caused by general market factors, such as interest rate changes,inflation
rate movements, tax rates, state of the economy.
Unsystematic risk = the potential variability in the returns offered by a security or
asset caused by factors specific to that company, such as profitability margins,
debt levels, quality of management, susceptibility to demands of customers and
suppliers.
TECHNOQUES OF PORTFOLIO MANAGEMENT
Various types of portfolio require different techniques to be adopted to achieve the
desired objectives. Some of the techniques followed in India by portfolio managers are
summarized below.
Page 46
(1). Equity portfolio: Equity portfolio is affected by internal and external factors.
(a) Internal factors : Pertain to the inner working of the particular company of which
equity shares are held. These factors generally include:
(1) Market value of shares
(2) Book value of shares
(3) Price earnings ratio (P/E ratio)
(4) Dividend payout ratio
(b) External factors:
(1) Government policies
(2) Norms prescribed by institutions
(3) Business environment
(4) Trade cycles
(2). Equity stock analysis:
The basic objective behind the analysis is to determine the probable future – value
of the shares of the concerned company. It is carried out primarily fewer than two ways.
(a)Earnings per share
(b) Price earnings ratio
(a) Trend of earning :
A higher price-earnings ratio discount expected profit growth. Conversely, a
downward trend in earning results in a low price-earnings ratio to discount
anticipated decrease in profits, price and dividend. Rising EPS causes
appreciation in price of shares, which benefits investors in lower tax brackets?
Such investors have not pay tax or to give lower rate tax on capital gains.
Many institutional investor like stability and growth and support high EPS.
Page 47
Growth of EPS is diluted when a company finances internally its expansion
program and offers new stock.
EPS increase rapidly and result in higher P/E ratio when a company finances it’s
expansion program from internal sources and borrowings without offering new
stock.
(b) Quality of reported earning :
Quality of reported earnings affects P/E ratio. The factors that affect the quality of
reported earnings are as under:
Depreciation allowances: -
Larger (Non Cash) deduction for depreciation provides more funds to company to
finance profitable expansion schemes internally. This builds up future earning power of
company.
Research and development outlets : -
There is higher P/E ratio for a company, which carries R&D programs. R&D enhances
profit earning strength of the company through increased future sales.
Inventory and other non-recurring type of profit : -
Low cost inventory may be sold at higher price due to inflationary conditions among
profit but such profit may not always occur and hence low P/E ratio.
(c)Dividend policy:
Dividend policy is significant in affecting P/E ratio. With higher dividend ratio, equity
price goes up and thus raises P/E ratio. Dividend rates are raised to push in share
prices up. Dividend cover is calculated to find out the time the dividend is protected, In
terms of earnings. It is calculated as under:
Dividend Cover = EPS / Dividend per Share
Page 48
(d) Investors demand : Demand from institutional investors for equity also enhances
the P/E ratio.
TYPES OF PORTFOLIOS
The different types of Portfolio which is carried by any Fund Manager to maximize
profit and minimize losses are different as per their objectives .They are as follows.
Page 49
1. Agreesive Portfolio
Objective: Growth. This strategy might be appropriate for investors who
seek High growth and who can tolerate wide fluctuations in market values, over the
short term.
2. Growth Portfolio
Objective: Growth. This strategy might be appropriate for investors who
have a preference for growth and who can withstand significant fluctuations in market
value.
3. Balanced Portfolio
Objective: Capital appreciation and income. This strategy might be appropriate for
investors who want the potential for capital appreciation and some growth, and who can
with stand moderate fluctuations in market values
Page 50
4. Conservative Portfolio
Objective: Income and capital appreciation. This strategy may be appropriate for
investors who want to preserve their capital and minimize fluctuations in market value.
Sharekhan Portfolio Management Services
1. PRO PRIME
Product Approach
Page 51
Investment will be keeping in mind 3 investment tenets.
1. Consistent, steady and sustainable returns.
2. Margin of Safety
3. Low Volatility
Product offering
Pro Prime is the ideal for investors looking at steady and superior with low and medium
risk appetite. The portfolio consists of a blend of quality blue chip and growth stocks
ensuring a balanced portfolio with relatively medium risk profile.The portfolio constitutes
of relatively large capitalization stocks, based on sector and themes which have
medium to long term growth potential.
Product Characteristics
Bottom up stock selection
In depth ,independent fundamental research
High quality companies with relatively large capitalization
Disciplined valuation approach applying multiple valuation measure.
Medium to long term vision, resulting in low portfolio turnover.
How to invest?
Minimum Investment : 5Lacs
Lock in : 6 months
Reporting: Access to website showing clients holding .Monthly reporting of
portfolio holding /transaction.
Charges: 2.5% pa AMC (Annual Maintenances Charges) fees charged every
quarter ,0.5% brokerage ,20% profit sharing after 15% hurdle is crossed
chargeable at the end of fiscal year.
Page 52
SHAREKHAN PROPRIME PERFORMANCE
DATE
TOTAL
BSE
MOVMENTS
NSE
MOVMENTS
NAV
RETURNS
BSE
RETURNS
NSE
RETURNS
30/06/2010 9,510,384.53 17,700.90 5312.50 1.8% 1.0% 1.2%
31/03/2010 9,341,971.87 17,527.77 5249.10 93.6% 80.5% 73.8%
31/03/2009 4,826,060.16 9,708.50 3020.95 -43.0% -37.9% -36.2%
31/03/2008 8,459,884.99 15,644.44 4734.50 15.8% 19.7% 23.9%
31/03/2007 7,305,890.21 13,072.10 3821.55 10.8% 15.9% 12.3%
31/03/2006 6,596,047.11 11,279.96 3402.55 75.5% 73.7% 67.1%
2. PRO ARBRITAGE
Product Approach
An opportunity lies in basis which is the difference between cash and future. Whenever
basis is high we buy the stocks and sell the future to lock in difference .The difference is
bound to be zero at expiry.
Product Offered
Cash –future arbitrage: The product intends to spot low risk opportunities which will
yield more than the normal low risk product .Whenever such opportunity is spotted
stocks will be bought and to lock in the basis, future will be sold .This position will be
liquated in the expiry or before that if the basis vanishes early .Similarly the scheme will
move on from opportunity to opportunity.
Product Characteristics
Low Risk: This is relatively low risk product which can be compared with liquid funds
issued by mutual funds.
Page 53
High return: Compared with other low risk products, this products offers an indicative
post tax return of 8 to 10% plus.
Product Details
Minimum Investment:Rs.5 lacs
Lock in :6 months
Reporting: Fortnightly for portfolio Net worth, Monthly reporting pf portfolio
Holding /transaction.
Charges: 0.035% brokerage for future ,0.07% for delivery
3. PRO TECH
Pro-tech using the knowledge of technique analysis and the power of depravities
markets to identify trading opportunities in the market .The protech line of the product is
designed around various risk/reward/volatility profiles for the different kind of investment
needs.
Product Approach
Better performance is possible from superior market timing and from picking stocks
before inflation points in their trading cycles .Linear return are possible from having
hedged/ sell market positions in downtrends .Absolute return are targeted by focusing
on finding trading opportunities & not out performance of an index.
Product offered
1. Nifty Thirty :
Nifty futures will be bought and sold on the basis of an automated trading system
generated calls to go long/short. The exposure will never exceed the value of portfolio
i.e. no leveraging; but allows us to be short /hedged in Nifty in falling market therefore
allowing the client to earn irrespective of the market direction.
Page 54
2. Beta Portfolio :
Positional trading opportunities are identified in the future segment based on technical
analysis .Inflection points in the momentum cycles are identified to go long /short on
stock/index futures with 1-2 months time horizon .The idea is to generate the best
possible return in the medium term irrespective of the direction of the market without
really leveraging beyond the portfolio value. Risk protection is done based on stop
losses on daily closing prices.
3. Star Nifty:
Swing trading technique and Dow theory is used to identify short –term reversal levels
for Nifty futures and ride with trend both on the long and short side This return can be
earned in bull and bear market .Stop and reverse means to reverse ones position from
long to short or vice a versa at the reversal levels simultaneously .The exposure never
exceeds value of portfolio i.e. there is no leveraging.
4. Trailing Stops.
Momentum trading techniques are used to spot short –term momentum of 5-10 days in
stocks and stocks /index futures .Trailing stop loss method of risk management or profit
protection is used to lower the portfolio volatility and maximize return .Trading
opportunities are exposed both on the long side and the short side as the market
demands to get the best of both upward and downward trends.
Product Characteristics
Using swing based index –trading systems stop and reverse .trend following and
momentum trading technique.
Nifty based products for low impact cost and low product volatility
Both long and short strategies to earn returns even in falling market.
Page 55
Trading in future market to allow for active risk protection using trailing stop
losses.
How to invest?
Minimum : Rs.5Lacs
Lock in : 6 months
Reporting: Fortnightly reporting of portfolio Net Worth, monthly reporting of portfolio
Holding /Transaction.
Charges: 0% AMC (Annual Maintenance Charges), 0.05% brokerage for
derivatives,
Protech Performance Report
PROTECH PERFORMANCE SUMMARY SINCE INCEPTION
INCEPTION 15-OCT-2009 BETA(NEW)
01-FEB-2006NIFTY THIRFTY
15-OCT-2009TRAILING STOPS
INCEPTION NAV 10.00 10.00 10.00
NAV as on 30/06/10 9.20 19.89 9.84
RETURNS(%) -8.00 98.90 -1.64
Nifty Thrifty:
Page 56
NIFTY THRIFTY
Date NAV Sensex
01/02/2006 10.00 9859.26
30/06/2010 19.89 17700.90
Returns (%)
98.90 79.54
How it works:
Our first product is based completely on a mathematical model with zero human
intervention. This product has come out of its fifth draw-down period (in 28 years of
back testing) and the net asset value (NAV) is taking off to new heights.
Beta portfolio:
BETA PORTFOLIO
Date NAV Sensex
03/08/2007 10.00 15138.40
30/06/2010 9.20 17700.90
Returns (%) -8.00 16.93
How it works:
Our product is based on positional trading with a long and short model investing in plain
vanilla stock futures. In this, we identify stocks with greater risk-reward ratios with a time horizon
of 1 to 2 months, based on the prevalent market situation.
Trailing Stops:
TRAILING STOPS
NAV Sensex
20/10/2007 10.00 17559.98
30/06/2010 9.84 17700.90
Returns (%) -1.60 0.80
How it works:
The trading strategy is to buy short-term momentum over a time frame of 1 to 5 days
and then book small profits consistently.
Page 57
4. ProTech Diversified
Product Approach
Aim – Absolute returns irrespective of market direction by long –short strategy applied
on basket of indexes and stocks
Disciplined trading approach with no human intervention based on back testing on
indexes and stocks
Invests in the following
Nifty Futures
Bank Nifty Futures
Stock Futures
Advantages of ProTech-Diversified
Non Toggle system
Exposure to investments will be constant even after gains
Helps in protecting the gains
Reinvesting in case of draw-downs helps in faster recovery
Non –leveraged product
Product Details
Minimum Investment: Indian Resident Rs 5 lakhs,
For NRI's - Rs 50 Lacks
Lock in: 6 months
Fees: AMC fees : 0%
Brokerage: 0.05% only
Profit Sharing :20% profit sharing on booked profits on quarterly basis
Performance Sheet
Performance for the Month ended June 2010
Page 58
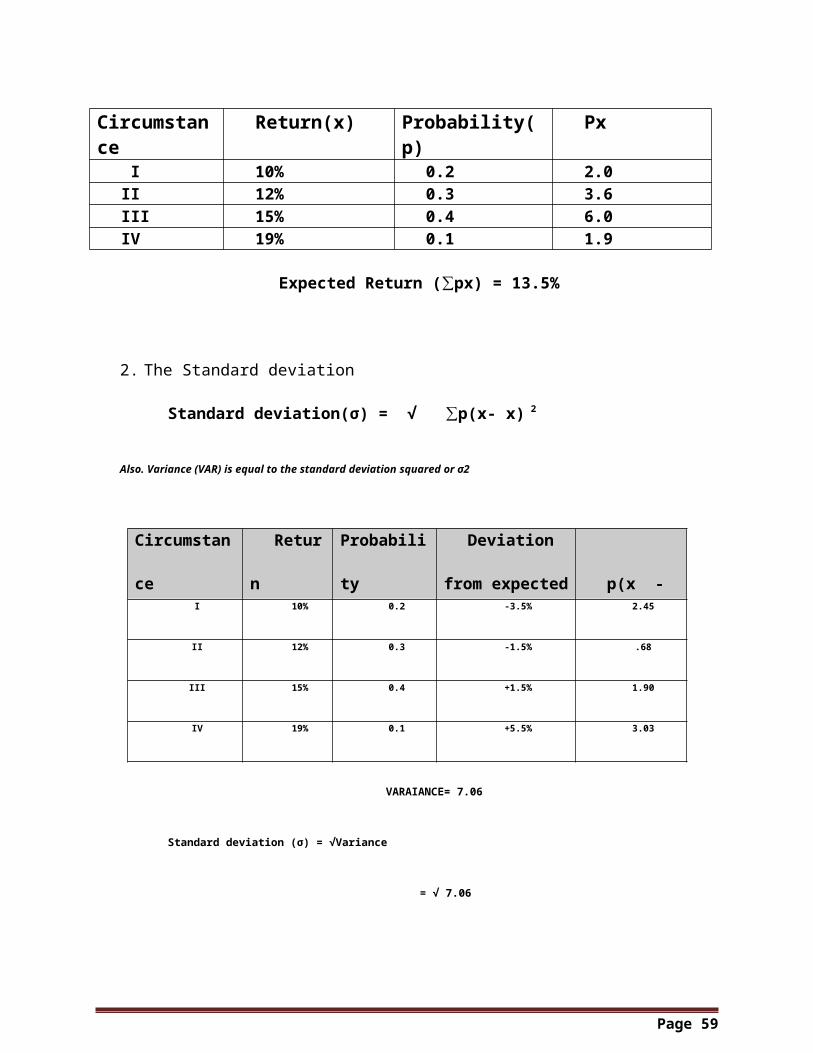
NAV as on 01-June-2010 10.07
NAV as on 30-June-2010 9.86
RETURNS (%) -2.07
Performance Summary Since Inception
As on 30 June 2010
INCEPTION NAV 10.00
NAV as on 30-June-2010 9.86
RETURNS (%) -1.35
OTHER PMS PROVIDED BY SHAREKHAN
1. Intraday Advisory Portfolio
Page 59
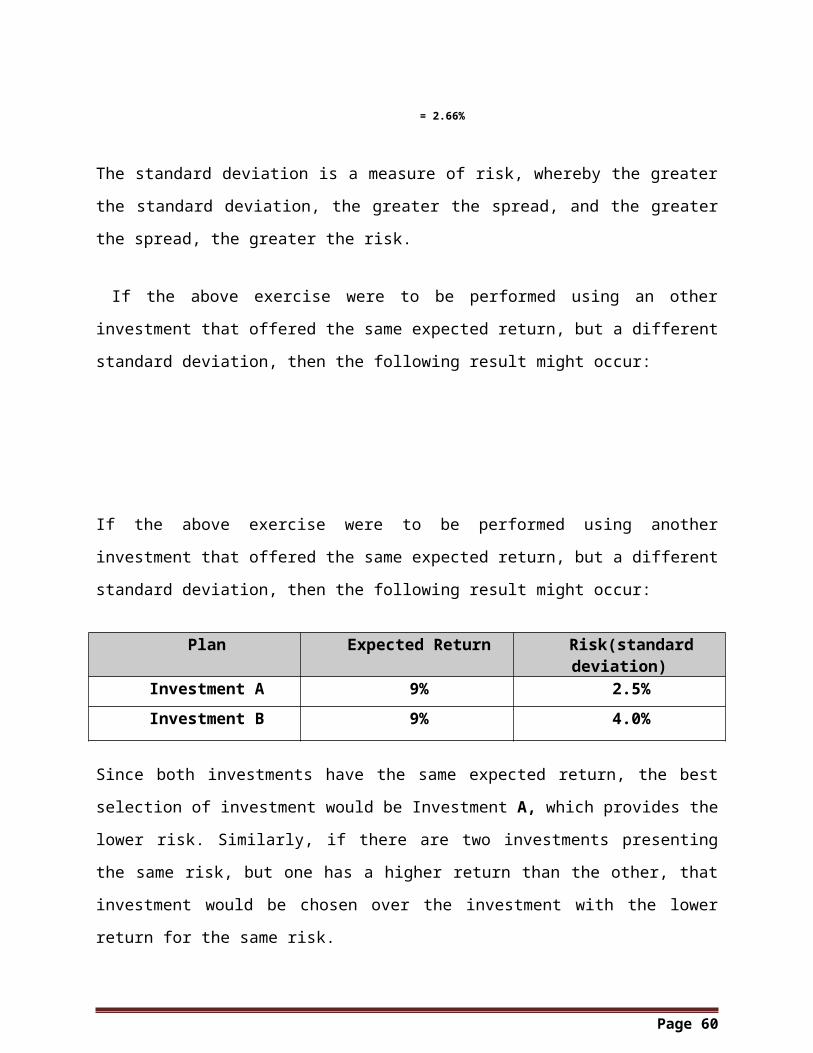
Ideal for Intraday Traders looking for aggressive returns with medium risk
appetite
Calls will be generated by Sharekhan Advisory Team
Time Frame : Settlement of calls on closing Basis
Is a Cash Market Portfolio
2.Smart Trade Portfolio
Is a cash Market Delivery Portfolio
Calls will be generated by Sharekhan Advisory Team
Time Frame of 1 day – 1 month.
Ideal for short term delivery trader lokking for aggressive returns with medium
risk appetite
Page 60
3. Nifty Portfolio
Is a Nifty – based derivative product
Time frame of 1 day -15 days.
Is aimed at traders who want to trade long – short in Nifty across all times frames
Ample Liquidity & Low Impact Cost
4. Derivative Portfolio
Is a Derivative Segment Portfolio
Time Frame of 1 day – 1 month
Is aimed at Short Term Derivative trader
Ideal for aggressive clients with risk appetite
Page 61
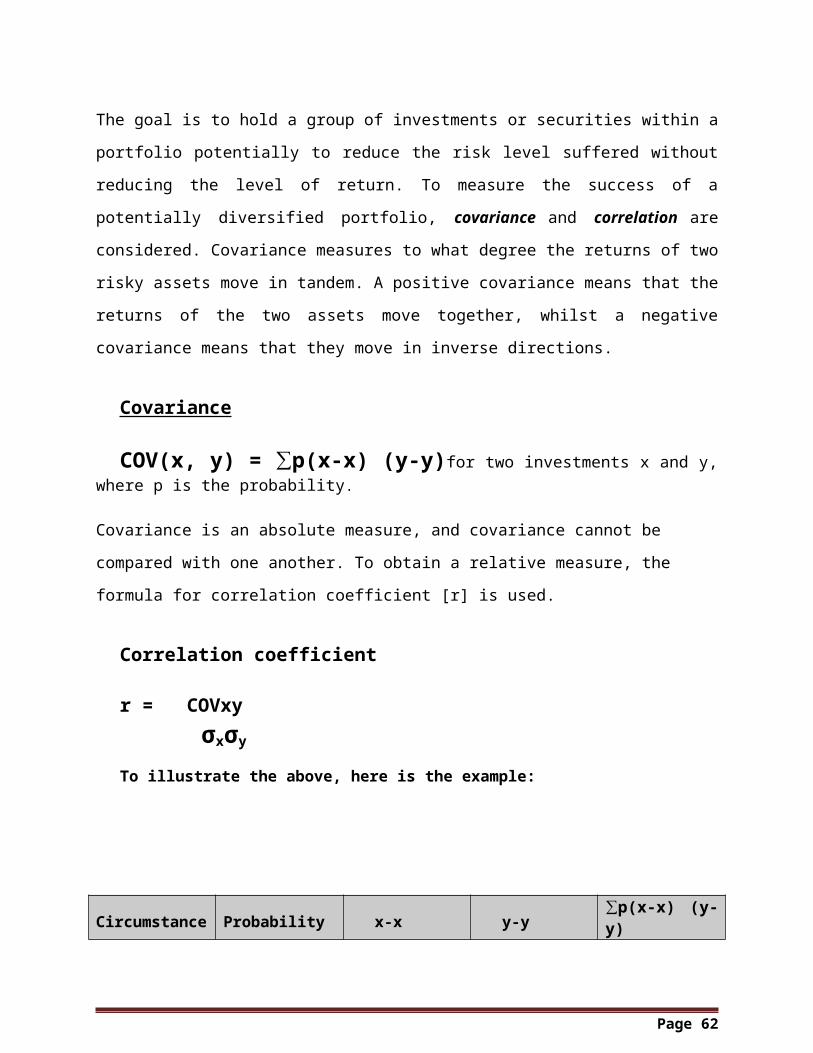
Calls generated by Sharekhan Advisory Team
5. CTFT Portfolio
Is aimed at traders who wants to carry position for tommorow
Low Cost of Transaction
Enjoy Gap Up Opening Benefits
Call are flow at 3:15 PM
Square off the position before 10:45 Am on next day
Call are given on the basis of whole day market movement
Page 62
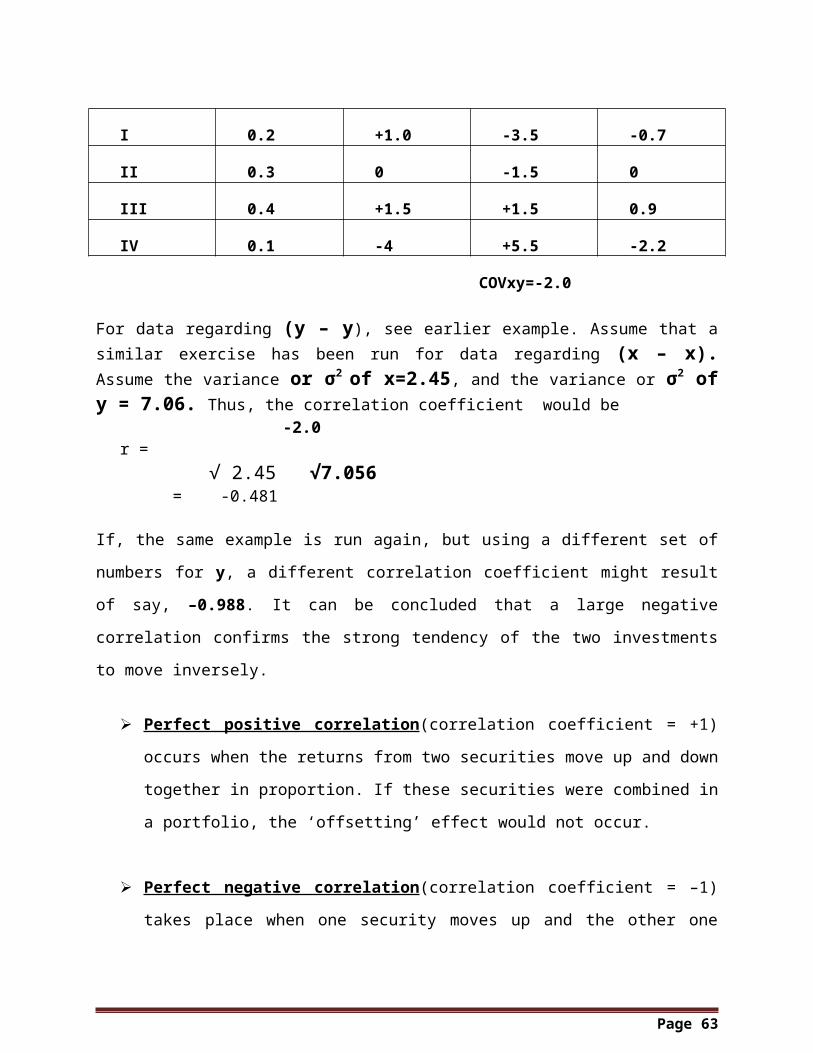
CH-5 DATA ANALYSIS AND INTERPRETRATION
1. Do you know about the Investment Option available?
Page 63
Interpretation
As the above table shows the knowledge of Investor out of 100 respondent carried
throughout the Jaipur Area is only 85%.The remaining 15% take his/her residential
property as an investment. According to law purpose this is not an investment because
of it is not create any profit for the owner. The main problem is that in this time from year
2008-2009 ,the recession and the Inflation make the investor think before investing a
even a Rs. 100.So ,it also create the problem for the Investor to not take interest in
Investment option.
2. What is the basic purpose of your Investments?
Page 64
Interpretation
As with the above analysis, it is found 75% people are interested in liquidity, returns
and tax benefits. And remaining 25% are interested in capital appreciations, risk
covering, and others. In the entire respondent it is common that this time everyone is
looking for minimizing the risk and maximizing their profit with the short time of period.
As explaining them About the Portfolio Management Services of Sharekhan, they
were quite interested in Protech Services.
Page 65
3. From which option you will get the best returns?
Interpretation
Most of the respondents say they will get more returns in Share Market. Since Share
Market is said to be the best place to invest to get more returns. The risk in the
investment is also high.
Similarly, the Investor are more Interested in Investing their money in Mutual Fund
Schemes as that is also very important financial product due to its nature of minimizing
risk and maximizing the profit. As the commodities market is doing well from last few
months so Investor also prefer to invest their money in Commodities Market basically in
GOLD nowadays.
Moreover, even who don’t want to take Risk they are looking for investing in Fixed
Deposit for long period of time.
4.“Investing in PMS is far safer than Investing in Mutual Fund”. Do you agree?
Page 66
Interpretation
In the above graphs it’s clear that 24% of respondent out of hundred feel that
investing their money in Mutual Fund Scheme are far safer than Investing in PMS. this
is because of lack of proper information about the Portfolio management services. As
the basis is same for the mutual fund and PMS but the investment pattern is totally
different from each other and which depends upon different risk factor available in both
the Financial Products.
5.How much you carry the expectation in Rise of your Income from Investments?
Page 67
Interpretation
The optimism is shown in the attitude of the respondents. The confidence was
appreciable with which they are looking forward to a rise in their investments. Major part
of the sample feels that the rise would be of around 15%. Only 8% of the respondents
were confident enough to expect a rise of upto 35%.
As all the respondents were considering the Risk factor also before filling the
questionnaire and they were asking about the performance report of all the PMS
services offered by Sharekhan limited.
6. If you invested in Share Market, what has been your experience?
Page 68

Interpretation
20% of the respondents have invested in Share market and received satisfactory
returns, 40% of the respondents have not at all invested in Share Market. Some of the
investors face problems due to less knowledge about the market. Some of the
respondents don’t have complete overview of the happenings and invest their money in
wrong shares which result in Loss. This is the reason most of the respondents prefer
Portfolio Management Services to trade now a days, which gives the Investor the clear
idea when is the right time to buy and right time to sell the shares which is
recommended by their Fund Manger.
7. How do you trade in Share Market?
Page 69
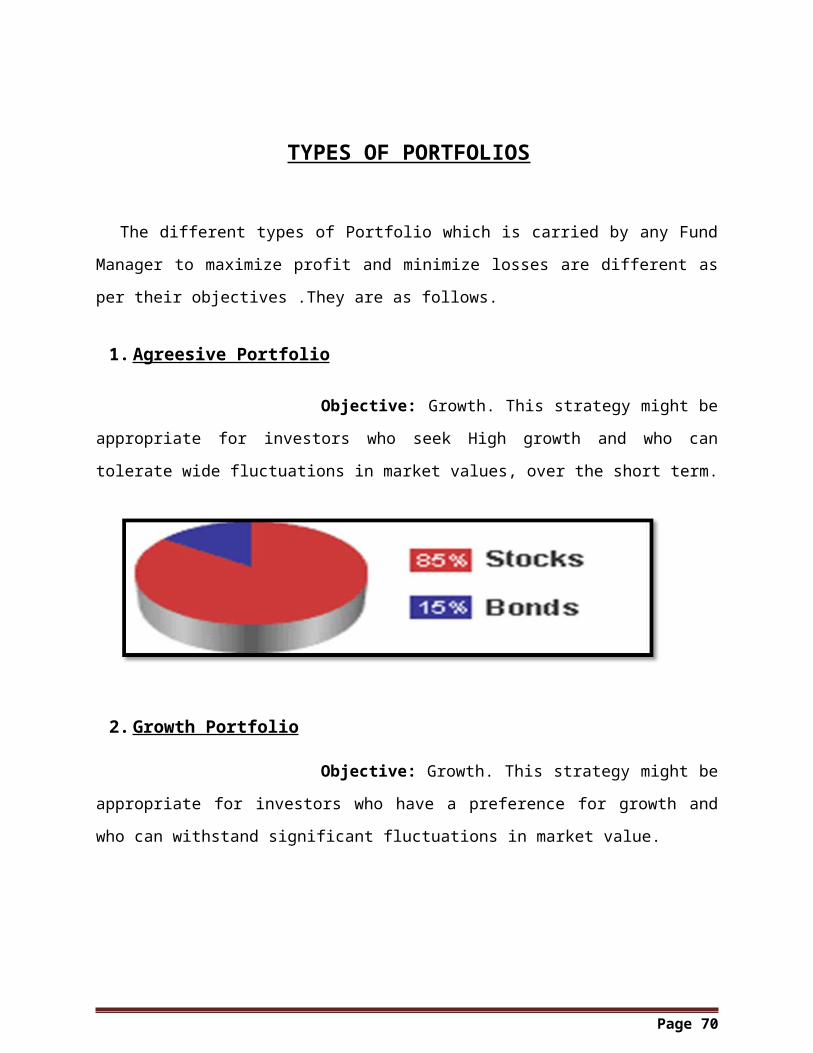
Interpretation
As we know that Share market is totally based on psychological parameters of
Investors, which changed as per the market condition, but at the same time the around
45%investor trade on the basis of speculation and 31% depend upon Investment option
Bonds, Mutual Funds etc.
Moreover, the now a day’s Hedging is most common derivatives tools which is used
by the Investor to get more return from the Market ,this is mostly used in the
Commodities Market.
8. How do you manage your Portfolio?
Page 70
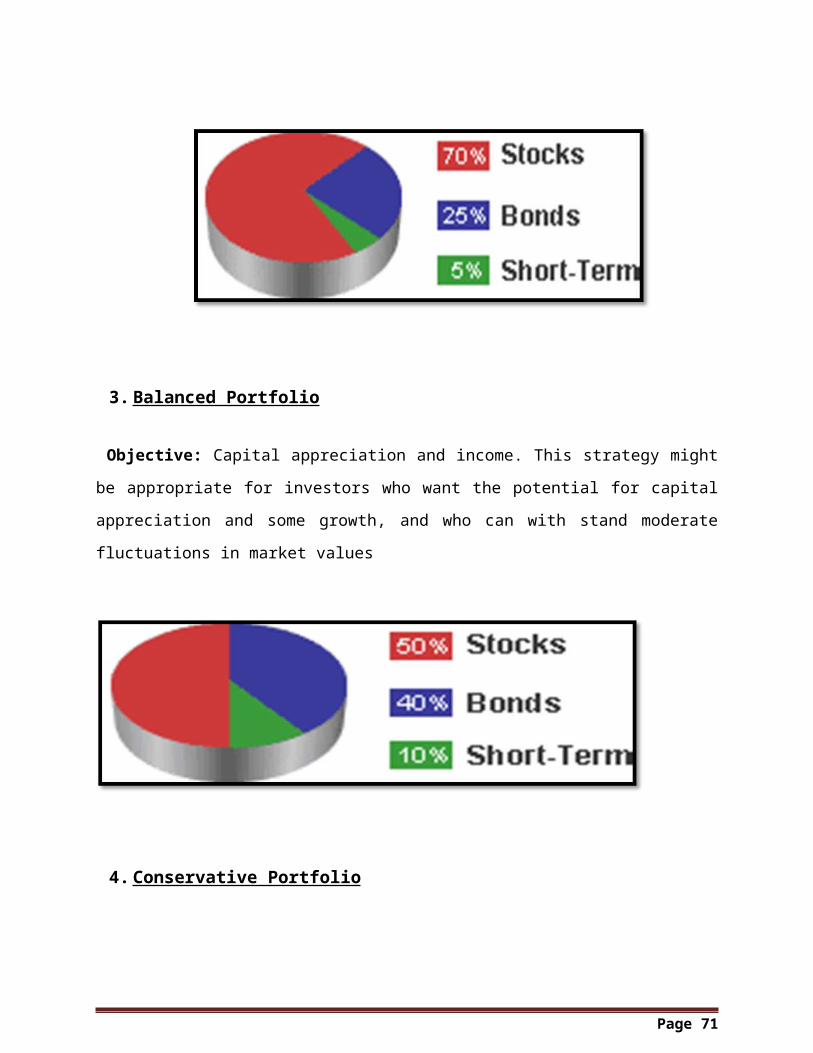
Interpretation
About57% of the respondents say they themselves manage their portfolio and 43%
of the respondents say they depends on the security company for portfolio
Management. 43% of the respondents prefer PMS of the company because they don’t
have to keep a close eye on their investment; they get all the information time to time
from their Fund Manager.
Moreover, talking about the Sharekhan PMS services they are far satisfied with the
Protech and Prop rime Performance during last year. They are satisfied with the quick
and active services of Sharekhan customer services where, they get the updated
knowledge about the scrip detail everyday from their Fund Manager.
9. If you trade with Sharekhan limited then why?
Page 71
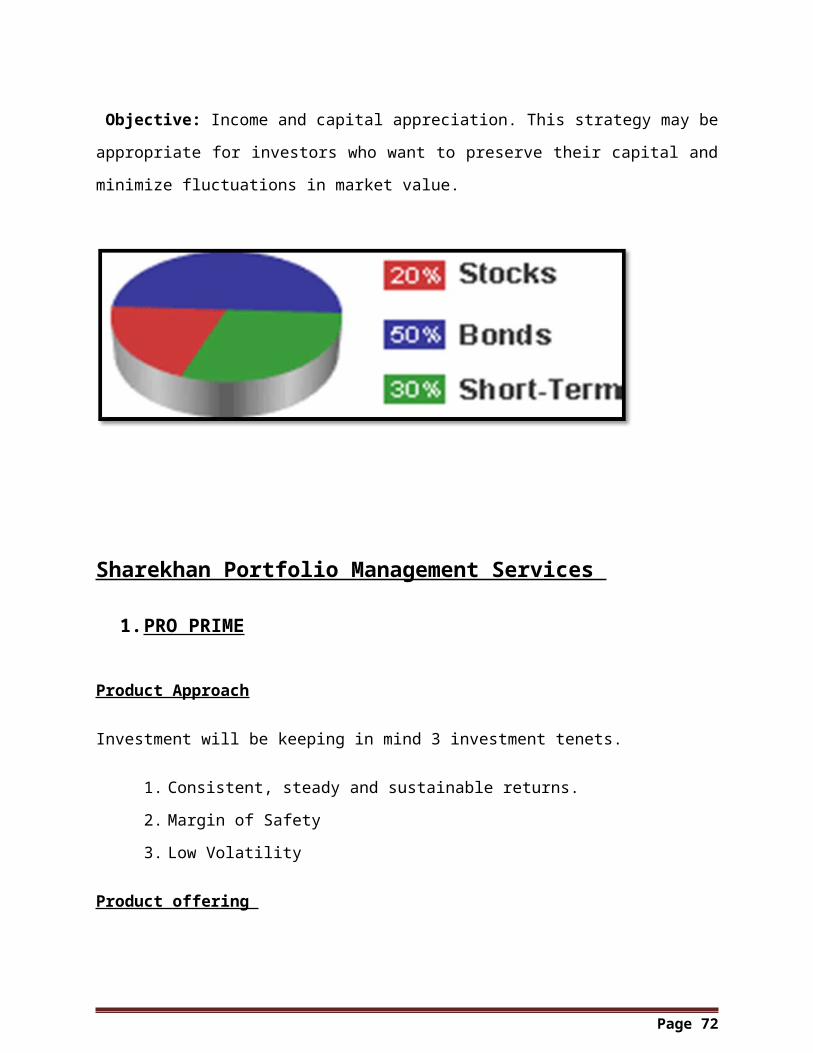
Interpretation
As the above research shows the reasons and the parameters on which investor lie
on Sharekhan and they do the trade.
Among hundred respondents 35% respondents do the trade with the company due
to its research Report, 28% based on Brokerage Rate whereas 22 % are happy with its
Services.
Last but not the least, 15% respondents are depends upon the tips of Sharekhan
which gives them idea where to invest and when to invest.
At the time of research what I found is that still Sharekhan need to make the clients
more knowledge about their PMS product.
10. Which Portfolio Type you preferred?
Page 72
Interpretation
The above analysis shows, in which portfolio the investor like to deal more in PMS.
As 45% investor likes to go for Equity Portfolio and 28% with Balanced Portfolio,
whereas around 27% investor like to, go for Debt Portfolio.
Page 73
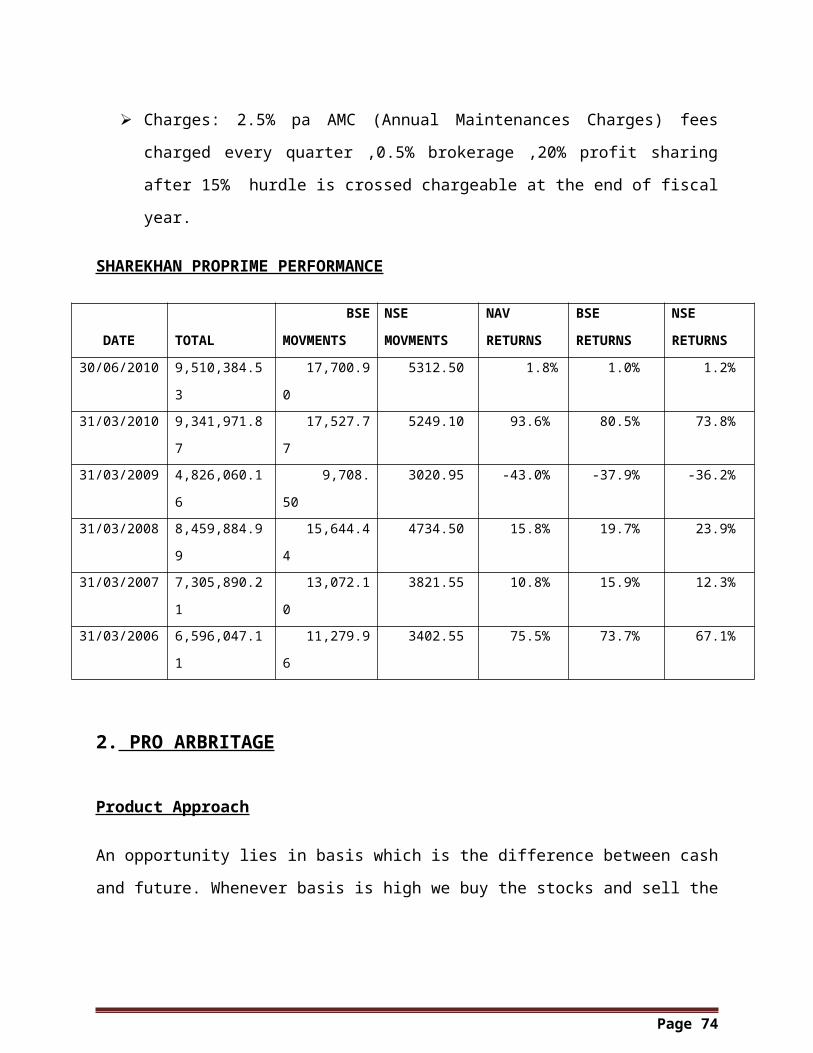
11. How was your experience about Portfolio Management services (PMS) of Sharekhan Limited?
Interpretation
In the above analysis it is clear that the Investor have the good and the bad
experience both with the Sharekhan PMS services.
In this current scenario 52% of the Investor earned, whereas around 18% have to
suffer losses in the market. Similarly 30% of the Respondents are there in Breakeven
Point (BEP), where no loss and no profit.
Page 74
CH-6 SWOT ANALYSIS
1. STRENGTHS
First Brokerage firm to go online
Best Technological Tools
Expert Reasearch Team
User friendlly website
2. WEAKNESSES
Provide very low leverage to customer
Insufficient advertisement policy
No acess to the rural market
3. OPPORTUNITIES
Huge market
Sharekhan having good customer relation stratergy so that it create
good opportunity to create goodwill and capture the market.
Growing IPO create opportunity to capture the new market.
4. THREATS
High volatility of the share market.
Stiff competition
Government policy/ Restrictions
Page 75
CH-7 CONCLUSION
On the basis of the study it is found that Sharekhan Ltd is better services provider
than the other stock-brokers because of their timely research and personalized advice
on what stocks to buy and sell. Sharekhan Ltd. provides the facility of Trade tiger as
well as relationship manager facility for encouragement and protects the interest of the
investors. It also provides the information through the internet and mobile alerts that
what IPO’s are coming in the market and it also provides its research on the future
prospect of the IPO. We can conclude the following with above analysis.
Sharekhan Ltd has better Portfolio Management services than Other Companies
It keeps its process more transparent.
It gives more returns to its investors.
It charges are less than other portfolio Management Services
It provides daily updates about the stocks information.
Investors are looking for those investment options where they get maximum
returns with less returns.
Market is becoming complex & it means that the individual investor will not have
the time to play stock game on his own
Page 76
CH-8RECOMMENDATIONS & SUGGESTIONS
The company should also organize seminars and similar activities to enhance the
knowledge of prospective and existing customers, so that they feel more
comfortable while investing in the stock market.
Investors must feel safe about their money invested.
Investor’s accounts must be more transparent as compared to other companies.
Sharekhan limited must try to promote more its Portfolio Management Services
through Advertisements.
Sharekhan needs to improve more it’s Customer Services
There is need to change in lock in period in all three PMS i.e.Protech, Proprime,
Pro Arbitrage.
Page 77
ANNEXURE
QUESTIONNAIRE
NAME…………………………………. AGE…………………………………………
OCCUPATION……………………………... PHONE NO..................................
1. Do you know about the Investments Option available?
A) YES B) NO
2. What is the basic purpose of your Investments?
A) Liquidity B) Return C) Tax Benefits D) Risk Covering
E) Capital Appreciation F) Others
3. From which option you will get the best returns?
A) Mutual Funds B) Shares C) Commodities Market D) Bonds
E) Fixed Deposits F) Property G) Others
4. “Investing in PMS is far safer than Investing in Mutual Fund”. Do you agree?
A) Yes B) No
5. How much you carry the expectation in Rise of your Income from Investments?
A) Upto 15% B) 15-25% C) 25-35% D) More than 35%
6. If you invested in Share Market, what has been your experience?
A) Satisfactory Return B) Burned Finger C) Unsatisfactory Result D) No
7. How do you trade in Share Market?
A) Hedging B) Speculation C) Investment
Page 78
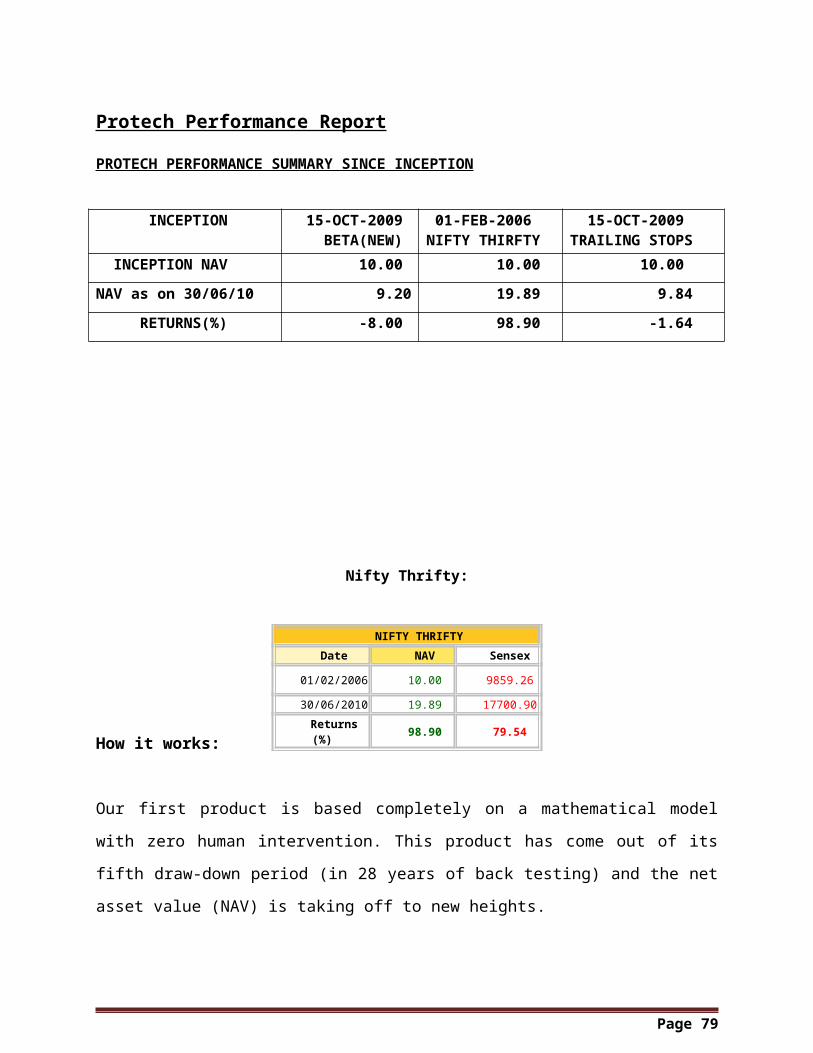
8. How do you manage your Portfolio?
A) Self B) Depends on the company for portfolio
9. If, you trade with Sharekhan limited then why?
A) Research B) Brokerage C) Services D) Investments Tips
10. Which Portfolio Type you preferred?
A) Equity B) Debt C) Balanced
11. How was your experience about Portfolio Management services (PMS) of
Sharekhan Limited?
A) Earned B) Faced Loss C) No profit No loss
Page 79

BIBILOGRAPHY
WEBSITES
www.sharekhan.com www.sebi.gov.in www.moneycontrol.com www.karvy.com www.valueresarchonline.com www.nseindia.com www.bseindia.com
Book Referred
Kothari, C.R., Research Methodology, Second Edition, New Delhi, New Age
International (p) Ltd Publishers, 2006.
Pandian, P., Security Analysis And Portfolio Management, Vikas Publishers,
2007.
Magzines & Journals
Value guide by Sharekhan Investors Eyes by Sharekhan Business world. The economist
Page 80