Embed Size (px)
Citation preview

PROGRAMMING AND CONCEPTUAL DESIGN USING
BUILDING INFORMATION MODELING
A Thesis
presented to
the Faculty of California Polytechnic State University,
San Luis Obispo
In Partial Fulfillment
of the Requirements for the Degree
Master of Science in Architecture
by
Mary-Alice Avila
January 2009

ii
© 2009
Mary-Alice Avila
ALL RIGHTS RESERVED

iii
COMMITTEE MEMBERSHIP
TITLE: Programming and Conceptual Design Using
Building Information Modeling
AUTHOR: Mary-Alice Avila
DATE SUBMITTED: January 2009
COMMITTEE CHAIR: Arthur J. Chapman, Professor
Architecture and Environmental Design
COMMITTEE MEMBER: James Doerfler, Professor
Architecture and Environmental Design
COMMITTEE MEMBER: Robert Kitamura, Executive Director
Facilities Planning & Capital Projects
iv
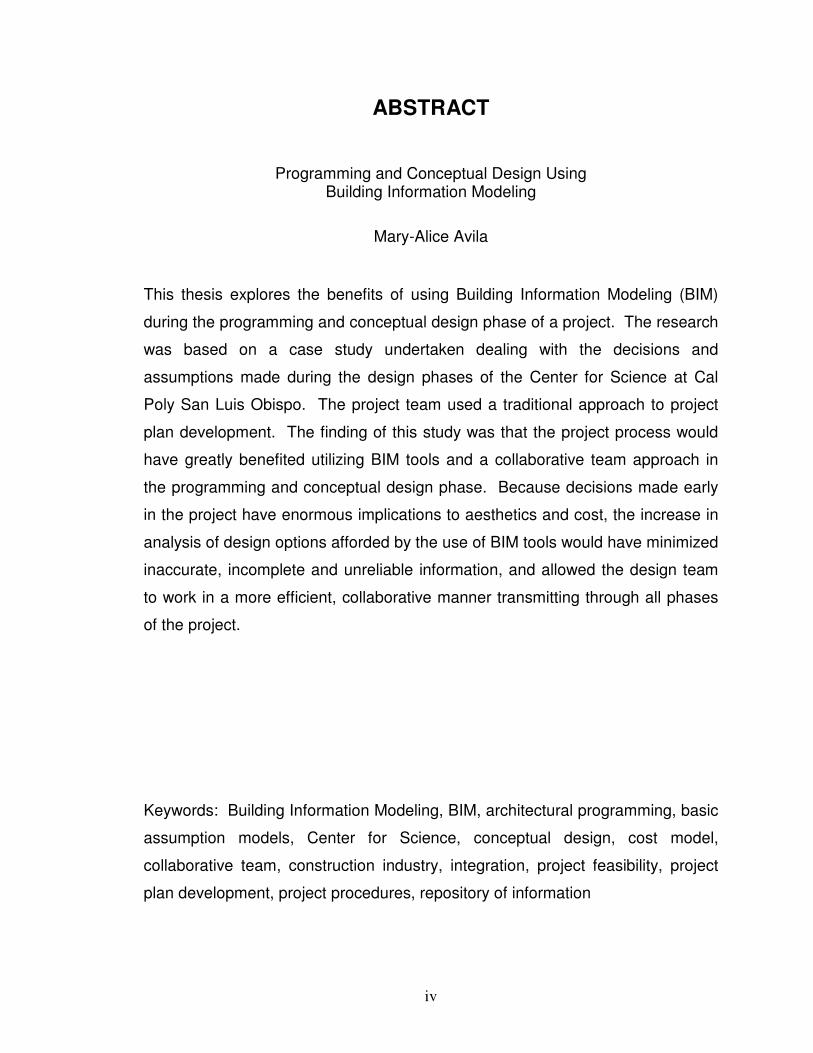
ABSTRACT
Programming and Conceptual Design Using Building Information Modeling
Mary-Alice Avila
This thesis explores the benefits of using Building Information Modeling (BIM)
during the programming and conceptual design phase of a project. The research
was based on a case study undertaken dealing with the decisions and
assumptions made during the design phases of the Center for Science at Cal
Poly San Luis Obispo. The project team used a traditional approach to project
plan development. The finding of this study was that the project process would
have greatly benefited utilizing BIM tools and a collaborative team approach in
the programming and conceptual design phase. Because decisions made early
in the project have enormous implications to aesthetics and cost, the increase in
analysis of design options afforded by the use of BIM tools would have minimized
inaccurate, incomplete and unreliable information, and allowed the design team
to work in a more efficient, collaborative manner transmitting through all phases
of the project.
Keywords: Building Information Modeling, BIM, architectural programming, basic
assumption models, Center for Science, conceptual design, cost model,
collaborative team, construction industry, integration, project feasibility, project
plan development, project procedures, repository of information

v
ACKNOWLEDGMENTS
First of all, I would like to thank Professor Art Chapman for his unique coaching
and enthusiasm. He guided, encouraged and inspired me every step of the way
through graduate school and through my thesis. Special thanks to Professor Jim
Doerfler for his continued encouragement over the years and letting me try my
hand at teaching by guest lecturing in his class; to Bob Kitamura for believing in
me and continually coaxing me along; and to Joel Neel, who persistently cajoled
me to reach for the light at the end of the tunnel and finish this endeavor.
There are many others to sincerely thank, including those who gave of their time
for interviews; Dane Dodd-Hansen, Mark Miller, Joel Neel, Kimon Onuma, Chris
Pechacek, Brent Pilgrim, Barbara Queen, Johan Uyttewaal and Rex Wolf, I
appreciate your insights.
To my fellow graduate students for their friendship, enthusiasm and
encouragement, Jenny Ferguson, Bewketu Kassa, and Eileen Joseph with a
special thanks to Jenny for editing my initial work.
Rishon, thanks for sharing your college years with me, Tuesday lunches and my
hopes and dreams for graduate school. Alyse, thanks for putting up with my
schedule and seeing me through college. Stuart, my best friend, I owe much of
my successes to you and your calm approach to life. Thanks for trusting that I
could take on one more copious task and get it done.
vi
TABLE OF CONTENTS
LIST OF TABLES ................................................................................................vii
LIST OF FIGURES............................................................................................. viii
CHAPTER 1 Overview ......................................................................................... 1
Introduction ..................................................................................................... 1
Thesis Addressed Issues ................................................................................ 3
Summary of Industry-wide Issues ................................................................... 4
CHAPTER 2 Methods......................................................................................... 13
Industry Project Procedures.......................................................................... 13
CSU Capital Projects .................................................................................... 18
Cal Poly Center for Science Project .............................................................. 23
CHAPTER 3 Justification, Assumptions and Recommendations........................ 49
Justification of Issues .................................................................................... 49
Assumptions and Recommendations............................................................ 51
CHAPTER 4 Results .......................................................................................... 65
Summary....................................................................................................... 65
Advice for Future Study................................................................................. 68
Conclusion .................................................................................................... 70
BIBLIOGRAPHY................................................................................................. 73
APPENDICES .................................................................................................... 77
A - Glossary .................................................................................................. 77
B - CSU CPDC FORM .................................................................................. 83

vii
LIST OF TABLES
Table Page
1. Typical Project Team Participants .................................................................. 14
2. Calculation of Space Requirements ............................................................... 19
3. Calculation of Budget Requirements .............................................................. 20
4. UniFormat Categories .................................................................................... 21
5. Cost in UniFormat Categories ........................................................................ 22
6. Programming Phase Allowable Costs versus Estimates ................................ 30
7. Cost Estimates at Programming & Feasibility Study Phase ........................... 32
8. Cost Estimates at Schematic Design Phase................................................... 34
9. Cost Estimates at Design Development Phase ......................................... 36-37
10. Cost Estimates at Construction Documents Phase ...................................... 39
11. Difference between Budget and Construction costs ..................................... 41
12. List of Information Provided by Cal Poly to Program Architect ..................... 53
13. List of CSU CPDC Forms to Provide to Program Architect........................... 57
14. List of Program Architect Information to Provide to Design Architect ...... 58-59

viii
LIST OF FIGURES
Figure Page
1. MacLeamy Curve ............................................................................................. 9
2. The Project Team, Typical.............................................................................. 14
3. Construction Manager as Contractor (CMc) ................................................... 15
4. Traditional Design Process............................................................................. 16
5. Center for Science.......................................................................................... 23
6. Total construction costs and areas ................................................................. 25
7. Project Team .................................................................................................. 26
8. Center for Science Project Team.................................................................... 28
9. Center for Science – Building Elevations........................................................ 38
10. Cost Changes Over Time by Building Systems............................................ 40
11. Cost Changes Over Time by Phase ............................................................. 42
12. Integrated Design Process Model................................................................. 44
13. Room Data Sheet ......................................................................................... 55
14. Basic Assumption Model - Data Base with Room Data Sheet Information..... 56
15. Repository of Information, or BIM................................................................. 62

1
CHAPTER 1
Overview
Introduction
Planning, design and construction are moving toward a major change propelled
by new tools in building information modeling (BIM).1 BIM is rapidly changing
how the construction industry does business and how people work with each
other. It has already begun to be used by architecture and engineering firms to
prepare plans for construction, and its use is expanding to more project phases.
With one of the major benefits being integrated project delivery, the goal of this
thesis is to determine the benefits anticipated in initiating BIM at the
programming and conceptual design phase,* and to allow owners, users,
architects, engineers, consultants and contractors to better understand the
impacts of early decisions on a project through schematic design, design
development, construction documents, construction, occupancy and de-
construction.†
Just as web-based project management software has improved efficiency and
accountability in the construction phase, and is now widely accepted and used in
the industry; web-based building information modeling can transform the
programming and design phase as is done using Onuma Planning System (OPS)
software developed by Onuma, Inc.2 Prior to the use of web-based project
management, architects, engineers, construction managers, contractors,
*Conceptual Design Phase - Cal Poly requires its program architects to go beyond the normal
programming effort and produce an “initial concept” according to Joel Neel, Associate Director in Facilities Planning and Capital Projects. Referred to as the “conceptual design,” this “initial concept,” or stacking and massing diagrams, based on the programming information, show building form, floor plans for each level, site circulation, and relationships to adjacent buildings and spaces. (Joel Neel 7 January 2009)
†Project phases following the programming phase.

2
subcontractors and owners each kept logs of the various documents (change
orders, requests for information, submittals, change order requests, etc.), and
generally only one person would have the latest, updated information. Logs were
shared by photocopying and distribution with updates once or twice a month.
With web-based project management, any team member with access rights, a
computer and an internet portal can have the latest information any time within
minutes. Additionally, each person is alerted automatically when they need to
perform a task. A similar function occurs in web-based building information
modeling but with the development of the building physical model.
Another way to look at web-based building information modeling is to consider it
as a web-based design charette with the players proposing ideas and expanding
upon ideas proposed by other players, and each testing preliminarily “what if”
scenarios. This process might occur over a period of perhaps a few weeks
instead of several months.
In addressing building information modeling, this thesis will be limited to the
programming and conceptual design phase of a project including the available
information, its analysis, and how it affects building outcomes. Finith Jernigan
has observed that many architects “make too many decisions at the wrong time,
with too little information.”3 This thesis will look for areas where better
information, presented earlier, may have changed the building outcome. In
addition, it will contrast the standard approach to programming and project
development versus an approach using building information modeling to program
and develop the project.
By making the costing activity an integrated part of programming and moving it
into the third stage where alternate blocking and stacking or three-dimensional
schemes are developed, it is anticipated that some of the difficulties experienced
in the development of the project may be avoided. The Center for Science at
California Polytechnic State University (Cal Poly) in San Luis Obispo, California
will be used as a case study. As part of that case study, viewing costing
information in conjunction with alternate three-dimensional schemes will enhance
3
the early analysis, and allow the owner, architect and engineers to make a more
informed decision in choosing conceptual design alternatives for the project.
Finally this thesis will conclude that using BIM in at least the programming phase
and conceptual phase of an architectural project can have significant advantages
in time and cost savings and quality of product.
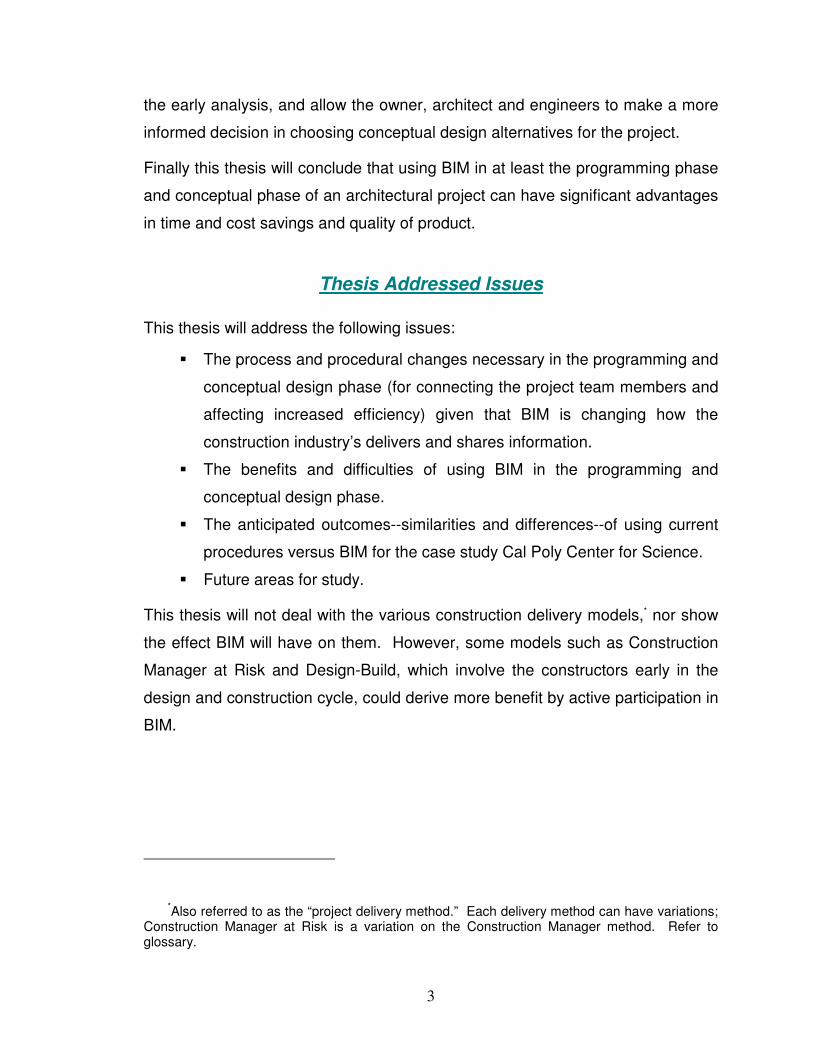
Thesis Addressed Issues
This thesis will address the following issues:
� The process and procedural changes necessary in the programming and
conceptual design phase (for connecting the project team members and
affecting increased efficiency) given that BIM is changing how the
construction industry’s delivers and shares information.
� The benefits and difficulties of using BIM in the programming and
conceptual design phase.
� The anticipated outcomes--similarities and differences--of using current
procedures versus BIM for the case study Cal Poly Center for Science.
� Future areas for study.
This thesis will not deal with the various construction delivery models,* nor show
the effect BIM will have on them. However, some models such as Construction
Manager at Risk and Design-Build, which involve the constructors early in the
design and construction cycle, could derive more benefit by active participation in
BIM.
*Also referred to as the “project delivery method.” Each delivery method can have variations;
Construction Manager at Risk is a variation on the Construction Manager method. Refer to glossary.

4
Summary of Industry-wide Issues
History and Developments in Process and Tools
Design Process – Master Builder, A/E with Consultants, Collaborative Teams
Many of the buildings in Europe from the Renaissance Period were designed,
engineered and built under the direction of one person, the master builder.
“Hundreds of years ago, all of architecture could be held in the intelligence of a
single maker, the master builder, part product and building engineer, and part
material scientist, the master builder integrated all the elements of architecture in
a single mind, heart, and hand.”4
As buildings became larger and taller, new materials and building systems, such
as structural, mechanical, electrical and plumbing were developed, requiring
special engineering knowledge. As noted by Paul Seletsky in an interview by
Bryant Rousseau, “Traditionally, we’ve had a very linear process in the way we
practice architecture.”5 Consultants were brought in when and as needed,
usually after the architect had completed the schematic design (site plan, floor
plan, and elevations). Keeping the consultants segregated with the architect
doing all of the coordination did not cause major problems. Usually minor
changes were made to the plans to accommodate the systems.
As buildings become more complex with the addition of more systems, uses,
equipment, codes, regulations, standards and laws, the segregated approach
resulted in deficiencies in the architectural process. Structural, plumbing,
mechanical, electrical, communication and fire systems collided, while user
needs and code requirements were missed. Users moved into spaces that did
not live up to their expectations. Owners were faced with changes that became
more costly as the project progressed. In Refabricating Architecture, the authors,
both architects, point out that the “current architecture production is typified by
stratification of the various components used in design and implementing a
building.”6 They further acknowledge that the disciplines have little or no
communication, and the benefit of their “collective intelligence” never makes it
past the hierarchy into the project.7 It is interesting to note that collaborative

5
teams of designers and builders are used in other industries, such as automobile
and aircraft industries, working together in an integrated and productive manner.8
For the construction industry to move forward, an integrated process will need to
be adopted industry-wide.
Design Tools – Hand Drafting, CAD, BIM
Among the first documentation of architectural plans and specifications (or in this
case, list of materials) in the United States was by Thomas Jefferson in planning
his home, Monticello in Virginia.9 Similar hand drafting, using t-square, triangles
and pencil on paper continues even today.
The use of CAD and word processing, which promised to revolutionize plans and
specifications development and coordination between disciplines, never
materialized. For example, AutoCAD operators tend to be among the least
experienced persons working on a project, adding to the problems discovered
during the construction phase. In discussing the ways in which architecture has
failed to take advantage of new technologies, Kieran and Timberlake note: “The
architecture industry’s move from T-Square and linen to computer as a means of
documentation has essentially been only a switch in media.”10 Computers can
be used for so much more than just 2-D representations. Other industries, such
as aircraft and automobile, provide examples.
In the aircraft industries, airplanes are initially built and maintained as three-
dimensional (3-D) models including non-graphical attributes about each
component. After an airplane is constructed, the 3-D model and component
attributes are maintained.11
The term “Building Information Model (BIM)” was coined in early 2002, but has
been used by some firms for more than 20 years, according to Kimon G.
Onuma.12 Leaders like Onuma are beginning to engage others in learning, trying
and using BIM. Ask architects about the acceptance and use of BIM in the
construction industry and those using it will state full use can be expected in
about 3-5 years.13 Those not yet experiencing its use, such as Robert Kitamura,
Director of Facilities and Planning at Cal Poly San Luis Obispo, estimate it will
6
take 15 years to become fully integrated.14 This validates comments by Mike
Kenig, Vice Chairman of Holder Construction Company, in his interview with
Bailey Webb that BIM users estimate five years or less, while non-users estimate
ten years.15
BIM
2D and 3D CAD versus BIM
Two- and three-dimensional (2D and 3D) computer aided drawing (CAD)
programs enable the drafter to use a computer to create drawings representing
data as geometric entities with points, lines, rectangles, circles, polygons and
planes. The nature of the data, however, limits it use as it does not contain
information that indicates walls, floor, ceiling and the physical space. In order to
see a wall in elevation, more lines must be drawn. In order to perform cost
estimating or an energy analysis on the room, several calculations must be done.
Simply put, the wall does not know it is a wall, and the space created by the walls
does not exist as a physical area in a CAD program.
In BIM, information is represented as object-based building data models. Lachmi
Khemlani, in “The IFC Building Model: A Look Under the Hood,” explains:
A data model in any given domain describes the attributes of the entities in that domain as well as how these entities are related to each other. Since all computer programs deal with some kind of data, they must have some kind of underlying data model. Traditional 2D CAD and generic 3D modeling programs internally represent data using geometric entities such as points, lines, rectangles, planes, etc.16
For example, a room may be represented (drawn) as a rectangle with length and
width defined as well as its point of origin (X and Y coordinate location on the
drawing). CAD models then are inadequate for their lack of representation of
real world scenarios as noted by Khemlani:
Thus, while these applications can accurately describe geometry in any domain, they cannot capture domain-specific information about the entities. In the case of the AEC industry, technological progress has been severely constrained by the limited intelligence of such applications in representing buildings and being able to extract the relevant information from the

7
representation that is needed for design, analysis, construction management, operation, and so on.
To overcome the limitation of general-purpose geometric representations, every design-related industry has been developing and using object-based data models that are specific to their domain. In the case of the building industry, this translates to a data model that is built around building entities and their relationship to one another.17
For instance, a room is represented (drawn) using walls with length, depth,
height, type, connection to other walls, attached spaces with function, occupant
and area, and with a starting point (X and Y coordinate location on the drawing)
The interrelationship of objects is vital in creating a more realistic interpretation of
a building. Khemlani further explains that the geometry used in 2D and 3D is
merely “one of the properties.”18 The building model can be viewed in plan,
elevation, section or detail without drawing more lines. In other words, the wall
knows it is a wall, the space a space, and the floor a floor. This allows the model
to be created, viewed and altered in plan, elevation, section and detail with
changes automatically updated for all views allowing the designer to see the
implications of changes immediately. For example, move an exterior wall two
feet out and the walls perpendicular to it lengthen and remain attached to it in
plan, elevation, section and detail views. There is no need to “re-draw” the
corresponding views.
BIM has further advantage as information about the building can be extracted
from BIM and used to analyze, document, or visualize a building. Software
programs used with BIM can extract information and analyze cost, energy,
egress, code compliance, etc.
Project Information
The holistic nature of BIM provides significant opportunities for all members of
the building team. For example, team members with access can be aware of all
changes being made in real time—a substantial information sharing and
coordinating opportunity. BIM can allow information created in the programming
and conceptual design phase to be carried throughout subsequent phases with
information being added or modified as the project progresses. BIM can reduce
errors made by the design and construction team members by checking for

8
conflicts in the drawings, such as a pipe penetrating a duct; and a duct cutting
through a critical structural member. It can free-up time spent on schedules,
such as door and window, by creating dynamic schedules that update
automatically as changes are made. It can be used to provide such analysis as
daylight and energy usage simulations to aid in the design, and cost estimates
for building systems to aid in decision making.
Using BIM in Conceptual Design Phase
Given that the conceptual design decisions set the building’s function, general
appearance and cost, and are carried throughout the project to completion and
occupancy; it would be more efficient and advantageous to begin rigorously
implementing BIM from the initial start of a project so that all project information,
including options, decisions and costs, are documented and shared with the
building team members. “Decisions are often made in the programming phase of
a project that have enormous downstream implications—for aesthetics, cost,
energy consumption, and the ultimate suitability of a building for its intended
purpose—on the basis of inaccurate, incomplete, or unreliable information.”19 It
is at this point that various massing models, systems and assemblies can be
considered. When tied to a cost estimating model, the design team can quickly
see the relationship between initial design assumptions and cost. Initiating BIM
at this phase creates additional substantial potential for efficiencies.
At the conceptual design phase, as many options as possible should be
considered, as well as their cost impacts. Because these early decisions will be
carried throughout the project, owners, architects, engineers and consultants will
rely on them. It is far easier to scale back the project early in the design process
than to continuously look for areas to cut costs in future phases as later changes
become increasingly expensive to implement and have less value. The
American Institute of Architects (AIA) reiterated the power of the focus on the
early design phase when laying out Integrated Project Delivery (IPD) principles,
noting that “integrated projects are uniquely distinguished by highly effective
collaboration . . . commencing at early design.”20 In redefining project team
procedures, the AIA suggests “moving design decisions upstream as far as

9
possible to where they are more effective and less costly.” This is illustrated by
the MacLeamy Curve (Figure 1). In the IPD process, “conceptualization
(expanded programming)” includes greater cost detail than in a conventional
project.21 Costs linked to BIM and detailed by systems allow a better
understanding of the cost ranges and importance of each system. The focus can
then be directed to areas where improvements and costs have a larger impact.
Figure 1. MacLeamy Curve. Source: Graph from AIA National / AIA California Council, Integrated Project Delivery: A Guide, version 1 (The American Institute of Architects, 2007), table page 21.
Interoperability and Integration
The Role of Interoperability
To work in a fully integrated manner, the software applications used by each
project team member must be able to share data seamlessly. To do so requires
a non-proprietary object-based building data model used by all software vendors.
Software interoperability will enable those involved in project design,
construction, management and deconstruction to work in an integrated process.

10
“Software interoperability is seamless data exchange at the software level among
diverse applications, each of which may have its own internal data structure.”22 It
is suggested that when owners, designers, engineers and constructors
collaborate by sharing a common database, projects will evolve more quickly,
complex projects will be doable, and project costs more manageable.
Current Issues with IFC
The International Alliance for Interoperability (IAI), which facilitates
interoperability in the construction industry, has created the IFC (Industry
Foundation Classes), the common language for software. Khemlani states, “The
IFC model is intended to support interoperability across the individual, discipline-
specific applications that are used to design, construct, and operate buildings by
capturing information about all aspects of a building throughout its lifecycle.”23
There are several object-based building data model applications currently being
used in the industry. These include Graphisoft’s ArchiCAD and Autodesk’s Revit,
in addition to hybrid applications such as, Bentley Architecture based on
MicroStation, and Autodesk Architectural Desktop based on AutoCAD. However,
as Lachmi Khemlani in “The IFC Building Model: A Look Under the Hood” notes
“these are applications by commercial vendors and their internal data models are
proprietary.”24 As she explains, this is why one software program cannot share
its information with another without the use of specific translators. In other
words, they do not speak the same language and cannot communicate. Sharing
data from one of these software applications with other software, such as a
Microsoft Excel spreadsheet, is impossible, or at best, extremely difficult.
Integration and interoperability are the keys to information sharing.
Time and Money
Currently, when architects, engineers, and cost estimators need certain project
information embedded in a software program, they must first retrieve the data
needed and then re-enter it into their specific software analysis program.
Translating the information back to the drawing stage takes the same effort, and
therefore, testing many building configuration options is time intensive and cost
11
prohibitive on most projects. BIM offers the potential for fully integrated systems
for all users.
Using the IFC model to capture building information, commercial building-model
based applications can exchange data with each other quickly and accurately.
Instead of spending time to enter and check data, and then re-enter it again,
project team members can put more design time into project space and detail
development, and can test more options with the goal of creating more effective
and efficient design and engineering solutions.
1Jeff Yoder, “Further Down the Merry Road to BIM,” Building Design and Construction
(1 November 2007). http://www.bdcnetwork.com/article/CA6501465.html (accessed 11 December 2007).
2Onuma, Inc., “Onuma Planning System,” under “Products,” http://www.onuma.com
(accessed 5 February 2008). 3Finith Jernigan, BIG BIM little bim (Salisbury: 4Site Press, 2007), 19.
4Stephan Kieran and James Timberlake, Refabricating Architecture (New York: McGraw-Hill,
2004), xi-xiii.
5Bryant Rousseau, “The ArchRecord Interview: SOM’s Carl Galioto and Paul Seletsky on
BIM,” Architectural Record (2008), http://aec.cadalyst.com/aec/Column%3A+1-2-3+Revit/1-2-3-Revit-BIM-and-Visualization-Part-1/ArticleStandard/Article/detail/438584?contextCategoryld+ 6569 (accessed 26 November 2007).
6Kieran and Timberlake, 12.
7Kieran and Timberlake, 12.
8Kieran and Timberlake, 9-11.
9I.T. Frary, Thomas Jefferson Architect and Builder (Richmond: Garrett and Massie, 1939), 5.
10Kieran and Timberlake, 58.
11Kieran and Timberlake, 59.
12Kimon Onuma, Forward, BIGBIM little bim (Salisbury: 4Site Press, 2007), 3.
13Kimon Onuma and Yong Ku Kim, “BIMStorm LAX – Overview and Players’ Perspectives.”
(5 February 2008), Webinar.
14Robert Kitamura, interview by author, San Luis Obispo, CA, 2008.
15Bailey Webb, “BIM dream becoming a reality,” Atlanta Business Chronicle (July 6, 2007),
http://www.bizjournals.com/Atlanta/stories/2007/07/09/focus7.html (accessed 10 January 2009).
16 Lachmi Khemlani, “The IFC Building Model: A Look Under the Hood,” AECbytes
(30 March 2004), http://www.aecbytes.com/feature/2004/IFCmodel.html (accessed 13 February 2008).
12
17
Khemlani IFC.
18Khemlani IFC.
19Michael Tardif, “Architect Creates Design Synthesis Software,” AIArchitect – The American
Institute of Architects (17 August 2007), http://www.aia.org/aiarchitect/thisweek07/0/17/ 0817rc_face.dfm (accessed 18 February 2008).
20AIA National / AIA California Council, Integrated Project Delivery: A Guide, version 1, (The
American Institute of Architects, 2007), Sub-title page.
21AIA IPD, 24.
22National Institute of Building Sciences (NIBS), Facility Information Council (FIC), National
Building Information Modeling Standard, Version 1 – Part 1: Overview, Principles, and Methodologies (2007), 7.
23Khemlani, IFC.
24Khemlani, IFC.

13
CHAPTER 2
Methods
Before proposing changes in the methods used to develop programming and
conceptual design studies, current industry procedures were examined in order
to lay the foundation for the case study of the Cal Poly Center for Science
project. Additionally, to understand the expectations for administration of the
project, CSU policies and procedures were reviewed and documented.
Industry Project Procedures
Standard Model
The typical project team composition and the predesign* process are the
framework for the CSU process. In this section, the construction delivery method
selected for the Center for Science is defined. Lastly, to understand the goals of
Programming during the predesign phase, the programming process is outlined.
Project Team
“The construction of a facility is the culmination of the collective needs, ideas,
talents, and services of a diverse group of individuals.”1 These individuals can
be classified into four basic teams as shown in Table 1, or separate participant
groups, organized to conceive, design and build a project (Figure 2). These
separate teams of owner, designer, contractor and supplier are brought into the
project during the particular phases as dictated by the type of delivery method.
For example, in the Design-Bid-Build method, contractors join the project team at
the Construction Phase. In the CM at Risk method, the contractor joins the
project team usually after the Schematic Phase.
*Programming, concept and feasibility.

14
Table 1. Typical Project Team Participants
Teams Owner Design Contractor Supplier
Team Participants
• Owner
• Facility Manager
• Facility Maintenance Engineer
• Construction Manager
• Tenant
• Facility User
• Architect / Engineer
• Interior Designer
• Specifier
• Construction Contract Administrator
• Specialty Consultant
• Contractor
• Contractor’s Project Manager
• Construction Manager
• Superintendent
• Subcontractor(s)
• Manufacturer’s Employee
• Independent Project Representative
• Distributor / Supplier
Source: Data from The Construction Specifications Institute, The Project Resource Manual – CSI Manual of Practice, Fifth Edition, (McGraw-Hill, 2005) Figure page 1.2.
Figure 2. The Project Team, Typical. Source: Data adapted from The Construction Specifications Institute, The Project Resource Manual – CSI Manual of Practice, Fifth Edition, (McGraw-Hill, 2005) Figure page 1.2.

15
Construction Delivery Method – Construction Manager as Contractor
In the Construction Manager as Contractor (CMc) construction delivery method,
also referred to as “at-risk construction management,” the “CMc is responsible for
the completed project and bears the financial risk in the same manner as a
contractor.”2 As with other delivery methods, the contractor and the architect
each have a direct contract with the owner, but not with each other (Figure 3).
They are, however, required to communicate and work together to accomplish
the project.
Figure 3. Construction Manager as Contractor (CMc). Source: Data from The Construction Specifications Institute, The Project Resource Manual – CSI Manual of Practice, Fifth Edition, (McGraw-Hill, 2005) Figure page 3.24.

16
Traditional Predesign Process
In the traditional predesign process, the Architect does not usually involve their
Design Consultants (civil, structural, mechanical, electrical, plumbing, controls,
special, etc.) in programming or predesign. Quite often, the first time Design
Consultants see a project is in the Schematic Design Phase, and in some cases,
not fully until the Design Development Phase. In the traditional design-bid-build
project delivery method, Constructors (contractors) and Sub-constructors
(subcontractors) are not involved until the construction phase, and actually obtain
their first look at the project during the Bidding Phase. Each party’s involvement
in the project phases is illustrated by Figure 4.
Figure 4. Traditional Design Process. Source: Data from AIA National / AIA California Council, Integrated Project Delivery: A Guide, version 1 (The American Institute of Architects, 2007), table page 22.

17
Defining Programming
The Dictionary of Architecture and Construction defines a program as:
A statement prepared by or for an owner . . . setting forth the conditions and objectives for a building project including its general purpose and detailed requirement, such as a complete listing of the rooms required, their sizes, special facilities, etc.3
Programming is generally approached in a similar manner by most architects
regardless of the size or complexity of the building. In the standard model, a
building project begins with an idea. For example, the owners or users realize
they have outgrown their current facilities and need to expand incorporating
newer technology and working processes. The architect is asked to look at
current operations and functions, help the users organize their thoughts about
how they would like to work, and development a program. In defining what
constitutes the planning process leading to the program, the authors of From
Problem Seeking search for “sufficient information to clarify, to understand, to
state the problem.”4 Furthermore, they have formalized the programming
process into a five step, linear procedure:
Goals – Project Goals, including Mission, Goals and Objectives, and Policies; Operational Goals
Facts – Staffing requirements, User Description, Evaluation of Existing Facility, Site Analysis, Climate Analysis, Zoning Regulations, Code Survey, Cost Parameters, Project Delivery Schedule
Concepts – Organizational Structure, Functional Relationships, Priorities, Narrative Functional Descriptions, Operational Concepts
Needs – Space Requirements, Parking Requirements, Land Requirements, Project Phasing, Budget Analysis for Renovation and New Construction
Problem Statements – Design Problem, Operational Problem 5
18
CSU Capital Projects
To better understand the policies, procedures and nuances of projects in the
CSU system, and the documentation required to submit for and receive funding
approval, the CSU model was studied with an eye toward recognizing areas
where information can be contained within and required forms generated from
the BIM. For instance, if the campus student population and existing classroom
information were held within the BIM, it could be used to generate additional
space and associated funding requirements.
CSU Model
The California State University (CSU) requires each of its twenty-three campuses
to develop a Capital Outlay Program that anticipates and plans for student
enrollment utilizing “proper planning, programming, budgeting and project
administration,” and State policy requires all capital outlay projects be “carefully
conceived and justified to provide cost effective solutions for program delivery.”6
Campuses are responsible for the initial planning, cost benefit analysis and
feasibility studies needed to submit a proposed project to the CSU for funding.
The results of these efforts – plans (site and individual room), outline
specifications (equipment, furnishings, special requirements by room) and cost
estimate—are used in preparing the CSU submission to the Board of Trustees
for the proposed capital outlay program.7
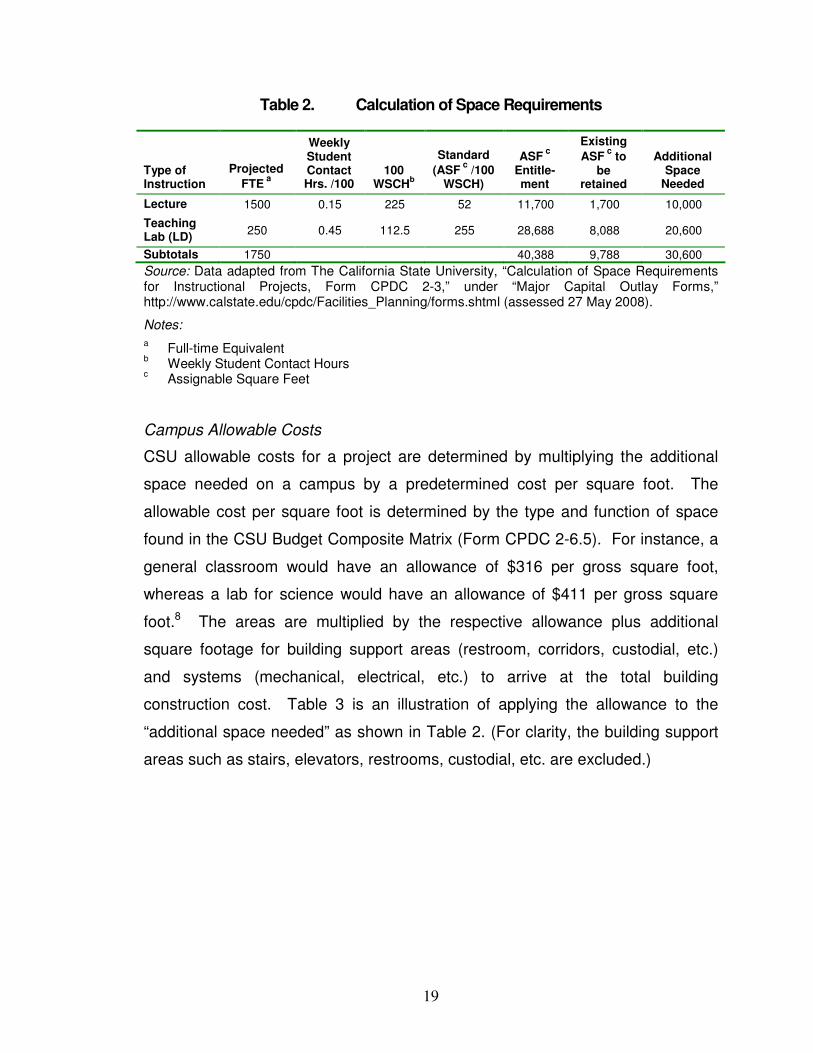
Campus Square Footage Requirements
First, each campus calculates the space requirements to accommodate the
projected full-time equivalent (FTE) students on the campus resulting in an
assignable square footage (ASF) entitlement. The existing ASF is subtracted
from the entitlement to determine the additional space needed. The example in
Table 2 illustrates a portion of the CSU Form CPDC 2-3 used to calculate the
additional space for a fictitious lecture and teaching lab on a CSU campus.
19
Table 2. Calculation of Space Requirements
Type of Instruction
Projected
FTE a
Weekly Student Contact Hrs. /100
100 WSCH
b
Standard
(ASF c
/100 WSCH)
ASF c
Entitle-ment
Existing
ASF c
to be
retained
Additional Space
Needed
Lecture 1500 0.15 225 52 11,700 1,700 10,000
Teaching Lab (LD)
250 0.45 112.5 255 28,688 8,088 20,600
Subtotals 1750 40,388 9,788 30,600
Source: Data adapted from The California State University, “Calculation of Space Requirements for Instructional Projects, Form CPDC 2-3,” under “Major Capital Outlay Forms,” http://www.calstate.edu/cpdc/Facilities_Planning/forms.shtml (assessed 27 May 2008).
Notes:
a Full-time Equivalent
b Weekly Student Contact Hours
c Assignable Square Feet
Campus Allowable Costs
CSU allowable costs for a project are determined by multiplying the additional
space needed on a campus by a predetermined cost per square foot. The
allowable cost per square foot is determined by the type and function of space
found in the CSU Budget Composite Matrix (Form CPDC 2-6.5). For instance, a
general classroom would have an allowance of $316 per gross square foot,
whereas a lab for science would have an allowance of $411 per gross square
foot.8 The areas are multiplied by the respective allowance plus additional
square footage for building support areas (restroom, corridors, custodial, etc.)
and systems (mechanical, electrical, etc.) to arrive at the total building
construction cost. Table 3 is an illustration of applying the allowance to the
“additional space needed” as shown in Table 2. (For clarity, the building support
areas such as stairs, elevators, restrooms, custodial, etc. are excluded.)

20
Table 3. Calculation of Budget Requirements
Space Type ASF EFF. GSF $/GSF BLDG. COST
Classroom (General) 10,000 63% 15,873 $316 $5,015,873
Teaching Lab (LD) 20,600 59% 34,915 $411 $14,350,169
Subtotals 30,600 50,788 $19,366,043
Source: Data adapted from The California State University, “Budget Composite Matrix, Form CPDC 2-6.5,” under “Major Capital Outlay Forms,” http://www.calstate.edu/cpdc/Facilities_Planning/forms.shtml (assessed 27 May 2008).
Costs for the building site and landscaping are dependent on site conditions and
vary by campus and project location. Some campuses, built on hills will have
higher site costs than those built in level valleys. Accordingly, site location on the
campus at Cal Poly affects the site construction costs. For instance, the Center
for Science is located on the upper part of the campus core and bedrock is
located near the earth’s surface. Engineering III and IV are located in an area of
campus that is flatter and composed of soil depth of 25 to 65 feet to bedrock.
Site excavation and substructure construction are both affected by the type of
soil and the depth to bedrock.
Other costs, such as fees for services are either formula driven or determined
based on previous projects. These costs include design, engineering, testing,
plan checking and construction management, and are known in the industry as
soft costs. The hard costs for building, site and landscaping are added to the soft
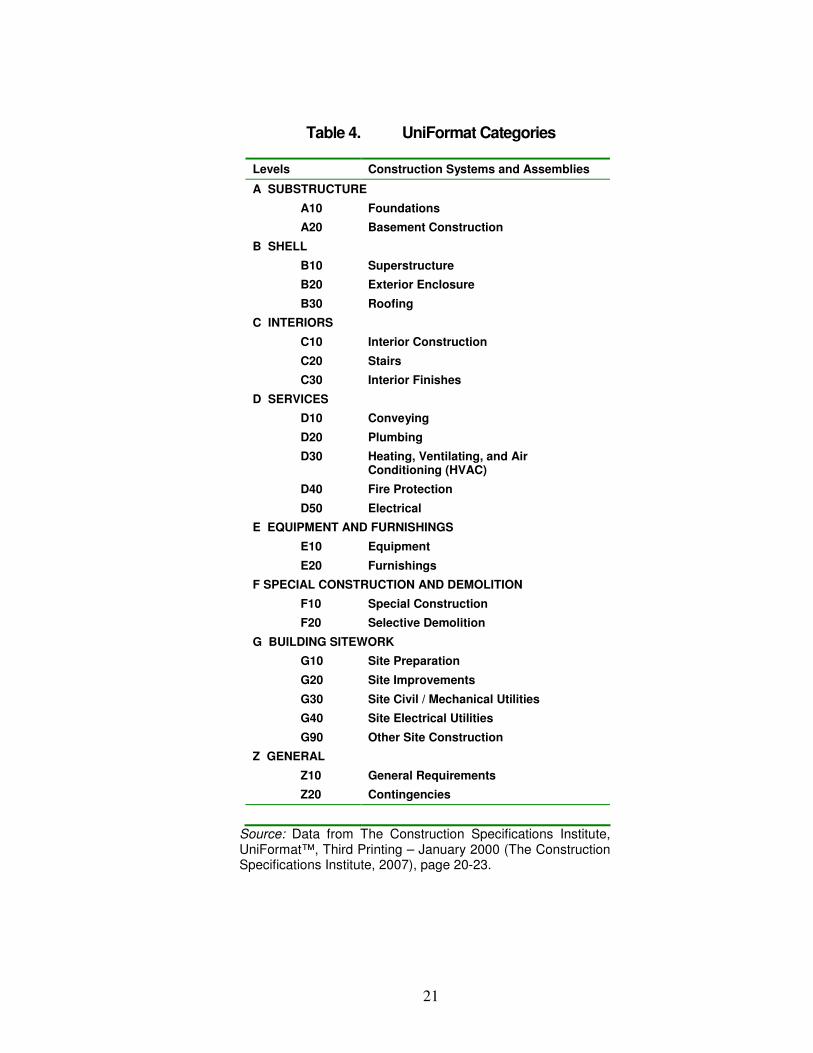
costs for the grand total project costs. At this point in the project process,
building costs are represented by building systems organized by CSI UniFormat
categories show in Table 4.
21
Table 4. UniFormat Categories
Levels Construction Systems and Assemblies
A SUBSTRUCTURE
A10 Foundations
A20 Basement Construction
B SHELL
B10 Superstructure
B20 Exterior Enclosure
B30 Roofing
C INTERIORS
C10 Interior Construction
C20 Stairs
C30 Interior Finishes
D SERVICES
D10 Conveying
D20 Plumbing
D30 Heating, Ventilating, and Air Conditioning (HVAC)
D40 Fire Protection
D50 Electrical
E EQUIPMENT AND FURNISHINGS
E10 Equipment
E20 Furnishings
F SPECIAL CONSTRUCTION AND DEMOLITION
F10 Special Construction
F20 Selective Demolition
G BUILDING SITEWORK
G10 Site Preparation
G20 Site Improvements
G30 Site Civil / Mechanical Utilities
G40 Site Electrical Utilities
G90 Other Site Construction
Z GENERAL
Z10 General Requirements
Z20 Contingencies
Source: Data from The Construction Specifications Institute, UniFormat™, Third Printing – January 2000 (The Construction Specifications Institute, 2007), page 20-23.

22
Projected amounts are entered into the CSU Capital Outlay Estimate
(Form CPDC 2-7),9 a portion of which is illustrated in Table 5. An additional
column in the Form, to the right of the total (not shown), provides a cost per
gross square foot. This allows the CSU to compare costs across campuses for
similar space and construction types, and campuses to monitor the cost of each
system.
Table 5. Cost in UniFormat Categories
Levels Construction Systems and Assemblies Subtotal Total
A SUBSTRUCTURE $1,370,135
A10 Foundations $1,370,135
A20 Basement Construction 0
B SHELL 7,037,189
B10 Superstructure 3,088,903
B20 Exterior Enclosure 2,013,886
B30 Roofing 1,934,401
C INTERIORS 2,043,398
C10 Interior Construction 1,065,180
C20 Stairs 0
C30 Interior Finishes 978,218
D SERVICES 7,452,322
D10 Conveying 525,704
D20 Plumbing 554,035
D30 HVAC 2,714,693
D40 Fire Protection 438,742
D50 Electrical 3,219,148
E EQUIPMENT AND FURNISHINGS
E10 Equipment 0
E20 Furnishings 0
F SPECIAL CONSTRUCTION AND DEMOLITION 1,462,999
F10 Special Construction 1,462,999
F20 Selective Demolition 0
$19,366,043
Source: Data adapted from The Construction Specifications Institute, UniFormat™, Third Printing – January 2000 (The Construction Specifications Institute, 2007), page 20-23.

23
Cal Poly Center for Science Project
Case Study
The Center for Science was chosen as the case study for comparison of the
traditional project management approach versus using building information
modeling (Figure 5). It is a complex project, located in the educational core of
the Campus, and presents many challenges in its design, construction and
occupancy.
Figure 5. Center for Science. Source: California Polytechnic State University, San Luis Obispo, Facilities Planning and Capital Project, Center for Science Project, drawing by ZGF (16 June 2007).
This section will provide a brief history of the project, how the Project Team
structure was identified, the method used to develop the project budget, an
analysis of the cost estimates at each design phase, and a summary of the cost
changes over time by building.
A significant difference in implementation and effectiveness was expected to be
found between using the industry’ traditional standard model versus using a
24
Building Information Model (BIM) approach. The results highlight the need for a
shift to BIM to significantly improve quality and efficiency.
Study Area
In an interview with Barbara Queen, Project Manager for the Center for Science,
two negative key areas of the building design were identified as potentially
benefiting from the use of BIM--the shell or exterior enclosure, and the labs and
fume hoods. These two items were not significantly explored by the design
team, nor were experts consulted or potential options given enough
consideration during the programming through design development phases.
Limited information provided the basis for the decisions on these two items.
Subsequent options and future potential savings were limited and handicapped
by the need to rework architectural and engineering solutions to reverse
unfavorable decisions. By not having explored and carried forward potential
options for these building systems, the project budget continued unresolved
during the construction document phase as the project team explored potential
savings in building systems.
The Center for Science case study was limited to the exterior enclosure of the
building and specifically, this thesis investigates the decisions made during the
three phases—Schematic, Design Development and Construction Documents.
Assumptions and decisions made by the team members were documented.
Project History
The University began planning the Center for Science project in 1999. Over
fourteen University groups were represented in the study. At that time, it was
anticipated to include the Mathematics Department and an applied research
component. However, over several years, the project scope was revised as
illustrated by the graph in Figure 6. The changes in total construction costs (by
fund and square footage) submitted to the California State University (CSU) in
the Capital Outlay Budget Change Proposal (COBCP) are typical of project
iterations before CSU scope and funding approval is obtained. In 2005, the
applied research component was removed and with a reduced scope, the project
was approved and slated to receive initial funding in early 2007.10 In the interim,

25
the committees and design team, originally established to work on the project,
were brought together to validate the scope.11 The Center for Science, which is
a replacement and growth project, is scheduled to commence construction in
May 2009, after completion of the working documents phase.
COBCP 2-7 - Total Construction by Fund vs. Area
256,
289
256,
289
256,
289
134,
256
173,
346
173,
346
$0
$20,000,000
$40,000,000
$60,000,000
$80,000,000
$100,000,000
$120,000,000
Year
Co
sts
0
50,000
100,000
150,000
200,000
250,000
300,000
Are
a (
SF
)
Nonstate
Applied Research
State
Area (SF)
Figure 6. Total construction costs and areas. Source: Data adapted from California Polytechnic State University, COBCP, Years 2002/03, 2004/05, 2006/07, 2007/08 and 2009/10, Capital Outlay Estimates (Form CPDC 2-7).
2002/03 2004/05 2005/06 2006/07 2007/08 2008/09

26
Project Team
In Figure 7, the Project Team organization chart exemplifies the complexity of the
temporary organization established to accomplish a project within the CSU
system. Unlike typical team illustrations, this organization chart is shown from
the campus Project Manager point-of-view. As the owner’s representative, the
Project Manager is responsible for keeping all team members on track.
Figure 7. Project Team. Source: Data adapted from Facilities Planning & Capital Projects.
27
Cal Poly often hires one architectural firm to provide services during the
Programming Phase, and later on a different firm for the Design and Construction
Phases. The Program Architect for the Center for Science was RRM Design
Group of San Luis Obispo, California. RRM helped Cal Poly to establish the
initial scope and budget for the Center for Science project.
After the project received funding for design services, the Architect, Zimmer
Gunsul Frasca Architects LLP (ZGF) of Los Angeles, California, was selected to
begin work on the Schematic Design Phase. Upon completion of the Schematic
Design Phase, Gilbane Building Company of San Jose, California, was selected
the Construction Manager at-Risk*, and brought on-board at initiation of the
Design Development Phase.12 In the Center for Science Project, the Owner is
represented by Cal Poly’s Facilities Planning and Capital Projects Department
staff. The User is the College of Science and Math led by the Dean and
Associate Dean. The project team relationships with the design architect and
construction manager are illustrated in Figure 8.
*In the Construction Manager at-Risk (CM at Risk) projects, the CM is issued a service
agreement for the preconstruction (project design) services, and works with the architect performing value engineering, constructability reviews, cost estimating, etc. to produce the optimum project value for the money available, and complete and accurate construction documents that the CM can then distribute to the trade contractors to bid to secure a Guaranteed Maximum Price (GMAX). Once the CM obtains the GMAX bid, the owner enters into a construction agreement with the CM for the construction phase of the project. http://www.calstate.edu/BF/Newsletters/letters04-05/1104issue.pdf (accessed 07 January 2009)

28
Figure 8. Center for Science Project Team. Source: Data adapted from Facilities Planning & Capital Projects.
Project Budget
During the Programming Phase, two independent estimates were prepared and
reconciled. The results were found to be above the CSU allowable costs
requiring that the Program be modified. Two additional independent estimates
were then prepared and reconciled with the results demonstrating that the
allowable costs were inadequate for the project.13 RRM, the program architect,
cautioned that areas for cost savings would need to be explored as the project
moved forward, and included further recommendations to reduce costs while
maintaining building performance: 1) simplified building layout to reduce
envelope, 2) integrated systems design to reduce redundancy, and 3) phased
implementation of the Centennial Green.14 These recommendations continued to
be considered throughout project development, and long after the study was
completed.
The CSU Programming budget, the results from the two final Programming
Phase estimates for the building and site construction, and the final budget from

29
the May 18, 2007 campus allowable costs (CSU Allocation) are listed in Table 6.
The sitework construction is shown as a lump sum cost since it is considered
separately from the building cost by the CSU. For purposes of consistency
throughout this report, the CSU Allocation will be shown as the last, revised
amount approved by the CSU on May 18, 2007, and obtained from Cal Poly
Facilities Planning and Capital Projects Department.

30
Table 6. Programming Phase Allowable Costs versus Estimates
Levels UniFormat Cat. CSU
Budgeta
Davis Langdon O’Connor
CSU Allocation
b
A SUBSTRUCTURE
A10 Foundations 972,657 2,243,000 1,387,184 627,000
A20 Basement Construction
2,583,730 0 2,532,942 0
B SHELL
B10 Superstructure 7,038,619 8,670,000 8,327,124 8,221,000
B20 Exterior Enclosure
4,981,283 4,884,000 7,970,902 4,873,000
B30 Roofing 437,901 761,000 1,524,096 474,000
C INTERIORS
C10 Interior Construction
6,180,103 5,162,000 3,483,393 1,838,000
C20 Stairs 149,685 c 548,092
c
C30 Interior Finishes 3,010,030 2,239,000 2,699,843 2,154,000
D SERVICES
D10 Conveying 347,999 1255000 933,914 785000
D20 Plumbing 11,233,361 6,172,000 4,448,392 3,166,000
D30 HVAC 13,829,989 13,747,000 12,371,700 9,086,000
D40 Fire Protection 1,583,389 879,000 945,663 783,000
D50 Electrical 10,918,414 8,719,000 8,652,113 7,286,000
E EQUIPMENT. & FURNISHINGS.
E10 Equipment 12,653,431 7,495,000 10,854,146 8,186,000
E20 Furnishings d
d
d
d
F SPECIAL CONSTRUCTION & DEMOLITION
F10 Special Construction
0 339,210 0
F20 Selective Demolition
652,501 0 1,044,185 0
Total Building 76,573,092 62,226,000 47,477,000 68,362,000
Total Sitework 7,893,402 14,411,000 12,146,000 16,134,000
Escalation for Construction 6,355,000 15,639,000 19,323,000 5,901,000
General Conditions, OH&P, Contingency
16,693,000 36,749,000 40,244,000 10,848,000
Grand Total 107,514,494 116,787,000 115,170,000 122,087,000
Source: Data from RRM Design Group. The Center for Science: Program Document and Feasibility Study. California Polytechnic State University, San Luis Obispo, October 2006.
Notes:
a Initial CSU 2-7 Budget.
b Final CSU 2-7 Budget and fund allocation.
c Included in D10-Conveying.
d Included in E10-Equipment.

31
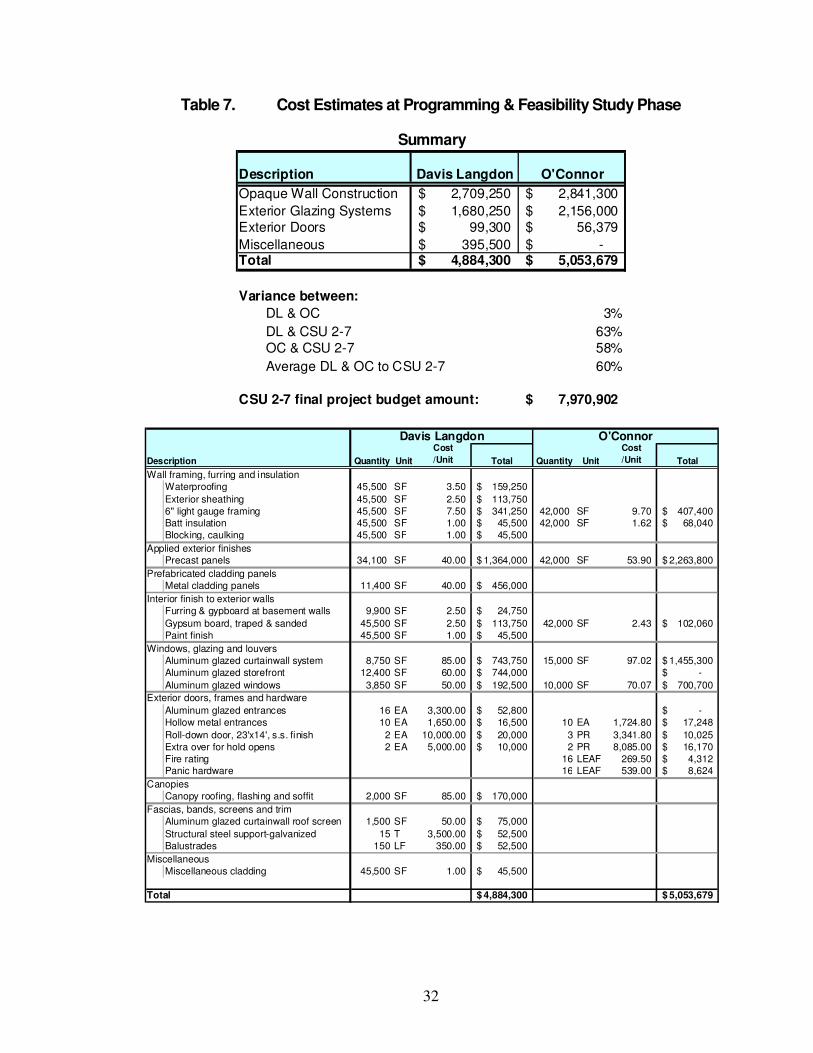
Exterior Enclosure
While the building information model assumptions will be limited to the
Programming and Conceptual Design Phase, this portion of the research
examined the exterior enclosure cost estimates and Basis of Design from
Programming and Conceptual Design through the Construction Documents.
Programming and Conceptual Design
In the Programming and Conceptual Design Phase, independent cost estimates
were prepared by two firms–Davis Langdon (the Program Architect’s estimator)
and O’Connor Construction Management (the University’s estimator). In Table 7,
the descriptions used by each estimator were compared and correlated where
possible. Variations in descriptions occurred because each has a separate cost
data base from which to work. Items broken-out by one may be lumped together
by another. Quantities may be determined in a different manner by each. At this
phase in the project, cost estimating is as much an art as it is a science in that to
a large extent the information is sketchy at best. Each estimator used
experience and judgment in making assumptions for inclusion and exclusion of
items in preparing the estimates.
While it is interesting to note the differences between the two approaches, the
two estimates are within three percent of each other—an acceptable variance.
They are, however, far below the final CSU allocation of $7,970,902, at
approximately 60 percent of the allocation. Cost escalation may be a portion of
the higher cost, but insufficient information at this phase would seem a more
likely reason. Even taking into account a 20 percent design contingency, both
estimates are still below what the project will end up costing.
32
Table 7. Cost Estimates at Programming & Feasibility Study Phase
Description Davis Langdon O'Connor
Opaque Wall Construction 2,709,250$ 2,841,300$
Exterior Glazing Systems 1,680,250$ 2,156,000$ Exterior Doors 99,300$ 56,379$
Miscellaneous 395,500$ -$ Total 4,884,300$ 5,053,679$
Variance between:
DL & OC 3%
DL & CSU 2-7 63% OC & CSU 2-7 58%
Average DL & OC to CSU 2-7 60%
CSU 2-7 final project budget amount: 7,970,902$
Summary
Quantity Unit
Cost
/Unit Total Quantity Unit
Cost
/Unit Total
Wall framing, furring and insulationWaterproofing 45,500 SF 3.50 159,250$
Exterior sheathing 45,500 SF 2.50 113,750$ 6" light gauge framing 45,500 SF 7.50 341,250$ 42,000 SF 9.70 407,400$ Batt insulation 45,500 SF 1.00 45,500$ 42,000 SF 1.62 68,040$ Blocking, caulking 45,500 SF 1.00 45,500$
Applied exterior finishesPrecast panels 34,100 SF 40.00 1,364,000$ 42,000 SF 53.90 2,263,800$
Prefabricated cladding panelsMetal cladding panels 11,400 SF 40.00 456,000$
Interior finish to exterior wallsFurring & gypboard at basement walls 9,900 SF 2.50 24,750$
Gypsum board, traped & sanded 45,500 SF 2.50 113,750$ 42,000 SF 2.43 102,060$ Paint finish 45,500 SF 1.00 45,500$
Windows, glazing and louversAluminum glazed curtainwall system 8,750 SF 85.00 743,750$ 15,000 SF 97.02 1,455,300$ Aluminum glazed storefront 12,400 SF 60.00 744,000$ -$
Aluminum glazed windows 3,850 SF 50.00 192,500$ 10,000 SF 70.07 700,700$
Exterior doors, frames and hardware
Aluminum glazed entrances 16 EA 3,300.00 52,800$ -$ Hollow metal entrances 10 EA 1,650.00 16,500$ 10 EA 1,724.80 17,248$
Roll-down door, 23'x14', s.s. finish 2 EA 10,000.00 20,000$ 3 PR 3,341.80 10,025$ Extra over for hold opens 2 EA 5,000.00 10,000$ 2 PR 8,085.00 16,170$ Fire rating 16 LEAF 269.50 4,312$ Panic hardware 16 LEAF 539.00 8,624$
CanopiesCanopy roofing, flashing and soffit 2,000 SF 85.00 170,000$
Fascias, bands, screens and trimAluminum glazed curtainwall roof screen 1,500 SF 50.00 75,000$
Structural steel support-galvanized 15 T 3,500.00 52,500$ Balustrades 150 LF 350.00 52,500$
MiscellaneousMiscellaneous cladding 45,500 SF 1.00 45,500$
Total 4,884,300$ 5,053,679$
Description
Davis Langdon O'Connor
33
Schematic Design Phase*
In the Schematic Design Phase, independent cost estimates were prepared by
Davis Langdon, the cost estimator for the design architect, ZGF, and by the
construction manager, Gilbane Building Company. In organizing Table 8, the
descriptions used by each estimator were compared and correlated where
possible.
Two areas of disagreement in the estimates emerged – materials and quantities.
It is also interesting to note that the quantities used by each estimator for the
same items differ. For example, the Curtain Wall System quantities differ by
6832 square feet for concealed header/jamb and 3044 square feet for the 2”
deep horizontal snap caps. The cost difference totals $1,272,340 for these two
items. Even the total number of doors is different—40 total for Davis Langdon
and 36 total for Gilbane. Several items listed by one are described differently by
the other, or omitted completely. For example, the 8” CMU Penthouse Walls are
not included in the Davis Langdon estimate.
At this phase in the project, the architect is attempting to hold the costs down,
while the construction manager is trying to include every possible contingency.
The variance between the two estimates is 31 percent. Davis Langdon is
9 percent below the final CSU allocation of $7,970,902, and Gilbane is
19 percent above it. The average of their differences is 5 percent from the CSU
allocation.
Variation in costs may be partially due to different approaches to cost data and
lack of detailed information leading to different assumptions at this early phase of
the project.
*Interprets the project requirements to show relationship of the facility to the site, other
buildings, and the campus; exterior design of the facility; relationship of interior areas; materials to be used in construction: types of structural, mechanical, electrical, and telecommunication systems to be utilized; construction costs; and life cycle cost analysis. Documents include drawings, outline specifications and cost estimates.

34
Table 8. Cost Estimates at Schematic Design Phase
Description Davis Langdon Gilbane
Opaque Wall Construction 3,761,913$ 5,149,532$ Exterior Glazing Systems 2,165,810$ 3,459,230$
Exterior Doors 122,050$ 152,500$ Miscellaneous 630,289$ -$
Total 6,680,062$ 8,761,262$
Variance between:
DL & OC 31% DL & CSU 2-7 19%
OC & CSU 2-7 -9% Average DL & OC to CSU 2-7 5%
CSU 2-7 final project budget amount: 7,970,902$
Summary
-
Quantity Unit
Cost
/Unit Total Quantity Unit
Cost
/Unit Total
Opaque Wall Construction8" CMU Penthouse Walls 3,140 SF 22.45 70,493$
4" Furring to basement walls 3,310 SF 3.50 11,585$ Steel Lintels (angles) 49,048 SF 1.50 73,572$ 25 Ton 2,759.14 68,979$ 8"light gauge framing 63,113 SF 8.50 536,461$
Rigid insulation 63,113 SF 2.50 157,783$ Waterproofing 63,113 SF 4.00 252,452$
Exterior sheathing, dens-glass 63,113 SF 2.75 173,561$ Metal Panel System (Zinc Panels) 24,974 SF 27.50 686,785$ Zinc Panels on 8" stud back-up 13,344 SF 60.00 800,640$
Zinc Panels - Return to Remove Protective Shielding 13,344 SF 10.00 133,440$ Zinc Panels on Structural Steel Framing (incl Steel) 11,425 SF 90.00 1,028,250$
Brick Veneer 49,048 SF 32.50 1,594,060$ 48,841 SF 50.00 2,442,050$ Gypsum board to exterior walls-taped, sanded & painted 66,423 SF 4.15 275,655$
Exterior Wall Back-up - Drywall Furring on 3-5/8" Studs 62,185 SF 8.00 497,480$ Exterior Soffits 4,200 SF 21.00 88,200$ Sub - Louvers & Grilles 1 LS 20,000.00 20,000$
Exterior Glazing SystemsInterior window Sills 5,000 LF 20.00 100,000$
Exterior Wall Mock Up 1 ALW 25,000.00 25,000$ Curtain Wall System - Concealed Header/Jamb 5,731 SF 100.00 573,100$ 12,563 SF 70.00 879,410$ Curtain Wall System - 2" Deep Horiz Snap Caps 18,721 SF 70.00 1,310,470$ 22,765 SF 100.00 2,276,500$
Structurally Glazed Double-height Curtainwall 2,352 SF 120.00 282,240$ 1,486 SF 120.00 178,320$
Exterior Doors
Doors/Frames/hardware, Exterior HM 8 LEAF 1,500.00 12,000$ --Single leaf 5 EA 1,700.00 8,500$
--Double leaf 7 EA 3,250.00 22,750$ Overhead Doors Elec Operated 1 EA 2,500.00 2,500$ Entrance Doors - Glass/Alum 15 LEAF 4,000.00 60,000$
--Single leaf 1 EA 3,300.00 3,300$ --Double leaf 10 EA 6,150.00 61,500$
Entrance Door Auto Assist HW - Fire Glass/Alum, 2 hr FR 12 LEAF 6,500.00 78,000$ Auto Openers 4 EA 6,500.00 26,000$
Miscellaneous
Soffits - Metal Panel 2,102 SF 47.50 99,845$ Soffits - Cement Planter 892 SF 30.00 26,760$
Roof screen including structural support, metal panel (12') 6,744 SF 50.00 337,200$ Galvanized guardrail at terraces, 4 feet high 240 LF 220.00 52,800$
Fascias, bands, screens & trim 113,684 SF 0.50 56,842$ Architectural detailing 113,684 SF 0.5 56842
Total 6,680,062$ 8,761,262$
Description
Davis Langdon Gilbane
35
Design Development Phase*
Again in the Design Development Phase, independent cost estimates were
prepared by Davis Langdon, and by Gilbane. In organizing Table 9, the
descriptions and quantities were compared. The cost estimates are becoming
more detailed as the building systems are defined.
Both ZGF and Gilbane were attempting to maintain the design intent, while
holding to the construction budget. The variance between the two estimates is
26 percent. Both Davis Langdon and Gilbane are above the final CSU allocation
of $7,970,902 (9 percent and 27 percent, respectively). The average of their
differences is 18 percent above the CSU allocation.
Optional materials and details for the exterior were explored in an attempt to
bring the final building in-line with the budget. It was becoming increasingly clear
that the budget approved by the CSU was inadequate, even after exploring and
applying several value engineering options, including a less durable exterior
material. The cost of other building systems would have to be reduced to make-
up for the shortfall in the exterior enclosure costs, and to bring the overall project
costs in-line with the budget.
*Confirms or adjusts all aspects of the schematic plans (exterior design, mechanical and
electrical systems, telecommunications system, structural systems, area arrangements, foundation plans, etc.). Documents include plans, outline specifications and cost estimates developed in further detail than schematic documents.

36
Table 9. Cost Estimates at Design Development Phase
Description Davis Langdon Gilbane
Opaque Wall Construction 5,536,972$ 6,882,309$ Exterior Glazing Systems 2,095,190$ 3,823,925$
Exterior Doors 153,800$ 190,540$ Miscellaneous 960,599$ 95,780$
Total 8,746,561$ 10,992,554$
Variance between:
DL & OC 26% DL & CSU 2-7 -9%
OC & CSU 2-7 -27% Average DL & OC to CSU 2-7 -18%
CSU 2-7 final project budget amount: 7,970,902$
Summary

37
Quantity Unit
Cost
/Unit Total Quantity Unit
Cost
/Unit Total
Opaque Wall Construction4" Furring to basement walls 4,165 SF 3.50 14,578$
Steel Lintels (angles) 58,450 SF 1.50 87,675$ 12 Ton 2,759.14 33,110$
Tube Steel at Bump-outs 10 Ton 8,500.00 85,000$ Metal support anchor, 4"x4" 28,522 SF 3.50 99,827$
Screen Wall Supports 10 Ton 8,500.00 85,000$
Metal angle, 1-1/2" x 1-1/2" 28,522 SF 4.00 114,088$ Shelf Angles to Support Brick 30 Ton 8,050.91 241,527$
Z-profile framing, 1" 28,522 SF 2.50 71,305$
Rigid insulation 86,972 SF 3.50 304,402$ 95,384 SF 2.07 197,445$ Waterproofing 86,972 SF 4.00 347,888$ 88,329 SF 4.10 362,149$
Basement Wall Waterproofing 7,283 SF 2.41 17,571$
Exterior sheathing, dens-glass o/6" stud framing 86,972 SF 10.25 891,463$ 88,329 SF 13.80 1,218,940$
Flashing at Opaque Wall 5,000 LF 11.28 56,390$ Aluminum Dri-p Edge at Window Head/Sill 2,536 LF 7.00 17,752$
Metal wall panels-screen walls & light monitors; at back of parapet 2,318 SF 35.00 81,130$
Brick Veneer, including anchors 58,450 SF 33.50 1,958,075$ 50,714 SF 38.25 1,939,811$ Brick Veneer with projecting horiz bands 8,495 SF 42.50 361,038$
Column cladding, GFRG 56 LF 275.00 15,400$ 60 LF 60.00 3,600$
Fiber cement siding 28,522 SF 40.00 1,140,880$ 43,129 SF 37.50 1,617,220$
Gypsum board to exterior walls-taped, sanded & painted 86,972 SF 5.65 491,392$ 88 LF 5.40 Drywall Furring on Hat Channels 88,329 SF 5.40 476,977$
Sub - Louvers & Grilles 1 LS 20,000.00 20,000$ Louvers attached to aluminum & SwissPearl System 1,353 SF 50.00 67,650$
Exterior Glazing Systems
Aluminum glazed curtainwall at knuckles 2080 SF 100.00 208,000$ 705 SF 150.00 105,750$ Aluminum glazed curtainwall 4745 SF 100.00 474,500$ 5331 SF 90.00 479,790$
Sloped aluminum window 342 SF 110.00 37,620$ 354 SF 110.00 38,940$
Aluminum windows / store front 14055 SF 70.00 983,850$ 7337 SF 82.94 608,555$
Windows-in Bumpouts & Clerestory 6230 SF 75.00 467,250$ Aluminum mullion system, 11" deep 19561 SF 20.00 391,220$
Curtainwall Support Steel Framing 25 Ton 9,000.00 225,000$
Sunshade - Mullion system & horiz. Louvers/sunshade 23,376 SF 69.19 1,617,320$ Windows-Operable 1,541 SF 120.00 184,920$
Glazing at light monitors - operable 714 SF 100.00 71,400$ Exterior Wall Mock Up 1 ALW 25,000.00 25,000$
Exterior Doors
Doors/Frames/hardware, Exterior HM
--Single leaf 10 EA 1,750.00 17,500$ --Double leaf 3 EA 3,250.00 9,750$
Doors Frames, Exterior HM, rated
--Single leaf 6 EA 960.00 5,760$
--Double leaf 3 EA 1,600.00 4,800$ Doors Frames, Exterior HM, non-rated
--Single leaf 2 EA 880.00 1,760$
--Double leaf 1 EA 1,520.00 1,520$ Entrance Doors - Glass/Alum 24 LEAF 4,000.00 96,000$
--Single leaf 8 EA 3,300.00 26,400$
--Double leaf 10 EA 6,150.00 61,500$
Solid metal door - Exterior, rated 10 LEAF 1,400.00 14,000$ Solid metal door with lite - Exterior 2 LEAF 1,500.00 3,000$
Solid wood door with metal frame and hardware 4 LEAF 1,300.00 5,200$
--Single leaf 5 EA 1,600.00 8,000$ --Double leaf 1 EA 3,150.00 3,150$
Premium for fire rating 10 EA 150.00 1,500$
Entrance Door Auto Assist HW - Fire Glass/Alum, 2 hr FR 9 LEAF 6,500.00 58,500$ Auto Openers 4 EA 6,500.00 26,000$
Miscellaneous
Soffits--Fiber cement 2,909 SF 50.00 145,450$
--Cement Planter 418 SF 25.00 10,450$
Balustrades & roof screen--Roof Screen including fiber cement siding o/structural steel
o/concrete curb5,472 SF 81.46 445,740$
--Maintenance walkway suspended 1,854 SF 38.00 70,452$
--Galvanized guardrail at terraces, 4 feet high 227 LF 250.00 56,750$ Fascias, bands, screens & trim
--Aluminum louvers / sunshade (4 fin assembly) 650 LF 175.00 113,750$
--Allow for fascias, bands, screens & trim 118,007 SF 0.50 59,004$ --Architectural detailing 118,007 SF 0.50 59,004$
Millwork - Interior wood window sills 1,485 LF 20.00 29,700$
Millwork - Interior wood window sills @ 21"wide windows 826 LF 80.00 66,080$
Total 8,746,561$ 10,992,554$
Cost Estimates at Design Development
Description
Davis Langdon Gilbane

38
Construction Documents Phase*
During the 50% Construction Documents Phase, Davis Langdon and Gilbane
had highly detailed information in the Construction Documents from which to
prepare their independent cost estimates. At this point in the project, the exterior
skin plans included elevations, sections, details and specifications (Figure 9).
Figure 9. Center for Science – Building Elevations. Source: California Polytechnic State University, San Luis Obispo, Facilities Planning and Capital Project, Center for Science Project, drawings by ZGF (10 July 2007).
*Sets forth, in detail, all aspects of project design, function, and construction. Documents
area used for estimating the cost of the project, securing bids for its construction, and directing the contractor during the construction period. Documents include detailed construction drawings, and material and building system specifications.
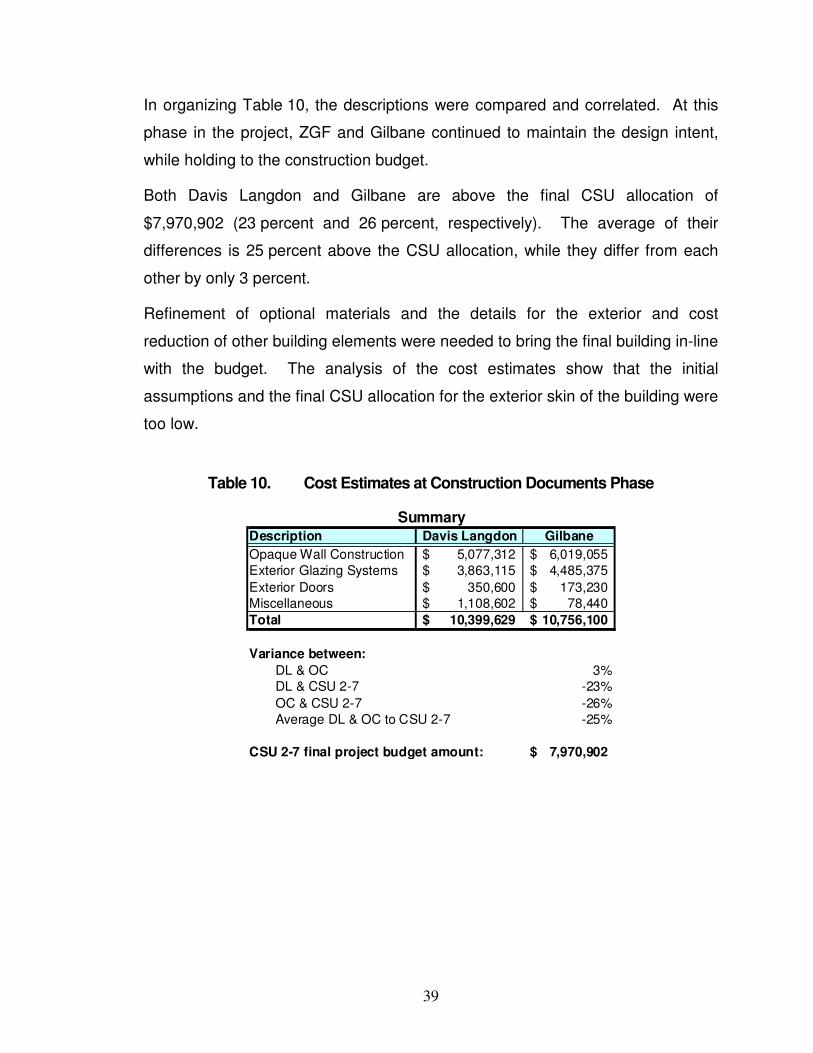
39
In organizing Table 10, the descriptions were compared and correlated. At this
phase in the project, ZGF and Gilbane continued to maintain the design intent,
while holding to the construction budget.
Both Davis Langdon and Gilbane are above the final CSU allocation of
$7,970,902 (23 percent and 26 percent, respectively). The average of their
differences is 25 percent above the CSU allocation, while they differ from each
other by only 3 percent.
Refinement of optional materials and the details for the exterior and cost
reduction of other building elements were needed to bring the final building in-line
with the budget. The analysis of the cost estimates show that the initial
assumptions and the final CSU allocation for the exterior skin of the building were
too low.
Table 10. Cost Estimates at Construction Documents Phase
Description Davis Langdon Gilbane
Opaque Wall Construction 5,077,312$ 6,019,055$ Exterior Glazing Systems 3,863,115$ 4,485,375$
Exterior Doors 350,600$ 173,230$ Miscellaneous 1,108,602$ 78,440$
Total 10,399,629$ 10,756,100$
Variance between:
DL & OC 3% DL & CSU 2-7 -23%
OC & CSU 2-7 -26% Average DL & OC to CSU 2-7 -25%
CSU 2-7 final project budget amount: 7,970,902$
Summary
40
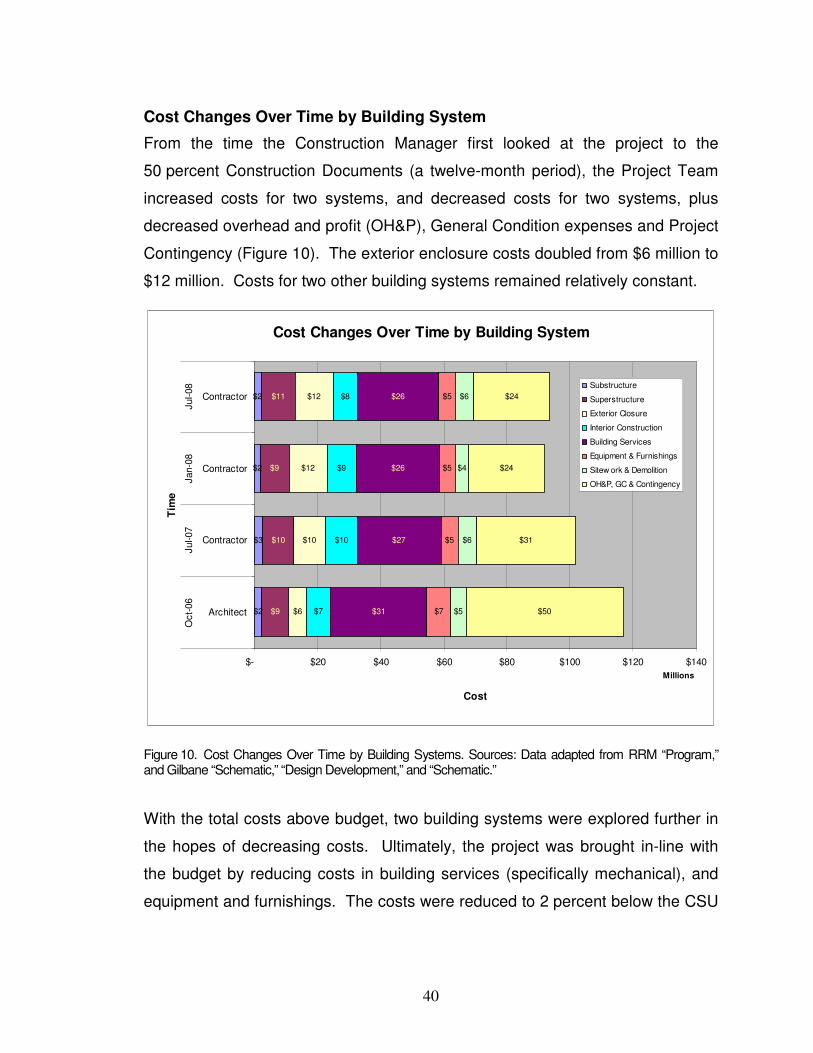
Cost Changes Over Time by Building System
From the time the Construction Manager first looked at the project to the
50 percent Construction Documents (a twelve-month period), the Project Team
increased costs for two systems, and decreased costs for two systems, plus
decreased overhead and profit (OH&P), General Condition expenses and Project
Contingency (Figure 10). The exterior enclosure costs doubled from $6 million to
$12 million. Costs for two other building systems remained relatively constant.
Cost Changes Over Time by Building System
$2
$3
$2
$2
$9
$10
$9
$11
$6
$10
$12
$12
$7
$10
$9
$8
$31
$27
$26
$26
$7
$5
$5
$5
$5
$6
$4
$6
$50
$31
$24
$24
$- $20 $40 $60 $80 $100 $120 $140
Architect
Contractor
Contractor
Contractor
Oct-
06
Jul-07
Jan-0
8Jul-08
Millions
Tim
e
Cost
Substructure
Superstructure
Exterior Closure
Interior Construction
Building Services
Equipment & Furnishings
Sitew ork & Demolition
OH&P, GC & Contingency
Figure 10. Cost Changes Over Time by Building Systems. Sources: Data adapted from RRM “Program,” and Gilbane “Schematic,” “Design Development,” and “Schematic.”
With the total costs above budget, two building systems were explored further in
the hopes of decreasing costs. Ultimately, the project was brought in-line with
the budget by reducing costs in building services (specifically mechanical), and
equipment and furnishings. The costs were reduced to 2 percent below the CSU

41
allocation, and the project continued to completion of the 100 percent
Construction Documents (Table 11).
Table 11. Difference between Budget and Construction Costs
Budget Costs Percentage
CSU 2-7 final $ 95,723,000 100%
Gilbane $ 93,520,626 98%
Difference $ 2,202,374 2%
The costs for many of the building systems over the twelve-month period differ
greatly from the budget established during the programming phase and from the
final CSU budget (Figure 10). For the exterior skin, and specifically the curtain
wall system, the architect and constructor were each envisioning a different
system. The program architect originally envisioned a standard curtainwall
system, while the design architect envisioned creating a unique curtainwall
system and did not realize the cost implications. In the end, the architect and
constructor worked together to arrive at a solution that preserve the design intent,
improved on other building systems and maintained the CSU project budget.
The design and material assumptions were the areas of consistent tension in the
costs estimates. While both estimators were reviewing the same information,
each made different assumptions about materials, systems and quantities.
Although their cost estimates differed consistently by system during the
Schematic and Design Development phases, and their final cost estimates for
the Construction Documents phase differs slightly for some building systems,
both agreed on the overall project costs for the construction budget at the
50 percent point in the Construction Documents phase (Figure 11).

42
Cost Estimate Summaries by Phase
$-
$20
$40
$60
$80
$100
$120
$140
Davis
Langdon
O'C
onnor
Davis
Langdon
Gilb
ane
Davis
Langdon
Gilb
ane
Davis
Langdon
Gilb
ane
Fin
al
Budget
Program Schemat. Des. Dev. Con.Docs. CSU
Millio
ns
Phase
Esti
mate
Escalation
Z - General
G - Building Sitework
F - Spec. Constr. & Demo.
E - Equip. & Furnishings
D - Services
C - Interiors
B - Shell
A - Substructure
Figure 11. Cost Changes Over Time by Phase. Sources: Data adapted from RRM “Program,” and Gilbane “Schematic,” “Design Development,” and “Schematic.”
Ideally, the options, assumptions, and decisions for the Center for Science would
have been known to all Project Team members at each phase of the project.
Because the project information was developed and shared in a 2-D format,
visualization of the project and all its components was open to a wide range of
assumptions and interpretations by each team member.
Interoperability, the process, and Building Information Modeling, the tool, present
new ways of developing, documenting and viewing project information. As
observed by Brent Pilgrim, if used as intended, BIM would allow architects to
make earlier and more definite assumptions, and to share those assumptions
with the rest of the team. He notes that this can be uncomfortable for architects,
because each assumption is documented and a cost applied. However, Pilgrim
also states that “one can expect the assumptions to change later, but everyone

43
knows the assumptions, and the cost estimate is in-line with those
assumptions.”15
BIM would allow options to be carried in the project data until a clear choice is
determined. Having information about the options in the model as the project
progresses would allow the Project Team members to add and analyze
information leading to a decision. If the BIM were viewed as a puzzle, then Team
members would be able to watch and participate in solving the puzzle by adding
pieces where needed, discarding pieces that don’t fit, and working together to
make sure no pieces were missing.
Dane Dodd-Hansen, an architect and specification consultant, who chairs CSI’s
BIM Technology Committee states that BIM enables “moving the decision-
making process and information gathering process to the front end of the
project.”16 He continues that it is important to share information with all team
members from initiation of the project. “Basically, the thing that they are doing
right from the beginning is to bring everybody that’s involved in the process into
the same room, right from the get go on every project.”17
Case Study Conclusions
Realizing the need to work differently by involving more team members earlier in
the design process, the AIA has gone from recommending a Traditional Design
process (Figure 4) to an “Integrated Project” process as is illustrated in Figure 12.
In the Integrated Project process, Design Consultants (civil, structural,
mechanical, electrical, plumbing, controls, special, etc.) and Constructors are
brought in earlier during what was previously known as the Predesign Phase in
the traditional design process.
In the Integrated Project process, Design Consultants (civil, structural,
mechanical, electrical, plumbing, controls, special, etc.) and Constructors are
brought in earlier during what was previously known as the Predesign Phase in
the traditional design process. “Shifting design decision making forward,” with
“early input from constructors, installers, fabricators and suppliers,” and with “the
ability to model and simulate the project accurately using BIM tools” enables “the
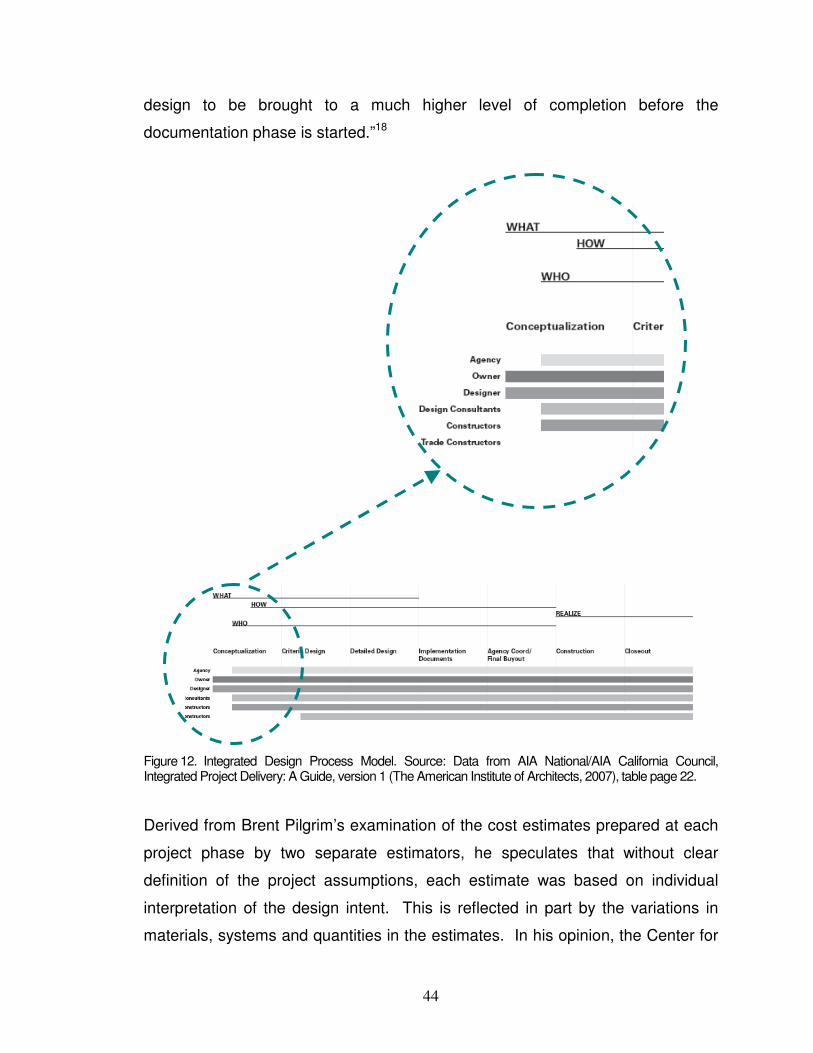
44
design to be brought to a much higher level of completion before the
documentation phase is started.”18
Figure 12. Integrated Design Process Model. Source: Data from AIA National/AIA California Council, Integrated Project Delivery: A Guide, version 1 (The American Institute of Architects, 2007), table page 22.
Derived from Brent Pilgrim’s examination of the cost estimates prepared at each
project phase by two separate estimators, he speculates that without clear
definition of the project assumptions, each estimate was based on individual
interpretation of the design intent. This is reflected in part by the variations in
materials, systems and quantities in the estimates. In his opinion, the Center for

45
Science project would have benefitted greatly if the entire team had been brought
together to visualize and communicate the project, including assumptions and
options, clearly defining the project using a 3-D tool and building information
modeling.19
In the viewpoint of Chris Pechacek, BIM would have benefited the Center for
Science project by illuminating the gaps in project definition required to develop
the cost estimate. He further adds that using BIM would have eliminated
disconnects in obtaining accurate costing information by enabling the project
team to be tied into the design process to fill in the gaps and contribute to the
project solution, noting that “every time we rehandle information, we introduce
error.”20 Pechacek is also a proponent of using information for different purposes
to create more value and save time. He observed that had the Center for
Science project been created in a BIM, the information could have been used to
create the renderings, drawings and cost estimates, and further down the road,
the shop drawings.
Based on the appraisal of the Center for Science project as the construction
manager, Mark Miller of Gilbane Building Company believes that the project
would have benefited if the complex project elements had been developed using
BIM. Miller stated that the real benefit of BIM is “seeing how all the elements
come together,”21 and that would have been helpful, especially on the east
section of the 4th floor. He noted that the numerous building elements and
seismic bracing were causing conflicts that the architect had not visualized during
design and was having difficulty understanding the challenges seismic bracing
was causing in an area congested with mechanical ducts and equipment.
In considering the potential benefits to the Center for Science project, Cal Poly
project administrator, Johan Uyttewaal is of the belief that the advantages of BIM
are greatest for the construction manager, especially in the crash detection and
as a tool for the construction process.22
Based on the opinion of Cal Poly project manager, Barbara Queen, had an
integrated process using BIM software been utilized on the Center for Science

46
project from the start, time would have been saved by the campus, architects,
consultants and construction manager since all would have had access to
complete project information and been able to utilize it at every step in the
work.23 Also, the knowledge and input of these team members would have
helped to reduce waste and maximize efficiency from programming through
design.
Thorton Tomasetti, an international engineering company, notes on their website
that BIM promises to provide “enhanced visualization, linked data sets, improved
design team coordination, expedited quantity takeoffs, better scope definition and
improved schedule,” and that IPD will enhance the project delivery as it
leverages “the many advantages inherent in BIM.”24
With the knowledge gained from examining the Center for Science case study
and the professional opinions and consensus of the project team members, plus
the insight gained from experts in the construction industry, an approach and
recommendations were developed for the university to initiate incorporating the
advantages of IPD and BIM into its projects. These recommendations,
enumerated in Chapter 3, are intended as the first steps.
1The Construction Specifications Institute, The Project Resource Manual-CSI Manual of
Practice, 5th ed. (New York: McGraw-Hill, 2005), 1.1.
2CSI PRM, 3.23.
3Cyril M. Harris, Dictionary of Architecture and Construction, 4
th ed. (New York: McGraw-Hill,
2006), 767-768. 4William Peña, Steven Parshall, and Kevin Kelley, Problem Seeking: An Architectural
Programming Primer (Washington: AIA Press, 1987), 15.
5Peña, Parshall, and Kelley, 181-182.
6The California State University, “SUAM, Section I – Capital Outlay and Public Works
Contracts, Sections 9000-9004” (Rev 11.02), http://www.calstate.edu/CPDC/SUAM/SUAM9000-9004.pdf (accessed 13 May 2008), Section 9001.
7The California State University, “SUAM, Section I – Capital Outlay and Public Works
Contracts, Sections 9025-9040,” (Rev 12.02), http://www.calstate.edu/CPDC/SUAM/SUAM9025-9040.pdf (accessed 13 May 2008), Section 9028.
8The California State University, “SUAM, Appendix B: Facilities Planning,”
http://www.calstate.edu/cpdc/suam/Appendices/Appendix B.shtml (accessed 20 May 2008).
47
9The California State University, “SUAM, Appendix B: Facilities Planning,”
http://www.calstate.edu/cpdc/suam/Appendices/Appendix B.shtml (accessed 20 May 2008), CSU CPDC Form.
10Capital Outlay Budget Change Proposal: 2007/08 State and Non-State Capital Outlay
Program (November 2006); RRM Design Group, The Center for Science: Program Document and Feasibility Study, California Polytechnic State University, San Luis Obispo (October 2006), 8.
11RRM, 8.
12California Polytechnic State University, “Request for Proposal – Construction Manager at
Risk with Guaranteed Maximum Price – Center for Science RFP MAJ 06-310, Article B – Information for Proposers,” (15 January 2007), 6.
13RRM, 57.
14RRM, 57.
15Brent Pilgrim, telephone interview by author, (26 November 2008).
16Dane Dodd-Hansen, telephone interview by author, (21 November 2008).
17Dodd-Hansen.
18AIA National / AIA California Council, Integrated Project Delivery: A Guide, version 1 (The
American Institute of Architects, 2007,: 22.
19Pilgrim.
20Christopher Pechacek, telephone interview by author, (26 November 2008).
21Mark Miller, telephone interview by author, (09 January 2009).
22Barbara Queen and Johan Uyttewaal, interview by author, San Luis Obispo, CA, (09 January 2009).
23Queen and Uyttewaal.
24Thorton Tomasetti, Website, http://www.thorntontomasetti.com/project_delivery.php
(accessed 6 January 2009).

48

49
CHAPTER 3
Justification, Assumptions and Recommendations
Justification of Issues
Industry Changes Necessitate Process Changes
As the construction industry moves toward BIM, propelled by new software tools,
integrated project delivery is becoming the process that will allow the project
team to work in a better, more efficient manner through all phases of a project.
As tools for each participant are developed and information becomes integrated
into a complete and accessible building information model, the industry must
respond by changing to an integrated design process to benefit fully from the
interoperability of the systems. Until this occurs, project information will be
fragmented and lost, and the construction industry will continue to be inefficient
and frustrated by the ever increasing building complexity. The benefits are many
and available to those who participate using BIM and an integrated process.
The individual experts interviewed for this thesis each have a different approach
to projects. Each demonstrates in a different way how they are modeling their
business to embrace BIM and improve upon the work processes and the project
outcomes. Beck Technology has responded to the industry changes by
providing integrated project services similar to design-build. However, they are
unique in that design and construction are all part of the same company and all
share the same bottom line.1
Dodd-Hansen Consulting has expanded their specification writing services (to
assist firms moving into new initial delivery processes) by gathering information
on materials and systems at the beginning of a project to provide the means for
earlier decision making. Dane Dodd-Hansen describes the Basis of Design in
the conceptual phase as “essentially a response to the owner’s requirements for
the project” where the probable products and systems are defined, and “put
together in a component specification.”2 This allows information to be provided

50
earlier to all team members so that all are working from the same assumptions.
Dodd-Hansen notes the advantage, “It moves everybody onto that early page
very, very effectively.”3
Onuma, Inc. is focusing on early planning and facility management. Their web-
based software tools allow owners to do early programming and feasibility
analysis. When initiating a project, the requirements can be cataloged or
assembled and shared with the project team. Instead of a static document,
information can continue to be added throughout the life cycle of the building.
Additionally, owners with large and multiple facilities benefit greatly by being able
to manage their space allocation and requirements. For large and multiple
facility owners, such as the United States General Services Administration (GSA)
and the United States Coast Guard, these types of tools enable them to manage
existing facilities and plan for future facilities.4
In 2003, GSA began a pilot program to leverage 3-D-based BIM to improve “cost
predictability.”5 GSA hoped to “ensure better as-built documentation,
communication, design delivery, and coordination.”6 As a result of the successes
with the pilot program, the Commissioner of the Public Buildings Services
mandated the use of interoperable BIM for cost-effective delivery of GSA
projects.”7
Transformation of Information Sharing
The holistic nature of BIM provides significant opportunities for all members of
the building team. For example, team members with access to the project
information can be aware of all changes being made in real time—a substantial
information sharing and coordinating opportunity. BIM can allow information
created in the programming and conceptual design phase to be carried
throughout subsequent phases with information being added or modified as the
project progresses. BIM can reduce errors made by the design and construction
team members by checking for conflicts in the drawings, such as a pipe
penetrating a duct and a duct cutting through a critical structural member. It can
free-up time spent on door and window schedules by creating dynamic

51
schedules that update automatically as changes are made. It can be used to
provide analysis such as daylighting and energy usage simulations, and to aid
the design, cost estimating, and decision making for building systems.
GSA realized direct benefits to their pilot projects. These included a 19 percent
reduction in the construction schedule duration, improvement in as-built
documentation, early discovery of design errors and omissions, and improvement
in the means of communication with tenant agencies and during pre-bidding
conferences.8 As team members obtain access to all changes being made in
real time, the transformation of information sharing will be realized, and
information created in programming will be carried throughout subsequent
phases.
Working in a Collaborative Environment
As the industry embraces the use of BIM, and team members have access to
information and changes in real time, project teams will need to collaborate to
work in the best interests of the project. The Integrated Project Delivery requires
close cooperation among team members, and aligns “participant success to
project success.”9 The focus by team members will shift form individual
expectations to “collectively achieving shared goals.”10
Assumptions and Recommendations
Approach
Chris Pechacek of Parsons Corporation, an engineering and construction firm
recommends starting at the end and working towards the beginning of a project
(as is done by constructors with Reverse Phase Scheduling) to identify what is
needed, from whom it is needed and when it is needed.11 Rather than going to
the end of a building’s life at the de-commissioning phase, the assumptions in
this thesis are based on working backwards from the Schematic Design and
Design Development Phases, and determining what information should be
passed onto the Design Architect from the Program Architect. Although the
approach used in this thesis was developed using Reverse Phase Scheduling
52
concepts beginning at the design phase, the assumptions are introduced in
project sequence beginning with the information the University may provide to
the Program Architect at the project initiation.
Project Initiation – Need and Vision Statement
For universities within the CSU system, project need is based on the projected
number of additional full-time equivalent (FTE) students and the resulting
requirement for the additional square footage (Table 2). To begin defining the
project scope, a vision for the project is developed by the Dean working in
concert with the Provost, or the Department Head working in concert with the
Vice-President, and is presented as a Vision Statement. Both the Dean and the
Department Head typically involve a committee to collaborate and develop the
vision as the project idea originates. With the vision statement ready, the
University hires a Program Architect to develop the programming and feasibility
study. The criteria given to the potential Program Architects includes the Vision
Statement, the FTE number, the approximate size and the anticipated CSU
construction budget. Additional information is provided once a Program Architect
is selected and programming begins.
University to Program Architect
At initiation of the programming and feasibility study, the University provides site,
topographical and utility maps, surveys, existing building plans and
specifications, and campus and CSU standards to the Program Architect. This
information is available in various forms, including on-line as pdf and AutoCAD
files, and in electronic and hard copy for programming, planning, building
consideration and analysis and is used by the Program Architect to define site
and building options and constraints. (Table 12)

53
Table 12. List of Information Provided by Cal Poly to Program Architect
Information On-line PDF AutoCAD Word Excel
Hard Copy
Campus Master Plan ● ● ●
Existing Buildings Plans & Specs ● ● ● ●
Site Utility Maps ● ● ●
Room Data Sheets Layout ●
Existing Buildings Area ●
Existing Buildings Usage ●
CSU Program Summary Spreadsheet Format ●
Campus Standards ● ●
FTEs to accommodate ● ●
CSU Building Design Standards ● ●
Source: Data from interview with Rex Wolf, Facility Services, California Polytechnic State University, 9 December 2008.
Considering the information that will be developed and the formats most likely to
be utilized, three recommendations are provided to the University. When
information can be developed in an alternate format more compatible to a BIM,
an alternate is given.
Recommendation #1 – Improve upon the information received from others and
provided to the Program Architect.
It would be beneficial for information to be in an open standard, such as IFC
format, so that it can be accessed by the Project Team. In the interim, continue
to provide the information in its original software file configuration. For example,
if the Campus Utility Plan maps are available in AutoCAD, continue to allow the
Program Architect access to the files for utilization of the information without
54
having to recreate it. This same desire would apply to other maps and building
information.
Better yet, if the information could be provided in a parametric, 3-dimension
format, such as GIS* or Revit,† then the underground depth and relationship to
other utilities could be established resulting in more accurate analysis, scope and
cost estimate. According to Rex Wolf in Facility Services at Cal Poly, the
University currently has no plans to research and document underground utility
data into a 3-D model, but would accept the information as it is developed and
submitted for campus projects. The University should require their consultants to
provide project information in a parametric 3-D format on future projects.
Recommendation #2 – Develop “Basic Assumption Models.”
Many of the building spaces required by the University are standardized for size,
material, equipment and furniture. It would be beneficial to Program Architects to
be able to receive space-type information in the form of “Basic Assumption
Models”12 rather than requiring each firm to create these. Presently at conclusion
of programming, this information is provided to the University in a non editable
format and cannot be changed except by the originating firm (Figure 13).
*Geographic Information System that integrates hardware, software, and data of
geographically referenced information. Refer to Glossary for further information. †Building design software for building information modeling. Refer to Glossary for further
information.

55
Figure 13. Room Data Sheet. Source: Data from Killefer Flammang “Program.” Page 189.

56
The University should require the Program Architect to provide Room Data Sheet
information in a configuration that will become part of the data base to be reused
and revised as the project progresses (Figure 14). If the Basic Assumption
Models were incorporated into a campus project data base, then it would be
available for use whenever the need arose. To initiate creation of this endeavor,
Cal Poly should develop a format for 3-D and non-3-D parts of the room data
sheets that would make utilization and sharing of the information easier. As
Onuma suggests, the owner “instead of having a whole stack of Excel files or
documents, and saying here’s the project we are thinking of doing, actually hand
them a BIM data file saying here’s all the pieces that we are considering using.”13
The benefit to the University would be that the Program Architect could spend
more time on developing and analyzing options, and less time on producing
standard, seldom changing information.
Figure 14. Basic Assumption Model - Data Base with Room Data Sheet Information. Source: Clip Art from Microsoft Office 2003.
Recommendation #3 – Provide CSU CPDC Forms to the Program Architect, and
develop innovative ways to extract and present the information using BIM.
Until the CSU Campus Planning, Design and Construction (CPDC) begins to
implement BIM in capital planning, the forms required for inclusion in the Capital

57
Outlay Program should be added to the list of information provided to the
Program Architect (Table 13). This would guide the Program Architect in the
type of information needed by the University, and make the information provided
by the campus to the CSU easier to extract.
Table 13. List of CSU CPDC Forms to Provide to Program Architect
CPDC Form Name Form # Purpose
Benefit to Program Architect
Benefit to
Cal Poly
COBCP Project Description
1-4 Summary of proposal for Capital Outlay Program, including alternatives, recommended solutions, consistency with State AB 857 and AB 32
Information to analyze and develop
Information required of University for submittal to CSU for project approval and funding allocation
Summary of Space Requirements for a Building
2-4 List of spaces proposed by project, description, type, size, stations, FTEs
Use to develop program
Information required of University for submittal
Room Specifications
2-6 Room Data Sheets; program on a room by room basis
Format required by University
Information presented in a reusable format
Summary of Component Costs
2-7.5 Summary of Project Costs Define UniFormat level and components for cost estimate summary
Eliminate need for translating information into CSU format
Energy & Utilities Planning Checklist
2-8 Questions and issues to address prior to submitting project to CSU
Checklist of information to consider and provide University
Information required of University for submittal
Information Technology Planning Sheet
2-8.5 Provides guidance crucial to the design and implementation of cable system interface
List of information to consider, develop and provide University
Information required of University for submittal
Equipment List 2-23 List and estimated cost of Group II Equipment
Information to be included on Room Data Sheets
Development of Group II equipment lists
Source: The California State University, “Major Capital Outlay Forms,” http://www.calstate.edu/cpdc/Facilities_Planning/majorcapoutlay.shtml (assessed 08 December 2008).
The next level up would be to put this information into the BIM, and extract it in a
format compatible with the CSU Forms. Also, CSU may want to consider
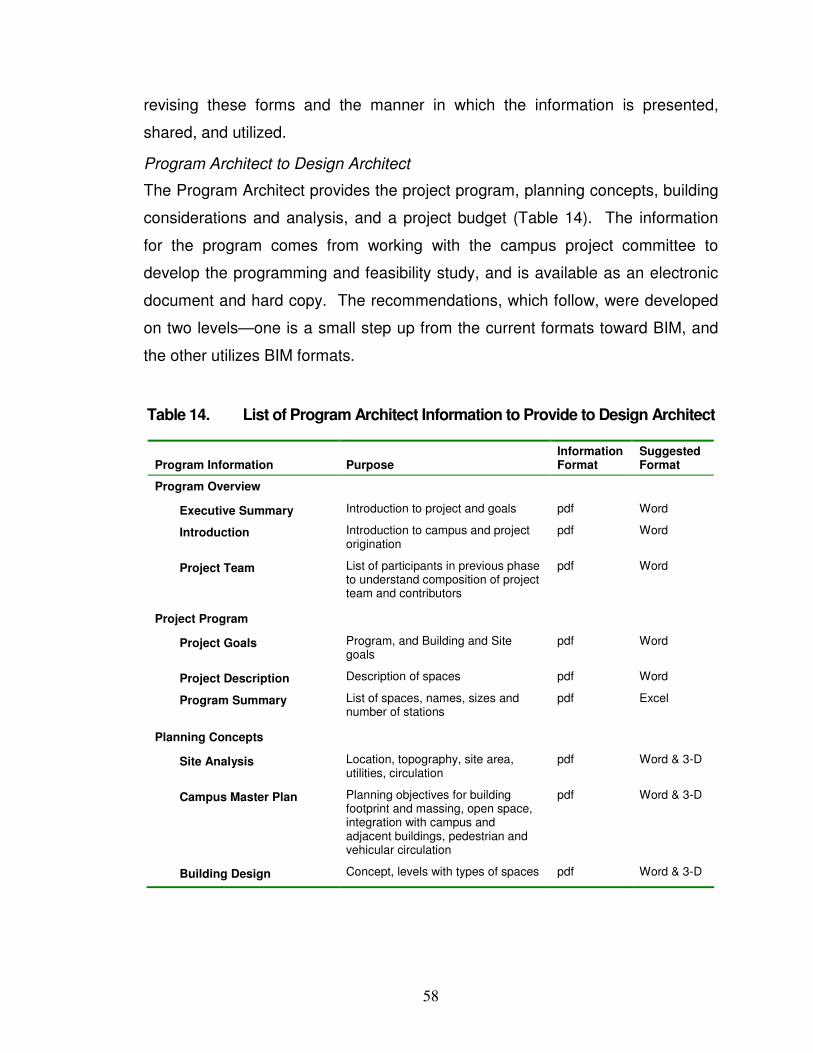
58
revising these forms and the manner in which the information is presented,
shared, and utilized.
Program Architect to Design Architect
The Program Architect provides the project program, planning concepts, building
considerations and analysis, and a project budget (Table 14). The information
for the program comes from working with the campus project committee to
develop the programming and feasibility study, and is available as an electronic
document and hard copy. The recommendations, which follow, were developed
on two levels—one is a small step up from the current formats toward BIM, and
the other utilizes BIM formats.
Table 14. List of Program Architect Information to Provide to Design Architect
Program Information Purpose Information Format
Suggested Format
Program Overview
Executive Summary Introduction to project and goals pdf Word
Introduction Introduction to campus and project origination
pdf Word
Project Team List of participants in previous phase to understand composition of project team and contributors
pdf Word
Project Program
Project Goals Program, and Building and Site goals
pdf Word
Project Description Description of spaces pdf Word
Program Summary List of spaces, names, sizes and number of stations
pdf Excel
Planning Concepts
Site Analysis Location, topography, site area, utilities, circulation
pdf Word & 3-D
Campus Master Plan Planning objectives for building footprint and massing, open space, integration with campus and adjacent buildings, pedestrian and vehicular circulation
pdf Word & 3-D
Building Design Concept, levels with types of spaces pdf Word & 3-D

59
Program Information Purpose Information Format
Suggested Format
Building Considerations & Analysis
Codes & Standards Applicable codes, requirements and standards
pdf Word & 3-D
Architectural Basis of Design
Organizational Concept and massing, modular planning and feasibility, orientation, materials, exterior, interior, and technology infrastructure and equipment
pdf Word & 3-D
Construction Phasing Issues to be addressed during construction
pdf Word & Scheduling
Sustainability CSU requirements, site considerations, water efficiency, materials and resources, energy and Atmosphere, LEED checklist
pdf Word & Excel
Landscape Basis of Design
Functional requirements, master plan goals
pdf Word & 3-D
Site Utilities District Heating and Cooling, storm water drainage, fire hydrants, gas, sewer, water, telecommunications, street lights, SCADA fiberoptic
pdf Word & 3-D
Structural Basis of Design Existing structural systems, building materials, condition
Word & Structural Analysis
Mechanical Basis of Design
Passive strategies, energy efficiency, occupant comfort
pdf Word & Mechanical Analysis
Plumbing & Fire Protection Basis of Design
Domestic water service, sanitary drainage and vent systems, storm water, fire protection, LEED criteria and sustainability
pdf Word & Plumbing Analysis
Electrical Basis of Design Electrical system description, distribution equipment, minimum bus sizes, feeder size, method of distribution, grounding, receptacle power, electrical associated with mechanical and plumbing, general lighting, telecommunication system, fire alarm system and LEED criteria and sustainability
pdf Word & Electrical Analysis
Project Budget
Cost Basis of Design Cost estimate, inclusions and exclusions, market conditions
pdf Word & Excel
Other Information
Room Data Sheets Size, occupants, systems, equipment and furnishings
pdf 3-D & Excel
Work Session Agendas & Meeting Minutes
Information from Programming sessions
pdf Word
Source: Data adapted from Killefer Flammang “Program.”

60
Recommendation #1 – Receive information from consultants in the original
software format.
Cal Poly should require programming and feasibility information be delivered in
the software formats in which it was developed and assembled. Information in its
original format can be shared with others saving the time required to input
information into a software program, and may possibly be transferred to other
software applications without degradation of the information. This is a small step
up from the electronic non editable files, and is noted under “Suggested Format”
in Table 14.
Recommendation #2 – Acquire and utilize a web-based planning program as the
repository of information for all phases of the campus projects to aid in
developing a collaborative environment.
Cal Poly should establish a goal of developing a collaborative project work
environment where an open standard is required, information is stored in a Web-
accessible data base (repository of information), and systems are able to talk to
each other. According to Kimon Onuma, it is not realistic to “imagine building a
Revit model and all its connections.” He further notes that many owners “have
their own data base of how they configure and operate,” but with “an open
standard you can start creating systems that talk to each other,” handle “complex
interconnections,” and eliminate many errors and disconnects.14
The University should acquire and begin utilizing a web-based software program,
such as Onuma Planning Systems (OPS) with an open standard system, that
allows users to interact via the Internet, to populate BIM designs with data from
simple programs such as Excel and Google Earth, and to contribute designs and
information from many different software types integrating it all into a building
modeling format.
Firms such as Onuma Inc. have created a specialized business developing tools
and engines focusing on helping the owner analyze operational requirements,
and perform preliminary analysis before initiating a project. Tools that provide for
early planning help the owner make decisions sooner. For instance, the owner
61
may analyze operational requirements and develop potential options before
deciding to hire a Program Architect.15
Onuma sees architects getting involved with the owner much earlier in a project
to provide another perspective instead of reacting to what the owner wants. He
notes that:
Some owners are looking at ways to change how they even request information from the architects. So instead of having a whole stack of Excel files, or documents, and saying here’s the project we are thinking of doing, actually hand them a BIM data file saying here’s all the pieces that we’re considering using. Provide your planning part . . . back to us in this format.16
This repository of information would not be the actual design, estimating,
scheduling and analysis software needed to plan, design, construct, maintain and
occupy a campus facility. That would still reside with the various project team
members. However, the information created by each team member would be
added to the repository as the project progresses. In the interim, Cal Poly would
need to require the files in their software vendor format, and encourage the use
of IFC format software.
Recommendation #3 – Provide, add to and maintain information for all campus
buildings and projects in a web-accessible BIM data base.
To improve upon the information provided by the Program Architect to pass onto
the Design Architect, it would be beneficial for the information to be in BIM in its
original software configuration so that it can be accessed by the Design Team.
For example, if the utility maps were provided in a Revit file, it would be easier for
the Design Architect to add to the information. This same desire would apply to
the room data sheets and cost estimates. Better yet, if the software utilized could
be provided in IFC format, then the information added by the Program Architect
would be more accurate and save time that could be devoted to analysis of
options and systems. As the project repository of information (BIM) continues to
grow, the team members would have access to continue to utilize and add to it
(Figure15).

62
Figure 15. Repository of Information, or BIM. Sources: Concept by Author, and Clip Art from Microsoft Office 2003.
When Brent Pilgrim of Beck Technology, an integrated (design and construction)
project services firm, begins the conceptual phase, the team members
collaborate to prepare a macro-BIM cost model. Together they visualize and
document assumptions about the project. While one can expect the assumptions
to change later on, project team members know the assumptions, and the project
costing can easily be prepared in-line with those assumptions. As the
assumptions change, the costs are adjusted.17
Beck Technology has used DProfiler, a conceptual cost estimating BIM
application, for the last three years to visualize, estimate and communicate the
project information. The costs are so heavily involved in a project that rarely do
they have a budget problem.18 Tools such as DProfiler in IFC format would allow
analysis of building systems, costing (4-D), and construction phasing (5-D) in a
more efficient manner saving time and money for all members of the project
team.
63
Recommendation #4 – Clearly define the methods and BIM deliverables.
To encourage the implementation of BIM on projects, a list of specific methods
and deliverables should be identified and included in the agreements with the
Program Architect, Design Architect, and Contractor, including:
1) a requirement to utilize the Integrated Project Delivery approach outlined by the American Institutes of Architects, or the Lean Construction principles used by many construction firms; 19
2) the software to be utilized by each participant; and
3) a specific list of deliverables.
Rather than asking what BIM capacity a firm has in-house and its number of BIM
stations (as is done in the CSU Application for Architectural Prequalification), Cal
Poly should take a more active role and clearly define the BIM deliverables
desired by the University. Cal Poly should also require that the firms use an
integrated project team approach and successfully demonstrate how the software
is utilized in developing a project.
1Brent Pilgrim, telephone interview by author, (26 November 2008).
2Dane Dodd-Hansen, telephone interview by author, (21 November 2008).
3Dodd-Hansen.
4Kimon Onuma, telephone interview by author, (22 November 2008).
5Charles Matta, and Calvin Kam, “The GSA’s BIM Pilot Program,”
http://www.aia.org/SiteObjects/files/gsa.pdf (accessed 16 December 2008).
6Matta and Kam.
7Matta and Kam.
8Matta and Kam.
9AIA National / AIA California Council, Integrated Project Delivery: A Guide, version 1, (The
American Institute of Architects, 2007), 7.
10AIA IPD, 7.
11Christopher Pechacek, telephone interview by author, (26 November 2008).
12Pechacek.
13Onuma.
14Onuma.
15Onuma.
16Onuma.

64
17
Pilgrim.
18Pilgrim.
19AIA IPD, Appendix-Glossary.

65
CHAPTER 4
Results
Summary
Future of Industry
As experts from architects to contractors weigh in with their opinions, each view
BIM as the future of the industry with its advantages and challenges through a
different lens. For each, BIM offers increasing analysis and accuracy with
efficiencies in time and costs.
Kimon Onuma believes that the construction-side of the industry has been ahead
in the use of BIM and in more advanced ways because it affects their bottom line.
BIM use has been greatly project-focused with collision detection and highly
detailed models.
Chris Pechacek believes that the industry members are dissimilar in
implementing and using BIM, and sums up the progress thus far:
I think that the subcontractors are leading it. The general contractors are half a step behind. The structural engineers on the design team are much further ahead than the architects. The owners desire it; they want it; they don’t understand it. . . . Hopefully, we have a snowball that is heading down the mountain.1
Brent Pilgrim predicts that within the next five years the industry will make huge
steps forward to being better and more efficient because of BIM tools. His
assumptions are based on the adaption rate by architecture firms and other
industry firms to the use of Revit, and the suite of products interacting with other
products. For instance, he points to Navisworks’ benefits and value currently
seen by team members during the construction phase. Navisworks allows for
viewing 3-D models, simulating 4-D construction schedule, and clash detection.
He anticipates that BIM tools will be the standard in the industry, and in five to
ten years, this will translate to a data model that will be used for facilities
management as well.2

66
Advantages
Beck Technology is using BIM as a building 3-D communication tool to pull
everybody to the same start.3 When Beck begins a project at the conceptual
phase, the architecture and construction groups meet and perform a macro-BIM
cost model as the project is visualized and communicated to everyone.4
Onuma, Inc. is able to offer owners a web-based space, building and project
management tool to aid in programming and quick analysis of potential projects.
This tool can be used throughout the project as a way to gather, contribute and
share project information. Sharing data among users is seen as one of the major
benefits of BIM.
BIM is being widely adopted in the construction industry. The McGraw-Hill
reports that “over 50% of each survey segment—architect, engineers,
contractors, and owners—[are] utilizing the tools at moderate levels or higher.”5
Those tracking their return on investment have see improvements of 100 percent
to 1000 percent. Contractors in the two case studies conducted by McGraw-Hill
have seen a return on investment of 300 to 500 percent. As firms become more
experienced with the use of BIM data, they are more able to leverage data
analysis and improve upon their bottom line.
Challenges
Kimon Onuma states that the biggest challenge is the “cultural shift.” For
example, he notes:
You can have a system that works right before your eyes, but the biggest resistance that you have is entrenched ways of doing things. If a company or group [has been] doing things a certain way for the last 30 years and they are making money . . . I see great resistance.6
Onuma explains that the resistance exists because the perception is that it will
cut into the company’s contract and profit even when shown that a change will
take one-tenth the time. He gives this observation from his experience in
encouraging others to embrace BIM:

67
It’s more advantageous for that group to keep doing it inefficiently because that’s tied to people working on it and putting hours into it. That goes all the way through contracting and everything. So there is a lot of confusion when these new technologies come around to wanting to make that shift. You can’t do it half way. If you start doing things half here and half there, it sometimes works, but if you don’t have buy-in from the top down, it doesn’t work.7
People tend to be focused on producing drawings rather than the information in
BIM. Kimon Onuma acknowledges that firms are often “document focused,” and
even though his firm focuses on the project, they also focus on the system where
he sees immense opportunities.8 There are Architects who want to become
more competitive and efficient internally, and offer clients a different, new
specialty based on BIM tools.
Chris Pechacek believes that the biggest winners would be the facility managers,
but BIM applications for operating and maintaining facilities are deficient:
I think the injustice is that the facilities management applications have not kept up. So when you look at what is the biggest benefit of having all this information and knowledge, it is for the owners to be able to use that [BIM] to manage their facilities. Currently, owners can do portfolio and asset property management, but not much more software is available.9
Initial costs and learning curves may be drawbacks to design firms and this has
been the reason most have been slow to adopt software programs such as Revit
and ArchiCAD observes Dane Dodd-Hansen. While contractors can save time
and money right away, design firms won’t see the results for a while.10
When architects are busy, they don’t have time to try new software and adopt
new project processes and procedures. Many times in the past, Onuma has tried
to get architects interested in working with BIM and OPS, but are told “we don’t
have the time to even consider this.”11
In a survey of architects, engineers, contractors and owners conducted between
June 18 and August 8, 2008, by McGraw-Hill Construction, challenges to
adoption of BIM included training, costs of software and hardware, staff buy-in
and other factors of less frequent concern, such as lack of external incentives,
potential risk of losing intellectual property, and liability issues.12

68
Significance for Cal Poly and the CSU
Cal Poly and the CSU should not wait for BIM to become the industry standard
and should take a major role in developing ways to incorporate it now. Onuma,
Inc. has been using BIM for years to produce the construction documents their
way without telling their clients and consultants. Kimon Onuma explains their
approach:
We have to identify where all the stake holders have comfort; what their comfort levels [are] with working with the technology, and not push it too far; take baby steps. You can be ahead of the curve by using new processes and new tools that they are not even aware of.13
The University is already using BIM and also may not be aware of it. Cal Poly
maintains Excel spreadsheets populated with space data, including size and
function. Information for the newer buildings is available in CAD files, while older
building plans have been scanned and are available in electronic format. Cal
Poly also has Campus Standards in electronic format for use by project
managers and consultants. This is all information appropriate for BIM. Cal Poly
and its consultants share information by posting on a website. Cost estimates
and project budgets are produced and shared electronically.
The next step for Cal Poly is to begin collecting all this building information into a
database where it can be easily accessed, updated and shared as a project
progresses. BIM is not Revit or ArchiCAD; it is so much more. It is all the project
information from conception through decommissioning. It is the “Building
Information Model.”
Advice for Future Study
Rocks and Boulders
BIM is less about software and more about process. To fully understand the
Building Information Model is at best a difficult endeavor. However, one can
begin by looking at obstacles and create a plan to conquer each one. Chris
Pechacek recommends defining what is of value for a project, and using BIM to
eliminate disconnects.14 For instance, on the Center for Science the architect

69
was not filling in the gaps for the cost estimators who were forced into making
assumptions about the materials and systems. Evaluating the obstacles that
prevented the architect from filling in the gaps sooner would be beneficial to the
design process. In conquering the constraints on a project, Pechacek suggests
getting the big rocks out of the way first and cautions to watch for the small rocks
as one will usually “trip over the small rocks” while avoiding “the boulders.”15
Study Areas
Building information modeling is still a new approach for the construction
industry. It is driving changes in how people work, and opening up opportunities
for every aspect of the building planning, design, construction, facility
management and deconstruction. Each segment of the industry will benefit in
numerous ways from BIM. Its potential is only beginning to be explored and
promises to be vast. The following recommendations for areas of further study
are based on concerns being raised in the industry in implementing building
information modeling.
Role of Educators at Colleges and Universities
How are colleges and universities preparing students for a future of BIM? What
role should they play, and what is the best way to prepare future graduates?
Industry Standards
What industry standards are being developed to enable the industry to work with
BIM? Are there additional areas not yet covered such as sustainability?
Changes to Owner-Architect-Contractor Agreements
What changes are industry organizations and building owners recommending?
Owners should determine and make their BIM needs a part of the agreement.
Architects, consultants, contractors, subcontractors and suppliers each will have
BIM needs, and industry organizations, such as American General Contractors
(AGC) and AIA, have already begun making recommendations.
Overcoming Obstacles to BIM

70
How are organizations overcoming the obstacles in the implementation of BIM?
What difficulties have they encountered, and how can others build upon the
successes?
Implementing Lean Principles for Planning and Feasibility Studies
What benefits can be derived for Planning and Feasibility from studying and
implementing Lean Principles?
Conclusion
During the one year time period spent researching BIM for this thesis, its
potential impacts on the future of the construction industry, and how Cal Poly and
CSU might begin to take advantage of it, the BIM movement has been gathering
momentum. As this thesis was being finalized, CSI issued an announcement on
their website that McGraw-Hill Construction had just released a report showing
the growing enthusiasm and potential for intensify usage in 2009 of BIM. This
statement from the CSI announcement succinctly states the direction of the
construction industry:
“Users plan to significantly increase their investment in BIM in 2009 to realize greater productivity, improved communications, and a competitive edge.”16
CSU and Cal Poly have an opportunity to begin shaping the use of BIM for
university projects. Rather than waiting to see what firms can offer in relationship
to BIM, Cal Poly should take the approach of determining the information needed
to program, design, construct, operate and maintain buildings on the campus in a
BIM format, and include the requirements for consultants in their contracts.
Program architects should provide information needed by campus, the CSU and
the design architect to meet the campus needs. The design architect should
provide information needed by the contractor to construct a facility; and finally,
the contractor should provide information needed by the campus to operate and
maintain a facility.
As the construction industry moves toward integrated project development,
campus planning, design and construction will change rapidly. The opportunities

71
for utilization of BIM continue to increase as the industry realizes additional
facets and benefits of the information aspects, the “I” for Information in BIM.
1Christopher Pechacek, telephone interview by author, (26 November 2008).
2Brent Pilgrim, telephone interview by author, (26 November 2008).
3Pilgrim.
4Pilgrim.
5McGraw-Hill Construction, “SmartMarket Report on Building Information Modeling:
Transforming Design and Construction to Achieve Greater Industry Productivity,” (McGraw-Hill Construction, 2008) http://www.csinet.org/s_csi/sec.asp?TRACKID=&CID=30&DID=16527 (accessed 17 December 2008), 2
6 Kimon Onuma, telephone interview by author, (22 November 2008).
7 Onuma.
8Onuma.
9Pechacek.
10Dane Dodd-Hansen, telephone interview by author, (21 November 2008).
11Onuma.
12McGraw-Hill, 9.
13Onuma.
14Pechacek.
15Pechacek.
16The Construction Specifications Institute, “BIM Report Shows Growing Demand for Digital
Models Training,” http://www.csinet.org/s_csi/sec.asp?TRACKID=&CID=2473&DID=16527 (accessed 17 December 2008).

72

73
BIBLIOGRAPHY
AIA National / AIA California Council. Integrated Project Delivery: A Guide, version 1. The American Institute of Architects, 2007.
Anderson, Eric and Mark Wagner. “Is the A/E/C industry ready for process reform?” DJC.COM (October 25, 2007). http://www.djc.com/news/ae/ 11194203.html (accessed 5 February 2008).
Beck Technology. “Examples – Two Alliance Center.” http://www.beck-technology.com/examples.asp (accessed 6 January 2009).
“BIM adoption accelerating, owners study finds.” Building Design and Construction (13 November 2007). http://www.bdcnetwork.com/article/CA6500734.html (accessed11 December 2007).
California Polytechnic State University. “Request for Proposal – Construction Manager at Risk with Guaranteed Maximum Price – Center for Science RFP MAJ 06-310, Article B – Information for Proposers.” 15 January 2007.
The California State University. “Calculation of Space Requirements for Instructional Projects, Form CPDC 2-3,” under “Major Capital Outlay Forms,” http://www.calstate.edu/cpdc/Facilities_Planning/forms.shtml (accessed 27 May 2008).
---. “Major Capital Outlay Forms.” http://www.calstate.edu/cpdc/ Facilities_Planning/majorcapoutlay.shtml (accessed 8 December 2008).
---. “State University Administrative Manual (SUAM).” http://www.calstate.edu/ CPDC/SUAM/ (accessed 13 May 2008).
---. “SUAM, Section I – Capital Outlay and Public Works Contracts, Sections 9000-9004.” (Rev 11.02) http://www.calstate.edu/CPDC/SUAM/ SUAM9000-9004.pdf (accessed 13 May 2008).
---. “SUAM, Section II – Physical Master Plan and Off-Campus Centers, Sections 9007-9014.” (Rev 10.02) http://www.calstate.edu/CPDC/SUAM/ SUAM9007-9014.pdf (accessed 13 May 2008).
---. “SUAM, Section III – Land Use Planning and Environmental Review, Sections 9015-9020.” (Rev 9.06) http://www.calstate.edu/CPDC/SUAM/ SUAM9015-9020.pdf (accessed 13 May 2008).
---. “SUAM, Section IV: Fiscal Resources for Campus Development, Section 9025-9040.” (Rev 12.02) http://www.calstate.edu/CPDC/SUAM/ SUAM9025-9040.pdf (accessed 13 May 2008).
---. “SUAM, Section V: Measurement Devices for Physical Planning, Sections 9045-9050.” (Rev 12.02) Online. Internet. http://www.calstate.edu/ CPDC/SUAM/SUAM9045-9050.pdf (accessed 13 May 2008).

74
---. “SUAM, Section VI: Standards for Campus Development Programs, Sections 9060-9079.” (Rev 12.02) http://www.calstate.edu/CPDC/SUAM/ SUAM9060-9079.pdf (accessed 13 May 2008).
---. “SUAM, Section VII: Five-Year Capital Improvement Program Procedures and Formats for Capital Outlay Submission, Sections 9100-9114.” (Rev 4.03) http://www.calstate.edu/CPDC/SUAM/SUAM9100-9114.pdf (accessed 13 May 2008).
---. “SUAM, Section IX: Energy Conservation and Utilities Management, Section 9170.” (Rev 4.02) http://www.calstate.edu/CPDC/SUAM/ SUAM9170.pdf (accessed 13 May 2008).
---. “SUAM, Section X: Professional Services For Campus Development Public Works-Related Service Agreements, Sections 9200-9212.” (Rev 07.06) http://www.calstate.edu/CPDC/SUAM/SUAM9200-9212.pdf (accessed 13 May 2008).
---. “SUAM, Section XI: Project Plan Development for Major Capital construction Projects, Sections 9230-9237.” (Rev 5.04) http://www.calstate.edu/CPDC/ SUAM/SUAM9200-9212.pdf (accessed 13 May 2008).
---. “SUAM, Appendix B: Facilities Planning.” http://www.calstate.edu/cpdc/suam/ Appendices/Appendix_B.shtml (accessed 20 May 2008).
Capital Outlay Budget Change Proposal, Cal Poly, San Luis Obispo. 2002/03 State and Non-State Capital Outlay Program. November 2000.
Capital Outlay Budget Change Proposal, Cal Poly, San Luis Obispo. 2004/05 State and Non-State Capital Outlay Program. November 2003.
Capital Outlay Budget Change Proposal, Cal Poly, San Luis Obispo. 2005/06 State and Non-State Capital Outlay Program. November 2004.
Capital Outlay Budget Change Proposal, Cal Poly, San Luis Obispo. 2006/07 State and Non-State Capital Outlay Program. November 2005.
Capital Outlay Budget Change Proposal, Cal Poly, San Luis Obispo. 2007/08 State and Non-State Capital Outlay Program. November 2006.
Capital Outlay Budget Change Proposal, Cal Poly, San Luis Obispo. 2008/09 State and Non-State Capital Outlay Program. November 2007.
Capital Outlay Budget Change Proposal, Cal Poly, San Luis Obispo. 2009/10 State and Non-State Capital Outlay Program. November 2008.
The Construction Specifications Institute. The Project Resource Manual-CSI Manual of Practice, Fifth Edition. New York: McGraw-Hill, 2005.
---. UniFormat – A Uniform Classification of Construction Systems and Assemblies. The Construction Specifications Institute, Third Printing – January 2000.
75
---. “BIM Report Shows Growing Demand for Digital Models, Training.” http://www.csinet.org/s_csi/sec.asp?TRACKID=&CID=2473&DID=16527 (accessed 17 December 2008).
Fallon, Kristine K. and Mark E. Palmer. General Buildings Information Handover Guide: Principles, Methodology and Case Studies, NISTIR 7417. U.S. Department of Commerce National Institute of Standards and Technology, August 2007.
Frary, I.T. Thomas Jefferson Architect and Builder. Richmond: Garrett and Massie, Incorporated, 1939.
Gilbane. “Schematic Design Estimate – California Polytechnic State University Center for Science and Mathematics, San Luis Obispo, California.” 11 July 2007.
---. “Design Development Estimate – 100 Percent – California Polytechnic State University Center for Science and Mathematics, San Luis Obispo, California.” 29 January 2008.
---. “Construction Documents Estimate - 50 Percent – California Polytechnic State University Center for Science and Mathematics, San Luis Obispo, California.” 25 July 2008.
Harris, Cyril M. Dictionary of Architecture and Construction, 4th ed. New York: McGraw-Hill, 2006.
Jernigan, Finith. BIG BIM little bim. Salisbury: 4Site Press, 2007.
Khemlani, Lachmi. “The IFC Building Model: A Look Under the Hood.” AECbytes (30 March 2004). http://www.aecbytes.com/feature/2004/IFCmodel.html (accessed 13 February 2008).
---. “Top Criteria for BIM Solutions: AECbytes Survey Results.” AECbytes (10 October 2007). http://www.aecbytes.com/feature/2007/BIMSurveyReport.html (accessed 12 October 2007).
Kieran, Stephan, and James Timberlake. Refabricating Architecture: How Manufacturing Methodologies Are Poised to Transform Building Construction. New York: McGraw-Hill, 2004.
Killefer Flammang Architects and Shepley Bulfinch. Academic Center and Library – Programming and Feasibility Study. California Polytechnic State University, San Luis Obispo, 15 October 2008.
Kim, W. Chan, and Renée Mauborgne. Blue Ocean Strategy: How to Create Uncontested Market Space and Make the Competition Irrelevant. Boston: Harvard Business School Press, 2005.
Matta, Charles and Calvin Kam. “The GSA’s BIM Pilot Program.” (2005). http://www.aia.org/SiteObjects/files/gsa.pdf (accessed 16 December 2008).

76
McGraw-Hill Construction. “SmartMarket Report on Building Information Modeling: Transforming Design and Construction to Achieve Greater Industry Productivity.” McGraw-Hill Construction (2008). http://www.csinet.org/s_csi/ sec.asp?TRACKID=&CID=30&DID=16527 (accessed 17 December 2008).
National Institute of Building Sciences (NIBS), Facility Information Council (FIC). National Building Information Modeling Standard, Version 1 – Part 1: Overview, Principles, and Methodologies, 2007.
Onuma, Kimon and Yong Ku Kim. “BIMStorm LAX – Overview and Players’ Perspectives.” (5 February 2008). Webinar.
Onuma, Kimon. Forward. BIG BIM little bim. By Finith Jernigan. BookSurge LLC and Design Atlantic Ltd, 2007.
Peña, William, Steven Parshall, and Kevin Kelly. Problem Seeking: An Architectural Programming Primer, 3rd ed. Washington: AIA Press, 1987.
Prather, Gary. “INSIGHT: Building Information Modeling: The Wave of the Future?” ArchNewsNow.com (18 September 2007). http://www.archnewsnow.com/ features/Feature234.htm (accessed 20 September 2007).
RRM Design Group. The Center for Science: Program Document and Feasibility Study. California Polytechnic State University, San Luis Obispo, October 2006.
Rousseau, Bryant. “The ArchRecord Interview: SOM’s Carl Galioto and Paul Seletsky on BIM.” Architectural Record (2008). http://archrecord. construction.com/features/interviews/0803SOM_BIM/0803_BIM-1.asp (accessed 6 March 2008).
Rundell, Rick. “1-2-3 Revit: BIM and Visualization, Part 1.” Cadalyst AEC (1 July 2007). http://aec.cadalyst.com/aec/Column%3A+1-2-3+Revit/1-2-3-Revit-BIM-and-Visualization-Part- 1/ArticleStandard/Article/detail/438584?context CategoryId=6569 (accessed 26 November 2007).
Tardif, Michael. “Architect Creates Design Synthesis Software.” AIArchitect - The American Institute of Architects, Volume14 (17 August 2007). http://www.aia.org/aiarchitect/thisweek07/0817/0817rc_face.cfm (accessed 18 February 2008).
Thorton Tomasetti. http://www.thorntontomasetti.com/project_delivery.php (accessed 6 January 2009).
Webb, Bailey. “BIM dream becoming a reality.” Atlanta Business Chronicle (10 December 2008). http://www.bizjournals.com/atlanta/stories/2007/07/09/ focus7.html (assessed 10 January 2009).
Yoders, Jeff. “Further Down the Merry Road to BIM.” Building Design and Construction (1 November 2007). http://www.bdcnetwork.com/article/ CA6501465.html (assessed 11 December 2007).

77
APPENDICES
A - Glossary
2-D
A geometric model of an object; a two-dimensional figure on one plane. Often used as components of a 3-D model.
3-D
A geometric model having three dimensions (width, length, and depth).
4-D
Cost estimating information usually tied to a 3-D model.
5-D
Scheduling information usually tied to a 3-D model.
Building Information Model
A Building Information Model, (BIM) is a digital representation of physical and functional characteristics of a facility. As such it serves as a shared knowledge resource for information about a facility forming a reliable basis for decisions during its lifecycle from inception onward. A basis premise of BIM is collaboration by different stakeholders at different phases of the life cycle of a facility to insert, extract, update or modify information in the BIM to support and reflect the roles of that stakeholder. The BIM is a shared digital representation founded on open standards for interoperability.
Construction Documents Phase
Sets forth, in detail, all aspects of project design, function, and construction. Documents are used for estimating the cost of the project, securing bids for its construction, and directing the contractor during the construction period. Documents include detailed construction drawings and materials and building systems specifications.
Reference: http://www.calstate.edu/CPDC/SUAM/SUAM9230-9237.pd, SUAM 9235

78
Cost Model
A breakdown of the construction and project budget into detailed “cost targets.” The construction budget is developed in both a detailed Component(s) based format and a CSI based format based on the project’s goals, detailed program and performance requirements. The cost targets are developed collaboratively by the integrated team prior to commencing the conceptualization phase of the project process. The structure provides the benchmark for the team to support continuous cost management as the project progresses to ensure that it will be completed within the targeted budget.
CSI UniFormat
UniFormat, a publication of CSI and CSC, is the Uniform Classification System for organizing preliminary construction information into a standard order or sequence on the basis of functional elements. Functional elements often referred to as systems or assemblies, are major components common to most buildings that usually perform a given function regardless of the design specifications, construction method, or materials used. UniFormat users can easily understand and compare information since it is linked to a standardized elemental classification structure. The use of UniFormat can provide consistent comparable data across an entire building life cycle. The use of its elemental framework reduces the time and cost of evaluating alternatives in the early design stages of a project, assuring faster and more accurate economic analysis of alternative design decisions.
Website: http://www.csinet.org/s_csi/sec.asp?CID=1379&DID=11342
Design Development Phase
Confirms or adjusts all aspects of the schematic plans (exterior design, mechanical and electrical systems, telecommunications system, structural systems, area arrangements, foundation plans, etc. Documents include plans, outline specifications and cost estimates developed in further detail than schematic documents.
Reference: http://www.calstate.edu/CPDC/SUAM/SUAM9230-9237.pdf, SUAM 9234
DProfiler
DProfiler, developed by Beck Technology, is a macro Building Information Modeling (BIM) program, integrating 3D modeling with conceptual cost estimating, integrated energy analysis, and export capabilities. The platform is aimed at reducing rework due to late-stage design changes.
Website: http://www.beck-technology.com/index.asp

79
GIS
A geographic information system (GIS) integrates hardware, software, and data for capturing, managing, analyzing, and displaying all forms of geographically referenced information. GIS allows for an individual to view, understand, question, interpret, and visualize data in many ways that reveal relationships, patterns, and trends in the form of maps, globes, reports, and charts.
Website: http://www.gis.com/
Integrated Project Coordinator
An individual responsible for overall facilitation, coordination and direction of the integrated team. This role may or may not shift among members of the team depending on delivery model and project phase. Leadership and consensus building skills are critical to this role. In some instances, this role may be filled by an outside party.
Lean Construction
Lean construction is a translation and adaption of lean manufacturing principles and practices to the end-to-end design and construction process. Unlike manufacturing, construction is a project based-production process. Lean construction is concerned with the holistic pursuit of concurrent and continuous improvements in all dimensions of the built and natural environment: design, construction, activation, maintenance, salvaging, and recycling. This approach tries to manage and improve construction processes with minimum cost and maximum value by considering customer needs.
Website: http://en.wikipedia.org/wiki/Lean_Construction
Key Supporting Participant
A person or organization whose contribution is critically necessary to achieve project goals but is not a primary participant.
Integration
The coming together of primary participations (which could include owner, design, constructor, design consultants, and trade contractors, key systems suppliers, etc.) at the beginning of a project, for the purpose of designing and constructing the project together as a team.
Navisworks®
Software from Autodesk® to help control, collaborate and aggregate information on project models for viewing and analyzing digital information. Features allow navigation and exploration of design, identification, inspection, and reporting of potential interferences in a 3-D project model.
Website:http://usa.autodesk.com/adsk/servlet/index?id=10571060&siteID=123112
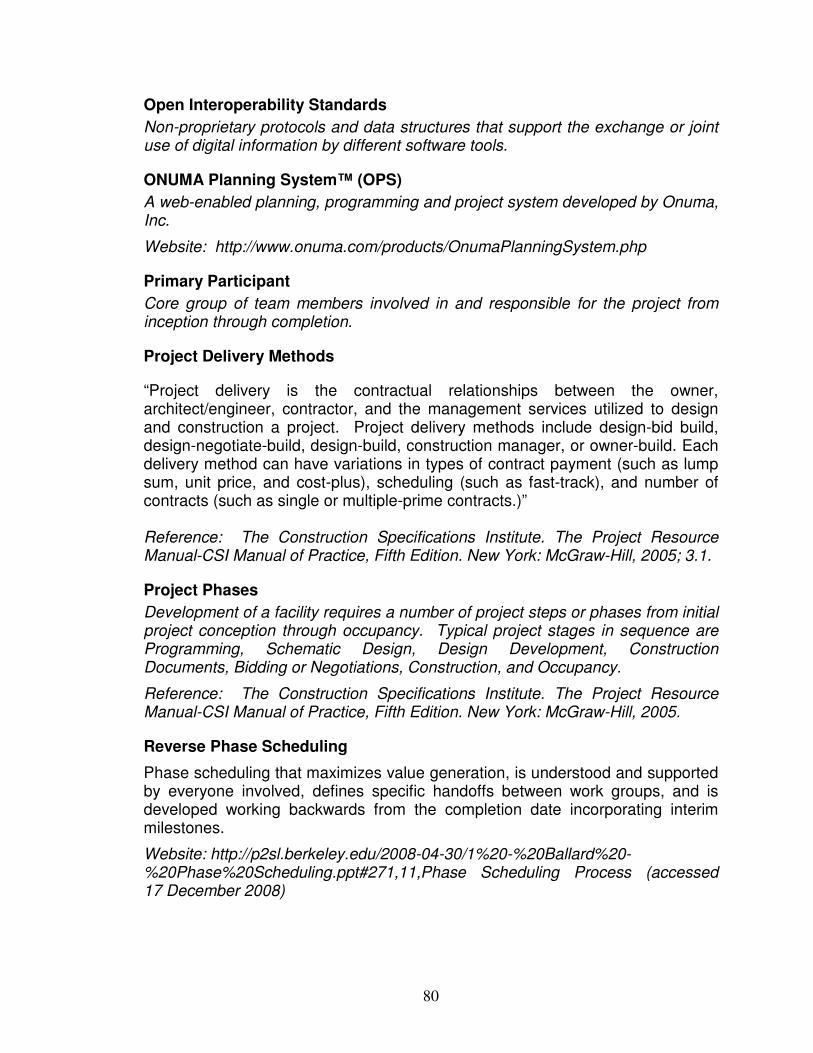
80
Open Interoperability Standards
Non-proprietary protocols and data structures that support the exchange or joint use of digital information by different software tools.
ONUMA Planning System™ (OPS)
A web-enabled planning, programming and project system developed by Onuma, Inc.
Website: http://www.onuma.com/products/OnumaPlanningSystem.php
Primary Participant
Core group of team members involved in and responsible for the project from inception through completion.
Project Delivery Methods
“Project delivery is the contractual relationships between the owner, architect/engineer, contractor, and the management services utilized to design and construction a project. Project delivery methods include design-bid build, design-negotiate-build, design-build, construction manager, or owner-build. Each delivery method can have variations in types of contract payment (such as lump sum, unit price, and cost-plus), scheduling (such as fast-track), and number of contracts (such as single or multiple-prime contracts.)”
Reference: The Construction Specifications Institute. The Project Resource Manual-CSI Manual of Practice, Fifth Edition. New York: McGraw-Hill, 2005; 3.1.
Project Phases
Development of a facility requires a number of project steps or phases from initial project conception through occupancy. Typical project stages in sequence are Programming, Schematic Design, Design Development, Construction Documents, Bidding or Negotiations, Construction, and Occupancy.
Reference: The Construction Specifications Institute. The Project Resource Manual-CSI Manual of Practice, Fifth Edition. New York: McGraw-Hill, 2005.
Reverse Phase Scheduling
Phase scheduling that maximizes value generation, is understood and supported by everyone involved, defines specific handoffs between work groups, and is developed working backwards from the completion date incorporating interim milestones.
Website: http://p2sl.berkeley.edu/2008-04-30/1%20-%20Ballard%20-%20Phase%20Scheduling.ppt#271,11,Phase Scheduling Process (accessed 17 December 2008)

81
Revit®
Building design software for building information modeling (BIM). Changes are automatically coordinated throughout a project. The software allows for quick and easy changes to major compositional elements, to create comprehensive design proposals, and to view ideas on the fly with 3-D views.
Website: http://usa.autodesk.com/adsk/servlet/index?id=3781831&siteID=123112
Schematic Design Phase
Interprets the project requirements to show relationship of the facility to the site, other buildings, and the campus; exterior design of the facility; relationship of interior areas; materials to be used in construction; types of structural, mechanical, electrical, and telecommunication systems to be utilized; construction cost; and life cycle cost analysis. Documents include drawings, outline specifications and cost estimates.
Reference: http://www.calstate.edu/CPDC/SUAM/SUAM9230-9237.pdf SUAM 9233
Solibri
Solibri, Inc. develops and provides software that automates the BIM model checking, design review, analysis and code checking process.
Website: http://www.solibri.com/
Vision Statement
A vision statement outlines what the project wants to be. It concentrates on the future, is a source of inspiration, and provides clear decision-making criteria.

82
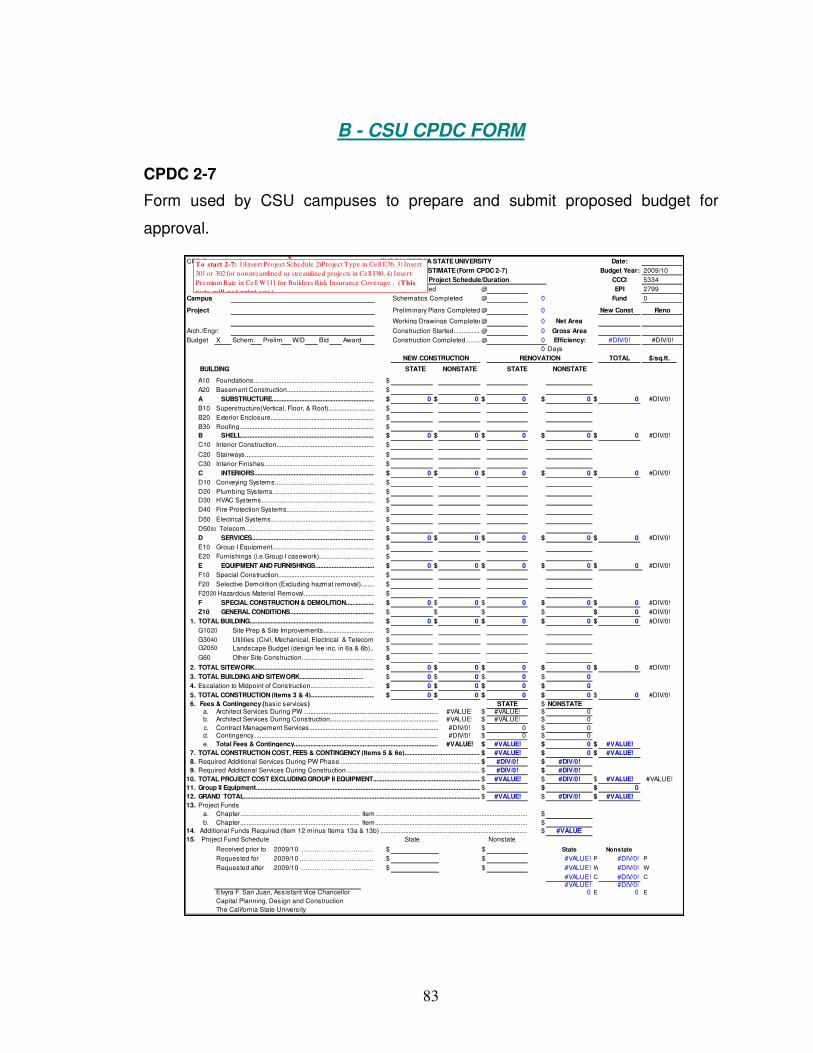
83
B - CSU CPDC FORM
CPDC 2-7
Form used by CSU campuses to prepare and submit proposed budget for
approval.
CPD Project Number THE CALIFORNIA STATE UNIVERSITY Date:
CAPITAL OUTLAY ESTIMATE (Form CPDC 2-7) Budget Year:
CCCI
Project Started @ EPI
Campus Schematics Completed @ 0 Fund 0
Project Preliminary Plans Completed..................................................................................................@ 0 New Const
Working Drawings Completed..............................................................................................@ 0 Net Area
Arch./Engr: Construction Started........................................................................................................@ 0 Gross Area
Budget X Schem. Prelim W/D Bid Award Construction Completed........................................................................................................@ 0 Efficiency: #DIV/0!
0 Days
TOTAL $/sq.ft.
BUILDING STATE NONSTATE STATE NONSTATE
A10 Foundations....................................................................................................................................................................…$
A20 Basement Construction....................................................................................................................................................................…$
A SUBSTRUCTURE....................................................................................................................................................................…$ 0 $ 0 $ 0 $ 0 $ 0 #DIV/0!
B10 Superstructure(Vertical, Floor, & Roof)....................................................................................................................................................................…$
B20 Exterior Enclosure.......................................................................................................................................................................$
B30 Roofing....................................................................................................................................................................…$
B SHELL....................................................................................................................................................................…$ 0 $ 0 $ 0 $ 0 $ 0 #DIV/0!
C10 Interior Construction....................................................................................................................................................................…$
C20 Stairways....................................................................................................................................................................…$
C30 Interior Finishes....................................................................................................................................................................…$
C INTERIORS....................................................................................................................................................................…$ 0 $ 0 $ 0 $ 0 $ 0 #DIV/0!
D10 Conveying Systems....................................................................................................................................................................…$
D20 Plumbing Systems....................................................................................................................................................................…$
D30 HVAC Systems....................................................................................................................................................................…$
D40 Fire Protection Systems....................................................................................................................................................................…$
D50 Electrical Systems....................................................................................................................................................................…$
D5050 Telecom....................................................................................................................................................................…$
D SERVICES....................................................................................................................................................................…$ 0 $ 0 $ 0 $ 0 $ 0 #DIV/0!
E10 Group I Equipment....................................................................................................................................................................…$
E20 Furnishings (i.e.Group I casework)...................................................................................................................................................................…$
E EQUIPMENT AND FURNISHINGS....................................................................................................................................................................…$ 0 $ 0 $ 0 $ 0 $ 0 #DIV/0!
F10 Special Construction....................................................................................................................................................................…$
F20 Selective Demolition (Excluding hazmat removal)....................................................................................................................................................................…$
F2020 Hazardous Material Removal....................................................................................................................................................................…$
F SPECIAL CONSTRUCTION & DEMOLITION....................................................................................................................................................................…$ 0 $ 0 $ 0 $ 0 $ 0 #DIV/0!
Z10 GENERAL CONDITIONS....................................................................................................................................................................…$ $ $ $ $ 0 #DIV/0!
1. TOTAL BUILDING....................................................................................................................................................................…$ 0 $ 0 $ 0 $ 0 $ 0 #DIV/0!
G1020 Site Prep & Site Improvements....................................................................................................................................................................…$
G3040 Utilities (Civil, Mechanical, Electrical & Telecom)....................................................................................................................................................................…$
G2050 Landscape Budget (design fee inc. in 6a & 6b)....................................................................................................................................................................…$
G60 Other Site Construction....................................................................................................................................................................…$
2. TOTAL SITEWORK....................................................................................................................................................................…$ 0 $ 0 $ 0 $ 0 $ 0 #DIV/0!
3. TOTAL BUILDING AND SITEWORK...................................… $ 0 $ 0 $ 0 $ 0
4. Escalation to Midpoint of Construction....................................................................................................................................................................…$ 0 $ 0 $ 0 $ 0
5. TOTAL CONSTRUCTION (Items 3 & 4)....................................................................................................................................................................…$ 0 $ 0 $ 0 $ 0 $ 0 #DIV/0!
6. Fees & Contingency (basic services) STATE $ NONSTATEa. Architect Services During PW ….........................................................................................................................................................................#VALUE! $ #VALUE! $ 0b. Architect Services During Construction.............................................................................................................................#VALUE! $ #VALUE! $ 0
c. Contract Management Services................................................................................................................................................................#DIV/0! $ 0 $ 0d. Contingency....................................................................................................................................................................................................#DIV/0! $ 0 $ 0
e. Total Fees & Contingency...........................................................................................................…#VALUE! $ #VALUE! $ 0 $ #VALUE!
7. TOTAL CONSTRUCTION COST, FEES & CONTINGENCY (Items 5 & 6e).....................................................................................................................................................................................................$ #VALUE! $ 0 $ #VALUE!
8. Required Additional Services During PW Phase....................................................................................................................................................................…$ #DIV/0! $ #DIV/0!
9. Required Additional Services During Construction....................................................................................................................................................................…$ #DIV/0! $ #DIV/0!
10. TOTAL PROJECT COST EXCLUDING GROUP II EQUIPMENT.........................................................................................................................$ #VALUE! $ #DIV/0! $ #VALUE! #VALUE!
11. Group II Equipment................................................................................................................................................................................................................$ $ $ 0
12. GRAND TOTAL....................................................................................................................................................................…$ #VALUE! $ #DIV/0! $ #VALUE!
13. Project Funds
a. Chapter....................................................................................................................................................................…Item......................................................................................................................................................$
b. Chapter....................................................................................................................................................................…Item......................................................................................................................................................$
14. Additional Funds Required (Item 12 minus Items 13a & 13b) ........................................................................................................…$ #VALUE!
15. Project Fund Schedule State Nonstate
Received prior to 2009/10 …………………………… $ $ State Nonstate
Requested for 2009/10 ……………………………. $ $ #VALUE! P #DIV/0! P
Requested after 2009/10 …………………………… $ $ #VALUE! W #DIV/0! W
#VALUE! C #DIV/0! C
#VALUE! #DIV/0!Elvyra F. San Juan, Assistant Vice Chancellor 0 E 0 E
Capital Planning, Design and Construction
The California State University
Project Schedule/Duration
NEW CONSTRUCTION RENOVATION
Reno
2009/10
5334
2799
#DIV/0!
To start 2-7: 1)Insert Project Schedule 2)Project Type in Cell E76. 3) Insert
301 or 302 for nonstreamlined or streamlined projects in Cell F80. 4) Insert
Premium Rate in Cell W111 for Builders Risk Insurance Coverage . (This
note will not print ou t.)