Embed Size (px)
Citation preview

Program / Discipline Assessment Report Program/Discipline: ACCOUNTING Responsibility: Sara Harris
Program/Discipline's Mission Statement: The Accounting Program’s mission is to provide a quality education in accounting within the learning-centered environment of our institution. The Program will strive to help each individual student achieve success in reaching their academic goals by offering a variety of learning opportunities and incorporating current technology. The Program will respond to the community and students’ changing needs for information and facilitate life-long learning by continued assessment of student academic achievement.
Program/Discipline's Assessment History: By using the assessment process as an evaluative technique, how has it previously affected your program's curricula and/or teaching strategies?
Past assessment results indicated students were highly successful in understanding the fundamental concepts of financial accounting, summarizing cost information for reporting and decision making, and using technology as it relates to accounting. Student weaknesses were noted in the area of financial statement analysis, payroll reporting and student abilities in written and oral communication. A financial statement analysis project was added as a requirement of Accounting Principles II to better correlate the topic with the course in which it is more comprehensively covered. In Payroll Accounting, a reallocation of points with increased weighting on preparation of payroll tax forms was adopted to encourage more diligence in completing the forms. Additional times in class on instructions and special sessions for assistance outside the classroom were also added. Students were encouraged to use the “Writing Center” to strengthen written communication skills and faculty are encouraged to added more exercises that involve both written and oral communication skills.
By using the assessment process as an evaluative technique, what changes to student learning have been noted? In 06-07, students improved performance in the area of financial statement analysis. However, weaknesses are still noted within Payroll Accounting and with communication skills.
What unintended consequences, if any, have occurred because of the assessment process? N/A
Who receives information about your department's assessment and why? (Please note if you plan on altering either of these items for the coming year.)
Assessment results are shared with the Accounting Advisory Committee and the Dean to keep them informed of our students’ strengths and weaknesses and solicit suggestions on improving student performance.

Part 1: Previous Academic Year Assessment Summary Previous Academic Year: 2007-08
Outcome #: 1 Outcome Title: Analyze the affects of business transactions on the accounting equation using
the system of debits and credits, journalize and post transactions to general and subsidiary ledgers and make adjusting entries.
Outcome Type (choose by bolding): Discipline/Program; General Ed; Other If General Education outcome (choose by bolding): Communication; Critical Thinking; Quantitative Reasoning; Use of Technology; Diversity and Global Awareness; Leadership and Teamwork
Outcome Description: The outcome encompasses basic accounting fundamentals and includes critical thinking, quantitative reasoning and the use of technology in analyzing business transactions using a computerized project.
Benchmark for success 1) Please specify what percentage of the sample size is expected to meet or exceed your benchmark. 2) What is the rationale for choosing this measure?
100% of the students assessed will score an average of 80% or better on the project. Student survey questions should average a score of 4 or better (out of 5). The students being assessed are completing the A.A.S. Degree in Accounting and the department is striving to ensure the program produces highly skilled, knowledgeable and marketable employees.
Description of assessment process: 1) What assessment methods were used to measure this outcome (i.e. pre/post test, portfolio review, etc.)? 2) How do these methods show students are learning? 3) What frequency is this outcome being measured (i.e.: each semester, yearly, every other year, etc.) and why? 4) How many students made up the sample size?
1) Students were assigned a computerized project, Kitchen Concepts, in Cost Accounting. A graduate student survey was used as a second measure. 2) The project is comprehensive and incorporates all components of outcome #1 and is an outside of the classroom project. Student performance on the project allows us to evaluate student’s grasp of fundamental accounting procedures. The survey allows us to view the student’s perception of the skills they attained. 3) It is measured as often as the Cost Accounting course is offered – usually once a year. The student survey is sent out once a year. 4) 7 projects assessed, only 3 out of 14 students responded to the graduate survey
Results What were the results of the assessment process? (List results for each method, if more than one were used.)
Assessment Outcome #1 - Analyze the affects of
business transactions
Cost Accounting Project
0.0010.0020.0030.0040.0050.0060.0070.0080.0090.00
100.00
Jou
rnal E
ntrie
s
Job
Cos
t Rec
ords
-Dat
es
Job
Cos
t Rec
ords
-Calcu
latio
ns
Job
Cos
t Rec
ords
-Sum
mar
y
Acc
ount
s Pay
able S
ched
ule
Acc
ount
s Rec
eiva
ble
Sch
edule
Adjus
ting
Entrie
s
AY06-07
AY07-08

Student Graduate Survey – Part II Program Graduates
Survey Results
SPECIFIC SKILLS
0
0.5
1
1.5
2
2.5
3
3.5
4
4.5
5
1 2 3 4 5 6 7 8 9 10 11 12
2004-05 AVERAGE
2005-06 AVERAGE
2006-07 AVERAGE
2007-08 AVERAGE
QUESTIONS RELATE TO THE X-AXIS NUMBERS IN THE CHART ABOVE: I have a fundamental knowledge of the following accounting principles:
1. Debits/Credits - Outcome #1 2. Journal Entries - Outcome #1 3. Adjusting Entries - Outcome #1 4. Subsidiary Ledgers - Outcome #1 5. I have the skills to prepare financial statements.
Outcome #2 6. I can calculate financial ratios. Outcome #2 7. I can use the results to analyze financial data.
Outcome #2
8. I gained a better understanding of Payroll Accounting. Outcome #3
9. I gained a better understanding of Income Tax Accounting. Outcome #3
10. I gained a better understanding of Cost accounting principles. Outcome #4
11. I can apply Managerial accounting concepts to decision-making. Outcome #4
12. I was adequately trained in the use of a general ledger software package. Outcome #5
What did the department learn? 1) How did group performance compare to the benchmark? 2) How does the data compare to the previous year, if applicable?
3) If multiple measures were used, how do they compare to each other?
1) Student performance exceeded the benchmark set with the project. 2) Students improved performance on all components measured within the project. 3) Students responding to the survey did not rate themselves as high on these components as
compared to the results from the project. It should be noted, in past years, the survey questions consistently hit a rating of 4 or better and were more consistent with the project results and more students responded to the survey.
Student performance summary 1) Based on the findings, how does the department rate student performance in regards to this outcome (strong, weak, or neutral)? 2) How does this assessment affect plans for this coming year in terms of curricula, teaching strategies, and assessment methods?
1) Past results have shown (including the use of other projects in past years) student performance in regards to this outcome has consistently measured up to the benchmarks.
2) The outcome results change the department plans for the coming year and this outcome will not be measured again for a couple of years. Also, due to the poor response to this year’s survey, the department will evaluate whether to continue sending the survey or possibly sending every other year.

Outcome #: 2 Outcome Title: Prepare financial statements and utilize and calculate financial ratios to
analyze financial performance. Outcome Type (choose by bolding): Discipline/Program; General Ed; Other If General Education outcome (choose by bolding): Communication; Critical Thinking; Quantitative Reasoning; Use of Technology; Diversity and Global Awareness; Leadership and Teamwork
Outcome Description: The outcome measures how financial information is summarized and analyzed. This requires students to not only apply specific (discipline) skills that require quantitative reasoning, but it incorporates critical thinking as well.
Benchmark for success 1) Please specify what percentage of the sample size is expected to meet or exceed your benchmark. 2) What is the rationale for choosing this measure?
100% of the students assessed will score an average of 80% or better on the projects. Student survey questions should average a score of 4 or better (out of 5). The students being assessed are completing the A.A.S. Degree in Accounting and the department is striving to ensure the program produces highly skilled, knowledgeable and marketable employees.
Description of assessment process: 1) What assessment methods were used to measure this outcome (i.e. pre/post test, portfolio review, etc.)? 2) How do these methods show students are learning? 3) What frequency is this outcome being measured (i.e.: each semester, yearly, every other year, etc.) and why? 4) How many students made up the sample size?
1) Computerized project in Cost Accounting, Financial Statement Analysis Project in Accounting Principles II and Graduate Student Surveys.
2) Students are being challenged to complete projects outside of the classroom that incorporate the concepts of reporting and analyzing financial information.
3) Financial reporting is measured in Cost Accounting as often as taught – last year it was one semester. The Financial Statement Analysis Project is required every semester in Accounting Principles II and the graduate survey is once a year.
4) Financial Reporting – 7 Financial Statement Analysis Project – 73 Graduate Student Survey - 3
Results What were the results of the assessment process? (List results for each method, if more than one were used.)
Assessment Outcome #2-Prepare Financial Statements
Cost Accounting Project
85.00%
90.00%
95.00%
100.00%
Income
Statement
Retained
Earnings
Statement
Balance Sheet
AY06-07
AY07-08

Financial Statement Analysis Project
Correct Numerators in Ratio
0.00%
10.00%
20.00%
30.00%
40.00%
50.00%
60.00%
70.00%
80.00%
90.00%
100.00%
Cur
rent
ratio
Acid-
test ra
tio
Acc
ount
s Rec
eiva
ble
turn
over
Day
s' sales
unc
llected
Inve
ntor
y tu
rnov
er
Day
s' sales
in in
vent
ory
Total a
sset
turn
over
Profit M
argin
Ret
urn
on a
sset
s
Ret
urn
on c/s e
quity
Deb
t to
equity ra
tio
Times
inte
rest e
arne
d
Price/
earn
ings
ratio
AY06-07
AY07-08
Financial Statement Analysis Project
Correct Denominators in Ratio
0.00%10.00%20.00%30.00%40.00%50.00%60.00%70.00%80.00%90.00%
100.00%Cur
rent
ratio
Acid-
test
rat
io
Acc
ount
s Rec
eiva
ble
turn
over
Day
s' s
ales
unc
llect
ed
Inve
ntor
y tu
rnov
er
Day
s' s
ales
in in
vent
ory
Tota
l ass
et tu
rnov
er
Pro
fit M
argi
n
Ret
urn
on a
sset
s
Ret
urn
on c
/s e
quity
Deb
t to
equi
ty ra
tio
Tim
es in
tere
st e
arne
d
Pric
e/ea
rnin
gs ra
tio
AY06-07
AY07-08

Mathematical Errors in
Financial Statement Project
39
9 8
0
64
81 0
0
10
20
30
40
50
60
70
No e
rrors
1-2
err
ors
3-4
err
ors
More
than 4
err
ors
AY06-07
AY07-08
Correct Analysis of Ratio Results
80.00%
82.00%
84.00%
86.00%
88.00%
90.00%
92.00%
94.00%
96.00%
98.00%
100.00%
Cur
rent
ratio
Acid-
test ra
tio
Acc
ount
s Rec
eiva
ble
turn
over
Day
s' sales
unc
llected
Inve
ntor
y tu
rnov
er
Day
s' sales
in in
vent
ory
Total a
sset
turn
over
Profit M
argin
Ret
urn
on a
sset
s
Ret
urn
on c/s e
quity
Deb
t to
equity ra
tio
Times
inte
rest e
arne
d
Price/
earn
ings
ratio
Series1
Series2
See chart in Outcome #1 for Graduate Student Survey Results
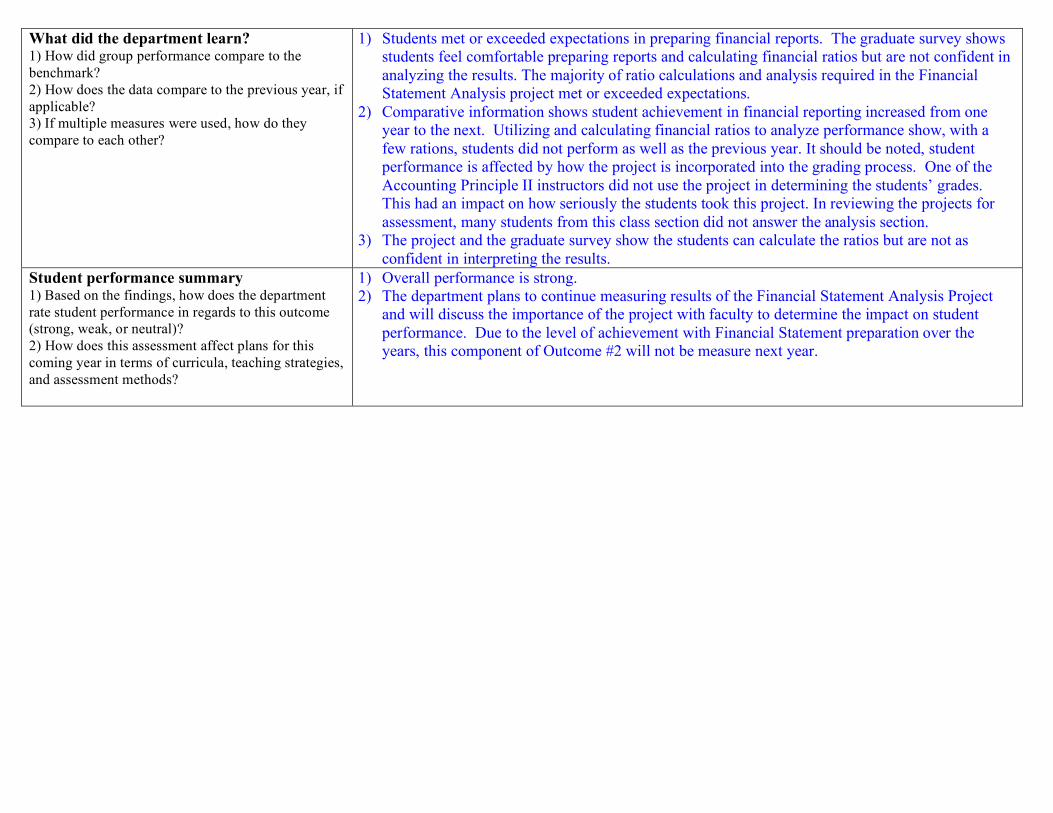
What did the department learn? 1) How did group performance compare to the benchmark? 2) How does the data compare to the previous year, if applicable? 3) If multiple measures were used, how do they compare to each other?
1) Students met or exceeded expectations in preparing financial reports. The graduate survey shows students feel comfortable preparing reports and calculating financial ratios but are not confident in analyzing the results. The majority of ratio calculations and analysis required in the Financial Statement Analysis project met or exceeded expectations.
2) Comparative information shows student achievement in financial reporting increased from one year to the next. Utilizing and calculating financial ratios to analyze performance show, with a few rations, students did not perform as well as the previous year. It should be noted, student performance is affected by how the project is incorporated into the grading process. One of the Accounting Principle II instructors did not use the project in determining the students’ grades. This had an impact on how seriously the students took this project. In reviewing the projects for assessment, many students from this class section did not answer the analysis section.
3) The project and the graduate survey show the students can calculate the ratios but are not as confident in interpreting the results.
Student performance summary 1) Based on the findings, how does the department rate student performance in regards to this outcome (strong, weak, or neutral)? 2) How does this assessment affect plans for this coming year in terms of curricula, teaching strategies, and assessment methods?
1) Overall performance is strong. 2) The department plans to continue measuring results of the Financial Statement Analysis Project
and will discuss the importance of the project with faculty to determine the impact on student performance. Due to the level of achievement with Financial Statement preparation over the years, this component of Outcome #2 will not be measure next year.

Outcome #: 3 Outcome Title: Identify and apply major provisions of payroll and income tax laws and
demonstrate the ability to prepare tax returns and payroll reports. Outcome Type (choose by bolding): Discipline/Program; General Ed; Other If General Education outcome (choose by bolding): Communication; Critical Thinking; Quantitative Reasoning; Use of Technology; Diversity and Global Awareness; Leadership and Teamwork
Outcome Description: This outcome tests student knowledge of tax law and reporting which is considered a desirable occupational skill for many entry level accounting positions. Students must interpret tax code and federal laws that govern employment using critical thinking and quantitative reasoning. Students are expected to apply technology in several ways: complete a computerized payroll project, access IRS site for forms and publications; research topics to determine application of the laws.
Benchmark for success 1) Please specify what percentage of the sample size is expected to meet or exceed your benchmark. 2) What is the rationale for choosing this measure?
100% of the students assessed will score an average of 80% or better on the project. Student survey questions should average a score of 4 or better (out of 5). The students being assessed are completing the A.A.S. Degree in Accounting and the department is striving to ensure the program produces highly skilled, knowledgeable and marketable employees.
Description of assessment process: 1) What assessment methods were used to measure this outcome (i.e. pre/post test, portfolio review, etc.)? 2) How do these methods show students are learning? 3) What frequency is this outcome being measured (i.e.: each semester, yearly, every other year, etc.) and why? 4) How many students made up the sample size?
1) 1) Students are required to complete a comprehensive computerized payroll project. The project takes the student through the fourth quarter of the year and requires quarterly and year-end reporting.
2) 2) This is a hands-on project students complete outside of the classroom. To be successful in completing the project, the student must apply what was learned during classroom instruction. 3) Each semester the course runs.
4) Student Projects evaluated - 22

Results What were the results of the assessment process? (List results for each method, if more than one were used.)
Payroll Accounting: Average Project Component Scores
91%
98%
95%
86%
100%
45%
93%
97% 97%
94%
80%
96%95%
92%
95%
55%
85%
99%98%
97%
100%
49%
97%
46%
30%
40%
50%
60%
70%
80%
90%
100%
Completeness Mathematical
Correctness
Creates Payroll
registers
Prepares
appropriate
journal entries
Updates payroll
info
Prepares
required tax
forms
04-05
05-06
06-07
07-08
Payroll Accounting Comparison: Percent of Students Correctly Preparing Payroll Tax
Form
63%
88%
94%
87%
50%
26%
42%
15%
54%
81%
50%
92%
73%77%
58%
73%
59%
14%
68%
86%
50%
73%
91%
82%
41%
50%
85%
40%
69%
94% 94%
65%
39%
91%
78%
89%
74%
52%
35%
74%
0%
10%
20%
30%
40%
50%
60%
70%
80%
90%
100%
941 940 UC2 W2 W3 REV1666 1099 1096 PAW3R AROWC
Payroll Tax Form04-05 05-06 06-07 07-08
See chart in Outcome #1 for Graduate Student Survey Results

What did the department learn? 1) How did group performance compare to the benchmark? 2) How does the data compare to the previous year, if applicable? 3) If multiple measures were used, how do they compare to each other?
1) In the Average Project Component Score (Chart #1) for the Academic school year 2007-2008, students met the benchmark of 80% in the following categories: Completeness, Mathematical Correctness, Creates Payroll Registers, Prepares Appropriate Journal Entries, and Updates Payroll Info. The only component that is below benchmark is the Prepares Required Tax Forms component. 2) Prepares Required Tax Forms has resulted in below average scores for the past four academic years. Steps taken to strength students’ abilities to prepare payroll tax forms were marginally successful. Students’ performance in preparing tax forms improved on six of the ten forms. Although the textbook gives examples of each of the forms listed above and students were assigned homework problems requiring many of these forms be prepared, it is still a challenge to get students to complete all requirements. Project points were reallocated to increase the points earned for completing forms, however, several projects were still submitted with incomplete or missing forms. The course was offered in a “fast track” mode and students were expected to complete the project after finishing the required class time. 3) The graduate survey shows students met the benchmark of a 4 rating with respect to their knowledge of payroll. Difficult to compare since we did not ask students specific questions about payroll accounting.
Student performance summary 1) Based on the findings, how does the department rate student performance in regards to this outcome (strong, weak, or neutral)? 2) How does this assessment affect plans for this coming year in terms of curricula, teaching strategies, and assessment methods?
1) Student performance rates strong on 5 of the 6 components of the project; “Prepares Tax Forms” student performance needs to improve. 2) In addition to changes made last year (as noted above). In the 08-09 AY the Payroll Accounting course changed from fast track to hybrid. This change was implemented to monitor and assist with student progress on the project, particularly the forms, within the classroom environment (see above note) and adds online support. An assessment of the success of these changes will be included in next year’s report.

Outcome #: 4 Outcome Title: Summarize cost information for both internal and external reporting and
utilize costing tools to support management decision-making Outcome Type (choose by bolding): Discipline/Program; General Ed; Other If General Education outcome (choose by bolding): Communication; Critical Thinking; Quantitative Reasoning; Use of Technology; Diversity and Global Awareness; Leadership and Teamwork
Outcome Description: The outcome measures the students’ ability to use financial results to evaluate overall performance and gives managers quantitative information to help make decisions.
Benchmark for success 1) Please specify what percentage of the sample size is expected to meet or exceed your benchmark. 2) What is the rationale for choosing this measure?
100% of the students assessed will score an average of 80% or better on the project. Student survey questions should average a score of 4 or better (out of 5). The students being assessed are completing the A.A.S. Degree in Accounting and the department is striving to ensure the program produces highly skilled, knowledgeable and marketable employees.
Description of assessment process: 1) What assessment methods were used to measure this outcome (i.e. pre/post test, portfolio review, etc.)? 2) How do these methods show students are learning? 3) What frequency is this outcome being measured (i.e.: each semester, yearly, every other year, etc.) and why? 4) How many students made up the sample size?
See Outcome #1. This outcome is assessed using the same project as Outcome #1.
Results What were the results of the assessment process? (List results for each method, if more than one were used.)
Assessment Outcome #4- Summarize cost information for
both internal and external use
Cost Accounting Project
0.00
20.00
40.00
60.00
80.00
Internal reports External reports
AY06-07
AY07-08
See chart in Outcome #1 for Graduate Student Survey Results

What did the department learn? 1) How did group performance compare to the benchmark? 2) How does the data compare to the previous year, if applicable? 3) If multiple measures were used, how do they compare to each other?
1) Students performed below the benchmark of 80% in their ability to summarize cost information (see comment below concerning future assessment of this outcome). 2) Student performance did improve from last year to this year. Only two years of data are available since the project was changed last year. 3) The student graduate survey benchmark of 4 was met on question # 10 related to Cost Accounting which differs from the results of the project as noted in #1.
Student performance summary 1) Based on the findings, how does the department rate student performance in regards to this outcome (strong, weak, or neutral)? 2) How does this assessment affect plans for this coming year in terms of curricula, teaching strategies, and assessment methods?
1) Student performance shows a weakness in completing this portion of the project. 2) The department has decided to change the assessment of this outcome. The current project used for assessment is not giving the department enough information regarding student performance in this area. As of the 08-09 academic year, the department will use projects in Managerial Accounting to evaluate student performance.

Outcome #: 5 Outcome Title: Use current technology to implement appropriate accounting systems that will support the
support different uses of accounting information. Outcome Type (choose by bolding): Discipline/Program; General Ed; Other If General Education outcome (choose by bolding): Communication; Critical Thinking; Quantitative Reasoning; Use of Technology; Diversity and Global Awareness; Leadership and Teamwork
Outcome Description: This outcome was design to ensure students are trained in the use of technology applicable to the specific skills of their program of study.
Benchmark for success 1) Please specify what percentage of the sample size is expected to meet or exceed your benchmark. 2) What is the rationale for choosing this measure?
100% of the students assessed will score an average of 80% or better on the projects. Student survey questions should average a score of 4 or better (out of 5). The students being assessed are completing the A.A.S. Degree in Accounting and the department is striving to ensure the program produces highly skilled, knowledgeable and marketable employees.
Description of assessment process: 1) What assessment methods were used to measure this outcome (i.e. pre/post test, portfolio review, etc.)? 2) How do these methods show students are learning? 3) What frequency is this outcome being measured (i.e.: each semester, yearly, every other year, etc.) and why? 4) How many students made up the sample size?
See Outcome #1. This outcome is assessed using the same project.
Results What were the results of the assessment process? (List results for each method, if more than one were used.)
Assessment Outcome #5-Use current technology
Cost Accounting Project
0.00%10.00%20.00%30.00%40.00%50.00%60.00%70.00%80.00%90.00%
100.00%
Use accounting softw
are to prin
t journals
Use accounting softw
are to prin
t general le
dger
Use accounting softw
are to prin
t trial b
alance
Use accounting softw
are to prin
t financial s
tatements
AY06-07
AY07-08

Student Graduate Survey - Part I
Program Graduates
Survey Results
GENERAL SKILLS
0
1
2
3
4
5
1 2 3 4 5 6 7 8
2004-05
AVERAGE
2005-06
AVERAGE
2006-07
AVERAGE
2007-08
AVERAGE
QUESTIONS RELATE TO X-AXIS NUMBERS IN CHART ABOVE 1. I experienced a continuum of learning throughout the program. 2. The program met my expectations 3. The knowledge acquired is applicable to my profession. 4. My analytical abilities were enhanced. 5. I sharpened my computer application skills (word, spreadsheets, etc.) Outcome #5 6. My oral and written communication skills have improved. Outcome #6 7. I increased my understanding of Diversity. Outcome #7 8. I increased my awareness of Ethics in the workplace. Outcome #7
What did the department learn? 1) How did group performance compare to the benchmark? 2) How does the data compare to the previous year, if applicable? 3) If multiple measures were used, how do they compare to each other?
1) Student performance exceeded the benchmarks set. 2) Student performance improved from last year to this year (again this project has been used for only
two years). 3) Student graduate survey results and project results show students are competent (and believe they
are competent) in the use of technology.
Student performance summary 1) Based on the findings, how does the department rate student performance in regards to this outcome (strong, weak, or neutral)? 2) How does this assessment affect plans for this coming year in terms of curricula, teaching strategies, and assessment methods?
1) Past results have shown (including the use of other projects in past years) student performance in regards to this outcome has consistently measured up to the benchmarks.
2) The outcome will not be measured again for a couple of years.

Outcome #: 6 Outcome Title: Demonstrate written and oral communication skills as related to accounting.
Outcome Type (choose by bolding): Discipline/Program; General Ed; Other If General Education outcome (choose by bolding): Communication; Critical Thinking; Quantitative Reasoning; Use of Technology; Diversity and Global Awareness; Leadership and Teamwork
Outcome Description: The outcome was designed to ensure students basic skills are addressed within the program specific courses. Strong communication skills are a most in the business world.
Benchmark for success 1) Please specify what percentage of the sample size is expected to meet or exceed your benchmark. 2) What is the rationale for choosing this measure?
100% of the students assessed will score an average of 80% or better on the project. Student survey questions should average a score of 4 or better (out of 5). The students being assessed are completing the A.A.S. Degree in Accounting and the department is striving to ensure the program produces highly skilled, knowledgeable and marketable employees.
Description of assessment process: 1) What assessment methods were used to measure this outcome (i.e. pre/post test, portfolio review, etc.)? 2) How do these methods show students are learning? 3) What frequency is this outcome being measured (i.e.: each semester, yearly, every other year, etc.) and why? 4) How many students made up the sample size?
1) Students are required to research a current event/law related to topics covered in Payroll Accounting, write a paper and present their findings to the class.
2) Students are evaluated on the content, relevance and accuracy of the report and the quality of the presentation allowing the instructor to determine if the students are properly applying what has been covered in the class. Also, the students benefit by getting a variety of perspectives and issues related to the topic.
3 Each semester the course runs. 4) Student Reports and Presentations -
Payroll Accounting Oral Presentation
4.1
4.44.2
4.44.4
4.8
4.0
4.34.1
4.3
4.0
4.3
4.54.4
4.2
4.5 4.5
4.84.7
4.54.4
4.8
4.3
5.0
0.0
0.5
1.0
1.5
2.0
2.5
3.0
3.5
4.0
4.5
5.0
Volume Posture Eye
Contact
Attire
04-05 05-06 06-07 07-08

Payroll Accounting Written Assignment
Assessment Comparison
8.4
4.8
7.9
8.68.0
9.0
9.99.5
8.8 8.6
6.6
9.9
9.3
5.9
9.0 9.2
7.8
9.19.8
6.7
10.0 10.0
9.0
9.4
0.01.02.0
3.04.05.0
6.07.0
8.09.0
10.0
Intr
od
uctio
n
Se
qu
en
cin
g
Gra
mm
ar
&
Sp
elli
ng
Fo
cu
s o
n
To
pic
Accu
racy o
f
Fa
cts
Co
nclu
sio
n
04-05
05-06
06-07
07-08
Results What were the results of the assessment process? (List results for each method, if more than one were used.)
What did the department learn? 1) How did group performance compare to the benchmark? 2) How does the data compare to the previous year, if applicable? 3) If multiple measures were used, how do they compare to each other?
1) According to the rubric scoring system for the oral communication requirement, the student ratings of 4 (out of 5) or better meet the 80% benchmark set for this outcome; for the written requirement a score of 8 (out of 10) or better meets the 80% benchmark. Student performance met the benchmark with the exception of grammar and spelling. 2) The results of the oral presentation show students performed slightly higher than the previous year in all areas except attire. Students written assignments were generally better than the previous year with the exception of the introduction. 3) Student graduate survey results indicated they are not as confident in their oral and written communication skills once they have finished the program
Student performance summary 1) Based on the findings, how does the department rate student performance in regards to this outcome (strong, weak, or neutral)? 2) How does this assessment affect plans for this coming year in terms of curricula, teaching strategies, and assessment methods?
1) Overall, the department believes student performance is strong. 2) The results indicate the students need to work on grammar and spelling as these basic skills
need to improve. The instructor will work with the Writing Center to determine what assistance/additional instruction might be given to students to help improve this element of written communication.

Outcome #: 7 Outcome Title: Demonstrate an understanding of diversity issues and ethics in accounting.
Outcome Type (choose by bolding): Discipline/Program; General Ed; Other If General Education outcome (choose by bolding): Communication; Critical Thinking; Quantitative Reasoning; Use of Technology; Diversity and Global Awareness; Leadership and Teamwork
Outcome Description: This outcome has been very difficult to measure in the context of the Accounting Program. We have not been able to identify a formal assessment method (other than a question on the graduate survey) for this outcome. It should be noted, the department believes exposing the students to issues related to diversity and global awareness is important and we have continually strived to include these elements within our courses as follows: - Principles of Accounting I and II, students are assigned homework cases addressing diversity, ethical
behavior and global awareness. These cases are discussed within the classroom. - Cost and Managerial Accounting students explore and discuss the International Management
Accountant’s website regarding ethical behavior during the 1st class meeting. - Students in Payroll Accounting are encouraged to explore issues in diversity and ethical behavior
when completing the course written report requirement. We will no longer include this outcome in our future assessments.
Benchmark for success 1) Please specify what percentage of the sample size is expected to meet or exceed your benchmark. 2) What is the rationale for choosing this measure?
NA
Description of assessment process: 1) What assessment methods were used to measure this outcome (i.e. pre/post test, portfolio review, etc.)? 2) How do these methods show students are learning? 3) What frequency is this outcome being measured (i.e.: each semester, yearly, every other year, etc.) and why? 4) How many students made up the sample size?
NA
Results What were the results of the assessment process? (List results for each method, if more than one were used.)
NA

What did the department learn? 1) How did group performance compare to the benchmark? 2) How does the data compare to the previous year, if applicable? 3) If multiple measures were used, how do they compare to each other?
NA
Student performance summary 1) Based on the findings, how does the department rate student performance in regards to this outcome (strong, weak, or neutral)? 2) How does this assessment affect plans for this coming year in terms of curricula, teaching strategies, and assessment methods?
See above.

Part 2: Current Academic Year Assessment Plan Current Academic Year: 2008-2009 Intended Learning Outcomes (only include if they differ from those noted in Part 1)
No. OUTCOME ASSESSMENT 1. Utilize and calculate financial ratios to analyze financial performance.
(General Education - critical thinking and quantitative reasoning are incorporated into outcomes)
Financial Statement Analysis Project
2. Identify and apply major provisions of payroll and income tax laws and demonstrate the ability to prepare individual income tax returns and payroll reports. (General Education -critical thinking and quantitative reasoning are incorporated into outcomes)
Payroll Project
3. Summarize cost information for both internal and external reporting and utilize costing tools to support management decision-making. (General Education - critical thinking and quantitative reasoning are incorporated into outcomes)
Managerial Accounting Project
4. Demonstrate written and oral communication skills as related to accounting. (General Education – communication)
Oral and Written Reports
Assessment Method(s) (only include if they differ from those noted in Part 1)
Same methods as Part I for the outcomes listed. Benchmarks (only include if they differ from those noted in Part 1)
Same benchmarks as Part I are expected. Have you submitted a separate budget worksheet? (Choose by bolding; for information about this worksheet, please refer to the specific budgeting e-mail sent by the committee chairperson.)
Yes No