Embed Size (px)
Citation preview
National Staff Development Council 1
Professional Learning in the Learning Profession
A Status Report on Teacher Development
in the U.S. and Abroad
Technical Report
Ruth Chung Wei, Linda daRLing-hammond, aLethea andRee, nikoLe RiChaRdson,and steLios oRphanos
sChooL Redesign netWoRk at stanfoRd univeRsity
pRofessionaL LeaRning in the LeaRning pRofession
a status RepoRt on teaCheR deveLopment in the united states and abRoad
Ruth Chung Wei, Linda Darling-Hammond, Alethea Andree, Nikole Richardson,and Stelios Orphanos; School Redesign Network at Stanford University.
Published by the National Staff Development Council and the School Redesign Network at Stanford University as part of their multi-year study, The Status of Professional Devel-opment in the United States.
© February 2009 National Staff Development Council. All rights reserved.
No part of this may be reproduced in any form — except for brief quotation (not to ex-ceed 1,000 words) in a review or professional work — without prior written permission from NSDC or the authors.
Citation: Wei, R. C., Darling-Hammond, L., Andree, A., Richardson, N., Orphanos, S. (2009). Professional learning in the learning profession: A status report on teacher development in the United States and abroad. Dallas, TX. National Staff Development Council.
National Staff Development Council 17330 Preston Rd., Suite 106DDallas, TX 75252972.421.0900www.nsdc.org
School Redesign Network505 Lasuen Mall Stanford, CA 94305-3084650.725.0703 srnleads.org
SRN LEADSS T A N F O R D U N I V E R S I T Y
NATIONAL
STAFF
DEVELOPMENT
COUNCIL
Table of Contents
Acknowledgements ...................................................................................................... i
Preface ......................................................................................................................... ii
Chapter 1: Introduction ............................................................................................... 1
Chapter 2: Defining Effective Professional Development ........................................ 3
Chapter 3: Professional Development in the U.S. and Abroad .................................. 18
Chapter 4: The Status of Professional Learning Opportunities in the U.S. ............... 30
Chapter 5: Another Lens on Professional Learning Opportunities: The NSDC Standards Assessment Inventory ................................................................................ 54
Summary ...................................................................................................................... 58
Conclusions ................................................................................................................. 61
References..................................................................................................................... 63
Appendix A: Datasets and Methods ........................................................................ 74
Appendix B: Results from the 2003-04 Schools and Staffing Survey ....................... 79
Appendix C: Results from the 2007-08 Standards Assessment Inventory ............... 139

i
Acknowledgementss is true with all such enterprises, many people made this research possible. We are grateful, first of all, to the National Staff Development Council. In particular, the leadership of Executive Director Stephanie Hirsh and the careful supervision of Deputy Executive Director Joellen Killion, who offered invaluable guidance on
research strategies and the writing of this report. We are also indebted to the generous support provided by Vicki Phillips, Sandra Licon, and Lynn Olson of the Bill & Melinda Gates Foundation; Sybil Jacobson and A. Richardson Love, Jr., of the MetLife Founda-tion; and Richard Laine, Jessica Schwartz, and Frederick Brown of the Wallace Founda-tion.
The expert review and constructive feedback of several external reviewers, including Michael Garet and Kwang Suk Yoon at the American Institutes for Research and Thomas Guskey at Georgetown College, provided critical insights to refine our review of the research on professional development and our presentation of findings on the status of professional learning in the United States and abroad. Richard Elmore at Harvard University served as a technical advisor. Credit also goes to the National Center for Education Statistics, which provided the restricted-use dataset of the 2003-04 Schools and Staffing Survey — currently the only wide-scale, nationally representative survey of teachers’ professional learning opportunities in the United States.
This report would not have been possible without the countless hours devoted to its design and layout by Barbara McKenna at the School Redesign Network at Stanford University and Shep Ranbom, Rafael Heller and the rest of their staff at CommunicationWorks, for editorial guidance and for leading the communications effort. We thank the Board of Trustees of the National Staff Development Council for its vision and advocacy for this study; NSDC’s National Advisors for their guidance and encouragement through the building stages; and NSDC consultants Hayes Mizell and M. René Islas for their perspectives and support.
Finally, we would like to express our appreciation to our families who supported us through the course of this important work.
A
Professional Learning in the Learning Professionii
Preface
CReating effeCtive pRofessionaL LeaRning systems to boLsteR teaChing QuaLity and student aChievement
Stephanie Hirsh, Executive DirectorNational Staff Development Council
or many years Title I of the Elementary and Secondary Education Act has required low-performing schools to set aside 10% of their allocations for schoolwide profes-sional development. Title II funding has resulted in the allocation of more than $3 billion to professional development. More than 40 states have adopted standards
calling for effective professional development for all educators accountable for results in student learning. And several national studies on what distinguishes high-performing, high-poverty schools from their lower-performing counterparts consistently identify effec-tive schoolwide collaborative professional learning as critical to the school’s success. And yet as a nation we have failed to leverage this support and these examples to ensure that every educator and every student benefits from highly effective professional learning.
Improving professional learning for educa-tors is a crucial step in transforming schools and improving academic achievement. To meet federal requirements and public ex-pectations for school and student perfor-mance, the nation needs to bolster teacher skills and knowledge to ensure that every teacher is able to teach increasingly diverse learners, knowledgeable about student learning, competent in complex core aca-demic content, and skillful at the craft of teaching.
To accomplish this, schools — with the support of school systems and state depart-ments of education — need to make sure that professional learning is planned and organized to engage all teachers regularly and to benefit all students. This requires high-quality, sustained professional learning throughout the school year, at every grade level and in every subject.
In an effective professional learning system, school leaders learn from experts, mentors,
and their peers about how to become true instructional leaders. They work with staff members to create the culture, structures, and dispositions for continuous profes-sional learning and create pressure and sup-port to help teachers continuously improve by better understanding students’ learning needs, making data-driven decisions regard-ing content and pedagogy, and assessing students’ learning within a framework of high expectations.
Teachers meet on a regular schedule in learning teams organized by grade-level or content-area assignments and share responsibility for their students’ success. Learning teams follow a cycle of continuous improvement that begins with examining student data to determine the areas of greatest student need, pinpointing areas where additional educator learning is necessary, identifying and creating learning experiences to address these adult needs, developing powerful lessons and assessments, applying new strategies in the
F
iii
classroom, refining new learning into more powerful lessons and assessments, reflecting on the impact on student learning, and repeating the cycle with new goals as necessary.
The system at the school level is supported by state and federal policies that encourage regular teacher collaboration and profes-sional learning closely tied with school improvement priorities and provides needed resources to give teachers time and oppor-tunity to make this happen. Many states, including Kansas, Ohio, and Oregon most recently, have adopted standards to demon-strate expectations that all teachers engage in effective professional development. These states are among the 40 that have adopted or adapted NSDC’s Standards for Staff Development written in conjunction with 17 other professional associations. Some states, such as Florida, Georgia, and Kansas, have implemented statewide assess-ment processes to determine the degree to which teachers experience effective profes-sional development and student learning is impacted. Other states, notably Arkansas, Pennsylvania, and New Jersey, invest in capacity-building strategies providing train-ing and resources for principals and teacher leaders. Ohio enacted sweeping reforms of its professional development policy. Stand-out high-poverty school systems like Long Beach (Calif.), Hamilton County (Tenn.), and Carmen-Ainsworth (Mich.), have made collaborative learning a priority to ensure that every educator and every student learns every day.
As this report shows, such an approach to professional learning has become the norm in many countries that are our competitors, but is the exception here. The report reveals that much of the professional develop-ment available today focuses on educators’
academic content knowledge, and pays growing attention to mentoring support, particularly for new teachers. But, overall, the kind of high-intensity, job-embedded collaborative learning that is most effective is not a common feature of professional de-velopment across most states, districts, and schools in the United States.
The purpose of this report is to provide policymakers, researchers, and school leaders with a teacher-development research base that can lead to powerful professional learning, instructional improvement, and student learning. By examining information about the nature of professional development opportunities currently available to teachers across the United States and in a variety of contexts, education leaders and policymakers can begin both to evaluate the needs of the systems in which teachers learn and do their work and to consider how teachers’ learning opportunities can be further supported.
This volume is prepared by Ruth Chung Wei, Linda Darling-Hammond, Alethea Andree, Nikole Richardson, and Stelios Orphanos through the School Redesign Network at Stanford University. It can be downloaded at http://www.nsdc.org/stateproflearning.cfm and at http://www.srnleads.org. The report is part of a larger study, The Status of Professional Development in the United States, a multi-year research initiative. Data and findings drawn from this study will be used to establish benchmarks for assessing progress in professional development over time.
Future reports will:
• Address the degree to which educators ex-perience professional development linked to
Professional Learning in the Learning Professioniv
improved professional practice and student learning, along with state-by-state compari-son data, and
• Examine policies and contexts that support implementation of more effective professional learning tied to student learning in states and school systems.
Taken as a whole, this work will provide the most comprehensive picture and
far-reaching analysis of professional learning that has ever been conducted in the United States. NSDC has sponsored this initial report to synthesize what we know as a baseline to measure state and district performance. We hope that each report in the series will answer key questions about professional learning that will contribute to improved outcomes in teaching and learning in the United States.

1
n recent decades, school reform efforts have recognized teacher professional develop-ment as a key component of change and as an important link between the standards movement and student achievement. As students are expected to learn more complex and analytical skills in preparation for further education and work in the 21st century,
teachers must learn to teach in ways that develop higher order thinking and performance. These new standards require a new kind of teaching, conducted by “teachers who under-stand learning as well as teaching, who can address students’ needs as well as the demands of their disciplines, and who can create bridges between students’ experiences and curricu-lum goals” (Darling-Hammond, 2005, p.5). Efforts to improve student achievement can succeed only by building the capacity of teachers to improve their instructional practice and the capacity of school systems to advance teacher learning.
We recognize that professional develop-ment does not always lead to professional learning, despite its intent (Easton, 2008; Fullan, 2007a). Indeed, Michael Fullan (2007a) argues that external approaches to instructional improvement are rarely “pow-erful enough, specific enough, or sustained enough to alter the culture of the class-room and school” (p. 35). He reminds us of Richard Elmore’s (2004) assertion that “improvement above all entails ‘learning to do the right things in the setting where you work’” (p. 73). Likewise, Lois Brown Easton argues that the most powerful learn-ing opportunities are active learning oppor-tunities embedded in teachers’ work, which begins with teachers’ assessments of what their students need and, subsequently, what teachers identify as areas for their own learning. She contends:
It is clearer today than ever that edu-cators need to learn, and that’s why professional learning has replaced professional development. Develop-ing is not enough. Educators must be knowledgeable and wise. They must know enough in order to change. They must change in order to get different results. They must become
Enabling educational systems to achieve on a wide scale the kind of teaching that has a substantial impact on student learning requires much more intensive and effective professional learning than has traditionally been available in the past. As states and districts work to create new structures and strategies for professional development, it is useful to evaluate what research has to say about the kind of professional learning that improves instruction and student achievement.
In this study, we examine the availability of both formal professional development and other opportunities for professional learning — such as common planning time, shared opportunities to examine student work, or tools for self-reflection — that may occur outside the bounds of formal professional development events. We conceptualize professional learning as a product of both externally-provided and job-embedded activities that increase teachers’ knowledge and change their instructional practice in ways that support student learning. Thus, formal professional development represents a subset of the range of experiences that may result in professional learning.
IIntroduction
Professional Learning in the Learning Profession2
learners, and they must be self-devel-oping (Easton, 2008, p. 756, empha-sis in original text).
In this study, we first review what research says regarding the relationship between teacher professional development and stu-dent learning. We then we review the avail-ability of the kinds of professional learning opportunities that research finds most effec-tive in the United States and in high-achiev-ing nations around the world. We illustrate with examples how key features of effec-tive professional development contexts and strategies operate in these systems.
Using nationally representative data from the 2003-04 Schools and Staffing Survey (National Center for Education Statistics), we examine the availability of professional development and supports for learning to teachers nationally and across states to determine whether current policies and practices are aligned with what research evidence demonstrates are effective profes-sional development. We also examine dif-ferences in professional development across
school contexts (e.g., grade level, location, different student populations) to determine whether there are differences in teachers’ access to professional development in dif-ferent types of school communities. Data from other surveys such as the MetLife Survey of the American Teacher, the Na-tional Education Association’s Survey of America’s Teachers and Support Profession-als on Technology, and the National Staff Development Council’s Standards Assess-ment Inventory are also examined to shed light on teachers’ learning opportunities.
This report is intended to provide a research-based understanding of the types of professional development that support powerful professional learning, improve teacher instruction and, ultimately, promote excellent student learning. By examining both the customary practices and the promising practices of professional development, school leaders can create conditions in which teachers are well-supported to be effective in the classroom and to improve their effectiveness throughout their careers.

3
n this review, we define “high quality” or “effective” professional development as that which results in improvements in teachers’ knowledge and instructional practice, as well as improved student learning outcomes. We emphasize research that links teacher development to student learning. While the impact on student achievement is a critical
indicator of the effectiveness of professional development, we believe the impact of profes-sional development on teacher knowledge and instructional practice is also relevant, as these are worthwhile outcomes in themselves that support increased learning for students. Since the impact of teacher learning on student achievement may not be immediate, and measures of student learning gains that can be linked to specific professional development are often difficult to secure, interim measures that examine practice are valuable, especial-ly where the practices in question have been shown to influence student achievement.
This review of research includes studies that use a range of research methodologies. We chose not to limit our review to those stud-ies that utilized experimental methods only, as there are important and valid research studies that draw on qualitative and case study methodologies. In these cases, we note that the inferences that can be drawn from such research should be treated as suggestive rather than conclusive.
Over the last two decades, a “new para-digm” for professional development has emerged from research that distinguishes powerful opportunities for teacher learn-ing from the ineffective traditional one-day workshop model (Stein, Smith, and Silver, 1999). The research on effective profession-al development has begun to create a con-sensus about key principles in the design of learning experiences that can impact teach-ers’ knowledge and practices (e.g., Hawley & Valli, 1999; NSDC, 2001). While the various features of effective professional development are cited in the literature, there are several cross-cutting themes. This consensus includes lessons about both the content of and contexts for professional
I
Defining Effective Professional Development
learning, as well as approaches to designing learning experiences.
Professional Development ContentThe content of the professional develop-ment is most useful when it focuses on “concrete tasks of teaching, assessment, observation and reflection” (Darling-Hammond & McLaughlin, 1995, p. 598), rather than abstract discussions of teaching. Studies find strong effects of professional development on practice when it focuses on enhancing teachers’ knowledge of how to engage in specific pedagogical skills and how to teach specific kinds of content to learners. Equally important is a focus on student learning, including analysis of the conceptual understanding and skills that students will be expected to demonstrate (Blank, de las Alas & Smith, 2007; Carpen-ter et al, 1989; Cohen & Hill, 2001; Lie-berman & Wood, 2002; Merek & Meth-ven, 1991; Saxe, Gearhart & Nasir, 2001; Wenglinsky, 2000).
Hawley and Valli (1999) observe that while the focus on student learning is an obvious goal of teacher professional development,
Professional Learning in the Learning Profession4
too often discussions of standards do not focus tightly on student learning of specific content. This focus matters. In a review of research examining the effects of the fea-
tures of professional development programs on student learning, Mary Kennedy (1998) found that, “Programs whose content focused mainly on teachers’ behaviors
demonstrated smaller influences on student learning than did pro grams whose content focused on teachers’ knowledge of the sub-ject, on the curriculum, or on how students learn the subject (p. 18).” Similarly, in a recent national survey, Garet and colleagues
(2001) found that teachers reported growth in their knowledge and skills and changes in their practice from professional develop-ment that is coherent, focused on content knowledge, and involves active learning. When teachers have an opportunity to do “hands-on” work which enhances their knowledge of the content to be taught to students and how to teach it, and is aligned with the curriculum and local policies, they report a greater sense of efficacy.
A strong focus on content — rather than simply providing a forum for teachers to talk — has proved critical to improving
The National Staff Development Council (NSDC) Standards for Staff Development
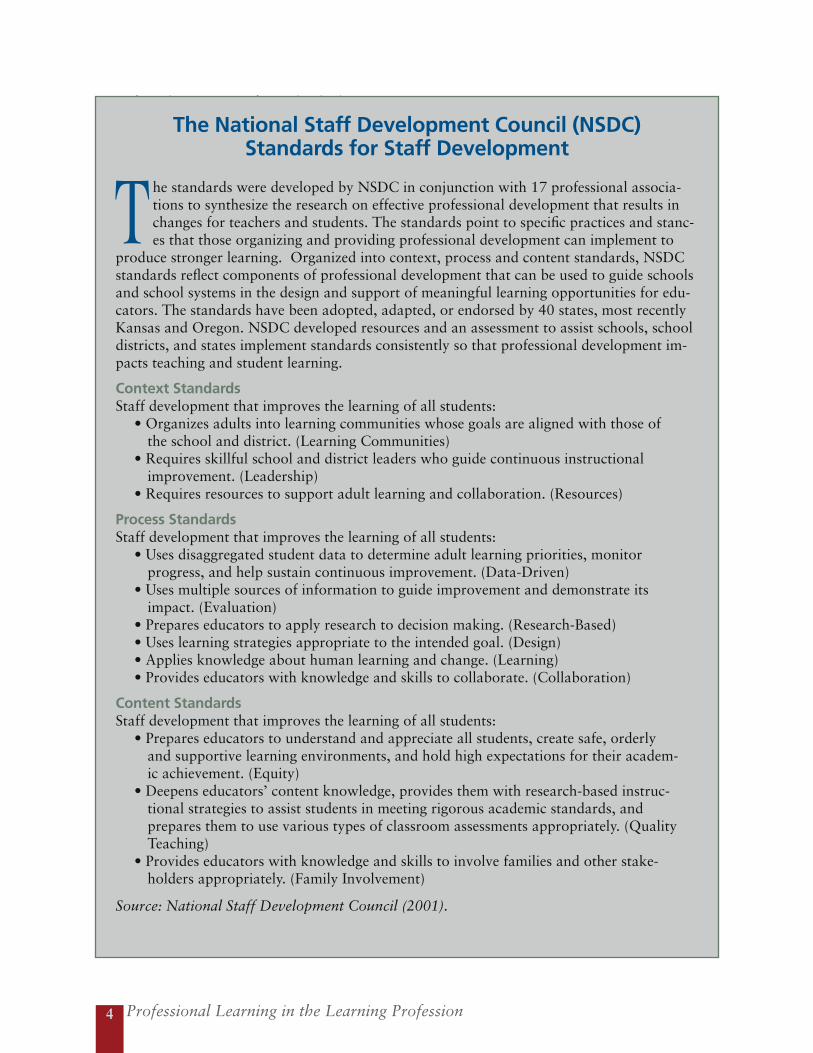
he standards were developed by NSDC in conjunction with 17 professional associa-tions to synthesize the research on effective professional development that results in changes for teachers and students. The standards point to specific practices and stanc-es that those organizing and providing professional development can implement to
produce stronger learning. Organized into context, process and content standards, NSDC standards reflect components of professional development that can be used to guide schools and school systems in the design and support of meaningful learning opportunities for edu-cators. The standards have been adopted, adapted, or endorsed by 40 states, most recently Kansas and Oregon. NSDC developed resources and an assessment to assist schools, school districts, and states implement standards consistently so that professional development im-pacts teaching and student learning.
Context StandardsStaff development that improves the learning of all students:
• Organizes adults into learning communities whose goals are aligned with those of the school and district. (Learning Communities)
• Requires skillful school and district leaders who guide continuous instructional improvement. (Leadership)
• Requires resources to support adult learning and collaboration. (Resources)
Process StandardsStaff development that improves the learning of all students:
• Uses disaggregated student data to determine adult learning priorities, monitor progress, and help sustain continuous improvement. (Data-Driven)
• Uses multiple sources of information to guide improvement and demonstrate its impact. (Evaluation)
• Prepares educators to apply research to decision making. (Research-Based)• Uses learning strategies appropriate to the intended goal. (Design)• Applies knowledge about human learning and change. (Learning)• Provides educators with knowledge and skills to collaborate. (Collaboration)
Content StandardsStaff development that improves the learning of all students:
• Prepares educators to understand and appreciate all students, create safe, orderly and supportive learning environments, and hold high expectations for their academ-ic achievement. (Equity)
• Deepens educators’ content knowledge, provides them with research-based instruc-tional strategies to assist students in meeting rigorous academic standards, and prepares them to use various types of classroom assessments appropriately. (Quality Teaching)
• Provides educators with knowledge and skills to involve families and other stake-holders appropriately. (Family Involvement)
Source: National Staff Development Council (2001).
T
Defining Effective Professional Development 5
teacher’s competence. Saxe, Gearheart, and Nasir (2001) compared three types of sup-port for teacher learning, and found that student achievement improved most when teachers were engaged in sustained, col-laborative professional development that specifically focused on deepening teach-ers’ content knowledge and instructional practices. The three teacher learning op-tions included: traditional professional development workshops, a professional community-based activity which offered support to teachers using new curriculum units, and the Integrated Mathemat-ics Assessment (IMA) approach, which directly engaged teachers in learn-ing the mathematics in the new curriculum as well as facilitating discussion around pedagogical con-tent knowledge necessary to teach the units. The re-searchers found that students whose teach-ers had participated in the Integrated Math-ematics Assessment (IMA) program showed the greatest gains in conceptual understand-ing. The study’s findings underscore the need for learning opportunities that focus on specific content knowledge and content pedagogy and “point to the problems with reform curriculum when such curriculum are not accompanied by focused supports for teachers’ subject matter knowledge, knowledge of children’s mathematics and implementation of reform-oriented peda-gogical practices” (Saxe, Gearheart, and Nasir, 2001, p. 70).
Similar strategies for engaging teachers in learning about mathematics content and pedagogy in the Cognitively Guided In-struction (CGI) program produced changes in practice for teachers and outcomes for
students (Carpenter et al., 1989). Teach-ers learned about CGI strategies, studied mathematics curriculum together, looked at student learning, and developed a unit and a year long plan involving CGI instruction. CGI operates on the theory that if teachers understand how students think and learn, they can better predict what their students need and match instruction accordingly. The researchers found that, in comparison with control-group teachers, CGI teachers more often emphasized problem-solving
skills, listened to stu-dents, expected stu-dents to use multiple strategies, and had greater knowledge of students’ thinking. In comparison to con-trol-group students, students in CGI class-rooms demonstrated higher level problem-solving abilities and
greater recall of number facts, while per-forming comparably on basic skills tests.
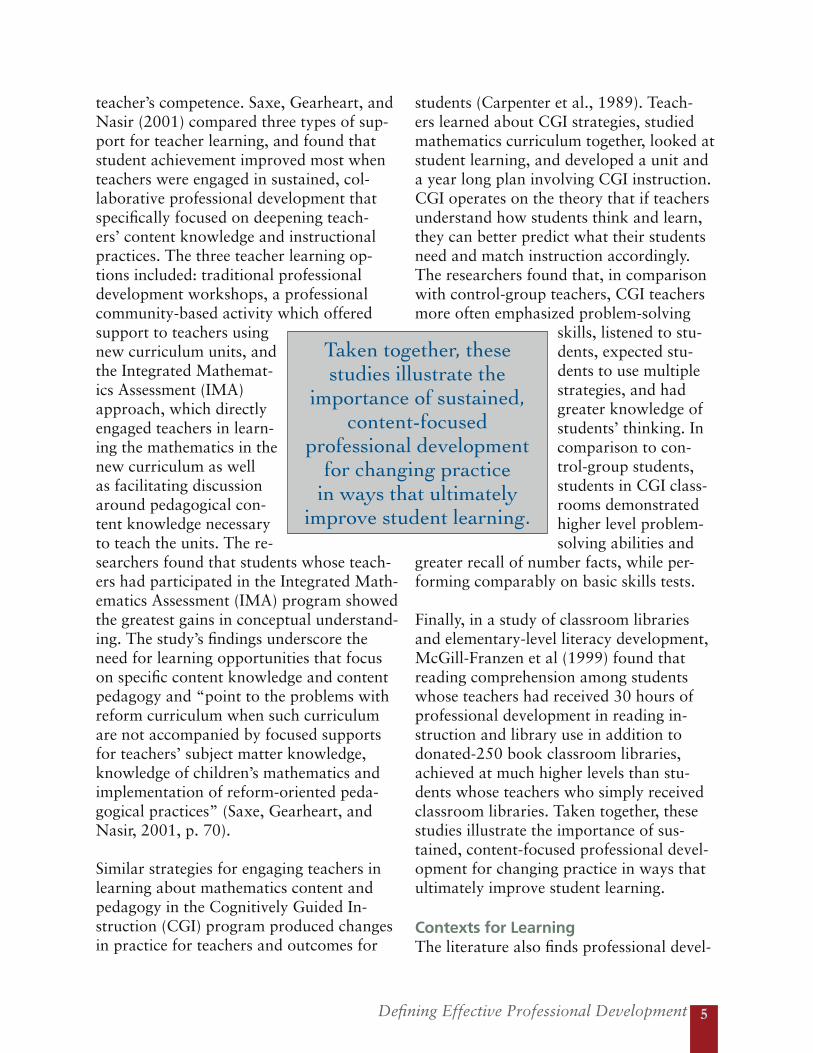
Finally, in a study of classroom libraries and elementary-level literacy development, McGill-Franzen et al (1999) found that reading comprehension among students whose teachers had received 30 hours of professional development in reading in-struction and library use in addition to donated-250 book classroom libraries, achieved at much higher levels than stu-dents whose teachers who simply received classroom libraries. Taken together, these studies illustrate the importance of sus-tained, content-focused professional devel-opment for changing practice in ways that ultimately improve student learning.
Contexts for LearningThe literature also finds professional devel-
Taken together, these studies illustrate the
importance of sustained, content-focused
professional development for changing practice
in ways that ultimately improve student learning.
Professional Learning in the Learning Profession6
opment more effective when it is not ap-proached in isolation — for example, as the traditional “flavor of the month” or one-shot workshop — but as a coherent part of the school reform effort (Elmore & Bur-ney, 1997; Cohen & Hill, 2001; Garet et al, 2001; Penuel, Fishman, Yamaguchi, & Gallagher, 2007; Supovitz, Mayer & Kahle, 2000). For substantial change to occur, cur-riculum, assessment, standards, and profes-sional learning should be seamlessly linked in order to avoid disjunctures between what teachers learn in professional development and what they are able to implement in their classrooms and schools. A statewide example from Ohio is NSF’s Discovery science professional development, which offered sustained support linked to sys-tem changes. Following six-week intensive content institutes, teachers were released by their districts for six seminars throughout the year that focused on grade-appropriate curriculum equity issues and authentic as-sessment strategies. In addition, they were provided on demand support and site visits from regional leaders, and contact with peers through newsletters and annual con-ferences. These efforts led to a significant increase in and continued use of inquiry-based instructional practices (Supovitz, Mayer, & Kahle, 2000).
Research on effective professional de-velopment highlights the importance of collaborative and collegial learning envi-ronments and communities of practice in schools (Knapp, 2003; Darling-Hammond & McLaughlin, 1995). Putnam and Borko (2000) call for a situated approach to teacher learning which grounds profes-sional development in teachers’ own prac-tices. This approach does not limit oppor-tunities to the classroom context, but does require ways for new knowledge and skills developed in professional development to
be “intertwined with [teachers’] ongoing practice” (p. 6). In a review of effective pro-fessional development programs in middle schools, Killion (1999) found that when teachers participate in professional learn-ing with peers from their school site, they become “engaged in a powerful form of staff development that allows them to grapple with “real” issues related to the new content and instructional processes” (p.180).
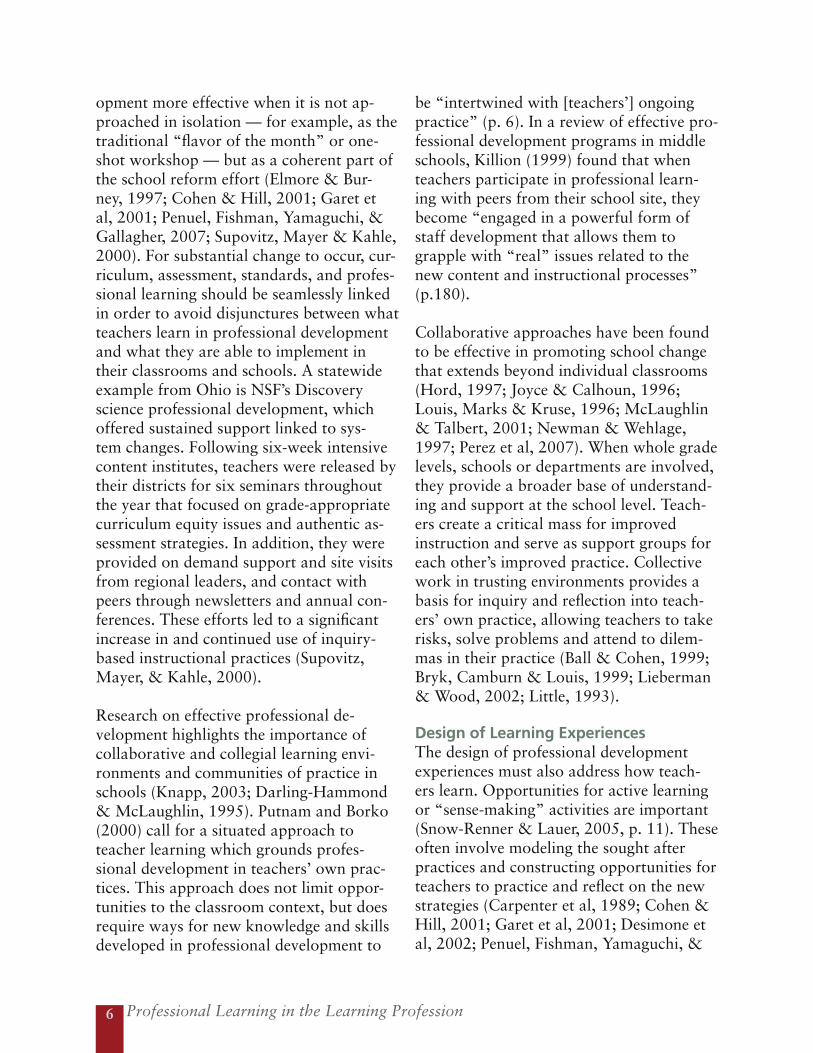
Collaborative approaches have been found to be effective in promoting school change that extends beyond individual classrooms (Hord, 1997; Joyce & Calhoun, 1996; Louis, Marks & Kruse, 1996; McLaughlin & Talbert, 2001; Newman & Wehlage, 1997; Perez et al, 2007). When whole grade levels, schools or departments are involved, they provide a broader base of understand-ing and support at the school level. Teach-ers create a critical mass for improved instruction and serve as support groups for each other’s improved practice. Collective work in trusting environments provides a basis for inquiry and reflection into teach-ers’ own practice, allowing teachers to take risks, solve problems and attend to dilem-mas in their practice (Ball & Cohen, 1999; Bryk, Camburn & Louis, 1999; Lieberman & Wood, 2002; Little, 1993).
Design of Learning ExperiencesThe design of professional development experiences must also address how teach-ers learn. Opportunities for active learning or “sense-making” activities are important (Snow-Renner & Lauer, 2005, p. 11). These often involve modeling the sought after practices and constructing opportunities for teachers to practice and reflect on the new strategies (Carpenter et al, 1989; Cohen & Hill, 2001; Garet et al, 2001; Desimone et al, 2002; Penuel, Fishman, Yamaguchi, &
Defining Effective Professional Development 7
Gallagher, 2007; Saxe, Gearhart & Nasir, 2001; Supovitz, Mayer & Kahle, 2000).
Active learning opportunities allow teachers to transform their teaching and not sim-ply layer new strategies on top of the old. Cohen and Hill (2001) describe two active learning approaches that proved success-ful in California’s statewide mathematics reform effort. During this reform, new curriculum and assessments were developed based on the framework established by the National Council of Teachers of Mathemat-ics (NCTM). These required elementary teachers and students to understand com-plex concepts of mathematics, not simply computational skills and algorithms with-out context. The first professional learning activity was organized around new curricu-lum units developed to teach the new state standards, and it en-gaged teachers in learn-ing the mathematics in the new curriculum units. Teachers taught the units and returned to debrief their experi-ences with other teach-ers and to problem solve next steps, while preparing to teach subsequent units. Teach-ers who attended these workshops over time reported more reform-oriented prac-tices in their classrooms, and their schools showed larger gains in achievement.
Other effective professional development involved teachers evaluating student work on assessments directly linked to the reform curriculum. Student work was displayed in constructed response tasks that showed students’ problem solving strategies and reasoning. While
assessing this work, teachers were guided through conceptual roadblocks students faced on the assessments and became knowledgeable about how to anticipate these misunderstandings and address them in their classrooms. When teachers reported having learned specifically about the new framework practices and having had opportunities to learn the mathematics they would ultimately teach, student achievement was higher.
Studies have found similar outcomes in other content areas. For example, Merek and Methven (1991) investigated the effects of elementary science teachers participating in a 100-hour long summer institute dur-
ing which they actively engaged in the “learn-ing cycle” students would complete in their classes. First students explore a phenom-enon, then they create a conceptual invention, a self-developed ex-planation of what has occurred, and finally, expand the concept to new applications. Following this active
learning, teachers developed their own units and taught each other their science learning cycles before returning to their classrooms. The authors found that the reasoning abil-ity of randomly selected students in the experimental classrooms was 44% higher than their peers in control classrooms.
Secondly, professional development that is sustained and intense has a greater chance of transforming teaching practices and student learning (Cohen & Hill, 2001; Desimone et al, 2002; Garet et al, 2001; McGill-Franzen et al 1999; Supovitz, May-
Collective work in trusting environments provides a basis for inquiry and reflection into teachers’ own practice, allowing
teachers to take risks, solve problems and attend to
dilemmas in their practice.
Professional Learning in the Learning Profession8
er & Kahle, 2000, Weiss & Pasley, 2006). The traditional episodic and fragmented ap-proach of traditional professional develop-ment does not afford the time necessary for learning that is “rigorous” and “cumula-tive” (Knapp, 2003).
As Garet and colleagues (2001) found in a recent national survey, when teachers have an opportunity to do “hands-on” work which enhances their knowledge of the content to be taught to students and how to teach it, and is aligned with the curriculum and local policies, they report a greater sense of efficacy. Furthermore, teachers who report gaining greater knowledge and skills through their professional development are also likely to report changing their teaching practices. This study also found that professional development is more likely to be viewed by teachers as effective if it is sustained over time and offers substantial contact hours, allowing more opportunities to engage in active learning, enable meaningful collaboration and focus on content, all of which enhance the acquisition of knowledge and skills.
While the duration of professional development is not the only variable that matters, there is evidence that teacher learning, and associated student learning, are associated with the number of contact hours. For example, two separate evaluations of professional development aimed at inquiry-based science teaching found that teachers who had 80 or more hours of science-related professional
development during the previous year were significantly more likely to use reform-based teacher instruction than teachers who had experienced fewer hours (Corcoran, McVay, & Riordan, 2003; Supovitz & Turner, 2000). Furthermore, increased student achievement was associated with more intense participation in the professional development for teachers and more exposure to the resulting reform-based teacher instruction (Banilower, 2002; Corcoran, McVay, & Riordan, 2003).
These findings are suggestive of effects, but cannot sustain strong causal claims. Few
studies in this arena are designed to do so. For example, a recent National Mathematics Advisory Panel report (2008) concluded that the majority of studies of professional develop-ment were descriptive in nature and lacking in the methodological rigor needed to war-rant causal inferences.
Most studies employed simple one-group pre-test/post-test designs without a com-parison group. A recent review of research on two professional development initiatives in literacy produced similar conclusions (see Garet et al., 2008).
In their systematic review of studies on the effectiveness of teachers’ in-service profes-sional development, Yoon and colleagues (2007) analyzed the findings from over 1,300 studies and evaluation reports ad-dressing the impact of professional devel-opment on student learning, and identified only nine experimental or quasi-experi-mental studies using control groups with pre- and post-test designs that could evalu-
As research deepens our understanding of how teachers learn, many
scholars have begun to place greater emphasis on job-embedded and collaborative teacher
learning.
Defining Effective Professional Development 9
ate impacts on student achievement. Their review of these nine studies concluded that sustained and intensive professional devel-opment was related to student achievement gains. Specifically, five of six studies that offered substantial contact hours of profes-sional development (ranging from 30 to 100 hours in total) spread out over six to 12 months showed a positive and signifi-cant effect on student achievement gains. The remaining three studies that involved limited amount of professional develop-ment (ranging from 5 to 14 hours in total) showed no statistically significant effect on student learning. Across the nine stud-ies, the levels of professional development offered — an average of 49 hours in a year — boosted student achievement by approx-imately 21percentile points.
The effects of professional learning experiences that are intense and focused on the work of teaching appear to support the “new paradigm” of professional development.
teaCheR LeaRning in pRofessionaL Communities
As research deepens our understanding of how teachers learn, many scholars have begun to place greater emphasis on job-em-bedded and collaborative teacher learning. As part of and in addition to formal profes-sional development opportunities, the lit-erature increasingly describes how teachers learn by working with their colleagues in professional learning communities (PLCs), engaging in continuous dialog and exami-nation of their practice and student perfor-mance to develop and enact more effective instructional practices. In ongoing oppor-tunities for collegial work, teachers have an opportunity to learn about, try out and
reflect upon new practices in their specific context, sharing their individual knowledge and expertise.
Earlier, we drew a contrast between formal professional development that is provided through structured events — such as cours-es, workshops, conferences, and school visits — and job-embedded professional learning. The former are often provided by external experts while job-embedded learn-ing opportunities often assume that exper-tise is internally located. However, the use of the term “formal” to describe traditional professional development approaches is not to suggest that the work of professional learning communities is wholly “informal.” We recognize that the organization of PLCs is becoming increasingly structured. Fur-thermore, the lines between formal and informal, as well as externally and inter-nally-organized, learning opportunities are becoming deliberately, and perhaps usefully, blurred, as school-based coaching and local study groups may be attached to periodic workshops, institutes, and conferences.
Explicit efforts to develop professional learning communities in American schools must respond to the structural isolation that has given rise to the individualistic, conservative, and present-minded norms described in Lortie’s (1975) seminal study of teaching. Confined to the egg-crate model of classrooms and stymied by the resulting norms of privacy, the U.S. teach-ing occupation has historically offered little opportunity for collective teacher work. Thus, early efforts at creating occasions for teacher collaboration were often found to be differentially effective at focusing on practice and enabling teacher learning, as teachers and reformers did not always have images of how teachers could work and learn effectively together.

Professional Learning in the Learning Profession10
Joint WoRk in sChooL-based Communities
To characterize what she observed occurring in productive teacher learning communities, Little (1990) developed a construct she termed joint work, which requires norms of mutual aid over privacy and “thoughtful, explicit examination of practices and their consequences” (p.520). Beyond other forms of collaboration, joint work involves shared responsibility for the work of teaching, collective conceptions of autonomy, support for teachers’ initiative and leadership with regard to professional practice, and group affiliations grounded in professional work. In concrete terms, joint work can be found in shared planning activities and collaboration on curriculum, when teachers work in grade level teams that share students or content goals, or when teachers observe and critique each other’s instruction based on a shared understanding of effective teaching and goals for student learning. Interdependence between teachers is cultivated through these activities. Little found that when teachers rely on each other to complete a task, it forces them to bare their practice publicly; this interaction provides opportunities to create a shared technical language and to agree upon sound practice.
Using this more complex understanding of the work that happens in effective collaboration, studies have attempted to understand how teacher communities that engage in joint work are formed and supported (Hord, 1997; Newman & Wehlage, 1997, Newman et al, 1996). In their study of 900 teachers in 24 nationally selected restructuring elementary, middle, and high schools, Louis, Marks, and Kruse (1996) examined the structural
and human resource conditions necessary for the possibility of teacher professional community. They found that smaller school size, and common planning time were key in providing opportunities for teachers to form professional communities, as were supportive leadership, mutual respect steeped in strong professional knowledge, and a climate that invites risk taking and innovation. They also found that lower staffing complexity (i.e. more staff who are directly involved in teaching and learning) and the empowerment of teachers as decision makers were strongly highly correlated with professional community.
These features are consistent with those identified in a review of research regarding the construction of professional learning communities that can elicit the collabora-tion necessary for teacher learning and student improvement (Hord, 1997). Five attributes of effective professional commu-nities were identified, including supportive and shared leadership, collective creativity, shared values and vision, supportive condi-tions and shared personal practice.
These larger structures give some idea of the prerequisites for professional commu-nity, but a finer lens is required to examine the types of interactions and processes in communities that foster teacher learning. In order to understand the dynamics that al-low effective collaboration to occur, schol-ars have conducted many case studies of teacher professional communities that take on the “optimistic premise” (Little, 2003, p. 938) that communities play a critical role in teacher development, and look closely at what processes and interactions serve as precursors for teacher learning (Achinstein, 2002; Grossman, Wineberg, and Wool-worth, 2001; Hollins et al, 2004; Horn, 2005; Little, 2003).
Defining Effective Professional Development 11
In documenting the slow and deliberate progress of forming a professional commu-nity among high school social studies and English teachers in one school, Grossman, Wineberg, and Woolworth (2001) found that, although participants were initially re-luctant to break through established norms of autonomy and individuality, the group’s purpose — the cre-ation of interdisci-plinary curriculum — became the basis for meaningful joint work. They identified particular markers for the development of community, in-cluding communal responsibility for individual growth, a formation of group identity and norms of interaction, and a productive use of difference and conflict.
Little (2003) studied three different school-based departmental and grade-level teacher communities to understand the specific dynamics between colleagues that enable teacher communities to become intellectual, social, and material resources for teacher growth and learning. Through observations, interviews, school documents and audio and videotaped records of interaction among teachers in school, Little found that learning occurred as teachers learned to describe, defend, and adjust their practices according to an emerging, collectively held standard of quality teaching. She observed that teacher communities initially faced some difficulty in determining a shared purpose for the group, and in ensuring that all members participated and benefited equally. Furthermore, she found that when teachers first shared experiences of their
practice they were often “decontextualized, disembodied accounts of the classroom” and were not a rich resource for learning. However, the potential for learning grew as teachers attempted to “recontextualize” practice as a group and as they discussed student work, curriculum, and instructional choices as ways to improve practice.
While qualitative studies have sought to examine how professional com-munities are formed and how they oper-ate, a number of large-scale studies have illustrated how collaborative, job-embedded, profes-sional learning that
is focused on student performance has resulted in changed practices and improved student achievement (Bryk et al,1999; Calkins, Guenther, Belfiore, & Lash, 2007; Goddard, Goddard & Tschannen-Moran, 2007; Louis & Marks, 1998; Supovitz & Christman, 2003). In a comprehensive five-year study of 1500 restructuring schools, Newmann & Wehlage (1997) analyzed three sets of data (School Restructuring Study, National Educational Longitudinal Study, and Study of Chicago School Re-form) to understand how various reforms influence improved educational experiences for students. In their findings the authors link successful professional learning com-munities to reduced dropout rates among students, lower absenteeism rates, academic achievement gains in math, science, his-tory, and reading. A final important find-ing was that particular characteristics of strong professional community — that is shared intellectual purpose and a sense of collective responsibility for student learn-
When teachers rely on each other to complete a
task, it forces them to bare their practice publicly;
this interaction provides opportunities to create a shared technical language and to agree
upon sound practice.
Professional Learning in the Learning Profession12
ing — reduced the “traditionally strong relationship between socioeconomic status and achievement gains in mathematics and science” (p. 37).
As we describe below, job-embedded, pro-fessional learning reflecting Little’s con-cept of joint work can take several forms that result in changes in teaching practices and, in some studies, measured increases in student achievement (for a review, see Vescio, Ross and Adams, 2008). In each of these forms, teachers engage in group processes around a concrete enterprise that results in shared learning (Ball and Cohen, 1999; Little, 1990; Putnam & Borko, 2000; Wenger, 1998).
Peer Observations of PracticeA regular practice of teachers in profes-sional communities is visiting and observ-ing each others’ classrooms. Peers provide feedback and assistance to support indi-vidual learning, community improvement and ultimately student learning (Hord, 1997). Critical Friends Groups trained to use protocols designed by the National School Reform Faculty have successfully engaged in this type of professional learn-ing. A study relying on observations and interviews of teachers using the protocols in 12 schools revealed noticeable changes in practice. Teachers’ instruction became more student-centered, with a focus on ensuring that students gained mastery of the subject as opposed to merely covering the mate-rial. In survey responses, teachers in these schools also reported having more opportu-nities to learn and a greater desire to con-tinuously develop more effective practices than teachers not participating in Critical Friends Groups (Dunne, Nave & Lewis, 2000). Teachers can also use videotapes of teaching as a way to make aspects of their practice public and open to peer critique,
learn new practices and pedagogical strate-gies, and analyze aspects of teaching prac-tice that may be difficult to capture other-wise (Sherin, 2004). This kind of work in contexts like National Board Certification has been found to change teachers’ prac-tices, their knowledge, and their effective-ness (Lustick & Sykes, 2006; Sato, Chung, & Darling-Hammond, 2008; Vandevoort, Beardsley, & Berliner, 2004).
Analyzing Student Work and Student DataThe focus of productive professional learn-ing communities is often an examination of student work. Analyzing student work together allows teachers opportunities to develop a common understanding of what good work is, what common misunder-standings student have and what instruc-tional strategies may or may not be work-ing and for whom (Ball and Cohen, 1999; Dunne, Nave & Lewis, 2000; Little, 2003). A study investigating three high achiev-ing schools that have continuously ‘beaten the odds’ on standardized tests found that teachers’ use of multiple student data sourc-es to collectively reflect upon and improve instructional practices in team meetings contributed to increases in student achieve-ment (Strahan, 2003).
Developing Study GroupsA range of studies suggest that when teach-ers in professional communities study prac-tice and research together, they can support one another in implementing new ideas (Killion, 1999, 2002a, 2002b; Hollins et al, 2004). For example, a case study of a suc-cessfully reforming middle school describes a community that transformed its practice by reading and discussing educational research. Teachers used what they learned in their study groups to improve their as-sessment practices, raise expectations for
Defining Effective Professional Development 13
traditionally underperforming groups, and create curriculum that was relevant and engaging. In interviews, teachers and ad-ministrators reported that these activities and other collaborative work led to the observed increase in student achievement in mathematics and reading (Phillips, 2003).
In a study of an intervention in another inner-city elementary school, Hollins et al. (2004) report that teachers who engaged in a structured dialogue to solve problems of literacy learning ultimately researched and adopted new practices which influenced student achievement. The inquiry groups par-ticipated in a five-step process in which they identified challenges, selected approaches to meet the challenge, implemented the ap-proach, evaluated the approach and then formulated a theory for future practice based on their experiences. Over the course of the two-year examination of these study groups through observations and interviews, the authors found that teachers developed more positive views of their students’ abilities, engaged in meaningful collaboration to develop new instructional strategies, and adopted more successful practices.
LeaRning fRom pRofessionaL Community beyond the sChooL
Positive effects of professional communities that operate beyond the school level have been documented by a number of research-ers (Darling-Hammond & McLaughlin, 1995; Fullan, 1991). These are often or-
ganized via networks that connect teach-ers around subject matter or other shared educational concerns. Lieberman and Wood (2002) reported on the work of the Nation-al Writing Project (NWP), one of the most successful teacher networks, to understand how teacher learning in a community can be a source of efficacy and confidence. The NWP first focuses on creating community amongst a small group of teachers during a five-week summer institute in which teach-ers engage in writing, share their work, and critique their peers. In the process of mak-ing their work public and critiquing others,
teachers learn how to make implicit rules and expectations explicit, and how to give and receive constructive feedback for students.
In addition, the au-thors found that the institutes, which were designed to promote risk taking and col-laboration, provided a foundation for ongoing
learning for teachers once they left. News-letters, annual conferences and opportuni-ties to lead workshops were catalysts for the continuous engagement of those teach-ers with each other and with teachers in their home contexts, creating the intersec-tion of professional learning communities within the school and across the profession.
In her study of two high school math de-partments, Horn (2005) also found produc-tive intersections between the professional development programs the math teachers participated in beyond the school (a Com-plex Instruction training and professional development for using graphing calcula-tors) and their in-school collaboration. She
Teachers who engaged in a structured dialogue to
solve problems of literacy learning ultimately
researched and adopted new practices which influenced student
achievement.
Professional Learning in the Learning Profession14
concluded that the teachers’ school-based “collegial conversations seemed to serve the important purpose of providing dis-cursive and interactional tools for actually implementing some of these [professional development] ideas in their classrooms with students” (p. 232).
Each of these studies augments our knowl-edge of how to create collaborative profes-sional communities that are, as Westheimer (1999) notes, truly collective — challenging the whole school to change practices for student achievement — rather than merely liberal — maintaining individual teachers’ autonomy. The difference lies in a group’s ability to engage in truly joint work, which makes practice public and open to critique, and to develop a collective understanding of what constitutes sound practice. The suc-cess of professional community as a lever for teacher learning requires attention to the processes of making practice public and to the creation of structures which make this possible and desirable.
sChooL-based CoaChing
One strategy that combines some features of traditional professional development with the need for learning about practice in practice is the use of school-based coaches. With an increased focus on improving literacy and mathematics instruction in elementary schools, many school districts and providers of professional development have used coaches to tighten the connection between the training they provide in exter-nal institutes and teachers’ application of the strategies in their classrooms. Coaching models recognize that if professional devel-opment is to take root in teachers’ practice, on-going and specific follow-up is necessary to help teachers incorporate new knowl-edge and skills into classroom practice both
in the short and long term (Guskey, 2000; Garet et al, 2001). Russo (2004) describes school-based coaching in this way:
[S]chool-based coaching generally involves experts in a particular sub-ject area or set of teaching strategies working closely with small groups of teachers to improve classroom prac-tice and, ultimately, student achieve-ment. In some cases coaches work full-time at an individual school or district; in others they work with a variety of schools throughout the year. Most are former classroom teachers, and some keep part-time classroom duties while they coach (p.1).
Many experts note that successful coaching should be offered by accomplished peers and should include “ongoing classroom modeling, supportive critiques of practice, and specific observations” (Poglinco et al., 2003, p.1; see also Showers & Joyce, 1996).
In a review of the literature on coaching conducted as part of an Institute for Edu-cation Sciences evaluation of the Reading First program, Deussen and colleagues (2007) reported mixed findings of the literature on the impact of coaching on instructional practice, which may be associ-ated with variability in coaching quality as a function of both coaches’ expertise and coaching practices. Several comparison-group studies provide evidence that teach-ers who receive coaching are more likely to enact the desired teaching practices and apply them more appropriately than those receiving more traditional professional development (Showers and Joyce, 1996; Neufeld and Roper, 2003; Knight, 2004; Kohler, Crilley, Shearer, and Good, 1997).
Defining Effective Professional Development 15
On the other hand, a study conducted in the Netherlands (Veenman, Denessen, Ger-rits, and Kenter, 2001) found that, while teachers who had been coached felt more confident in their teaching, they were not rated as more effective than teachers who had not been coached. Another small scale study found that teachers who had received coaching on particular strategies did not necessarily know when it was appropri-ate to select one instructional strategy over another (Gutierrez, Crosland, and Berlin, 2001). It is likely that the knowledge base in which coaching is embedded also matters to its outcomes.
Several evaluations have suggested that there is a link between coaching models of professional development linked to re-forms in literacy instruction. For example, Norton (2001) cites impressive achievement gains of students whose school participated in the Alabama Reading Initiative, which utilized a school-based coach-ing model following an intensive 2-week sum-mer institute to provide ongoing support to teachers implementing the new literacy ap-proach. More recently, Blachowicz, Obrochta, and Fogelberg (2005) reported that as a result of a differentiated literacy program and other interventions that utilized a coaching model, the percentage of students meeting benchmark standards in an Illinois district increased markedly. In a study by the Foundation for California Early Lit-eracy Learning, teachers reported that the coaching they received had a positive effect on student achievement (Schwartz & Mc-
Carthy, 2003). Likewise, Lyons and Pinnell (2001) linked achievement gains in reading and writing to literacy coaching. None of these stud ies, however, employed compari-son-group methods with sufficient controls and on a large enough scale to establish a causal link between coach ing and student achievement. More research is necessary to establish these relationships.
mentoRing and CoaChing duRing induCtion
A special subset of coaching and mentor-ing strategies, along with other supports, has been developed as part of induction programs for new teachers. Requirements for such programs have been adopted in more than 30 states, and often serve as the
primary source of pro-fessional development for teachers in the first years of their careers.
In their review of the impact of induction programs, Ingersoll and Kralik (2004) found that mentoring pro-grams increase teacher retention (Cheng & Brown, 1992; Odell & Ferraro, 1992; Spuhler & Zetler, 1995; Henke
et al., 2000; Fuller, 2003). Some research also suggests that well developed induction programs, which include mentors who have structured time with beginning teachers and receive training directly related to beginning teachers’ immediate needs, can increase teacher retention rates and improve the rated performance of the retained teachers (Bartell, 1995; Smith & Ingersoll, 2004; Olebe, 2001).
In the process of making their work public
and critiquing others, teachers learn how to
make implicit rules and expectations explicit, and how to give and receive
constructive feedback for students.
Professional Learning in the Learning Profession16
In a recent review of the literature on teacher induction, Wang, Odell and Schwille (2008) organized the research into three genres based on how outcomes were measured: 1) consistency of reported induction practices with theoretical as-sumptions about high quality induction; 2) teachers’ reports of learning; 3) changes in teaching practice and student achieve-ment. They found a number of studies in which induction practices were compared with theoretical assumptions about effec-tive induction and studies in which teachers reported changes in their ideas about teach-ing, but few that assessed beginning teach-ers’ changes in instructional practice or the impact on student achievement.
In line with other research on professional development, collegial, job-embedded models of support appeared to have more effect on practice than traditional workshop models of training. The two case studies of workshop-based induction included in the 2008 review by Wang, Odell, and Schwill (Barret at al., 2002; Franke et al., 1998) found no substantial impact on beginning teachers’ practices. On the other hand, two case studies of collaboration-based models found, in one case, effects on beginning teachers’ enactment of student-centered science teaching (Eick, 2002), and, in the case of collaborative preservice training program, continued collaboration in the cause of professional learning, even when new teachers’ school contexts did not support a collaborative culture (Rolheiser & Hundey, 1995).
A few studies looked at mentoring pro-grams (Luft & Cox, 2001; Hall, Johnson & Bowman, 1995) and found that begin-ning teachers believed the most valuable components of induction were interacting with and receiving feedback from mentors and observing and being observed by their colleagues. However, these studies did not examine the effects on teachers’ practices or their students’ learning. Other studies of the impact of mentoring have found little effect of mentoring relationships on teachers’ en-actment of desired pedagogical strategies in math (Pourdavood, Grob, Clark, and Orr, 1999; Holohan, Jurkat & Friedman, 2000). Researchers have suggested that effective mentoring may require mentor teachers to receive training in both mentoring tech-niques and the teaching practices that their mentees are expected to learn (Evertson & Smithey, 2000), as well as support from
school administrators for mentors’ work and the new teaching ap-proaches (Holohan, Jurkat & Friedman, 2000).
Another concern is that many induction pro-grams operate under a generic conception of mentoring and do not match teachers by subject area. Some
studies suggest that a subject matter fit and focus may be important. For example, Luft, Roehrig, and Patterson (2003) found that induction programs that focused on subject-specific pedagogy were better able to support beginning teachers’ learning of curriculum standards than those with general pedagogy as the focus. With respect to teacher retention, Smith and Ingersoll’s (2004) analysis of the Schools and Staffing
In line with other research on professional development, collegial,
job-embedded models of support appeared to have
more effect on practice than traditional workshop
models of training.
Defining Effective Professional Development 17
Survey found strong links between the type of induction support received and whether novice teachers stayed in their schools. The types of induction supports most strongly associated with higher retention rates were a mentor in the same subject area, common planning time with teachers in the same subject, regularly scheduled collaboration with other teachers, and being part of a network of teachers. Teacher attrition was reduced by half when teachers received comprehensive induction supports.
One of the difficulties in evaluating the design and effects of induction programs is the lack of information about program de-sign and the wide variability in implementa-tion, coupled with the fact that a wide vari-ety of models are now widespread, so that clean comparisons between treatments are difficult. These problems were evident in a report released in October 2008, on results from the first year of a longitudinal ran-domized control group study of the impact of a teacher induction program offering
mentoring, teacher observations, formative assessments, and professional development workshops across 17 districts, compared to the districts’ regular induction programs. The study sought to examine effects on classroom practices, student achievement, and teacher mobility (Glazerman, et al., 2008). There were no statistically signifi-cant differences in teacher practices, student test scores, or teacher retention between the two groups of teachers; however, it is dif-ficult to draw useful generalizations about induction from these results, since both the “treatment” and comparison groups received substantial support, and there was so much variability in the participation of those who were in the program under study that a common treatment was lacking. The results of this study as well as the research review by Wang, Odell, and Schwille (2008) highlight the need for more rigorous studies of the impact of induction models and components on beginning teachers’ instruc-tional practice, student achievement, and retention.
Professional Learning in the Learning Profession18
nfortunately, while there is greater understanding of what constitutes high-quality professional development, and while more such opportunities are gradually being offered in the United States, surveys find that well-designed opportunities are not representative of most U.S. teachers’ professional development experiences (Blank,
de las Alas, & Smith, 2007). For example, in analyzing national survey results, Birman and colleagues (2007) found that mathematics teach ers averaged 8 hours of professional development on how to teach mathe matics and 5 hours on the “in-depth study” of topics in the subject area during 2003-04. Fewer than 10% experienced more than 24 hours of professional development on mathematics content or pedagogy during the year.
Even the more intensive professional devel-opment activities offered by the Eisenhower professional development grants for mathe-matics and science teachers generally lasted less than a week and included, on average, only 25 contact hours. Most activities did not emphasize collegial work among teach-ers (Garet, et al., 1999), in part because most schools still lack structures for collec-tive work on problems of practice.
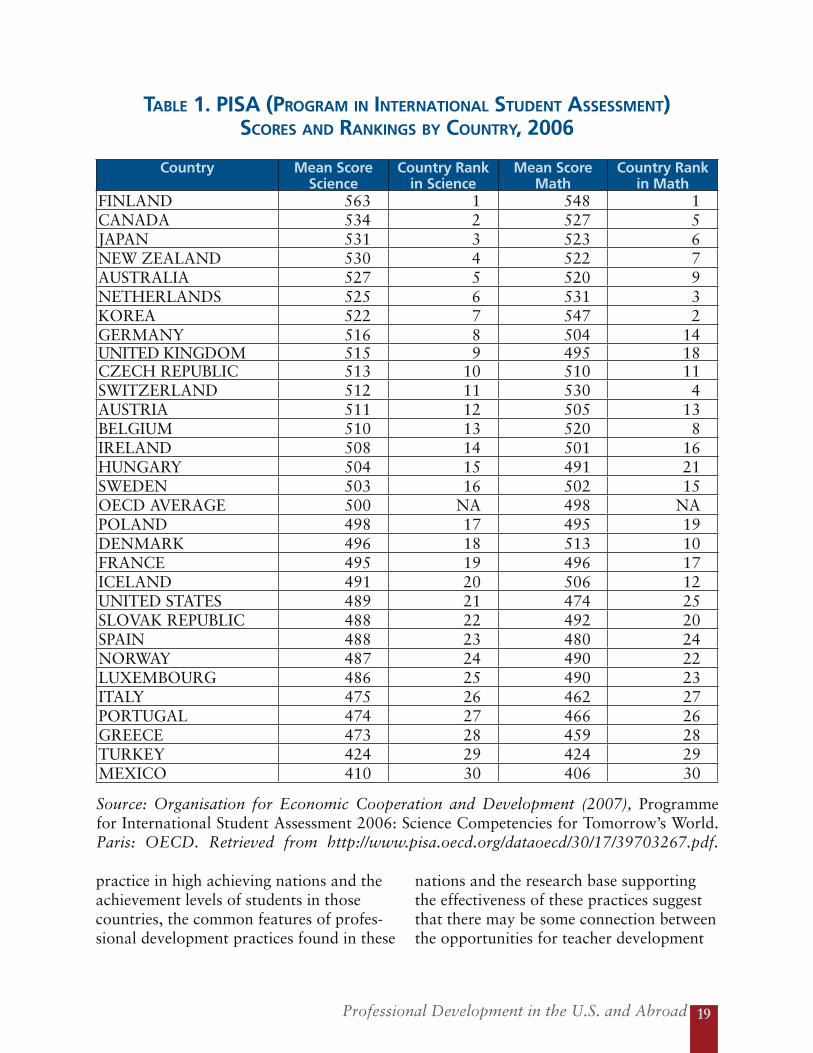
Meanwhile, the supports for effective professional learning we have described above are commonly available in nations that have been recognized as high achiev-ing on international measures such as PISA (Programme for International Student As-sessment) and TIMSS (Third International Math and Science Study). In this review of professional development policies and prac-tices abroad, we focus on those nations that have been top ranked in either the PISA or the TIMMS assessment programs. Under-standing more about how other nations are succeeding can suggest how systems that support teaching and learning are con-structed. See Table 1 (p. 19) for the 2006 PISA rankings. (Note that Singapore and Hong Kong do not participate in PISA but are top ranked on the TIMSS.)
Professional Development in the U.S. and Abroad
UWe found a number of common features characterizing professional development practices in high achieving countries:
• Extensive opportunities for both formal and informal in-service de-velopment;
• Time for professional learning and collaboration built into teachers’ work hours;
• Professional development activi-ties that are embedded in teachers’ contexts and that are ongoing over a period of time;
• School governance structures that support the involvement of teachers in decisions regarding curriculum and instructional practice;
• Teacher induction programs for new teachers with release time for new teachers and mentor teachers, and formal training for mentors.
While we are unable to draw causal in-ferences about the relationship between these features of professional development
Professional Development in the U.S. and Abroad 19
practice in high achieving nations and the achievement levels of students in those countries, the common features of profes-sional development practices found in these
nations and the research base supporting the effectiveness of these practices suggest that there may be some connection between the opportunities for teacher development
tabLe 1. pisa (pRogRam in inteRnationaL student assessment) sCoRes and Rankings by CountRy, 2006
Country Mean Score Science
Country Rank in Science
Mean Score Math
Country Rank in Math
FINLAND 563 1 548 1CANADA 534 2 527 5JAPAN 531 3 523 6NEW ZEALAND 530 4 522 7AUSTRALIA 527 5 520 9NETHERLANDS 525 6 531 3KOREA 522 7 547 2GERMANY 516 8 504 14UNITED KINGDOM 515 9 495 18CZECH REPUBLIC 513 10 510 11SWITZERLAND 512 11 530 4AUSTRIA 511 12 505 13BELGIUM 510 13 520 8IRELAND 508 14 501 16HUNGARY 504 15 491 21SWEDEN 503 16 502 15OECD AVERAGE 500 NA 498 NAPOLAND 498 17 495 19DENMARK 496 18 513 10FRANCE 495 19 496 17ICELAND 491 20 506 12UNITED STATES 489 21 474 25SLOVAK REPUBLIC 488 22 492 20SPAIN 488 23 480 24NORWAY 487 24 490 22LUXEMBOURG 486 25 490 23ITALY 475 26 462 27PORTUGAL 474 27 466 26GREECE 473 28 459 28TURKEY 424 29 424 29MEXICO 410 30 406 30
Source: Organisation for Economic Cooperation and Development (2007), Programme for International Student Assessment 2006: Science Competencies for Tomorrow’s World. Paris: OECD. Retrieved from http://www.pisa.oecd.org/dataoecd/30/17/39703267.pdf.

Professional Learning in the Learning Profession20
and the quality of teaching and learning that result.
Time for Professional Learning and Collaboration One of the key structural supports for teachers engaging in professional learning is the allocation of time in teachers’ work day and week to participate in such activi-ties. In most European and Asian coun-tries, instruction takes up less than half of a teacher’s working time (NCTAF, 1996, and OECD, 2007). The rest of teachers’ working time — generally about 15 to 20 hours per week — is spent on tasks related to teaching like preparing lessons, marking papers, meeting with students and parents, and working with colleagues. Most plan-ning is done in collegial settings, in the con-text of subject matter departments, grade level teams, or the large teacher rooms where teachers’ desks are located to facili-tate collective work.
By contrast, U.S. teachers generally have from 3 to 5 hours a week for lesson plan-ning, usually scheduled independently rather than jointly with colleagues (NCTAF, 1996). U.S. teachers also average far more net teaching time in direct contact with stu-dents (1080 hours per year) than any other member of the Organisation for Economic Cooperation and Development (OECD). By comparison, the OECD average is only 803 hours per year for primary schools and 664 hours per year for upper secondary schools (OECD, 2007). U.S. teachers spent about 80% of their total working time teaching students as compared to about 60% for teachers in these other nations, who thus have much more time to plan and learn together, and to develop high-quality cur-riculum and instruction.
In South Korea — much like Japan and
Singapore — only about 35% of teach-ers’ working time is spent teaching pupils. Teachers work in a shared office space during out-of-class time, since the students stay in a fixed classroom while the teach-ers rotate to teach them different subjects. The shared office space facilitates sharing of instructional resources and ideas among teachers, which is especially helpful for new teachers (Kang & Hong, 2008).
These practices are also found in European nations. For example, in Denmark, Fin-land, Hungary, Italy, Norway, Switzerland and the Flemish community of Belgium, schools provide time for regular collabora-tion among teachers on issues of instruction (OECD, 2004). Teachers in Finnish schools meet one afternoon each week to jointly plan and develop curriculum and schools in the same municipality are encouraged to work together to share materials.
A majority of schools in high-achieving na-tions also provide time for teachers’ pro-fessional development by building it into teachers’ work day and/or by providing class coverage by other teachers. Among OECD nations, more than 85% of schools in Belgium, Denmark, Finland, Hungary, Ireland, Norway, Sweden, and Switzerland provide time for professional development in teachers’ work day or week (OECD, 2004). When time for professional develop-ment is built into teachers’ working time, their learning activities can be ongoing and sustained, and can focus on a particular is-sue or problem over time.
Job-embedded, professional learning time also supports the kind of context-specific professional learning and action research that has been found to be more effective in catalyzing improvements in teaching practice. Active research on a topic related
Professional Development in the U.S. and Abroad 21
to education is fairly common in Western European schools where professional devel-opment time is built into the teachers’ work time. In Denmark, Finland, Italy, and Nor-way, teachers participate in collaborative research and/or development on topics re-lated to education both in their pre-service preparation and in their ongoing work on the job (OECD, 2004). Similarly, England, Hungary, and Ontario (Canada) have cre-ated opportunities for teachers to engage in
school-focused research and development. Teachers are provided time and support for studying and evaluating their own teach-ing strategies and school programs and in sharing their findings with their colleagues, and through conferences and publications (OECD, 2005).
A highly developed practice in Japan and China — one that is now spreading to other nations — is the “research lesson”
Japan’s Lesson Study Approach to Professional Development
n Japan kenkyuu jugyou (research lessons) are a key part of the learning culture. Every teacher periodically prepares a best possible lesson that dem-onstrates strategies to achieve a specific goal (e.g., students becoming active problem-solvers or students learning more from each other) in collaboration
with other colleagues. A group of teachers observe while the lesson is taught and usually record the lesson in a number of ways, including videotapes, audiotapes, and narrative and/or checklist observations that focus on areas of interest to the instructing teacher (e.g., how many student volunteered their own ideas). After-wards, the group of teachers, and sometimes outside educators, discuss the les-son’s strengths and weakness, ask questions, and make suggestions to improve the lesson. In some cases the revised lesson is given by another teacher only a few days later and observed and discussed again (Fernandez, 2002; Pang, 2006; Barber & Mourshed, 2007).
Teachers themselves decide the theme and frequency of research lessons. Large study groups often break up into subgroups of 4-6 teachers. The subgroups plan their own lessons but work toward the same goal and teachers from all sub-groups share and comment on lessons and try to attend the lesson and follow-up discussion. For a typical lesson study, the 10-15 hours of group meetings are spread over 3-4 weeks. While schools let out between 2:40 and 3:45 pm, teach-ers’ work days don’t end until 5:00 pm, which provides additional time for colle-gial work and planning. Most lesson study meetings occur during the hours after school lets out. The research lessons allow teachers to refine individual lessons, consult with other teachers and receive feedback based on colleagues’ observa-tions of their classroom practice, reflect on their own practice, learn new content and approaches, and build a culture that emphasizes continuous improvement and collaboration (Fernandez, 2002).
I
Professional Learning in the Learning Profession22
(or “lesson study”) approach to profes-sional inquiry. (see “Japan’s Lesson Study Approach,” p. 21.) When engaged in lesson study, groups of teachers observe each oth-er’s classrooms and work together to refine individual lessons, expediting the spread of best practices throughout the school (Bar-ber & Mourshed, 2007).
Some teachers also provide public research lessons, which expedites the spread of best practices across schools, allows principals, district personnel, and policymakers to see how teachers are grappling with new sub-ject matter and goals, and gives recognition to excellent teachers (Fernandez, 2002).
Formal Professional DevelopmentIn addition to ongoing work to improve practice that is supported within schools, many high-achieving nations also organize extensive professional development that draws on expertise beyond the school. While relatively few countries have estab-lished national professional development requirements, Singapore, Sweden and the Netherlands require at least 100 hours of professional development per year, beyond the many hours spent in collegial planning and inquiry (OECD, 2005 and Barber & Mourshed, 2007).
This emphasis on professional development requires significant investment on the part of the ministries of education. In Swe-den,104 hours or 15 days a year (approxi-mately 6% of teachers’ total working time) are allocated for teachers’ inservice training (OECD, 2005), and in 2007, the national government appropriated a large grant to establish a teachers’ in-service training program called “lifting the teachers.” The grant pays the tuition for one university course for all compulsory school and pre-school teachers, and will support 80% of a
teacher’s salary while the teacher works in a school for 20% of her time and studies in a university post-graduate program for the remaining time (K. Ronnerman, personal communication, June 23, 2008).
After their fourth year of teaching, South Korean teachers are required to take 90 hours of professional development courses every 3 years. Also, after 3 years of teach-ing teachers are eligible to enroll in a 5-week (180 hour) professional develop-ment program approved by the government to obtain an advanced certificate, which provides an increase in salary and eligibility for promotion (Kang & Hong, 2008).
In Singapore, the government pays for 100 hours of professional development each year for all teachers in addition to the 20 hours a week they have to work with other teachers and visit each others’ classrooms to study teaching. Currently teachers are being trained to undertake action research projects in the classroom so that they can examine teaching and learning problems, and find solutions that can be disseminated to others. (See “Singapore’s Investment in Teacher Professional Learning,” p. 23.) With government funding, teachers can take courses at the National Institute of Ed-ucation toward a master’s degree aimed at any of three career ladders that help them become curriculum specialists, mentors for other teachers, or school principals. These opportunities build their own expertise and that of the profession as a whole, as their work in these roles supports other teachers.
A few countries have established national training programs. For example, England instituted a national training program in best-practice training techniques, which coincided with a subsequent rise in the percentage of students meeting the target

Professional Development in the U.S. and Abroad 23
Singapore’s Investment in Teacher Professional Learning
mong its many investments in teacher professional learning is the Teacher’s Network, established in 1998 by the Singapore Ministry of Education as part of Prime Minister Goh Chok Tong’s new vision, “Thinking Schools, Learning Nation.” This vision aims to produce life-long learners by making
schools a learning environment for everyone from teachers to policy makers and having knowledge spiral up and down the system. The Teacher’s Network’s mis-sion is to serve as a catalyst and support for teacher-initiated development through sharing, collaboration, and reflection. The Teacher’s Network has six main interre-lated components: (1) learning circles, (2) teacher-led workshops, (3) conferences, (4) well-being program, (5) a website, and (6) publications (Tripp, 2004; Salleh, 2006).
In a Teacher’s Network learning circle 4-10 teachers and a facilitator collaborative-ly identify and solve common problems chosen by the participating teachers using discussions and action research. The learning circles generally meet for eight two-hour sessions over a period of 4-12 months. Supported by the national university, Teacher’s Network professional development officers run an initial whole-school training program on the key processes of reflection, dialogue and action research and a more extended program to train teachers as learning circle facilitators and mentor facilitators in the field. A major part of the facilitator’s role is to encour-age the teachers to act as co-learners and critical friends so that they feel safe to take the risks of sharing their assumptions and personal theories, experimenting with new ideas and practices, and sharing their successes and problems. Discuss-ing problems and possible solutions in learning circles fosters a sense of collegiality among teachers and encourages teachers to be reflective practitioners. Learning circles allow teachers to feel that they are producing knowledge, not just dissemi-nating received knowledge (Tripp, 2004; Salleh, 2006).
Teacher-led workshops provide teachers an opportunity to present their ideas and work with their colleagues in a collegial atmosphere where everyone, including the presenter, is a co-learner and critical friend. Each workshop is jointly planned with a Teacher’s Network professional development officer to ensure that everyone will be a co-learner in the workshop. The presenters first prepare an outline of their workshop, then the professional development officer helps the presenters surface their tacit knowledge and assumptions and trains them in facilitation so that they do not present as an expert with all the answers, but share and discuss the chal-lenges they face in the classroom. The process is time consuming, but almost all teacher presenters find that it leads to them grow professionally (Tripp, 2004).
A
Professional Learning in the Learning Profession24
literacy standards from 63% to 75% in just three years (Barber & Mourshed, 2007). The training program is part of the Na-tional Literacy Strategy (NLS) and National Numeracy Strategy (NNS), which provide resources to support implementation of the national curriculum frameworks. These include packets of high quality teach-ing materials, resource documents, and videos depicting good practice. A “cascade” model of training — similar to a trainer of trainers model — is structured around these resources to help teachers learn and use productive practices. The National Literacy and National Numeracy Cen-ters provide leadership and training for teacher training institutions and consultants, who train school heads, coordina-tors, lead math teachers and expert literacy teachers, who in turn support and train other teachers (Fullan, 2007b; Earl, Watson, & Torrance, 2002).
As more teachers become familiar with the strategies, expertise is increasingly located at the local level with consultants and leading mathematics teachers and literacy teachers providing support for teach-ers (Earl, Watson, & Torrance, 2002). In 2004, England began a new component of the Strategies designed to allow schools and local education agencies to learn best practices from each other by funding and supporting 1,500 groups of six schools each (Fullan, 2007b).
Since 2000, the Australian government has been sponsoring the Quality Teacher
Programme, a large scale program that provides funding to update and improve teachers’ skills and understandings in priority areas and enhance the status of teaching in both government and non-government schools. The Programme operates at three levels: (1) Teaching Australia (formerly the National Institute
for Quality Teaching and School Leadership); (2) National Projects; and (3) State and Territory Projects. Teaching Australia facilitates the development and implementation of nationally agreed upon teaching standards, conducts research and communicates research findings, and facilitates and coordinates professional development courses. The National Projects have a national focus
and include programs designed to identify and promote best practice, support the development and dissemination of professional learning resources in priority areas, and develop professional networks for teachers and school leaders. The State and Territory Projects fund a wide variety of professional learning activities for teachers and school leaders under agreements with state and territory education authorities. The State and Territory Projects allow professional development activities to be tailored to local needs and include school-based action research and learning, conferences, workshops, on-line or digital media, and training of trainers, school project and team leaders (Skilbeck & Connell. 2003; Atelier Learning Solutions, 2005).
Many countries offer professional
development programs specifically for new
teachers, and induction programs are mandatory
in many countries, including Australia,
France, Greece, Israel, Italy, Japan, Korea, New Zealand, and
Switzerland.
Professional Development in the U.S. and Abroad 25
In 2002, Western Australia initiated the Getting it Right (GiR) Strategy, which provides specialist teaching personnel, professional development, and support to select primary schools across the school system. The strategy is intended to improve literacy and numeracy outcomes of high needs students, with a focus on Aboriginal students and other students at risk of not making satisfactory progress, to achieve a greater parity of outcomes for all groups of students (Meiers, et.al., 2006). Each school selects a highly regarded teacher with inter-est and expertise in numeracy or literacy to be a Specialist Teacher (ST), who is then trained through a series of seven three-day intensive workshops over the course of their initial two-year appointment. The Specialist Teacher works “shoulder to shoulder” with teachers in their schools, for about half a day each week for each teacher. The Specialist Teachers monitor and record student learning, help teachers analyze student performance data and set performance goals for underperforming stu-dents, model teaching strategies, plan learn-ing activities to meet the identified needs of students, assist with the implementation of these activities, and provide access to a range of resources. The Specialist Teach-ers work collaboratively with teachers on continuous professional development and bring useful knowledge to the core teach-ing tasks of planning and teaching in a way that breaks through teacher isolation and encourages teachers to be reflective about their own practice (Meiers, et.al, 2006; Ingvarson, 2005).
Teacher InductionMany countries offer professional develop-ment programs specifically for new teach-ers, and induction programs are mandatory in many countries, including Australia, France, Greece, Israel, Italy, Japan, Korea,
New Zealand, and Switzerland. A three year study of five nations selected because they provide comprehensive induction pro-grams (Switzerland, China, New Zealand, Japan, and France) highlighted three com-mon features of their approaches:
1. Induction is highly structured, with clear roles for administrators, staff developers, mentors, and others responsible for the development of new teachers.
2. Induction is focused on profes-sional growth and structured learn-ing that are viewed as the entry into a lifelong professional growth pro-cess.
3. Community and collaboration are central to the induction process, using observation, demonstration, discussion, and friendly critique as ways of ensuring that teachers share the language, tools, and practices. (Wong, Britton, & Ganser, 2005, cited in NCTAF, 2005, p.16)
This emphasis on community and collabo-ration is noteworthy, in light of our review of the research on professional learning communities and their potential for sup-porting more powerful, job-embedded professional learning. In China, for ex-ample, both new and experienced teachers participate in extensive peer observation, public lessons with debriefs, “report les-sons” or “talk lessons,” and lesson prepa-ration and teaching research groups. In France, beginning teachers participate in teacher institutes at the local university and are inducted into a community of same-subject teachers who share common tools, language, practice, and experiences. In Switzerland, beginning teachers work in
Professional Learning in the Learning Profession26
practice groups of about six teachers from across different schools and together, they participate in peer observation, observation of more experienced colleagues, and self/peer evaluation within the practice group (NCTAF, 2005).
In a model like that found in a number of Asian nations, the New Zealand Ministry of Education funds 20% release time for new teachers and 10% release time for second-year teachers, and requires schools to have a locally developed program to develop new teachers’ abilities (Britton, 2006). Most of the release time is used to give the new teachers time to attend profes-sional development activities or extra time to perform teacher duties like writing lesson plans. Some time is also used to support mentor teachers in observing and meeting with beginners. Induction programs sup-port new teachers’ observations of other teachers (both in their own school and at other schools), class visits followed by in-formal discussion or written reports, work-ing in a classroom with a mentor teacher, attending meetings for beginning teachers, and attending courses (Clement, 2000).
Mentor teachers and coaches play a key part in launching new teachers into the profession, and some countries (including Israel, Switzerland, France, Norway and England) require formal training for men-tor teachers (OECD, 2005). In Singapore, master teachers are appointed to lead the coaching and development of the teachers in each school (Barber & Mourshed, 2007). Norwegian principals assign an experi-enced, highly qualified mentor to each new teacher and the teacher education institu-tion then trains the mentor and takes part in in-school guidance (OECD, 2005). In some Swiss states the new teachers in each district meet in reflective practice groups
twice a month with an experienced teacher who is trained to facilitate their discussions of common problems for new teachers (Stansbury & Zimmerman, 2000). Eng-land trains new teacher coaches about both effective pedagogies for students and the National Literacy and Numeracy Strategies techniques (Barber & Mourshed, 2007).
Teacher Involvement in Decision-Making One of the policy conditions associated with increased teacher collaboration in many high-achieving nations is the decen-tralization of much curriculum and assess-ment work, often guided by national or state standards. For example, in nations such as Finland and Sweden, highly de-tailed curriculum documents and external tests were replaced in the 1970s and ‘80s by much broader goal statements that were designed to guide teachers’ development of curriculum and instruction. Teachers in these and many other nations are re-sponsible for designing key assessments to evaluate student learning as part of an as-sessment system that includes school-based assessments. In place of professional devel-opment seminars/workshops with topics dictated by national boards of education, the content of professional learning is deter-mined according to local needs and is often embedded in the work of “teacher teams” or “teacher units” at particular schools, which are empowered to make decisions around curriculum and evaluation (Ahl-strand, 1994).
A study of school leadership in Finland (see box, p. 27) found the inclusion of teach-ers and other staff in policy and decision-making to be the norm, with teacher and administrator teams work together on de-veloping syllabi, selecting textbooks, devel-oping curriculum and assessments, deciding on course offerings and budget, planning
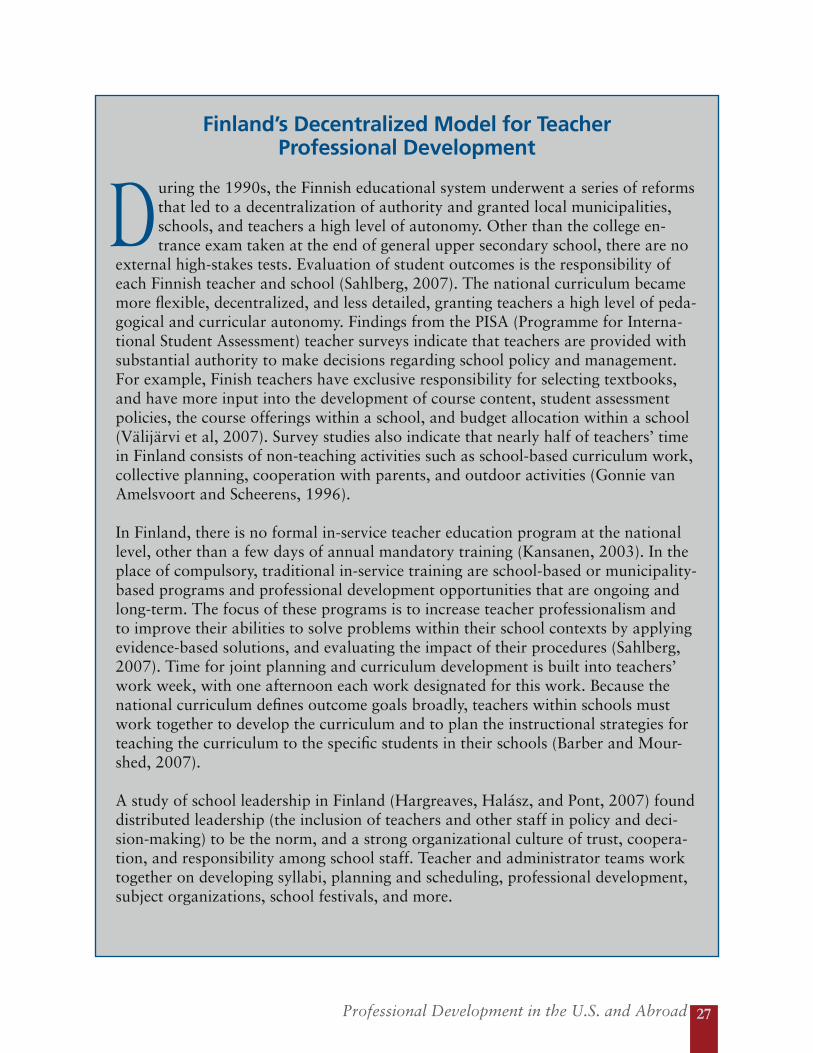
Professional Development in the U.S. and Abroad 27
Finland’s Decentralized Model for Teacher Professional Development
uring the 1990s, the Finnish educational system underwent a series of reforms that led to a decentralization of authority and granted local municipalities, schools, and teachers a high level of autonomy. Other than the college en-trance exam taken at the end of general upper secondary school, there are no
external high-stakes tests. Evaluation of student outcomes is the responsibility of each Finnish teacher and school (Sahlberg, 2007). The national curriculum became more flexible, decentralized, and less detailed, granting teachers a high level of peda-gogical and curricular autonomy. Findings from the PISA (Programme for Interna-tional Student Assessment) teacher surveys indicate that teachers are provided with substantial authority to make decisions regarding school policy and management. For example, Finish teachers have exclusive responsibility for selecting textbooks, and have more input into the development of course content, student assessment policies, the course offerings within a school, and budget allocation within a school (Välijärvi et al, 2007). Survey studies also indicate that nearly half of teachers’ time in Finland consists of non-teaching activities such as school-based curriculum work, collective planning, cooperation with parents, and outdoor activities (Gonnie van Amelsvoort and Scheerens, 1996).
In Finland, there is no formal in-service teacher education program at the national level, other than a few days of annual mandatory training (Kansanen, 2003). In the place of compulsory, traditional in-service training are school-based or municipality-based programs and professional development opportunities that are ongoing and long-term. The focus of these programs is to increase teacher professionalism and to improve their abilities to solve problems within their school contexts by applying evidence-based solutions, and evaluating the impact of their procedures (Sahlberg, 2007). Time for joint planning and curriculum development is built into teachers’ work week, with one afternoon each work designated for this work. Because the national curriculum defines outcome goals broadly, teachers within schools must work together to develop the curriculum and to plan the instructional strategies for teaching the curriculum to the specific students in their schools (Barber and Mour-shed, 2007).
A study of school leadership in Finland (Hargreaves, Halász, and Pont, 2007) found distributed leadership (the inclusion of teachers and other staff in policy and deci-sion-making) to be the norm, and a strong organizational culture of trust, coopera-tion, and responsibility among school staff. Teacher and administrator teams work together on developing syllabi, planning and scheduling, professional development, subject organizations, school festivals, and more.
D
Professional Learning in the Learning Profession28
and scheduling professional development, and more (Hargreaves, Halász, and Pont, 2007; Välijärvi et al, 2007). These delibera-tions are themselves a form of professional development, as teachers study issues and share their ideas.
Similarly, in Sweden, the decentralization of the curriculum and in-service training led to a shift in the focus of the development work at each school from predetermined solutions and prescribed teaching methods from the central education ministry to problems in teachers’ own classrooms. Teachers were then seen not only as the consumers of professional development, but also the producers of knowledge. This has led to a new school culture as a learning organization wherein teachers’ development and knowledge has become the center of school development (Ronnerman, 1996). Teachers are now required to participate in “work units” or “teacher teams,” which meet during regular working hours to discuss and make decisions on common matters in their work, including the planning of lessons, the welfare of pupils, curriculum development and evaluation (Alhstrand, 1994).
Professional development policies and practices in high-achieving nations
reflect many of the principles of effective professional learning outlined by research, providing sustained and extensive opportunities to develop practice that go well beyond the traditional “one-shot” workshop approaches that are more commonly found in the U.S. Building time into teachers’ work schedules provides them with regular and ongoing opportunities to engage in
collaborative inquiry aimed at improving teaching and learning in their unique contexts. Policies that provide schools and teachers with the power to make decisions around local curriculum and assessment practices, and to select the content of professional development based on local priorities, are also associated with higher levels of teacher engagement in collaborative work and learning activities.
Heavy investment in professional development is evident not only in nations that fund major professional development initiatives and national training programs but also in those nations that
provide release time for teachers or reduce the number of their teaching hours to pro-vide more time for professional development. It is apparent that in these high achieving nations, teachers’ professional learning is a high priority and that teachers are treated as professionals. In Finland, the highest scoring OECD nation on all three PISA assessments in 2006, scholars attribute the academic suc-
Professional development policies and practices in high-
achieving nations reflect many of the
principles of effective professional learning outlined by research, providing sustained
and extensive opportunities to
develop practice that go well beyond the
traditional “one-shot” workshop approaches
that are more commonly found in the
U.S.
Professional Development in the U.S. and Abroad 29
cess of their students in part to an emphasis on teachers’ professional learning and the high status of teachers as professionals:
Continuous upgrading of teach-ers’ pedagogical professionalism has become a right rather than an obligation. This shift in teachers’ learning conditions and styles often reflects ways that classroom learn-ing is arranged for pupils. As a consequence of strengthened profes-sionalism in schools, it has become understood that teachers and schools are responsible for their own work and also solve most problems rather than shift them elsewhere. Today the Finnish teaching profession is on a par with other professional work-
ers; teachers can diagnose problems in their classrooms and schools, apply evidence-based and often alternative solutions to them and evaluate and analyze the impact of implemented procedures. Parents trust teachers as professionals who know what is best for their chil-dren (Sahlberg, 2007, p.155).
Like Finland, many of the countries that have established strong infrastructures for high-quality teaching have built them over the last two decades. This suggests that such conditions could be developed in the United States as well, with purposeful effort and clarity about what matters and what works to support professional learning and practice.
Professional Learning in the Learning Profession30
o assess the current status of professional learning opportunities in U.S. schools, as well as trends over time, we examined teacher and school questionnaire data from the federal Schools and Staffing Surveys from 1999-2000 and 2003-04 (National Center for Education Statistics). This data set is the most recent nationally represen-
tative, large scale survey on teachers’ professional development that is available.1
We analyzed the data in terms of professional learning opportunities reported by teachers at the national and state levels and by school types (e.g. grade levels, type of community, and student population served.) We examined:
1. Formal professional development activities (e.g., university courses; workshops, conferences, training sessions offered during or outside of school hours); and the content of those training activities (e.g., con-tent of the subjects they teach, using computers for instruction, teaching special education students); as well as hours spent in these activities, their usefulness ratings of those activities; and resources supporting teacher participation in professional development (e.g., release time, time built into regular work hours for professional development, reim-bursement for tuition, fees, travel expenses);
2. Job-embedded professional de-velopment activities (e.g., teacher collaboration on issues of instruc-tion, collective research on topics of professional interest, peer obser-vation and mentoring) as well as the conditions that support teacher collaboration and learning (e.g., regularly scheduled time during
Tteachers’ work hours, level of influ-ence teachers have over school deci-sions, school climate with regard to teacher cooperation); and
3. Induction programs for beginning teachers (including specific forms of induction supports received such as mentorship, seminars, reduced teaching load) in the first year of teaching.
foRmaL pRofessionaL deveLopment
ParticipationNationally, in 2003-04, almost all U.S. teachers reported participating in work-shops, conferences, or other training ses-sions (92%) over the previous 12 months, a slight decline from the levels of participa-tion in 1999-2000 (95%). Fewer teachers participated in other forms of formal pro-fessional development, including univer-sity courses related to teaching (36%) and observational visits to other schools (22%). About one quarter (25%) of teachers had served as a presenter in a workshop, con-ference, or training session. Among these
1 The 2007-08 survey was being administered at the time this report was being compiled but the data will not be available for another year or more.
The Status of Professional Learning Opportunities in the U.S.
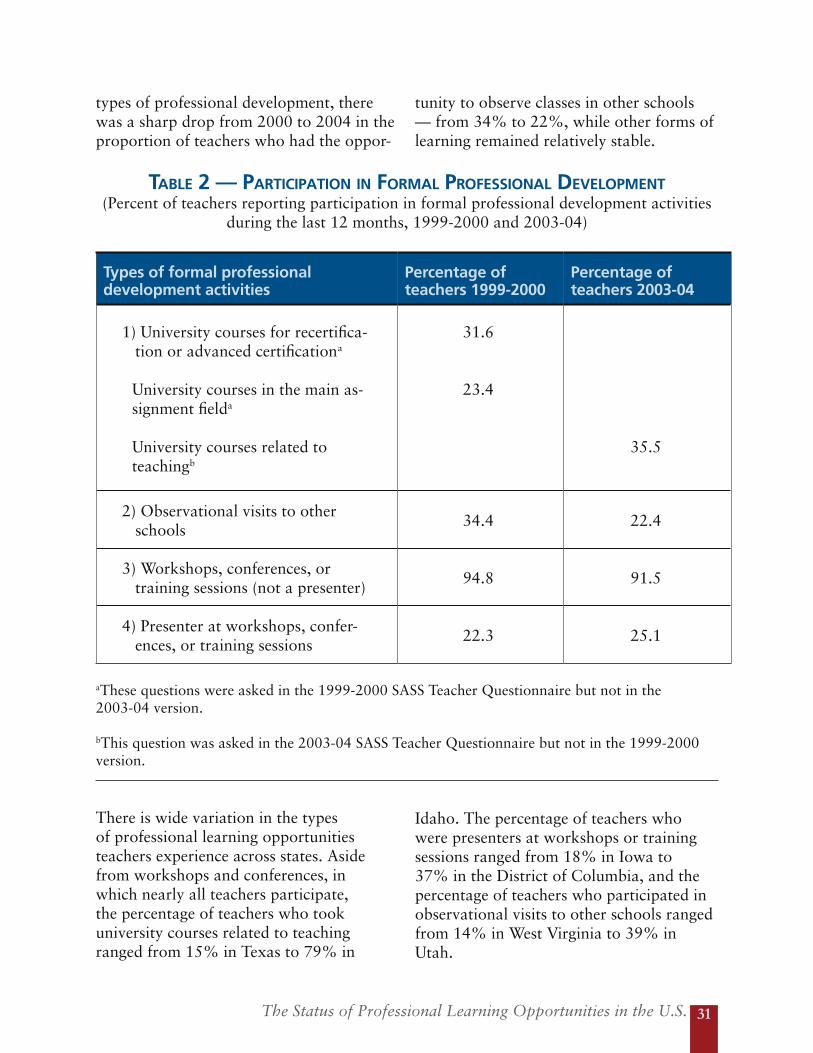
The Status of Professional Learning Opportunities in the U.S. 31
types of professional development, there was a sharp drop from 2000 to 2004 in the proportion of teachers who had the oppor-
tunity to observe classes in other schools — from 34% to 22%, while other forms of learning remained relatively stable.
tabLe 2 — paRtiCipation in foRmaL pRofessionaL deveLopment(Percent of teachers reporting participation in formal professional development activities
during the last 12 months, 1999-2000 and 2003-04)
Types of formal professional development activities
Percentage of teachers 1999-2000
Percentage of teachers 2003-04
1) University courses for recertifica-tion or advanced certificationa
University courses in the main as-signment fielda
University courses related to teachingb
31.6
23.4
35.5
2) Observational visits to other schools
34.4 22.4
3) Workshops, conferences, or training sessions (not a presenter)
94.8 91.5
4) Presenter at workshops, confer-ences, or training sessions
22.3 25.1
aThese questions were asked in the 1999-2000 SASS Teacher Questionnaire but not in the 2003-04 version.
bThis question was asked in the 2003-04 SASS Teacher Questionnaire but not in the 1999-2000 version.
There is wide variation in the types of professional learning opportunities teachers experience across states. Aside from workshops and conferences, in which nearly all teachers participate, the percentage of teachers who took university courses related to teaching ranged from 15% in Texas to 79% in
Idaho. The percentage of teachers who were presenters at workshops or training sessions ranged from 18% in Iowa to 37% in the District of Columbia, and the percentage of teachers who participated in observational visits to other schools ranged from 14% in West Virginia to 39% in Utah.

Professional Learning in the Learning Profession32
Among those who had participated in some form of professional development, teach-ers were asked to report on whether the content of the professional development activities included four topics (the content of the subject(s) they teach, uses of comput-ers for instruction, reading instruction, and
student discipline and management in the classroom). They were also asked to report the number of hours that they participated in professional development on these topics in the past 12 months and to rate the use-fulness of these training sessions on these topics.
tabLe 3 — paRtiCipation in tRaditionaL pRofessionaL deveLopment on fouR topiCs
(Percentage of teachers reporting participation in professional development during the past 12 months)
Topic of Professional Development
Percentage of teachers2003-04
Percentage with >16 hours on topic2003-04
Percentage who rated training on this topic “useful” or “very useful”
1) The content of the subject(s) they teach
83.4 43.3 59.3
2) Uses of computers for instruc-tion
64.9 13.4 42.7
3) Reading instruction 60.0 19 42.5
4) Student discipline and manage-ment in the classroom
43.5 5 27.4
It appears that the improvement of teach-ers’ expertise in how to teach specific con-tent was a major emphasis of professional development. Nationally, 83.4% of teach-ers were engaged in learning opportunities focused on the content they teach, ranging from 75% in Wisconsin to 94% in New Hampshire. However, this learning was not intensive. Most teachers (57%) received fewer than two days (16 hours) of profes-sional development during the previous 12 months. Only 23% of teachers reported that they had received 33 hours or more (more than 4 days) of professional develop-
ment on the content of the subject(s) they teach, a slight increase from 18% four years earlier.
The amount of time spent on professional learning was even smaller for other top-ics. For example, while 60% of teachers received some professional development on reading instruction, and slightly more (64%) on using computers for instruction, the vast majority of these teachers (80%) worked on these issues for two days or less. Across states, participation in professional development regarding reading instruction

The Status of Professional Learning Opportunities in the U.S. 33
ranged from 43% in North Dakota to 76% in Maryland. Whereas nationwide, elemen-tary school teachers were much more likely to participate in such opportunities than secondary teachers (70% vs. 40%), in some states such as Maryland, nearly all teachers are engaged in learning to teach students to read.
There was even more variability in access to learning regarding technology use in the classroom. The percentage of teachers par-ticipating in professional development on the use of computers in instruction ranged from a low of 40% in Hawaii to 93% in Arizona. However, even in Arizona, only 18% of teachers had as much as two days of professional development in this area.
There are other indications that profes-sional development for technology use is inadequate. A 2006 National Education As-sociation survey of nearly 2,000 classroom teachers and teaching assistants found that, although 60% of teachers reported that their districts required technology training, and most felt competent in using technol-ogy for administrative or communications purposes, only about half felt their training for using technology directly with students was adequate. These findings were reflected in teachers’ reports of how they actually used technology in their classrooms. While 76% of teachers reported using technol-ogy for administrative purposes on a daily basis, fewer than half of teachers used technology daily to monitor student prog-ress (41%), for research and information (37%), to instruct students (32%), and to plan and prepare instruction (29%). In ad-dition, teachers in urban schools were less likely than those in suburban and rural/small town schools to use computers on a daily basis for administrative and instruc-tional tasks. The low rates of technology
use for instructional purposes are cause for some concern because of the growing importance of students’ ability to use tech-nology to access information in preparation for their work in a global society (NEA, 2008).
Teachers were also asked to report whether they had participated in at least 8 hours of training during the last 3 years on teach-ing special education students and limited English proficiency students. While 8 hours represents a modest level of attention to these issues, more than two thirds of teach-ers nationally had not had any training on supporting the learning of special educa-tion or LEP students during the previous three years. Participation rates on these two types of professional development varied widely across states, and for training on teaching LEP students, appears to be some-what related to the school-age populations in these states. States with high percent-ages of English learners had more teachers involved in such professional development (64% in California, 52% in Florida, 52% in Arizona, 42% in New York, and 43% in Texas), while rates of participation were low in states like New Hampshire and Ohio (8% each).
Teacher participation in professional development on special education ranged widely from 21% in Idaho (where 11% of the student population received special education services in 2003-04) to 62% in Texas (where 12% of the student population received special education services in 2004). On an item that asked teachers to indicate their agreement level with the statement “I am given the support that I need to teach students with special needs,” only 36% of all teachers across the states agreed with this statement. In addition, on the question that asked
Professional Learning in the Learning Profession34
teachers to select the top three topics for further personal professional growth, professional development on teaching students with special needs was the third most frequently selected topic (15% of teachers) as the number one priority for additional professional development. Overall, these findings indicate that nationally, teachers feel there is a greater need for professional development on teaching special education students. This request was followed closely by a desire for more opportunity to learn about the use of technology. (See Figure 1.)
Adequacy of Professional Learning OpportunitiesThese data indicate that the intensity and duration of professional development offered to U.S. teachers is not at the level research suggests is necessary to have noticeable impacts on instruction and student learning. While many teachers get a day or two of professional development on various topics, very few have the chance to study any aspect of teaching for more than two days. This means most of their professional learning opportunities do not meet the threshold needed for strong effects on practice or student learning. As we noted earlier, Yoon and colleagues (2007) found in their review of research that professional development of 14 hours or less showed no effects on student learning, while longer duration programs — averaging 49 hours of engagement around a specific topic or teaching strategy — showed positive and significant effects on student achievement.
Perhaps because of the short duration, or perhaps because of other aspects of quality, most teachers were not enormously enthusiastic about
the usefulness of the professional development they received. Only 59% found content-related learning opportunities useful or very useful, and fewer than half found the professional development they received in other areas useful, including areas where they would like more opportunities to learn. There was very little variation in these ratings of usefulness across states and school contexts, with a few exceptions. Teachers in the District of Columbia, Louisiana, and Utah rated their professional development experiences higher than the national average on at least three out of the four topics. (See Table 7 in Appendix B for state data.)
Teachers in elementary schools rated their content-focused professional development significantly more highly than teachers in secondary schools. Similarly, teachers in schools with the highest LEP enrollment gave significantly higher ratings to their professional development on content than teachers in schools with lower LEP enrollment. Ratings of professional development on reading instruction were highest for teachers in elementary schools, in schools with the highest enrollments of students were minority, low-income, or limited English proficient.
On a survey item in the 2003-04 SASS Teacher Questionnaire in which teachers were asked to indicate their top priorities for further professional development, content related professional development was listed most commonly (23% of teachers) as the top priority, followed by classroom management (18%), teaching students with special needs (15%), and using technology in the classroom (14%).
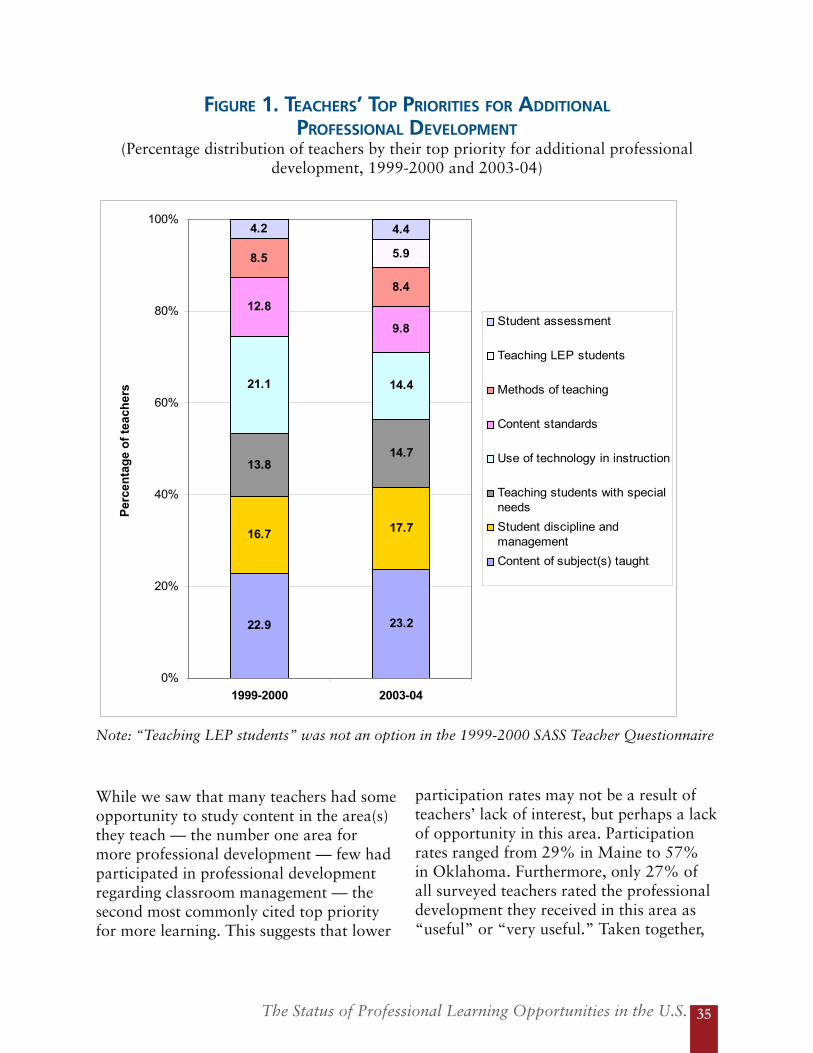
The Status of Professional Learning Opportunities in the U.S. 35
figuRe 1. teaCheRs’ top pRioRities foR additionaL pRofessionaL deveLopment
(Percentage distribution of teachers by their top priority for additional professional development, 1999-2000 and 2003-04)
22.9 23.2
16.7 17.7
13.814.7
21.1 14.4
12.8
9.8
8.5
8.4
5.9
4.2 4.4
0%
20%
40%
60%
80%
100%
1999-2000 2003-04
Per
cen
tag
e o
f te
ach
ers
Student assessment
Teaching LEP students
Methods of teaching
Content standards
Use of technology in instruction
Teaching students with specialneeds
Student discipline andmanagement
Content of subject(s) taught
Note: “Teaching LEP students” was not an option in the 1999-2000 SASS Teacher Questionnaire
While we saw that many teachers had some opportunity to study content in the area(s) they teach — the number one area for more professional development — few had participated in professional development regarding classroom management — the second most commonly cited top priority for more learning. This suggests that lower
participation rates may not be a result of teachers’ lack of interest, but perhaps a lack of opportunity in this area. Participation rates ranged from 29% in Maine to 57% in Oklahoma. Furthermore, only 27% of all surveyed teachers rated the professional development they received in this area as “useful” or “very useful.” Taken together,
Professional Learning in the Learning Profession36
these results suggest that high-quality pro-fessional development on this topic may not be readily available to teachers.
Supports for Professional DevelopmentIn our review of professional development policies and practices abroad, we found that a common support for professional development in high-achieving nations was the provision of time in teachers’ regular work hours to engage in professional learning. In many of those nations, the time that teachers spend engaged in classroom instruction is a much smaller percentage of their working hours than that found in the U.S. (The absolute number of hours spent in classroom instruction is also significantly less in OECD nations than in the U.S.) Due to policies that build in time for professional development and collaborative work in the regular hours of teachers, teachers in those countries are able to engage in professional learning activities that are intensive and sustained over time. In addition, many of those nations have made significant investments in professional development, in many cases underwriting or subsidizing the cost of programs or tuition.
In the 2003-04 SASS Teacher Question-naire, teachers were asked to report whether they were provided with several school supports for participating in pro-fessional development, including release time, scheduled time in the contract year, a stipend when engaging in professional development work outside of work hours, full or partial reimbursement of tuition for college courses, reimbursement for confer-ence or workshop fees, and reimbursement for travel and/or daily expenses. Table 4 below displays the national averages for teachers’ responses on these items for both 2003-04 and 1999-2000. More than three-
quarters of the respondents reported hav-ing scheduled time in the contract year for professional development. However, it is unclear from this question what the dura-tion or frequency of that scheduled time is. As we have seen, very few teachers have the opportunity to engage in more than two days of professional development on any single aspect of their teaching, and few report more than two different kinds of professional development in a year. Thus, it does not appear that scheduled time in the contract year for professional develop-ment is of long duration. A little over half of teachers across states reported having release time to participate in professional development, and about 40% were reim-bursed for workshop or conference fees. Less commonly reported supports were stipends, reimbursement of college tuition, and reimbursement for travel or other ex-penses related to professional development.
In comparing the results for 2003-04 with the prior SASS dataset (1999-2000), we find very slight changes in school supports for professional development activities reported by teachers. There was a slight increase in the% of teachers who reported scheduled time in the contract year for professional development and slight decreases in the% of teachers reporting reimbursement for conference or workshop fees and for travel or expenses related to participation in professional development.
States varied widely in the types of school supports provided to teachers. Some states were more likely to provide release time than others (e.g., 70% in Indiana and Wyoming) or scheduled time in the contract year (e.g., 93% in Connecticut, 91% in Arkansas). Other states focused on provid-ing stipends for professional development outside of regular work hours (64% in
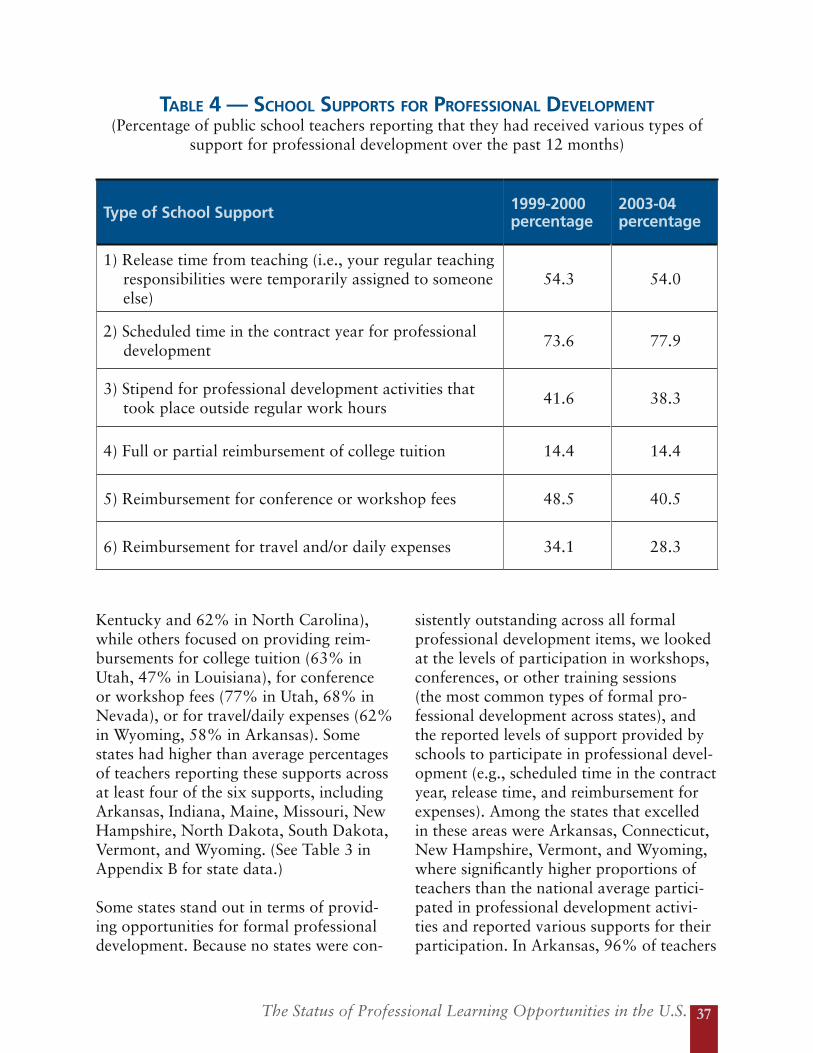
The Status of Professional Learning Opportunities in the U.S. 37
Kentucky and 62% in North Carolina), while others focused on providing reim-bursements for college tuition (63% in Utah, 47% in Louisiana), for conference or workshop fees (77% in Utah, 68% in Nevada), or for travel/daily expenses (62% in Wyoming, 58% in Arkansas). Some states had higher than average percentages of teachers reporting these supports across at least four of the six supports, including Arkansas, Indiana, Maine, Missouri, New Hampshire, North Dakota, South Dakota, Vermont, and Wyoming. (See Table 3 in Appendix B for state data.)
Some states stand out in terms of provid-ing opportunities for formal professional development. Because no states were con-
sistently outstanding across all formal professional development items, we looked at the levels of participation in workshops, conferences, or other training sessions (the most common types of formal pro-fessional development across states), and the reported levels of support provided by schools to participate in professional devel-opment (e.g., scheduled time in the contract year, release time, and reimbursement for expenses). Among the states that excelled in these areas were Arkansas, Connecticut, New Hampshire, Vermont, and Wyoming, where significantly higher proportions of teachers than the national average partici-pated in professional development activi-ties and reported various supports for their participation. In Arkansas, 96% of teachers
tabLe 4 — sChooL suppoRts foR pRofessionaL deveLopment(Percentage of public school teachers reporting that they had received various types of
support for professional development over the past 12 months)
Type of School Support 1999-2000 percentage
2003-04 percentage
1) Release time from teaching (i.e., your regular teaching responsibilities were temporarily assigned to someone else)
54.3 54.0
2) Scheduled time in the contract year for professional development
73.6 77.9
3) Stipend for professional development activities that took place outside regular work hours
41.6 38.3
4) Full or partial reimbursement of college tuition 14.4 14.4
5) Reimbursement for conference or workshop fees 48.5 40.5
6) Reimbursement for travel and/or daily expenses 34.1 28.3
Professional Learning in the Learning Profession38
reported participating in workshops, con-ferences, or other training sessions, with an average of 6.6 events per teacher (as com-pared to 2.3 nationally), and 91% reported having scheduled time in the contract year for professional development. Sixty-three% reported having release time for profes-sional development as well. Similarly, 95% of Connecticut teachers participated in formal professional development activities such as workshops, conferences, and train-ing sessions, with an average of 5.6 events per teacher during the last 12 months, and 93% also reported having scheduled time in the contract year for professional develop-ment. (See boxes, following pages.)
We offer these examples as illustrative of state strategies associated with high levels of teacher participation in certain forms of professional development, but not defini-tive of best practices. Later phases of this study will provide a deeper analysis of professional development state-by-state and will examine more deeply the policies and practices in those states in which effective professional development exists.
Formal Professional Development and Supports across School ContextsA lower percentage of secondary school teachers reported participating in most formal professional development activities than did elementary school teachers. Sec-ondary school teachers who participated in formal professional development events on various topics also rated these sessions less useful than did elementary school teach-ers and a smaller percentage of secondary school teachers reported that they had certain school supports for participating in professional development, including release time, scheduled time in the contract year, and a stipend when the professional devel-opment takes place outside regular work
hours. On the other hand, a significantly higher percentage of secondary school teachers reported receiving reimbursement for conference or workshop fees and for travel or daily expenses than did elementary school teachers. These results suggest that it was more common for elementary teachers to participate in in-service professional de-velopment that is job-embedded and a regu-lar part of teachers’ work responsibilities than secondary teachers, who were more likely to go off site for their professional learning. (See Tables 15-17 in Appendix B for comparisons across school levels.)
Interestingly, teachers in many of the high-est-need schools receive the most profes-sional development in most areas, except the use of computers for instruction. Teach-ers in schools with the greatest propor-tions of minority, low-income, and limited English proficient students had significantly higher rates of participation in formal professional development activities (such as university courses related to teaching, observational visits to other schools, work-shops, conferences, or other training ses-sions). This was true in many areas, includ-ing the content of the subject(s) they teach, reading instruction, student discipline and classroom management, and teaching LEP students, though a smaller percentage re-ceived professional development on the use of computers for instruction than did teach-ers in suburban schools. This last finding was consistent with the NEA (2008) survey cited above. (See Tables 18-29 in Appendix B for comparisons across schools in differ-ent locales and across schools with varying levels of minority, low-income, and LEP student enrollments.)
While teachers in urban schools seem to have higher overall participation rates in formal professional development, a smaller

The Status of Professional Learning Opportunities in the U.S. 39
percentage report receiving school supports for this development, such as release time, or reimbursements for tuition, conference fees, and travel. Still, teachers in schools with the highest levels of minority enroll-ment were most likely to report school supports for professional development, such as release time or stipends when the professional development takes place outside regular school time. However, the highest percentage of teachers reporting scheduled time in the contract year for professional development — 81% - was found in schools with the lowest minority enrollments). (See Tables 20, 23, 26, and 29 in Appendix B for comparisons in reported supports across school contexts.)
These findings are somewhat surprising, given that schools in urban areas, with the highest levels of ethnic and linguistic minorities, as well as the highest levels of poverty, typically have fewer resources than schools in wealthier schools in suburbs with less diverse student populations. However, in 2003, the first year of No Child Left Behind, the amount of federal funding available for professional development in high-need schools was increased, so states and districts made greater investments in schools with lower achievement to boost scores.
Job-embedded pRofessionaL LeaRning
As noted in the review of the research, there is increasing consensus that the most ef-fective forms of professional development are those that are directly related to teach-ers’ instructional practice, intensive and sustained, integrated with school-reform efforts, and that actively engage teachers in collaborative professional communities.
Teachers in many high-achieving nations have these kinds of opportunities on a regu-lar basis, as considerable time is built into their work week for collegial planning and learning, lesson study, and peer observa-tions.
While we don’t have fine-grained national data on these practices, the SASS Teacher Questionnaires asked teachers whether in the last 12 months they have engaged in individual or collaborative research on a topic of professional interest, participated in regularly scheduled collaboration with other teachers on issues of instruction (excluding administrative meetings), partici-pated in peer observations, or participated in a mentor/coaching program either as a mentor/coach or as a recipient of mentor-ing/coaching. The national average percent-ages for these items are displayed in Table 5 (see page 40).
In 2003-04, about 70% of teachers re-ported participating in “regularly scheduled collaboration with other teachers on is-sues of instruction,” a slight decline from the 74% in 1999-2000. Unfortunately, the survey does not specify what “regularly scheduled” means in terms of frequency, or duration, so we do not know whether teachers may be meeting for a couple of hours a month or for 10 hours a week as those in other nations frequently do. There was also a drop in the proportion of teach-ers engaged in individual or collaborative research, from 47% to about 40% over this time period. More, however, were involved in mentoring and coaching (46%), or peer observations (63%).
Our review of professional development practices in high achieving nations in Eu-rope and Asia indicated that in many of these nations, time was built into teach-
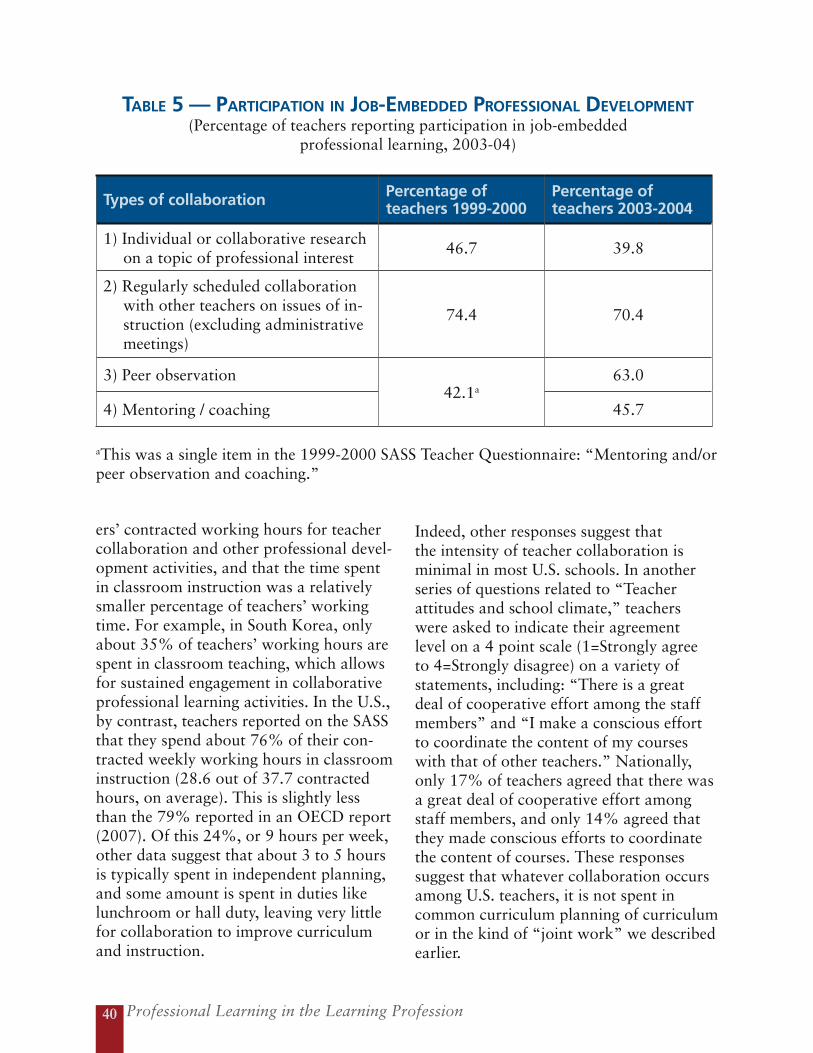
Professional Learning in the Learning Profession40
Indeed, other responses suggest that the intensity of teacher collaboration is minimal in most U.S. schools. In another series of questions related to “Teacher attitudes and school climate,” teachers were asked to indicate their agreement level on a 4 point scale (1=Strongly agree to 4=Strongly disagree) on a variety of statements, including: “There is a great deal of cooperative effort among the staff members” and “I make a conscious effort to coordinate the content of my courses with that of other teachers.” Nationally, only 17% of teachers agreed that there was a great deal of cooperative effort among staff members, and only 14% agreed that they made conscious efforts to coordinate the content of courses. These responses suggest that whatever collaboration occurs among U.S. teachers, it is not spent in common curriculum planning of curriculum or in the kind of “joint work” we described earlier.
tabLe 5 — paRtiCipation in Job-embedded pRofessionaL deveLopment(Percentage of teachers reporting participation in job-embedded
professional learning, 2003-04)
Types of collaboration Percentage of teachers 1999-2000
Percentage of teachers 2003-2004
1) Individual or collaborative research on a topic of professional interest
46.7 39.8
2) Regularly scheduled collaboration with other teachers on issues of in-struction (excluding administrative meetings)
74.4 70.4
3) Peer observation42.1a
63.0
4) Mentoring / coaching 45.7
aThis was a single item in the 1999-2000 SASS Teacher Questionnaire: “Mentoring and/or peer observation and coaching.”
ers’ contracted working hours for teacher collaboration and other professional devel-opment activities, and that the time spent in classroom instruction was a relatively smaller percentage of teachers’ working time. For example, in South Korea, only about 35% of teachers’ working hours are spent in classroom teaching, which allows for sustained engagement in collaborative professional learning activities. In the U.S., by contrast, teachers reported on the SASS that they spend about 76% of their con-tracted weekly working hours in classroom instruction (28.6 out of 37.7 contracted hours, on average). This is slightly less than the 79% reported in an OECD report (2007). Of this 24%, or 9 hours per week, other data suggest that about 3 to 5 hours is typically spent in independent planning, and some amount is spent in duties like lunchroom or hall duty, leaving very little for collaboration to improve curriculum and instruction.
The Status of Professional Learning Opportunities in the U.S. 41
Professional Development Policy and Practice in Connecticut
onnecticut’s teacher quality initiatives and their role in improving classroom practice have been well documented in several studies (e.g., Baron, 1999; Darling-Hammond, 1999; Wilson, Darling-Hammond, and Berry, 2001; Berry, Hopkins-Thompson, and Hoke, 2002). Following significant investments in teacher quality in the late 1980s,
Connecticut has posted significant achievement gains, becoming one of the top scoring states in the nation in mathematics and reading by the end of the 1990s, despite an increase in the proportion of low-income and limited English proficient students during that time.
In 1986, the state’s Educational Enhancement Act appropriated $300 million to increase mini-mum beginning teacher salaries and to equalize salaries across districts. It also included provi-sions that created a staged teacher licensing process that included a beginning teacher induc-tion program (the BEST — Beginning Educator Support and Training — program) and trained mentors for all new teachers and student teachers; required ongoing professional development, including a masters degree for a professional license and continuing education for license re-newal (currently 90 hours or 9 Continuing Education Units every five years). The law required districts to develop professional development plans, career incentive plans, and teacher evalu-ation systems, which were partially funded by the state (Darling-Hammond, 1999). Districts were required to provide state-approved course opportunities every year, free of charge for all teachers. These opportunities for professional development offered by districts and the 90 hour requirement for all teachers partially explain the high levels of teacher participation in formal professional development evidence in the SASS data (B. Sternberg, personal communi-cation, November 4, 2008). Currently, elementary teachers are required to complete 15 hours of training in reading instruction and all K-12 teachers are required to take 15 hours of train-ing in the use of computers in the classroom.
The National Education Goals Panel (1998) identified the state’s intensive professional devel-opment program in mathematics, science and technology as a critical factor in Connecticut’s strong performance and large student achievement gains in mathematics and its teacher invest-ments in reading as a critical factor in the strong performance in reading (Baron, 1999). Since 1983, Connecticut has offered 4-week institutes in math, science, and technology with follow-up support to elementary, middle, and high school teachers. Investments in Reading Recovery training and other supports for literacy development have been credited with the strong read-ing gains that also occurred. In 1995, the state also invested in new curriculum frameworks and a statewide student testing system using performance assessments intended to measure higher order thinking and performance skills. This system is tied to statewide reporting of scores and substantial new professional development, which has served to improve curriculum and teacher development (Darling-Hammond, 1999).
In recent years, spurred by the school improvement provisions of the No Child Left Behind Act, Connecticut engaged in a state-wide effort to train school teams to engage in “Data-Driv-en Decision Making” (School Improvement Network). Using federal funds, they contracted with Doug Reeves of the School Improvement Network to provide direct trainings of several hundred participants at a time, members of school teams, and a training of trainers model was used to expand the scope of this model to local schools across the state (B. Sternberg, personal communication, November 4, 2008).
C

Professional Learning in the Learning Profession42
Formal Professional Development Initiatives in Arkansas
rkansas has been strengthening its professional development supports for many years. In 2003, the state required teachers to complete 30 hours of professional development annually for licensure renewal. In 2005, the State Board of Edu-cation increased the number of annually required hours of professional devel-
opment to 60 for all certified staff and aligned the state’s professional development programs with NSDC’s standards for professional development. Of the 60 required hours, at least 6 hours are to include training in technology and at least 2 hours are to focus on Family Involvement. Twelve hours can be met through time spent at the be-ginning of the school year engaged in a wide range of professional activities, including curriculum planning, grade level or vertical team planning, and team work to analyze student data. The state provides direct professional development services and allows categorical funding (based on the poverty index) to be used for professional develop-ment targeted at improving student achievement. A number of notable statewide professional development initiatives provide the kind of extended, collegial learning opportunities identified by research as needed for changing practice and outcomes. Among these are:
The Arkansas Leadership Academy, established in 1991 to provide training programs and leadership skill development opportunities for teachers, administrators and other school leaders, established the Teacher Institute in 1997. The Academy’s Teacher Insti-tutes, funded privately by the Winthrop Rockefeller Foundation and the Walton Fam-ily Foundation, involve a year-long study in which pairs of classroom teachers spend 13 days in structured, group activities, organized into 4 sessions, spread throughout the year. These sessions are designed to help teachers develop specific skills including action research, collaboration, reflective practice, professional dialogue, and develop-ing professional learning communities, and to equip them to be teacher leaders (Ar-kansas Leadership Academy, 2003). The stated purpose of the Teacher Institute is “to develop Arkansas public school teacher-leaders who are continuous learners and are actively engaged in a statewide, networked learning community which supports the use of diverse teaching and learning practices that will result in high teacher perfor-mance and student achievement.” By 2007, 500 teachers had completed the Teacher Institutes (Arkansas Leadership Academy, 2003-07).
In 1994, Arkansas signed on to participate as one state among 25 states in the State-wide Systemic Initiative (SSI), funded over five years by the National Science Founda-tion to improve math and science instruction. The goal of the Arkansas SSI was to change the system at all levels, including (a) increasing the capacity at the local level by providing professional development to large numbers of teachers and working with school and district leadership teams; (b) establishing regional partnerships to provide ongoing assistance to local districts; and (c) creating a more supportive policy context for improved mathematics and science education. The strategy that Arkansas followed
A
The Status of Professional Learning Opportunities in the U.S. 43
was to expand the reach of its math “Crusades” courses taught by teams of content and pedagogy experts. The Crusades courses, which usually met once a week in the evenings, were offered throughout the state. The grade K–4 Crusades course integrat-ed mathematics, science, and (with support from state funds) language arts, to support teachers responsible for self-contained classrooms. At grades 5–12, a key focus of the course was articulation of content across the grades. One of the major features of the program was to provide teachers with classroom sets of hands-on materials. Over the five years of the Arkansas SSI, more than 8,000 teachers had participated in one of the Crusades programs, with an estimated impact on 87 percent of Arkansas students. Although some aspects of the program were scaled back when the NSF funding ran out in 1999, the initiative has had lasting impacts on the math and science profession-al development infrastructure (Heck et al., 2003). Mathematics specialists continue to provide support and training for more than 200 teacher leaders and coaches across the state, who in turn support teachers in local schools in their efforts to learn about and implement standards-based mathematics instruction.
Since 1999, the state has used this tiered approach to extend the reach of its adopted mathematics professional development program (“Math Solutions”) by inviting el-ementary teachers across the state to a five-day course, which enrolls 300-400 teach-ers each time it is offered. In between the courses, the state math specialists provide follow up and additional classes to help teachers put their learning to use in their daily instructional practice. Judy Trowell, Coordinator of Professional Development for Ar-kansas Mathematics Specialists, reported: “Since our partnership with Math Solutions began, I’ve noticed a real change in the way mathematics is taught. When I observe teachers in their classrooms, I see better ways of questioning students…real efforts to incorporate hands-on experiences in the classroom. Teachers tell me that, after taking the Math Solutions course, they encourage students to share their solutions and strate-gies – they place more value on that kind of sharing and learning.” (Math Solutions, 2008). A Math Solutions specialist commented, “I don’t know of any other state that has this tiered system in place. This is a different approach, and one that is working well for Arkansas. They are charting a new course for building capacity throughout the state” (Math Solutions, 2008). During the period between 2000 and 2005, 8th graders in Arkansas made among the largest gains in mathematics on the National As-sessment of Education Progress, with African American students making particularly large gains (Education Trust, 2006).
The state currently funds the employment of literacy and mathematics specialists (51 in literacy, 16 in K-6 math, and 10 in secondary math as of 2001) to provide tar-geted training to schools and districts to implement a standards-based system focused on reading, writing, and mathematics (Arkansas Department of Education, 2001). Though participation in the program has been voluntary, all districts in the state par-ticipate in this initiative (J. Riggs, personal communication, November 6, 2008).
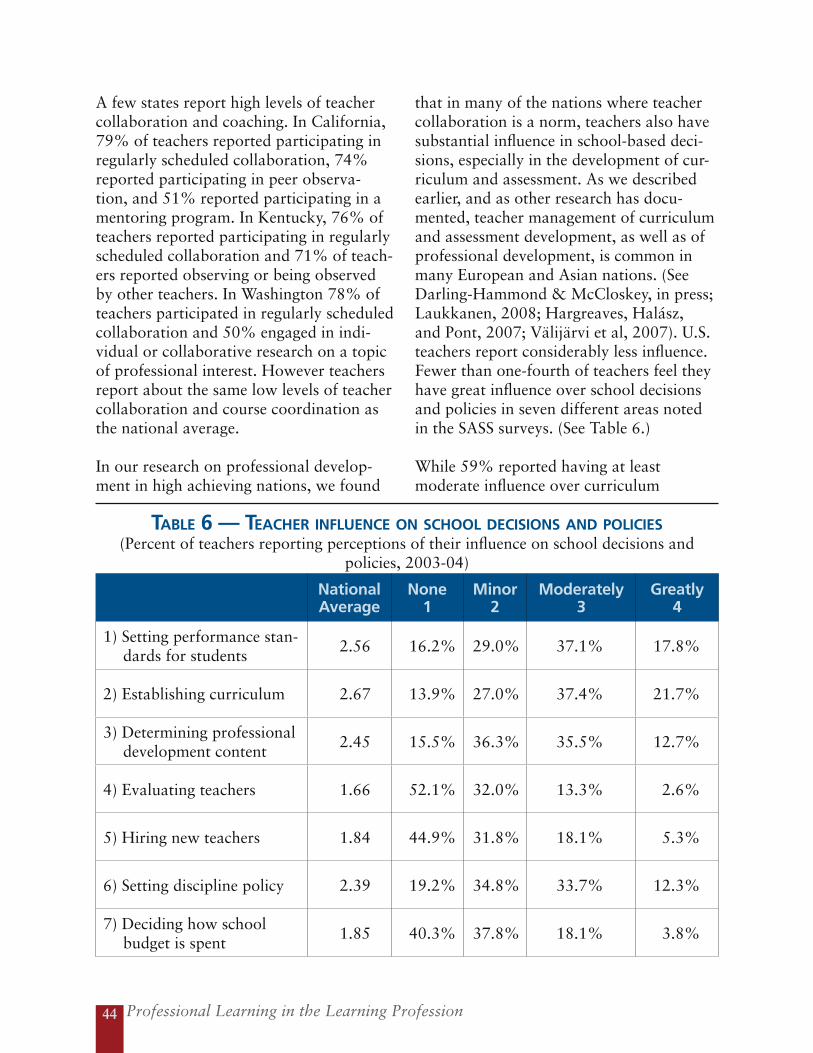
Professional Learning in the Learning Profession44
A few states report high levels of teacher collaboration and coaching. In California, 79% of teachers reported participating in regularly scheduled collaboration, 74% reported participating in peer observa-tion, and 51% reported participating in a mentoring program. In Kentucky, 76% of teachers reported participating in regularly scheduled collaboration and 71% of teach-ers reported observing or being observed by other teachers. In Washington 78% of teachers participated in regularly scheduled collaboration and 50% engaged in indi-vidual or collaborative research on a topic of professional interest. However teachers report about the same low levels of teacher collaboration and course coordination as the national average.
In our research on professional develop-ment in high achieving nations, we found
that in many of the nations where teacher collaboration is a norm, teachers also have substantial influence in school-based deci-sions, especially in the development of cur-riculum and assessment. As we described earlier, and as other research has docu-mented, teacher management of curriculum and assessment development, as well as of professional development, is common in many European and Asian nations. (See Darling-Hammond & McCloskey, in press; Laukkanen, 2008; Hargreaves, Halász, and Pont, 2007; Välijärvi et al, 2007). U.S. teachers report considerably less influence. Fewer than one-fourth of teachers feel they have great influence over school decisions and policies in seven different areas noted in the SASS surveys. (See Table 6.)
While 59% reported having at least moderate influence over curriculum
tabLe 6 — teaCheR infLuenCe on sChooL deCisions and poLiCies(Percent of teachers reporting perceptions of their influence on school decisions and
policies, 2003-04)
National Average
None1
Minor2
Moderately3
Greatly4
1) Setting performance stan-dards for students
2.56 16.2% 29.0% 37.1% 17.8%
2) Establishing curriculum 2.67 13.9% 27.0% 37.4% 21.7%
3) Determining professional development content
2.45 15.5% 36.3% 35.5% 12.7%
4) Evaluating teachers 1.66 52.1% 32.0% 13.3% 2.6%
5) Hiring new teachers 1.84 44.9% 31.8% 18.1% 5.3%
6) Setting discipline policy 2.39 19.2% 34.8% 33.7% 12.3%
7) Deciding how school budget is spent
1.85 40.3% 37.8% 18.1% 3.8%
The Status of Professional Learning Opportunities in the U.S. 45
Professional Development and Teacher Collaboration in Washington State
uring the 1990s, Washington invested in professional development as part of statewide standards-based reforms. New standards and curriculum frame-works, state assessments, and state professional development guidelines were all developed in tandem. In 1993 the state legislature passed the Student
Learning and Improvement Act, referred to as the Education Reform Act, which implemented content standards and state assessment measures over a 10 year peri-od. The law allocated additional funds to professional development, providing small discretionary grants to schools to create school-based restructuring plans and estab-lishing 16 Learning and Assessment Centers in the state, operated by the governor’s Commission on Student Learning (CSL), to offer training on the reform. The CSL used a training-of-trainers model and provided tool kits for teaching and learning of new standards (Stecher, Chun, Barron, & Ross, 2000; Laguardia, et al., 2002).
During the initial years of the reform, funding was provided for Student Improve-ment Learning Grants for teachers to use for professional development, which in-cluded the development of more effective classroom assessments. Later the program was modified to focus on literacy and mathematics. In 1999, the monetary awards were replaced by additional professional development days in teachers’ contracts and districts added three days to school calendars to allow teachers to focus on improving student learning and to meet the goals of the reform. Districts, schools and teachers worked to align classroom practices with the standards in the reform (LaGuardia et al, 2002). Case studies of exemplary schools indicate that schools engaged in collaborative activities to align classroom practices with the reform. Teachers met in grade level teams, across grade levels and in district networks to ad-dress student progress and determine appropriate sequence and scope of curriculum (Stecher & Borko, 2002).
Piloted in 2002 and implemented in 2005, Washington launched a new professional development initiative which emphasizes performance assessment over “clock-hours” as evidence of professional growth for professional certification. Individual teachers, learning communities, and grade level or subject matter teams can submit professional growth plans, which much be aligned with school goals and student needs and include goals found in the research-based Washington Sate Professional Development Planning Guide. Upon approval of a district professional development committee, teachers can earn up to 60 of the required 150 clock hours of profes-sional development credit required for several types of certification (OSPI, 2006). These initiatives have stimulated many forms of teacher collaboration focused on improving student learning.
D
Professional Learning in the Learning Profession46
decisions, and a small majority (55%) said the same about setting performance standards for students, only 48% felt they had even moderate influence on determining the content of in-service professional development. Even smaller shares of teachers felt they influenced policies or decisions regarding teacher hiring (23%), the school budget (22%), or teacher evaluation (16%). The levels of influence that teachers reported in the 2006 Met Life Survey of the American Teacher were more optimistic. Of the
1,001 teachers surveyed, 60% rated their influence on policies that affect them as adequate, with most rating as “adequate” their influence on the training they receive (77%), the school curriculum (75%), and “team building and problem solving” (87%). In both surveys, teachers in urban schools were substantially less satisfied than teachers in non-urban schools with their influence on policies that affect them, on the training they receive, and their school curriculum (MetLife, 2006).
Kentucky’s Model of Professional Development and Collaboration
s part of the 1990 Kentucky Education Reform Act, the Kentucky Department of Education (KDE) established nine regional service centers which supply resource teachers and materials to improve instruction throughout the state. The law increased funding for professional development from less than $1
per student to $23 per student annually over several years (McDiarmid & Cocoran, 2000). As part of a multifaceted professional development plan, schools were al-lotted 65% of the professional development funds, while 35% went to districts. In 1994, state law required school site councils to submit annual plans outlining the content of professional development, its alignment with the reform, and describing how all members of the school would be served by the plan. In addition, the Ken-tucky reform included an innovative student mathematics and writing portfolio that was implemented and evaluated by teachers. The Department created a complex trainer-of-trainer model in which each teacher in the state was trained on the imple-mentation and scoring of the portfolios and provided with supplemental resources. Resource teachers supported 700 cluster leaders throughout the state, who in turn supported every teacher implementing the reform (Borko, Elliot, & Uchiyama, 1999).
In 1999, regulations encouraged professional development that included summer institutes and school improvement activities, including curriculum work with col-leagues, study groups and teacher networks, as legitimate professional development activities (McDiarmid & Corcoran, 2000). Kentucky currently requires four days of professional development in which teachers are engaged in effective learning processes and collaborative and collegial activities. The local school based council determines the content of three of the days and the district superintendent has dis-cretion to use one of the days for districts wide activities (KDE, 2007).
A
The Status of Professional Learning Opportunities in the U.S. 47
Teacher Collaboration and Participation in Decision Making across School ContextsParalleling the findings on formal profes-sional development, elementary teachers participated at higher rates than second-ary teachers in regularly scheduled col-laboration with other teachers on issues of instruction (75% vs. 63%). On the other hand, elementary teachers were less likely than secondary teachers to agree that there was a great deal of cooperative ef-fort among staff members (15% vs. 21%) and that they make conscious efforts to coordinate course content (11% vs. 19%). Elementary and secondary teachers also varied in their perceptions of how much influence they had on school decisions, with elementary teachers reporting a greater level of influence than secondary teachers on determining the content of in-service professional development, hiring teachers, setting discipline policy, and deciding how the school budget will be spent. Second-ary teachers reported a significantly greater level of influence than elementary teachers on establishing curriculum and evaluating teachers. (See Tables 30-32 in Appendix B for differences across school grade levels.)
Teachers in urban schools and in schools with high levels of minority, LEP, and low-income student enrollment had the highest rates of participation in regularly scheduled collaboration with other teach-ers, peer observation, coaching or mentor-ing. For example, while 68% of teachers in urban schools reported participating in peer observations, only 63% of teachers in suburban schools and 56% of teachers in rural schools did so. Teachers in these contexts (urban, high minority/LEP/poor student enrollment) were also more likely to agree that there was a great deal of coop-erative effort among school staff and that
they coordinate course content (although the levels of agreement indicate that most teachers across contexts disagree with these statements). On the other hand, teachers in these contexts reported the lowest levels of perceived influence on school decisions and policies (including setting performance standards for students, establishing curricu-lum, developing the content of in-service professional development, and setting discipline policy). Teachers in small/town rural schools and schools with the lowest levels of student poverty reported signifi-cantly higher levels of influence over school decisions and policies. (See Tables 33-44 in Appendix B for comparisons across school contexts.)
beginning teaCheR induCtion
Induction is a form of professional develop-ment designed specifically for novice teach-ers. It is generally intended to help them both refine both their technical skills and their knowledge and understanding of the context within which they are teaching. At-tention to the induction needs of beginning teachers is an area where there has been considerable progress made in the United States; however, as a nation, we are still far from providing the universal access to intensive mentoring, coaching, and job sup-ports common in many other countries
In 1996, the National Commission on Teaching and America’s Future found that only 8 states mandated and funded in-duction programs for beginning teachers (NCTAF, 1996). By 2004, the Council of Chief States School Officers (CCSSO) re-ported that 21 states required new teachers to participate in an induction program and 31 states provided some form of induction. Among these,16 of the states with man-dates provided state funding or subsidized
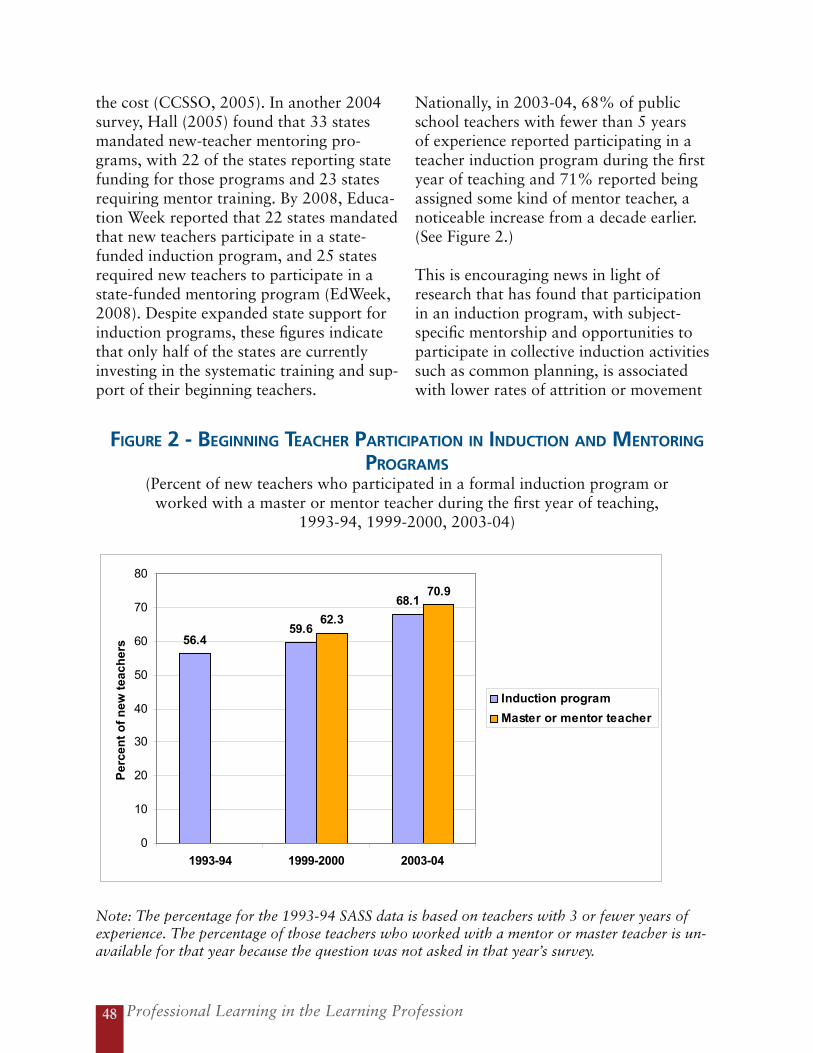
Professional Learning in the Learning Profession48
the cost (CCSSO, 2005). In another 2004 survey, Hall (2005) found that 33 states mandated new-teacher mentoring pro-grams, with 22 of the states reporting state funding for those programs and 23 states requiring mentor training. By 2008, Educa-tion Week reported that 22 states mandated that new teachers participate in a state-funded induction program, and 25 states required new teachers to participate in a state-funded mentoring program (EdWeek, 2008). Despite expanded state support for induction programs, these figures indicate that only half of the states are currently investing in the systematic training and sup-port of their beginning teachers.
Nationally, in 2003-04, 68% of public school teachers with fewer than 5 years of experience reported participating in a teacher induction program during the first year of teaching and 71% reported being assigned some kind of mentor teacher, a noticeable increase from a decade earlier. (See Figure 2.)
This is encouraging news in light of research that has found that participation in an induction program, with subject-specific mentorship and opportunities to participate in collective induction activities such as common planning, is associated with lower rates of attrition or movement
figuRe 2 - beginning teaCheR paRtiCipation in induCtion and mentoRing pRogRams
(Percent of new teachers who participated in a formal induction program or worked with a master or mentor teacher during the first year of teaching,
1993-94, 1999-2000, 2003-04)
56.459.6
68.1
62.3
70.9
0
10
20
30
40
50
60
70
80
1993-94 1999-2000 2003-04
Per
cen
t o
f n
ew t
each
ers
Induction program
Master or mentor teacher
Note: The percentage for the 1993-94 SASS data is based on teachers with 3 or fewer years of experience. The percentage of those teachers who worked with a mentor or master teacher is un-available for that year because the question was not asked in that year’s survey.
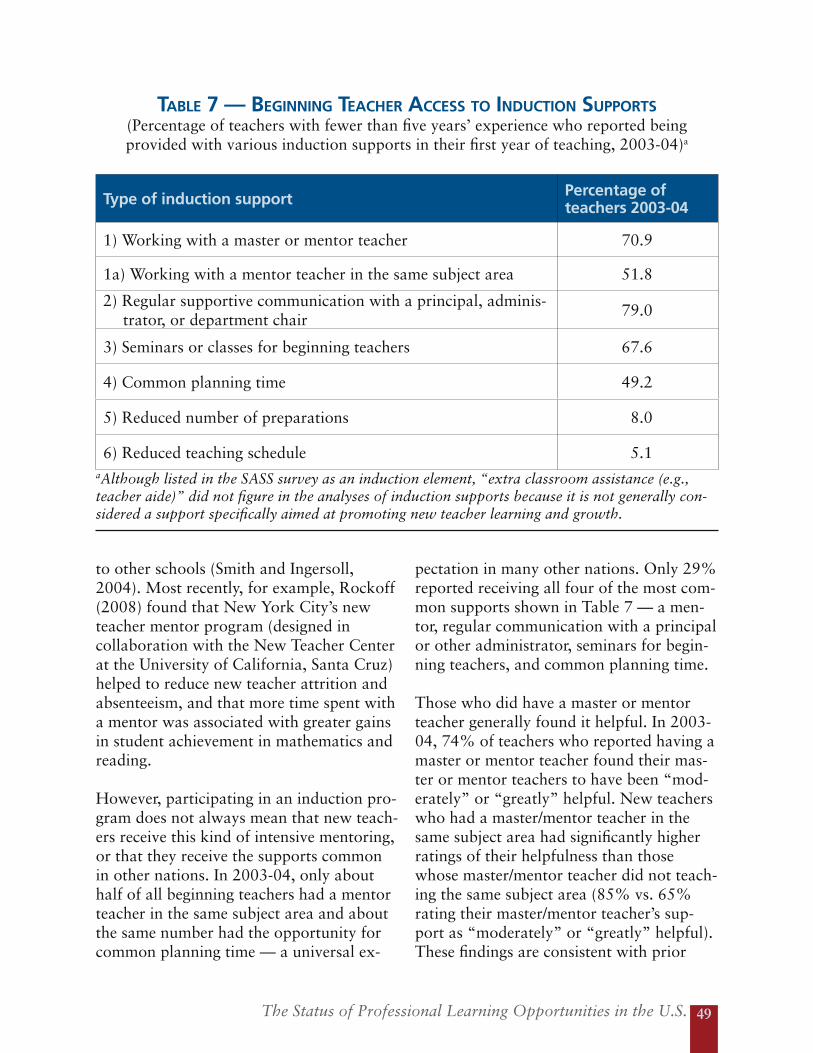
The Status of Professional Learning Opportunities in the U.S. 49
tabLe 7 — beginning teaCheR aCCess to induCtion suppoRts(Percentage of teachers with fewer than five years’ experience who reported being provided with various induction supports in their first year of teaching, 2003-04)a
Type of induction support Percentage of teachers 2003-04
1) Working with a master or mentor teacher 70.9
1a) Working with a mentor teacher in the same subject area 51.8
2) Regular supportive communication with a principal, adminis-trator, or department chair
79.0
3) Seminars or classes for beginning teachers 67.6
4) Common planning time 49.2
5) Reduced number of preparations 8.0
6) Reduced teaching schedule 5.1aAlthough listed in the SASS survey as an induction element, “extra classroom assistance (e.g., teacher aide)” did not figure in the analyses of induction supports because it is not generally con-sidered a support specifically aimed at promoting new teacher learning and growth.
to other schools (Smith and Ingersoll, 2004). Most recently, for example, Rockoff (2008) found that New York City’s new teacher mentor program (designed in collaboration with the New Teacher Center at the University of California, Santa Cruz) helped to reduce new teacher attrition and absenteeism, and that more time spent with a mentor was associated with greater gains in student achievement in mathematics and reading.
However, participating in an induction pro-gram does not always mean that new teach-ers receive this kind of intensive mentoring, or that they receive the supports common in other nations. In 2003-04, only about half of all beginning teachers had a mentor teacher in the same subject area and about the same number had the opportunity for common planning time — a universal ex-
pectation in many other nations. Only 29% reported receiving all four of the most com-mon supports shown in Table 7 — a men-tor, regular communication with a principal or other administrator, seminars for begin-ning teachers, and common planning time.
Those who did have a master or mentor teacher generally found it helpful. In 2003-04, 74% of teachers who reported having a master or mentor teacher found their mas-ter or mentor teachers to have been “mod-erately” or “greatly” helpful. New teachers who had a master/mentor teacher in the same subject area had significantly higher ratings of their helpfulness than those whose master/mentor teacher did not teach-ing the same subject area (85% vs. 65% rating their master/mentor teacher’s sup-port as “moderately” or “greatly” helpful). These findings are consistent with prior
Professional Learning in the Learning Profession50
New Teacher Induction Policy and Practice in South Carolina
ew teachers in South Carolina are well-supported by a universally available induction program. First-year teachers in South Carolina are required to participate in their districts’ induction and mentoring programs, developed and approved according to guidelines established by the State Board of Edu-
cation. The guidelines specify responsibilities of district and school administrators, including annual evaluations of the program; describe the mentor-guided formative assessment procedures and professional development plans all beginning teachers must complete; and provide criteria for the selection, assignment, and professional development of mentors. The induction programs are part of South Carolina’s As-sisting, Developing, and Evaluation Professional Teacher (ADEPT) system, which began in 1998. During the induction year, beginning teachers learn about the AD-EPT Performance Standards that are the basis for teacher evaluation for all teachers. The ten ADEPT Performance Standards are grouped into four broad domains: plan-ning, instruction, classroom environment, and professionalism.
Another key part of each induction program is the mentor-guided formative assess-ment process, which consists of (1) collecting performance data, (2) analyzing the data in terms of the ADEPT performance standards, (3) developing the teacher’s individual professional growth and development plan, and (4) implementing the plan and beginning the formative assessment cycle again. Beginning teachers must be given feedback using this formative assessment process at least twice a year and meet with their mentors at least once a month.
The South Carolina Department of Education’s Division of Educator Quality and Leadership (DEQL) and the Center for Educator Recruitment, Retention, and Ad-vancement (CERRA) conduct initial mentor training, provide or coordinate continu-ing professional development for all mentors, arrange for some mentors to receive advanced training, and work with each district’s induction and mentoring coordina-tor to plan and implement an evaluation of the district’s induction program. Men-tors must be recommended by both a school administrator and another teacher in the district, complete a three day initial training conducted by DEQL and CERRA, and participate in at least 15 hours of professional development related to mentor-ing in the next five years (DEQL, 2006; SCDE, 2006).
The South Carolina General Assembly appropriates funds annually that are dis-persed to school districts on a per-induction-teacher basis.. These funds may be used to provide a stipend, release time, or additional assistance in the classroom. The per-teacher allocation varies each year, based on the total number of first-year teachers in the state. For the 2007-08 school year, districts received $590 in state funds per induction teacher and were encouraged to use a portion of their Title II professional development funds to support ongoing training for mentors.
N
The Status of Professional Learning Opportunities in the U.S. 51
research on the benefits of subject-specific mentoring (Hudson, 2004; Feiman-Nemser and Parker, 1990) and current practice in induction programs in high achieving na-tions.
The findings on participation rates in induction and mentoring programs for 2003-04 are mirrored in results from the MetLife Survey of the American Teacher (2004-2005), which was administered by the Harris polling company to a nationally representative sample of 800 teachers with fewer than five years of experience: 81% of these new teachers reported being assigned a more experienced mentor teacher, and of those reporting having had a mentor, 63% rated their mentors “very helpful” or “ex-tremely helpful.”
Less common types of induction support were a reduced number of preparations (8%) and a reduced teaching schedule (5%). Altogether, 4.8% reported receiving at least five of the six types of induction support listed in Table 2, and only 1.6% reported receiving all six types of support. Research suggests that these supports can help beginning teachers navigate through their first years of teaching successfully, improve their teaching, and persist in the profession (Fideler & Haselkorn, 1999; Ser-pell & Bozeman, 1999; Arends & Rigazio-DiGilio, 2000; Smith & Ingersoll 2004; Ingersoll & Kralik, 2004). The findings from the SASS data suggest that there is still much room for improvement in the qual-ity and intensity of the induction supports provided across the nation.
New teacher induction and support varied substantially across states, from a low of 30% (in Montana) to 96% (in South Caro-lina). In South Carolina, 85% of begin-ning teachers reported having a master or
mentor teacher (75% of them in the same teaching subject), and 82% reported receiv-ing at least 3 of the 4 most common types of support listed above. Another state with strong supports was Missouri, where 87% of new teachers reported participating in an induction program during their first year, and 91% of those teachers also reported having had a master or mentor teacher (80% in the same teaching subject). Three-quarters (76%) reported receiving at least 3 of the 4 most common types of support listed in Table 2. More information on the induction programs and policies of Mis-souri and South Carolina is provided in the pages that follow.
Variations across school contexts Rates of participation in induction were significantly higher in suburban schools (73%) than in urban schools (64%) and small town/rural schools (63%). Rates of participation in induction were highest in schools with the least poverty (75%) and lowest in schools with high levels of poverty (65%). Rates of participation in induction were also highest in schools with very low LEP student enrollment (77%) vs. those with the highest LEP enrollment (66%). These findings indicate that subur-ban schools, schools in primarily affluent communities, and schools with low levels of linguistic diversity are most likely to pro-vide new teachers with induction programs and services.
Teachers in more affluent and suburban schools were significantly more likely to have access to a master or mentor teacher than those in urban schools and those with high poverty levels. Nearly three-quarters (74%) of new teachers in suburban schools worked with a mentor, as compared to 72% in small towns and only 65% in ur-ban schools. New teachers in schools with
Professional Learning in the Learning Profession52
New Teacher Induction Policy and Practice in Missouri
issouri supports new teachers much more intensively than most other states, having gradually solidified policies on teacher induction over the last de-cade. In 1996, the state both required and financed induction for all new teachers, although there was some softening of the funding commitment in
1997 (Johnson, 2007). Then, in 2003 Missouri passed legislation requiring begin-ning teachers to participate in a two year mentoring program as well as a “Begin-ning Teacher Assistance” (BTA) program in order to maintain an initial professional certificate (Missouri Department of Elementary and Secondary Education, 2006). At that time, the Missouri State Board of Education adopted five standards to assist schools in creating successful mentoring programs that include appropriate train-ing, peer support, release time, and financial support for mentor teachers. These five standards include statements about 1) the scope and purpose of the mentoring program; 2) mentor incentives such as release time and stipends; 3) mentor training appropriate to the mentor role; 4) mentor selection and matching; and 5) evaluation of the effectiveness of mentoring.
By law, Missouri also requires all beginning teachers to have a professional develop-ment plan as part of their participation in the BTA program. The Professional Devel-opment Committee for each district, the members of which are selected by teachers employed by the district, is required to develop a generic plan, and individual teach-ers with their mentors and school principals customize the plan to individual needs. The plan may include goals in such areas as classroom management, understanding district policies, and use of curriculum guides, equipment and materials. The new teacher should continue to adjust the plan during the first four years on the job. An individual professional development plan is required throughout the time that a teacher has an Initial Professional Certificate (Missouri State Teachers Associa-tion, 2005). In addition, beginning teachers who graduated from a Missouri teacher preparation program must be provided ongoing assistance by the program, which may include retraining, internship, counseling, and in-service training.
Missouri’s Outstanding Schools Act of 1993 required that at least 1% of the state aid that districts receive (not including categorical add-ons) is allocated to the dis-trict’s Professional Development Committee to meet the objectives of the district’s Comprehensive School Improvement Plan. These funds may be used, in part, to pay mentor teacher stipends (Missouri Department of Elementary and Secondary Educa-tion, 2006).
M
The Status of Professional Learning Opportunities in the U.S. 53
the highest poverty levels were least likely to report working with a master or mentor teacher (68%) compared with teachers in schools with lower poverty levels (ranging from 72 to 74%). In addition, a significant-ly higher percentage of elementary school teachers reported working with a master or mentor teacher than secondary school teachers (73% vs. 69%). (See Tables 45-49 in Appendix B for comparisons of reported induction supports across school contexts.)
The helpfulness rating of master or mentor teachers was fairly consistent across school contexts with a few exceptions. Teachers in schools with the highest percentage of mi-norities rated the helpfulness of their mas-ter/mentor teachers significantly lower on
average than did teachers in schools with the lowest minority enrollment (2.55 vs. 2.96 on a 4 point scale). This may suggest that the quality of the mentorship programs in schools with high minority enrollments is not as high as in schools with low minority enrollment. We know that in many “hard to staff” schools with high minority enroll-ments, teacher quality is generally lower, turnover is higher, and higher percentages of novice, emergency credentialed, and underprepared teachers are employed (see e.g., Jepsen & Rivkin, 2002; Oakes, 2002; Esch et al., 2005). It can often be difficult in these schools to recruit, train, and main-tain a corps of expert mentor teachers for the revolving door of new teachers in these schools.

Professional Learning in the Learning Profession54
Another Lens on Professional Learning Opportunities: The NSDC Standards Assessment
Inventory
ince the 2004-05 academic year, the National Staff Development Council (NSDC) has administered a survey called the “Standards Assessment Inventory,” an instru-ment with 60 survey questions designed to measure the alignment of school/district professional development practices with the NSDC’s 12 Professional Development
Standards. See Appendix C for the 60 survey items on the SAI. In a recent study of the validity of the SAI, using data from the Spring 2006 administration of the survey in Geor-gia, researchers found that average school level ratings on the instrument were significant predictors of student achievement on a standardized English Language Arts assessment in grades 1-4 (Georgia’s Criterion-Referenced Competency Tests). The study also found that two constructs that emerged from factor analysis of the data, “Process” and “Eq-uity,” were significant and positive predictors of student’ ELA achievement in grades 1-4 (Vaden-Kiernan, Hughes Jones, and McCann, 2008).
Data from the most current administra-tion of the survey (2007-08 academic year) were analyzed for this report. Because the survey sample is not a nationally represen-tative sample, we made strategic choices about which states’ samples to include in our analyses. We included survey responses from two states (Arizona and Georgia) that contracted with the NSDC to administer the survey statewide. We also included sur-vey responses from Missouri and Alabama, which administered the survey widely on a voluntary basis. The data from these four states were combined and analyzed, and results were compared with results from the Schools and Staffing Survey (2003-04). (See Appendix A for more detail on the method-ology used to analyze this dataset.)
To inform our analyses of the SAI’s 60 items, we assessed the constructs within the 2007-08 SAI dataset through factor analy-ses, and the results indicated that there were four factors. Analyzing the items in each factor, we found that the items were
S
comprised of items that reflect the follow-ing concepts:
• Factor 1 — Opportunities for Pro-fessional Development and Collabo-ration (20 items);
• Factor 2 — School Leadership (10 items);
• Factor 3 — Equity (9 items); • Factor 4 — Teacher Influence and
Collaboration (5 items)
The results of our analyses indicated that teachers rated their school principal’s lead-ership and their schools’ equity focus more highly than they rated their opportunities for teacher collaboration and their influence on school decisions and policies. Comput-ing the composite (average) survey ratings for each factor, we found that for the entire sample (across four states), there were significant differences between the average ratings across the four factors (see Table 8, next page). These findings are consis-tent with those found in the SASS dataset,
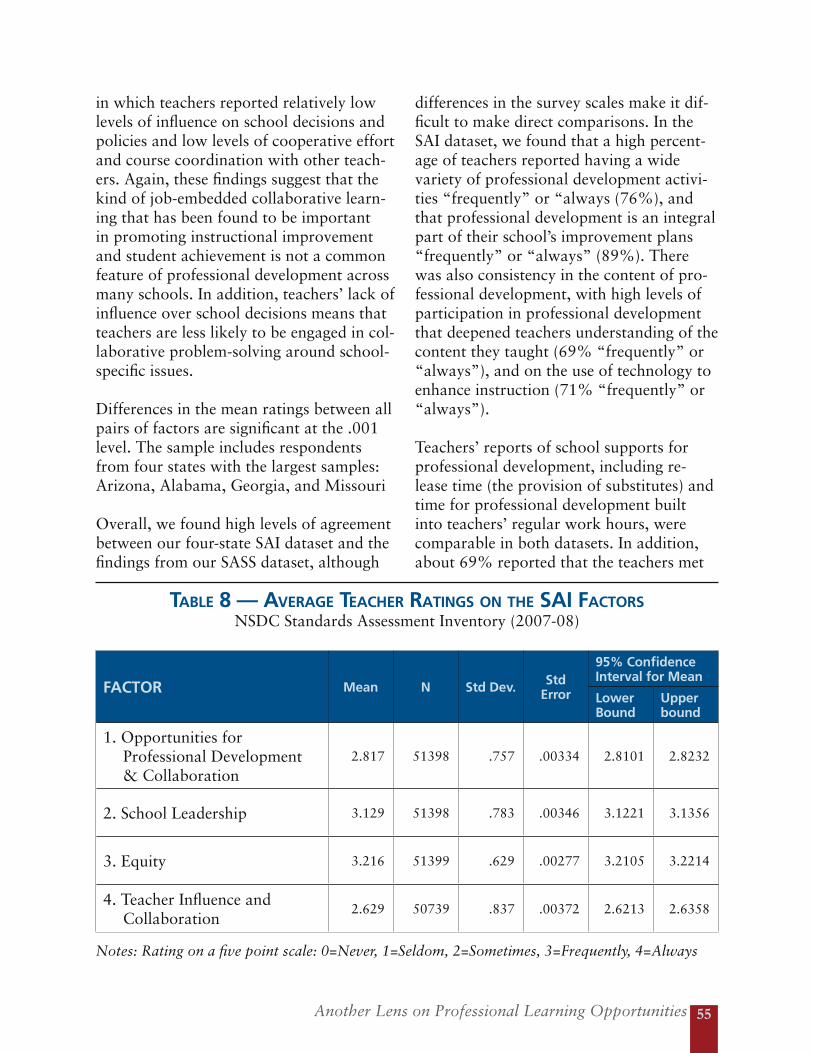
Another Lens on Professional Learning Opportunities 55
in which teachers reported relatively low levels of influence on school decisions and policies and low levels of cooperative effort and course coordination with other teach-ers. Again, these findings suggest that the kind of job-embedded collaborative learn-ing that has been found to be important in promoting instructional improvement and student achievement is not a common feature of professional development across many schools. In addition, teachers’ lack of influence over school decisions means that teachers are less likely to be engaged in col-laborative problem-solving around school-specific issues.
Differences in the mean ratings between all pairs of factors are significant at the .001 level. The sample includes respondents from four states with the largest samples: Arizona, Alabama, Georgia, and Missouri
Overall, we found high levels of agreement between our four-state SAI dataset and the findings from our SASS dataset, although
differences in the survey scales make it dif-ficult to make direct comparisons. In the SAI dataset, we found that a high percent-age of teachers reported having a wide variety of professional development activi-ties “frequently” or “always (76%), and that professional development is an integral part of their school’s improvement plans “frequently” or “always” (89%). There was also consistency in the content of pro-fessional development, with high levels of participation in professional development that deepened teachers understanding of the content they taught (69% “frequently” or “always”), and on the use of technology to enhance instruction (71% “frequently” or “always”).
Teachers’ reports of school supports for professional development, including re-lease time (the provision of substitutes) and time for professional development built into teachers’ regular work hours, were comparable in both datasets. In addition, about 69% reported that the teachers met
tabLe 8 — aveRage teaCheR Ratings on the sai faCtoRsNSDC Standards Assessment Inventory (2007-08)
FACTOR Mean N Std Dev. Std Error
95% Confidence Interval for Mean
LowerBound
Upper bound
1. Opportunities for Professional Development & Collaboration
2.817 51398 .757 .00334 2.8101 2.8232
2. School Leadership 3.129 51398 .783 .00346 3.1221 3.1356
3. Equity 3.216 51399 .629 .00277 3.2105 3.2214
4. Teacher Influence and Collaboration
2.629 50739 .837 .00372 2.6213 2.6358
Notes: Rating on a five point scale: 0=Never, 1=Seldom, 2=Sometimes, 3=Frequently, 4=Always
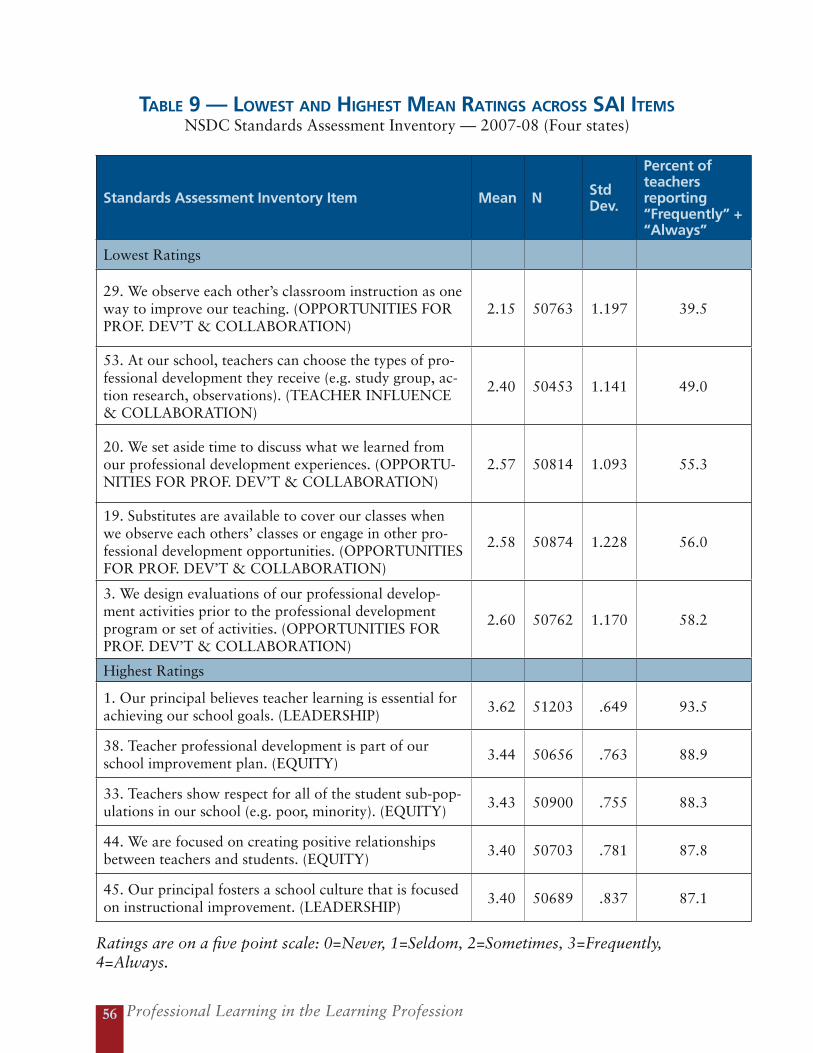
Professional Learning in the Learning Profession56
tabLe 9 — LoWest and highest mean Ratings aCRoss sai itemsNSDC Standards Assessment Inventory — 2007-08 (Four states)
Standards Assessment Inventory Item Mean N Std Dev.
Percent of teachers reporting “Frequently” + “Always”
Lowest Ratings
29. We observe each other’s classroom instruction as one way to improve our teaching. (OPPORTUNITIES FOR PROF. DEV’T & COLLABORATION)
2.15 50763 1.197 39.5
53. At our school, teachers can choose the types of pro-fessional development they receive (e.g. study group, ac-tion research, observations). (TEACHER INFLUENCE & COLLABORATION)
2.40 50453 1.141 49.0
20. We set aside time to discuss what we learned from our professional development experiences. (OPPORTU-NITIES FOR PROF. DEV’T & COLLABORATION)
2.57 50814 1.093 55.3
19. Substitutes are available to cover our classes when we observe each others’ classes or engage in other pro-fessional development opportunities. (OPPORTUNITIES FOR PROF. DEV’T & COLLABORATION)
2.58 50874 1.228 56.0
3. We design evaluations of our professional develop-ment activities prior to the professional development program or set of activities. (OPPORTUNITIES FOR PROF. DEV’T & COLLABORATION)
2.60 50762 1.170 58.2
Highest Ratings
1. Our principal believes teacher learning is essential for achieving our school goals. (LEADERSHIP)
3.62 51203 .649 93.5
38. Teacher professional development is part of our school improvement plan. (EQUITY)
3.44 50656 .763 88.9
33. Teachers show respect for all of the student sub-pop-ulations in our school (e.g. poor, minority). (EQUITY)
3.43 50900 .755 88.3
44. We are focused on creating positive relationships between teachers and students. (EQUITY)
3.40 50703 .781 87.8
45. Our principal fosters a school culture that is focused on instructional improvement. (LEADERSHIP)
3.40 50689 .837 87.1
Ratings are on a five point scale: 0=Never, 1=Seldom, 2=Sometimes, 3=Frequently, 4=Always.
Another Lens on Professional Learning Opportunities 57
as a whole staff to discuss ways to im-prove teaching and learning “frequently” or “always,” but opportunities to observe each others’ classroom instruction and to provide feedback to one another were less common: only 40% of teachers frequently observed each other, only 55% had time set aside to discuss what they learned from professional development experiences, and only 57% had frequent opportunities to give each other feedback. We saw a similar pattern in the SASS dataset, which showed low levels of agreement on items that asked teachers whether there was a great deal of cooperative effort and coordination among teachers in their schools.
The sample includes respondents from four states with the largest samples: Arizona, Alabama, Georgia, and Missouri
Evidence about the extent of teachers’ influ-ence over their own professional develop-ment was comparable in both datasets. Just under half (48%) of public school teachers in the SASS dataset reported having mod-erate or great influence on the content of their in-service professional development. In the 4-state SAI sample, 49% of teachers reported that they could choose the types
of professional development they receive “frequently” or “always.”
Last we found differences in teachers responses based on the location of their schools. There were significant differences between the average ratings of teachers in urban versus non-urban schools/districts across 20 items. In most cases, these differences were significant at the .001 level, and in most cases with the exception of six items, these differences favored teachers in non-urban (suburban or small town) schools. For example, teachers in non-urban schools rated their schools’ professional development opportunities and practices more highly than did teachers in urban contexts. Similarly, in the SASS dataset, while a larger percentage of urban teachers reported participating in both formal and job-embedded professional development activities, a smaller percentage of them reported receiving school supports for professional development, including release time, and reimbursements for tuition, workshop/conference fees, and travel; they were less likely to have access to mentoring; and were less likely to report having an influence on school decisions and policies.
Professional Learning in the Learning Profession58
Summaryata from the 2003-04 Schools and Staffing Survey, the 2004-05 MetLife Survey of the American Teacher, and the 2007-08 NSDC SAI seem to be in general agree-ment that in recent years, there have been high levels of participation of teachers in professional development activity, and an increase in the participation of new
teachers in induction and mentorship programs. Information from the SASS data indicate that 71% of beginning teachers had a master or mentor teacher assigned to support them, two-thirds took seminars or classes for beginning teachers, and half participated in com-mon planning. However, it was much less common for beginning teachers to be provided with release time or reduced teaching loads in their first year of teaching and only about half of beginners had mentors in their subject area. In addition, these data do not provide information about the quality of the mentorship programs that were available to begin-ning teachers, and some teachers, especially those without mentors in their subject areas and those in high-need schools, do not rate the helpfulness of mentors as highly as do others. New teachers in urban schools with high percentages of minority, LEP, and low-
income students experience significantly lower rates of participation in induction and mentoring programs, and rate the helpfulness of the master/mentor teachers significantly lower, suggesting potential dif-ferences in access and quality.
From the SASS data, there also appear to be high levels of participation in formal professional development activities, particu-larly in workshops, conferences, and train-ing sessions, with more than 90% of public school teachers across the nation reporting participation in this type of professional development. The focus of many of these formal training events was on teachers’ content knowledge of the subject(s) they teach, with 83.4% of teachers participating in professional development on this topic. While this content-focused professional development is promising as a strategy to improve instruction, the intensity and dura-tion of most of these learning activities has not deviated far from the traditional one-shot model of professional development. In most cases, contact hours across topics were less than 16 hours in length (2 days
D
or less), which has been shown by research to be generally insufficient for effecting real change in teachers’ instructional practice and in student achievement. Research on effective models of professional develop-ment suggests that intensive and sustained efforts over a period of time are more likely to be effective in improving instruction than intermittent workshops with no follow-up mechanisms — a design that is typically not powerful enough to produce the impact desired.
Research also suggests that professional development is most effective when teach-ers engage actively in instructional inquiry in the context of collaborative professional communities, focused on instructional im-provement and student achievement. From the 2003-04 SASS data, as well as the SAI, it is not clear that schools offer teachers the regularly scheduled time at the frequency that is needed to participate in this kind of activity on a regular basis. While 70% of teachers reported participating in “regularly scheduled collaboration with other teach-ers on issues of instruction,” it is unclear
Summary 59
what “regularly scheduled” means in terms of real frequency. A very low percentage of teachers across the nation (less than 20%) agreed that there was a “great deal of cooperative effort among staff members” and that they “make a conscious effort to coordinate the content of courses with that of other teachers.” It is unclear what the focus of teachers’ collaborative activity was, given that it did not result in percep-tions of cooperative effort or curriculum coordination.
In addition, data from the SASS indicate that on most topics of professional develop-ment, fewer than 50% of teachers rated their pro-fessional development as useful. In addition, despite the higher ratings of content-focused pro-fessional development (60% rated it useful), teachers indicated that they desired further pro-fessional development on the content they teach, classroom management/discipline, and teaching students with special needs. With regard to teaching special needs students, only 36% of teachers agreed that they were given the supports they need to teach these students.
When compared with high-achieving coun-tries around the world, the U.S. appears to be significantly behind in providing certain kinds of professional learning opportuni-ties. The differences are especially marked with respect to observational visits to other classrooms and schools, collaborative action research, and regularly scheduled
collaboration among teachers on issues of instruction. It appears that teachers in the United States are not provided with nearly as much opportunity and support to engage in this kind of job-embedded learning in professional communities as those in many other countries.
Last, teachers in the U.S. appear to have less influence over school decisions and policies than those in other nations. A bare majority of U.S. teachers feel that they have some influence over curriculum and setting performance standards for students. Fewer than half of U.S. teachers perceived that
they had some influence over the content of their in-service professional development and very few felt they had influ-ence over other school policies and decisions affecting teacher hiring, evaluation, or deciding how the school budget will be spent These fig-ures suggest that teacher influence over decisions is considerably less com-mon than is the case in other high-achieving nations, especially those in Scandinavia and the Pacific Rim. Teachers
in urban schools and in schools with high percentages of minority, LEP, and poor stu-dent enrollment were even less likely than those in suburban, rural, and more afflu-ent, less diverse school contexts to report having influence over school decisions and policies. This might suggest that teachers in these contexts may not feel as empowered in their collaborative activity to make a real impact on decisions that affect them and their students.
Professional development is most
effective when teachers engage actively in
instructional inquiry in the context
of collaborative professional
communities, focused on instructional
improvement and student achievement.

Professional Learning in the Learning Profession60
Our review of the literature on high quality professional development and our analysis of the current status of teacher professional development in the United States reveal that U.S. public schools have a long way to go in terms of practicing what are known to be effective designs for powerful profes-sional learning. This study raises a number of related questions that deserve further exploration. Some of these questions will be addressed in Phase 2 and 3 of the multiyear study.
• Why do so many U.S. districts and schools appear to lack the capacity to provide the kind of professional development that research shows is effective? What are the steps that states, districts, and schools should take to build this capacity?
• What kinds of organizational fea-tures support and facilitate effective professional development?
• How are states with higher student performance using professional de-velopment to achieve their results?
• How can the nation shift from inef-fective professional development to effective professional development? What investments will be needed to make this transition?
• Given limited resources, what should be the focus of profes-sional development and how should resources for professional development be targeted in terms of both content and teachers?
• How should states/districts/school systems monitor the qual-ity of professional development that is provided within their jurisdictions?
Finally, while initial studies of professional learning communities (PLCs) are promising, the research literature is sparse and that the methodologies that have been used to study the impact of PLCs do not permit us to make causal inferences. There is a great need for more studies that would allow us to assess how different approaches to school-based professional learning communities influence teacher knowledge, instructional practice, and student achievement, as well as studies that examine the organizational factors that facilitate these practices. Such research would strengthen our ability to draw stronger conclusions about the ways that job-embedded professional development can be effective in promoting more powerful teaching and learning.
61
Conclusionsgrowing body of research on effective professional development models for teachers provides support for a new paradigm of teacher professional learning — one based on evidence about the kinds of experiences which appear to build teacher capac-ity and catalyze transformations in teaching practice resulting in improved student
outcomes. This research allows us to assess the current status of professional develop-ment in the United States against a set of evaluative criteria. In addition, our examination of professional development policies and trends in high-achieving nations in the world allows us to evaluate and compare the status of professional development in the United States against these international benchmarks. Our analysis of the 2003-04 Schools and Staffing Survey, as well as data from the 2004-05 Met Life Survey and the 2007-08 NSDC Standards Assessment Inventory, provides us with a snapshot of how the United States is doing in terms of teachers’ access to powerful professional learning opportunities nation-ally, across states, and in particular school contexts.
What we found from our analyses is that, while the United States has made some progress in certain areas such as the availability of induction and mentoring programs for beginning teachers and an increased emphasis on building teachers’ content knowledge, the structures and supports that are needed to sustain teacher learning and change and to foster job-embedded professional development in collegial environments falls short. The time and opportunities that are needed for intense, sustained professional development with regular follow-up and reinforcement are simply not in place in most contexts, as evidenced by the short duration of most professional development activities. The low ratings of the usefulness
of most professional development activities and teachers’ desire for further professional development on the content
they teach, classroom management, teaching special needs students, and other topics, are indicators of the insufficiency of the professional development infrastructure now in place in most states and communities. The low levels of teachers’ perceptions of their influence on school policies and low levels of agreement on cooperative effort and coordination among teachers are symptomatic of the
lack of school governance structures and professional communities that involve teachers in collective decision making and problem-solving. It also appears that across different school contexts, there is unequal
A
Comparisons of American teachers’ participation in professional development
with that of teachers in the international community also demonstrate that the
United States is substantially behind other OECD nations
in providing the kinds of powerful professional
learning opportunities that are more likely to build their capacity and have significant impacts on student learning.

Professional Learning in the Learning Profession62
access to and quality of induction supports, technology training, and opportunities for teachers to influence school policies.
Comparisons of American teachers’ par-ticipation in professional development with that of teachers in the international com-munity also demonstrate that the United States is substantially behind other OECD nations in providing the kinds of power-ful professional learning opportunities that are more likely to build their capacity and have significant impacts on student learn-ing. While American teachers participate in workshops and short-term professional development events at similar levels as that of OECD nations, the U.S. is far behind in providing public school teachers with op-portunities to participate in extended learn-ing opportunities and productive collabora-tive communities in which they conduct
research on education-related topics, work together on issues of instruction, learn from one another through mentoring or peer coaching, and collectively guide curriculum, assessment, and professional learning deci-sions.
Given what we know about the status of professional development opportunities for teachers in the United States, and the current lack of capacity and infrastructure of many school organizations to provide the kinds of powerful learning opportunities that teachers need to support student learning, the question that remains is — how can states, districts, and schools build their capacities to provide the kinds of high quality professional development that is effective in building teacher knowledge, improving their instruction, and supporting student learning?
63
References
Achinstein, B. (2002). Conflict amid community: The micropolitics of teacher collaboration. Teachers College Record, 104(3), 421-455.
Ahlstrand, E. (1994). Professional isolation and imposed collaboration in teachers’ work. In I. Carlgren, G. Handal, and S. Vaage (Eds.), Teachers’ minds and actions: Research on teachers’ thinking and practice (pp. 260-271). London: The Falmer Press.
Arends, R. I., Rigazio-DiGilio, A. J. (2000, July). Beginning teacher induction: Research and examples of contemporary practice. Paper presented at the Annual Meeting of the Japan-United States Teacher Education Consortium (JUSTEC). (ERIC Document Reproduction Service No. ED450070)
Arkansas Department of Education. (2006-08). Smart start: Arkansas’ K-4 initiative. Retrieved November 6, 2008, from http://arkansased.org/smart_arkansas/smart_start/index.html
Arkansas Leadership Academy. (2003, February). Academy Action (newsletter), 7(1). Retrieved October 31, 2008, from http://www.arkleadership.org/news_archive.htm.
Arkansas Leadership Academy. (2003-07). Teacher Institute. Retrieved October 31, 2008, from http://www.arkleadership.org/institutes_teacher.htm.
Atelier Learning Solutions Pty Ltd. (2005). An evaluation of the Australian Government Quality Teacher Programme 1999 to 2004. Canberra: Department of Education, Science and Training.
Ball, D., & Cohen, D. (1999). Developing practice, developing practitioners: Toward a practice-based theory of professional education. In L. Darling-Hammond & G. Sykes (Eds.), Teaching as the learning profession: Handbook of policy and practice (pp. 3-32). San Francisco, CA: Jossey-Bass Publishers.
Banilower, E. R. (2002). Results of the 2001–2002 study of the impact of the local systemic change initiative on student achievement in science. Chapel Hill, NC: Horizon Research.
Barber, M., & Mourshed, M. (2007). How the world’s best-performing school systems come out on top. London: McKinsey and Company.
Baron, J. B. (1999). Exploring high and improving reading achievement in Connecticut. Washington: National Educational Goals Panel.
Barrett, J., Jones, G., Mooney, E., Thornton, C., Cady, J., Guinee, P., & Olson, J. (2002). Working with novice teachers: Challenges for professional development. Mathematics Teacher Education and Development, 4, 15-27.
Bartell, C. (1995). Shaping teacher induction policy in California. Teacher Education Quarterly, 22(4), 27-43.
Berry, B., P. Hopkins-Thompson, & Hoke, M. (2002). Assessing and supporting new teachers: Lessons from the Southeast. Southeast Center for Teaching Quality. Retrieved October 31, 2008, from http://www.teachingquality.org/pdfs/Induction.pdf.
Birman, B., LeFloch, K. C., Klekotka, A., Ludwig, M., Taylor, J., Walters, K., Wayne, A., & Yoon, K. S. (2007). State and local implementation of the No Child Left Behind Act, volume II—Teacher quality under NCLB: Interim report. Washington, D.C.: U.S. Department of Education, Office of Planning, Evaluation and Policy Development, Policy and Program Studies Service.
Professional Learning in the Learning Profession64
Blachowicz, C. L. Z., Obrochta, C., & Fogelberg, E. (2005). Literacy coaching for change. Educational Leadership, 62(6), 55.
Blank, R.K., de las Alas, N., & Smith, C. (2007). Analysis of the quality of professional development programs for mathematics and science teachers: Findings from a cross-state study. Washington DC: CCSSO.
Borko, H., Elliot, R., & Uchiyama, K. (1999). Professional development: A key to Kentucky’s reform effort (CSE Tech Report 512). Los Angeles, CA: University of California, Center for Research on Evaluation, Standards, and Student Testing (CRESST).
Britton, T. (2006). Mentoring in the induction system of five countries: A sum is greater than its parts. In C. Cullingford (Ed.), Mentoring in education: An international perspective (pp. 110-123). Aldershot, England: Ashgate Publishing.
Bryk, A., Camburn, E., & Louis, K. (1999). Professional community in Chicago elementary schools: Facilitating factors and organizational consequences. Educational Administration Quarterly, 35(5), 751-781.
Calkins, A., Guenther, W., Belfiore, G., & Lash, D. (2007). The turnaround challenge: Why America’s best opportunity to dramatically improve student achievement lies in our worst-performing schools. Boston, MA: Mass Insight Education & Research Institute.
Carpenter, T.P., Feneman, E., Peterson, P.L., Chiang, C.P., & Loef, M. (1989). Using knowledge of children’s mathematics thinking in classroom teaching: An experimental study. American Educational Research Journal, 26(4), 499-531.
Cheng, M., & Brown, R.S. (1992). A two-year evaluation of the peer support pilot project: 1990-1992. Toronto, Ontario, Canada: Toronto Board of Education, Research Department.
Choy, S.P., Chen, X., & Bugarin, R. (2006). Teacher professional development in 1999–2000: What teachers, principals, and district staff report (NCES 2006-305). Washington, DC: U.S. Department of Education, National Center for Education Statistics.
Clement, M. (2000). Making time for teacher induction: A lesson from the New Zealand model. The Clearing House, 73(6), 329-330.
Cohen, D. K., & Hill, H. C. (2001). Learning policy. New Haven, CT: Yale University Press.
Corcoran, T., McVay, S., & Riordan, K. (2003). Getting it right: The MISE approach to professional development. Philadelphia, PA: Consortium for Policy Research in Education.
Council of Chief State School Officers (CCSSO). (2005). Key state education policies on PK-12 education: 2004. Washington, DC: CCSSO.
Darling-Hammond, L. (1999). Teacher quality and student achievement: A review of state policy evidence. Seattle, WA: Center for the Study of Teaching and Policy, University of Washington.
Darling-Hammond, L. (2005). Developing professional development schools: Early lessons, challenge, and promise. In L. Darling-Hammond (Ed.), Professional development schools: Schools for developing a profession (pp. 1-27). New York: Teachers College Press.
Darling-Hammond, L., & McCloskey, L. (in press). Benchmarking learning systems: Student performance assessment in international context.

References 65
Darling-Hammond, L., & McLaughlin, M. W. (1995). Policies that support professional development in an era of reform. Phi Delta Kappan, 76(8), 597-604.
Desimone, L., Porter, A., Garet, M., Yoon, K., & Birman, B. (2002). Effects of professional development on teachers’ instruction: Results from a three-year longitudinal study. Education Evaluation and Policy Analysis, 24(2), 81-112.
Deussen, T., Coskie, T., Robinson, L., & Autio, E. (2007). “Coach” can mean many things: Five categories of literacy coaches in Reading First (Issues & Answers Report, REL 2007–No. 005). Retrieved December 19, 2008, from http://ies.ed.gov/ncee/edlabs.
Dunne, F., Nave, B., & Lewis, A. (2000). Critical friends: Teachers helping to improve student learning. Phi Delta Kappa International Research Bulletin (CEDR) 28, 9-12. Retrieved September 11, 2008, from http://www.pdkintl.org/edres/resbul28.htm.
Earl, L, Watson, N., & Torrance, N. (2002). Front row seats: What we’ve learned from the Naitonal Literacy and Numeracy Strategies in England. Journal of Educational Change, 3(1), 35-53.
Easton, L. B. (2008). From professional development to professional learning. Phi Delta Kappan, 89(10), 755-759.
Education Trust. (2006). Arkansas: Key education facts and figures – Achievement, attainment, and opportunity from elementary school through college. Retrieved October 31, 2008, from http://www2.edtrust.org/edtrust/summaries2006/Arkansas.pdf
Education Week. (2008, January 10). Quality Counts 2008: Tapping into teaching. Table: The Teaching Profession. Retrieved October 7, 2008, from http://www.edweek.org/ew/toc/2008/01/10/index.html
Eick, C. J. (2002). Job sharing their first year: A narrative of two partnered teachers’ induction into middle school science teaching. Teaching and Teacher Education, 18(7), 887-904.
Elmore, R. F., & Burney, D. (1997). Investing in teacher learning: Staff development and instructional improvement: Community School District 2, New York City. New York: National Commission on Teaching and America’s Future and Consortium for Policy Research in Education.
Elmore, R.F. (2004). School reform from the inside out. Cambridge, MA: Harvard University Press.
Esch, C. E., Chang-Ross, C. M., Guha, R., Humphrey, D. C., Shields, P. M., Tiffany-Morales, J. D., Wechsler, M. E., & Woodworth, K. R. (2005). The status of the teaching profession 2005. Santa Cruz, CA: The Center for the Future of Teaching and Learning.
Evertson, C. M., & Smithey, M. W. (2000). Mentoring effects on protégées’ classroom practice: An experimental field study. Journal of Educational Research, 93(5), 294-304.
Feiman-Nemser, F., & Parker, M.B. (1990). Making subject matter a part of the conversation or helping beginning teachers learn to teach (Research report 90-3). Retrieved October 31, 2008, from http://ncrtl.msu.edu/http/rreports/html/rr903.htm
Fernandez, C. (2002). Learning from Japanese approaches to professional development: The case of lesson study. Journal of teacher education, 53(5), 393-405.
Fideler, E.F., & Haselkorn, D. (1999). Learning the ropes: Urban teacher induction programs and practices in the United States [and] Executive Summary. Belmont, MA: Recruiting New Teachers, Inc.

Professional Learning in the Learning Profession66
Franke, M. L., Carpenter, T., Fennema, E., Ansell, E., & Behrend, J. (1998). Understanding teachers’ selfsustaining, generative change in the context of professional development. Teaching and Teacher Education, 14(1), 67-80.
Fullan, M. (1991). The new meaning of educational change, 1st edition. New York City: Teachers College Press.
Fullan, M. (2007a). Change the terms for teacher learning. Journal of Staff Development, 28(3), 35-36.
Fullan, M. (2007b). The new meaning of educational change, 4th edition. New York City: Teachers College, Columbia University.
Fuller, E. (2003). Beginning teacher retention rates for TxBESS and non-TxBESS teachers. Unpublished paper. State Board for Educator Certification, Texas.
Garet, M. S., Birman, B. F., Porter, A. C., Desimone, L., & Herman, J. (1999). Designing effective professional development: Lessons from the Eisenhower program [and] technical appendices. Washington, D.C.: U.S. Department of Education.
Garet, M., Porter, A., Desimone, L., Birman, B., & Yoon, K.S. (2001). What makes professional development effective? Results from a national sample of teachers. American Educational Research Journal, 38(4), 915-945.
Garet, M. S., Cronen, S., Eaton, M., Kurki, A., Ludwig, M., Jones, W., Uekawa, K., Falk, A., Bloom, H. S., Doolittle, F., Zhu, P., & Sztejnberg, L. (2008). The impact of two professional development interventions on early reading instruction and achievement (NCEE 2008-4030). Washington, DC: National Center for Education Evaluation and Regional Assistance, Institute of Education Sciences, U.S. Department of Education.
Glazerman, S., Dolfin, S., Bleeker, M., Johnson, A., Isenberg, E., Lugo-Gil, J., Grider, M., & Britton, E. (2008). Impacts of comprehensive teacher induction: Results from the first year of a randomized controlled study (NCEE 2009-4034). Washington, DC: National Center for Education Evaluation and Regional Assistance, Institute of Education Sciences, U.S. Department of Education.
Goddard, Y.L., Goddard, R.D., & Tschannen-Moran, M. (2007). Theoretical and empirical investigation of teacher collaboration for school improvement and student achievement tin public elementary schools. Teachers College Record, 109(4), 877-896.
Gonnie van Amelsvoort, H.W.C., & Scheerens, J. (1996). International comparative indicators on teachers. International Journal of Educational Research, 25(3), 267-277.
Grossman, P., Wineburg, S., & Woolworth, S. (2001). Toward a theory of teacher community. Teachers College Record, 103(6), 942-1012.
Guskey, T.G. (2000). Evaluating professional development. Thousand Oaks, CA: Corwin Press.
Gutiérrez, K., Crosland, K., & Berlin, D. (2001, April). Reconsidering coaching: Assisting teachers’ literacy practices in the zone of proximal development. Paper presented at the annual meeting of the American Educational Research Association, Seattle, WA.
Hall, J. L. (2005). Promoting quality programs through state-school relationships. In H. Portner (Ed.), Teacher mentoring and induction (pp. 225-244). Thousand Oaks, CA: Corwin Press.
Hall, J. L., Johnson, B., & Bowman, A. C. (1995). Teacher socialization: A spiral process. Teacher Educator, 30(4), 25-36.
References 67
Hargreaves, A., Halász, G., & Pont, B. (2007). School leadership for systemic improvement in Finland: A case study report for the OECD activity “Improving school leadership”. Retrieved June 24, 2008, from http://www.oecd.org/dataoecd/43/17/39928629.pdf
Hawley, W.D., & Valli, L. (1999). The essentials of effective professional development: A new consensus. In L. Darling-Hammond & G. Sykes (Eds.), Teaching as the learning profession: Handbook for policy and practice (pp. 127-150). San Francisco: Jossey-Bass.
Heck, D.J., Weiss, I.R., Boyd, S.E., Howard, M.N., & Supovitz, J. A. (2003). Lessons learned about designing, implementing, and evaluating statewide systemic reform. In N. L. Webb & I. R. Weiss (Eds.), Study of the impact of the Statewide Systemic Initiatives Program (Vol. I.). Madison, WI: University of Wisconsin-Madison, Wisconsin Center for Education Research
Henke, R.R., Chen, X., Geis, S., & Knepper, P. (2000). Progress through the teacher pipeline: 1992-93 College graduates and elementary/secondary school teaching as of 1997 (NCES 2000-152). Washington, DC: National Center for Education Statistics.
Holahan, P. J., Jurkat, M. P., & Friedman, E. A. (2000). Evaluation of a mentor teacher model for enhancing mathematics instruction through the use of computers. Journal of Research on Computing in Education, 32(3), 336-350.
Hollins, E. R., McIntyre, L. R., DeBose, C., Hollins, K. S., & Towner, A. (2004). Promoting a self-sustaining learning community: Investigating an internal model for teacher development. International Journal of Qualitative Studies in Education, 17(2), 247-264.
Hord, S. (1997). Professional learning communities: Communities of continuous inquiry and improvement. Austin, TX: Southwest Educational Development Laboratory.
Horn, I. S. (2005). Learning on the job: A situated account of teacher learning in high school mathematics departments. Cognition and Instruction, 23(2), 207-236.
Hudson, P. (2004). Specific mentoring: A theory and model for developing primary science teaching practices. European Journal of Teacher Education, 27(2), 139-146.
Ingersoll, R., & Kralik, J.M. (2004). The impact of mentoring on teacher retention: What the research says. Denver, CO: Education Commission of the States.
Ingvarson, L. (2005). Getting professional development right. In Australian Council for Educational Research Annual Conference Proceedings 2005 – Getting Data to Support Learning Conference (pp. 63-71). Retrieved June 28, 2008, from http://www.acer.edu.au/documents/RC2005_Ingvarson.pdf.
Jepsen, C., & Rivkin, S.G. (2002). Class size reduction, teacher quality, and academic achievement in California public elementary schools. Retrieved October 10, 2008, from http://www.ppic.org/content/pubs/report/R_602CJR.pdf
Johnson, L.S. (2007, July). Teacher induction in Kansas City: State policy, district trends, and their implications. Retrieved October 23, 2008, from http://www.newteachercenter.org/norti/docs/Johnson_Kauffman_Report_8.2.07_FINAL-2.pdf
Joyce, B., & Calhoun, E. (1996). Learning experiences in school renewal: An exploration of five successful programs. Eugene, OR: ERIC Clearinghouse on Educational Management.
Kang, N., & Hong, M. (2008). Achieving excellence in teacher workforce and equity in learning opportunities in South Korea. Educational Researcher, 37(4), 200-207.
Professional Learning in the Learning Profession68
Kansanen, P. (2003). Teacher education in Finland: Current models and new developments. In B. Moon, L. Vlasceanu, & C. Barrows (Eds.), Institutional approaches to teacher education within higher education in Europe: Current models and new developments (pp. 85-108). Retrieved June 12, 2008, from http://www.helsinki.fi/~pkansane/ceps.pdf
Kennedy, M. (1998). Form and substance of inservice teacher education (Research Monograph No. 13). Madison, WI: National Institute for Science Education, University of Wisconsin–Madison.
Kentucky Department of Education. (2007). Professional development. Retrieved October 10, 2008, from http://www.kde.state.ky.us/KDE/Administrative+Resources/Professional+Development/default.htm
Killion, J. (1999). What works in the middle: Results-based staff development. Oxford, OH: National Staff Development Council.
Killion, J. (2002a). What works in the high school: Results-based staff development. Oxford, OH: National Staff Development Council.
Killion, J. (2002b). What works in the elementary school: Results-based staff development. Oxford, OH: National Staff Development Council.
Knapp, M.S. (2003). Professional development as policy pathway. Review of Research in Education, 27(1), 109-157.
Knight, J. (2004). Instructional coaching. StrateNotes, 13(3), 1–5. Retrieved March 15, 2007, from www.instructionalcoach.org/nov_stratenotes.pdf
Kohler, F.W., Crilley, K.M., Shearer, D.D., & Good, G. (1997). Effects of peer coaching on teacher and student outcomes. Journal of Educational Research, 90(4), 240–250.
Laguardia, A., Brink, B., Wheeler, M., Grisham, D., & Peck, C. (2002). From agents to objects: The lived experience of school reform. Child Study Journal, 32(1), 1-19.
Laukannen, R. (2008). In teachers we trust: An interview with Finnish education expert Reijo Laukannen. Posted by Claus von Zastrow on Public School Insights. Retrieved October 31, 2008, from http://www.publicschoolinsights.org/?storyId=22987
Lieberman, A., & Wood, D. (2002). From network learning to classroom teaching. Journal of Educational Change, 3, 315-337.
Little, J. W. (1990). The persistence of privacy: Autonomy and initiative in teachers’ professional relations. Teacher College Record, 91(4), 509-536.
Little, J. W. (1993). Teachers’ professional development in a climate of educational reform. Educational Evaluation and Policy Analysis, 15(2), 129.
Little, J.W. (2003). Inside teacher community: Representations of classroom practice. Teacher College Record, 105(6), 913-945.
Lortie, D. C. (1975). Schoolteacher: A sociological study. Chicago: University of Chicago Press.
Louis, K. S., Marks, H. M., & Kruse, S. (1996). Professional community in restructuring schools. American Educational Research Journal, 33(4), 757-798.
References 69
Louis, K.S., & Marks, H.M. (1998). Does professional learning community affect the classroom? Teachers’ work and student experiences in restructuring schools. American Journal of Education, 106(4), 532-575.
Luczak, J.M. (2004). Who will teach in the 21st century? Beginning teacher training experiences and attrition rates. Unpublished dissertation, Stanford University. UMI 3145612
Luft, J. A., & Cox, W. E. (2001). Investing in our future: A survey of support offered to beginning secondary science and mathematics teachers. Science Educator, 10(1), 1-9.
Luft, J. A., Roehrig, G. H., & Patterson, N. C. (2003). Contrasting landscapes: A comparison of the impact of different induction programs on beginning secondary science teachersí practices, beliefs, and experiences. Journal of Research in Science Teaching, 40, 77-97.
Lustick, D., & Sykes, G. (2006). National Board Certification as professional development: What are teachers learning. Education Policy Analysis Archives, 14(5), 1-43.
Lyons, C.A., & Pinnell, G.S. (2001). Systems for change in literacy education: A guide to professional development. Portsmouth, NH: Heinemann.
Math Solutions. (2008). District partnerships: State of Arkansas. Retrieved October 31, 2008, from http://www.mathsolutions.com/index.cfm?page=wp7&crid=151
McDiarmid, G.W., & Corcoran, T. (2000). Promoting the professional development of all teachers. In R.S. Pankratz & J.M. Petrosko (Eds.), All children can learn: Lessons from the Kentucky reform experience (pp.147-159). San Francisco: Jossey-Bass.
McGill-Franzen, A., Allington, R.L., Yokio, L., & Brooks, G. (1999). Putting books in the classroom seems necessary but not sufficient. The Journal of Educational Research, 93(2), 67-74.
McLaughlin, M. W., & Talbert, J. E. (2001). Professional communities and the work of high school teaching. Chicago: University Of Chicago Press.
Meiers, M., Ingvarson, L., Beavis, A., Hogan, J., & Kleinhenz, E. (2006). An evaluation of the Getting it Right: Literacy and numeracy strategy in Western Australian Schools Volume 1. Retrieved June 28, 2008, from http://research.acer.edu.au/cgi/viewcontent.cgi?article=1002&context=policy_reform
Merek E., & Methven, S, (1991). Effects of the learning cycle upon student and classroom teacher performance. Journal of Research in Science Teaching, 28(1), 41-53.
MetLife (2004-2005). The MetLife Survey of the American Teacher: Transitions and the role of supportive relationships. New York: Metropolitan Life Insurance Company.
MetLife (2006). The MetLife Survey of the American Teacher: Expectations and Experiences. New York: Metropolitan Life Insurance Company.
Missouri Department of Elementary and Secondary Education. (2006). Missouri professional development guidelines for student success. Retrieved October 10, 2008, from http://dese.mo.gov/divteachqual/leadership/pd_guidelines/
Missouri State Teachers Association. (2005). Missouri’s mentoring framework. Retrieved October 10, 2008, from http://www.msta.org/files/new_teachers/mentoring_frameworks.pdf

Professional Learning in the Learning Profession70
National Commission on Teaching and America’s Future. (1996). What matters most: Teaching for America’s future. New York: National Commission on Teaching and America’s Future.
National Commission on Teaching and America’s Future (2005). Induction into learning communities. Washington, DC: National Commission on Teaching and America’s Future.
National Education Association. (2008). Access, adequacy, and equity in education technology: Results of a survey of America’s teachers and support professionals on technology in public schools and classrooms. Washington, DC: National Educational Agency.
National Education Goals Panel (NEGP). (1999). Reading achievement state by state, 1999. Washington, DC: U.S. Government Printing Office.
National Mathematics Advisory Panel. (2008). Foundations for success: The final report of the National Mathematics Advisory Panel. Washington, DC: U.S. Department of Education.
National Staff Development Council. (2001). Standards for Staff Development (Revised). Oxford, OH: NSDC.
Neufeld, B., & Roper, D. (2003). Coaching: A strategy for developing institutional capacity, promises and practicalities. Retrieved September 14, 2006, from www.annenberginstitute.org/images/Coaching.pdf
Newman, F. M. & Associates. (1996). Authentic instruction: Restructuring schools for intellectual quality. San Francisco: Jossey-Bass.
Newman, F., & Wehlage, G. (1997). Successful school restructuring: A report to the public and educators by the Center on Organization and Restructuring of Schools. Madison, WI: Document Service, Wisconsin Center for Education Research.
Norton, J. (2001). A storybook breakthrough. Journal of Staff Development, 22(4), 22–25. Retrieved August 9, 2006, from www.nsdc.org/library/publications/jsd/norton224.pdf
Oakes, J. (2002). Education inadequacy, inequality, and failed state policy: A synthesis of expert reports prepared for Williams v. State of California. Retrieved October 10, 2008, from http://www.decentschools.org/expert_reports/oakes_report.pdf
Odell, S.J., & Ferraro, D.P. (1992). Teacher mentoring and teacher retention. Journal of Teacher Education, 43(3), 200-04.
Office of the Superintendent of Public Instruction. (2006). Professional growth planning for clock hours: Guidelines for educators in Washington state. Olympia: OSPI.
Olebe, M. (2001). A decade of policy support for California’s new teachers: The beginning teacher support and assessment program. Teacher Education Quarterly, 10(2), 9-21.
Organisation for Economic Cooperation and Development (OECD). (2004). Completing the foundation for lifelong learning: An OECD survey of upper secondary schools. Paris: OECD.
Organisation for Economic Cooperation and Development (OECD). (2005). Teachers matter: Attracting, developing, and retaining effective teachers. Paris: OECD.
Organisation for Economic Cooperation and Development (OECD). (2007). Education at a glance 2007: OECD indicators. Paris: OECD.
References 71
Pang, M. (2006). The use of learning study to enhance teacher professional learning in Hong Kong. Teaching Education, 17(1), 27-42.
Penuel, W., Fishman, B., Yamaguchi, R., & Gallagher, L. (2007, December). What makes professional development effective? Strategies that foster curriculum implementation. American Educational Research Journal, 44(4), 921-958.
Phillips, J. (2003). Powerful learning: Creating learning communities in urban school reform. Journal of Curriculum and Supervision, 18(3), 240-258.
Poglinco, S.M., Bach, A.J., Hovde, K., Rosenblum, .S., Saunders, M., & Supovitz, J.A. (2003). The heart of the matter: The coaching model in America’s Choice schools. Philadelphia: Consortium for Policy Research in Education, University of Pennsylvania.
Pourdavood, R., Grob, S., Clark, J., & Orr, H. (1999). Discourse on professional growth: Processes, relationships, dilemmas, and hope. School Community Journal, 9(1), 33-47.
Putnam, R., & Borko, H. (2000). What do new view of knowledge and thinking have to say about research on teacher learning? Educational Researcher, 29(1), 4-15.
Rockoff, J.E. (2008, February). Does mentoring reduce turnover and improve skills of new employees? Evidence from teachers in New York City (National Bureau of Economics Working Paper 13868). Under review, Journal of Labor Economics. Retrieved October 31, 2008, from http://www.nber.org/papers/w13868
Rolheiser, C., & Hundey, I. (1995). Building norms for professional growth in beginning teachers: A learning consortium initiative. School Effectiveness and School Improvement, 6(3), 205-221.
Ronnerman, K. (1996, April 7). Action research as in-service project to help teachers validate their own teaching practice. Paper presented at the annual meeting of the American Educational Research Association, New York.
Russo, A. (2004, July/August). School-based coaching. A revolution in professional development – or just the latest fad? Harvard Education Letter, 20(4).
Sahlberg, P. (2007). Education policies for raising student learning: The Finnish approach. Journal of Education Policy, 22(2), 147-171.
Salleh, H. (2006). Action research in Singapore education: Constraints and sustainability. Educational Action Research, 14(4), 513-523.
Sato, M., Wei, R.C., & Darling-Hammond, L. (2008). Improving teachers’ assessment practices through professional development: The case of National Board Certification. American Educational Research Journal, 45(3), 669-700.
Saxe, G., Gearhart, M., & Nasir, N. S. (2001). Enhancing students’ understanding of Mathematics: A study of three contrasting approaches to professional support. Journal of Mathematics Teacher Education, 4, 55-79.
Schwartz, S., & McCarthy, M. (with Gould, T., Politiziner, S., & Enyeart, C.). (2003). Where the rubber hits the road: An in-depth look at collaborative coaching and learning and workshop instruction in a sample of effective practice schools. Boston, MA: Boston Plan for Excellence.
Professional Learning in the Learning Profession72
Serpell, Z., & Bozeman, L. (1999). Beginning teacher induction: A report on beginning teacher effectiveness and retention. Washington, DC: National Partnership for Excellence and Accountability in Teaching. Retrieved October 31, 2008, from http://www.ericsp.org/digests/BeginningTeachInduction.htm
Sherin, M. G. (2004). New perspectives on the role of video in teacher education. In J. Brophy (Ed.) Using video in teacher education: Advances in research on teaching (pp. 1-27). Oxford: Elsevier Press.
Showers, B., & Joyce, B. (1996). The evolution of peer coaching. Educational Leadership, 53(6), 12–16.
Skilbeck, M., & Connell, H. (2003). Attracting, developing and retaining effective teachers: Australian country background report. Canberra: Commonwealth of Australia.
Smith, T. M., & Ingersoll, R. M. (2004). What are the effects of induction and mentoring on beginning teacher turnover? American Educational Research Journal, 41(3), 681-714.
Snow-Renner, R., & Lauer, P. (2005). Professional development analysis. Denver, CO: Mid-Content Research for Education and Learning.
South Carolina Department of Education. (2006). ADEPT system guidelines. Retrieved October 10, 2008, from http://www.scteachers.org/ADEPT/evalpdf/adept_guidelines.pdf
South Carolina Division of Educator Quality and Leadership (DEQL). (2006). South Carolina induction and mentoring program: Implementation guidelines. Retrieved October 10, 2008, from http://www.scteachers.org/Cert/certpdf/mentor_guide.pdf
Spuhler, L., & Zetler, A. (1995). Montana beginning teacher support program. final report. Helena, MT: Montana State Board of Education.
Stansbury, K., & Zimmerman, J. (2000), Lifelines to the classroom: Designing support for beginning teachers. San Francisco: WestEd.
Stecher, B., & Borko, H. (2002) Combining surveys and case studies to examine standards-based educational reform (CSE Tech. Rep. 565). Los Angeles: University of California Center for Research on Evaluation, Standards, and Student Testing (CCRESST).
Stecher, B. M., Chun, T, Barron, S., & Ross, K. (2000). The effects of the Washington State education reform on schools and classrooms (CSE Technical Report 515). Los Angeles: UCLA Center for the Study of Evaluation.
Stein, M.K., Smith, M.S., & Silver, E.A. (1999). The development of professional developers: Learning to assist teachers in new settings in new ways. Harvard Educational Review, 69(3), 237-269.
Strahan, D. (2003). Promoting a collaborative professional culture in three elementary schools that have beaten the odds. The Elementary School Journal, 104(2), 127-133.
Supovitz, J.A., & Christman, J.B. (2003, November). Developing communities of instructional practice: Lessons from Cincinnati and Philadelphia (CPRE Policy Briefs RB-39). Pennsylvania: University of Pennsylvania, Graduate School of Education.
Supovitz, J.A., Mayer, D. P. , & Kahle, J.B. (2000). Promoting inquiry based instructional practice: The longitudinal impact of professional development in the context of systemic reform. Educational Policy, 14(3), 331-356.

References 73
Supovitz, J. A., & Turner, H. M. (2000). The effects of professional development on science teaching practices and classroom culture. Journal of Research in Science Teaching, 37(9), 963–980.
Tripp, D. (2004). Teachers’ networks: A new approach to the professional development of teachers in Singapore. In C. Day & J. Sachsm International Handbook on the Continuing Professional Development of Teachers (pp. 191-214). Maidenhead, UK: Open University Press.
Vaden-Kiernan, M., Hughes Jones, D., & McCann, E. (2008, August). National Staff Development Council: Revisions and additional psychometric data analyses of the standards assessment inventory. Austin, TX: Southwest Educational Development Laboratory (SEDL) Evaluation Services.
Välijärvi, J., Kupari, P., Linnakylä, P., Reinikainen, P., Sulkunen, S., Törnroos, J., & Arffman, I. (2007). The Finnish success in PISA – and some reasons behind it (PISA 2003). Finland: Institute for Educational Research, University of Jyvaskyla.
Vandevoort, L.G., Amrein-Beardsley, A., & Berliner, D. (2004). National Board certified teachers and their students’ achievement. Educational Policy Analysis Archives, 12(46), 1-117.
Veenman, S., Denessen, E., Gerrits, J., & Kenter, J. (2001). Evaluation of a coaching programme for cooperating teachers. Educational Studies, 27(3), 317–340.
Vescio, V., Ross, D., & Adams, A. (2008). A review of research on the impact of professional learning communities on teaching practice and student learning. Teaching and Teacher Education, 24(1), 80-91.
Wang, J., Odell, S., & Schwille, S. (2008). Effects of teacher induction on beginning teachers’ teaching: A critical review. Journal of Teacher Education, 59(2), 132-152.
Weiss, I. R., & Pasley J. D. (2006). Scaling up instructional improvement through teacher professional development: Insights from the local systemic change initiative. Philadelphia, PA: Consortium for Policy Research in Education (CPRE) Policy Briefs.
Wenger, E. (1998). Communities of practice: Learning, meaning, and identity. Cambridge, England: Cambridge University Press.
Wenglinsky, H. (2000). How teaching matters: Bringing the classroom back into discussions of teacher quality. Princeton, NY: Milken Family Foundation and Educational Testing Service.
Westheimer, J. (1999). Communities and consequences: An inquiry into ideology and practice in teachers’ professional work. Educational Administration Quarterly, 35(1), 71-105.
Wilson, S.M., Darling-Hammond, L., & Berry, B. (2001). A case of successful teaching policy: Connecticut’s long-term efforts to improve teaching and learning. Seattle, WA: Center for the Study of Teaching and Policy, University of Washington.
Wong, H.K., Britton, T. & Ganser, T. (2005, January). What the world can teach us about new teacher induction. Phi Delta Kappan, 86(5), 379-384. Retrieved July 27, 2008, from http://www.newteacher.com/pdf/PDK_Article_Jan05.pdf.
Yoon, K. S., Duncan, T., Lee, S. W.-Y., Scarloss, B., & Shapley, K. (2007). Reviewing the evidence on how teacher professional development affects student achievement (Issues & Answers Report, REL 2007–No. 033). Retrieved October 15, 2008, from http://ies.ed.gov/ncee/edlabs/regions/southwest/pdf/REL_2007033.pdf
Professional Learning in the Learning Profession74
or our analyses of the status of professional development in the U.S., we used the School and Staffing Survey (SASS) dataset of 2003-04 (National Center for Education Statistics). SASS includes data on the characteristics and qualifications of teachers and principals, schools’ teacher hiring practices, teachers’ professional development, and
a number of other characteristics of schools across the nation. The SASS dataset allows comparisons of public and private schools and staff and the sampling is representative of all states (and the District of Columbia) for public schools across the country.
Appendix A:Datasets and Methods
sChooLs and staffing suRvey 2003-04
We restricted our sample to schools and regular or itinerant teachers in the public sector. The total sample size was 40,520 teachers. In order to account for the strati-fied probability sample design scheme used in SASS we used two types of weighting variables. The first weight is the sampling weight which adjusts for non-response and oversampling and is used so that estimates represent the population rather than sim-ply the sample. The replication weights are variables containing the necessary infor-mation for computing the standard errors of point estimates without giving away any information regarding the identity of any respondents. The use of both types of weights (probability and replication) is nec-essary for the correct calculation of point estimates and their standard errors.
We used information on teachers provided by two sources: the Teacher Questionnaire and the School Questionnaire. Each teacher and school in the SASS dataset has unique control numbers. Therefore, we were able to match teacher and school data by using the school control number. This allowed us to link the state and other schools context variables (school grade level, school loca-tion, percent minority enrollment, percent LEP enrollment, percent enrolled in the
Free and Reduced Lunch program) to teacher responses.
To aid our analysis, we created a number of composite variables that combined data from different variables included in the SASS data files. One composite variable assessed the extent of different kinds of in-duction support given to first-year teachers (similar in concept to Smith and Ingersoll’s “induction packages” (2004) and Luczak’s “induction power ratings” (2004). Our first set of composite variables was the percent-age of beginning teachers who reported receiving three out of the four most com-monly reported induction supports (mentor, common planning time, seminars or classes, and regular supportive communication with administrators) the percentage of teachers who reported receiving all four of these supports, and the average number of these four supports teachers reported. A second similar set of composite variables included two additional but less commonly reported induction supports (reduced teaching sched-ule and reduced number of preparations). Another composite variable reporting the total days of teacher participation in formal professional development opportunities was created by combining the data on indi-vidual SASS survey items. Last, we created
F
Appendix A 75
our own “percent minority enrollment variable,” using the percentages of African-American, Latino/Hispanic, and Native American student enrollment reported in the School Questionnaires. For other school context variables (school grade level, school urbanicity, percent LEP enrollment, and percent of students enrolled in the Free and Reduced Lunch program), we utilized the created variables that were included in the SASS restricted-use dataset.
Our analysis consisted of two types of com-parisons: state averages compared to the national average and comparisons of aver-ages across quintiles or quartiles of specific student population characteristics. For the first type of comparison, we computed the national average for all variables of interest. Then, using the sampling and replication weights, we compared the average value of teachers’ responses in each state to the national average. In the summary tables in Appendix B, we noted state averages that were significantly higher than the national average (p < 0.01).
Several characteristics of school communi-ties that may be associated with differences in school academic performance and/or teacher working conditions were used to analyze participation rates in professional development: School grade level (elemen-tary vs. secondary); School urbanicity (large city/central, urban fringe, small town/rural); School minority enrollment (divided into quintiles of minority enrollment); School poverty level as measured by the percent-age of students eligible for the federal Free and Reduced Lunch program (divided into quartiles of the percentage enrolled); and percentage of students classified as Limited English Proficient (divided into quintiles of LEP enrollment). We divided two variables into quintiles instead of quartiles (per-
cent minority enrollment and percent LEP enrollment) because past research indicates that there are differences in the extreme groups of schools with the lowest and high-est concentration of students with these demographic characteristics. (These school level data were obtained from the 2003-04 School Questionnaire which were com-pleted by school administrators, and linked with the data from the Teacher Question-naire.) Tables 2, 4, 6, 9, 10, 13, and 14 in Appendix B display the participation rates across these school context variables for all induction and professional develop-ment items. These tables highlight the cases in which the percentages are significantly higher or lower than the national average, but do not indicate when the percentages are significantly different between catego-ries. In the summary tables in Appendix B, we noted significant differences (p < 0.01) between the average value of teachers’ re-sponses in each category with the national average. Differences between categories within the same variable are reported in the main body of this report.
The 2003-04 national averages for public school teachers are compared to findings from the 1999-2000 SASS administra-tion, published by NCES (Choy, Chen, and Bugarin, 2006). We also compare findings from the 2003-04 SASS dataset with find-ings from other nationally representative surveys (e.g., the Met Life Survey of the American Teacher 2004-05; the 2006 NEA Survey of teachers on “Access, Adequacy, and Equity in Education Technology,” and with findings from a 4-state dataset from the 2007-08 National Staff Development Council’s Standards Assessment Inventory. These other datasets allow us to confirm or disconfirm our findings.
While teachers’ reports of participation in
Professional Learning in the Learning Profession76
various forms of professional development cannot be equated with access to or avail-ability of opportunities for professional development because some of these oppor-tunities are required and others are volun-tary, we do make an inference that levels of participation are a reflection of the access and availability of professional develop-ment opportunities across states and in different school contexts.
nationaL staff deveLopment CounCiL: standaRds assessment inventoRy
Data from the most current administration of the survey (2007-08 academic year) were analyzed for this study. Because the survey sample is not a nationally representative sample, we made strategic choices about which states’ samples to include in our analyses. Two states (Arizona and Georgia) have contracted with the NSDC to admin-ister the survey across the entire state. The approximate response rates based on the total number of teachers currently teaching in public schools in each state are 33% for Georgia and 13% for Arizona. Missouri administers the survey on a voluntary basis, but almost all of the districts (56 districts) have agreed to administer the survey. The response rate in Missouri was 7%. One other state, Alabama, had the fourth larg-est sample in the 2007-08 administration and the response rate based on the total public school teacher population is 8%. Altogether, the number of teacher responses from public schools in these four states was just over 50,000. The data from these four states were combined and analyzed, and results were compared with results from the Schools and Staffing Survey (2003-04). Be-cause most of the schools and districts that administered the survey did so on a volun-
tary basis (especially those in Alabama and Missouri), we make an assumption that this sample most likely represents the “best case scenario.” Schools and districts that elected to participate in the survey were probably more likely to participate in the survey if they already perceived teachers’ professional development to be an important component of school success and had made professional development a priority in their schools or districts.
Differences in ratings across items and across constructs were analyzed to assess the preva-lence of particular professional development practices and supports, and differences in rat-ings between teachers in urban and non-ur-ban contexts were also analyzed. The results from the 2007-08 SAI were then compared with findings from the SASS 2003-04 Teacher Questionnaire on items with similar content. However, because the scales on these two instruments are different, direct comparisons cannot be made. (The scale used across all 60 items on the SAI ranges from 0=Never to 4=Always. It serves as an indicator of the intensity or prevalence of the type of pro-fessional development practice or support across items.) In most cases, we compare the percentage of teachers with the two highest rating levels for each instrument. In the SAI, “frequently” and “always” are often com-bined to assess the prevalence of the school practice or support.1 In the SASS dataset, we examine the percentage of teachers report-ing whether they participated in a form of professional development (Yes/No), and the 1We include the responses in the “frequently” (3) and “always” (4) categories in our assessment of the prevalence of a professional development practice or support on the SAI. Although one could argue that the response “sometimes” (2) should be included, we decided not to include it because the addition of “sometimes” results in there being very little variation across items.
Appendix A 77
combined percentage of teachers reporting “agree” + “strongly agree” or the combined percentage of teachers reporting “moder-ate” or “great” influence.
When the developers of the SAI, the South-west Educational Development Laboratory (SEDL), conducted factor analyses on aver-age school level ratings in Georgia (Spring 2006), the results indicated that there were three factors, as below:
• Factor 1 had a total of 43 items, with a majority (i.e., 63% or 27 of the 43 items) of the items originally grouped under the standard titled “Process;”
• Factor 2 had 5 out of 7 items that corresponded to the standard cat-egory “Context” and contained meaning that may be interpreted as “Leadership;” the remaining 2 items corresponded to “Content” and “Process” standard categories but their content was subsumed under the leadership label;
• Factor 3 had 3 items exclusively derived from the standard category “Content,” specifically from the “Equity” category (Vaden-Kiernan, Hughes Jones, and McCann, 2008).
However, the first factor included so many items (43), representing two-thirds of the survey items across many different standards, that to some extent, the factor loses its value as a construct. We re-examined the constructs within the SAI, conducting factor analyses on the 2007-08 responses from one state, Georgia, which has the highest sample size among the four states. We used the same
procedures for factor analysis as those used by Vaden-Kiernan, Hughes Jones, and McCann (2008), except that we used individual teacher responses across all grades rather than school level averages across elementary grades only. We used the principal axis extraction method for non-normal distributions and the oblimin (oblique) rotation to allow for some correlation between factors. We obtained four factors that we analyzed for content and categorized them based on the content of the items:
• Factor 1 — Opportunities for Pro-fessional Development and Collabo-ration (20 items);
• Factor 2 — School Leadership (10 items);
• Factor 3 — Equity (9 items);
• Factor 4 — Teacher Influence and Collaboration (5 items)
(16 survey items did not load onto any of these four factors.)
To determine whether there were differences in teachers’ responses depending on the location of their schools, we coded each school as an urban or non-urban school depending on the location of the school or district. If the school or district was located in any of the major cities in each state, it was coded as an urban school or district. Approximately one-fifth of the teachers in the four-state SAI dataset sample were teaching in urban schools. In this case, one-way analysis of variance (ANOVA) was used assess the differences in average ratings across SAI items depending on school urbanicity.

79
Appendix B:Results from the 2003-04
Schools and Staffing Survey(nationaL CenteR foR eduCation statistiCs)
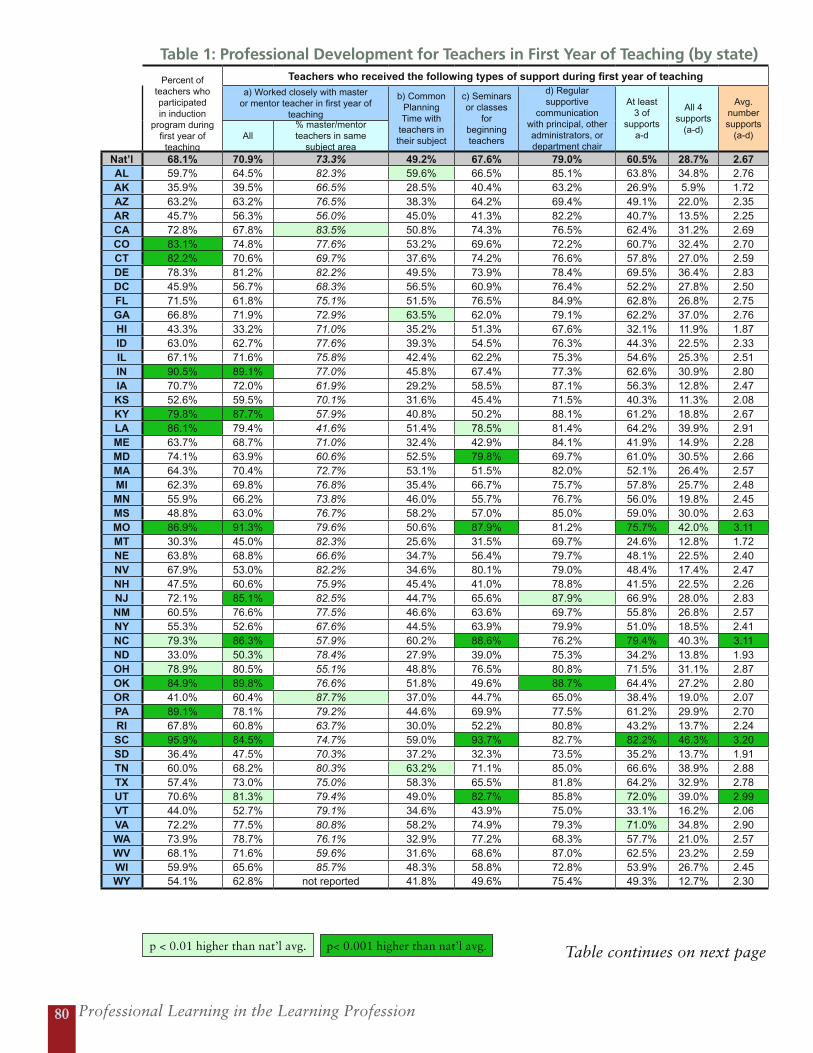
Professional Learning in the Learning Profession80
p < 0.01 higher than nat’l avg. p< 0.001 higher than nat’l avg.
Table 1: Professional Development for Teachers in First Year of Teaching (by state)
Percent of teachers who participated in induction
program during first year of
teaching
Teachers who received the following types of support during first year of teaching
a) Worked closely with master or mentor teacher in first year of
teaching
b) Common Planning Time with
teachers in their subject
c) Seminars or classes
for beginning teachers
d) Regular supportive
communication with principal, other administrators, or department chair
At least 3 of
supports a-d
All 4 supports
(a-d)
Avg. number supports
(a-d) All% master/mentor teachers in same
subject areaNat’l 68.1% 70.9% 73.3% 49.2% 67.6% 79.0% 60.5% 28.7% 2.67AL 59.7% 64.5% 82.3% 59.6% 66.5% 85.1% 63.8% 34.8% 2.76AK 35.9% 39.5% 66.5% 28.5% 40.4% 63.2% 26.9% 5.9% 1.72AZ 63.2% 63.2% 76.5% 38.3% 64.2% 69.4% 49.1% 22.0% 2.35AR 45.7% 56.3% 56.0% 45.0% 41.3% 82.2% 40.7% 13.5% 2.25CA 72.8% 67.8% 83.5% 50.8% 74.3% 76.5% 62.4% 31.2% 2.69CO 83.1% 74.8% 77.6% 53.2% 69.6% 72.2% 60.7% 32.4% 2.70CT 82.2% 70.6% 69.7% 37.6% 74.2% 76.6% 57.8% 27.0% 2.59DE 78.3% 81.2% 82.2% 49.5% 73.9% 78.4% 69.5% 36.4% 2.83DC 45.9% 56.7% 68.3% 56.5% 60.9% 76.4% 52.2% 27.8% 2.50FL 71.5% 61.8% 75.1% 51.5% 76.5% 84.9% 62.8% 26.8% 2.75GA 66.8% 71.9% 72.9% 63.5% 62.0% 79.1% 62.2% 37.0% 2.76HI 43.3% 33.2% 71.0% 35.2% 51.3% 67.6% 32.1% 11.9% 1.87ID 63.0% 62.7% 77.6% 39.3% 54.5% 76.3% 44.3% 22.5% 2.33IL 67.1% 71.6% 75.8% 42.4% 62.2% 75.3% 54.6% 25.3% 2.51IN 90.5% 89.1% 77.0% 45.8% 67.4% 77.3% 62.6% 30.9% 2.80IA 70.7% 72.0% 61.9% 29.2% 58.5% 87.1% 56.3% 12.8% 2.47KS 52.6% 59.5% 70.1% 31.6% 45.4% 71.5% 40.3% 11.3% 2.08KY 79.8% 87.7% 57.9% 40.8% 50.2% 88.1% 61.2% 18.8% 2.67LA 86.1% 79.4% 41.6% 51.4% 78.5% 81.4% 64.2% 39.9% 2.91ME 63.7% 68.7% 71.0% 32.4% 42.9% 84.1% 41.9% 14.9% 2.28MD 74.1% 63.9% 60.6% 52.5% 79.8% 69.7% 61.0% 30.5% 2.66MA 64.3% 70.4% 72.7% 53.1% 51.5% 82.0% 52.1% 26.4% 2.57MI 62.3% 69.8% 76.8% 35.4% 66.7% 75.7% 57.8% 25.7% 2.48MN 55.9% 66.2% 73.8% 46.0% 55.7% 76.7% 56.0% 19.8% 2.45MS 48.8% 63.0% 76.7% 58.2% 57.0% 85.0% 59.0% 30.0% 2.63MO 86.9% 91.3% 79.6% 50.6% 87.9% 81.2% 75.7% 42.0% 3.11MT 30.3% 45.0% 82.3% 25.6% 31.5% 69.7% 24.6% 12.8% 1.72NE 63.8% 68.8% 66.6% 34.7% 56.4% 79.7% 48.1% 22.5% 2.40NV 67.9% 53.0% 82.2% 34.6% 80.1% 79.0% 48.4% 17.4% 2.47NH 47.5% 60.6% 75.9% 45.4% 41.0% 78.8% 41.5% 22.5% 2.26NJ 72.1% 85.1% 82.5% 44.7% 65.6% 87.9% 66.9% 28.0% 2.83NM 60.5% 76.6% 77.5% 46.6% 63.6% 69.7% 55.8% 26.8% 2.57NY 55.3% 52.6% 67.6% 44.5% 63.9% 79.9% 51.0% 18.5% 2.41NC 79.3% 86.3% 57.9% 60.2% 88.6% 76.2% 79.4% 40.3% 3.11ND 33.0% 50.3% 78.4% 27.9% 39.0% 75.3% 34.2% 13.8% 1.93OH 78.9% 80.5% 55.1% 48.8% 76.5% 80.8% 71.5% 31.1% 2.87OK 84.9% 89.8% 76.6% 51.8% 49.6% 88.7% 64.4% 27.2% 2.80OR 41.0% 60.4% 87.7% 37.0% 44.7% 65.0% 38.4% 19.0% 2.07PA 89.1% 78.1% 79.2% 44.6% 69.9% 77.5% 61.2% 29.9% 2.70RI 67.8% 60.8% 63.7% 30.0% 52.2% 80.8% 43.2% 13.7% 2.24SC 95.9% 84.5% 74.7% 59.0% 93.7% 82.7% 82.2% 46.3% 3.20SD 36.4% 47.5% 70.3% 37.2% 32.3% 73.5% 35.2% 13.7% 1.91TN 60.0% 68.2% 80.3% 63.2% 71.1% 85.0% 66.6% 38.9% 2.88TX 57.4% 73.0% 75.0% 58.3% 65.5% 81.8% 64.2% 32.9% 2.78UT 70.6% 81.3% 79.4% 49.0% 82.7% 85.8% 72.0% 39.0% 2.99VT 44.0% 52.7% 79.1% 34.6% 43.9% 75.0% 33.1% 16.2% 2.06VA 72.2% 77.5% 80.8% 58.2% 74.9% 79.3% 71.0% 34.8% 2.90WA 73.9% 78.7% 76.1% 32.9% 77.2% 68.3% 57.7% 21.0% 2.57WV 68.1% 71.6% 59.6% 31.6% 68.6% 87.0% 62.5% 23.2% 2.59WI 59.9% 65.6% 85.7% 48.3% 58.8% 72.8% 53.9% 26.7% 2.45WY 54.1% 62.8% not reported 41.8% 49.6% 75.4% 49.3% 12.7% 2.30
Table continues on next page
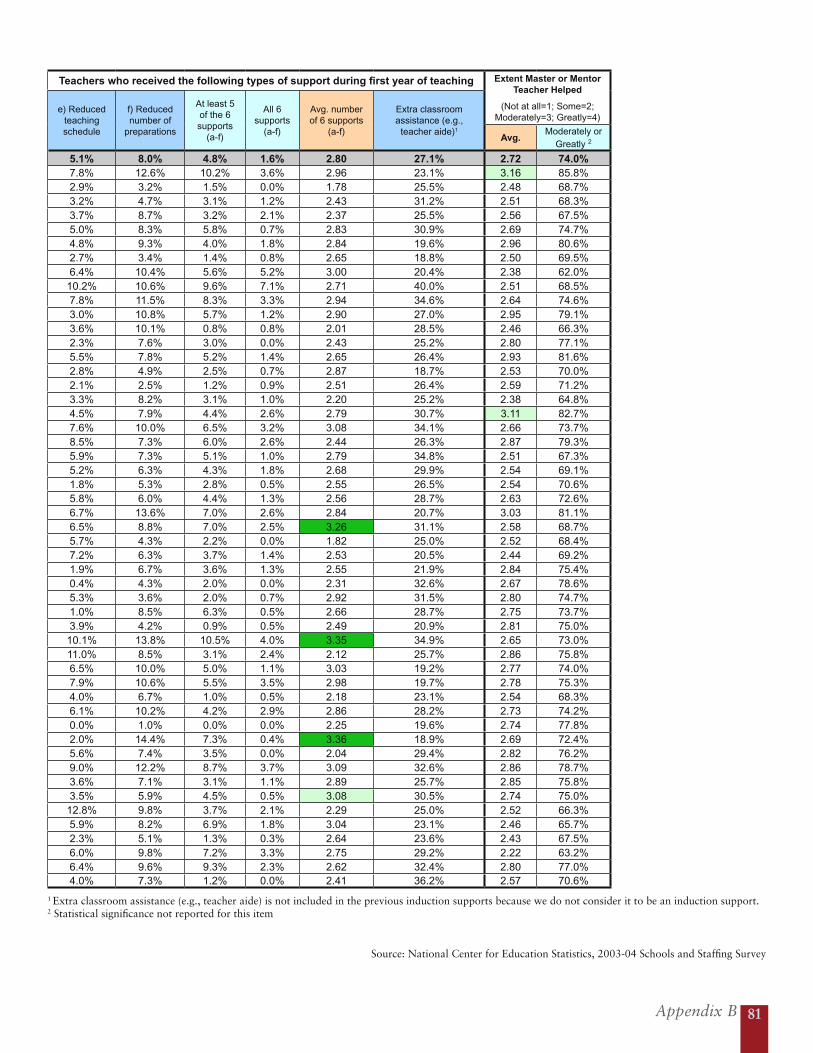
Appendix B 81
Source: National Center for Education Statistics, 2003-04 Schools and Staffing Survey
Table 1: Professional Development for Teachers in First Year of Teaching (by state)
Percent of teachers who participated in induction
program during first year of
teaching
Teachers who received the following types of support during first year of teaching
a) Worked closely with master or mentor teacher in first year of
teaching
b) Common Planning Time with
teachers in their subject
c) Seminars or classes
for beginning teachers
d) Regular supportive
communication with principal, other administrators, or department chair
At least 3 of
supports a-d
All 4 supports
(a-d)
Avg. number supports
(a-d) All% master/mentor teachers in same
subject areaNat’l 68.1% 70.9% 73.3% 49.2% 67.6% 79.0% 60.5% 28.7% 2.67AL 59.7% 64.5% 82.3% 59.6% 66.5% 85.1% 63.8% 34.8% 2.76AK 35.9% 39.5% 66.5% 28.5% 40.4% 63.2% 26.9% 5.9% 1.72AZ 63.2% 63.2% 76.5% 38.3% 64.2% 69.4% 49.1% 22.0% 2.35AR 45.7% 56.3% 56.0% 45.0% 41.3% 82.2% 40.7% 13.5% 2.25CA 72.8% 67.8% 83.5% 50.8% 74.3% 76.5% 62.4% 31.2% 2.69CO 83.1% 74.8% 77.6% 53.2% 69.6% 72.2% 60.7% 32.4% 2.70CT 82.2% 70.6% 69.7% 37.6% 74.2% 76.6% 57.8% 27.0% 2.59DE 78.3% 81.2% 82.2% 49.5% 73.9% 78.4% 69.5% 36.4% 2.83DC 45.9% 56.7% 68.3% 56.5% 60.9% 76.4% 52.2% 27.8% 2.50FL 71.5% 61.8% 75.1% 51.5% 76.5% 84.9% 62.8% 26.8% 2.75GA 66.8% 71.9% 72.9% 63.5% 62.0% 79.1% 62.2% 37.0% 2.76HI 43.3% 33.2% 71.0% 35.2% 51.3% 67.6% 32.1% 11.9% 1.87ID 63.0% 62.7% 77.6% 39.3% 54.5% 76.3% 44.3% 22.5% 2.33IL 67.1% 71.6% 75.8% 42.4% 62.2% 75.3% 54.6% 25.3% 2.51IN 90.5% 89.1% 77.0% 45.8% 67.4% 77.3% 62.6% 30.9% 2.80IA 70.7% 72.0% 61.9% 29.2% 58.5% 87.1% 56.3% 12.8% 2.47KS 52.6% 59.5% 70.1% 31.6% 45.4% 71.5% 40.3% 11.3% 2.08KY 79.8% 87.7% 57.9% 40.8% 50.2% 88.1% 61.2% 18.8% 2.67LA 86.1% 79.4% 41.6% 51.4% 78.5% 81.4% 64.2% 39.9% 2.91ME 63.7% 68.7% 71.0% 32.4% 42.9% 84.1% 41.9% 14.9% 2.28MD 74.1% 63.9% 60.6% 52.5% 79.8% 69.7% 61.0% 30.5% 2.66MA 64.3% 70.4% 72.7% 53.1% 51.5% 82.0% 52.1% 26.4% 2.57MI 62.3% 69.8% 76.8% 35.4% 66.7% 75.7% 57.8% 25.7% 2.48MN 55.9% 66.2% 73.8% 46.0% 55.7% 76.7% 56.0% 19.8% 2.45MS 48.8% 63.0% 76.7% 58.2% 57.0% 85.0% 59.0% 30.0% 2.63MO 86.9% 91.3% 79.6% 50.6% 87.9% 81.2% 75.7% 42.0% 3.11MT 30.3% 45.0% 82.3% 25.6% 31.5% 69.7% 24.6% 12.8% 1.72NE 63.8% 68.8% 66.6% 34.7% 56.4% 79.7% 48.1% 22.5% 2.40NV 67.9% 53.0% 82.2% 34.6% 80.1% 79.0% 48.4% 17.4% 2.47NH 47.5% 60.6% 75.9% 45.4% 41.0% 78.8% 41.5% 22.5% 2.26NJ 72.1% 85.1% 82.5% 44.7% 65.6% 87.9% 66.9% 28.0% 2.83NM 60.5% 76.6% 77.5% 46.6% 63.6% 69.7% 55.8% 26.8% 2.57NY 55.3% 52.6% 67.6% 44.5% 63.9% 79.9% 51.0% 18.5% 2.41NC 79.3% 86.3% 57.9% 60.2% 88.6% 76.2% 79.4% 40.3% 3.11ND 33.0% 50.3% 78.4% 27.9% 39.0% 75.3% 34.2% 13.8% 1.93OH 78.9% 80.5% 55.1% 48.8% 76.5% 80.8% 71.5% 31.1% 2.87OK 84.9% 89.8% 76.6% 51.8% 49.6% 88.7% 64.4% 27.2% 2.80OR 41.0% 60.4% 87.7% 37.0% 44.7% 65.0% 38.4% 19.0% 2.07PA 89.1% 78.1% 79.2% 44.6% 69.9% 77.5% 61.2% 29.9% 2.70RI 67.8% 60.8% 63.7% 30.0% 52.2% 80.8% 43.2% 13.7% 2.24SC 95.9% 84.5% 74.7% 59.0% 93.7% 82.7% 82.2% 46.3% 3.20SD 36.4% 47.5% 70.3% 37.2% 32.3% 73.5% 35.2% 13.7% 1.91TN 60.0% 68.2% 80.3% 63.2% 71.1% 85.0% 66.6% 38.9% 2.88TX 57.4% 73.0% 75.0% 58.3% 65.5% 81.8% 64.2% 32.9% 2.78UT 70.6% 81.3% 79.4% 49.0% 82.7% 85.8% 72.0% 39.0% 2.99VT 44.0% 52.7% 79.1% 34.6% 43.9% 75.0% 33.1% 16.2% 2.06VA 72.2% 77.5% 80.8% 58.2% 74.9% 79.3% 71.0% 34.8% 2.90WA 73.9% 78.7% 76.1% 32.9% 77.2% 68.3% 57.7% 21.0% 2.57WV 68.1% 71.6% 59.6% 31.6% 68.6% 87.0% 62.5% 23.2% 2.59WI 59.9% 65.6% 85.7% 48.3% 58.8% 72.8% 53.9% 26.7% 2.45WY 54.1% 62.8% not reported 41.8% 49.6% 75.4% 49.3% 12.7% 2.30
Teachers who received the following types of support during first year of teaching Extent Master or Mentor Teacher Helped
(Not at all=1; Some=2; Moderately=3; Greatly=4)
e) Reduced teaching schedule
f) Reduced number of
preparations
At least 5 of the 6 supports
(a-f)
All 6 supports
(a-f)
Avg. number of 6 supports
(a-f)
Extra classroom assistance (e.g.,
teacher aide)1
Avg.Moderately or
Greatly 2
5.1% 8.0% 4.8% 1.6% 2.80 27.1% 2.72 74.0%7.8% 12.6% 10.2% 3.6% 2.96 23.1% 3.16 85.8%2.9% 3.2% 1.5% 0.0% 1.78 25.5% 2.48 68.7%3.2% 4.7% 3.1% 1.2% 2.43 31.2% 2.51 68.3%3.7% 8.7% 3.2% 2.1% 2.37 25.5% 2.56 67.5%5.0% 8.3% 5.8% 0.7% 2.83 30.9% 2.69 74.7%4.8% 9.3% 4.0% 1.8% 2.84 19.6% 2.96 80.6%2.7% 3.4% 1.4% 0.8% 2.65 18.8% 2.50 69.5%6.4% 10.4% 5.6% 5.2% 3.00 20.4% 2.38 62.0%
10.2% 10.6% 9.6% 7.1% 2.71 40.0% 2.51 68.5%7.8% 11.5% 8.3% 3.3% 2.94 34.6% 2.64 74.6%3.0% 10.8% 5.7% 1.2% 2.90 27.0% 2.95 79.1%3.6% 10.1% 0.8% 0.8% 2.01 28.5% 2.46 66.3%2.3% 7.6% 3.0% 0.0% 2.43 25.2% 2.80 77.1%5.5% 7.8% 5.2% 1.4% 2.65 26.4% 2.93 81.6%2.8% 4.9% 2.5% 0.7% 2.87 18.7% 2.53 70.0%2.1% 2.5% 1.2% 0.9% 2.51 26.4% 2.59 71.2%3.3% 8.2% 3.1% 1.0% 2.20 25.2% 2.38 64.8%4.5% 7.9% 4.4% 2.6% 2.79 30.7% 3.11 82.7%7.6% 10.0% 6.5% 3.2% 3.08 34.1% 2.66 73.7%8.5% 7.3% 6.0% 2.6% 2.44 26.3% 2.87 79.3%5.9% 7.3% 5.1% 1.0% 2.79 34.8% 2.51 67.3%5.2% 6.3% 4.3% 1.8% 2.68 29.9% 2.54 69.1%1.8% 5.3% 2.8% 0.5% 2.55 26.5% 2.54 70.6%5.8% 6.0% 4.4% 1.3% 2.56 28.7% 2.63 72.6%6.7% 13.6% 7.0% 2.6% 2.84 20.7% 3.03 81.1%6.5% 8.8% 7.0% 2.5% 3.26 31.1% 2.58 68.7%5.7% 4.3% 2.2% 0.0% 1.82 25.0% 2.52 68.4%7.2% 6.3% 3.7% 1.4% 2.53 20.5% 2.44 69.2%1.9% 6.7% 3.6% 1.3% 2.55 21.9% 2.84 75.4%0.4% 4.3% 2.0% 0.0% 2.31 32.6% 2.67 78.6%5.3% 3.6% 2.0% 0.7% 2.92 31.5% 2.80 74.7%1.0% 8.5% 6.3% 0.5% 2.66 28.7% 2.75 73.7%3.9% 4.2% 0.9% 0.5% 2.49 20.9% 2.81 75.0%
10.1% 13.8% 10.5% 4.0% 3.35 34.9% 2.65 73.0%11.0% 8.5% 3.1% 2.4% 2.12 25.7% 2.86 75.8%6.5% 10.0% 5.0% 1.1% 3.03 19.2% 2.77 74.0%7.9% 10.6% 5.5% 3.5% 2.98 19.7% 2.78 75.3%4.0% 6.7% 1.0% 0.5% 2.18 23.1% 2.54 68.3%6.1% 10.2% 4.2% 2.9% 2.86 28.2% 2.73 74.2%0.0% 1.0% 0.0% 0.0% 2.25 19.6% 2.74 77.8%2.0% 14.4% 7.3% 0.4% 3.36 18.9% 2.69 72.4%5.6% 7.4% 3.5% 0.0% 2.04 29.4% 2.82 76.2%9.0% 12.2% 8.7% 3.7% 3.09 32.6% 2.86 78.7%3.6% 7.1% 3.1% 1.1% 2.89 25.7% 2.85 75.8%3.5% 5.9% 4.5% 0.5% 3.08 30.5% 2.74 75.0%
12.8% 9.8% 3.7% 2.1% 2.29 25.0% 2.52 66.3%5.9% 8.2% 6.9% 1.8% 3.04 23.1% 2.46 65.7%2.3% 5.1% 1.3% 0.3% 2.64 23.6% 2.43 67.5%6.0% 9.8% 7.2% 3.3% 2.75 29.2% 2.22 63.2%6.4% 9.6% 9.3% 2.3% 2.62 32.4% 2.80 77.0%4.0% 7.3% 1.2% 0.0% 2.41 36.2% 2.57 70.6%
1 Extra classroom assistance (e.g., teacher aide) is not included in the previous induction supports because we do not consider it to be an induction support. 2 Statistical significance not reported for this item

Professional Learning in the Learning Profession82
Table 2: Professional Development for Teachers in First Year of Teaching (by school context variables)
Percent of teachers who participated in induction
program during first
year of teaching
Teachers who received the following types of support during first year of teaching
a) Worked closely with master or mentor teacher in
first year of teaching b) Common Planning Time with teachers in their subject
c) Seminars or classes
for beginning teachers
d) Regular supportive
communication with principal,
other administrators, or department chair
At least 3 of
supports a-d
All 4 supports
(a-d)
Avg. number supports
(a-d)
All
% master/ mentor teachers in same subject
area
National 68.1% 73.3% 73.3% 49.2% 67.6% 79.0% 60.5% 28.7% 2.67
Sch
oo
l Lev
el
Elem. 68.1% 72.5% 74.4% 56.6% 69.6% 79.1% 64.2% 32.9% 2.78
Sec 70.1% 68.6% 72.5% 34.8% 65.5% 78.5% 53.8% 21.5% 2.48
Urb
anic
ity
City 63.5% 65.2% 73.5% 53.2% 70.4% 77.1% 59.3% 30.5% 2.66
Urban Fringe 72.6% 74.0% 74.5% 48.7% 69.4% 79.8% 62.9% 29.5% 2.72
Small Town/ Rural
62.8% 72.2% 68.9% 42.3% 56.1% 80.4% 54.7% 22.3% 2.51
% M
ino
rity
En
rollm
ent <10.5% 70.5% 59.0% 72.1% 50.0% 61.2% 77.4% 50.3% 26.2% 2.48
10.5-23.0% 72.7% 68.4% 82.8% 52.1% 75.3% 81.7% 66.3% 30.2% 2.78
23.0-44.6% 76.0% 75.5% 81.7% 41.5% 65.6% 74.0% 55.9% 23.4% 2.57
44.6-77.0% 64.9% 64.9% 75.6% 45.8% 72.3% 75.9% 59.6% 31.7% 2.59
>77.0% 68.4% 64.9% 77.5% 53.6% 67.2% 73.3% 57.5% 29.3% 2.59
% F
ree/
Red
uce
d L
un
ch
< 17.3% 75.0% 72.1% 76.3% 44.9% 65.7% 80.4% 60.3% 27.0% 2.63
17.3-34.3% 70.5% 74.1% 73.9% 43.9% 67.8% 78.9% 60.9% 25.2% 2.65
34.4-53.8% 66.0% 72.4% 73.8% 48.9% 67.9% 80.4% 61.5% 28.9% 2.70
> 53.8% 64.5% 67.8% 71.1% 54.4% 68.4% 77.5% 59.8% 31.4% 2.68
% L
EP
0% 68.4% 70.9% 72.8% 50.0% 66.1% 81.0% 60.4% 29.3% 2.68
<2.5% 77.4% 70.6% 71.5% 35.6% 70.2% 77.1% 56.7% 22.5% 2.54
2.5-5% 70.0% 65.0% 77.1% 48.9% 67.7% 78.8% 58.7% 30.0% 2.60
5-10% 67.1% 71.6% 69.7% 53.1% 68.7% 80.1% 63.1% 30.8% 2.73
>10% 65.8% 71.9% 74.5% 50.1% 68.8% 76.6% 61.2% 28.6% 2.68
Table continues on next page
p < 0.01 higher than nat’l avg. p < 0.01 lower than nat’l avgp< 0.001 higher than nat’l avg. p< 0.001 lower than nat’l avg
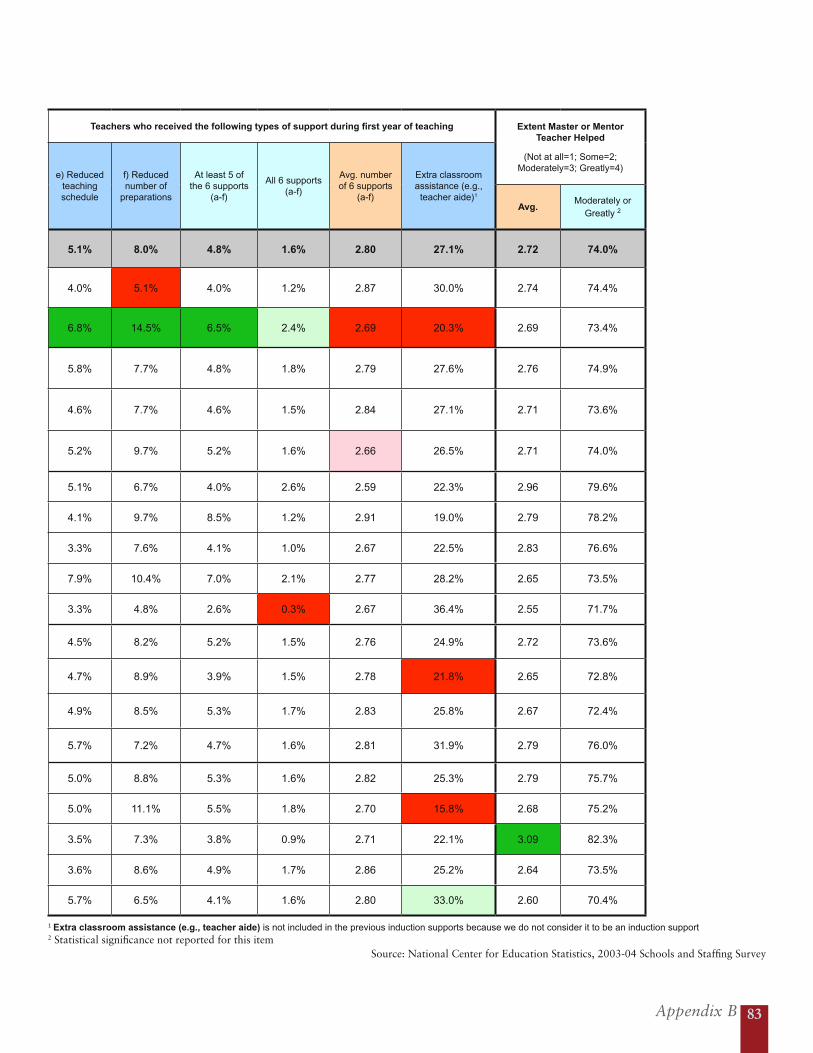
Appendix B 83
Source: National Center for Education Statistics, 2003-04 Schools and Staffing Survey
Teachers who received the following types of support during first year of teaching Extent Master or Mentor Teacher Helped
(Not at all=1; Some=2; Moderately=3; Greatly=4)
e) Reduced teaching schedule
f) Reduced number of
preparations
At least 5 of the 6 supports
(a-f)
All 6 supports (a-f)
Avg. number of 6 supports
(a-f)
Extra classroom assistance (e.g.,
teacher aide)1
Avg.Moderately or
Greatly 2
5.1% 8.0% 4.8% 1.6% 2.80 27.1% 2.72 74.0%
4.0% 5.1% 4.0% 1.2% 2.87 30.0% 2.74 74.4%
6.8% 14.5% 6.5% 2.4% 2.69 20.3% 2.69 73.4%
5.8% 7.7% 4.8% 1.8% 2.79 27.6% 2.76 74.9%
4.6% 7.7% 4.6% 1.5% 2.84 27.1% 2.71 73.6%
5.2% 9.7% 5.2% 1.6% 2.66 26.5% 2.71 74.0%
5.1% 6.7% 4.0% 2.6% 2.59 22.3% 2.96 79.6%
4.1% 9.7% 8.5% 1.2% 2.91 19.0% 2.79 78.2%
3.3% 7.6% 4.1% 1.0% 2.67 22.5% 2.83 76.6%
7.9% 10.4% 7.0% 2.1% 2.77 28.2% 2.65 73.5%
3.3% 4.8% 2.6% 0.3% 2.67 36.4% 2.55 71.7%
4.5% 8.2% 5.2% 1.5% 2.76 24.9% 2.72 73.6%
4.7% 8.9% 3.9% 1.5% 2.78 21.8% 2.65 72.8%
4.9% 8.5% 5.3% 1.7% 2.83 25.8% 2.67 72.4%
5.7% 7.2% 4.7% 1.6% 2.81 31.9% 2.79 76.0%
5.0% 8.8% 5.3% 1.6% 2.82 25.3% 2.79 75.7%
5.0% 11.1% 5.5% 1.8% 2.70 15.8% 2.68 75.2%
3.5% 7.3% 3.8% 0.9% 2.71 22.1% 3.09 82.3%
3.6% 8.6% 4.9% 1.7% 2.86 25.2% 2.64 73.5%
5.7% 6.5% 4.1% 1.6% 2.80 33.0% 2.60 70.4%
1 Extra classroom assistance (e.g., teacher aide) is not included in the previous induction supports because we do not consider it to be an induction support2 Statistical significance not reported for this item

Professional Learning in the Learning Profession84
Table 3: Formal Professional Development Activities and Supports in Last 12 Months (by state)
Teachers participated in the following professional development activities in the past 12 months
University course(s) related to teaching
Observational visits to other schools
Workshops, conferences or training sessions in which
they were a presenter
Other workshops, conferences or training sessions in which they
were NOT a presenterAvg. # of
four activities participated in
% of teachers
Avg. number
% of teachers
Avg. number
% of teachers
Avg. number
% of teachersAvg.
number
Nat’l 35.5% 2.75 22.4% 1.88 25.1% 2.27 91.5% 4.47 2.53AL 29.1% 3.24 29.7% 1.55 27.3% 2.16 95.1% 5.38 2.44AK 75.4% 2.14 19.2% 1.26 24.0% 1.29 86.2% 2.82 2.33AZ 41.8% 3.29 26.0% 1.84 25.7% 2.32 90.9% 5.88 2.12AR 21.3% 2.53 19.3% 1.76 21.3% 2.84 96.3% 6.57 3.04CA 41.9% 3.20 32.4% 2.19 26.3% 2.25 88.7% 4.20 2.29CO 57.9% 2.27 29.2% 1.77 26.7% 1.65 90.0% 3.55 2.33CT 21.8% 2.31 22.0% 1.65 28.8% 2.06 95.3% 5.60 2.37DE 40.1% 2.76 19.5% 1.70 28.9% 2.89 95.3% 4.99 2.98DC 70.0% 2.12 22.1% 1.68 37.1% 1.84 90.1% 3.81 1.63FL 20.9% 2.83 16.8% 3.73 25.6% 2.66 91.0% 4.95 2.23GA 28.1% 4.59 18.4% 1.75 21.2% 1.98 91.7% 3.85 2.11HI 33.4% 2.07 25.3% 2.14 23.4% 1.73 93.5% 3.93 2.22ID 78.8% 2.30 26.7% 1.51 24.0% 1.36 85.8% 2.10 2.87IL 41.8% 2.98 21.9% 2.07 30.0% 2.89 89.2% 4.05 2.73IN 33.6% 1.77 30.7% 1.50 21.8% 2.09 84.7% 3.16 2.99IA 51.3% 1.79 18.7% 1.08 17.5% 1.52 84.4% 2.52 2.42KS 48.6% 2.38 23.3% 1.43 23.6% 1.43 89.6% 4.00 2.92KY 28.1% 3.51 21.3% 1.29 22.1% 1.96 94.6% 5.12 2.51LA 24.7% 4.01 23.7% 2.06 24.8% 2.16 94.1% 5.14 2.61ME 40.0% 1.47 29.1% 1.30 25.3% 1.64 92.8% 3.53 3.39MD 46.6% 1.98 25.0% 1.54 32.4% 1.81 92.2% 3.78 2.43MA 49.5% 1.94 17.3% 1.44 22.9% 1.74 91.8% 4.02 2.50MI 37.5% 2.41 21.6% 1.47 22.0% 2.76 93.5% 4.26 2.82MN 36.9% 2.85 27.3% 1.52 26.2% 1.82 92.9% 4.08 2.73MS 29.1% 2.91 20.0% 1.85 25.0% 1.69 89.9% 3.99 2.50MO 37.0% 2.98 21.3% 1.33 25.6% 3.13 92.5% 4.25 2.92MT 57.9% 1.97 24.1% 1.43 24.2% 1.96 92.7% 3.42 2.79NE 34.9% 2.08 20.0% 1.29 24.0% 1.49 91.0% 3.34 2.81NV 51.9% 2.71 26.9% 1.83 30.2% 2.36 89.5% 3.53 2.11NH 37.2% 1.70 35.5% 1.72 28.6% 1.76 96.8% 5.86 3.39NJ 25.2% 3.15 19.0% 1.67 22.6% 2.56 93.5% 5.78 2.58NM 40.7% 3.28 28.3% 1.77 28.5% 1.43 88.8% 3.98 2.78NY 32.8% 3.82 19.5% 1.70 25.3% 3.13 93.2% 4.86 2.39NC 25.8% 2.99 23.1% 2.82 23.1% 1.81 95.0% 4.59 2.36ND 73.9% 1.93 18.8% 1.51 21.3% 1.75 88.0% 2.22 3.06OH 51.9% 2.37 17.9% 1.45 22.1% 1.99 88.4% 3.49 2.82OK 14.9% 3.36 21.8% 1.50 18.3% 2.06 93.7% 5.09 2.45OR 43.8% 3.02 27.2% 1.62 24.0% 2.05 90.3% 3.15 2.84PA 36.0% 2.88 15.7% 1.19 21.7% 2.24 89.5% 4.81 2.55RI 48.0% 1.32 18.7% 1.50 26.3% 1.44 89.1% 3.33 2.52SC 50.3% 2.07 23.6% 2.45 29.0% 1.74 89.8% 4.07 2.28SD 69.8% 2.12 16.8% 1.20 18.1% 1.18 84.6% 1.97 3.00TN 24.7% 3.06 24.7% 1.28 23.9% 1.72 94.1% 4.52 2.14TX 14.7% 3.24 19.9% 2.43 27.2% 2.76 94.2% 5.99 2.51UT 46.9% 2.95 38.8% 2.37 31.3% 2.18 94.2% 4.59 2.76VT 53.5% 1.63 27.7% 1.52 23.4% 1.50 90.9% 3.15 3.69VA 41.4% 1.49 16.2% 1.46 28.4% 1.62 92.4% 3.72 2.53WA 43.8% 2.92 29.5% 1.85 27.4% 1.93 90.3% 4.00 2.82WV 34.7% 1.66 14.0% 2.12 25.4% 1.50 91.6% 3.63 2.63WI 56.3% 2.02 21.0% 1.56 20.9% 1.87 89.9% 2.42 2.77WY 66.3% 2.61 23.8% 1.36 27.9% 1.84 91.8% 3.25 3.50
Table continues on next pagep < 0.01 higher than nat’l avg. p< 0.001 higher than nat’l avg.
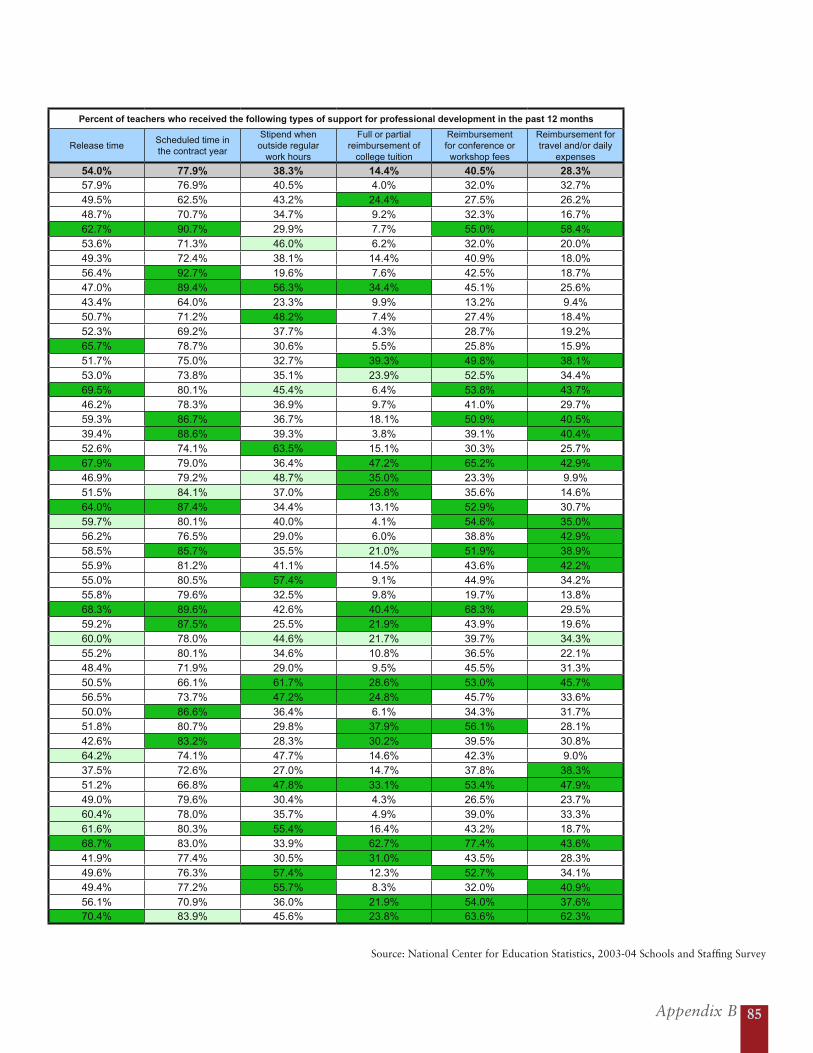
Appendix B 85
Source: National Center for Education Statistics, 2003-04 Schools and Staffing Survey
Table 3: Formal Professional Development Activities and Supports in Last 12 Months (by state)
Teachers participated in the following professional development activities in the past 12 months
University course(s) related to teaching
Observational visits to other schools
Workshops, conferences or training sessions in which
they were a presenter
Other workshops, conferences or training sessions in which they
were NOT a presenterAvg. # of
four activities participated in
% of teachers
Avg. number
% of teachers
Avg. number
% of teachers
Avg. number
% of teachersAvg.
number
Nat’l 35.5% 2.75 22.4% 1.88 25.1% 2.27 91.5% 4.47 2.53AL 29.1% 3.24 29.7% 1.55 27.3% 2.16 95.1% 5.38 2.44AK 75.4% 2.14 19.2% 1.26 24.0% 1.29 86.2% 2.82 2.33AZ 41.8% 3.29 26.0% 1.84 25.7% 2.32 90.9% 5.88 2.12AR 21.3% 2.53 19.3% 1.76 21.3% 2.84 96.3% 6.57 3.04CA 41.9% 3.20 32.4% 2.19 26.3% 2.25 88.7% 4.20 2.29CO 57.9% 2.27 29.2% 1.77 26.7% 1.65 90.0% 3.55 2.33CT 21.8% 2.31 22.0% 1.65 28.8% 2.06 95.3% 5.60 2.37DE 40.1% 2.76 19.5% 1.70 28.9% 2.89 95.3% 4.99 2.98DC 70.0% 2.12 22.1% 1.68 37.1% 1.84 90.1% 3.81 1.63FL 20.9% 2.83 16.8% 3.73 25.6% 2.66 91.0% 4.95 2.23GA 28.1% 4.59 18.4% 1.75 21.2% 1.98 91.7% 3.85 2.11HI 33.4% 2.07 25.3% 2.14 23.4% 1.73 93.5% 3.93 2.22ID 78.8% 2.30 26.7% 1.51 24.0% 1.36 85.8% 2.10 2.87IL 41.8% 2.98 21.9% 2.07 30.0% 2.89 89.2% 4.05 2.73IN 33.6% 1.77 30.7% 1.50 21.8% 2.09 84.7% 3.16 2.99IA 51.3% 1.79 18.7% 1.08 17.5% 1.52 84.4% 2.52 2.42KS 48.6% 2.38 23.3% 1.43 23.6% 1.43 89.6% 4.00 2.92KY 28.1% 3.51 21.3% 1.29 22.1% 1.96 94.6% 5.12 2.51LA 24.7% 4.01 23.7% 2.06 24.8% 2.16 94.1% 5.14 2.61ME 40.0% 1.47 29.1% 1.30 25.3% 1.64 92.8% 3.53 3.39MD 46.6% 1.98 25.0% 1.54 32.4% 1.81 92.2% 3.78 2.43MA 49.5% 1.94 17.3% 1.44 22.9% 1.74 91.8% 4.02 2.50MI 37.5% 2.41 21.6% 1.47 22.0% 2.76 93.5% 4.26 2.82MN 36.9% 2.85 27.3% 1.52 26.2% 1.82 92.9% 4.08 2.73MS 29.1% 2.91 20.0% 1.85 25.0% 1.69 89.9% 3.99 2.50MO 37.0% 2.98 21.3% 1.33 25.6% 3.13 92.5% 4.25 2.92MT 57.9% 1.97 24.1% 1.43 24.2% 1.96 92.7% 3.42 2.79NE 34.9% 2.08 20.0% 1.29 24.0% 1.49 91.0% 3.34 2.81NV 51.9% 2.71 26.9% 1.83 30.2% 2.36 89.5% 3.53 2.11NH 37.2% 1.70 35.5% 1.72 28.6% 1.76 96.8% 5.86 3.39NJ 25.2% 3.15 19.0% 1.67 22.6% 2.56 93.5% 5.78 2.58NM 40.7% 3.28 28.3% 1.77 28.5% 1.43 88.8% 3.98 2.78NY 32.8% 3.82 19.5% 1.70 25.3% 3.13 93.2% 4.86 2.39NC 25.8% 2.99 23.1% 2.82 23.1% 1.81 95.0% 4.59 2.36ND 73.9% 1.93 18.8% 1.51 21.3% 1.75 88.0% 2.22 3.06OH 51.9% 2.37 17.9% 1.45 22.1% 1.99 88.4% 3.49 2.82OK 14.9% 3.36 21.8% 1.50 18.3% 2.06 93.7% 5.09 2.45OR 43.8% 3.02 27.2% 1.62 24.0% 2.05 90.3% 3.15 2.84PA 36.0% 2.88 15.7% 1.19 21.7% 2.24 89.5% 4.81 2.55RI 48.0% 1.32 18.7% 1.50 26.3% 1.44 89.1% 3.33 2.52SC 50.3% 2.07 23.6% 2.45 29.0% 1.74 89.8% 4.07 2.28SD 69.8% 2.12 16.8% 1.20 18.1% 1.18 84.6% 1.97 3.00TN 24.7% 3.06 24.7% 1.28 23.9% 1.72 94.1% 4.52 2.14TX 14.7% 3.24 19.9% 2.43 27.2% 2.76 94.2% 5.99 2.51UT 46.9% 2.95 38.8% 2.37 31.3% 2.18 94.2% 4.59 2.76VT 53.5% 1.63 27.7% 1.52 23.4% 1.50 90.9% 3.15 3.69VA 41.4% 1.49 16.2% 1.46 28.4% 1.62 92.4% 3.72 2.53WA 43.8% 2.92 29.5% 1.85 27.4% 1.93 90.3% 4.00 2.82WV 34.7% 1.66 14.0% 2.12 25.4% 1.50 91.6% 3.63 2.63WI 56.3% 2.02 21.0% 1.56 20.9% 1.87 89.9% 2.42 2.77WY 66.3% 2.61 23.8% 1.36 27.9% 1.84 91.8% 3.25 3.50
Percent of teachers who received the following types of support for professional development in the past 12 months
Release timeScheduled time in the contract year
Stipend when outside regular
work hours
Full or partial reimbursement of
college tuition
Reimbursement for conference or workshop fees
Reimbursement for travel and/or daily
expenses
54.0% 77.9% 38.3% 14.4% 40.5% 28.3%57.9% 76.9% 40.5% 4.0% 32.0% 32.7%49.5% 62.5% 43.2% 24.4% 27.5% 26.2%48.7% 70.7% 34.7% 9.2% 32.3% 16.7%62.7% 90.7% 29.9% 7.7% 55.0% 58.4%53.6% 71.3% 46.0% 6.2% 32.0% 20.0%49.3% 72.4% 38.1% 14.4% 40.9% 18.0%56.4% 92.7% 19.6% 7.6% 42.5% 18.7%47.0% 89.4% 56.3% 34.4% 45.1% 25.6%43.4% 64.0% 23.3% 9.9% 13.2% 9.4%50.7% 71.2% 48.2% 7.4% 27.4% 18.4%52.3% 69.2% 37.7% 4.3% 28.7% 19.2%65.7% 78.7% 30.6% 5.5% 25.8% 15.9%51.7% 75.0% 32.7% 39.3% 49.8% 38.1%53.0% 73.8% 35.1% 23.9% 52.5% 34.4%69.5% 80.1% 45.4% 6.4% 53.8% 43.7%46.2% 78.3% 36.9% 9.7% 41.0% 29.7%59.3% 86.7% 36.7% 18.1% 50.9% 40.5%39.4% 88.6% 39.3% 3.8% 39.1% 40.4%52.6% 74.1% 63.5% 15.1% 30.3% 25.7%67.9% 79.0% 36.4% 47.2% 65.2% 42.9%46.9% 79.2% 48.7% 35.0% 23.3% 9.9%51.5% 84.1% 37.0% 26.8% 35.6% 14.6%64.0% 87.4% 34.4% 13.1% 52.9% 30.7%59.7% 80.1% 40.0% 4.1% 54.6% 35.0%56.2% 76.5% 29.0% 6.0% 38.8% 42.9%58.5% 85.7% 35.5% 21.0% 51.9% 38.9%55.9% 81.2% 41.1% 14.5% 43.6% 42.2%55.0% 80.5% 57.4% 9.1% 44.9% 34.2%55.8% 79.6% 32.5% 9.8% 19.7% 13.8%68.3% 89.6% 42.6% 40.4% 68.3% 29.5%59.2% 87.5% 25.5% 21.9% 43.9% 19.6%60.0% 78.0% 44.6% 21.7% 39.7% 34.3%55.2% 80.1% 34.6% 10.8% 36.5% 22.1%48.4% 71.9% 29.0% 9.5% 45.5% 31.3%50.5% 66.1% 61.7% 28.6% 53.0% 45.7%56.5% 73.7% 47.2% 24.8% 45.7% 33.6%50.0% 86.6% 36.4% 6.1% 34.3% 31.7%51.8% 80.7% 29.8% 37.9% 56.1% 28.1%42.6% 83.2% 28.3% 30.2% 39.5% 30.8%64.2% 74.1% 47.7% 14.6% 42.3% 9.0%37.5% 72.6% 27.0% 14.7% 37.8% 38.3%51.2% 66.8% 47.8% 33.1% 53.4% 47.9%49.0% 79.6% 30.4% 4.3% 26.5% 23.7%60.4% 78.0% 35.7% 4.9% 39.0% 33.3%61.6% 80.3% 55.4% 16.4% 43.2% 18.7%68.7% 83.0% 33.9% 62.7% 77.4% 43.6%41.9% 77.4% 30.5% 31.0% 43.5% 28.3%49.6% 76.3% 57.4% 12.3% 52.7% 34.1%49.4% 77.2% 55.7% 8.3% 32.0% 40.9%56.1% 70.9% 36.0% 21.9% 54.0% 37.6%70.4% 83.9% 45.6% 23.8% 63.6% 62.3%
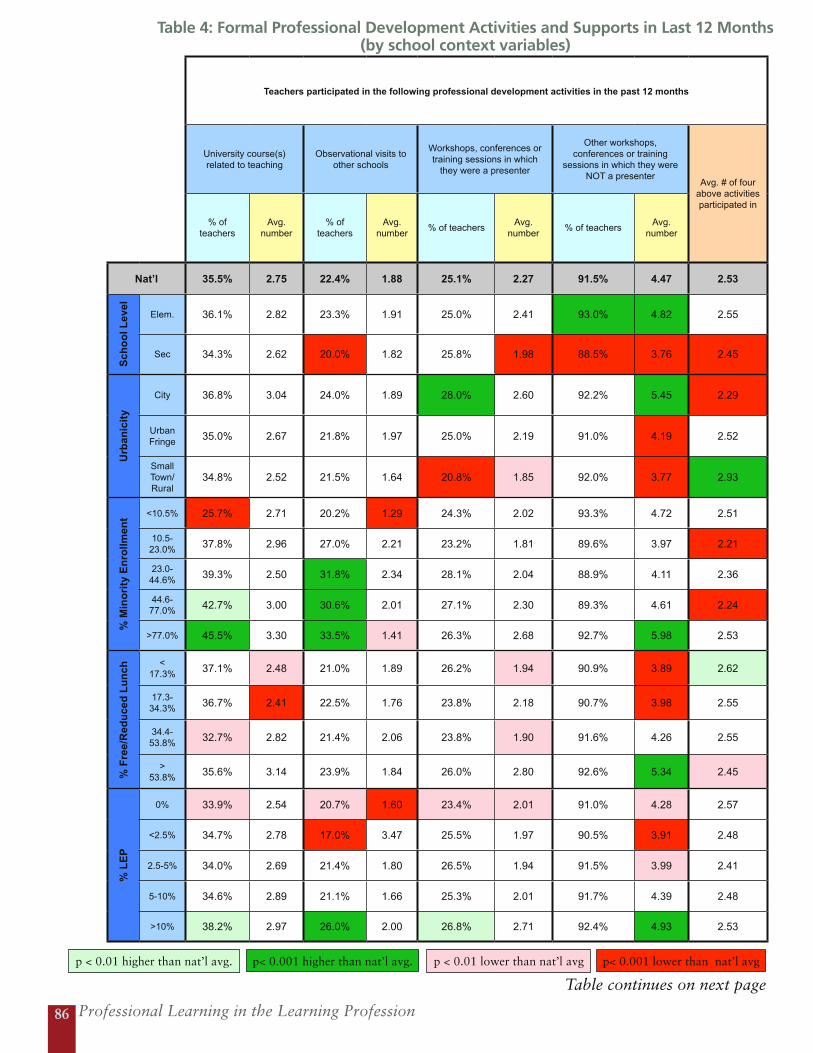
Professional Learning in the Learning Profession86
Table 4: Formal Professional Development Activities and Supports in Last 12 Months (by school context variables)
Teachers participated in the following professional development activities in the past 12 months
University course(s) related to teaching
Observational visits to other schools
Workshops, conferences or training sessions in which
they were a presenter
Other workshops, conferences or training
sessions in which they were NOT a presenter
Avg. # of four above activities participated in
% of teachers
Avg. number
% of teachers
Avg. number
% of teachersAvg.
number% of teachers
Avg. number
Nat’l 35.5% 2.75 22.4% 1.88 25.1% 2.27 91.5% 4.47 2.53
Sch
oo
l Lev
el
Elem. 36.1% 2.82 23.3% 1.91 25.0% 2.41 93.0% 4.82 2.55
Sec 34.3% 2.62 20.0% 1.82 25.8% 1.98 88.5% 3.76 2.45
Urb
anic
ity
City 36.8% 3.04 24.0% 1.89 28.0% 2.60 92.2% 5.45 2.29
Urban Fringe 35.0% 2.67 21.8% 1.97 25.0% 2.19 91.0% 4.19 2.52
Small Town/ Rural
34.8% 2.52 21.5% 1.64 20.8% 1.85 92.0% 3.77 2.93
% M
ino
rity
En
rollm
ent <10.5% 25.7% 2.71 20.2% 1.29 24.3% 2.02 93.3% 4.72 2.51
10.5-23.0% 37.8% 2.96 27.0% 2.21 23.2% 1.81 89.6% 3.97 2.21
23.0-44.6% 39.3% 2.50 31.8% 2.34 28.1% 2.04 88.9% 4.11 2.36
44.6-77.0% 42.7% 3.00 30.6% 2.01 27.1% 2.30 89.3% 4.61 2.24
>77.0% 45.5% 3.30 33.5% 1.41 26.3% 2.68 92.7% 5.98 2.53
% F
ree/
Red
uce
d L
un
ch
< 17.3% 37.1% 2.48 21.0% 1.89 26.2% 1.94 90.9% 3.89 2.62
17.3-34.3% 36.7% 2.41 22.5% 1.76 23.8% 2.18 90.7% 3.98 2.55
34.4-53.8% 32.7% 2.82 21.4% 2.06 23.8% 1.90 91.6% 4.26 2.55
> 53.8% 35.6% 3.14 23.9% 1.84 26.0% 2.80 92.6% 5.34 2.45
% L
EP
0% 33.9% 2.54 20.7% 1.60 23.4% 2.01 91.0% 4.28 2.57
<2.5% 34.7% 2.78 17.0% 3.47 25.5% 1.97 90.5% 3.91 2.48
2.5-5% 34.0% 2.69 21.4% 1.80 26.5% 1.94 91.5% 3.99 2.41
5-10% 34.6% 2.89 21.1% 1.66 25.3% 2.01 91.7% 4.39 2.48
>10% 38.2% 2.97 26.0% 2.00 26.8% 2.71 92.4% 4.93 2.53
p < 0.01 higher than nat’l avg. p < 0.01 lower than nat’l avgp< 0.001 higher than nat’l avg. p< 0.001 lower than nat’l avg
Table continues on next page

Appendix B 87
Source: National Center for Education Statistics, 2003-04 Schools and Staffing Survey
Table 4: Formal Professional Development Activities and Supports in Last 12 Months (by school context variables)
Teachers participated in the following professional development activities in the past 12 months
University course(s) related to teaching
Observational visits to other schools
Workshops, conferences or training sessions in which
they were a presenter
Other workshops, conferences or training
sessions in which they were NOT a presenter
Avg. # of four above activities participated in
% of teachers
Avg. number
% of teachers
Avg. number
% of teachersAvg.
number% of teachers
Avg. number
Nat’l 35.5% 2.75 22.4% 1.88 25.1% 2.27 91.5% 4.47 2.53
Sch
oo
l Lev
el
Elem. 36.1% 2.82 23.3% 1.91 25.0% 2.41 93.0% 4.82 2.55
Sec 34.3% 2.62 20.0% 1.82 25.8% 1.98 88.5% 3.76 2.45
Urb
anic
ity
City 36.8% 3.04 24.0% 1.89 28.0% 2.60 92.2% 5.45 2.29
Urban Fringe 35.0% 2.67 21.8% 1.97 25.0% 2.19 91.0% 4.19 2.52
Small Town/ Rural
34.8% 2.52 21.5% 1.64 20.8% 1.85 92.0% 3.77 2.93
% M
ino
rity
En
rollm
ent <10.5% 25.7% 2.71 20.2% 1.29 24.3% 2.02 93.3% 4.72 2.51
10.5-23.0% 37.8% 2.96 27.0% 2.21 23.2% 1.81 89.6% 3.97 2.21
23.0-44.6% 39.3% 2.50 31.8% 2.34 28.1% 2.04 88.9% 4.11 2.36
44.6-77.0% 42.7% 3.00 30.6% 2.01 27.1% 2.30 89.3% 4.61 2.24
>77.0% 45.5% 3.30 33.5% 1.41 26.3% 2.68 92.7% 5.98 2.53
% F
ree/
Red
uce
d L
un
ch
< 17.3% 37.1% 2.48 21.0% 1.89 26.2% 1.94 90.9% 3.89 2.62
17.3-34.3% 36.7% 2.41 22.5% 1.76 23.8% 2.18 90.7% 3.98 2.55
34.4-53.8% 32.7% 2.82 21.4% 2.06 23.8% 1.90 91.6% 4.26 2.55
> 53.8% 35.6% 3.14 23.9% 1.84 26.0% 2.80 92.6% 5.34 2.45
% L
EP
0% 33.9% 2.54 20.7% 1.60 23.4% 2.01 91.0% 4.28 2.57
<2.5% 34.7% 2.78 17.0% 3.47 25.5% 1.97 90.5% 3.91 2.48
2.5-5% 34.0% 2.69 21.4% 1.80 26.5% 1.94 91.5% 3.99 2.41
5-10% 34.6% 2.89 21.1% 1.66 25.3% 2.01 91.7% 4.39 2.48
>10% 38.2% 2.97 26.0% 2.00 26.8% 2.71 92.4% 4.93 2.53
Percent of teachers who received the following types of support for professional development in the past 12 months
Release timeScheduled time in the
contract yearStipend when outside
regular work hours
Full or partial reimbursement of
college tuition
Reimbursement for conference or workshop fees
Reimbursement for travel and/or daily
expenses
54.0% 77.9% 38.3% 14.4% 40.5% 28.3%
56.0% 79.2% 41.7% 14.3% 39.2% 24.9%
49.2% 75.1% 31.3% 14.3% 42.0% 33.3%
51.1% 77.6% 41.5% 10.5% 29.8% 18.9%
54.3% 77.8% 35.7% 15.7% 42.3% 26.1%
57.3% 78.5% 40.4% 16.5% 51.5% 48.6%
55.8% 81.1% 27.6% 7.6% 47.1% 31.8%
52.8% 74.1% 27.9% 5.8% 39.7% 20.4%
49.1% 72.6% 42.8% 6.7% 37.2% 27.2%
53.7% 70.5% 42.3% 5.6% 30.0% 21.9%
59.6% 78.3% 53.3% 10.5% 29.5% 21.6%
55.5% 78.3% 33.3% 18.8% 47.6% 28.4%
53.4% 78.1% 35.3% 15.7% 43.1% 29.4%
53.1% 77.8% 38.0% 13.1% 42.0% 30.8%
53.9% 77.5% 44.0% 11.3% 32.7% 25.7%
53.5% 78.0% 38.7% 15.0% 41.2% 30.3%
51.5% 76.3% 33.9% 14.6% 41.4% 30.6%
50.4% 76.7% 35.6% 13.7% 40.6% 24.5%
54.4% 79.9% 37.0% 10.9% 40.0% 26.0%
55.6% 77.9% 39.3% 14.3% 39.3% 26.4%
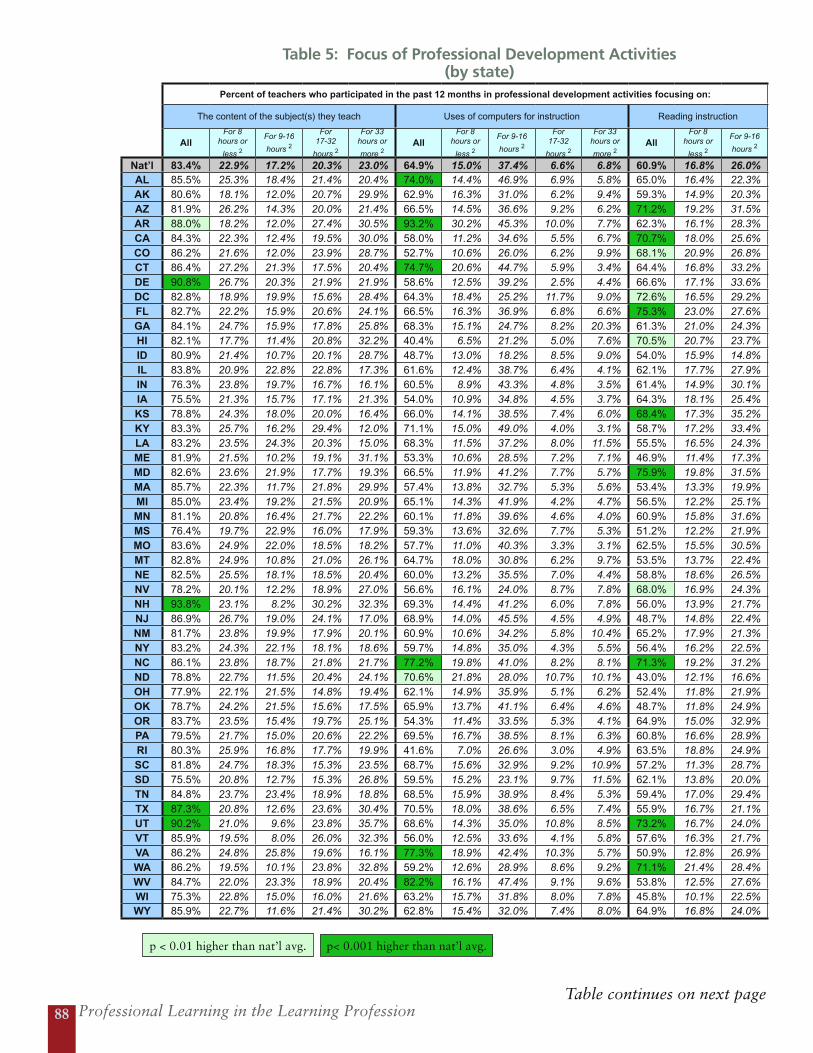
Professional Learning in the Learning Profession88
p < 0.01 higher than nat’l avg. p< 0.001 higher than nat’l avg.
Table 5: Focus of Professional Development Activities (by state)
Percent of teachers who participated in the past 12 months in professional development activities focusing on:
The content of the subject(s) they teach Uses of computers for instruction Reading instruction
AllFor 8
hours or
less 2
For 9-16
hours 2
For 17-32
hours 2
For 33 hours or
more 2All
For 8 hours or
less 2
For 9-16
hours 2
For 17-32
hours 2
For 33 hours or
more 2All
For 8 hours or
less 2
For 9-16
hours 2
Nat’l 83.4% 22.9% 17.2% 20.3% 23.0% 64.9% 15.0% 37.4% 6.6% 6.8% 60.9% 16.8% 26.0%AL 85.5% 25.3% 18.4% 21.4% 20.4% 74.0% 14.4% 46.9% 6.9% 5.8% 65.0% 16.4% 22.3%AK 80.6% 18.1% 12.0% 20.7% 29.9% 62.9% 16.3% 31.0% 6.2% 9.4% 59.3% 14.9% 20.3%AZ 81.9% 26.2% 14.3% 20.0% 21.4% 66.5% 14.5% 36.6% 9.2% 6.2% 71.2% 19.2% 31.5%AR 88.0% 18.2% 12.0% 27.4% 30.5% 93.2% 30.2% 45.3% 10.0% 7.7% 62.3% 16.1% 28.3%CA 84.3% 22.3% 12.4% 19.5% 30.0% 58.0% 11.2% 34.6% 5.5% 6.7% 70.7% 18.0% 25.6%CO 86.2% 21.6% 12.0% 23.9% 28.7% 52.7% 10.6% 26.0% 6.2% 9.9% 68.1% 20.9% 26.8%CT 86.4% 27.2% 21.3% 17.5% 20.4% 74.7% 20.6% 44.7% 5.9% 3.4% 64.4% 16.8% 33.2%DE 90.8% 26.7% 20.3% 21.9% 21.9% 58.6% 12.5% 39.2% 2.5% 4.4% 66.6% 17.1% 33.6%DC 82.8% 18.9% 19.9% 15.6% 28.4% 64.3% 18.4% 25.2% 11.7% 9.0% 72.6% 16.5% 29.2%FL 82.7% 22.2% 15.9% 20.6% 24.1% 66.5% 16.3% 36.9% 6.8% 6.6% 75.3% 23.0% 27.6%GA 84.1% 24.7% 15.9% 17.8% 25.8% 68.3% 15.1% 24.7% 8.2% 20.3% 61.3% 21.0% 24.3%HI 82.1% 17.7% 11.4% 20.8% 32.2% 40.4% 6.5% 21.2% 5.0% 7.6% 70.5% 20.7% 23.7%ID 80.9% 21.4% 10.7% 20.1% 28.7% 48.7% 13.0% 18.2% 8.5% 9.0% 54.0% 15.9% 14.8%IL 83.8% 20.9% 22.8% 22.8% 17.3% 61.6% 12.4% 38.7% 6.4% 4.1% 62.1% 17.7% 27.9%IN 76.3% 23.8% 19.7% 16.7% 16.1% 60.5% 8.9% 43.3% 4.8% 3.5% 61.4% 14.9% 30.1%IA 75.5% 21.3% 15.7% 17.1% 21.3% 54.0% 10.9% 34.8% 4.5% 3.7% 64.3% 18.1% 25.4%KS 78.8% 24.3% 18.0% 20.0% 16.4% 66.0% 14.1% 38.5% 7.4% 6.0% 68.4% 17.3% 35.2%KY 83.3% 25.7% 16.2% 29.4% 12.0% 71.1% 15.0% 49.0% 4.0% 3.1% 58.7% 17.2% 33.4%LA 83.2% 23.5% 24.3% 20.3% 15.0% 68.3% 11.5% 37.2% 8.0% 11.5% 55.5% 16.5% 24.3%ME 81.9% 21.5% 10.2% 19.1% 31.1% 53.3% 10.6% 28.5% 7.2% 7.1% 46.9% 11.4% 17.3%MD 82.6% 23.6% 21.9% 17.7% 19.3% 66.5% 11.9% 41.2% 7.7% 5.7% 75.9% 19.8% 31.5%MA 85.7% 22.3% 11.7% 21.8% 29.9% 57.4% 13.8% 32.7% 5.3% 5.6% 53.4% 13.3% 19.9%MI 85.0% 23.4% 19.2% 21.5% 20.9% 65.1% 14.3% 41.9% 4.2% 4.7% 56.5% 12.2% 25.1%MN 81.1% 20.8% 16.4% 21.7% 22.2% 60.1% 11.8% 39.6% 4.6% 4.0% 60.9% 15.8% 31.6%MS 76.4% 19.7% 22.9% 16.0% 17.9% 59.3% 13.6% 32.6% 7.7% 5.3% 51.2% 12.2% 21.9%MO 83.6% 24.9% 22.0% 18.5% 18.2% 57.7% 11.0% 40.3% 3.3% 3.1% 62.5% 15.5% 30.5%MT 82.8% 24.9% 10.8% 21.0% 26.1% 64.7% 18.0% 30.8% 6.2% 9.7% 53.5% 13.7% 22.4%NE 82.5% 25.5% 18.1% 18.5% 20.4% 60.0% 13.2% 35.5% 7.0% 4.4% 58.8% 18.6% 26.5%NV 78.2% 20.1% 12.2% 18.9% 27.0% 56.6% 16.1% 24.0% 8.7% 7.8% 68.0% 16.9% 24.3%NH 93.8% 23.1% 8.2% 30.2% 32.3% 69.3% 14.4% 41.2% 6.0% 7.8% 56.0% 13.9% 21.7%NJ 86.9% 26.7% 19.0% 24.1% 17.0% 68.9% 14.0% 45.5% 4.5% 4.9% 48.7% 14.8% 22.4%NM 81.7% 23.8% 19.9% 17.9% 20.1% 60.9% 10.6% 34.2% 5.8% 10.4% 65.2% 17.9% 21.3%NY 83.2% 24.3% 22.1% 18.1% 18.6% 59.7% 14.8% 35.0% 4.3% 5.5% 56.4% 16.2% 22.5%NC 86.1% 23.8% 18.7% 21.8% 21.7% 77.2% 19.8% 41.0% 8.2% 8.1% 71.3% 19.2% 31.2%ND 78.8% 22.7% 11.5% 20.4% 24.1% 70.6% 21.8% 28.0% 10.7% 10.1% 43.0% 12.1% 16.6%OH 77.9% 22.1% 21.5% 14.8% 19.4% 62.1% 14.9% 35.9% 5.1% 6.2% 52.4% 11.8% 21.9%OK 78.7% 24.2% 21.5% 15.6% 17.5% 65.9% 13.7% 41.1% 6.4% 4.6% 48.7% 11.8% 24.9%OR 83.7% 23.5% 15.4% 19.7% 25.1% 54.3% 11.4% 33.5% 5.3% 4.1% 64.9% 15.0% 32.9%PA 79.5% 21.7% 15.0% 20.6% 22.2% 69.5% 16.7% 38.5% 8.1% 6.3% 60.8% 16.6% 28.9%RI 80.3% 25.9% 16.8% 17.7% 19.9% 41.6% 7.0% 26.6% 3.0% 4.9% 63.5% 18.8% 24.9%SC 81.8% 24.7% 18.3% 15.3% 23.5% 68.7% 15.6% 32.9% 9.2% 10.9% 57.2% 11.3% 28.7%SD 75.5% 20.8% 12.7% 15.3% 26.8% 59.5% 15.2% 23.1% 9.7% 11.5% 62.1% 13.8% 20.0%TN 84.8% 23.7% 23.4% 18.9% 18.8% 68.5% 15.9% 38.9% 8.4% 5.3% 59.4% 17.0% 29.4%TX 87.3% 20.8% 12.6% 23.6% 30.4% 70.5% 18.0% 38.6% 6.5% 7.4% 55.9% 16.7% 21.1%UT 90.2% 21.0% 9.6% 23.8% 35.7% 68.6% 14.3% 35.0% 10.8% 8.5% 73.2% 16.7% 24.0%VT 85.9% 19.5% 8.0% 26.0% 32.3% 56.0% 12.5% 33.6% 4.1% 5.8% 57.6% 16.3% 21.7%VA 86.2% 24.8% 25.8% 19.6% 16.1% 77.3% 18.9% 42.4% 10.3% 5.7% 50.9% 12.8% 26.9%WA 86.2% 19.5% 10.1% 23.8% 32.8% 59.2% 12.6% 28.9% 8.6% 9.2% 71.1% 21.4% 28.4%WV 84.7% 22.0% 23.3% 18.9% 20.4% 82.2% 16.1% 47.4% 9.1% 9.6% 53.8% 12.5% 27.6%WI 75.3% 22.8% 15.0% 16.0% 21.6% 63.2% 15.7% 31.8% 8.0% 7.8% 45.8% 10.1% 22.5%WY 85.9% 22.7% 11.6% 21.4% 30.2% 62.8% 15.4% 32.0% 7.4% 8.0% 64.9% 16.8% 24.0%
Table continues on next page
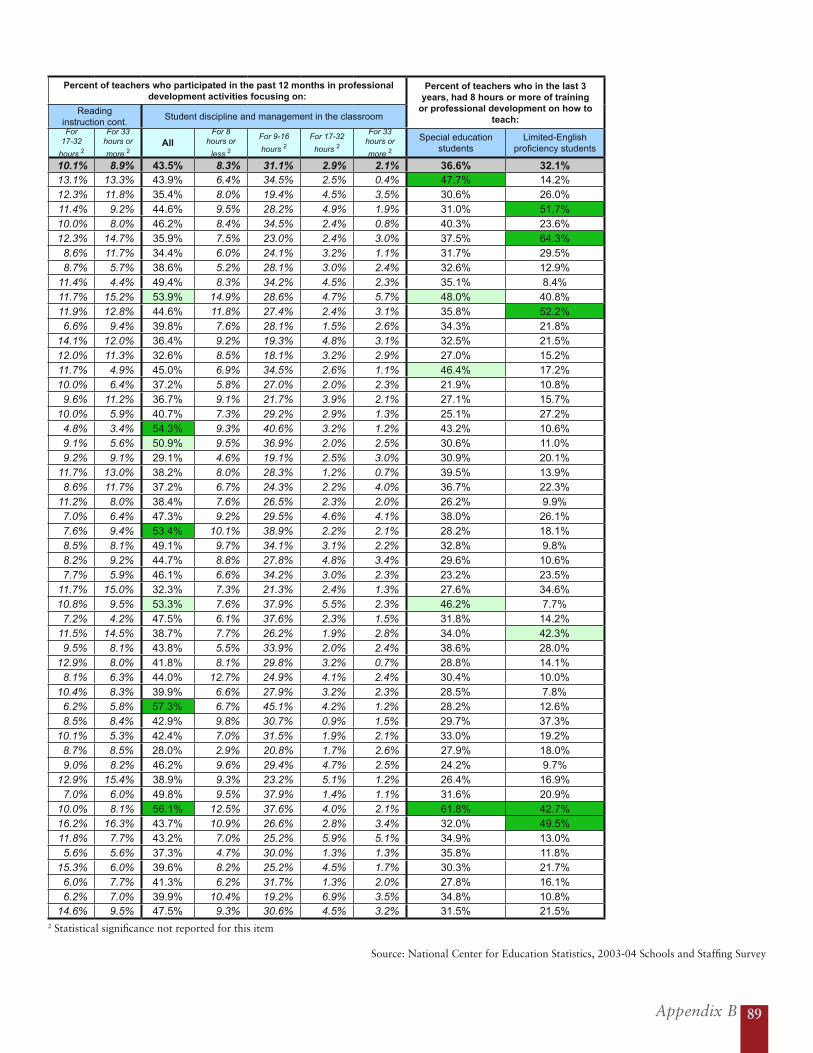
Appendix B 89
Source: National Center for Education Statistics, 2003-04 Schools and Staffing Survey
Table 5: Focus of Professional Development Activities (by state)
Percent of teachers who participated in the past 12 months in professional development activities focusing on:
The content of the subject(s) they teach Uses of computers for instruction Reading instruction
AllFor 8
hours or
less 2
For 9-16
hours 2
For 17-32
hours 2
For 33 hours or
more 2All
For 8 hours or
less 2
For 9-16
hours 2
For 17-32
hours 2
For 33 hours or
more 2All
For 8 hours or
less 2
For 9-16
hours 2
Nat’l 83.4% 22.9% 17.2% 20.3% 23.0% 64.9% 15.0% 37.4% 6.6% 6.8% 60.9% 16.8% 26.0%AL 85.5% 25.3% 18.4% 21.4% 20.4% 74.0% 14.4% 46.9% 6.9% 5.8% 65.0% 16.4% 22.3%AK 80.6% 18.1% 12.0% 20.7% 29.9% 62.9% 16.3% 31.0% 6.2% 9.4% 59.3% 14.9% 20.3%AZ 81.9% 26.2% 14.3% 20.0% 21.4% 66.5% 14.5% 36.6% 9.2% 6.2% 71.2% 19.2% 31.5%AR 88.0% 18.2% 12.0% 27.4% 30.5% 93.2% 30.2% 45.3% 10.0% 7.7% 62.3% 16.1% 28.3%CA 84.3% 22.3% 12.4% 19.5% 30.0% 58.0% 11.2% 34.6% 5.5% 6.7% 70.7% 18.0% 25.6%CO 86.2% 21.6% 12.0% 23.9% 28.7% 52.7% 10.6% 26.0% 6.2% 9.9% 68.1% 20.9% 26.8%CT 86.4% 27.2% 21.3% 17.5% 20.4% 74.7% 20.6% 44.7% 5.9% 3.4% 64.4% 16.8% 33.2%DE 90.8% 26.7% 20.3% 21.9% 21.9% 58.6% 12.5% 39.2% 2.5% 4.4% 66.6% 17.1% 33.6%DC 82.8% 18.9% 19.9% 15.6% 28.4% 64.3% 18.4% 25.2% 11.7% 9.0% 72.6% 16.5% 29.2%FL 82.7% 22.2% 15.9% 20.6% 24.1% 66.5% 16.3% 36.9% 6.8% 6.6% 75.3% 23.0% 27.6%GA 84.1% 24.7% 15.9% 17.8% 25.8% 68.3% 15.1% 24.7% 8.2% 20.3% 61.3% 21.0% 24.3%HI 82.1% 17.7% 11.4% 20.8% 32.2% 40.4% 6.5% 21.2% 5.0% 7.6% 70.5% 20.7% 23.7%ID 80.9% 21.4% 10.7% 20.1% 28.7% 48.7% 13.0% 18.2% 8.5% 9.0% 54.0% 15.9% 14.8%IL 83.8% 20.9% 22.8% 22.8% 17.3% 61.6% 12.4% 38.7% 6.4% 4.1% 62.1% 17.7% 27.9%IN 76.3% 23.8% 19.7% 16.7% 16.1% 60.5% 8.9% 43.3% 4.8% 3.5% 61.4% 14.9% 30.1%IA 75.5% 21.3% 15.7% 17.1% 21.3% 54.0% 10.9% 34.8% 4.5% 3.7% 64.3% 18.1% 25.4%KS 78.8% 24.3% 18.0% 20.0% 16.4% 66.0% 14.1% 38.5% 7.4% 6.0% 68.4% 17.3% 35.2%KY 83.3% 25.7% 16.2% 29.4% 12.0% 71.1% 15.0% 49.0% 4.0% 3.1% 58.7% 17.2% 33.4%LA 83.2% 23.5% 24.3% 20.3% 15.0% 68.3% 11.5% 37.2% 8.0% 11.5% 55.5% 16.5% 24.3%ME 81.9% 21.5% 10.2% 19.1% 31.1% 53.3% 10.6% 28.5% 7.2% 7.1% 46.9% 11.4% 17.3%MD 82.6% 23.6% 21.9% 17.7% 19.3% 66.5% 11.9% 41.2% 7.7% 5.7% 75.9% 19.8% 31.5%MA 85.7% 22.3% 11.7% 21.8% 29.9% 57.4% 13.8% 32.7% 5.3% 5.6% 53.4% 13.3% 19.9%MI 85.0% 23.4% 19.2% 21.5% 20.9% 65.1% 14.3% 41.9% 4.2% 4.7% 56.5% 12.2% 25.1%MN 81.1% 20.8% 16.4% 21.7% 22.2% 60.1% 11.8% 39.6% 4.6% 4.0% 60.9% 15.8% 31.6%MS 76.4% 19.7% 22.9% 16.0% 17.9% 59.3% 13.6% 32.6% 7.7% 5.3% 51.2% 12.2% 21.9%MO 83.6% 24.9% 22.0% 18.5% 18.2% 57.7% 11.0% 40.3% 3.3% 3.1% 62.5% 15.5% 30.5%MT 82.8% 24.9% 10.8% 21.0% 26.1% 64.7% 18.0% 30.8% 6.2% 9.7% 53.5% 13.7% 22.4%NE 82.5% 25.5% 18.1% 18.5% 20.4% 60.0% 13.2% 35.5% 7.0% 4.4% 58.8% 18.6% 26.5%NV 78.2% 20.1% 12.2% 18.9% 27.0% 56.6% 16.1% 24.0% 8.7% 7.8% 68.0% 16.9% 24.3%NH 93.8% 23.1% 8.2% 30.2% 32.3% 69.3% 14.4% 41.2% 6.0% 7.8% 56.0% 13.9% 21.7%NJ 86.9% 26.7% 19.0% 24.1% 17.0% 68.9% 14.0% 45.5% 4.5% 4.9% 48.7% 14.8% 22.4%NM 81.7% 23.8% 19.9% 17.9% 20.1% 60.9% 10.6% 34.2% 5.8% 10.4% 65.2% 17.9% 21.3%NY 83.2% 24.3% 22.1% 18.1% 18.6% 59.7% 14.8% 35.0% 4.3% 5.5% 56.4% 16.2% 22.5%NC 86.1% 23.8% 18.7% 21.8% 21.7% 77.2% 19.8% 41.0% 8.2% 8.1% 71.3% 19.2% 31.2%ND 78.8% 22.7% 11.5% 20.4% 24.1% 70.6% 21.8% 28.0% 10.7% 10.1% 43.0% 12.1% 16.6%OH 77.9% 22.1% 21.5% 14.8% 19.4% 62.1% 14.9% 35.9% 5.1% 6.2% 52.4% 11.8% 21.9%OK 78.7% 24.2% 21.5% 15.6% 17.5% 65.9% 13.7% 41.1% 6.4% 4.6% 48.7% 11.8% 24.9%OR 83.7% 23.5% 15.4% 19.7% 25.1% 54.3% 11.4% 33.5% 5.3% 4.1% 64.9% 15.0% 32.9%PA 79.5% 21.7% 15.0% 20.6% 22.2% 69.5% 16.7% 38.5% 8.1% 6.3% 60.8% 16.6% 28.9%RI 80.3% 25.9% 16.8% 17.7% 19.9% 41.6% 7.0% 26.6% 3.0% 4.9% 63.5% 18.8% 24.9%SC 81.8% 24.7% 18.3% 15.3% 23.5% 68.7% 15.6% 32.9% 9.2% 10.9% 57.2% 11.3% 28.7%SD 75.5% 20.8% 12.7% 15.3% 26.8% 59.5% 15.2% 23.1% 9.7% 11.5% 62.1% 13.8% 20.0%TN 84.8% 23.7% 23.4% 18.9% 18.8% 68.5% 15.9% 38.9% 8.4% 5.3% 59.4% 17.0% 29.4%TX 87.3% 20.8% 12.6% 23.6% 30.4% 70.5% 18.0% 38.6% 6.5% 7.4% 55.9% 16.7% 21.1%UT 90.2% 21.0% 9.6% 23.8% 35.7% 68.6% 14.3% 35.0% 10.8% 8.5% 73.2% 16.7% 24.0%VT 85.9% 19.5% 8.0% 26.0% 32.3% 56.0% 12.5% 33.6% 4.1% 5.8% 57.6% 16.3% 21.7%VA 86.2% 24.8% 25.8% 19.6% 16.1% 77.3% 18.9% 42.4% 10.3% 5.7% 50.9% 12.8% 26.9%WA 86.2% 19.5% 10.1% 23.8% 32.8% 59.2% 12.6% 28.9% 8.6% 9.2% 71.1% 21.4% 28.4%WV 84.7% 22.0% 23.3% 18.9% 20.4% 82.2% 16.1% 47.4% 9.1% 9.6% 53.8% 12.5% 27.6%WI 75.3% 22.8% 15.0% 16.0% 21.6% 63.2% 15.7% 31.8% 8.0% 7.8% 45.8% 10.1% 22.5%WY 85.9% 22.7% 11.6% 21.4% 30.2% 62.8% 15.4% 32.0% 7.4% 8.0% 64.9% 16.8% 24.0%
Percent of teachers who participated in the past 12 months in professional development activities focusing on:
Percent of teachers who in the last 3 years, had 8 hours or more of training
or professional development on how to teach:
Reading instruction cont.
Student discipline and management in the classroom
For 17-32
hours 2
For 33 hours or
more 2All
For 8 hours or
less 2
For 9-16
hours 2For 17-32
hours 2
For 33 hours or
more 2
Special education students
Limited-English proficiency students
10.1% 8.9% 43.5% 8.3% 31.1% 2.9% 2.1% 36.6% 32.1%13.1% 13.3% 43.9% 6.4% 34.5% 2.5% 0.4% 47.7% 14.2%12.3% 11.8% 35.4% 8.0% 19.4% 4.5% 3.5% 30.6% 26.0%11.4% 9.2% 44.6% 9.5% 28.2% 4.9% 1.9% 31.0% 51.7%10.0% 8.0% 46.2% 8.4% 34.5% 2.4% 0.8% 40.3% 23.6%12.3% 14.7% 35.9% 7.5% 23.0% 2.4% 3.0% 37.5% 64.3%8.6% 11.7% 34.4% 6.0% 24.1% 3.2% 1.1% 31.7% 29.5%8.7% 5.7% 38.6% 5.2% 28.1% 3.0% 2.4% 32.6% 12.9%
11.4% 4.4% 49.4% 8.3% 34.2% 4.5% 2.3% 35.1% 8.4%11.7% 15.2% 53.9% 14.9% 28.6% 4.7% 5.7% 48.0% 40.8%11.9% 12.8% 44.6% 11.8% 27.4% 2.4% 3.1% 35.8% 52.2%6.6% 9.4% 39.8% 7.6% 28.1% 1.5% 2.6% 34.3% 21.8%
14.1% 12.0% 36.4% 9.2% 19.3% 4.8% 3.1% 32.5% 21.5%12.0% 11.3% 32.6% 8.5% 18.1% 3.2% 2.9% 27.0% 15.2%11.7% 4.9% 45.0% 6.9% 34.5% 2.6% 1.1% 46.4% 17.2%10.0% 6.4% 37.2% 5.8% 27.0% 2.0% 2.3% 21.9% 10.8%9.6% 11.2% 36.7% 9.1% 21.7% 3.9% 2.1% 27.1% 15.7%
10.0% 5.9% 40.7% 7.3% 29.2% 2.9% 1.3% 25.1% 27.2%4.8% 3.4% 54.3% 9.3% 40.6% 3.2% 1.2% 43.2% 10.6%9.1% 5.6% 50.9% 9.5% 36.9% 2.0% 2.5% 30.6% 11.0%9.2% 9.1% 29.1% 4.6% 19.1% 2.5% 3.0% 30.9% 20.1%
11.7% 13.0% 38.2% 8.0% 28.3% 1.2% 0.7% 39.5% 13.9%8.6% 11.7% 37.2% 6.7% 24.3% 2.2% 4.0% 36.7% 22.3%
11.2% 8.0% 38.4% 7.6% 26.5% 2.3% 2.0% 26.2% 9.9%7.0% 6.4% 47.3% 9.2% 29.5% 4.6% 4.1% 38.0% 26.1%7.6% 9.4% 53.4% 10.1% 38.9% 2.2% 2.1% 28.2% 18.1%8.5% 8.1% 49.1% 9.7% 34.1% 3.1% 2.2% 32.8% 9.8%8.2% 9.2% 44.7% 8.8% 27.8% 4.8% 3.4% 29.6% 10.6%7.7% 5.9% 46.1% 6.6% 34.2% 3.0% 2.3% 23.2% 23.5%
11.7% 15.0% 32.3% 7.3% 21.3% 2.4% 1.3% 27.6% 34.6%10.8% 9.5% 53.3% 7.6% 37.9% 5.5% 2.3% 46.2% 7.7%7.2% 4.2% 47.5% 6.1% 37.6% 2.3% 1.5% 31.8% 14.2%
11.5% 14.5% 38.7% 7.7% 26.2% 1.9% 2.8% 34.0% 42.3%9.5% 8.1% 43.8% 5.5% 33.9% 2.0% 2.4% 38.6% 28.0%
12.9% 8.0% 41.8% 8.1% 29.8% 3.2% 0.7% 28.8% 14.1%8.1% 6.3% 44.0% 12.7% 24.9% 4.1% 2.4% 30.4% 10.0%
10.4% 8.3% 39.9% 6.6% 27.9% 3.2% 2.3% 28.5% 7.8%6.2% 5.8% 57.3% 6.7% 45.1% 4.2% 1.2% 28.2% 12.6%8.5% 8.4% 42.9% 9.8% 30.7% 0.9% 1.5% 29.7% 37.3%
10.1% 5.3% 42.4% 7.0% 31.5% 1.9% 2.1% 33.0% 19.2%8.7% 8.5% 28.0% 2.9% 20.8% 1.7% 2.6% 27.9% 18.0%9.0% 8.2% 46.2% 9.6% 29.4% 4.7% 2.5% 24.2% 9.7%
12.9% 15.4% 38.9% 9.3% 23.2% 5.1% 1.2% 26.4% 16.9%7.0% 6.0% 49.8% 9.5% 37.9% 1.4% 1.1% 31.6% 20.9%
10.0% 8.1% 56.1% 12.5% 37.6% 4.0% 2.1% 61.8% 42.7%16.2% 16.3% 43.7% 10.9% 26.6% 2.8% 3.4% 32.0% 49.5%11.8% 7.7% 43.2% 7.0% 25.2% 5.9% 5.1% 34.9% 13.0%5.6% 5.6% 37.3% 4.7% 30.0% 1.3% 1.3% 35.8% 11.8%
15.3% 6.0% 39.6% 8.2% 25.2% 4.5% 1.7% 30.3% 21.7%6.0% 7.7% 41.3% 6.2% 31.7% 1.3% 2.0% 27.8% 16.1%6.2% 7.0% 39.9% 10.4% 19.2% 6.9% 3.5% 34.8% 10.8%
14.6% 9.5% 47.5% 9.3% 30.6% 4.5% 3.2% 31.5% 21.5%2 Statistical significance not reported for this item
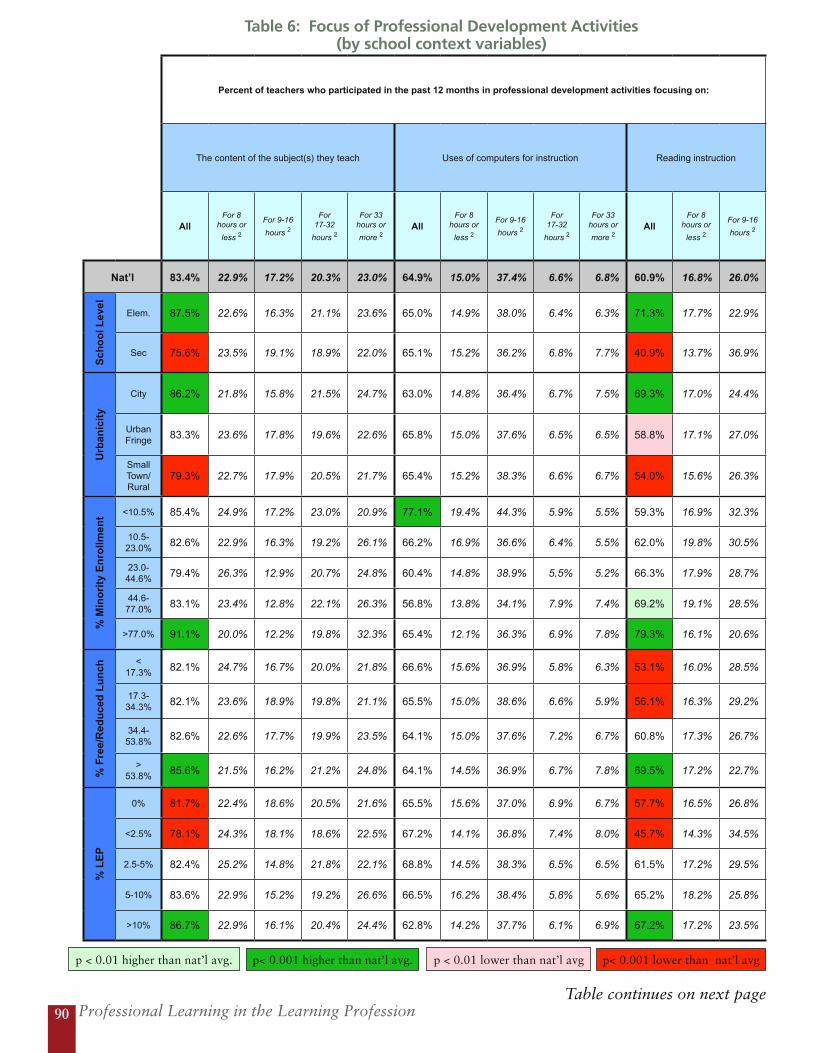
Professional Learning in the Learning Profession90
p < 0.01 higher than nat’l avg. p < 0.01 lower than nat’l avgp< 0.001 higher than nat’l avg. p< 0.001 lower than nat’l avg
Table 6: Focus of Professional Development Activities (by school context variables)
Percent of teachers who participated in the past 12 months in professional development activities focusing on:
The content of the subject(s) they teach Uses of computers for instruction Reading instruction
AllFor 8
hours or
less 2
For 9-16
hours 2
For 17-32
hours 2
For 33 hours or
more 2All
For 8 hours or
less 2
For 9-16
hours 2
For 17-32
hours 2
For 33 hours or
more 2All
For 8 hours or
less 2
For 9-16
hours 2
Nat’l 83.4% 22.9% 17.2% 20.3% 23.0% 64.9% 15.0% 37.4% 6.6% 6.8% 60.9% 16.8% 26.0%
Sch
oo
l Lev
el
Elem. 87.5% 22.6% 16.3% 21.1% 23.6% 65.0% 14.9% 38.0% 6.4% 6.3% 71.3% 17.7% 22.9%
Sec 75.6% 23.5% 19.1% 18.9% 22.0% 65.1% 15.2% 36.2% 6.8% 7.7% 40.9% 13.7% 36.9%
Urb
anic
ity
City 86.2% 21.8% 15.8% 21.5% 24.7% 63.0% 14.8% 36.4% 6.7% 7.5% 69.3% 17.0% 24.4%
Urban Fringe 83.3% 23.6% 17.8% 19.6% 22.6% 65.8% 15.0% 37.6% 6.5% 6.5% 58.8% 17.1% 27.0%
Small Town/ Rural
79.3% 22.7% 17.9% 20.5% 21.7% 65.4% 15.2% 38.3% 6.6% 6.7% 54.0% 15.6% 26.3%
% M
ino
rity
En
rollm
ent <10.5% 85.4% 24.9% 17.2% 23.0% 20.9% 77.1% 19.4% 44.3% 5.9% 5.5% 59.3% 16.9% 32.3%
10.5-23.0% 82.6% 22.9% 16.3% 19.2% 26.1% 66.2% 16.9% 36.6% 6.4% 5.5% 62.0% 19.8% 30.5%
23.0-44.6% 79.4% 26.3% 12.9% 20.7% 24.8% 60.4% 14.8% 38.9% 5.5% 5.2% 66.3% 17.9% 28.7%
44.6-77.0% 83.1% 23.4% 12.8% 22.1% 26.3% 56.8% 13.8% 34.1% 7.9% 7.4% 69.2% 19.1% 28.5%
>77.0% 91.1% 20.0% 12.2% 19.8% 32.3% 65.4% 12.1% 36.3% 6.9% 7.8% 79.3% 16.1% 20.6%
% F
ree/
Red
uce
d L
un
ch
< 17.3% 82.1% 24.7% 16.7% 20.0% 21.8% 66.6% 15.6% 36.9% 5.8% 6.3% 53.1% 16.0% 28.5%
17.3-34.3% 82.1% 23.6% 18.9% 19.8% 21.1% 65.5% 15.0% 38.6% 6.6% 5.9% 56.1% 16.3% 29.2%
34.4-53.8% 82.6% 22.6% 17.7% 19.9% 23.5% 64.1% 15.0% 37.6% 7.2% 6.7% 60.8% 17.3% 26.7%
> 53.8% 85.6% 21.5% 16.2% 21.2% 24.8% 64.1% 14.5% 36.9% 6.7% 7.8% 69.5% 17.2% 22.7%
% L
EP
0% 81.7% 22.4% 18.6% 20.5% 21.6% 65.5% 15.6% 37.0% 6.9% 6.7% 57.7% 16.5% 26.8%
<2.5% 78.1% 24.3% 18.1% 18.6% 22.5% 67.2% 14.1% 36.8% 7.4% 8.0% 45.7% 14.3% 34.5%
2.5-5% 82.4% 25.2% 14.8% 21.8% 22.1% 68.8% 14.5% 38.3% 6.5% 6.5% 61.5% 17.2% 29.5%
5-10% 83.6% 22.9% 15.2% 19.2% 26.6% 66.5% 16.2% 38.4% 5.8% 5.6% 65.2% 18.2% 25.8%
>10% 86.7% 22.9% 16.1% 20.4% 24.4% 62.8% 14.2% 37.7% 6.1% 6.9% 67.2% 17.2% 23.5%
Table continues on next page
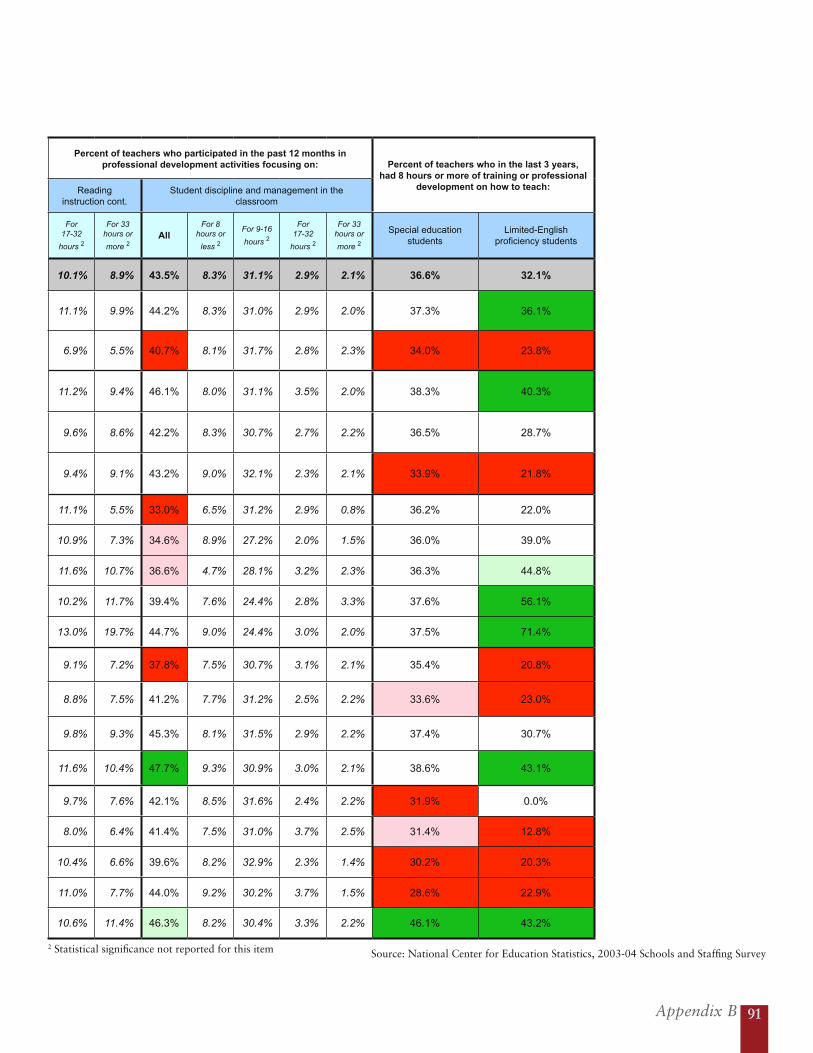
Appendix B 91
Source: National Center for Education Statistics, 2003-04 Schools and Staffing Survey
Percent of teachers who participated in the past 12 months in professional development activities focusing on: Percent of teachers who in the last 3 years,
had 8 hours or more of training or professional development on how to teach:Reading
instruction cont.Student discipline and management in the
classroom
For 17-32
hours 2
For 33 hours or
more 2All
For 8 hours or
less 2
For 9-16
hours 2
For 17-32
hours 2
For 33 hours or
more 2
Special education students
Limited-English proficiency students
10.1% 8.9% 43.5% 8.3% 31.1% 2.9% 2.1% 36.6% 32.1%
11.1% 9.9% 44.2% 8.3% 31.0% 2.9% 2.0% 37.3% 36.1%
6.9% 5.5% 40.7% 8.1% 31.7% 2.8% 2.3% 34.0% 23.8%
11.2% 9.4% 46.1% 8.0% 31.1% 3.5% 2.0% 38.3% 40.3%
9.6% 8.6% 42.2% 8.3% 30.7% 2.7% 2.2% 36.5% 28.7%
9.4% 9.1% 43.2% 9.0% 32.1% 2.3% 2.1% 33.9% 21.8%
11.1% 5.5% 33.0% 6.5% 31.2% 2.9% 0.8% 36.2% 22.0%
10.9% 7.3% 34.6% 8.9% 27.2% 2.0% 1.5% 36.0% 39.0%
11.6% 10.7% 36.6% 4.7% 28.1% 3.2% 2.3% 36.3% 44.8%
10.2% 11.7% 39.4% 7.6% 24.4% 2.8% 3.3% 37.6% 56.1%
13.0% 19.7% 44.7% 9.0% 24.4% 3.0% 2.0% 37.5% 71.4%
9.1% 7.2% 37.8% 7.5% 30.7% 3.1% 2.1% 35.4% 20.8%
8.8% 7.5% 41.2% 7.7% 31.2% 2.5% 2.2% 33.6% 23.0%
9.8% 9.3% 45.3% 8.1% 31.5% 2.9% 2.2% 37.4% 30.7%
11.6% 10.4% 47.7% 9.3% 30.9% 3.0% 2.1% 38.6% 43.1%
9.7% 7.6% 42.1% 8.5% 31.6% 2.4% 2.2% 31.9% 0.0%
8.0% 6.4% 41.4% 7.5% 31.0% 3.7% 2.5% 31.4% 12.8%
10.4% 6.6% 39.6% 8.2% 32.9% 2.3% 1.4% 30.2% 20.3%
11.0% 7.7% 44.0% 9.2% 30.2% 3.7% 1.5% 28.6% 22.9%
10.6% 11.4% 46.3% 8.2% 30.4% 3.3% 2.2% 46.1% 43.2%
2 Statistical significance not reported for this item

Professional Learning in the Learning Profession92
p < 0.01 higher than nat’l avg. p< 0.001 higher than nat’l avg.
Table 7: Usefulness of Professional Development in Last 12 Months (by state)
How useful to teachers professional development activities attended within the last 12 months with the following foci were (Not useful=1; Somewhat useful=2; Useful=3; Very useful=4)
The content of the subject(s) they teach
Uses of computers for instruction Reading instructionStudent discipline and
management in the classroom Avg.
Useful or Very Useful 2
Avg.Useful or Very
Useful 2Avg.
Useful or Very Useful 2
Avg.Useful or Very
Useful 2
Nat’l 2.42 59.3% 2.22 42.7% 2.40 42.5% 2.11 27.4%AL 2.48 62.2% 2.44 52.4% 2.56 47.9% 2.10 27.5%AK 2.54 59.0% 2.33 42.3% 2.50 41.7% 2.17 22.8%AZ 2.41 58.1% 1.93 37.0% 2.30 47.8% 2.21 28.6%AR 2.36 61.5% 2.06 57.2% 2.49 44.9% 1.99 27.5%CA 2.46 60.9% 1.99 33.1% 2.31 46.9% 2.25 23.2%CO 2.51 63.4% 2.16 33.0% 2.29 44.9% 2.08 20.8%CT 2.24 56.8% 2.23 50.3% 2.29 43.1% 2.14 24.7%DE 2.37 63.1% 2.31 40.1% 2.40 46.3% 2.19 30.7%DC 2.88 67.9% 2.94 53.7% 2.96 61.0% 2.50 38.8%FL 2.54 61.3% 2.38 46.4% 2.40 51.8% 2.23 27.7%GA 2.44 60.7% 2.63 52.8% 2.38 42.3% 2.37 27.5%HI 2.58 60.8% 2.41 28.2% 2.35 47.1% 2.25 24.0%ID 2.44 58.5% 2.27 32.2% 2.63 40.9% 2.22 20.9%IL 2.42 59.1% 2.25 41.8% 2.40 42.9% 2.08 27.1%IN 2.50 55.8% 1.93 34.5% 2.40 43.0% 1.98 22.0%IA 2.42 54.2% 2.05 33.4% 2.20 41.1% 2.22 24.2%KS 2.32 54.1% 2.05 39.5% 2.00 39.6% 2.16 26.8%KY 2.27 55.5% 2.26 47.7% 2.39 41.0% 2.21 35.3%LA 2.63 63.8% 2.50 48.3% 2.70 43.0% 2.31 34.2%ME 2.68 64.1% 2.40 37.1% 2.69 35.4% 1.97 17.0%MD 2.16 51.2% 2.08 39.8% 1.96 42.7% 1.98 21.7%MA 2.40 61.2% 2.19 37.1% 2.44 37.4% 2.13 23.0%MI 2.35 59.5% 2.09 39.7% 2.36 38.8% 2.01 23.4%MN 2.40 57.0% 2.04 36.6% 2.29 40.4% 2.16 30.5%MS 2.43 54.1% 2.47 41.7% 2.70 39.3% 2.16 33.9%MO 2.47 60.0% 2.07 35.0% 2.46 43.7% 1.97 28.4%MT 2.62 63.8% 2.37 45.7% 2.33 36.0% 2.26 29.4%NE 2.44 59.1% 2.26 39.3% 2.34 40.2% 2.16 29.6%NV 2.40 54.3% 2.40 38.9% 2.44 47.4% 2.23 21.1%NH 2.68 73.0% 2.26 44.6% 2.70 42.7% 2.13 33.1%NJ 2.51 64.2% 2.20 43.8% 2.61 36.3% 2.02 28.3%NM 2.32 55.2% 2.22 38.8% 2.43 43.9% 1.90 21.2%NY 2.26 55.2% 2.14 37.2% 2.29 36.3% 1.99 25.0%NC 2.43 62.1% 2.24 51.4% 2.32 48.1% 2.19 26.7%ND 2.49 57.5% 2.30 48.3% 2.69 33.3% 2.32 30.6%OH 2.30 52.6% 2.22 40.2% 2.55 38.1% 2.18 25.8%OK 2.31 53.1% 1.96 37.5% 2.29 32.7% 1.75 29.9%OR 2.31 56.4% 1.98 32.1% 2.19 41.5% 1.96 25.2%PA 2.32 54.2% 2.21 44.6% 2.26 39.4% 1.89 23.2%RI 2.50 56.8% 2.05 24.6% 2.41 40.3% 2.08 16.4%SC 2.31 54.4% 2.53 49.2% 2.36 38.1% 1.98 27.1%SD 2.63 58.2% 2.43 43.1% 2.46 44.0% 2.19 25.4%TN 2.33 57.8% 2.29 45.3% 2.54 43.4% 2.01 29.5%TX 2.51 64.9% 2.32 47.5% 2.64 42.2% 2.10 35.0%UT 2.85 74.5% 2.45 49.0% 2.76 57.1% 2.59 33.3%VT 2.93 50.9% 2.15 35.2% 2.64 41.9% 2.21 28.6%VA 2.20 55.8% 2.28 51.8% 2.37 35.4% 2.03 22.3%WA 2.53 64.0% 2.34 40.1% 2.27 46.2% 2.01 23.3%WV 2.41 60.0% 2.15 51.9% 2.41 37.9% 1.96 24.3%WI 2.36 51.2% 2.11 38.1% 2.33 30.9% 2.38 28.0%WY 2.70 68.0% 2.32 43.3% 2.56 47.9% 2.19 31.5%
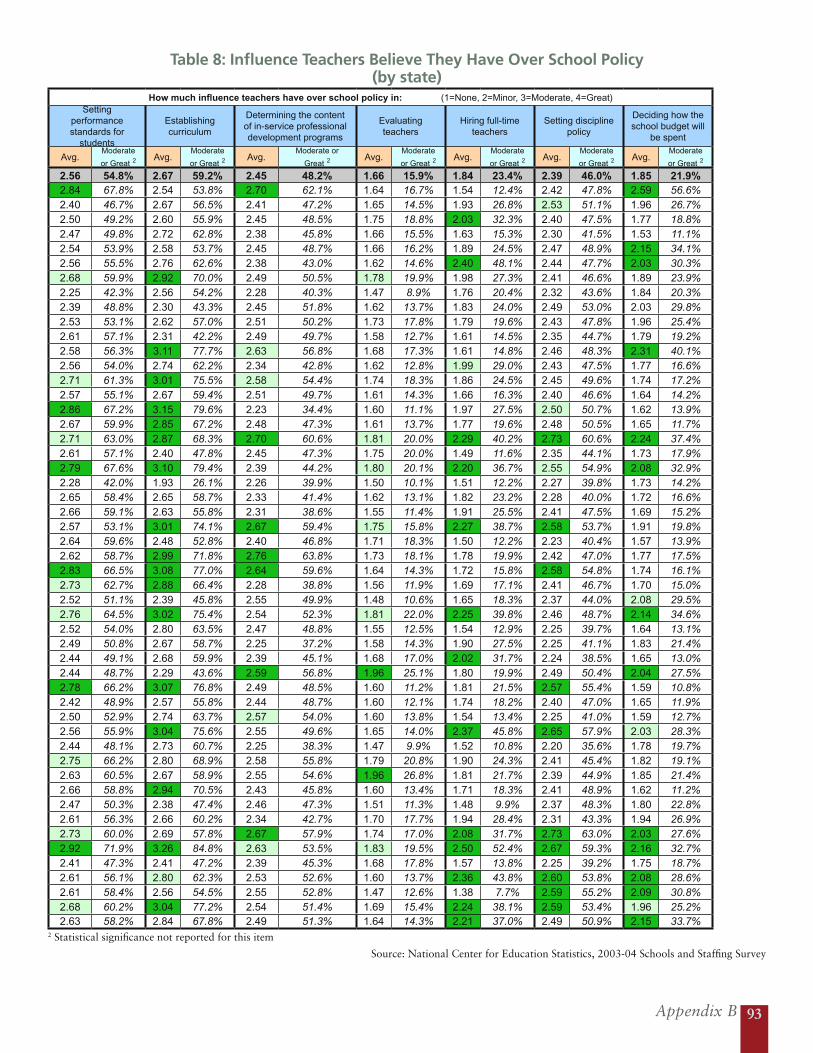
Appendix B 93
Source: National Center for Education Statistics, 2003-04 Schools and Staffing Survey
Table 7: Usefulness of Professional Development in Last 12 Months (by state)
How useful to teachers professional development activities attended within the last 12 months with the following foci were (Not useful=1; Somewhat useful=2; Useful=3; Very useful=4)
The content of the subject(s) they teach
Uses of computers for instruction Reading instructionStudent discipline and
management in the classroom
Avg. Useful or Very
Useful 2Avg.
Useful or Very Useful 2
Avg.Useful or Very
Useful 2Avg.
Useful or Very Useful 2
Nat’l 2.42 59.3% 2.22 42.7% 2.40 42.5% 2.11 27.4%AL 2.48 62.2% 2.44 52.4% 2.56 47.9% 2.10 27.5%AK 2.54 59.0% 2.33 42.3% 2.50 41.7% 2.17 22.8%AZ 2.41 58.1% 1.93 37.0% 2.30 47.8% 2.21 28.6%AR 2.36 61.5% 2.06 57.2% 2.49 44.9% 1.99 27.5%CA 2.46 60.9% 1.99 33.1% 2.31 46.9% 2.25 23.2%CO 2.51 63.4% 2.16 33.0% 2.29 44.9% 2.08 20.8%CT 2.24 56.8% 2.23 50.3% 2.29 43.1% 2.14 24.7%DE 2.37 63.1% 2.31 40.1% 2.40 46.3% 2.19 30.7%DC 2.88 67.9% 2.94 53.7% 2.96 61.0% 2.50 38.8%FL 2.54 61.3% 2.38 46.4% 2.40 51.8% 2.23 27.7%GA 2.44 60.7% 2.63 52.8% 2.38 42.3% 2.37 27.5%HI 2.58 60.8% 2.41 28.2% 2.35 47.1% 2.25 24.0%ID 2.44 58.5% 2.27 32.2% 2.63 40.9% 2.22 20.9%IL 2.42 59.1% 2.25 41.8% 2.40 42.9% 2.08 27.1%IN 2.50 55.8% 1.93 34.5% 2.40 43.0% 1.98 22.0%IA 2.42 54.2% 2.05 33.4% 2.20 41.1% 2.22 24.2%KS 2.32 54.1% 2.05 39.5% 2.00 39.6% 2.16 26.8%KY 2.27 55.5% 2.26 47.7% 2.39 41.0% 2.21 35.3%LA 2.63 63.8% 2.50 48.3% 2.70 43.0% 2.31 34.2%ME 2.68 64.1% 2.40 37.1% 2.69 35.4% 1.97 17.0%MD 2.16 51.2% 2.08 39.8% 1.96 42.7% 1.98 21.7%MA 2.40 61.2% 2.19 37.1% 2.44 37.4% 2.13 23.0%MI 2.35 59.5% 2.09 39.7% 2.36 38.8% 2.01 23.4%MN 2.40 57.0% 2.04 36.6% 2.29 40.4% 2.16 30.5%MS 2.43 54.1% 2.47 41.7% 2.70 39.3% 2.16 33.9%MO 2.47 60.0% 2.07 35.0% 2.46 43.7% 1.97 28.4%MT 2.62 63.8% 2.37 45.7% 2.33 36.0% 2.26 29.4%NE 2.44 59.1% 2.26 39.3% 2.34 40.2% 2.16 29.6%NV 2.40 54.3% 2.40 38.9% 2.44 47.4% 2.23 21.1%NH 2.68 73.0% 2.26 44.6% 2.70 42.7% 2.13 33.1%NJ 2.51 64.2% 2.20 43.8% 2.61 36.3% 2.02 28.3%NM 2.32 55.2% 2.22 38.8% 2.43 43.9% 1.90 21.2%NY 2.26 55.2% 2.14 37.2% 2.29 36.3% 1.99 25.0%NC 2.43 62.1% 2.24 51.4% 2.32 48.1% 2.19 26.7%ND 2.49 57.5% 2.30 48.3% 2.69 33.3% 2.32 30.6%OH 2.30 52.6% 2.22 40.2% 2.55 38.1% 2.18 25.8%OK 2.31 53.1% 1.96 37.5% 2.29 32.7% 1.75 29.9%OR 2.31 56.4% 1.98 32.1% 2.19 41.5% 1.96 25.2%PA 2.32 54.2% 2.21 44.6% 2.26 39.4% 1.89 23.2%RI 2.50 56.8% 2.05 24.6% 2.41 40.3% 2.08 16.4%SC 2.31 54.4% 2.53 49.2% 2.36 38.1% 1.98 27.1%SD 2.63 58.2% 2.43 43.1% 2.46 44.0% 2.19 25.4%TN 2.33 57.8% 2.29 45.3% 2.54 43.4% 2.01 29.5%TX 2.51 64.9% 2.32 47.5% 2.64 42.2% 2.10 35.0%UT 2.85 74.5% 2.45 49.0% 2.76 57.1% 2.59 33.3%VT 2.93 50.9% 2.15 35.2% 2.64 41.9% 2.21 28.6%VA 2.20 55.8% 2.28 51.8% 2.37 35.4% 2.03 22.3%WA 2.53 64.0% 2.34 40.1% 2.27 46.2% 2.01 23.3%WV 2.41 60.0% 2.15 51.9% 2.41 37.9% 1.96 24.3%WI 2.36 51.2% 2.11 38.1% 2.33 30.9% 2.38 28.0%WY 2.70 68.0% 2.32 43.3% 2.56 47.9% 2.19 31.5%
Table 8: Influence Teachers Believe They Have Over School Policy (by state)
How much influence teachers have over school policy in: (1=None, 2=Minor, 3=Moderate, 4=Great)Setting
performance standards for
students
Establishing curriculum
Determining the content of in-service professional development programs
Evaluating teachers
Hiring full-time teachers
Setting discipline policy
Deciding how the school budget will
be spent
Avg.Moderate
or Great 2Avg.
Moderate
or Great 2Avg.
Moderate or
Great 2Avg.
Moderate
or Great 2Avg.
Moderate
or Great 2Avg.
Moderate
or Great 2Avg.
Moderate
or Great 2
2.56 54.8% 2.67 59.2% 2.45 48.2% 1.66 15.9% 1.84 23.4% 2.39 46.0% 1.85 21.9%2.84 67.8% 2.54 53.8% 2.70 62.1% 1.64 16.7% 1.54 12.4% 2.42 47.8% 2.59 56.6%2.40 46.7% 2.67 56.5% 2.41 47.2% 1.65 14.5% 1.93 26.8% 2.53 51.1% 1.96 26.7%2.50 49.2% 2.60 55.9% 2.45 48.5% 1.75 18.8% 2.03 32.3% 2.40 47.5% 1.77 18.8%2.47 49.8% 2.72 62.8% 2.38 45.8% 1.66 15.5% 1.63 15.3% 2.30 41.5% 1.53 11.1%2.54 53.9% 2.58 53.7% 2.45 48.7% 1.66 16.2% 1.89 24.5% 2.47 48.9% 2.15 34.1%2.56 55.5% 2.76 62.6% 2.38 43.0% 1.62 14.6% 2.40 48.1% 2.44 47.7% 2.03 30.3%2.68 59.9% 2.92 70.0% 2.49 50.5% 1.78 19.9% 1.98 27.3% 2.41 46.6% 1.89 23.9%2.25 42.3% 2.56 54.2% 2.28 40.3% 1.47 8.9% 1.76 20.4% 2.32 43.6% 1.84 20.3%2.39 48.8% 2.30 43.3% 2.45 51.8% 1.62 13.7% 1.83 24.0% 2.49 53.0% 2.03 29.8%2.53 53.1% 2.62 57.0% 2.51 50.2% 1.73 17.8% 1.79 19.6% 2.43 47.8% 1.96 25.4%2.61 57.1% 2.31 42.2% 2.49 49.7% 1.58 12.7% 1.61 14.5% 2.35 44.7% 1.79 19.2%2.58 56.3% 3.11 77.7% 2.63 56.8% 1.68 17.3% 1.61 14.8% 2.46 48.3% 2.31 40.1%2.56 54.0% 2.74 62.2% 2.34 42.8% 1.62 12.8% 1.99 29.0% 2.43 47.5% 1.77 16.6%2.71 61.3% 3.01 75.5% 2.58 54.4% 1.74 18.3% 1.86 24.5% 2.45 49.6% 1.74 17.2%2.57 55.1% 2.67 59.4% 2.51 49.7% 1.61 14.3% 1.66 16.3% 2.40 46.6% 1.64 14.2%2.86 67.2% 3.15 79.6% 2.23 34.4% 1.60 11.1% 1.97 27.5% 2.50 50.7% 1.62 13.9%2.67 59.9% 2.85 67.2% 2.48 47.3% 1.61 13.7% 1.77 19.6% 2.48 50.5% 1.65 11.7%2.71 63.0% 2.87 68.3% 2.70 60.6% 1.81 20.0% 2.29 40.2% 2.73 60.6% 2.24 37.4%2.61 57.1% 2.40 47.8% 2.45 47.3% 1.75 20.0% 1.49 11.6% 2.35 44.1% 1.73 17.9%2.79 67.6% 3.10 79.4% 2.39 44.2% 1.80 20.1% 2.20 36.7% 2.55 54.9% 2.08 32.9%2.28 42.0% 1.93 26.1% 2.26 39.9% 1.50 10.1% 1.51 12.2% 2.27 39.8% 1.73 14.2%2.65 58.4% 2.65 58.7% 2.33 41.4% 1.62 13.1% 1.82 23.2% 2.28 40.0% 1.72 16.6%2.66 59.1% 2.63 55.8% 2.31 38.6% 1.55 11.4% 1.91 25.5% 2.41 47.5% 1.69 15.2%2.57 53.1% 3.01 74.1% 2.67 59.4% 1.75 15.8% 2.27 38.7% 2.58 53.7% 1.91 19.8%2.64 59.6% 2.48 52.8% 2.40 46.8% 1.71 18.3% 1.50 12.2% 2.23 40.4% 1.57 13.9%2.62 58.7% 2.99 71.8% 2.76 63.8% 1.73 18.1% 1.78 19.9% 2.42 47.0% 1.77 17.5%2.83 66.5% 3.08 77.0% 2.64 59.6% 1.64 14.3% 1.72 15.8% 2.58 54.8% 1.74 16.1%2.73 62.7% 2.88 66.4% 2.28 38.8% 1.56 11.9% 1.69 17.1% 2.41 46.7% 1.70 15.0%2.52 51.1% 2.39 45.8% 2.55 49.9% 1.48 10.6% 1.65 18.3% 2.37 44.0% 2.08 29.5%2.76 64.5% 3.02 75.4% 2.54 52.3% 1.81 22.0% 2.25 39.8% 2.46 48.7% 2.14 34.6%2.52 54.0% 2.80 63.5% 2.47 48.8% 1.55 12.5% 1.54 12.9% 2.25 39.7% 1.64 13.1%2.49 50.8% 2.67 58.7% 2.25 37.2% 1.58 14.3% 1.90 27.5% 2.25 41.1% 1.83 21.4%2.44 49.1% 2.68 59.9% 2.39 45.1% 1.68 17.0% 2.02 31.7% 2.24 38.5% 1.65 13.0%2.44 48.7% 2.29 43.6% 2.59 56.8% 1.96 25.1% 1.80 19.9% 2.49 50.4% 2.04 27.5%2.78 66.2% 3.07 76.8% 2.49 48.5% 1.60 11.2% 1.81 21.5% 2.57 55.4% 1.59 10.8%2.42 48.9% 2.57 55.8% 2.44 48.7% 1.60 12.1% 1.74 18.2% 2.40 47.0% 1.65 11.9%2.50 52.9% 2.74 63.7% 2.57 54.0% 1.60 13.8% 1.54 13.4% 2.25 41.0% 1.59 12.7%2.56 55.9% 3.04 75.6% 2.55 49.6% 1.65 14.0% 2.37 45.8% 2.65 57.9% 2.03 28.3%2.44 48.1% 2.73 60.7% 2.25 38.3% 1.47 9.9% 1.52 10.8% 2.20 35.6% 1.78 19.7%2.75 66.2% 2.80 68.9% 2.58 55.8% 1.79 20.8% 1.90 24.3% 2.41 45.4% 1.82 19.1%2.63 60.5% 2.67 58.9% 2.55 54.6% 1.96 26.8% 1.81 21.7% 2.39 44.9% 1.85 21.4%2.66 58.8% 2.94 70.5% 2.43 45.8% 1.60 13.4% 1.71 18.3% 2.41 48.9% 1.62 11.2%2.47 50.3% 2.38 47.4% 2.46 47.3% 1.51 11.3% 1.48 9.9% 2.37 48.3% 1.80 22.8%2.61 56.3% 2.66 60.2% 2.34 42.7% 1.70 17.7% 1.94 28.4% 2.31 43.3% 1.94 26.9%2.73 60.0% 2.69 57.8% 2.67 57.9% 1.74 17.0% 2.08 31.7% 2.73 63.0% 2.03 27.6%2.92 71.9% 3.26 84.8% 2.63 53.5% 1.83 19.5% 2.50 52.4% 2.67 59.3% 2.16 32.7%2.41 47.3% 2.41 47.2% 2.39 45.3% 1.68 17.8% 1.57 13.8% 2.25 39.2% 1.75 18.7%2.61 56.1% 2.80 62.3% 2.53 52.6% 1.60 13.7% 2.36 43.8% 2.60 53.8% 2.08 28.6%2.61 58.4% 2.56 54.5% 2.55 52.8% 1.47 12.6% 1.38 7.7% 2.59 55.2% 2.09 30.8%2.68 60.2% 3.04 77.2% 2.54 51.4% 1.69 15.4% 2.24 38.1% 2.59 53.4% 1.96 25.2%2.63 58.2% 2.84 67.8% 2.49 51.3% 1.64 14.3% 2.21 37.0% 2.49 50.9% 2.15 33.7%
2 Statistical significance not reported for this item
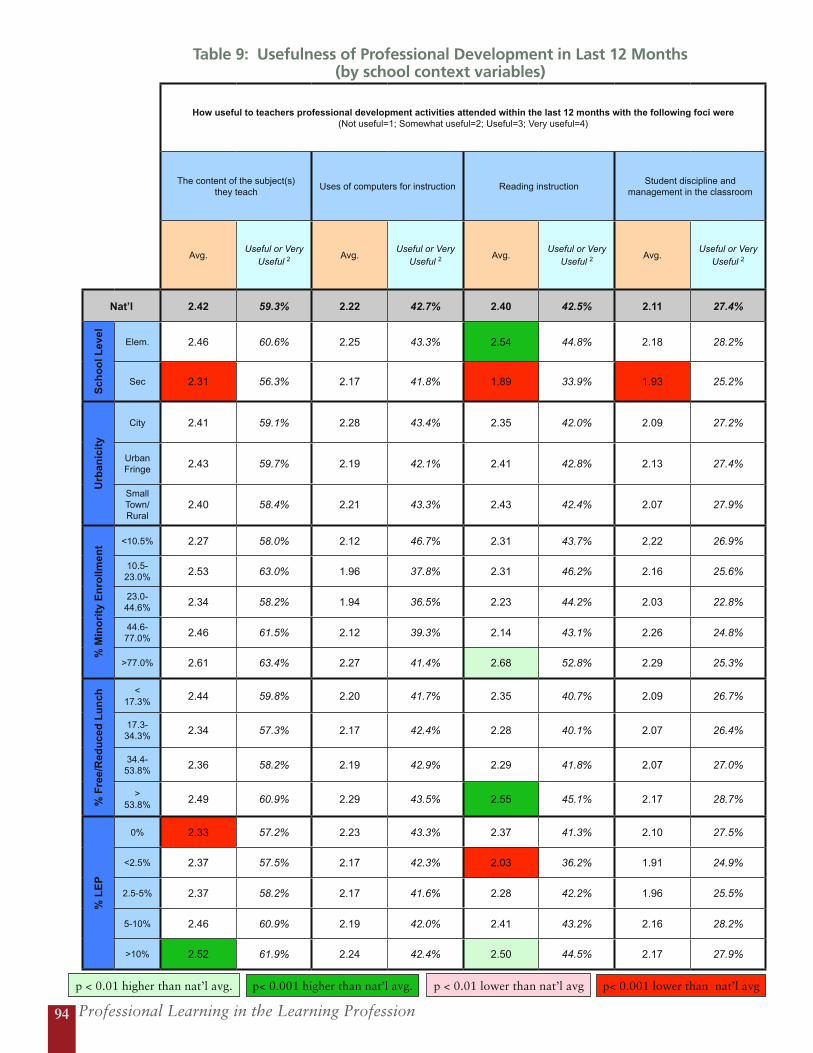
Professional Learning in the Learning Profession94
Table 9: Usefulness of Professional Development in Last 12 Months (by school context variables)
How useful to teachers professional development activities attended within the last 12 months with the following foci were (Not useful=1; Somewhat useful=2; Useful=3; Very useful=4)
The content of the subject(s) they teach
Uses of computers for instruction Reading instructionStudent discipline and
management in the classroom
Avg.Useful or Very
Useful 2Avg.
Useful or Very Useful 2
Avg.Useful or Very
Useful 2Avg.
Useful or Very Useful 2
Nat’l 2.42 59.3% 2.22 42.7% 2.40 42.5% 2.11 27.4%
Sch
oo
l Lev
el
Elem. 2.46 60.6% 2.25 43.3% 2.54 44.8% 2.18 28.2%
Sec 2.31 56.3% 2.17 41.8% 1.89 33.9% 1.93 25.2%
Urb
anic
ity
City 2.41 59.1% 2.28 43.4% 2.35 42.0% 2.09 27.2%
Urban Fringe 2.43 59.7% 2.19 42.1% 2.41 42.8% 2.13 27.4%
Small Town/ Rural
2.40 58.4% 2.21 43.3% 2.43 42.4% 2.07 27.9%
% M
ino
rity
En
rollm
ent <10.5% 2.27 58.0% 2.12 46.7% 2.31 43.7% 2.22 26.9%
10.5-23.0% 2.53 63.0% 1.96 37.8% 2.31 46.2% 2.16 25.6%
23.0-44.6% 2.34 58.2% 1.94 36.5% 2.23 44.2% 2.03 22.8%
44.6-77.0% 2.46 61.5% 2.12 39.3% 2.14 43.1% 2.26 24.8%
>77.0% 2.61 63.4% 2.27 41.4% 2.68 52.8% 2.29 25.3%
% F
ree/
Red
uce
d L
un
ch
< 17.3% 2.44 59.8% 2.20 41.7% 2.35 40.7% 2.09 26.7%
17.3-34.3% 2.34 57.3% 2.17 42.4% 2.28 40.1% 2.07 26.4%
34.4-53.8% 2.36 58.2% 2.19 42.9% 2.29 41.8% 2.07 27.0%
> 53.8% 2.49 60.9% 2.29 43.5% 2.55 45.1% 2.17 28.7%
% L
EP
0% 2.33 57.2% 2.23 43.3% 2.37 41.3% 2.10 27.5%
<2.5% 2.37 57.5% 2.17 42.3% 2.03 36.2% 1.91 24.9%
2.5-5% 2.37 58.2% 2.17 41.6% 2.28 42.2% 1.96 25.5%
5-10% 2.46 60.9% 2.19 42.0% 2.41 43.2% 2.16 28.2%
>10% 2.52 61.9% 2.24 42.4% 2.50 44.5% 2.17 27.9%
p < 0.01 higher than nat’l avg. p < 0.01 lower than nat’l avgp< 0.001 higher than nat’l avg. p< 0.001 lower than nat’l avg
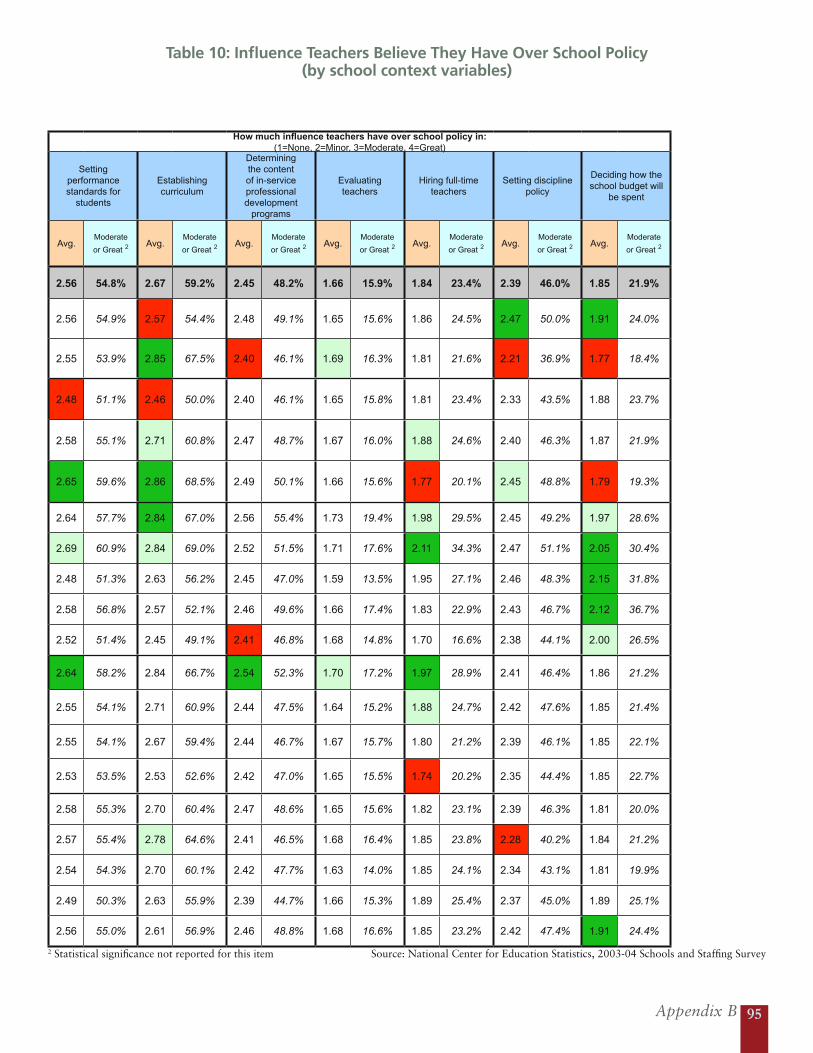
Appendix B 95
Source: National Center for Education Statistics, 2003-04 Schools and Staffing Survey
Table 10: Influence Teachers Believe They Have Over School Policy (by school context variables)
How much influence teachers have over school policy in: (1=None, 2=Minor, 3=Moderate, 4=Great)
Setting performance standards for
students
Establishing curriculum
Determining the content of in-service professional development
programs
Evaluating teachers
Hiring full-time teachers
Setting discipline policy
Deciding how the school budget will
be spent
Avg.Moderate
or Great 2Avg.
Moderate
or Great 2Avg.
Moderate
or Great 2Avg.
Moderate
or Great 2Avg.
Moderate
or Great 2Avg.
Moderate
or Great 2Avg.
Moderate
or Great 2
2.56 54.8% 2.67 59.2% 2.45 48.2% 1.66 15.9% 1.84 23.4% 2.39 46.0% 1.85 21.9%
2.56 54.9% 2.57 54.4% 2.48 49.1% 1.65 15.6% 1.86 24.5% 2.47 50.0% 1.91 24.0%
2.55 53.9% 2.85 67.5% 2.40 46.1% 1.69 16.3% 1.81 21.6% 2.21 36.9% 1.77 18.4%
2.48 51.1% 2.46 50.0% 2.40 46.1% 1.65 15.8% 1.81 23.4% 2.33 43.5% 1.88 23.7%
2.58 55.1% 2.71 60.8% 2.47 48.7% 1.67 16.0% 1.88 24.6% 2.40 46.3% 1.87 21.9%
2.65 59.6% 2.86 68.5% 2.49 50.1% 1.66 15.6% 1.77 20.1% 2.45 48.8% 1.79 19.3%
2.64 57.7% 2.84 67.0% 2.56 55.4% 1.73 19.4% 1.98 29.5% 2.45 49.2% 1.97 28.6%
2.69 60.9% 2.84 69.0% 2.52 51.5% 1.71 17.6% 2.11 34.3% 2.47 51.1% 2.05 30.4%
2.48 51.3% 2.63 56.2% 2.45 47.0% 1.59 13.5% 1.95 27.1% 2.46 48.3% 2.15 31.8%
2.58 56.8% 2.57 52.1% 2.46 49.6% 1.66 17.4% 1.83 22.9% 2.43 46.7% 2.12 36.7%
2.52 51.4% 2.45 49.1% 2.41 46.8% 1.68 14.8% 1.70 16.6% 2.38 44.1% 2.00 26.5%
2.64 58.2% 2.84 66.7% 2.54 52.3% 1.70 17.2% 1.97 28.9% 2.41 46.4% 1.86 21.2%
2.55 54.1% 2.71 60.9% 2.44 47.5% 1.64 15.2% 1.88 24.7% 2.42 47.6% 1.85 21.4%
2.55 54.1% 2.67 59.4% 2.44 46.7% 1.67 15.7% 1.80 21.2% 2.39 46.1% 1.85 22.1%
2.53 53.5% 2.53 52.6% 2.42 47.0% 1.65 15.5% 1.74 20.2% 2.35 44.4% 1.85 22.7%
2.58 55.3% 2.70 60.4% 2.47 48.6% 1.65 15.6% 1.82 23.1% 2.39 46.3% 1.81 20.0%
2.57 55.4% 2.78 64.6% 2.41 46.5% 1.68 16.4% 1.85 23.8% 2.28 40.2% 1.84 21.2%
2.54 54.3% 2.70 60.1% 2.42 47.7% 1.63 14.0% 1.85 24.1% 2.34 43.1% 1.81 19.9%
2.49 50.3% 2.63 55.9% 2.39 44.7% 1.66 15.3% 1.89 25.4% 2.37 45.0% 1.89 25.1%
2.56 55.0% 2.61 56.9% 2.46 48.8% 1.68 16.6% 1.85 23.2% 2.42 47.4% 1.91 24.4%
2 Statistical significance not reported for this item
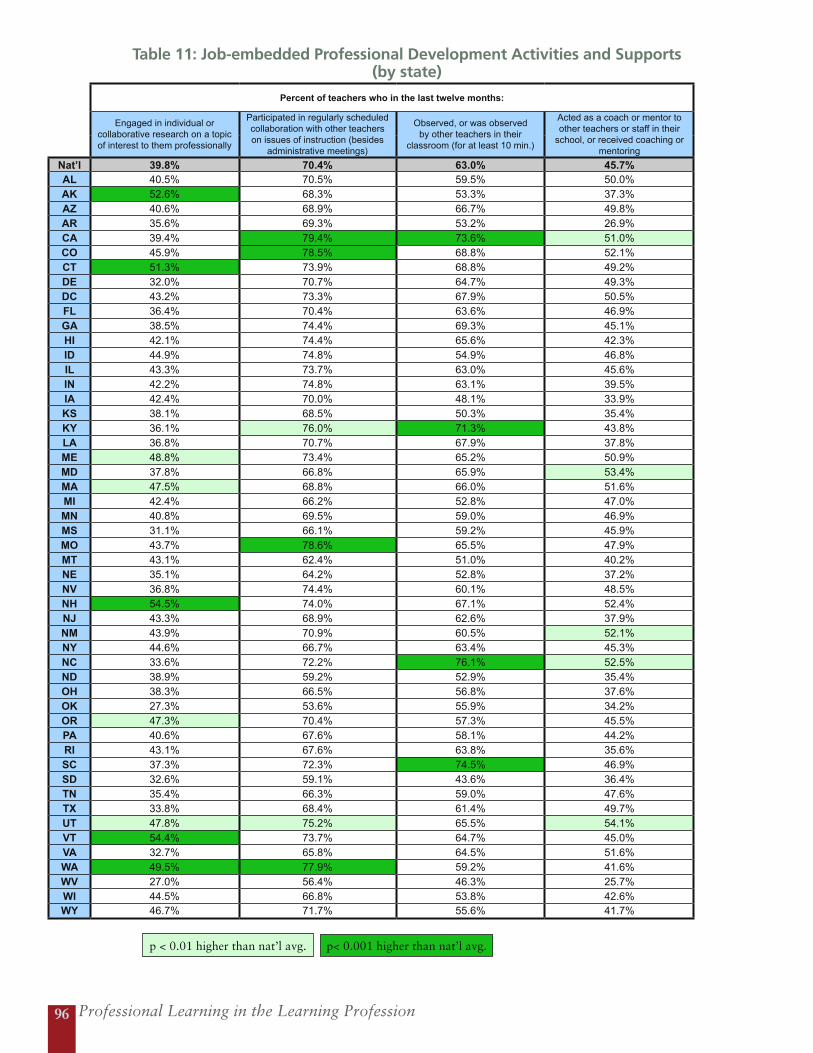
Professional Learning in the Learning Profession96
p < 0.01 higher than nat’l avg. p< 0.001 higher than nat’l avg.
Table 11: Job-embedded Professional Development Activities and Supports (by state)
Percent of teachers who in the last twelve months:
Engaged in individual or collaborative research on a topic of interest to them professionally
Participated in regularly scheduled collaboration with other teachers on issues of instruction (besides
administrative meetings)
Observed, or was observed by other teachers in their
classroom (for at least 10 min.)
Acted as a coach or mentor to other teachers or staff in their
school, or received coaching or mentoring
Nat’l 39.8% 70.4% 63.0% 45.7%AL 40.5% 70.5% 59.5% 50.0%AK 52.6% 68.3% 53.3% 37.3%AZ 40.6% 68.9% 66.7% 49.8%AR 35.6% 69.3% 53.2% 26.9%CA 39.4% 79.4% 73.6% 51.0%CO 45.9% 78.5% 68.8% 52.1%CT 51.3% 73.9% 68.8% 49.2%DE 32.0% 70.7% 64.7% 49.3%DC 43.2% 73.3% 67.9% 50.5%FL 36.4% 70.4% 63.6% 46.9%GA 38.5% 74.4% 69.3% 45.1%HI 42.1% 74.4% 65.6% 42.3%ID 44.9% 74.8% 54.9% 46.8%IL 43.3% 73.7% 63.0% 45.6%IN 42.2% 74.8% 63.1% 39.5%IA 42.4% 70.0% 48.1% 33.9%KS 38.1% 68.5% 50.3% 35.4%KY 36.1% 76.0% 71.3% 43.8%LA 36.8% 70.7% 67.9% 37.8%ME 48.8% 73.4% 65.2% 50.9%MD 37.8% 66.8% 65.9% 53.4%MA 47.5% 68.8% 66.0% 51.6%MI 42.4% 66.2% 52.8% 47.0%MN 40.8% 69.5% 59.0% 46.9%MS 31.1% 66.1% 59.2% 45.9%MO 43.7% 78.6% 65.5% 47.9%MT 43.1% 62.4% 51.0% 40.2%NE 35.1% 64.2% 52.8% 37.2%NV 36.8% 74.4% 60.1% 48.5%NH 54.5% 74.0% 67.1% 52.4%NJ 43.3% 68.9% 62.6% 37.9%NM 43.9% 70.9% 60.5% 52.1%NY 44.6% 66.7% 63.4% 45.3%NC 33.6% 72.2% 76.1% 52.5%ND 38.9% 59.2% 52.9% 35.4%OH 38.3% 66.5% 56.8% 37.6%OK 27.3% 53.6% 55.9% 34.2%OR 47.3% 70.4% 57.3% 45.5%PA 40.6% 67.6% 58.1% 44.2%RI 43.1% 67.6% 63.8% 35.6%SC 37.3% 72.3% 74.5% 46.9%SD 32.6% 59.1% 43.6% 36.4%TN 35.4% 66.3% 59.0% 47.6%TX 33.8% 68.4% 61.4% 49.7%UT 47.8% 75.2% 65.5% 54.1%VT 54.4% 73.7% 64.7% 45.0%VA 32.7% 65.8% 64.5% 51.6%WA 49.5% 77.9% 59.2% 41.6%WV 27.0% 56.4% 46.3% 25.7%WI 44.5% 66.8% 53.8% 42.6%WY 46.7% 71.7% 55.6% 41.7%
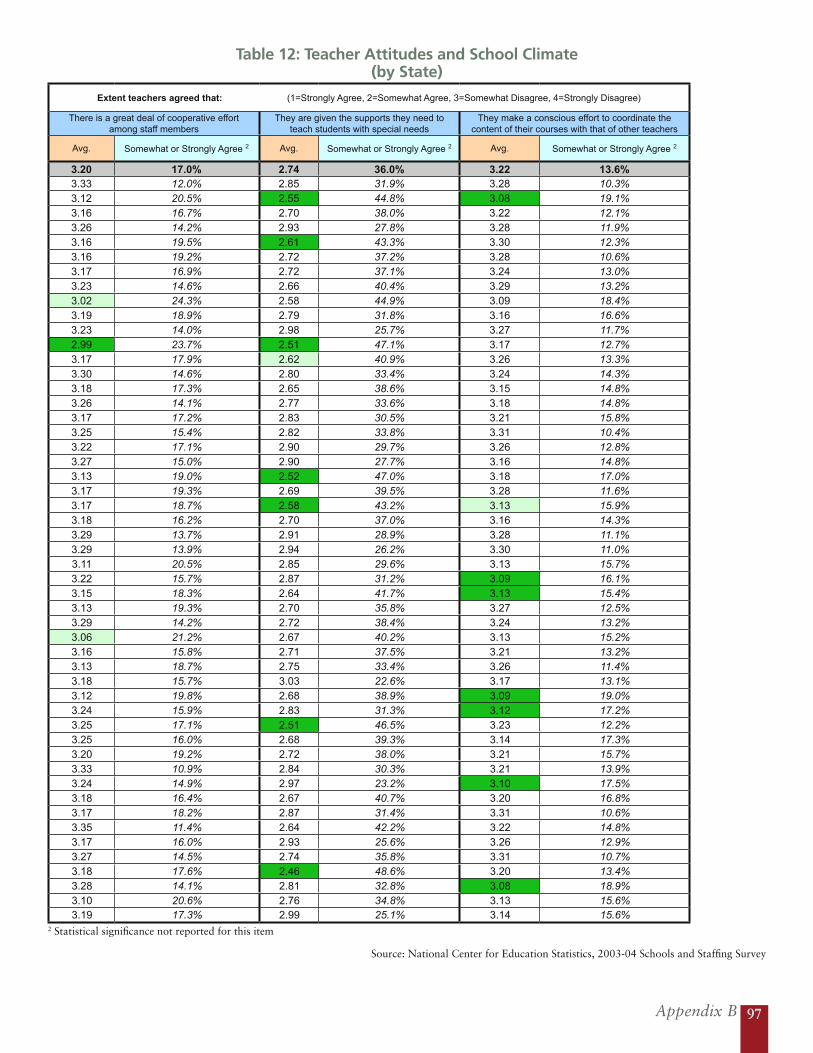
Appendix B 97
Source: National Center for Education Statistics, 2003-04 Schools and Staffing Survey
Table 12: Teacher Attitudes and School Climate (by State)
Extent teachers agreed that: (1=Strongly Agree, 2=Somewhat Agree, 3=Somewhat Disagree, 4=Strongly Disagree)
There is a great deal of cooperative effort among staff members
They are given the supports they need to teach students with special needs
They make a conscious effort to coordinate the content of their courses with that of other teachers
Avg. Somewhat or Strongly Agree 2 Avg. Somewhat or Strongly Agree 2 Avg. Somewhat or Strongly Agree 2
3.20 17.0% 2.74 36.0% 3.22 13.6%3.33 12.0% 2.85 31.9% 3.28 10.3%3.12 20.5% 2.55 44.8% 3.08 19.1%3.16 16.7% 2.70 38.0% 3.22 12.1%3.26 14.2% 2.93 27.8% 3.28 11.9%3.16 19.5% 2.61 43.3% 3.30 12.3%3.16 19.2% 2.72 37.2% 3.28 10.6%3.17 16.9% 2.72 37.1% 3.24 13.0%3.23 14.6% 2.66 40.4% 3.29 13.2%3.02 24.3% 2.58 44.9% 3.09 18.4%3.19 18.9% 2.79 31.8% 3.16 16.6%3.23 14.0% 2.98 25.7% 3.27 11.7%2.99 23.7% 2.51 47.1% 3.17 12.7%3.17 17.9% 2.62 40.9% 3.26 13.3%3.30 14.6% 2.80 33.4% 3.24 14.3%3.18 17.3% 2.65 38.6% 3.15 14.8%3.26 14.1% 2.77 33.6% 3.18 14.8%3.17 17.2% 2.83 30.5% 3.21 15.8%3.25 15.4% 2.82 33.8% 3.31 10.4%3.22 17.1% 2.90 29.7% 3.26 12.8%3.27 15.0% 2.90 27.7% 3.16 14.8%3.13 19.0% 2.52 47.0% 3.18 17.0%3.17 19.3% 2.69 39.5% 3.28 11.6%3.17 18.7% 2.58 43.2% 3.13 15.9%3.18 16.2% 2.70 37.0% 3.16 14.3%3.29 13.7% 2.91 28.9% 3.28 11.1%3.29 13.9% 2.94 26.2% 3.30 11.0%3.11 20.5% 2.85 29.6% 3.13 15.7%3.22 15.7% 2.87 31.2% 3.09 16.1%3.15 18.3% 2.64 41.7% 3.13 15.4%3.13 19.3% 2.70 35.8% 3.27 12.5%3.29 14.2% 2.72 38.4% 3.24 13.2%3.06 21.2% 2.67 40.2% 3.13 15.2%3.16 15.8% 2.71 37.5% 3.21 13.2%3.13 18.7% 2.75 33.4% 3.26 11.4%3.18 15.7% 3.03 22.6% 3.17 13.1%3.12 19.8% 2.68 38.9% 3.09 19.0%3.24 15.9% 2.83 31.3% 3.12 17.2%3.25 17.1% 2.51 46.5% 3.23 12.2%3.25 16.0% 2.68 39.3% 3.14 17.3%3.20 19.2% 2.72 38.0% 3.21 15.7%3.33 10.9% 2.84 30.3% 3.21 13.9%3.24 14.9% 2.97 23.2% 3.10 17.5%3.18 16.4% 2.67 40.7% 3.20 16.8%3.17 18.2% 2.87 31.4% 3.31 10.6%3.35 11.4% 2.64 42.2% 3.22 14.8%3.17 16.0% 2.93 25.6% 3.26 12.9%3.27 14.5% 2.74 35.8% 3.31 10.7%3.18 17.6% 2.46 48.6% 3.20 13.4%3.28 14.1% 2.81 32.8% 3.08 18.9%3.10 20.6% 2.76 34.8% 3.13 15.6%3.19 17.3% 2.99 25.1% 3.14 15.6%
2 Statistical significance not reported for this item
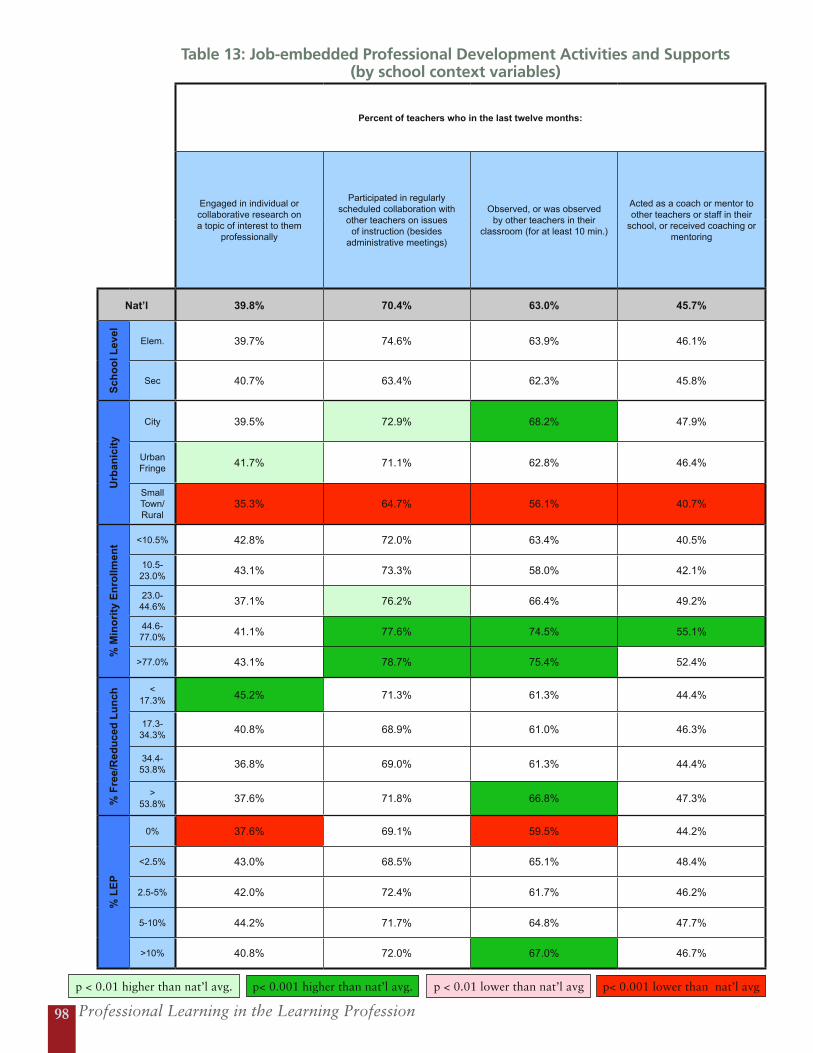
Professional Learning in the Learning Profession98
Table 13: Job-embedded Professional Development Activities and Supports (by school context variables)
Percent of teachers who in the last twelve months:
Engaged in individual or collaborative research on a topic of interest to them
professionally
Participated in regularly scheduled collaboration with
other teachers on issues of instruction (besides
administrative meetings)
Observed, or was observed by other teachers in their
classroom (for at least 10 min.)
Acted as a coach or mentor to other teachers or staff in their
school, or received coaching or mentoring
Nat’l 39.8% 70.4% 63.0% 45.7%
Sch
oo
l Lev
el
Elem. 39.7% 74.6% 63.9% 46.1%
Sec 40.7% 63.4% 62.3% 45.8%
Urb
anic
ity
City 39.5% 72.9% 68.2% 47.9%
Urban Fringe 41.7% 71.1% 62.8% 46.4%
Small Town/ Rural
35.3% 64.7% 56.1% 40.7%
% M
ino
rity
En
rollm
ent <10.5% 42.8% 72.0% 63.4% 40.5%
10.5-23.0% 43.1% 73.3% 58.0% 42.1%
23.0-44.6% 37.1% 76.2% 66.4% 49.2%
44.6-77.0% 41.1% 77.6% 74.5% 55.1%
>77.0% 43.1% 78.7% 75.4% 52.4%
% F
ree/
Red
uce
d L
un
ch
< 17.3% 45.2% 71.3% 61.3% 44.4%
17.3-34.3% 40.8% 68.9% 61.0% 46.3%
34.4-53.8% 36.8% 69.0% 61.3% 44.4%
> 53.8% 37.6% 71.8% 66.8% 47.3%
% L
EP
0% 37.6% 69.1% 59.5% 44.2%
<2.5% 43.0% 68.5% 65.1% 48.4%
2.5-5% 42.0% 72.4% 61.7% 46.2%
5-10% 44.2% 71.7% 64.8% 47.7%
>10% 40.8% 72.0% 67.0% 46.7%
p < 0.01 higher than nat’l avg. p < 0.01 lower than nat’l avgp< 0.001 higher than nat’l avg. p< 0.001 lower than nat’l avg
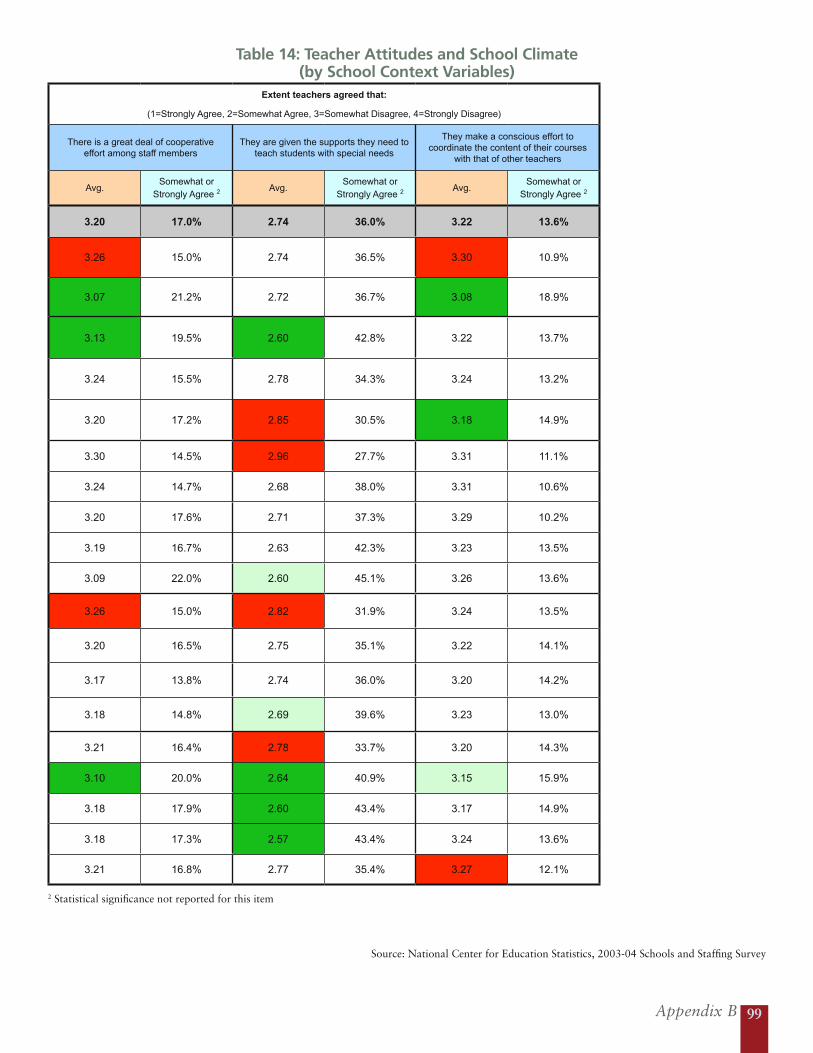
Appendix B 99
Source: National Center for Education Statistics, 2003-04 Schools and Staffing Survey
Table 13: Job-embedded Professional Development Activities and Supports (by school context variables)
Percent of teachers who in the last twelve months:
Engaged in individual or collaborative research on a topic of interest to them
professionally
Participated in regularly scheduled collaboration with
other teachers on issues of instruction (besides
administrative meetings)
Observed, or was observed by other teachers in their
classroom (for at least 10 min.)
Acted as a coach or mentor to other teachers or staff in their
school, or received coaching or mentoring
Nat’l 39.8% 70.4% 63.0% 45.7%
Sch
oo
l Lev
el
Elem. 39.7% 74.6% 63.9% 46.1%
Sec 40.7% 63.4% 62.3% 45.8%
Urb
anic
ity
City 39.5% 72.9% 68.2% 47.9%
Urban Fringe 41.7% 71.1% 62.8% 46.4%
Small Town/ Rural
35.3% 64.7% 56.1% 40.7%
% M
ino
rity
En
rollm
ent <10.5% 42.8% 72.0% 63.4% 40.5%
10.5-23.0% 43.1% 73.3% 58.0% 42.1%
23.0-44.6% 37.1% 76.2% 66.4% 49.2%
44.6-77.0% 41.1% 77.6% 74.5% 55.1%
>77.0% 43.1% 78.7% 75.4% 52.4%
% F
ree/
Red
uce
d L
un
ch
< 17.3% 45.2% 71.3% 61.3% 44.4%
17.3-34.3% 40.8% 68.9% 61.0% 46.3%
34.4-53.8% 36.8% 69.0% 61.3% 44.4%
> 53.8% 37.6% 71.8% 66.8% 47.3%
% L
EP
0% 37.6% 69.1% 59.5% 44.2%
<2.5% 43.0% 68.5% 65.1% 48.4%
2.5-5% 42.0% 72.4% 61.7% 46.2%
5-10% 44.2% 71.7% 64.8% 47.7%
>10% 40.8% 72.0% 67.0% 46.7%
Table 14: Teacher Attitudes and School Climate (by School Context Variables)
Extent teachers agreed that:
(1=Strongly Agree, 2=Somewhat Agree, 3=Somewhat Disagree, 4=Strongly Disagree)
There is a great deal of cooperative effort among staff members
They are given the supports they need to teach students with special needs
They make a conscious effort to coordinate the content of their courses
with that of other teachers
Avg.Somewhat or
Strongly Agree 2Avg.
Somewhat or Strongly Agree 2
Avg.Somewhat or
Strongly Agree 2
3.20 17.0% 2.74 36.0% 3.22 13.6%
3.26 15.0% 2.74 36.5% 3.30 10.9%
3.07 21.2% 2.72 36.7% 3.08 18.9%
3.13 19.5% 2.60 42.8% 3.22 13.7%
3.24 15.5% 2.78 34.3% 3.24 13.2%
3.20 17.2% 2.85 30.5% 3.18 14.9%
3.30 14.5% 2.96 27.7% 3.31 11.1%
3.24 14.7% 2.68 38.0% 3.31 10.6%
3.20 17.6% 2.71 37.3% 3.29 10.2%
3.19 16.7% 2.63 42.3% 3.23 13.5%
3.09 22.0% 2.60 45.1% 3.26 13.6%
3.26 15.0% 2.82 31.9% 3.24 13.5%
3.20 16.5% 2.75 35.1% 3.22 14.1%
3.17 13.8% 2.74 36.0% 3.20 14.2%
3.18 14.8% 2.69 39.6% 3.23 13.0%
3.21 16.4% 2.78 33.7% 3.20 14.3%
3.10 20.0% 2.64 40.9% 3.15 15.9%
3.18 17.9% 2.60 43.4% 3.17 14.9%
3.18 17.3% 2.57 43.4% 3.24 13.6%
3.21 16.8% 2.77 35.4% 3.27 12.1%
2 Statistical significance not reported for this item
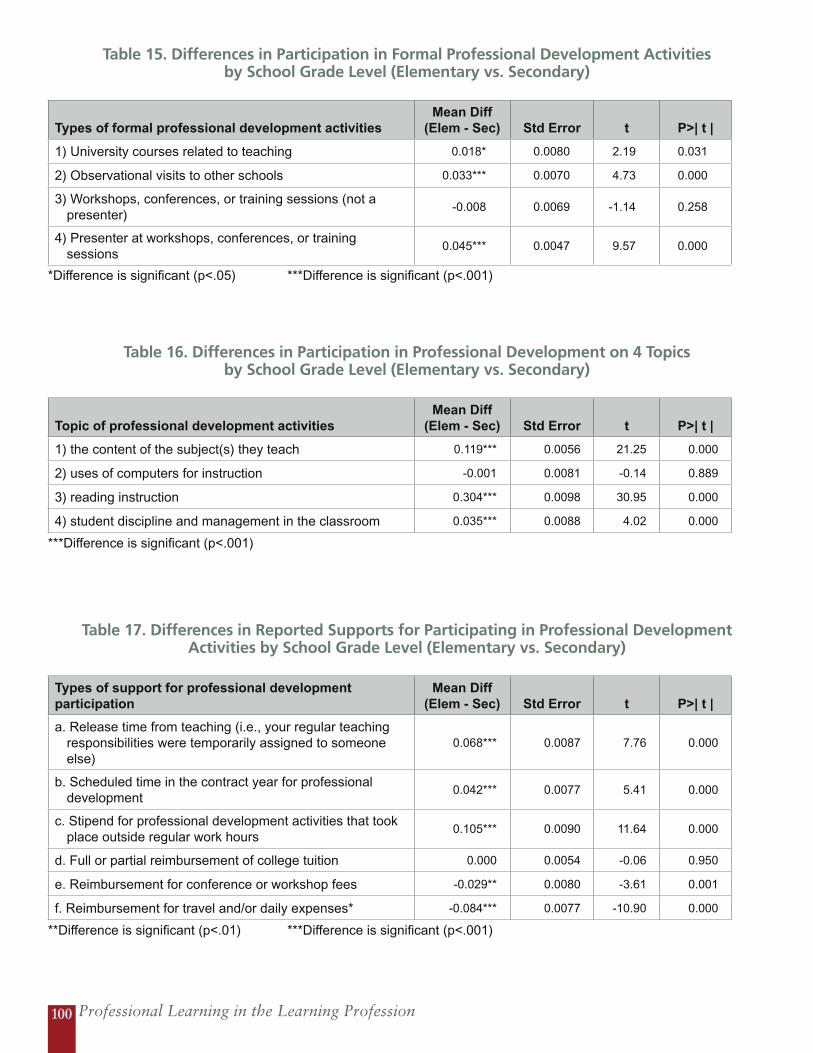
Professional Learning in the Learning Profession100
Table 15. Differences in Participation in Formal Professional Development Activities by School Grade Level (Elementary vs. Secondary)
Types of formal professional development activitiesMean Diff
(Elem - Sec) Std Error t P>| t |
1) University courses related to teaching 0.018* 0.0080 2.19 0.031
2) Observational visits to other schools 0.033*** 0.0070 4.73 0.000
3) Workshops, conferences, or training sessions (not a presenter)
-0.008 0.0069 -1.14 0.258
4) Presenter at workshops, conferences, or training sessions
0.045*** 0.0047 9.57 0.000
*Difference is significant (p<.05) ***Difference is significant (p<.001)
Table 16. Differences in Participation in Professional Development on 4 Topics by School Grade Level (Elementary vs. Secondary)
Topic of professional development activitiesMean Diff
(Elem - Sec) Std Error t P>| t |
1) the content of the subject(s) they teach 0.119*** 0.0056 21.25 0.000
2) uses of computers for instruction -0.001 0.0081 -0.14 0.889
3) reading instruction 0.304*** 0.0098 30.95 0.000
4) student discipline and management in the classroom 0.035*** 0.0088 4.02 0.000
***Difference is significant (p<.001)
Table 17. Differences in Reported Supports for Participating in Professional Development Activities by School Grade Level (Elementary vs. Secondary)
Types of support for professional development participation
Mean Diff (Elem - Sec) Std Error t P>| t |
a. Release time from teaching (i.e., your regular teaching responsibilities were temporarily assigned to someone else)
0.068*** 0.0087 7.76 0.000
b. Scheduled time in the contract year for professional development
0.042*** 0.0077 5.41 0.000
c. Stipend for professional development activities that took place outside regular work hours
0.105*** 0.0090 11.64 0.000
d. Full or partial reimbursement of college tuition 0.000 0.0054 -0.06 0.950
e. Reimbursement for conference or workshop fees -0.029** 0.0080 -3.61 0.001
f. Reimbursement for travel and/or daily expenses* -0.084*** 0.0077 -10.90 0.000
**Difference is significant (p<.01) ***Difference is significant (p<.001)
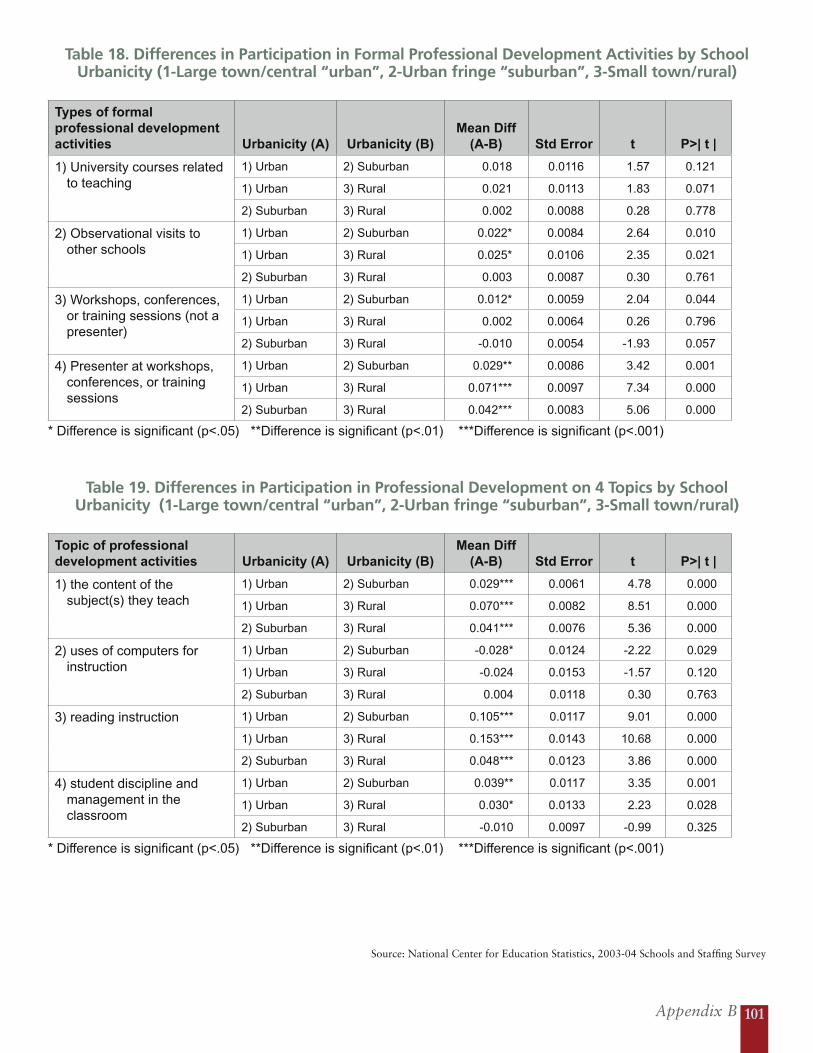
Appendix B 101
Source: National Center for Education Statistics, 2003-04 Schools and Staffing Survey
Table 18. Differences in Participation in Formal Professional Development Activities by School Urbanicity (1-Large town/central “urban”, 2-Urban fringe “suburban”, 3-Small town/rural)
Types of formal professional development activities Urbanicity (A) Urbanicity (B)
Mean Diff (A-B) Std Error t P>| t |
1) University courses related to teaching
1) Urban 2) Suburban 0.018 0.0116 1.57 0.121
1) Urban 3) Rural 0.021 0.0113 1.83 0.071
2) Suburban 3) Rural 0.002 0.0088 0.28 0.778
2) Observational visits to other schools
1) Urban 2) Suburban 0.022* 0.0084 2.64 0.010
1) Urban 3) Rural 0.025* 0.0106 2.35 0.021
2) Suburban 3) Rural 0.003 0.0087 0.30 0.761
3) Workshops, conferences, or training sessions (not a presenter)
1) Urban 2) Suburban 0.012* 0.0059 2.04 0.044
1) Urban 3) Rural 0.002 0.0064 0.26 0.796
2) Suburban 3) Rural -0.010 0.0054 -1.93 0.057
4) Presenter at workshops, conferences, or training sessions
1) Urban 2) Suburban 0.029** 0.0086 3.42 0.001
1) Urban 3) Rural 0.071*** 0.0097 7.34 0.000
2) Suburban 3) Rural 0.042*** 0.0083 5.06 0.000
* Difference is significant (p<.05) **Difference is significant (p<.01) ***Difference is significant (p<.001)
Table 19. Differences in Participation in Professional Development on 4 Topics by School Urbanicity (1-Large town/central “urban”, 2-Urban fringe “suburban”, 3-Small town/rural)
Topic of professional development activities Urbanicity (A) Urbanicity (B)
Mean Diff (A-B) Std Error t P>| t |
1) the content of the subject(s) they teach
1) Urban 2) Suburban 0.029*** 0.0061 4.78 0.000
1) Urban 3) Rural 0.070*** 0.0082 8.51 0.000
2) Suburban 3) Rural 0.041*** 0.0076 5.36 0.000
2) uses of computers for instruction
1) Urban 2) Suburban -0.028* 0.0124 -2.22 0.029
1) Urban 3) Rural -0.024 0.0153 -1.57 0.120
2) Suburban 3) Rural 0.004 0.0118 0.30 0.763
3) reading instruction 1) Urban 2) Suburban 0.105*** 0.0117 9.01 0.000
1) Urban 3) Rural 0.153*** 0.0143 10.68 0.000
2) Suburban 3) Rural 0.048*** 0.0123 3.86 0.000
4) student discipline and management in the classroom
1) Urban 2) Suburban 0.039** 0.0117 3.35 0.001
1) Urban 3) Rural 0.030* 0.0133 2.23 0.028
2) Suburban 3) Rural -0.010 0.0097 -0.99 0.325
* Difference is significant (p<.05) **Difference is significant (p<.01) ***Difference is significant (p<.001)
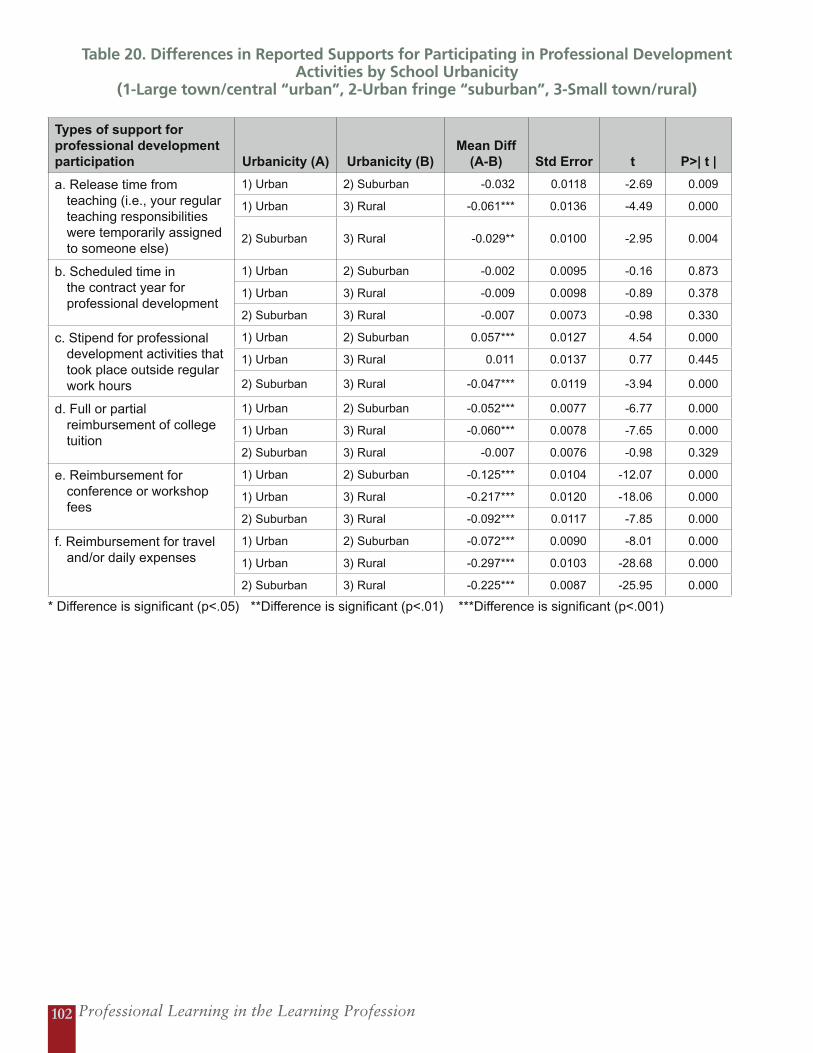
Professional Learning in the Learning Profession102
Table 20. Differences in Reported Supports for Participating in Professional Development Activities by School Urbanicity
(1-Large town/central “urban”, 2-Urban fringe “suburban”, 3-Small town/rural)
Types of support for professional development participation Urbanicity (A) Urbanicity (B)
Mean Diff (A-B) Std Error t P>| t |
a. Release time from teaching (i.e., your regular teaching responsibilities were temporarily assigned to someone else)
1) Urban 2) Suburban -0.032 0.0118 -2.69 0.009
1) Urban 3) Rural -0.061*** 0.0136 -4.49 0.000
2) Suburban 3) Rural -0.029** 0.0100 -2.95 0.004
b. Scheduled time in the contract year for professional development
1) Urban 2) Suburban -0.002 0.0095 -0.16 0.873
1) Urban 3) Rural -0.009 0.0098 -0.89 0.378
2) Suburban 3) Rural -0.007 0.0073 -0.98 0.330
c. Stipend for professional development activities that took place outside regular work hours
1) Urban 2) Suburban 0.057*** 0.0127 4.54 0.000
1) Urban 3) Rural 0.011 0.0137 0.77 0.445
2) Suburban 3) Rural -0.047*** 0.0119 -3.94 0.000
d. Full or partial reimbursement of college tuition
1) Urban 2) Suburban -0.052*** 0.0077 -6.77 0.000
1) Urban 3) Rural -0.060*** 0.0078 -7.65 0.000
2) Suburban 3) Rural -0.007 0.0076 -0.98 0.329
e. Reimbursement for conference or workshop fees
1) Urban 2) Suburban -0.125*** 0.0104 -12.07 0.000
1) Urban 3) Rural -0.217*** 0.0120 -18.06 0.000
2) Suburban 3) Rural -0.092*** 0.0117 -7.85 0.000
f. Reimbursement for travel and/or daily expenses
1) Urban 2) Suburban -0.072*** 0.0090 -8.01 0.000
1) Urban 3) Rural -0.297*** 0.0103 -28.68 0.000
2) Suburban 3) Rural -0.225*** 0.0087 -25.95 0.000
* Difference is significant (p<.05) **Difference is significant (p<.01) ***Difference is significant (p<.001)

Appendix B 103
Source: National Center for Education Statistics, 2003-04 Schools and Staffing Survey
Table 21. Differences in Participation in Formal Professional Development Activities by School Minority Enrollment
Types of formal professional development activities
Percent Minority
Enrollment (A)
Percent Minority
Enrollment (B)Mean Diff
(A-B) Std Error t P>| t |1) University courses related to
teaching1) < 10.5% 2) 10.5-23.0% -0.121*** 0.0316 -3.83 0.000
1) < 10.5% 3) 23.0-44.6% -0.136*** 0.0253 -5.39 0.000
1) < 10.5% 4) 44.6-77.0% -0.171*** 0.0308 -5.54 0.000
1) < 10.5% 5) >77% -0.198*** 0.0332 -5.96 0.000
2) 10.5-23.0% 3) 23.0-44.6% -0.015 0.0325 -0.47 0.639
2) 10.5-23.0% 4) 44.6-77.0% -0.050 0.0354 -1.40 0.165
2) 10.5-23.0% 5) >77% -0.077* 0.0369 -2.08 0.040
3) 23.0-44.6% 4) 44.6-77.0% -0.034 0.0301 -1.14 0.258
3) 23.0-44.6% 5) >77% -0.062 0.0372 -1.65 0.102
4) 44.6-77.0% 5) >77% -0.027 0.0375 -0.73 0.4672) Observational visits to other
schools1) < 10.5% 2) 10.5-23.0% -0.068** 0.0253 -2.68 0.009
1) < 10.5% 3) 23.0-44.6% -0.117*** 0.0303 -3.85 0.000
1) < 10.5% 4) 44.6-77.0% -0.104*** 0.0265 -3.92 0.000
1) < 10.5% 5) >77% -0.134*** 0.0269 -4.97 0.000
2) 10.5-23.0% 3) 23.0-44.6% -0.049 0.0315 -1.54 0.127
2) 10.5-23.0% 4) 44.6-77.0% -0.036 0.0299 -1.21 0.229
2) 10.5-23.0% 5) >77% -0.066 0.0332 -1.98 0.051
3) 23.0-44.6% 4) 44.6-77.0% 0.012 0.0310 0.40 0.689
3) 23.0-44.6% 5) >77% -0.017 0.0355 -0.48 0.633
4) 44.6-77.0% 5) >77% -0.029 0.0289 -1.02 0.3113) Workshops, conferences,
or training sessions (not a presenter)
1) < 10.5% 2) 10.5-23.0% 0.012 0.0280 0.42 0.678
1) < 10.5% 3) 23.0-44.6% -0.038 0.0319 -1.18 0.243
1) < 10.5% 4) 44.6-77.0% -0.027 0.0298 -0.92 0.362
1) < 10.5% 5) >77% -0.020 0.0269 -0.75 0.458
2) 10.5-23.0% 3) 23.0-44.6% -0.049 0.0373 -1.32 0.191
2) 10.5-23.0% 4) 44.6-77.0% -0.032 0.0321 -0.99 0.326
2) 10.5-23.0% 5) >77% -0.019 0.0273 -0.69 0.489
3) 23.0-44.6% 4) 44.6-77.0% 0.010 0.0347 0.30 0.768
3) 23.0-44.6% 5) >77% 0.018 0.0338 0.52 0.606
4) 44.6-77.0% 5) >77% 0.007 0.0321 0.23 0.8224) Presenter at workshops,
conferences, or training sessions
1) < 10.5% 2) 10.5-23.0% 0.037 0.0211 1.75 0.084
1) < 10.5% 3) 23.0-44.6% 0.045* 0.0211 2.12 0.037
1) < 10.5% 4) 44.6-77.0% 0.040* 0.0186 2.17 0.032
1) < 10.5% 5) >77% 0.006 0.0154 0.42 0.677
2) 10.5-23.0% 3) 23.0-44.6% 0.008 0.0243 0.32 0.750
2) 10.5-23.0% 4) 44.6-77.0% 0.003 0.0235 0.15 0.884
2) 10.5-23.0% 5) >77% -0.030 0.0201 -1.52 0.133
3) 23.0-44.6% 4) 44.6-77.0% -0.004 0.0240 -0.18 0.858
3) 23.0-44.6% 5) >77% -0.038 0.0196 -1.95 0.055
4) 44.6-77.0% 5) >77% -0.034 0.0178 -1.91 0.059
* Difference is significant (p<.05) **Difference is significant (p<.01) ***Difference is significant (p<.001)
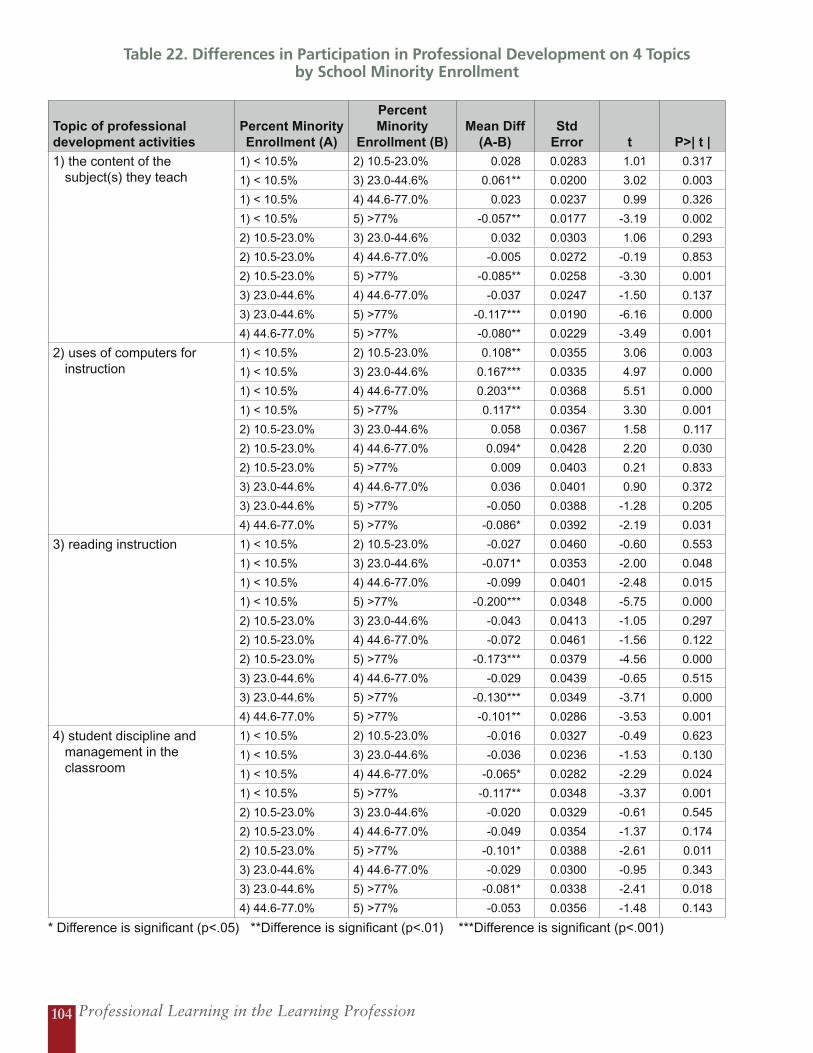
Professional Learning in the Learning Profession104
Table 22. Differences in Participation in Professional Development on 4 Topics by School Minority Enrollment
Topic of professional development activities
Percent Minority Enrollment (A)
Percent Minority
Enrollment (B)Mean Diff
(A-B)Std
Error t P>| t |
1) the content of the subject(s) they teach
1) < 10.5% 2) 10.5-23.0% 0.028 0.0283 1.01 0.317
1) < 10.5% 3) 23.0-44.6% 0.061** 0.0200 3.02 0.003
1) < 10.5% 4) 44.6-77.0% 0.023 0.0237 0.99 0.326
1) < 10.5% 5) >77% -0.057** 0.0177 -3.19 0.002
2) 10.5-23.0% 3) 23.0-44.6% 0.032 0.0303 1.06 0.293
2) 10.5-23.0% 4) 44.6-77.0% -0.005 0.0272 -0.19 0.853
2) 10.5-23.0% 5) >77% -0.085** 0.0258 -3.30 0.001
3) 23.0-44.6% 4) 44.6-77.0% -0.037 0.0247 -1.50 0.137
3) 23.0-44.6% 5) >77% -0.117*** 0.0190 -6.16 0.000
4) 44.6-77.0% 5) >77% -0.080** 0.0229 -3.49 0.001
2) uses of computers for instruction
1) < 10.5% 2) 10.5-23.0% 0.108** 0.0355 3.06 0.003
1) < 10.5% 3) 23.0-44.6% 0.167*** 0.0335 4.97 0.000
1) < 10.5% 4) 44.6-77.0% 0.203*** 0.0368 5.51 0.000
1) < 10.5% 5) >77% 0.117** 0.0354 3.30 0.001
2) 10.5-23.0% 3) 23.0-44.6% 0.058 0.0367 1.58 0.117
2) 10.5-23.0% 4) 44.6-77.0% 0.094* 0.0428 2.20 0.030
2) 10.5-23.0% 5) >77% 0.009 0.0403 0.21 0.833
3) 23.0-44.6% 4) 44.6-77.0% 0.036 0.0401 0.90 0.372
3) 23.0-44.6% 5) >77% -0.050 0.0388 -1.28 0.205
4) 44.6-77.0% 5) >77% -0.086* 0.0392 -2.19 0.031
3) reading instruction 1) < 10.5% 2) 10.5-23.0% -0.027 0.0460 -0.60 0.553
1) < 10.5% 3) 23.0-44.6% -0.071* 0.0353 -2.00 0.048
1) < 10.5% 4) 44.6-77.0% -0.099 0.0401 -2.48 0.015
1) < 10.5% 5) >77% -0.200*** 0.0348 -5.75 0.000
2) 10.5-23.0% 3) 23.0-44.6% -0.043 0.0413 -1.05 0.297
2) 10.5-23.0% 4) 44.6-77.0% -0.072 0.0461 -1.56 0.122
2) 10.5-23.0% 5) >77% -0.173*** 0.0379 -4.56 0.000
3) 23.0-44.6% 4) 44.6-77.0% -0.029 0.0439 -0.65 0.515
3) 23.0-44.6% 5) >77% -0.130*** 0.0349 -3.71 0.000
4) 44.6-77.0% 5) >77% -0.101** 0.0286 -3.53 0.001
4) student discipline and management in the classroom
1) < 10.5% 2) 10.5-23.0% -0.016 0.0327 -0.49 0.623
1) < 10.5% 3) 23.0-44.6% -0.036 0.0236 -1.53 0.130
1) < 10.5% 4) 44.6-77.0% -0.065* 0.0282 -2.29 0.024
1) < 10.5% 5) >77% -0.117** 0.0348 -3.37 0.001
2) 10.5-23.0% 3) 23.0-44.6% -0.020 0.0329 -0.61 0.545
2) 10.5-23.0% 4) 44.6-77.0% -0.049 0.0354 -1.37 0.174
2) 10.5-23.0% 5) >77% -0.101* 0.0388 -2.61 0.011
3) 23.0-44.6% 4) 44.6-77.0% -0.029 0.0300 -0.95 0.343
3) 23.0-44.6% 5) >77% -0.081* 0.0338 -2.41 0.018
4) 44.6-77.0% 5) >77% -0.053 0.0356 -1.48 0.143
* Difference is significant (p<.05) **Difference is significant (p<.01) ***Difference is significant (p<.001)
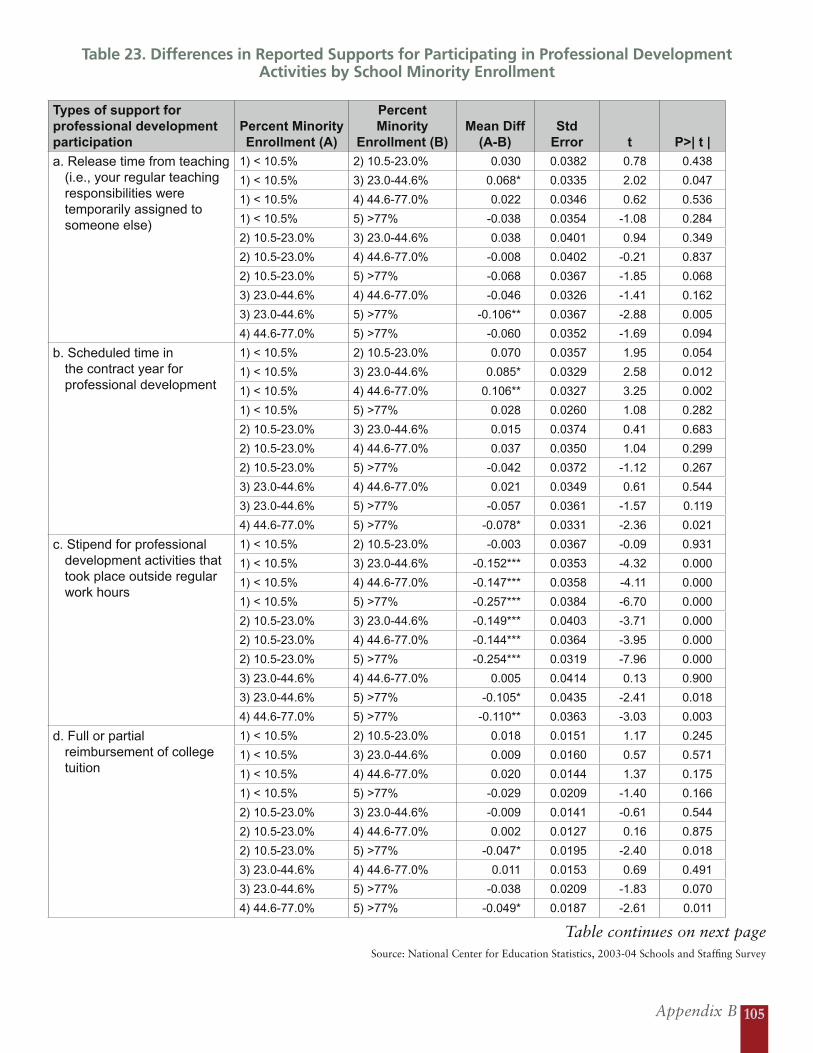
Appendix B 105
Source: National Center for Education Statistics, 2003-04 Schools and Staffing Survey
Table 23. Differences in Reported Supports for Participating in Professional Development Activities by School Minority Enrollment
Types of support for professional development participation
Percent Minority Enrollment (A)
Percent Minority
Enrollment (B)Mean Diff
(A-B)Std
Error t P>| t |
a. Release time from teaching (i.e., your regular teaching responsibilities were temporarily assigned to someone else)
1) < 10.5% 2) 10.5-23.0% 0.030 0.0382 0.78 0.438
1) < 10.5% 3) 23.0-44.6% 0.068* 0.0335 2.02 0.047
1) < 10.5% 4) 44.6-77.0% 0.022 0.0346 0.62 0.536
1) < 10.5% 5) >77% -0.038 0.0354 -1.08 0.284
2) 10.5-23.0% 3) 23.0-44.6% 0.038 0.0401 0.94 0.349
2) 10.5-23.0% 4) 44.6-77.0% -0.008 0.0402 -0.21 0.837
2) 10.5-23.0% 5) >77% -0.068 0.0367 -1.85 0.068
3) 23.0-44.6% 4) 44.6-77.0% -0.046 0.0326 -1.41 0.162
3) 23.0-44.6% 5) >77% -0.106** 0.0367 -2.88 0.005
4) 44.6-77.0% 5) >77% -0.060 0.0352 -1.69 0.094
b. Scheduled time in the contract year for professional development
1) < 10.5% 2) 10.5-23.0% 0.070 0.0357 1.95 0.054
1) < 10.5% 3) 23.0-44.6% 0.085* 0.0329 2.58 0.012
1) < 10.5% 4) 44.6-77.0% 0.106** 0.0327 3.25 0.002
1) < 10.5% 5) >77% 0.028 0.0260 1.08 0.282
2) 10.5-23.0% 3) 23.0-44.6% 0.015 0.0374 0.41 0.683
2) 10.5-23.0% 4) 44.6-77.0% 0.037 0.0350 1.04 0.299
2) 10.5-23.0% 5) >77% -0.042 0.0372 -1.12 0.267
3) 23.0-44.6% 4) 44.6-77.0% 0.021 0.0349 0.61 0.544
3) 23.0-44.6% 5) >77% -0.057 0.0361 -1.57 0.119
4) 44.6-77.0% 5) >77% -0.078* 0.0331 -2.36 0.021
c. Stipend for professional development activities that took place outside regular work hours
1) < 10.5% 2) 10.5-23.0% -0.003 0.0367 -0.09 0.931
1) < 10.5% 3) 23.0-44.6% -0.152*** 0.0353 -4.32 0.000
1) < 10.5% 4) 44.6-77.0% -0.147*** 0.0358 -4.11 0.000
1) < 10.5% 5) >77% -0.257*** 0.0384 -6.70 0.000
2) 10.5-23.0% 3) 23.0-44.6% -0.149*** 0.0403 -3.71 0.000
2) 10.5-23.0% 4) 44.6-77.0% -0.144*** 0.0364 -3.95 0.000
2) 10.5-23.0% 5) >77% -0.254*** 0.0319 -7.96 0.000
3) 23.0-44.6% 4) 44.6-77.0% 0.005 0.0414 0.13 0.900
3) 23.0-44.6% 5) >77% -0.105* 0.0435 -2.41 0.018
4) 44.6-77.0% 5) >77% -0.110** 0.0363 -3.03 0.003
d. Full or partial reimbursement of college tuition
1) < 10.5% 2) 10.5-23.0% 0.018 0.0151 1.17 0.245
1) < 10.5% 3) 23.0-44.6% 0.009 0.0160 0.57 0.571
1) < 10.5% 4) 44.6-77.0% 0.020 0.0144 1.37 0.175
1) < 10.5% 5) >77% -0.029 0.0209 -1.40 0.166
2) 10.5-23.0% 3) 23.0-44.6% -0.009 0.0141 -0.61 0.544
2) 10.5-23.0% 4) 44.6-77.0% 0.002 0.0127 0.16 0.875
2) 10.5-23.0% 5) >77% -0.047* 0.0195 -2.40 0.018
3) 23.0-44.6% 4) 44.6-77.0% 0.011 0.0153 0.69 0.491
3) 23.0-44.6% 5) >77% -0.038 0.0209 -1.83 0.070
4) 44.6-77.0% 5) >77% -0.049* 0.0187 -2.61 0.011
Table continues on next page
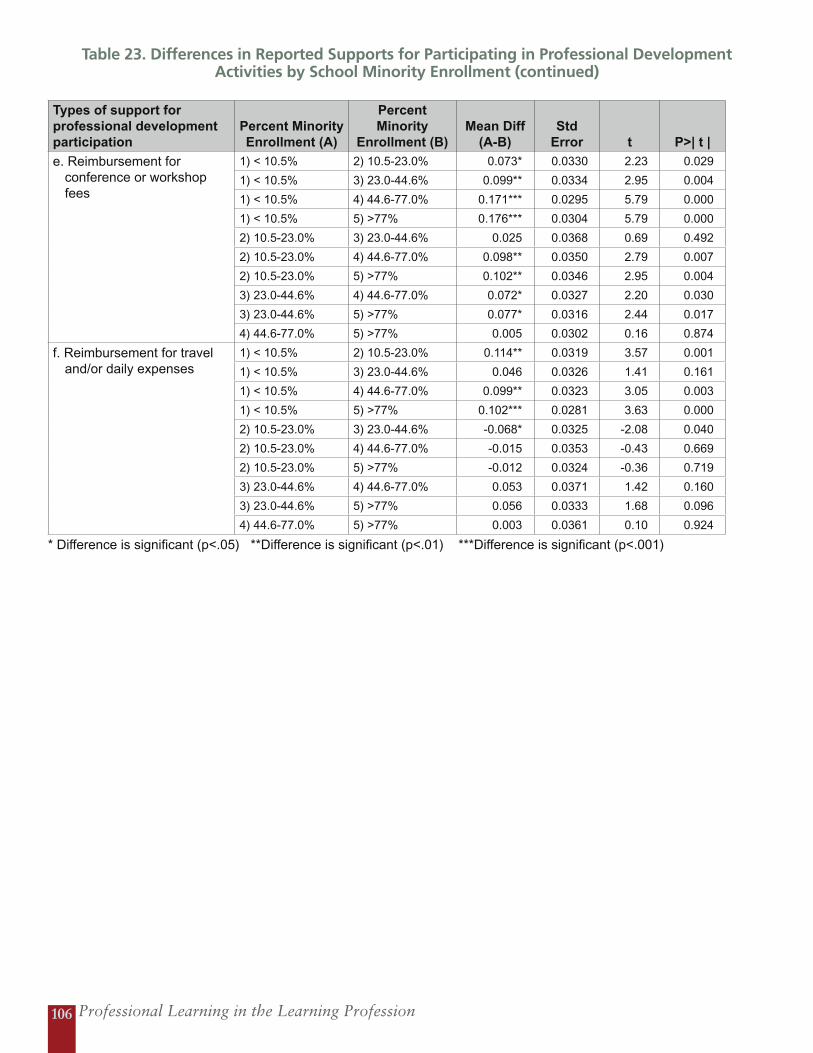
Professional Learning in the Learning Profession106
Table 23. Differences in Reported Supports for Participating in Professional Development Activities by School Minority Enrollment (continued)
Types of support for professional development participation
Percent Minority Enrollment (A)
Percent Minority
Enrollment (B)Mean Diff
(A-B)Std
Error t P>| t |
e. Reimbursement for conference or workshop fees
1) < 10.5% 2) 10.5-23.0% 0.073* 0.0330 2.23 0.029
1) < 10.5% 3) 23.0-44.6% 0.099** 0.0334 2.95 0.004
1) < 10.5% 4) 44.6-77.0% 0.171*** 0.0295 5.79 0.000
1) < 10.5% 5) >77% 0.176*** 0.0304 5.79 0.000
2) 10.5-23.0% 3) 23.0-44.6% 0.025 0.0368 0.69 0.492
2) 10.5-23.0% 4) 44.6-77.0% 0.098** 0.0350 2.79 0.007
2) 10.5-23.0% 5) >77% 0.102** 0.0346 2.95 0.004
3) 23.0-44.6% 4) 44.6-77.0% 0.072* 0.0327 2.20 0.030
3) 23.0-44.6% 5) >77% 0.077* 0.0316 2.44 0.017
4) 44.6-77.0% 5) >77% 0.005 0.0302 0.16 0.874
f. Reimbursement for travel and/or daily expenses
1) < 10.5% 2) 10.5-23.0% 0.114** 0.0319 3.57 0.001
1) < 10.5% 3) 23.0-44.6% 0.046 0.0326 1.41 0.161
1) < 10.5% 4) 44.6-77.0% 0.099** 0.0323 3.05 0.003
1) < 10.5% 5) >77% 0.102*** 0.0281 3.63 0.000
2) 10.5-23.0% 3) 23.0-44.6% -0.068* 0.0325 -2.08 0.040
2) 10.5-23.0% 4) 44.6-77.0% -0.015 0.0353 -0.43 0.669
2) 10.5-23.0% 5) >77% -0.012 0.0324 -0.36 0.719
3) 23.0-44.6% 4) 44.6-77.0% 0.053 0.0371 1.42 0.160
3) 23.0-44.6% 5) >77% 0.056 0.0333 1.68 0.096
4) 44.6-77.0% 5) >77% 0.003 0.0361 0.10 0.924
* Difference is significant (p<.05) **Difference is significant (p<.01) ***Difference is significant (p<.001)
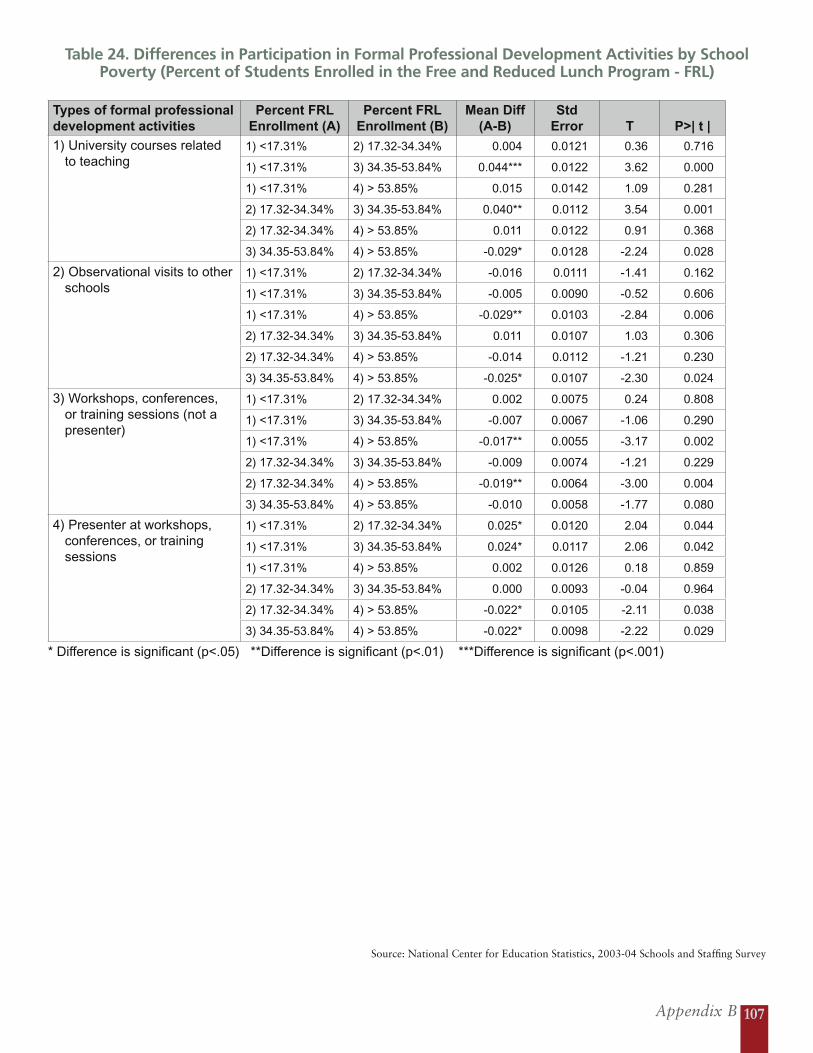
Appendix B 107
Source: National Center for Education Statistics, 2003-04 Schools and Staffing Survey
Table 24. Differences in Participation in Formal Professional Development Activities by School Poverty (Percent of Students Enrolled in the Free and Reduced Lunch Program - FRL)
Types of formal professional development activities
Percent FRL Enrollment (A)
Percent FRL Enrollment (B)
Mean Diff (A-B)
Std Error T P>| t |
1) University courses related to teaching
1) <17.31% 2) 17.32-34.34% 0.004 0.0121 0.36 0.716
1) <17.31% 3) 34.35-53.84% 0.044*** 0.0122 3.62 0.000
1) <17.31% 4) > 53.85% 0.015 0.0142 1.09 0.281
2) 17.32-34.34% 3) 34.35-53.84% 0.040** 0.0112 3.54 0.001
2) 17.32-34.34% 4) > 53.85% 0.011 0.0122 0.91 0.368
3) 34.35-53.84% 4) > 53.85% -0.029* 0.0128 -2.24 0.028
2) Observational visits to other schools
1) <17.31% 2) 17.32-34.34% -0.016 0.0111 -1.41 0.162
1) <17.31% 3) 34.35-53.84% -0.005 0.0090 -0.52 0.606
1) <17.31% 4) > 53.85% -0.029** 0.0103 -2.84 0.006
2) 17.32-34.34% 3) 34.35-53.84% 0.011 0.0107 1.03 0.306
2) 17.32-34.34% 4) > 53.85% -0.014 0.0112 -1.21 0.230
3) 34.35-53.84% 4) > 53.85% -0.025* 0.0107 -2.30 0.024
3) Workshops, conferences, or training sessions (not a presenter)
1) <17.31% 2) 17.32-34.34% 0.002 0.0075 0.24 0.808
1) <17.31% 3) 34.35-53.84% -0.007 0.0067 -1.06 0.290
1) <17.31% 4) > 53.85% -0.017** 0.0055 -3.17 0.002
2) 17.32-34.34% 3) 34.35-53.84% -0.009 0.0074 -1.21 0.229
2) 17.32-34.34% 4) > 53.85% -0.019** 0.0064 -3.00 0.004
3) 34.35-53.84% 4) > 53.85% -0.010 0.0058 -1.77 0.080
4) Presenter at workshops, conferences, or training sessions
1) <17.31% 2) 17.32-34.34% 0.025* 0.0120 2.04 0.044
1) <17.31% 3) 34.35-53.84% 0.024* 0.0117 2.06 0.042
1) <17.31% 4) > 53.85% 0.002 0.0126 0.18 0.859
2) 17.32-34.34% 3) 34.35-53.84% 0.000 0.0093 -0.04 0.964
2) 17.32-34.34% 4) > 53.85% -0.022* 0.0105 -2.11 0.038
3) 34.35-53.84% 4) > 53.85% -0.022* 0.0098 -2.22 0.029
* Difference is significant (p<.05) **Difference is significant (p<.01) ***Difference is significant (p<.001)

Professional Learning in the Learning Profession108
Table 25. Differences in Participation in Professional Development on 4 Topics by School Poverty (Percent of Students Enrolled in the Free and Reduced Lunch Program - FRL)
Topic of professional development activities
Percent FRL Enrollment (A)
Percent FRL Enrollment (B)
Mean Diff (A-B)
Std Error t P>| t |
1) the content of the subject(s) they teach
1) <17.31% 2) 17.32-34.34% 0.000 0.0088 0.04 0.965
1) <17.31% 3) 34.35-53.84% -0.005 0.0086 -0.59 0.558
1) <17.31% 4) > 53.85% -0.035** 0.0099 -3.53 0.001
2) 17.32-34.34% 3) 34.35-53.84% -0.005 0.0082 -0.66 0.509
2) 17.32-34.34% 4) > 53.85% -0.035*** 0.0073 -4.83 0.000
3) 34.35-53.84% 4) > 53.85% -0.030*** 0.0081 -3.69 0.000
2) uses of computers for instruction
1) <17.31% 2) 17.32-34.34% 0.011 0.0130 0.82 0.414
1) <17.31% 3) 34.35-53.84% 0.025 0.0128 1.94 0.056
1) <17.31% 4) > 53.85% 0.025 0.0133 1.89 0.062
2) 17.32-34.34% 3) 34.35-53.84% 0.014 0.0134 1.06 0.292
2) 17.32-34.34% 4) > 53.85% 0.014 0.0123 1.17 0.243
3) 34.35-53.84% 4) > 53.85% 0.000 0.0152 0.02 0.986
3) reading instruction 1) <17.31% 2) 17.32-34.34% -0.031* 0.0145 -2.13 0.036
1) <17.31% 3) 34.35-53.84% -0.077*** 0.0137 -5.64 0.000
1) <17.31% 4) > 53.85% -0.164*** 0.0125 -13.18 0.000
2) 17.32-34.34% 3) 34.35-53.84% -0.046** 0.0162 -2.86 0.005
2) 17.32-34.34% 4) > 53.85% -0.133*** 0.0143 -9.34 0.000
3) 34.35-53.84% 4) > 53.85% -0.087*** 0.0118 -7.37 0.000
4) student discipline and management in the classroom
1) <17.31% 2) 17.32-34.34% -0.034* 0.0153 -2.24 0.028
1) <17.31% 3) 34.35-53.84% -0.075*** 0.0143 -5.24 0.000
1) <17.31% 4) > 53.85% -0.099*** 0.0152 -6.51 0.000
2) 17.32-34.34% 3) 34.35-53.84% -0.041** 0.0141 -2.89 0.005
2) 17.32-34.34% 4) > 53.85% -0.065*** 0.0128 -5.08 0.000
3) 34.35-53.84% 4) > 53.85% -0.024 0.0131 -1.84 0.069
* Difference is significant (p<.05) **Difference is significant (p<.01) ***Difference is significant (p<.001)
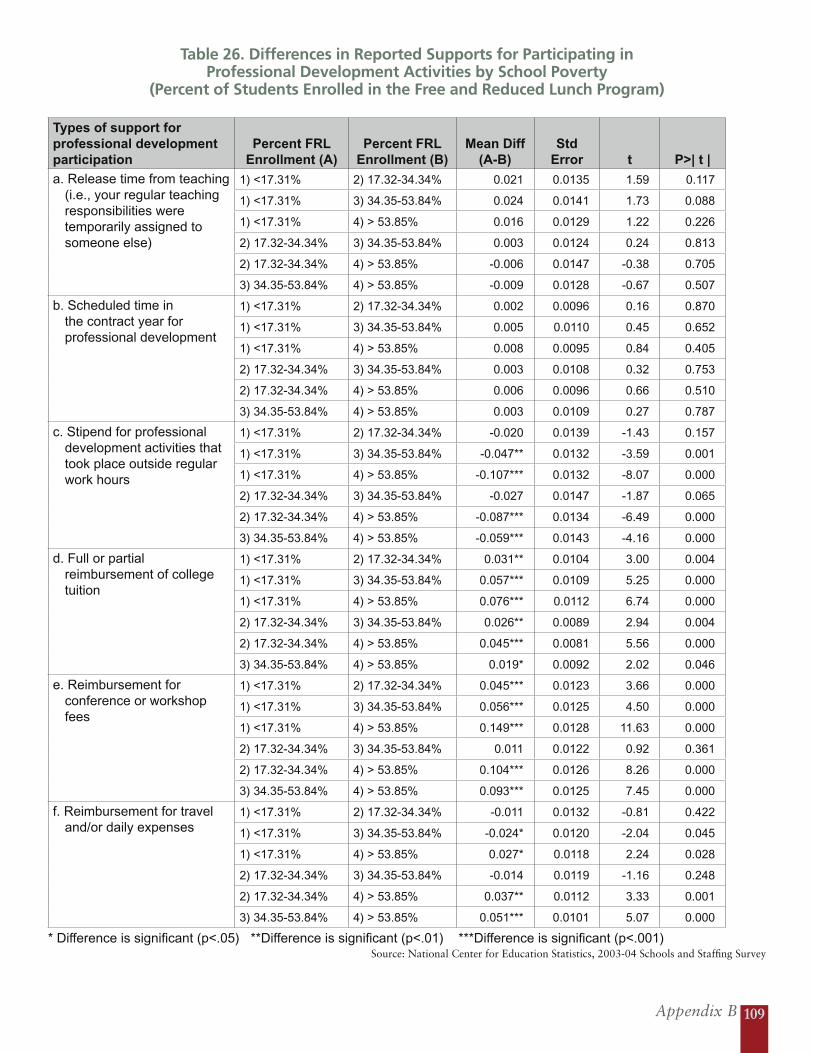
Appendix B 109
Source: National Center for Education Statistics, 2003-04 Schools and Staffing Survey
Table 26. Differences in Reported Supports for Participating in Professional Development Activities by School Poverty
(Percent of Students Enrolled in the Free and Reduced Lunch Program)
Types of support for professional development participation
Percent FRL Enrollment (A)
Percent FRL Enrollment (B)
Mean Diff (A-B)
Std Error t P>| t |
a. Release time from teaching (i.e., your regular teaching responsibilities were temporarily assigned to someone else)
1) <17.31% 2) 17.32-34.34% 0.021 0.0135 1.59 0.117
1) <17.31% 3) 34.35-53.84% 0.024 0.0141 1.73 0.088
1) <17.31% 4) > 53.85% 0.016 0.0129 1.22 0.226
2) 17.32-34.34% 3) 34.35-53.84% 0.003 0.0124 0.24 0.813
2) 17.32-34.34% 4) > 53.85% -0.006 0.0147 -0.38 0.705
3) 34.35-53.84% 4) > 53.85% -0.009 0.0128 -0.67 0.507
b. Scheduled time in the contract year for professional development
1) <17.31% 2) 17.32-34.34% 0.002 0.0096 0.16 0.870
1) <17.31% 3) 34.35-53.84% 0.005 0.0110 0.45 0.652
1) <17.31% 4) > 53.85% 0.008 0.0095 0.84 0.405
2) 17.32-34.34% 3) 34.35-53.84% 0.003 0.0108 0.32 0.753
2) 17.32-34.34% 4) > 53.85% 0.006 0.0096 0.66 0.510
3) 34.35-53.84% 4) > 53.85% 0.003 0.0109 0.27 0.787
c. Stipend for professional development activities that took place outside regular work hours
1) <17.31% 2) 17.32-34.34% -0.020 0.0139 -1.43 0.157
1) <17.31% 3) 34.35-53.84% -0.047** 0.0132 -3.59 0.001
1) <17.31% 4) > 53.85% -0.107*** 0.0132 -8.07 0.000
2) 17.32-34.34% 3) 34.35-53.84% -0.027 0.0147 -1.87 0.065
2) 17.32-34.34% 4) > 53.85% -0.087*** 0.0134 -6.49 0.000
3) 34.35-53.84% 4) > 53.85% -0.059*** 0.0143 -4.16 0.000
d. Full or partial reimbursement of college tuition
1) <17.31% 2) 17.32-34.34% 0.031** 0.0104 3.00 0.004
1) <17.31% 3) 34.35-53.84% 0.057*** 0.0109 5.25 0.000
1) <17.31% 4) > 53.85% 0.076*** 0.0112 6.74 0.000
2) 17.32-34.34% 3) 34.35-53.84% 0.026** 0.0089 2.94 0.004
2) 17.32-34.34% 4) > 53.85% 0.045*** 0.0081 5.56 0.000
3) 34.35-53.84% 4) > 53.85% 0.019* 0.0092 2.02 0.046
e. Reimbursement for conference or workshop fees
1) <17.31% 2) 17.32-34.34% 0.045*** 0.0123 3.66 0.000
1) <17.31% 3) 34.35-53.84% 0.056*** 0.0125 4.50 0.000
1) <17.31% 4) > 53.85% 0.149*** 0.0128 11.63 0.000
2) 17.32-34.34% 3) 34.35-53.84% 0.011 0.0122 0.92 0.361
2) 17.32-34.34% 4) > 53.85% 0.104*** 0.0126 8.26 0.000
3) 34.35-53.84% 4) > 53.85% 0.093*** 0.0125 7.45 0.000
f. Reimbursement for travel and/or daily expenses
1) <17.31% 2) 17.32-34.34% -0.011 0.0132 -0.81 0.422
1) <17.31% 3) 34.35-53.84% -0.024* 0.0120 -2.04 0.045
1) <17.31% 4) > 53.85% 0.027* 0.0118 2.24 0.028
2) 17.32-34.34% 3) 34.35-53.84% -0.014 0.0119 -1.16 0.248
2) 17.32-34.34% 4) > 53.85% 0.037** 0.0112 3.33 0.001
3) 34.35-53.84% 4) > 53.85% 0.051*** 0.0101 5.07 0.000
* Difference is significant (p<.05) **Difference is significant (p<.01) ***Difference is significant (p<.001)

Professional Learning in the Learning Profession110
Table 27. Differences in Participation in Formal Professional Development Activities by School LEP (Limited English Proficient) Enrollment
Types of formal professional development activities
Percent LEP Enrollment (A)
Percent LEP Enrollment (B)
Mean Diff (A-B)
Std Error t P>| t |
1) University courses related to teaching
1) 0% 2) 0.0-2.5% -0.009 0.0134 -0.66 0.514
1) 0% 3) 2.5-5.0% -0.001 0.0127 -0.11 0.914
1) 0% 4) 5.0-10.0% -0.007 0.0160 -0.47 0.640
1) 0% 5) >10.0% -0.043*** 0.0103 -4.20 0.000
2) 0.0-2.5% 3) 2.5-5.0% 0.007 0.0180 0.41 0.682
2) 0.0-2.5% 4) 5.0-10.0% 0.001 0.0173 0.07 0.941
2) 0.0-2.5% 5) >10.0% -0.035* 0.0138 -2.50 0.014
3) 2.5-5.0% 4) 5.0-10.0% -0.006 0.0197 -0.31 0.757
3) 2.5-5.0% 5) >10.0% -0.042** 0.0156 -2.69 0.008
4) 5.0-10.0% 5) >10.0% -0.036* 0.0176 -2.03 0.045
2) Observational visits to other schools
1) 0% 2) 0.0-2.5% 0.037** 0.0113 3.27 0.002
1) 0% 3) 2.5-5.0% -0.006 0.0165 -0.38 0.705
1) 0% 4) 5.0-10.0% -0.004 0.0134 -0.29 0.775
1) 0% 5) >10.0% -0.052*** 0.0091 -5.73 0.000
2) 0.0-2.5% 3) 2.5-5.0% -0.043* 0.0176 -2.45 0.016
2) 0.0-2.5% 4) 5.0-10.0% -0.041* 0.0169 -2.41 0.018
2) 0.0-2.5% 5) >10.0% -0.089*** 0.0135 -6.61 0.000
3) 2.5-5.0% 4) 5.0-10.0% 0.002 0.0191 0.13 0.900
3) 2.5-5.0% 5) >10.0% -0.046** 0.0167 -2.75 0.007
4) 5.0-10.0% 5) >10.0% -0.048** 0.0150 -3.22 0.002
3) Workshops, conferences, or training sessions (not a presenter)
1) 0% 2) 0.0-2.5% -0.021 0.0133 -1.58 0.118
1) 0% 3) 2.5-5.0% -0.031 0.0165 -1.91 0.060
1) 0% 4) 5.0-10.0% -0.019 0.0138 -1.39 0.169
1) 0% 5) >10.0% -0.035*** 0.0093 -3.75 0.000
2) 0.0-2.5% 3) 2.5-5.0% -0.011 0.0191 -0.55 0.583
2) 0.0-2.5% 4) 5.0-10.0% 0.002 0.0160 0.11 0.909
2) 0.0-2.5% 5) >10.0% -0.014 0.0139 -0.99 0.324
3) 2.5-5.0% 4) 5.0-10.0% 0.012 0.0191 0.64 0.521
3) 2.5-5.0% 5) >10.0% -0.003 0.0170 -0.19 0.847
4) 5.0-10.0% 5) >10.0% -0.016 0.0138 -1.13 0.263
4) Presenter at workshops, conferences, or training sessions
1) 0% 2) 0.0-2.5% 0.005 0.0098 0.50 0.620
1) 0% 3) 2.5-5.0% -0.004 0.0104 -0.41 0.685
1) 0% 4) 5.0-10.0% -0.006 0.0087 -0.75 0.458
1) 0% 5) >10.0% -0.014* 0.0055 -2.48 0.015
2) 0.0-2.5% 3) 2.5-5.0% -0.009 0.0134 -0.68 0.499
2) 0.0-2.5% 4) 5.0-10.0% -0.011 0.0115 -0.99 0.325
2) 0.0-2.5% 5) >10.0% -0.019* 0.0092 -2.01 0.047
3) 2.5-5.0% 4) 5.0-10.0% -0.002 0.0131 -0.17 0.864
3) 2.5-5.0% 5) >10.0% -0.009 0.0093 -1.01 0.315
4) 5.0-10.0% 5) >10.0% -0.007 0.0090 -0.79 0.430
* Difference is significant (p<.05) **Difference is significant (p<.01) ***Difference is significant (p<.001)
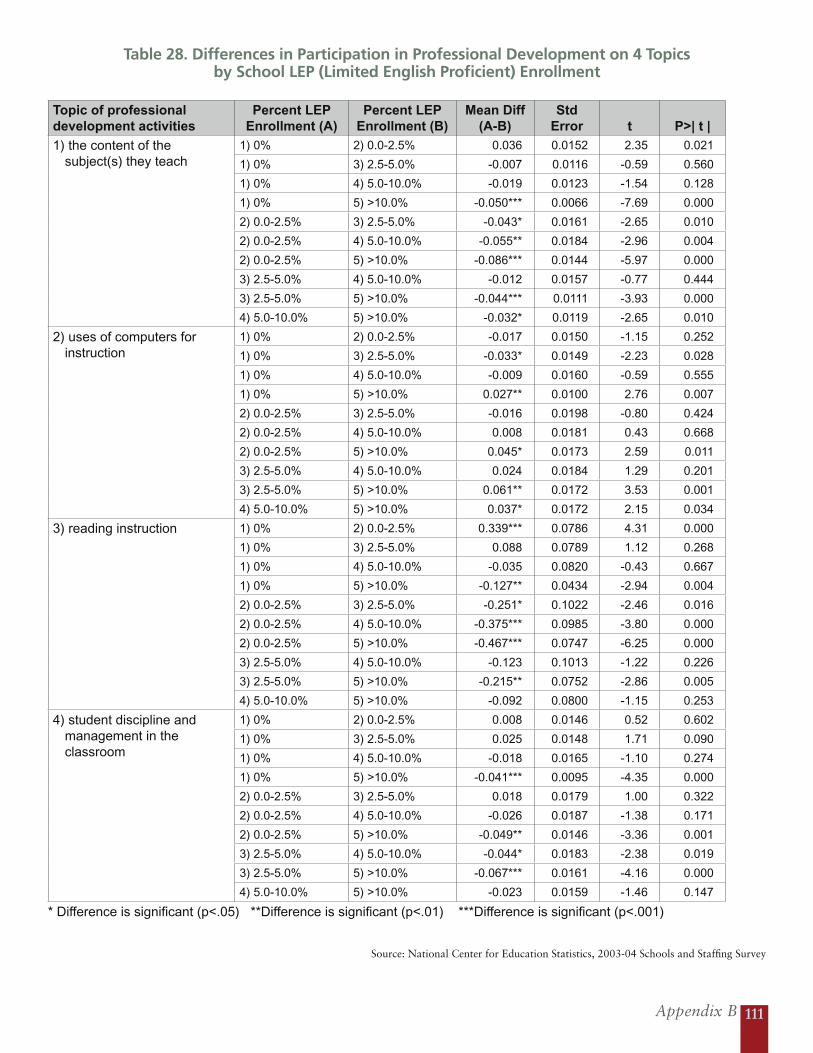
Appendix B 111
Source: National Center for Education Statistics, 2003-04 Schools and Staffing Survey
Table 28. Differences in Participation in Professional Development on 4 Topics by School LEP (Limited English Proficient) Enrollment
Topic of professional development activities
Percent LEP Enrollment (A)
Percent LEP Enrollment (B)
Mean Diff (A-B)
Std Error t P>| t |
1) the content of the subject(s) they teach
1) 0% 2) 0.0-2.5% 0.036 0.0152 2.35 0.021
1) 0% 3) 2.5-5.0% -0.007 0.0116 -0.59 0.560
1) 0% 4) 5.0-10.0% -0.019 0.0123 -1.54 0.128
1) 0% 5) >10.0% -0.050*** 0.0066 -7.69 0.000
2) 0.0-2.5% 3) 2.5-5.0% -0.043* 0.0161 -2.65 0.010
2) 0.0-2.5% 4) 5.0-10.0% -0.055** 0.0184 -2.96 0.004
2) 0.0-2.5% 5) >10.0% -0.086*** 0.0144 -5.97 0.000
3) 2.5-5.0% 4) 5.0-10.0% -0.012 0.0157 -0.77 0.444
3) 2.5-5.0% 5) >10.0% -0.044*** 0.0111 -3.93 0.000
4) 5.0-10.0% 5) >10.0% -0.032* 0.0119 -2.65 0.010
2) uses of computers for instruction
1) 0% 2) 0.0-2.5% -0.017 0.0150 -1.15 0.252
1) 0% 3) 2.5-5.0% -0.033* 0.0149 -2.23 0.028
1) 0% 4) 5.0-10.0% -0.009 0.0160 -0.59 0.555
1) 0% 5) >10.0% 0.027** 0.0100 2.76 0.007
2) 0.0-2.5% 3) 2.5-5.0% -0.016 0.0198 -0.80 0.424
2) 0.0-2.5% 4) 5.0-10.0% 0.008 0.0181 0.43 0.668
2) 0.0-2.5% 5) >10.0% 0.045* 0.0173 2.59 0.011
3) 2.5-5.0% 4) 5.0-10.0% 0.024 0.0184 1.29 0.201
3) 2.5-5.0% 5) >10.0% 0.061** 0.0172 3.53 0.001
4) 5.0-10.0% 5) >10.0% 0.037* 0.0172 2.15 0.034
3) reading instruction 1) 0% 2) 0.0-2.5% 0.339*** 0.0786 4.31 0.000
1) 0% 3) 2.5-5.0% 0.088 0.0789 1.12 0.268
1) 0% 4) 5.0-10.0% -0.035 0.0820 -0.43 0.667
1) 0% 5) >10.0% -0.127** 0.0434 -2.94 0.004
2) 0.0-2.5% 3) 2.5-5.0% -0.251* 0.1022 -2.46 0.016
2) 0.0-2.5% 4) 5.0-10.0% -0.375*** 0.0985 -3.80 0.000
2) 0.0-2.5% 5) >10.0% -0.467*** 0.0747 -6.25 0.000
3) 2.5-5.0% 4) 5.0-10.0% -0.123 0.1013 -1.22 0.226
3) 2.5-5.0% 5) >10.0% -0.215** 0.0752 -2.86 0.005
4) 5.0-10.0% 5) >10.0% -0.092 0.0800 -1.15 0.253
4) student discipline and management in the classroom
1) 0% 2) 0.0-2.5% 0.008 0.0146 0.52 0.602
1) 0% 3) 2.5-5.0% 0.025 0.0148 1.71 0.090
1) 0% 4) 5.0-10.0% -0.018 0.0165 -1.10 0.274
1) 0% 5) >10.0% -0.041*** 0.0095 -4.35 0.000
2) 0.0-2.5% 3) 2.5-5.0% 0.018 0.0179 1.00 0.322
2) 0.0-2.5% 4) 5.0-10.0% -0.026 0.0187 -1.38 0.171
2) 0.0-2.5% 5) >10.0% -0.049** 0.0146 -3.36 0.001
3) 2.5-5.0% 4) 5.0-10.0% -0.044* 0.0183 -2.38 0.019
3) 2.5-5.0% 5) >10.0% -0.067*** 0.0161 -4.16 0.000
4) 5.0-10.0% 5) >10.0% -0.023 0.0159 -1.46 0.147
* Difference is significant (p<.05) **Difference is significant (p<.01) ***Difference is significant (p<.001)
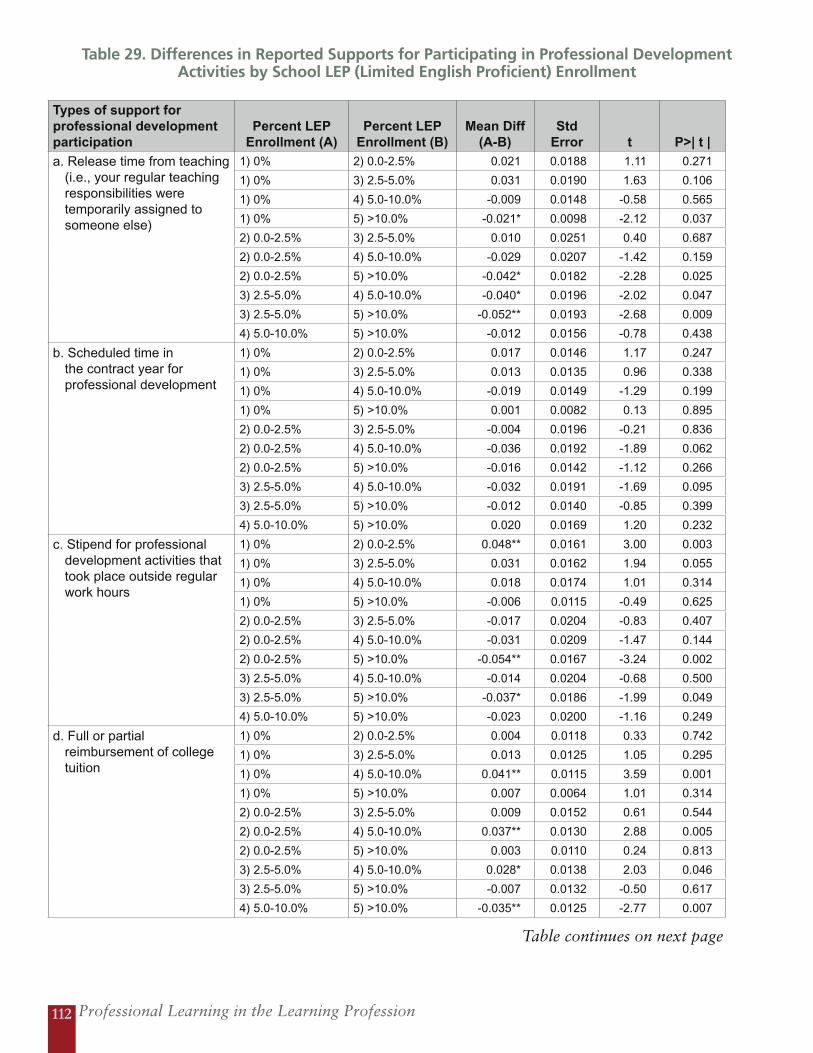
Professional Learning in the Learning Profession112
Table 29. Differences in Reported Supports for Participating in Professional Development Activities by School LEP (Limited English Proficient) Enrollment
Types of support for professional development participation
Percent LEP Enrollment (A)
Percent LEP Enrollment (B)
Mean Diff (A-B)
Std Error t P>| t |
a. Release time from teaching (i.e., your regular teaching responsibilities were temporarily assigned to someone else)
1) 0% 2) 0.0-2.5% 0.021 0.0188 1.11 0.271
1) 0% 3) 2.5-5.0% 0.031 0.0190 1.63 0.106
1) 0% 4) 5.0-10.0% -0.009 0.0148 -0.58 0.565
1) 0% 5) >10.0% -0.021* 0.0098 -2.12 0.037
2) 0.0-2.5% 3) 2.5-5.0% 0.010 0.0251 0.40 0.687
2) 0.0-2.5% 4) 5.0-10.0% -0.029 0.0207 -1.42 0.159
2) 0.0-2.5% 5) >10.0% -0.042* 0.0182 -2.28 0.025
3) 2.5-5.0% 4) 5.0-10.0% -0.040* 0.0196 -2.02 0.047
3) 2.5-5.0% 5) >10.0% -0.052** 0.0193 -2.68 0.009
4) 5.0-10.0% 5) >10.0% -0.012 0.0156 -0.78 0.438
b. Scheduled time in the contract year for professional development
1) 0% 2) 0.0-2.5% 0.017 0.0146 1.17 0.247
1) 0% 3) 2.5-5.0% 0.013 0.0135 0.96 0.338
1) 0% 4) 5.0-10.0% -0.019 0.0149 -1.29 0.199
1) 0% 5) >10.0% 0.001 0.0082 0.13 0.895
2) 0.0-2.5% 3) 2.5-5.0% -0.004 0.0196 -0.21 0.836
2) 0.0-2.5% 4) 5.0-10.0% -0.036 0.0192 -1.89 0.062
2) 0.0-2.5% 5) >10.0% -0.016 0.0142 -1.12 0.266
3) 2.5-5.0% 4) 5.0-10.0% -0.032 0.0191 -1.69 0.095
3) 2.5-5.0% 5) >10.0% -0.012 0.0140 -0.85 0.399
4) 5.0-10.0% 5) >10.0% 0.020 0.0169 1.20 0.232
c. Stipend for professional development activities that took place outside regular work hours
1) 0% 2) 0.0-2.5% 0.048** 0.0161 3.00 0.003
1) 0% 3) 2.5-5.0% 0.031 0.0162 1.94 0.055
1) 0% 4) 5.0-10.0% 0.018 0.0174 1.01 0.314
1) 0% 5) >10.0% -0.006 0.0115 -0.49 0.625
2) 0.0-2.5% 3) 2.5-5.0% -0.017 0.0204 -0.83 0.407
2) 0.0-2.5% 4) 5.0-10.0% -0.031 0.0209 -1.47 0.144
2) 0.0-2.5% 5) >10.0% -0.054** 0.0167 -3.24 0.002
3) 2.5-5.0% 4) 5.0-10.0% -0.014 0.0204 -0.68 0.500
3) 2.5-5.0% 5) >10.0% -0.037* 0.0186 -1.99 0.049
4) 5.0-10.0% 5) >10.0% -0.023 0.0200 -1.16 0.249
d. Full or partial reimbursement of college tuition
1) 0% 2) 0.0-2.5% 0.004 0.0118 0.33 0.742
1) 0% 3) 2.5-5.0% 0.013 0.0125 1.05 0.295
1) 0% 4) 5.0-10.0% 0.041** 0.0115 3.59 0.001
1) 0% 5) >10.0% 0.007 0.0064 1.01 0.314
2) 0.0-2.5% 3) 2.5-5.0% 0.009 0.0152 0.61 0.544
2) 0.0-2.5% 4) 5.0-10.0% 0.037** 0.0130 2.88 0.005
2) 0.0-2.5% 5) >10.0% 0.003 0.0110 0.24 0.813
3) 2.5-5.0% 4) 5.0-10.0% 0.028* 0.0138 2.03 0.046
3) 2.5-5.0% 5) >10.0% -0.007 0.0132 -0.50 0.617
4) 5.0-10.0% 5) >10.0% -0.035** 0.0125 -2.77 0.007
Table continues on next page
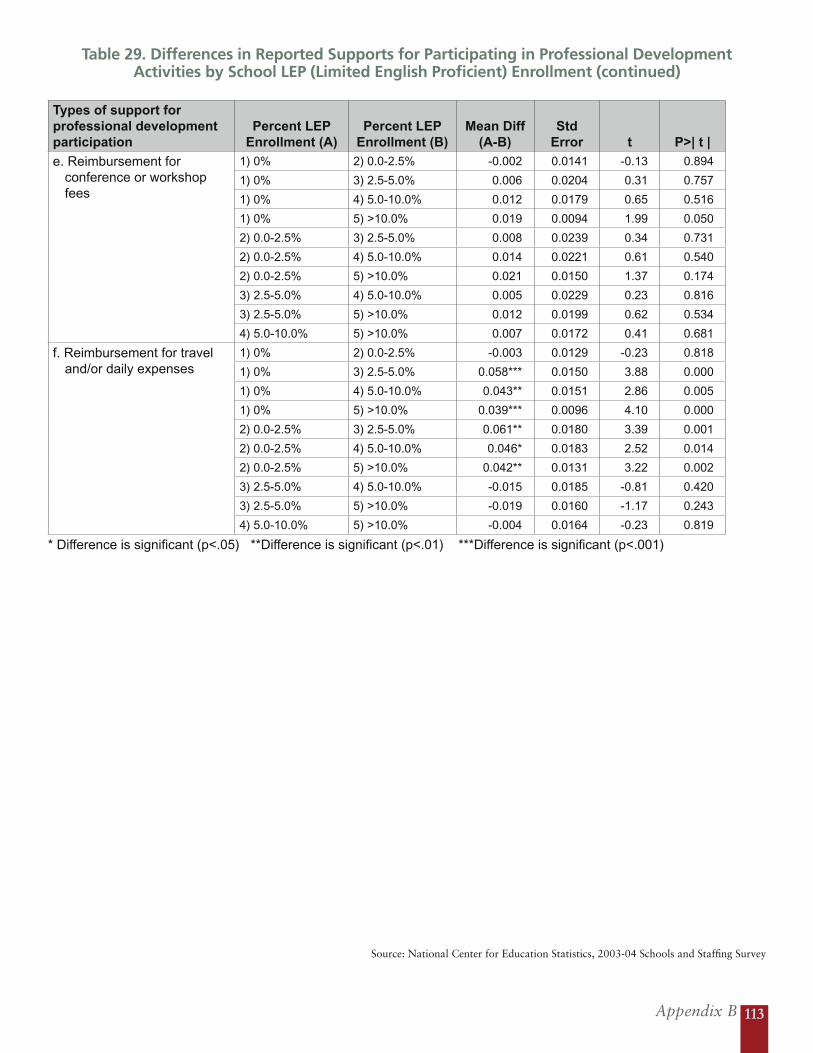
Appendix B 113
Source: National Center for Education Statistics, 2003-04 Schools and Staffing Survey
Table 29. Differences in Reported Supports for Participating in Professional Development Activities by School LEP (Limited English Proficient) Enrollment (continued)
Types of support for professional development participation
Percent LEP Enrollment (A)
Percent LEP Enrollment (B)
Mean Diff (A-B)
Std Error t P>| t |
e. Reimbursement for conference or workshop fees
1) 0% 2) 0.0-2.5% -0.002 0.0141 -0.13 0.894
1) 0% 3) 2.5-5.0% 0.006 0.0204 0.31 0.757
1) 0% 4) 5.0-10.0% 0.012 0.0179 0.65 0.516
1) 0% 5) >10.0% 0.019 0.0094 1.99 0.050
2) 0.0-2.5% 3) 2.5-5.0% 0.008 0.0239 0.34 0.731
2) 0.0-2.5% 4) 5.0-10.0% 0.014 0.0221 0.61 0.540
2) 0.0-2.5% 5) >10.0% 0.021 0.0150 1.37 0.174
3) 2.5-5.0% 4) 5.0-10.0% 0.005 0.0229 0.23 0.816
3) 2.5-5.0% 5) >10.0% 0.012 0.0199 0.62 0.534
4) 5.0-10.0% 5) >10.0% 0.007 0.0172 0.41 0.681
f. Reimbursement for travel and/or daily expenses
1) 0% 2) 0.0-2.5% -0.003 0.0129 -0.23 0.818
1) 0% 3) 2.5-5.0% 0.058*** 0.0150 3.88 0.000
1) 0% 4) 5.0-10.0% 0.043** 0.0151 2.86 0.005
1) 0% 5) >10.0% 0.039*** 0.0096 4.10 0.000
2) 0.0-2.5% 3) 2.5-5.0% 0.061** 0.0180 3.39 0.001
2) 0.0-2.5% 4) 5.0-10.0% 0.046* 0.0183 2.52 0.014
2) 0.0-2.5% 5) >10.0% 0.042** 0.0131 3.22 0.002
3) 2.5-5.0% 4) 5.0-10.0% -0.015 0.0185 -0.81 0.420
3) 2.5-5.0% 5) >10.0% -0.019 0.0160 -1.17 0.243
4) 5.0-10.0% 5) >10.0% -0.004 0.0164 -0.23 0.819
* Difference is significant (p<.05) **Difference is significant (p<.01) ***Difference is significant (p<.001)
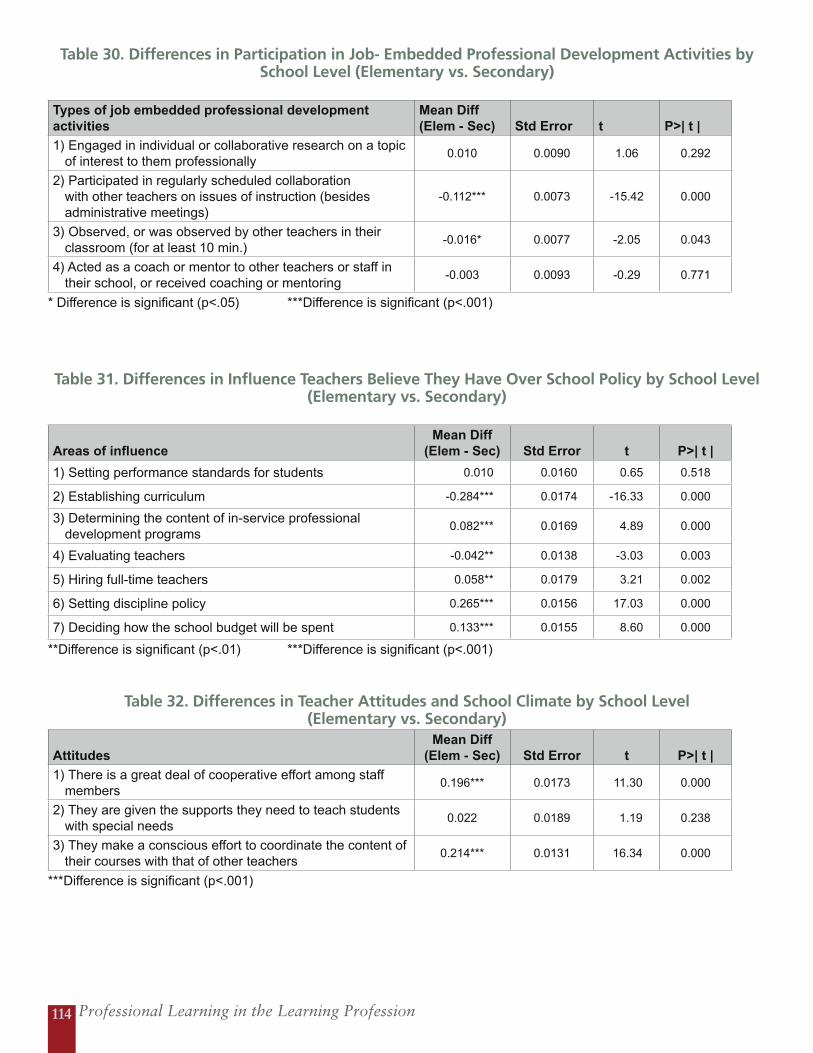
Professional Learning in the Learning Profession114
Table 30. Differences in Participation in Job- Embedded Professional Development Activities by School Level (Elementary vs. Secondary)
Types of job embedded professional development activities
Mean Diff (Elem - Sec) Std Error t P>| t |
1) Engaged in individual or collaborative research on a topic of interest to them professionally
0.010 0.0090 1.06 0.292
2) Participated in regularly scheduled collaboration with other teachers on issues of instruction (besides administrative meetings)
-0.112*** 0.0073 -15.42 0.000
3) Observed, or was observed by other teachers in their classroom (for at least 10 min.)
-0.016* 0.0077 -2.05 0.043
4) Acted as a coach or mentor to other teachers or staff in their school, or received coaching or mentoring
-0.003 0.0093 -0.29 0.771
* Difference is significant (p<.05) ***Difference is significant (p<.001)
Table 31. Differences in Influence Teachers Believe They Have Over School Policy by School Level (Elementary vs. Secondary)
Areas of influenceMean Diff
(Elem - Sec) Std Error t P>| t |
1) Setting performance standards for students 0.010 0.0160 0.65 0.518
2) Establishing curriculum -0.284*** 0.0174 -16.33 0.000
3) Determining the content of in-service professional development programs
0.082*** 0.0169 4.89 0.000
4) Evaluating teachers -0.042** 0.0138 -3.03 0.003
5) Hiring full-time teachers 0.058** 0.0179 3.21 0.002
6) Setting discipline policy 0.265*** 0.0156 17.03 0.000
7) Deciding how the school budget will be spent 0.133*** 0.0155 8.60 0.000
**Difference is significant (p<.01) ***Difference is significant (p<.001)
Table 32. Differences in Teacher Attitudes and School Climate by School Level (Elementary vs. Secondary)
Attitudes Mean Diff
(Elem - Sec) Std Error t P>| t |
1) There is a great deal of cooperative effort among staff members
0.196*** 0.0173 11.30 0.000
2) They are given the supports they need to teach students with special needs
0.022 0.0189 1.19 0.238
3) They make a conscious effort to coordinate the content of their courses with that of other teachers
0.214*** 0.0131 16.34 0.000
***Difference is significant (p<.001)
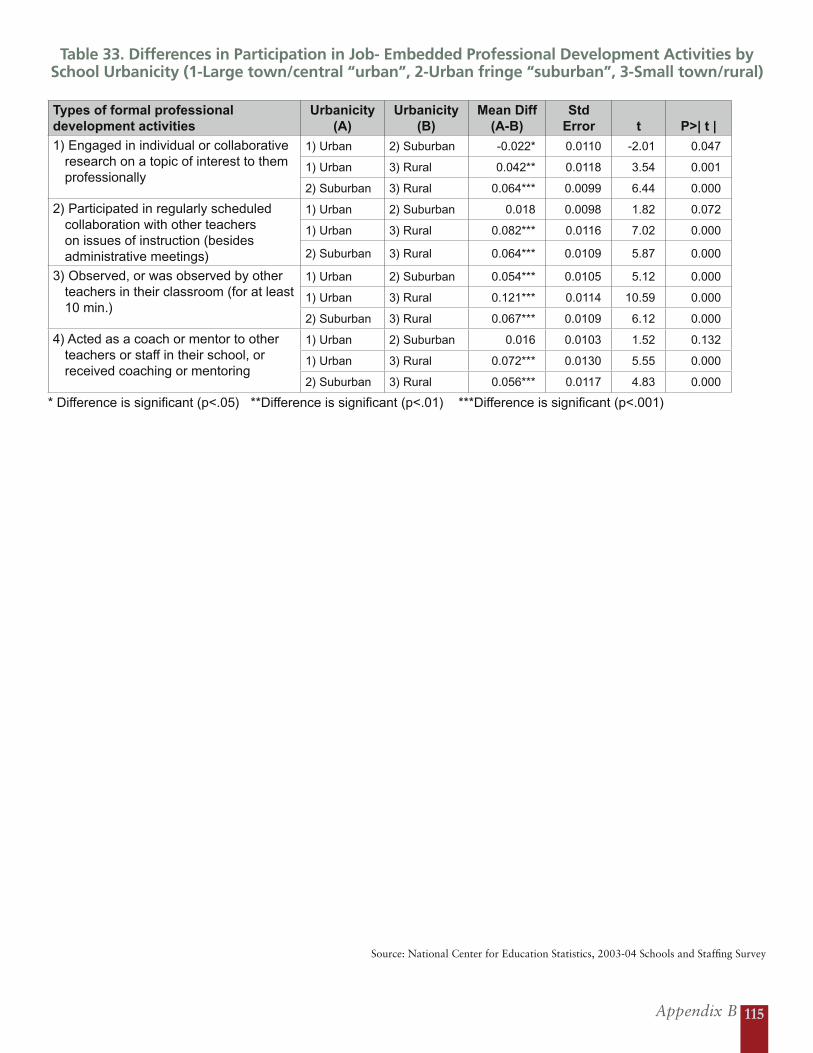
Appendix B 115
Source: National Center for Education Statistics, 2003-04 Schools and Staffing Survey
Table 33. Differences in Participation in Job- Embedded Professional Development Activities by School Urbanicity (1-Large town/central “urban”, 2-Urban fringe “suburban”, 3-Small town/rural)
Types of formal professional development activities
Urbanicity (A)
Urbanicity (B)
Mean Diff (A-B)
Std Error t P>| t |
1) Engaged in individual or collaborative research on a topic of interest to them professionally
1) Urban 2) Suburban -0.022* 0.0110 -2.01 0.047
1) Urban 3) Rural 0.042** 0.0118 3.54 0.001
2) Suburban 3) Rural 0.064*** 0.0099 6.44 0.000
2) Participated in regularly scheduled collaboration with other teachers on issues of instruction (besides administrative meetings)
1) Urban 2) Suburban 0.018 0.0098 1.82 0.072
1) Urban 3) Rural 0.082*** 0.0116 7.02 0.000
2) Suburban 3) Rural 0.064*** 0.0109 5.87 0.000
3) Observed, or was observed by other teachers in their classroom (for at least 10 min.)
1) Urban 2) Suburban 0.054*** 0.0105 5.12 0.000
1) Urban 3) Rural 0.121*** 0.0114 10.59 0.000
2) Suburban 3) Rural 0.067*** 0.0109 6.12 0.000
4) Acted as a coach or mentor to other teachers or staff in their school, or received coaching or mentoring
1) Urban 2) Suburban 0.016 0.0103 1.52 0.132
1) Urban 3) Rural 0.072*** 0.0130 5.55 0.000
2) Suburban 3) Rural 0.056*** 0.0117 4.83 0.000
* Difference is significant (p<.05) **Difference is significant (p<.01) ***Difference is significant (p<.001)
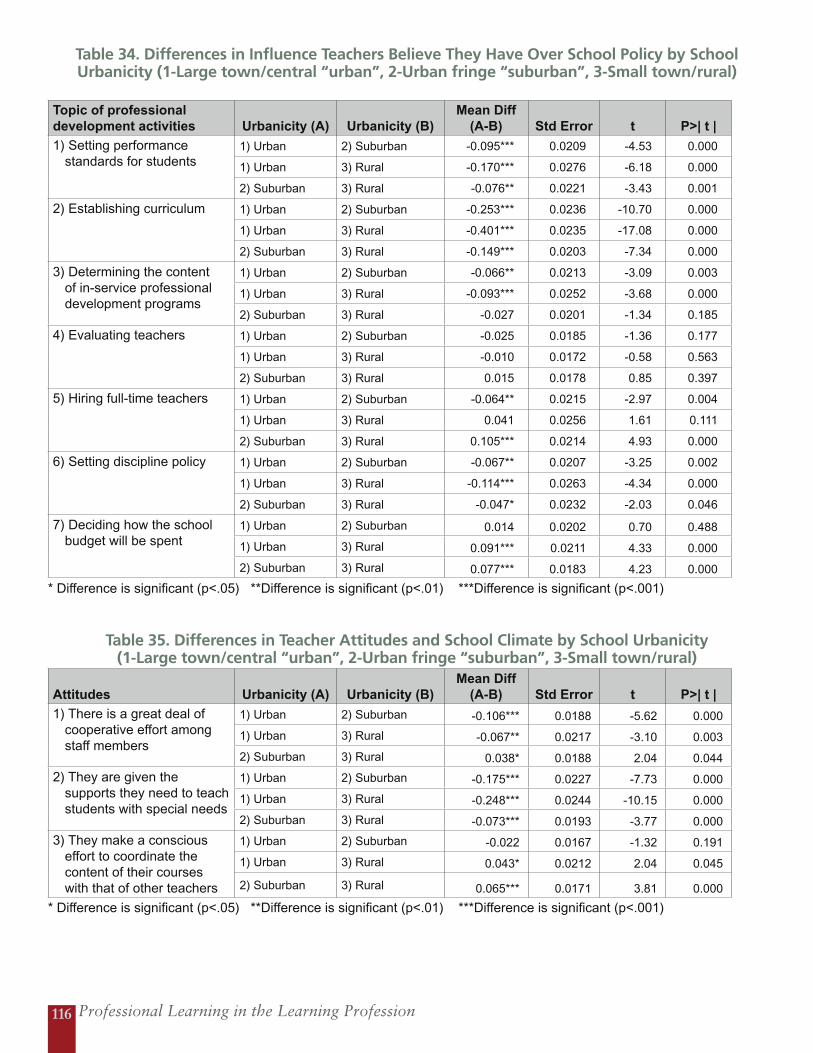
Professional Learning in the Learning Profession116
Table 34. Differences in Influence Teachers Believe They Have Over School Policy by School Urbanicity (1-Large town/central “urban”, 2-Urban fringe “suburban”, 3-Small town/rural)
Topic of professional development activities Urbanicity (A) Urbanicity (B)
Mean Diff (A-B) Std Error t P>| t |
1) Setting performance standards for students
1) Urban 2) Suburban -0.095*** 0.0209 -4.53 0.000
1) Urban 3) Rural -0.170*** 0.0276 -6.18 0.000
2) Suburban 3) Rural -0.076** 0.0221 -3.43 0.001
2) Establishing curriculum 1) Urban 2) Suburban -0.253*** 0.0236 -10.70 0.000
1) Urban 3) Rural -0.401*** 0.0235 -17.08 0.000
2) Suburban 3) Rural -0.149*** 0.0203 -7.34 0.000
3) Determining the content of in-service professional development programs
1) Urban 2) Suburban -0.066** 0.0213 -3.09 0.003
1) Urban 3) Rural -0.093*** 0.0252 -3.68 0.000
2) Suburban 3) Rural -0.027 0.0201 -1.34 0.185
4) Evaluating teachers 1) Urban 2) Suburban -0.025 0.0185 -1.36 0.177
1) Urban 3) Rural -0.010 0.0172 -0.58 0.563
2) Suburban 3) Rural 0.015 0.0178 0.85 0.397
5) Hiring full-time teachers 1) Urban 2) Suburban -0.064** 0.0215 -2.97 0.004
1) Urban 3) Rural 0.041 0.0256 1.61 0.111
2) Suburban 3) Rural 0.105*** 0.0214 4.93 0.000
6) Setting discipline policy 1) Urban 2) Suburban -0.067** 0.0207 -3.25 0.002
1) Urban 3) Rural -0.114*** 0.0263 -4.34 0.000
2) Suburban 3) Rural -0.047* 0.0232 -2.03 0.046
7) Deciding how the school budget will be spent
1) Urban 2) Suburban 0.014 0.0202 0.70 0.488
1) Urban 3) Rural 0.091*** 0.0211 4.33 0.000
2) Suburban 3) Rural 0.077*** 0.0183 4.23 0.000
* Difference is significant (p<.05) **Difference is significant (p<.01) ***Difference is significant (p<.001)
Table 35. Differences in Teacher Attitudes and School Climate by School Urbanicity (1-Large town/central “urban”, 2-Urban fringe “suburban”, 3-Small town/rural)
Attitudes Urbanicity (A) Urbanicity (B)Mean Diff
(A-B) Std Error t P>| t |
1) There is a great deal of cooperative effort among staff members
1) Urban 2) Suburban -0.106*** 0.0188 -5.62 0.000
1) Urban 3) Rural -0.067** 0.0217 -3.10 0.003
2) Suburban 3) Rural 0.038* 0.0188 2.04 0.044
2) They are given the supports they need to teach students with special needs
1) Urban 2) Suburban -0.175*** 0.0227 -7.73 0.000
1) Urban 3) Rural -0.248*** 0.0244 -10.15 0.000
2) Suburban 3) Rural -0.073*** 0.0193 -3.77 0.000
3) They make a conscious effort to coordinate the content of their courses with that of other teachers
1) Urban 2) Suburban -0.022 0.0167 -1.32 0.191
1) Urban 3) Rural 0.043* 0.0212 2.04 0.045
2) Suburban 3) Rural 0.065*** 0.0171 3.81 0.000
* Difference is significant (p<.05) **Difference is significant (p<.01) ***Difference is significant (p<.001)

Appendix B 117
Source: National Center for Education Statistics, 2003-04 Schools and Staffing Survey
Table 36. Differences in Participation in Job- Embedded Professional Development Activitiesby School Minority Enrollment
Types of job embedded professional development activities
Percent Minority
Enrollment (A)
Percent Minority
Enrollment (B)Mean Diff
(A-B)Std
Error t P>| t |
1) Engaged in individual or collaborative research on a topic of interest to them professionally
1) < 10.5% 2) 10.5-23.0% -0.002 0.0292 -0.08 0.935
1) < 10.5% 3) 23.0-44.6% 0.057 0.0308 1.86 0.066
1) < 10.5% 4) 44.6-77.0% 0.017 0.0313 0.55 0.587
1) < 10.5% 5) >77% -0.002 0.0320 -0.07 0.948
2) 10.5-23.0% 3) 23.0-44.6% 0.060 0.0312 1.91 0.059
2) 10.5-23.0% 4) 44.6-77.0% 0.019 0.0342 0.57 0.570
2) 10.5-23.0% 5) >77% 0.000 0.0346 0.01 0.993
3) 23.0-44.6% 4) 44.6-77.0% -0.040 0.0338 -1.19 0.237
3) 23.0-44.6% 5) >77% -0.059 0.0351 -1.69 0.094
4) 44.6-77.0% 5) >77% -0.019 0.0323 -0.59 0.554
2) Participated in regularly scheduled collaboration with other teachers on issues of instruction (besides administrative meetings)
1) < 10.5% 2) 10.5-23.0% -0.014 0.0308 -0.45 0.657
1) < 10.5% 3) 23.0-44.6% -0.042 0.0235 -1.78 0.078
1) < 10.5% 4) 44.6-77.0% -0.056* 0.0272 -2.08 0.041
1) < 10.5% 5) >77% -0.068* 0.0279 -2.43 0.017
2) 10.5-23.0% 3) 23.0-44.6% -0.028 0.0322 -0.88 0.383
2) 10.5-23.0% 4) 44.6-77.0% -0.043 0.0332 -1.29 0.201
2) 10.5-23.0% 5) >77% -0.054 0.0331 -1.63 0.107
3) 23.0-44.6% 4) 44.6-77.0% -0.014 0.0257 -0.56 0.575
3) 23.0-44.6% 5) >77% -0.026 0.0262 -0.98 0.328
4) 44.6-77.0% 5) >77% -0.011 0.0274 -0.41 0.683
3) Observed, or was observed by other teachers in their classroom (for at least 10 min.)
1) < 10.5% 2) 10.5-23.0% 0.054 0.0313 1.73 0.086
1) < 10.5% 3) 23.0-44.6% -0.030 0.0339 -0.88 0.382
1) < 10.5% 4) 44.6-77.0% -0.111*** 0.0304 -3.64 0.000
1) < 10.5% 5) >77% -0.120** 0.0331 -3.61 0.001
2) 10.5-23.0% 3) 23.0-44.6% -0.084** 0.0306 -2.74 0.007
2) 10.5-23.0% 4) 44.6-77.0% -0.165*** 0.0299 -5.52 0.000
2) 10.5-23.0% 5) >77% -0.174*** 0.0276 -6.31 0.000
3) 23.0-44.6% 4) 44.6-77.0% -0.081** 0.0305 -2.66 0.009
3) 23.0-44.6% 5) >77% -0.090** 0.0284 -3.17 0.002
4) 44.6-77.0% 5) >77% -0.009 0.0311 -0.29 0.775
4) Acted as a coach or mentor to other teachers or staff in their school, or received coaching or mentoring
1) < 10.5% 2) 10.5-23.0% -0.016 0.0328 -0.49 0.626
1) < 10.5% 3) 23.0-44.6% -0.087* 0.0353 -2.45 0.016
1) < 10.5% 4) 44.6-77.0% -0.147*** 0.0315 -4.66 0.000
1) < 10.5% 5) >77% -0.119*** 0.0315 -3.78 0.000
2) 10.5-23.0% 3) 23.0-44.6% -0.071* 0.0350 -2.02 0.047
2) 10.5-23.0% 4) 44.6-77.0% -0.131*** 0.0352 -3.71 0.000
2) 10.5-23.0% 5) >77% -0.103** 0.0369 -2.79 0.006
3) 23.0-44.6% 4) 44.6-77.0% -0.060 0.0365 -1.64 0.104
3) 23.0-44.6% 5) >77% -0.032 0.0378 -0.86 0.394
4) 44.6-77.0% 5) >77% 0.028 0.0326 0.85 0.400
* Difference is significant (p<.05) **Difference is significant (p<.01) ***Difference is significant (p<.001)
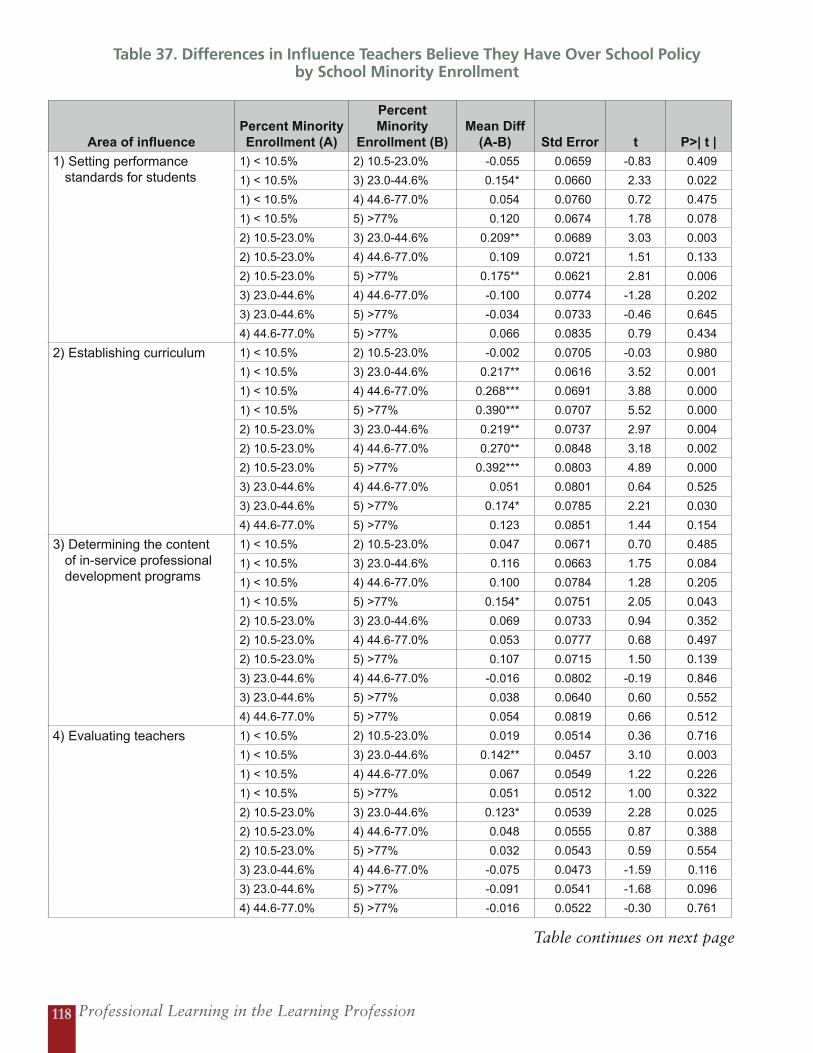
Professional Learning in the Learning Profession118
Table 37. Differences in Influence Teachers Believe They Have Over School Policy by School Minority Enrollment
Area of influencePercent Minority Enrollment (A)
Percent Minority
Enrollment (B)Mean Diff
(A-B) Std Error t P>| t |
1) Setting performance standards for students
1) < 10.5% 2) 10.5-23.0% -0.055 0.0659 -0.83 0.409
1) < 10.5% 3) 23.0-44.6% 0.154* 0.0660 2.33 0.022
1) < 10.5% 4) 44.6-77.0% 0.054 0.0760 0.72 0.475
1) < 10.5% 5) >77% 0.120 0.0674 1.78 0.078
2) 10.5-23.0% 3) 23.0-44.6% 0.209** 0.0689 3.03 0.003
2) 10.5-23.0% 4) 44.6-77.0% 0.109 0.0721 1.51 0.133
2) 10.5-23.0% 5) >77% 0.175** 0.0621 2.81 0.006
3) 23.0-44.6% 4) 44.6-77.0% -0.100 0.0774 -1.28 0.202
3) 23.0-44.6% 5) >77% -0.034 0.0733 -0.46 0.645
4) 44.6-77.0% 5) >77% 0.066 0.0835 0.79 0.434
2) Establishing curriculum 1) < 10.5% 2) 10.5-23.0% -0.002 0.0705 -0.03 0.980
1) < 10.5% 3) 23.0-44.6% 0.217** 0.0616 3.52 0.001
1) < 10.5% 4) 44.6-77.0% 0.268*** 0.0691 3.88 0.000
1) < 10.5% 5) >77% 0.390*** 0.0707 5.52 0.000
2) 10.5-23.0% 3) 23.0-44.6% 0.219** 0.0737 2.97 0.004
2) 10.5-23.0% 4) 44.6-77.0% 0.270** 0.0848 3.18 0.002
2) 10.5-23.0% 5) >77% 0.392*** 0.0803 4.89 0.000
3) 23.0-44.6% 4) 44.6-77.0% 0.051 0.0801 0.64 0.525
3) 23.0-44.6% 5) >77% 0.174* 0.0785 2.21 0.030
4) 44.6-77.0% 5) >77% 0.123 0.0851 1.44 0.154
3) Determining the content of in-service professional development programs
1) < 10.5% 2) 10.5-23.0% 0.047 0.0671 0.70 0.485
1) < 10.5% 3) 23.0-44.6% 0.116 0.0663 1.75 0.084
1) < 10.5% 4) 44.6-77.0% 0.100 0.0784 1.28 0.205
1) < 10.5% 5) >77% 0.154* 0.0751 2.05 0.043
2) 10.5-23.0% 3) 23.0-44.6% 0.069 0.0733 0.94 0.352
2) 10.5-23.0% 4) 44.6-77.0% 0.053 0.0777 0.68 0.497
2) 10.5-23.0% 5) >77% 0.107 0.0715 1.50 0.139
3) 23.0-44.6% 4) 44.6-77.0% -0.016 0.0802 -0.19 0.846
3) 23.0-44.6% 5) >77% 0.038 0.0640 0.60 0.552
4) 44.6-77.0% 5) >77% 0.054 0.0819 0.66 0.512
4) Evaluating teachers 1) < 10.5% 2) 10.5-23.0% 0.019 0.0514 0.36 0.716
1) < 10.5% 3) 23.0-44.6% 0.142** 0.0457 3.10 0.003
1) < 10.5% 4) 44.6-77.0% 0.067 0.0549 1.22 0.226
1) < 10.5% 5) >77% 0.051 0.0512 1.00 0.322
2) 10.5-23.0% 3) 23.0-44.6% 0.123* 0.0539 2.28 0.025
2) 10.5-23.0% 4) 44.6-77.0% 0.048 0.0555 0.87 0.388
2) 10.5-23.0% 5) >77% 0.032 0.0543 0.59 0.554
3) 23.0-44.6% 4) 44.6-77.0% -0.075 0.0473 -1.59 0.116
3) 23.0-44.6% 5) >77% -0.091 0.0541 -1.68 0.096
4) 44.6-77.0% 5) >77% -0.016 0.0522 -0.30 0.761
Table continues on next page
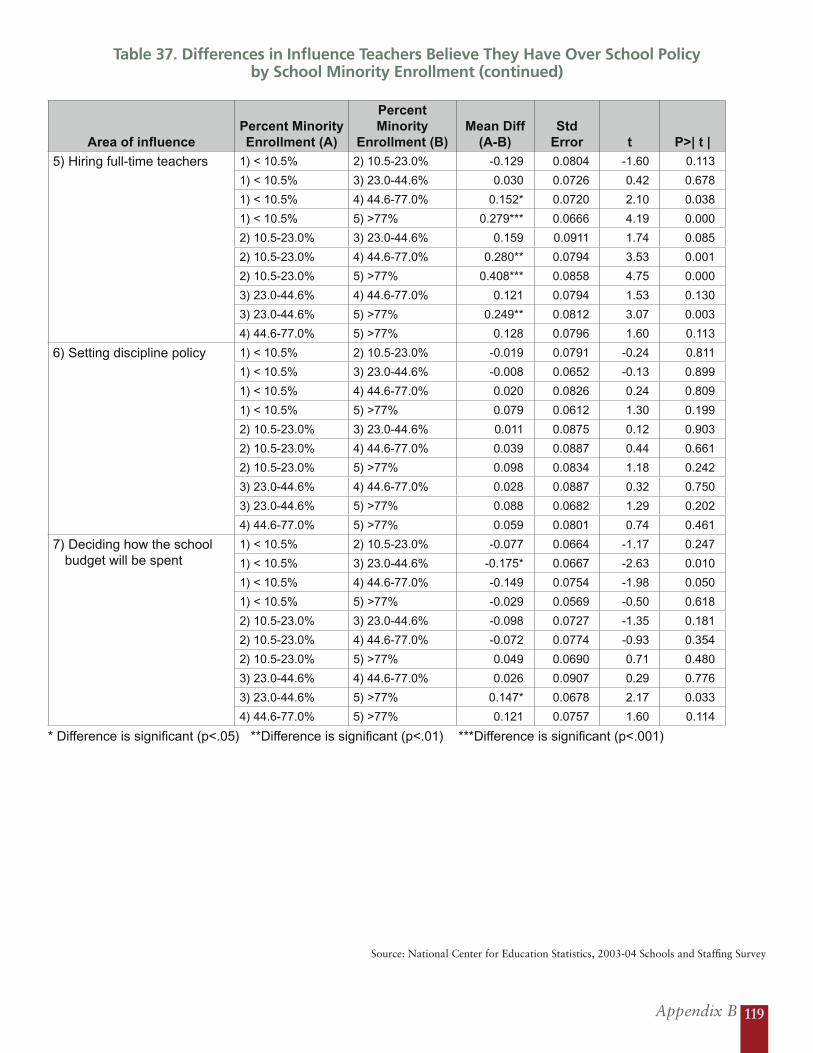
Appendix B 119
Source: National Center for Education Statistics, 2003-04 Schools and Staffing Survey
Table 37. Differences in Influence Teachers Believe They Have Over School Policy by School Minority Enrollment (continued)
Area of influencePercent Minority Enrollment (A)
Percent Minority
Enrollment (B)Mean Diff
(A-B)Std
Error t P>| t |
5) Hiring full-time teachers
1) < 10.5% 2) 10.5-23.0% -0.129 0.0804 -1.60 0.113
1) < 10.5% 3) 23.0-44.6% 0.030 0.0726 0.42 0.678
1) < 10.5% 4) 44.6-77.0% 0.152* 0.0720 2.10 0.038
1) < 10.5% 5) >77% 0.279*** 0.0666 4.19 0.000
2) 10.5-23.0% 3) 23.0-44.6% 0.159 0.0911 1.74 0.085
2) 10.5-23.0% 4) 44.6-77.0% 0.280** 0.0794 3.53 0.001
2) 10.5-23.0% 5) >77% 0.408*** 0.0858 4.75 0.000
3) 23.0-44.6% 4) 44.6-77.0% 0.121 0.0794 1.53 0.130
3) 23.0-44.6% 5) >77% 0.249** 0.0812 3.07 0.003
4) 44.6-77.0% 5) >77% 0.128 0.0796 1.60 0.113
6) Setting discipline policy 1) < 10.5% 2) 10.5-23.0% -0.019 0.0791 -0.24 0.811
1) < 10.5% 3) 23.0-44.6% -0.008 0.0652 -0.13 0.899
1) < 10.5% 4) 44.6-77.0% 0.020 0.0826 0.24 0.809
1) < 10.5% 5) >77% 0.079 0.0612 1.30 0.199
2) 10.5-23.0% 3) 23.0-44.6% 0.011 0.0875 0.12 0.903
2) 10.5-23.0% 4) 44.6-77.0% 0.039 0.0887 0.44 0.661
2) 10.5-23.0% 5) >77% 0.098 0.0834 1.18 0.242
3) 23.0-44.6% 4) 44.6-77.0% 0.028 0.0887 0.32 0.750
3) 23.0-44.6% 5) >77% 0.088 0.0682 1.29 0.202
4) 44.6-77.0% 5) >77% 0.059 0.0801 0.74 0.461
7) Deciding how the school budget will be spent
1) < 10.5% 2) 10.5-23.0% -0.077 0.0664 -1.17 0.247
1) < 10.5% 3) 23.0-44.6% -0.175* 0.0667 -2.63 0.010
1) < 10.5% 4) 44.6-77.0% -0.149 0.0754 -1.98 0.050
1) < 10.5% 5) >77% -0.029 0.0569 -0.50 0.618
2) 10.5-23.0% 3) 23.0-44.6% -0.098 0.0727 -1.35 0.181
2) 10.5-23.0% 4) 44.6-77.0% -0.072 0.0774 -0.93 0.354
2) 10.5-23.0% 5) >77% 0.049 0.0690 0.71 0.480
3) 23.0-44.6% 4) 44.6-77.0% 0.026 0.0907 0.29 0.776
3) 23.0-44.6% 5) >77% 0.147* 0.0678 2.17 0.033
4) 44.6-77.0% 5) >77% 0.121 0.0757 1.60 0.114
* Difference is significant (p<.05) **Difference is significant (p<.01) ***Difference is significant (p<.001)
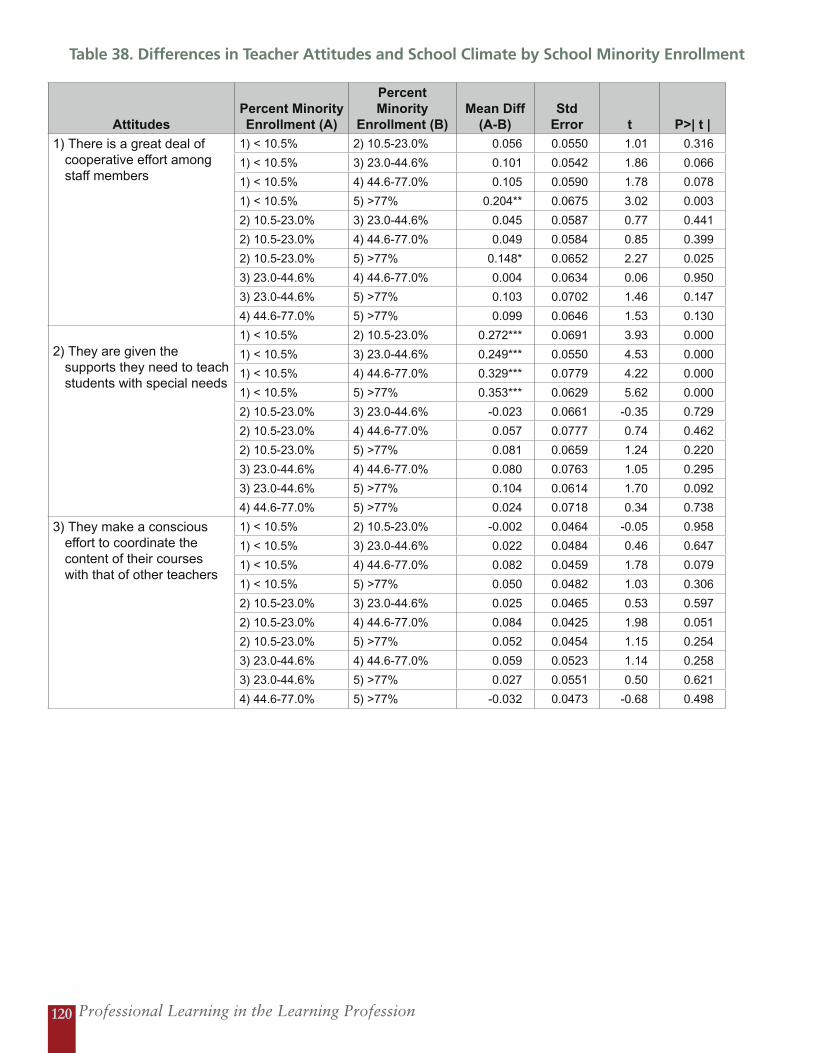
Professional Learning in the Learning Profession120
Table 38. Differences in Teacher Attitudes and School Climate by School Minority Enrollment
Attitudes Percent Minority Enrollment (A)
Percent Minority
Enrollment (B)Mean Diff
(A-B)Std
Error t P>| t |
1) There is a great deal of cooperative effort among staff members
1) < 10.5% 2) 10.5-23.0% 0.056 0.0550 1.01 0.316
1) < 10.5% 3) 23.0-44.6% 0.101 0.0542 1.86 0.066
1) < 10.5% 4) 44.6-77.0% 0.105 0.0590 1.78 0.078
1) < 10.5% 5) >77% 0.204** 0.0675 3.02 0.003
2) 10.5-23.0% 3) 23.0-44.6% 0.045 0.0587 0.77 0.441
2) 10.5-23.0% 4) 44.6-77.0% 0.049 0.0584 0.85 0.399
2) 10.5-23.0% 5) >77% 0.148* 0.0652 2.27 0.025
3) 23.0-44.6% 4) 44.6-77.0% 0.004 0.0634 0.06 0.950
3) 23.0-44.6% 5) >77% 0.103 0.0702 1.46 0.147
4) 44.6-77.0% 5) >77% 0.099 0.0646 1.53 0.130
2) They are given the supports they need to teach students with special needs
1) < 10.5% 2) 10.5-23.0% 0.272*** 0.0691 3.93 0.000
1) < 10.5% 3) 23.0-44.6% 0.249*** 0.0550 4.53 0.000
1) < 10.5% 4) 44.6-77.0% 0.329*** 0.0779 4.22 0.000
1) < 10.5% 5) >77% 0.353*** 0.0629 5.62 0.000
2) 10.5-23.0% 3) 23.0-44.6% -0.023 0.0661 -0.35 0.729
2) 10.5-23.0% 4) 44.6-77.0% 0.057 0.0777 0.74 0.462
2) 10.5-23.0% 5) >77% 0.081 0.0659 1.24 0.220
3) 23.0-44.6% 4) 44.6-77.0% 0.080 0.0763 1.05 0.295
3) 23.0-44.6% 5) >77% 0.104 0.0614 1.70 0.092
4) 44.6-77.0% 5) >77% 0.024 0.0718 0.34 0.738
3) They make a conscious effort to coordinate the content of their courses with that of other teachers
1) < 10.5% 2) 10.5-23.0% -0.002 0.0464 -0.05 0.958
1) < 10.5% 3) 23.0-44.6% 0.022 0.0484 0.46 0.647
1) < 10.5% 4) 44.6-77.0% 0.082 0.0459 1.78 0.079
1) < 10.5% 5) >77% 0.050 0.0482 1.03 0.306
2) 10.5-23.0% 3) 23.0-44.6% 0.025 0.0465 0.53 0.597
2) 10.5-23.0% 4) 44.6-77.0% 0.084 0.0425 1.98 0.051
2) 10.5-23.0% 5) >77% 0.052 0.0454 1.15 0.254
3) 23.0-44.6% 4) 44.6-77.0% 0.059 0.0523 1.14 0.258
3) 23.0-44.6% 5) >77% 0.027 0.0551 0.50 0.621
4) 44.6-77.0% 5) >77% -0.032 0.0473 -0.68 0.498
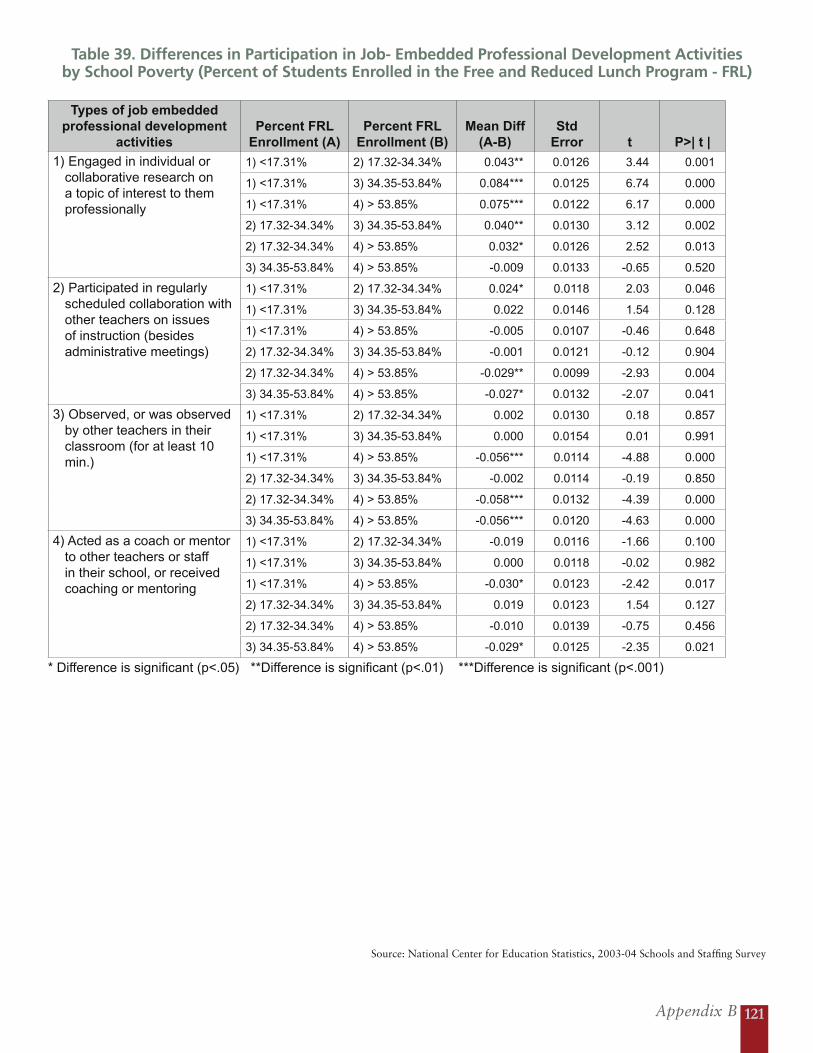
Appendix B 121
Source: National Center for Education Statistics, 2003-04 Schools and Staffing Survey
Table 39. Differences in Participation in Job- Embedded Professional Development Activities by School Poverty (Percent of Students Enrolled in the Free and Reduced Lunch Program - FRL)
Types of job embedded professional development
activitiesPercent FRL
Enrollment (A)Percent FRL
Enrollment (B)Mean Diff
(A-B)Std
Error t P>| t |
1) Engaged in individual or collaborative research on a topic of interest to them professionally
1) <17.31% 2) 17.32-34.34% 0.043** 0.0126 3.44 0.001
1) <17.31% 3) 34.35-53.84% 0.084*** 0.0125 6.74 0.000
1) <17.31% 4) > 53.85% 0.075*** 0.0122 6.17 0.000
2) 17.32-34.34% 3) 34.35-53.84% 0.040** 0.0130 3.12 0.002
2) 17.32-34.34% 4) > 53.85% 0.032* 0.0126 2.52 0.013
3) 34.35-53.84% 4) > 53.85% -0.009 0.0133 -0.65 0.520
2) Participated in regularly scheduled collaboration with other teachers on issues of instruction (besides administrative meetings)
1) <17.31% 2) 17.32-34.34% 0.024* 0.0118 2.03 0.046
1) <17.31% 3) 34.35-53.84% 0.022 0.0146 1.54 0.128
1) <17.31% 4) > 53.85% -0.005 0.0107 -0.46 0.648
2) 17.32-34.34% 3) 34.35-53.84% -0.001 0.0121 -0.12 0.904
2) 17.32-34.34% 4) > 53.85% -0.029** 0.0099 -2.93 0.004
3) 34.35-53.84% 4) > 53.85% -0.027* 0.0132 -2.07 0.041
3) Observed, or was observed by other teachers in their classroom (for at least 10 min.)
1) <17.31% 2) 17.32-34.34% 0.002 0.0130 0.18 0.857
1) <17.31% 3) 34.35-53.84% 0.000 0.0154 0.01 0.991
1) <17.31% 4) > 53.85% -0.056*** 0.0114 -4.88 0.000
2) 17.32-34.34% 3) 34.35-53.84% -0.002 0.0114 -0.19 0.850
2) 17.32-34.34% 4) > 53.85% -0.058*** 0.0132 -4.39 0.000
3) 34.35-53.84% 4) > 53.85% -0.056*** 0.0120 -4.63 0.000
4) Acted as a coach or mentor to other teachers or staff in their school, or received coaching or mentoring
1) <17.31% 2) 17.32-34.34% -0.019 0.0116 -1.66 0.100
1) <17.31% 3) 34.35-53.84% 0.000 0.0118 -0.02 0.982
1) <17.31% 4) > 53.85% -0.030* 0.0123 -2.42 0.017
2) 17.32-34.34% 3) 34.35-53.84% 0.019 0.0123 1.54 0.127
2) 17.32-34.34% 4) > 53.85% -0.010 0.0139 -0.75 0.456
3) 34.35-53.84% 4) > 53.85% -0.029* 0.0125 -2.35 0.021
* Difference is significant (p<.05) **Difference is significant (p<.01) ***Difference is significant (p<.001)
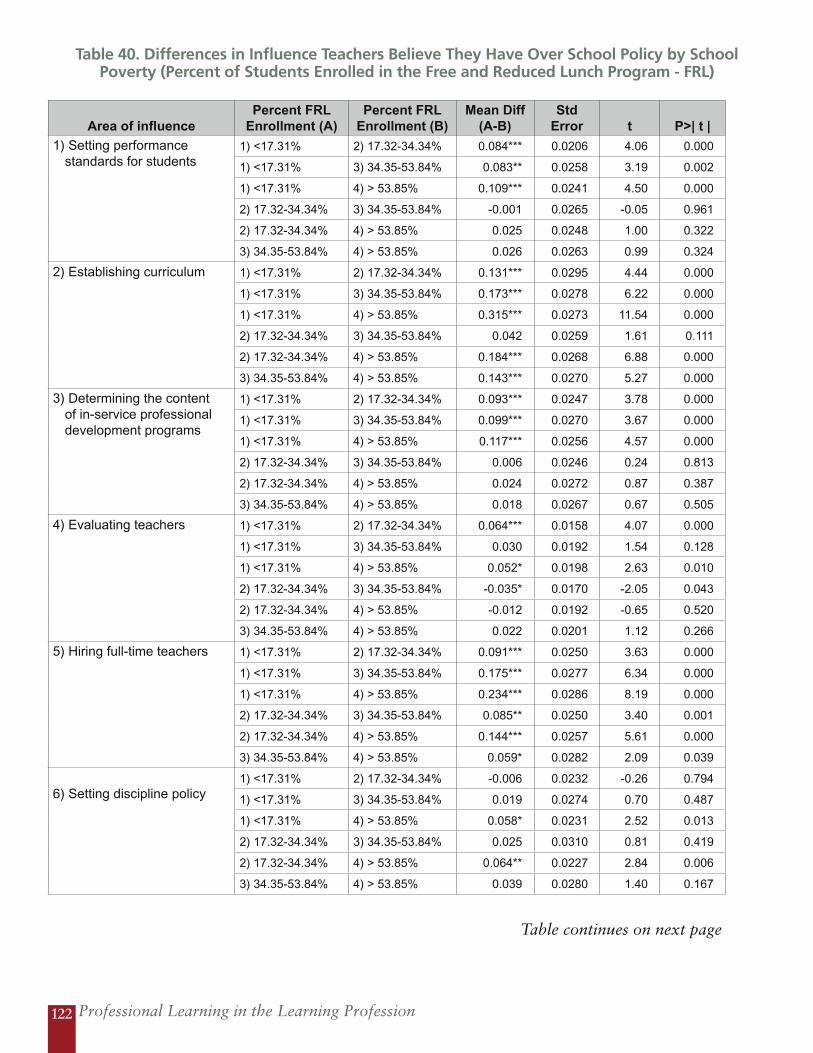
Professional Learning in the Learning Profession122
Table 40. Differences in Influence Teachers Believe They Have Over School Policy by School Poverty (Percent of Students Enrolled in the Free and Reduced Lunch Program - FRL)
Area of influencePercent FRL
Enrollment (A)Percent FRL
Enrollment (B)Mean Diff
(A-B)Std
Error t P>| t |
1) Setting performance standards for students
1) <17.31% 2) 17.32-34.34% 0.084*** 0.0206 4.06 0.000
1) <17.31% 3) 34.35-53.84% 0.083** 0.0258 3.19 0.002
1) <17.31% 4) > 53.85% 0.109*** 0.0241 4.50 0.000
2) 17.32-34.34% 3) 34.35-53.84% -0.001 0.0265 -0.05 0.961
2) 17.32-34.34% 4) > 53.85% 0.025 0.0248 1.00 0.322
3) 34.35-53.84% 4) > 53.85% 0.026 0.0263 0.99 0.324
2) Establishing curriculum 1) <17.31% 2) 17.32-34.34% 0.131*** 0.0295 4.44 0.000
1) <17.31% 3) 34.35-53.84% 0.173*** 0.0278 6.22 0.000
1) <17.31% 4) > 53.85% 0.315*** 0.0273 11.54 0.000
2) 17.32-34.34% 3) 34.35-53.84% 0.042 0.0259 1.61 0.111
2) 17.32-34.34% 4) > 53.85% 0.184*** 0.0268 6.88 0.000
3) 34.35-53.84% 4) > 53.85% 0.143*** 0.0270 5.27 0.000
3) Determining the content of in-service professional development programs
1) <17.31% 2) 17.32-34.34% 0.093*** 0.0247 3.78 0.000
1) <17.31% 3) 34.35-53.84% 0.099*** 0.0270 3.67 0.000
1) <17.31% 4) > 53.85% 0.117*** 0.0256 4.57 0.000
2) 17.32-34.34% 3) 34.35-53.84% 0.006 0.0246 0.24 0.813
2) 17.32-34.34% 4) > 53.85% 0.024 0.0272 0.87 0.387
3) 34.35-53.84% 4) > 53.85% 0.018 0.0267 0.67 0.505
4) Evaluating teachers 1) <17.31% 2) 17.32-34.34% 0.064*** 0.0158 4.07 0.000
1) <17.31% 3) 34.35-53.84% 0.030 0.0192 1.54 0.128
1) <17.31% 4) > 53.85% 0.052* 0.0198 2.63 0.010
2) 17.32-34.34% 3) 34.35-53.84% -0.035* 0.0170 -2.05 0.043
2) 17.32-34.34% 4) > 53.85% -0.012 0.0192 -0.65 0.520
3) 34.35-53.84% 4) > 53.85% 0.022 0.0201 1.12 0.266
5) Hiring full-time teachers
1) <17.31% 2) 17.32-34.34% 0.091*** 0.0250 3.63 0.000
1) <17.31% 3) 34.35-53.84% 0.175*** 0.0277 6.34 0.000
1) <17.31% 4) > 53.85% 0.234*** 0.0286 8.19 0.000
2) 17.32-34.34% 3) 34.35-53.84% 0.085** 0.0250 3.40 0.001
2) 17.32-34.34% 4) > 53.85% 0.144*** 0.0257 5.61 0.000
3) 34.35-53.84% 4) > 53.85% 0.059* 0.0282 2.09 0.039
6) Setting discipline policy1) <17.31% 2) 17.32-34.34% -0.006 0.0232 -0.26 0.794
1) <17.31% 3) 34.35-53.84% 0.019 0.0274 0.70 0.487
1) <17.31% 4) > 53.85% 0.058* 0.0231 2.52 0.013
2) 17.32-34.34% 3) 34.35-53.84% 0.025 0.0310 0.81 0.419
2) 17.32-34.34% 4) > 53.85% 0.064** 0.0227 2.84 0.006
3) 34.35-53.84% 4) > 53.85% 0.039 0.0280 1.40 0.167
Table continues on next page
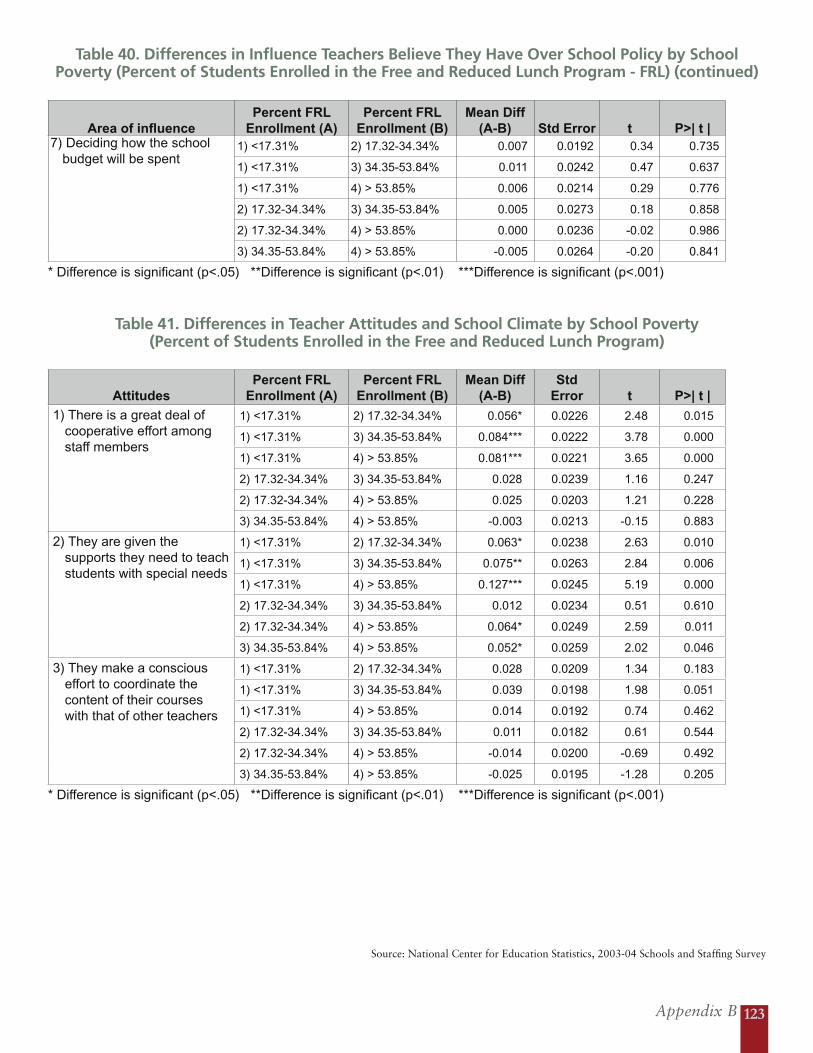
Appendix B 123
Source: National Center for Education Statistics, 2003-04 Schools and Staffing Survey
Table 40. Differences in Influence Teachers Believe They Have Over School Policy by School Poverty (Percent of Students Enrolled in the Free and Reduced Lunch Program - FRL) (continued)
Area of influencePercent FRL
Enrollment (A)Percent FRL
Enrollment (B)Mean Diff
(A-B) Std Error t P>| t |7) Deciding how the school
budget will be spent1) <17.31% 2) 17.32-34.34% 0.007 0.0192 0.34 0.735
1) <17.31% 3) 34.35-53.84% 0.011 0.0242 0.47 0.637
1) <17.31% 4) > 53.85% 0.006 0.0214 0.29 0.776
2) 17.32-34.34% 3) 34.35-53.84% 0.005 0.0273 0.18 0.858
2) 17.32-34.34% 4) > 53.85% 0.000 0.0236 -0.02 0.986
3) 34.35-53.84% 4) > 53.85% -0.005 0.0264 -0.20 0.841
* Difference is significant (p<.05) **Difference is significant (p<.01) ***Difference is significant (p<.001)
Table 41. Differences in Teacher Attitudes and School Climate by School Poverty (Percent of Students Enrolled in the Free and Reduced Lunch Program)
AttitudesPercent FRL
Enrollment (A)Percent FRL
Enrollment (B)Mean Diff
(A-B)Std
Error t P>| t |
1) There is a great deal of cooperative effort among staff members
1) <17.31% 2) 17.32-34.34% 0.056* 0.0226 2.48 0.015
1) <17.31% 3) 34.35-53.84% 0.084*** 0.0222 3.78 0.000
1) <17.31% 4) > 53.85% 0.081*** 0.0221 3.65 0.000
2) 17.32-34.34% 3) 34.35-53.84% 0.028 0.0239 1.16 0.247
2) 17.32-34.34% 4) > 53.85% 0.025 0.0203 1.21 0.228
3) 34.35-53.84% 4) > 53.85% -0.003 0.0213 -0.15 0.883
2) They are given the supports they need to teach students with special needs
1) <17.31% 2) 17.32-34.34% 0.063* 0.0238 2.63 0.010
1) <17.31% 3) 34.35-53.84% 0.075** 0.0263 2.84 0.006
1) <17.31% 4) > 53.85% 0.127*** 0.0245 5.19 0.000
2) 17.32-34.34% 3) 34.35-53.84% 0.012 0.0234 0.51 0.610
2) 17.32-34.34% 4) > 53.85% 0.064* 0.0249 2.59 0.011
3) 34.35-53.84% 4) > 53.85% 0.052* 0.0259 2.02 0.046
3) They make a conscious effort to coordinate the content of their courses with that of other teachers
1) <17.31% 2) 17.32-34.34% 0.028 0.0209 1.34 0.183
1) <17.31% 3) 34.35-53.84% 0.039 0.0198 1.98 0.051
1) <17.31% 4) > 53.85% 0.014 0.0192 0.74 0.462
2) 17.32-34.34% 3) 34.35-53.84% 0.011 0.0182 0.61 0.544
2) 17.32-34.34% 4) > 53.85% -0.014 0.0200 -0.69 0.492
3) 34.35-53.84% 4) > 53.85% -0.025 0.0195 -1.28 0.205
* Difference is significant (p<.05) **Difference is significant (p<.01) ***Difference is significant (p<.001)
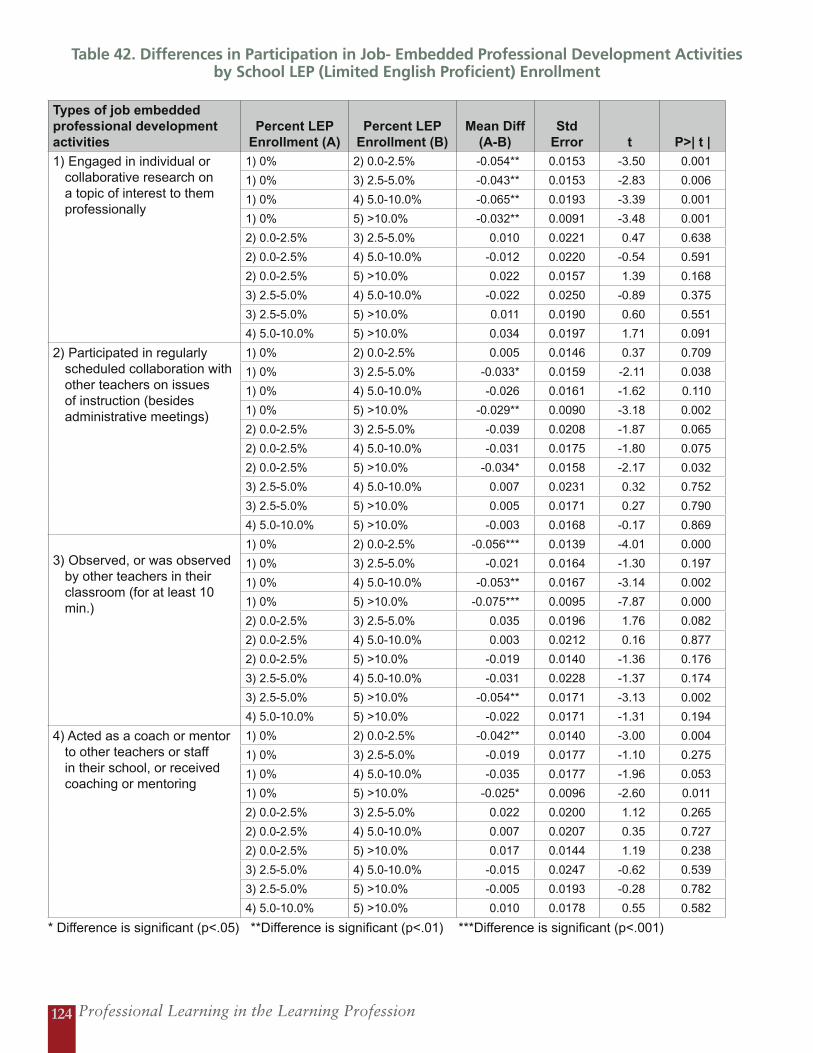
Professional Learning in the Learning Profession124
Table 42. Differences in Participation in Job- Embedded Professional Development Activities by School LEP (Limited English Proficient) Enrollment
Types of job embedded professional development activities
Percent LEP Enrollment (A)
Percent LEP Enrollment (B)
Mean Diff (A-B)
Std Error t P>| t |
1) Engaged in individual or collaborative research on a topic of interest to them professionally
1) 0% 2) 0.0-2.5% -0.054** 0.0153 -3.50 0.001
1) 0% 3) 2.5-5.0% -0.043** 0.0153 -2.83 0.006
1) 0% 4) 5.0-10.0% -0.065** 0.0193 -3.39 0.001
1) 0% 5) >10.0% -0.032** 0.0091 -3.48 0.001
2) 0.0-2.5% 3) 2.5-5.0% 0.010 0.0221 0.47 0.638
2) 0.0-2.5% 4) 5.0-10.0% -0.012 0.0220 -0.54 0.591
2) 0.0-2.5% 5) >10.0% 0.022 0.0157 1.39 0.168
3) 2.5-5.0% 4) 5.0-10.0% -0.022 0.0250 -0.89 0.375
3) 2.5-5.0% 5) >10.0% 0.011 0.0190 0.60 0.551
4) 5.0-10.0% 5) >10.0% 0.034 0.0197 1.71 0.091
2) Participated in regularly scheduled collaboration with other teachers on issues of instruction (besides administrative meetings)
1) 0% 2) 0.0-2.5% 0.005 0.0146 0.37 0.709
1) 0% 3) 2.5-5.0% -0.033* 0.0159 -2.11 0.038
1) 0% 4) 5.0-10.0% -0.026 0.0161 -1.62 0.110
1) 0% 5) >10.0% -0.029** 0.0090 -3.18 0.002
2) 0.0-2.5% 3) 2.5-5.0% -0.039 0.0208 -1.87 0.065
2) 0.0-2.5% 4) 5.0-10.0% -0.031 0.0175 -1.80 0.075
2) 0.0-2.5% 5) >10.0% -0.034* 0.0158 -2.17 0.032
3) 2.5-5.0% 4) 5.0-10.0% 0.007 0.0231 0.32 0.752
3) 2.5-5.0% 5) >10.0% 0.005 0.0171 0.27 0.790
4) 5.0-10.0% 5) >10.0% -0.003 0.0168 -0.17 0.869
3) Observed, or was observed by other teachers in their classroom (for at least 10 min.)
1) 0% 2) 0.0-2.5% -0.056*** 0.0139 -4.01 0.000
1) 0% 3) 2.5-5.0% -0.021 0.0164 -1.30 0.197
1) 0% 4) 5.0-10.0% -0.053** 0.0167 -3.14 0.002
1) 0% 5) >10.0% -0.075*** 0.0095 -7.87 0.000
2) 0.0-2.5% 3) 2.5-5.0% 0.035 0.0196 1.76 0.082
2) 0.0-2.5% 4) 5.0-10.0% 0.003 0.0212 0.16 0.877
2) 0.0-2.5% 5) >10.0% -0.019 0.0140 -1.36 0.176
3) 2.5-5.0% 4) 5.0-10.0% -0.031 0.0228 -1.37 0.174
3) 2.5-5.0% 5) >10.0% -0.054** 0.0171 -3.13 0.002
4) 5.0-10.0% 5) >10.0% -0.022 0.0171 -1.31 0.194
4) Acted as a coach or mentor to other teachers or staff in their school, or received coaching or mentoring
1) 0% 2) 0.0-2.5% -0.042** 0.0140 -3.00 0.004
1) 0% 3) 2.5-5.0% -0.019 0.0177 -1.10 0.275
1) 0% 4) 5.0-10.0% -0.035 0.0177 -1.96 0.053
1) 0% 5) >10.0% -0.025* 0.0096 -2.60 0.011
2) 0.0-2.5% 3) 2.5-5.0% 0.022 0.0200 1.12 0.265
2) 0.0-2.5% 4) 5.0-10.0% 0.007 0.0207 0.35 0.727
2) 0.0-2.5% 5) >10.0% 0.017 0.0144 1.19 0.238
3) 2.5-5.0% 4) 5.0-10.0% -0.015 0.0247 -0.62 0.539
3) 2.5-5.0% 5) >10.0% -0.005 0.0193 -0.28 0.782
4) 5.0-10.0% 5) >10.0% 0.010 0.0178 0.55 0.582
* Difference is significant (p<.05) **Difference is significant (p<.01) ***Difference is significant (p<.001)
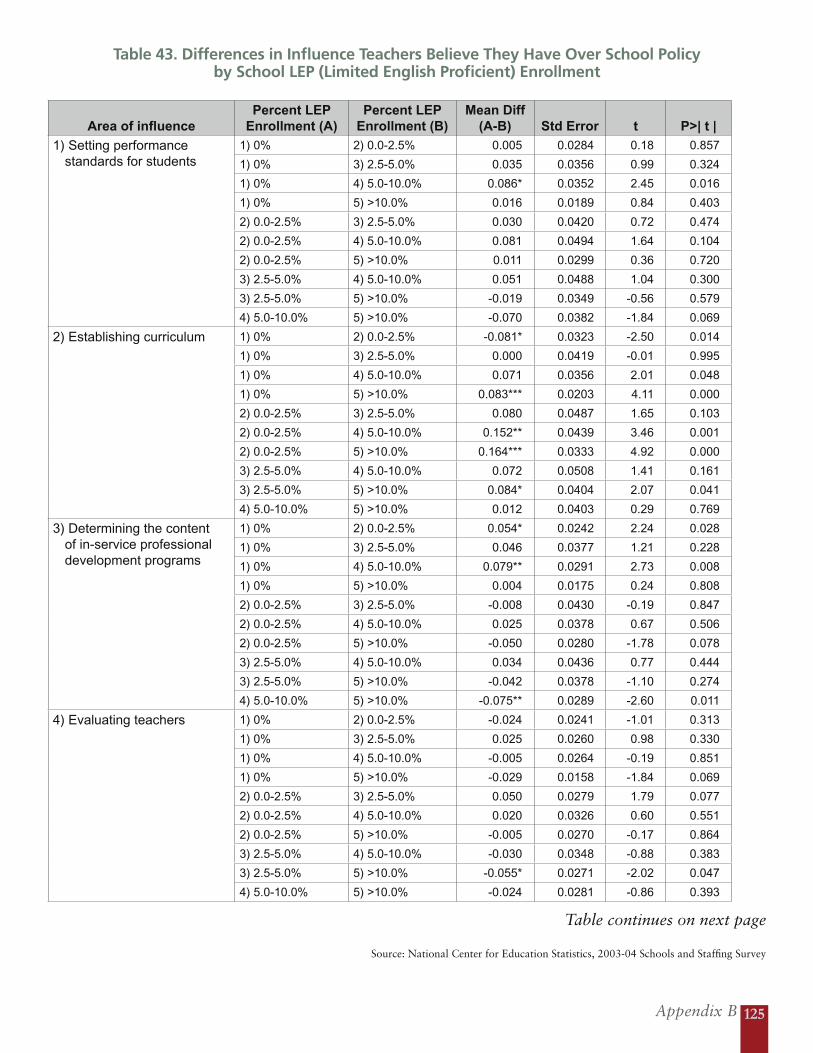
Appendix B 125
Source: National Center for Education Statistics, 2003-04 Schools and Staffing Survey
Table 43. Differences in Influence Teachers Believe They Have Over School Policy by School LEP (Limited English Proficient) Enrollment
Area of influencePercent LEP
Enrollment (A)Percent LEP
Enrollment (B)Mean Diff
(A-B) Std Error t P>| t |
1) Setting performance standards for students
1) 0% 2) 0.0-2.5% 0.005 0.0284 0.18 0.857
1) 0% 3) 2.5-5.0% 0.035 0.0356 0.99 0.324
1) 0% 4) 5.0-10.0% 0.086* 0.0352 2.45 0.016
1) 0% 5) >10.0% 0.016 0.0189 0.84 0.403
2) 0.0-2.5% 3) 2.5-5.0% 0.030 0.0420 0.72 0.474
2) 0.0-2.5% 4) 5.0-10.0% 0.081 0.0494 1.64 0.104
2) 0.0-2.5% 5) >10.0% 0.011 0.0299 0.36 0.720
3) 2.5-5.0% 4) 5.0-10.0% 0.051 0.0488 1.04 0.300
3) 2.5-5.0% 5) >10.0% -0.019 0.0349 -0.56 0.579
4) 5.0-10.0% 5) >10.0% -0.070 0.0382 -1.84 0.069
2) Establishing curriculum 1) 0% 2) 0.0-2.5% -0.081* 0.0323 -2.50 0.014
1) 0% 3) 2.5-5.0% 0.000 0.0419 -0.01 0.995
1) 0% 4) 5.0-10.0% 0.071 0.0356 2.01 0.048
1) 0% 5) >10.0% 0.083*** 0.0203 4.11 0.000
2) 0.0-2.5% 3) 2.5-5.0% 0.080 0.0487 1.65 0.103
2) 0.0-2.5% 4) 5.0-10.0% 0.152** 0.0439 3.46 0.001
2) 0.0-2.5% 5) >10.0% 0.164*** 0.0333 4.92 0.000
3) 2.5-5.0% 4) 5.0-10.0% 0.072 0.0508 1.41 0.161
3) 2.5-5.0% 5) >10.0% 0.084* 0.0404 2.07 0.041
4) 5.0-10.0% 5) >10.0% 0.012 0.0403 0.29 0.769
3) Determining the content of in-service professional development programs
1) 0% 2) 0.0-2.5% 0.054* 0.0242 2.24 0.028
1) 0% 3) 2.5-5.0% 0.046 0.0377 1.21 0.228
1) 0% 4) 5.0-10.0% 0.079** 0.0291 2.73 0.008
1) 0% 5) >10.0% 0.004 0.0175 0.24 0.808
2) 0.0-2.5% 3) 2.5-5.0% -0.008 0.0430 -0.19 0.847
2) 0.0-2.5% 4) 5.0-10.0% 0.025 0.0378 0.67 0.506
2) 0.0-2.5% 5) >10.0% -0.050 0.0280 -1.78 0.078
3) 2.5-5.0% 4) 5.0-10.0% 0.034 0.0436 0.77 0.444
3) 2.5-5.0% 5) >10.0% -0.042 0.0378 -1.10 0.274
4) 5.0-10.0% 5) >10.0% -0.075** 0.0289 -2.60 0.011
4) Evaluating teachers 1) 0% 2) 0.0-2.5% -0.024 0.0241 -1.01 0.313
1) 0% 3) 2.5-5.0% 0.025 0.0260 0.98 0.330
1) 0% 4) 5.0-10.0% -0.005 0.0264 -0.19 0.851
1) 0% 5) >10.0% -0.029 0.0158 -1.84 0.069
2) 0.0-2.5% 3) 2.5-5.0% 0.050 0.0279 1.79 0.077
2) 0.0-2.5% 4) 5.0-10.0% 0.020 0.0326 0.60 0.551
2) 0.0-2.5% 5) >10.0% -0.005 0.0270 -0.17 0.864
3) 2.5-5.0% 4) 5.0-10.0% -0.030 0.0348 -0.88 0.383
3) 2.5-5.0% 5) >10.0% -0.055* 0.0271 -2.02 0.047
4) 5.0-10.0% 5) >10.0% -0.024 0.0281 -0.86 0.393
Table continues on next page
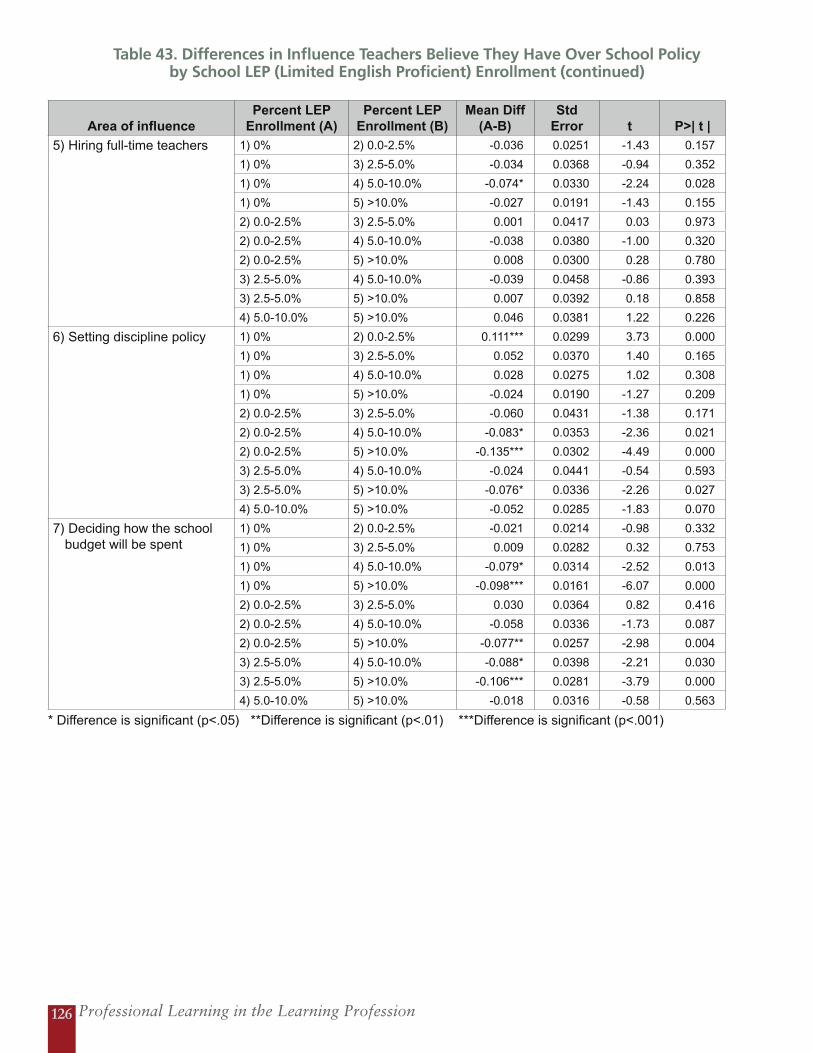
Professional Learning in the Learning Profession126
Table 43. Differences in Influence Teachers Believe They Have Over School Policy by School LEP (Limited English Proficient) Enrollment (continued)
Area of influencePercent LEP
Enrollment (A)Percent LEP
Enrollment (B)Mean Diff
(A-B)Std
Error t P>| t |
5) Hiring full-time teachers
1) 0% 2) 0.0-2.5% -0.036 0.0251 -1.43 0.157
1) 0% 3) 2.5-5.0% -0.034 0.0368 -0.94 0.352
1) 0% 4) 5.0-10.0% -0.074* 0.0330 -2.24 0.028
1) 0% 5) >10.0% -0.027 0.0191 -1.43 0.155
2) 0.0-2.5% 3) 2.5-5.0% 0.001 0.0417 0.03 0.973
2) 0.0-2.5% 4) 5.0-10.0% -0.038 0.0380 -1.00 0.320
2) 0.0-2.5% 5) >10.0% 0.008 0.0300 0.28 0.780
3) 2.5-5.0% 4) 5.0-10.0% -0.039 0.0458 -0.86 0.393
3) 2.5-5.0% 5) >10.0% 0.007 0.0392 0.18 0.858
4) 5.0-10.0% 5) >10.0% 0.046 0.0381 1.22 0.226
6) Setting discipline policy 1) 0% 2) 0.0-2.5% 0.111*** 0.0299 3.73 0.000
1) 0% 3) 2.5-5.0% 0.052 0.0370 1.40 0.165
1) 0% 4) 5.0-10.0% 0.028 0.0275 1.02 0.308
1) 0% 5) >10.0% -0.024 0.0190 -1.27 0.209
2) 0.0-2.5% 3) 2.5-5.0% -0.060 0.0431 -1.38 0.171
2) 0.0-2.5% 4) 5.0-10.0% -0.083* 0.0353 -2.36 0.021
2) 0.0-2.5% 5) >10.0% -0.135*** 0.0302 -4.49 0.000
3) 2.5-5.0% 4) 5.0-10.0% -0.024 0.0441 -0.54 0.593
3) 2.5-5.0% 5) >10.0% -0.076* 0.0336 -2.26 0.027
4) 5.0-10.0% 5) >10.0% -0.052 0.0285 -1.83 0.070
7) Deciding how the school budget will be spent
1) 0% 2) 0.0-2.5% -0.021 0.0214 -0.98 0.332
1) 0% 3) 2.5-5.0% 0.009 0.0282 0.32 0.753
1) 0% 4) 5.0-10.0% -0.079* 0.0314 -2.52 0.013
1) 0% 5) >10.0% -0.098*** 0.0161 -6.07 0.000
2) 0.0-2.5% 3) 2.5-5.0% 0.030 0.0364 0.82 0.416
2) 0.0-2.5% 4) 5.0-10.0% -0.058 0.0336 -1.73 0.087
2) 0.0-2.5% 5) >10.0% -0.077** 0.0257 -2.98 0.004
3) 2.5-5.0% 4) 5.0-10.0% -0.088* 0.0398 -2.21 0.030
3) 2.5-5.0% 5) >10.0% -0.106*** 0.0281 -3.79 0.000
4) 5.0-10.0% 5) >10.0% -0.018 0.0316 -0.58 0.563
* Difference is significant (p<.05) **Difference is significant (p<.01) ***Difference is significant (p<.001)
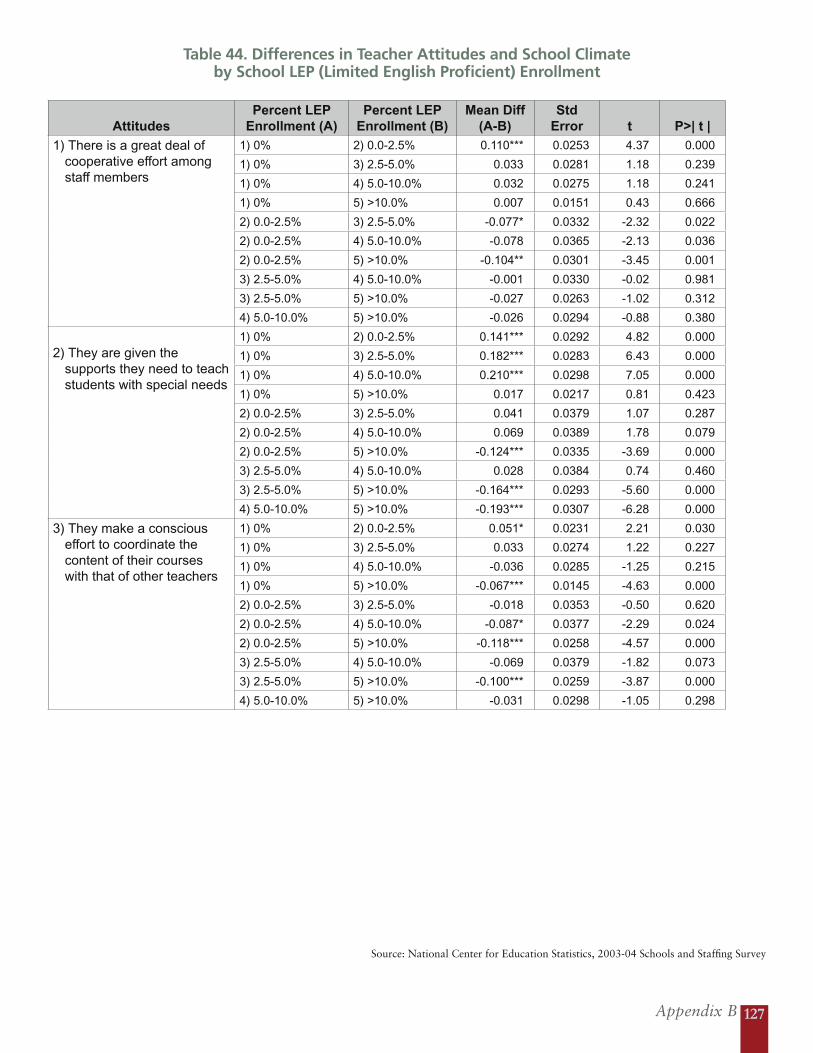
Appendix B 127
Source: National Center for Education Statistics, 2003-04 Schools and Staffing Survey
Table 44. Differences in Teacher Attitudes and School Climate by School LEP (Limited English Proficient) Enrollment
Attitudes Percent LEP
Enrollment (A)Percent LEP
Enrollment (B)Mean Diff
(A-B)Std
Error t P>| t |
1) There is a great deal of cooperative effort among staff members
1) 0% 2) 0.0-2.5% 0.110*** 0.0253 4.37 0.000
1) 0% 3) 2.5-5.0% 0.033 0.0281 1.18 0.239
1) 0% 4) 5.0-10.0% 0.032 0.0275 1.18 0.241
1) 0% 5) >10.0% 0.007 0.0151 0.43 0.666
2) 0.0-2.5% 3) 2.5-5.0% -0.077* 0.0332 -2.32 0.022
2) 0.0-2.5% 4) 5.0-10.0% -0.078 0.0365 -2.13 0.036
2) 0.0-2.5% 5) >10.0% -0.104** 0.0301 -3.45 0.001
3) 2.5-5.0% 4) 5.0-10.0% -0.001 0.0330 -0.02 0.981
3) 2.5-5.0% 5) >10.0% -0.027 0.0263 -1.02 0.312
4) 5.0-10.0% 5) >10.0% -0.026 0.0294 -0.88 0.380
2) They are given the supports they need to teach students with special needs
1) 0% 2) 0.0-2.5% 0.141*** 0.0292 4.82 0.000
1) 0% 3) 2.5-5.0% 0.182*** 0.0283 6.43 0.000
1) 0% 4) 5.0-10.0% 0.210*** 0.0298 7.05 0.000
1) 0% 5) >10.0% 0.017 0.0217 0.81 0.423
2) 0.0-2.5% 3) 2.5-5.0% 0.041 0.0379 1.07 0.287
2) 0.0-2.5% 4) 5.0-10.0% 0.069 0.0389 1.78 0.079
2) 0.0-2.5% 5) >10.0% -0.124*** 0.0335 -3.69 0.000
3) 2.5-5.0% 4) 5.0-10.0% 0.028 0.0384 0.74 0.460
3) 2.5-5.0% 5) >10.0% -0.164*** 0.0293 -5.60 0.000
4) 5.0-10.0% 5) >10.0% -0.193*** 0.0307 -6.28 0.000
3) They make a conscious effort to coordinate the content of their courses with that of other teachers
1) 0% 2) 0.0-2.5% 0.051* 0.0231 2.21 0.030
1) 0% 3) 2.5-5.0% 0.033 0.0274 1.22 0.227
1) 0% 4) 5.0-10.0% -0.036 0.0285 -1.25 0.215
1) 0% 5) >10.0% -0.067*** 0.0145 -4.63 0.000
2) 0.0-2.5% 3) 2.5-5.0% -0.018 0.0353 -0.50 0.620
2) 0.0-2.5% 4) 5.0-10.0% -0.087* 0.0377 -2.29 0.024
2) 0.0-2.5% 5) >10.0% -0.118*** 0.0258 -4.57 0.000
3) 2.5-5.0% 4) 5.0-10.0% -0.069 0.0379 -1.82 0.073
3) 2.5-5.0% 5) >10.0% -0.100*** 0.0259 -3.87 0.000
4) 5.0-10.0% 5) >10.0% -0.031 0.0298 -1.05 0.298
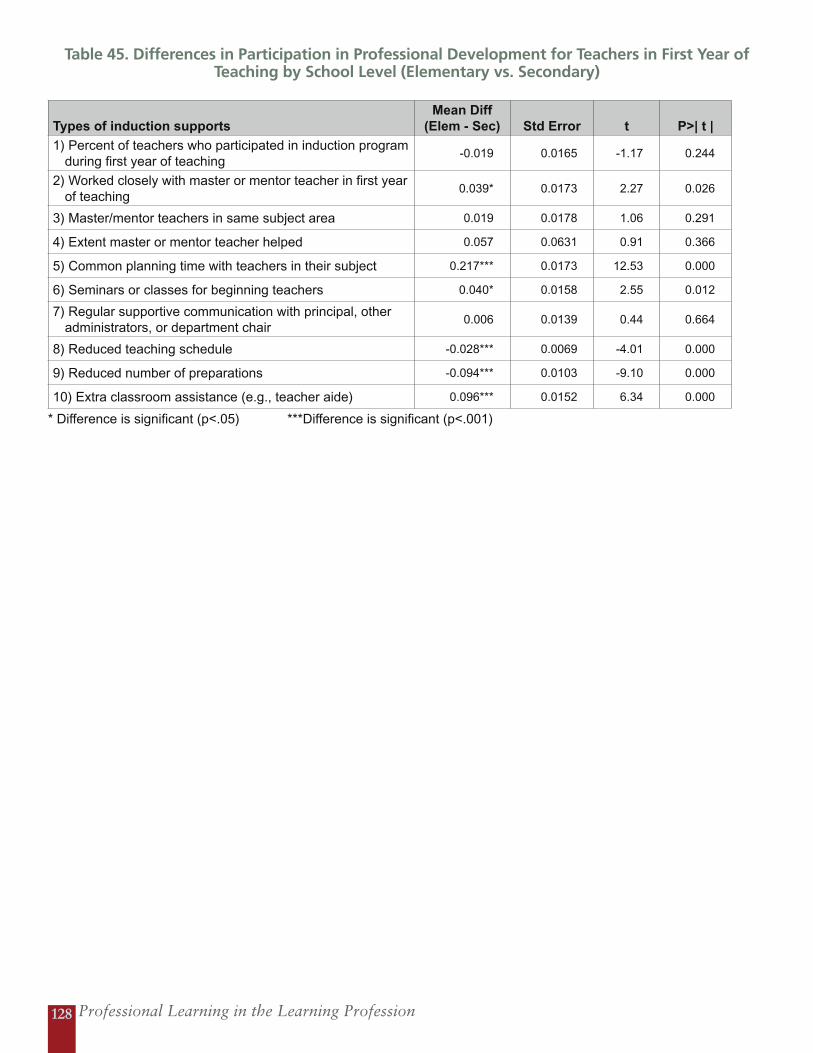
Professional Learning in the Learning Profession128
Table 45. Differences in Participation in Professional Development for Teachers in First Year of Teaching by School Level (Elementary vs. Secondary)
Types of induction supportsMean Diff
(Elem - Sec) Std Error t P>| t |
1) Percent of teachers who participated in induction program during first year of teaching
-0.019 0.0165 -1.17 0.244
2) Worked closely with master or mentor teacher in first year of teaching
0.039* 0.0173 2.27 0.026
3) Master/mentor teachers in same subject area 0.019 0.0178 1.06 0.291
4) Extent master or mentor teacher helped 0.057 0.0631 0.91 0.366
5) Common planning time with teachers in their subject 0.217*** 0.0173 12.53 0.000
6) Seminars or classes for beginning teachers 0.040* 0.0158 2.55 0.012
7) Regular supportive communication with principal, other administrators, or department chair
0.006 0.0139 0.44 0.664
8) Reduced teaching schedule -0.028*** 0.0069 -4.01 0.000
9) Reduced number of preparations -0.094*** 0.0103 -9.10 0.000
10) Extra classroom assistance (e.g., teacher aide) 0.096*** 0.0152 6.34 0.000
* Difference is significant (p<.05) ***Difference is significant (p<.001)
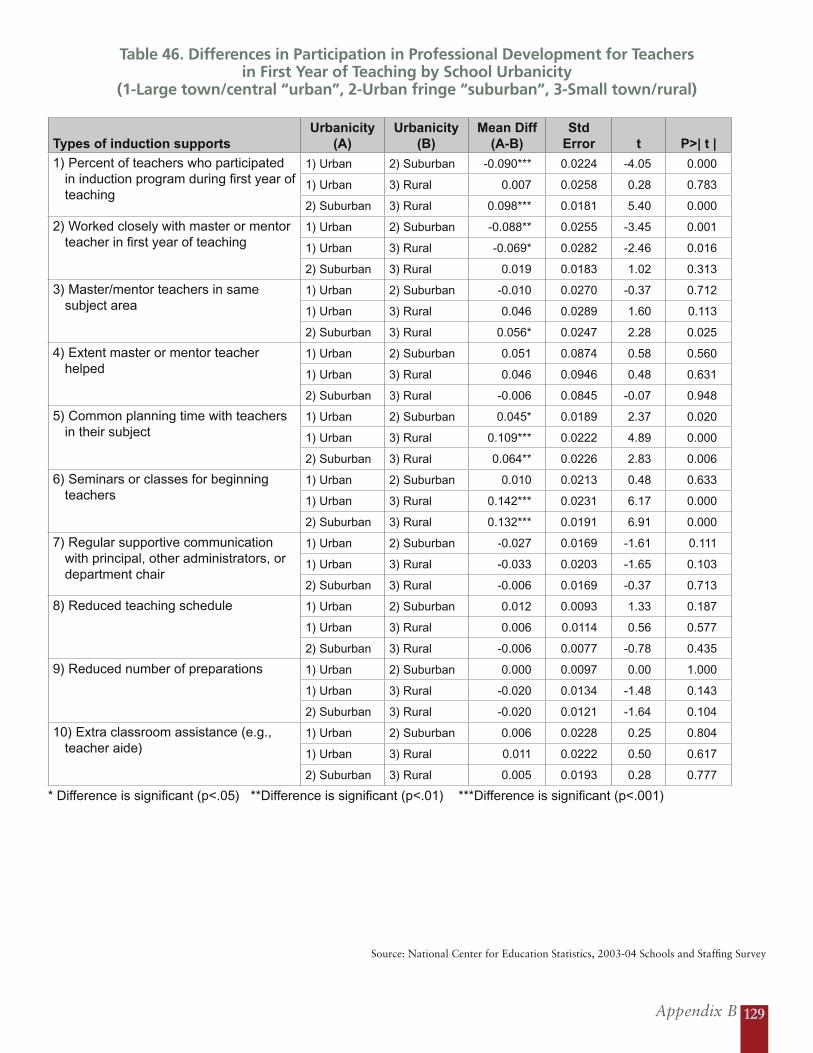
Appendix B 129
Source: National Center for Education Statistics, 2003-04 Schools and Staffing Survey
Table 46. Differences in Participation in Professional Development for Teachers in First Year of Teaching by School Urbanicity
(1-Large town/central “urban”, 2-Urban fringe “suburban”, 3-Small town/rural)
Types of induction supportsUrbanicity
(A)Urbanicity
(B)Mean Diff
(A-B)Std
Error t P>| t |
1) Percent of teachers who participated in induction program during first year of teaching
1) Urban 2) Suburban -0.090*** 0.0224 -4.05 0.000
1) Urban 3) Rural 0.007 0.0258 0.28 0.783
2) Suburban 3) Rural 0.098*** 0.0181 5.40 0.000
2) Worked closely with master or mentor teacher in first year of teaching
1) Urban 2) Suburban -0.088** 0.0255 -3.45 0.001
1) Urban 3) Rural -0.069* 0.0282 -2.46 0.016
2) Suburban 3) Rural 0.019 0.0183 1.02 0.313
3) Master/mentor teachers in same subject area
1) Urban 2) Suburban -0.010 0.0270 -0.37 0.712
1) Urban 3) Rural 0.046 0.0289 1.60 0.113
2) Suburban 3) Rural 0.056* 0.0247 2.28 0.025
4) Extent master or mentor teacher helped
1) Urban 2) Suburban 0.051 0.0874 0.58 0.560
1) Urban 3) Rural 0.046 0.0946 0.48 0.631
2) Suburban 3) Rural -0.006 0.0845 -0.07 0.948
5) Common planning time with teachers in their subject
1) Urban 2) Suburban 0.045* 0.0189 2.37 0.020
1) Urban 3) Rural 0.109*** 0.0222 4.89 0.000
2) Suburban 3) Rural 0.064** 0.0226 2.83 0.006
6) Seminars or classes for beginning teachers
1) Urban 2) Suburban 0.010 0.0213 0.48 0.633
1) Urban 3) Rural 0.142*** 0.0231 6.17 0.000
2) Suburban 3) Rural 0.132*** 0.0191 6.91 0.000
7) Regular supportive communication with principal, other administrators, or department chair
1) Urban 2) Suburban -0.027 0.0169 -1.61 0.111
1) Urban 3) Rural -0.033 0.0203 -1.65 0.103
2) Suburban 3) Rural -0.006 0.0169 -0.37 0.713
8) Reduced teaching schedule 1) Urban 2) Suburban 0.012 0.0093 1.33 0.187
1) Urban 3) Rural 0.006 0.0114 0.56 0.577
2) Suburban 3) Rural -0.006 0.0077 -0.78 0.435
9) Reduced number of preparations 1) Urban 2) Suburban 0.000 0.0097 0.00 1.000
1) Urban 3) Rural -0.020 0.0134 -1.48 0.143
2) Suburban 3) Rural -0.020 0.0121 -1.64 0.104
10) Extra classroom assistance (e.g., teacher aide)
1) Urban 2) Suburban 0.006 0.0228 0.25 0.804
1) Urban 3) Rural 0.011 0.0222 0.50 0.617
2) Suburban 3) Rural 0.005 0.0193 0.28 0.777
* Difference is significant (p<.05) **Difference is significant (p<.01) ***Difference is significant (p<.001)
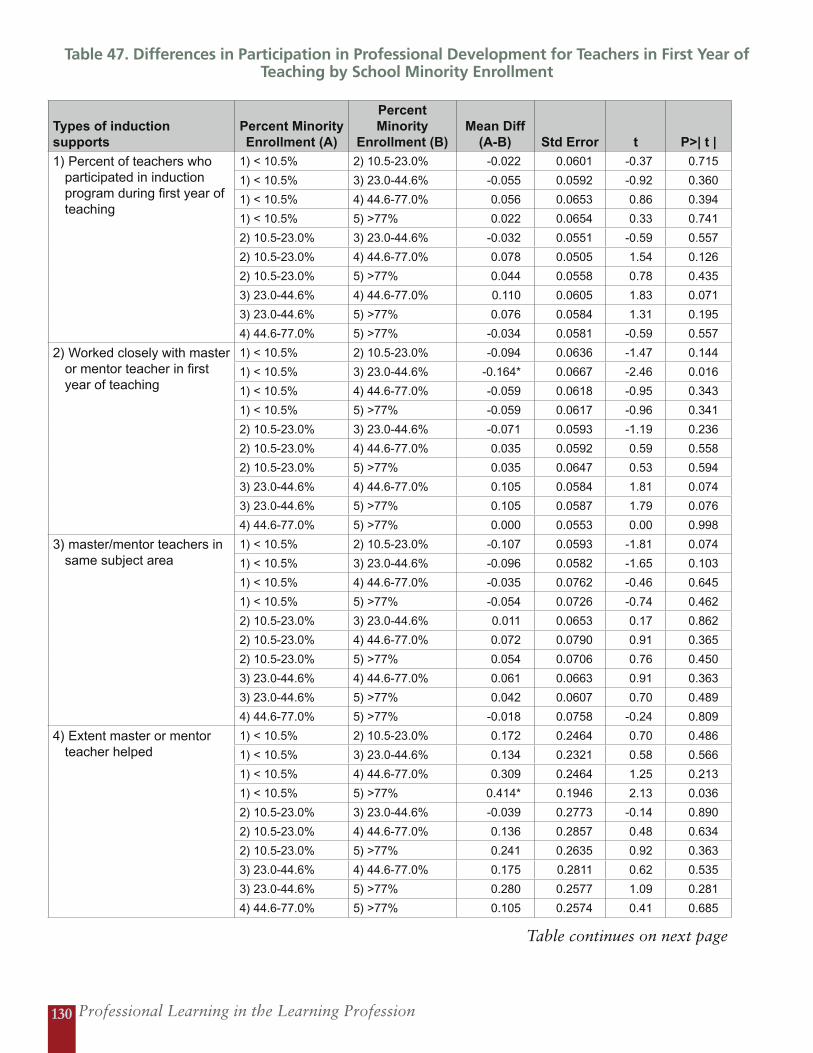
Professional Learning in the Learning Profession130
Table 47. Differences in Participation in Professional Development for Teachers in First Year of Teaching by School Minority Enrollment
Types of induction supports
Percent Minority Enrollment (A)
Percent Minority
Enrollment (B)Mean Diff
(A-B) Std Error t P>| t |
1) Percent of teachers who participated in induction program during first year of teaching
1) < 10.5% 2) 10.5-23.0% -0.022 0.0601 -0.37 0.715
1) < 10.5% 3) 23.0-44.6% -0.055 0.0592 -0.92 0.360
1) < 10.5% 4) 44.6-77.0% 0.056 0.0653 0.86 0.394
1) < 10.5% 5) >77% 0.022 0.0654 0.33 0.741
2) 10.5-23.0% 3) 23.0-44.6% -0.032 0.0551 -0.59 0.557
2) 10.5-23.0% 4) 44.6-77.0% 0.078 0.0505 1.54 0.126
2) 10.5-23.0% 5) >77% 0.044 0.0558 0.78 0.435
3) 23.0-44.6% 4) 44.6-77.0% 0.110 0.0605 1.83 0.071
3) 23.0-44.6% 5) >77% 0.076 0.0584 1.31 0.195
4) 44.6-77.0% 5) >77% -0.034 0.0581 -0.59 0.557
2) Worked closely with master or mentor teacher in first year of teaching
1) < 10.5% 2) 10.5-23.0% -0.094 0.0636 -1.47 0.144
1) < 10.5% 3) 23.0-44.6% -0.164* 0.0667 -2.46 0.016
1) < 10.5% 4) 44.6-77.0% -0.059 0.0618 -0.95 0.343
1) < 10.5% 5) >77% -0.059 0.0617 -0.96 0.341
2) 10.5-23.0% 3) 23.0-44.6% -0.071 0.0593 -1.19 0.236
2) 10.5-23.0% 4) 44.6-77.0% 0.035 0.0592 0.59 0.558
2) 10.5-23.0% 5) >77% 0.035 0.0647 0.53 0.594
3) 23.0-44.6% 4) 44.6-77.0% 0.105 0.0584 1.81 0.074
3) 23.0-44.6% 5) >77% 0.105 0.0587 1.79 0.076
4) 44.6-77.0% 5) >77% 0.000 0.0553 0.00 0.998
3) master/mentor teachers in same subject area
1) < 10.5% 2) 10.5-23.0% -0.107 0.0593 -1.81 0.074
1) < 10.5% 3) 23.0-44.6% -0.096 0.0582 -1.65 0.103
1) < 10.5% 4) 44.6-77.0% -0.035 0.0762 -0.46 0.645
1) < 10.5% 5) >77% -0.054 0.0726 -0.74 0.462
2) 10.5-23.0% 3) 23.0-44.6% 0.011 0.0653 0.17 0.862
2) 10.5-23.0% 4) 44.6-77.0% 0.072 0.0790 0.91 0.365
2) 10.5-23.0% 5) >77% 0.054 0.0706 0.76 0.450
3) 23.0-44.6% 4) 44.6-77.0% 0.061 0.0663 0.91 0.363
3) 23.0-44.6% 5) >77% 0.042 0.0607 0.70 0.489
4) 44.6-77.0% 5) >77% -0.018 0.0758 -0.24 0.809
4) Extent master or mentor teacher helped
1) < 10.5% 2) 10.5-23.0% 0.172 0.2464 0.70 0.486
1) < 10.5% 3) 23.0-44.6% 0.134 0.2321 0.58 0.566
1) < 10.5% 4) 44.6-77.0% 0.309 0.2464 1.25 0.213
1) < 10.5% 5) >77% 0.414* 0.1946 2.13 0.036
2) 10.5-23.0% 3) 23.0-44.6% -0.039 0.2773 -0.14 0.890
2) 10.5-23.0% 4) 44.6-77.0% 0.136 0.2857 0.48 0.634
2) 10.5-23.0% 5) >77% 0.241 0.2635 0.92 0.363
3) 23.0-44.6% 4) 44.6-77.0% 0.175 0.2811 0.62 0.535
3) 23.0-44.6% 5) >77% 0.280 0.2577 1.09 0.281
4) 44.6-77.0% 5) >77% 0.105 0.2574 0.41 0.685
Table continues on next page
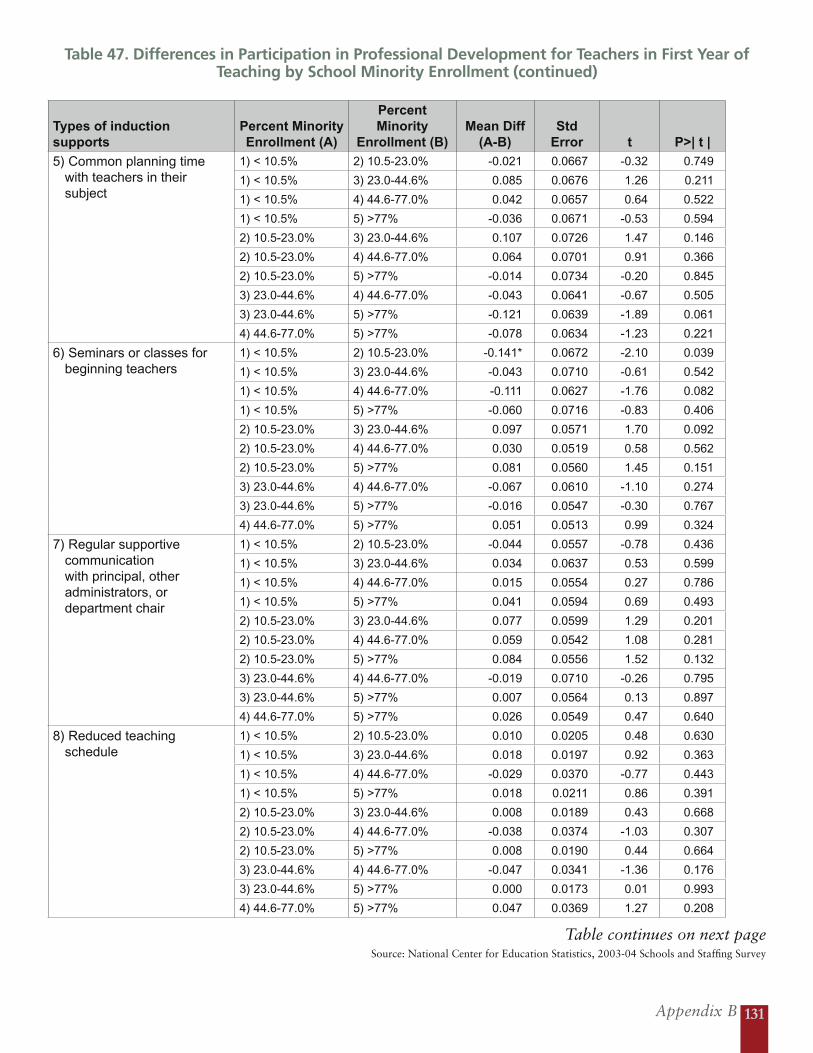
Appendix B 131
Source: National Center for Education Statistics, 2003-04 Schools and Staffing Survey
Table 47. Differences in Participation in Professional Development for Teachers in First Year of Teaching by School Minority Enrollment (continued)
Types of induction supports
Percent Minority Enrollment (A)
Percent Minority
Enrollment (B)Mean Diff
(A-B)Std
Error t P>| t |
5) Common planning time with teachers in their subject
1) < 10.5% 2) 10.5-23.0% -0.021 0.0667 -0.32 0.749
1) < 10.5% 3) 23.0-44.6% 0.085 0.0676 1.26 0.211
1) < 10.5% 4) 44.6-77.0% 0.042 0.0657 0.64 0.522
1) < 10.5% 5) >77% -0.036 0.0671 -0.53 0.594
2) 10.5-23.0% 3) 23.0-44.6% 0.107 0.0726 1.47 0.146
2) 10.5-23.0% 4) 44.6-77.0% 0.064 0.0701 0.91 0.366
2) 10.5-23.0% 5) >77% -0.014 0.0734 -0.20 0.845
3) 23.0-44.6% 4) 44.6-77.0% -0.043 0.0641 -0.67 0.505
3) 23.0-44.6% 5) >77% -0.121 0.0639 -1.89 0.061
4) 44.6-77.0% 5) >77% -0.078 0.0634 -1.23 0.221
6) Seminars or classes for beginning teachers
1) < 10.5% 2) 10.5-23.0% -0.141* 0.0672 -2.10 0.039
1) < 10.5% 3) 23.0-44.6% -0.043 0.0710 -0.61 0.542
1) < 10.5% 4) 44.6-77.0% -0.111 0.0627 -1.76 0.082
1) < 10.5% 5) >77% -0.060 0.0716 -0.83 0.406
2) 10.5-23.0% 3) 23.0-44.6% 0.097 0.0571 1.70 0.092
2) 10.5-23.0% 4) 44.6-77.0% 0.030 0.0519 0.58 0.562
2) 10.5-23.0% 5) >77% 0.081 0.0560 1.45 0.151
3) 23.0-44.6% 4) 44.6-77.0% -0.067 0.0610 -1.10 0.274
3) 23.0-44.6% 5) >77% -0.016 0.0547 -0.30 0.767
4) 44.6-77.0% 5) >77% 0.051 0.0513 0.99 0.324
7) Regular supportive communication with principal, other administrators, or department chair
1) < 10.5% 2) 10.5-23.0% -0.044 0.0557 -0.78 0.436
1) < 10.5% 3) 23.0-44.6% 0.034 0.0637 0.53 0.599
1) < 10.5% 4) 44.6-77.0% 0.015 0.0554 0.27 0.786
1) < 10.5% 5) >77% 0.041 0.0594 0.69 0.493
2) 10.5-23.0% 3) 23.0-44.6% 0.077 0.0599 1.29 0.201
2) 10.5-23.0% 4) 44.6-77.0% 0.059 0.0542 1.08 0.281
2) 10.5-23.0% 5) >77% 0.084 0.0556 1.52 0.132
3) 23.0-44.6% 4) 44.6-77.0% -0.019 0.0710 -0.26 0.795
3) 23.0-44.6% 5) >77% 0.007 0.0564 0.13 0.897
4) 44.6-77.0% 5) >77% 0.026 0.0549 0.47 0.640
8) Reduced teaching schedule
1) < 10.5% 2) 10.5-23.0% 0.010 0.0205 0.48 0.630
1) < 10.5% 3) 23.0-44.6% 0.018 0.0197 0.92 0.363
1) < 10.5% 4) 44.6-77.0% -0.029 0.0370 -0.77 0.443
1) < 10.5% 5) >77% 0.018 0.0211 0.86 0.391
2) 10.5-23.0% 3) 23.0-44.6% 0.008 0.0189 0.43 0.668
2) 10.5-23.0% 4) 44.6-77.0% -0.038 0.0374 -1.03 0.307
2) 10.5-23.0% 5) >77% 0.008 0.0190 0.44 0.664
3) 23.0-44.6% 4) 44.6-77.0% -0.047 0.0341 -1.36 0.176
3) 23.0-44.6% 5) >77% 0.000 0.0173 0.01 0.993
4) 44.6-77.0% 5) >77% 0.047 0.0369 1.27 0.208
Table continues on next page
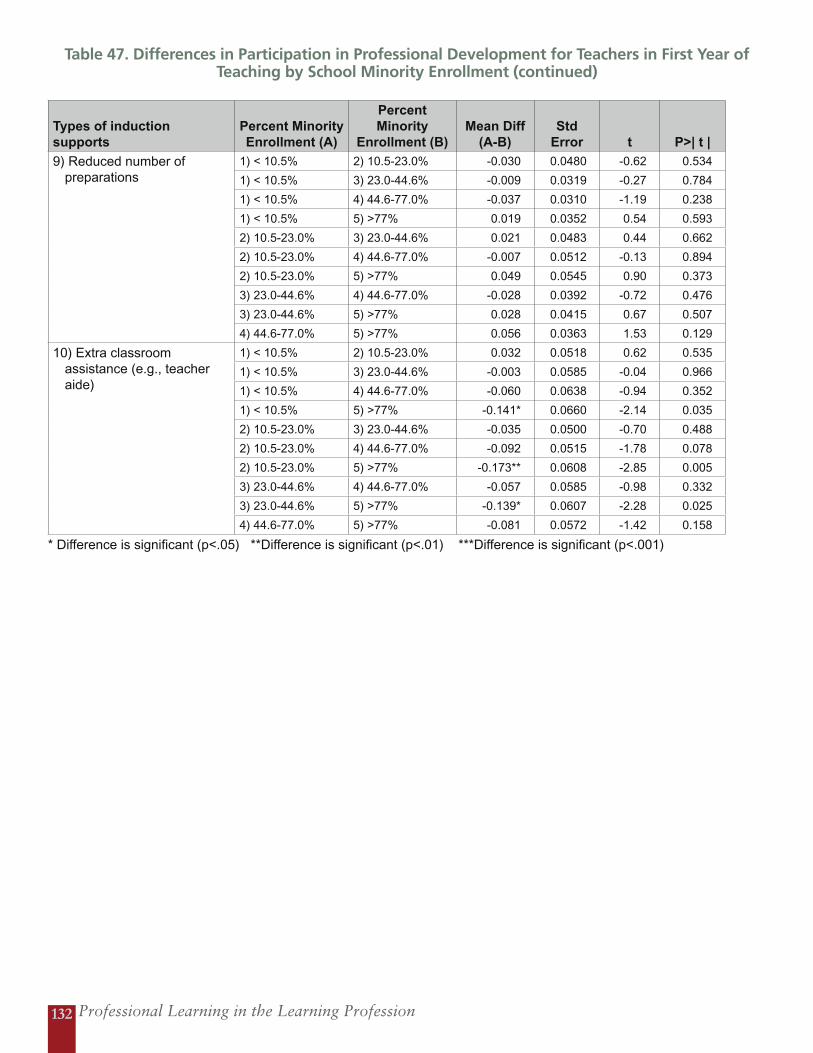
Professional Learning in the Learning Profession132
Table 47. Differences in Participation in Professional Development for Teachers in First Year of Teaching by School Minority Enrollment (continued)
Types of induction supports
Percent Minority Enrollment (A)
Percent Minority
Enrollment (B)Mean Diff
(A-B)Std
Error t P>| t |
9) Reduced number of preparations
1) < 10.5% 2) 10.5-23.0% -0.030 0.0480 -0.62 0.534
1) < 10.5% 3) 23.0-44.6% -0.009 0.0319 -0.27 0.784
1) < 10.5% 4) 44.6-77.0% -0.037 0.0310 -1.19 0.238
1) < 10.5% 5) >77% 0.019 0.0352 0.54 0.593
2) 10.5-23.0% 3) 23.0-44.6% 0.021 0.0483 0.44 0.662
2) 10.5-23.0% 4) 44.6-77.0% -0.007 0.0512 -0.13 0.894
2) 10.5-23.0% 5) >77% 0.049 0.0545 0.90 0.373
3) 23.0-44.6% 4) 44.6-77.0% -0.028 0.0392 -0.72 0.476
3) 23.0-44.6% 5) >77% 0.028 0.0415 0.67 0.507
4) 44.6-77.0% 5) >77% 0.056 0.0363 1.53 0.129
10) Extra classroom assistance (e.g., teacher aide)
1) < 10.5% 2) 10.5-23.0% 0.032 0.0518 0.62 0.535
1) < 10.5% 3) 23.0-44.6% -0.003 0.0585 -0.04 0.966
1) < 10.5% 4) 44.6-77.0% -0.060 0.0638 -0.94 0.352
1) < 10.5% 5) >77% -0.141* 0.0660 -2.14 0.035
2) 10.5-23.0% 3) 23.0-44.6% -0.035 0.0500 -0.70 0.488
2) 10.5-23.0% 4) 44.6-77.0% -0.092 0.0515 -1.78 0.078
2) 10.5-23.0% 5) >77% -0.173** 0.0608 -2.85 0.005
3) 23.0-44.6% 4) 44.6-77.0% -0.057 0.0585 -0.98 0.332
3) 23.0-44.6% 5) >77% -0.139* 0.0607 -2.28 0.025
4) 44.6-77.0% 5) >77% -0.081 0.0572 -1.42 0.158
* Difference is significant (p<.05) **Difference is significant (p<.01) ***Difference is significant (p<.001)

Appendix B 133
Source: National Center for Education Statistics, 2003-04 Schools and Staffing Survey
Table 48. Differences in Participation in Professional Development for Teachers in First Year of Teaching by School Poverty
(Percent of Students Enrolled in the Free and Reduced Lunch Program - FRL)
Types of induction supportsPercent FRL
Enrollment (A)Percent FRL
Enrollment (B)Mean Diff
(A-B)Std
Error t P>| t |
1) Percent of teachers who participated in induction program during first year of teaching
1) <17.31% 2) 17.32-34.34% 0.046 0.0249 1.83 0.071
1) <17.31% 3) 34.35-53.84% 0.090*** 0.0238 3.78 0.000
1) <17.31% 4) > 53.85% 0.105*** 0.0249 4.22 0.000
2) 17.32-34.34% 3) 34.35-53.84% 0.045 0.0228 1.95 0.054
2) 17.32-34.34% 4) > 53.85% 0.060 0.0217 2.76 0.007
3) 34.35-53.84% 4) > 53.85% 0.015 0.0250 0.61 0.544
2) Worked closely with master or mentor teacher in first year of teaching
1) <17.31% 2) 17.32-34.34% -0.019 0.0218 -0.89 0.377
1) <17.31% 3) 34.35-53.84% -0.002 0.0243 -0.10 0.924
1) <17.31% 4) > 53.85% 0.044* 0.0207 2.12 0.037
2) 17.32-34.34% 3) 34.35-53.84% 0.017 0.0239 0.71 0.478
2) 17.32-34.34% 4) > 53.85% 0.063** 0.0234 2.70 0.008
3) 34.35-53.84% 4) > 53.85% 0.046* 0.0231 2.00 0.049
3) master/mentor teachers in same subject area
1) <17.31% 2) 17.32-34.34% 0.024 0.0297 0.81 0.419
1) <17.31% 3) 34.35-53.84% 0.025 0.0272 0.92 0.358
1) <17.31% 4) > 53.85% 0.052 0.0284 1.84 0.070
2) 17.32-34.34% 3) 34.35-53.84% 0.001 0.0250 0.04 0.967
2) 17.32-34.34% 4) > 53.85% 0.028 0.0290 0.97 0.335
3) 34.35-53.84% 4) > 53.85% 0.027 0.0296 0.91 0.364
4) Extent master or mentor teacher helped
1) <17.31% 2) 17.32-34.34% 0.067 0.1052 0.64 0.525
1) <17.31% 3) 34.35-53.84% 0.047 0.1011 0.46 0.643
1) <17.31% 4) > 53.85% -0.069 0.1068 -0.65 0.520
2) 17.32-34.34% 3) 34.35-53.84% -0.020 0.0963 -0.21 0.835
2) 17.32-34.34% 4) > 53.85% -0.136 0.0937 -1.45 0.150
3) 34.35-53.84% 4) > 53.85% -0.116 0.0937 -1.24 0.219
5) Common planning time with teachers in their subject
1) <17.31% 2) 17.32-34.34% 0.009 0.0263 0.35 0.730
1) <17.31% 3) 34.35-53.84% -0.040 0.0239 -1.69 0.095
1) <17.31% 4) > 53.85% -0.095*** 0.0247 -3.86 0.000
2) 17.32-34.34% 3) 34.35-53.84% -0.050* 0.0247 -2.00 0.048
2) 17.32-34.34% 4) > 53.85% -0.105*** 0.0245 -4.26 0.000
3) 34.35-53.84% 4) > 53.85% -0.055* 0.0252 -2.18 0.032
6) Seminars or classes for beginning teachers
1) <17.31% 2) 17.32-34.34% -0.021 0.0221 -0.97 0.334
1) <17.31% 3) 34.35-53.84% -0.023 0.0238 -0.95 0.347
1) <17.31% 4) > 53.85% -0.027 0.0205 -1.34 0.184
2) 17.32-34.34% 3) 34.35-53.84% -0.001 0.0197 -0.06 0.956
2) 17.32-34.34% 4) > 53.85% -0.006 0.0217 -0.28 0.783
3) 34.35-53.84% 4) > 53.85% -0.005 0.0226 -0.22 0.828
Table continues on next page
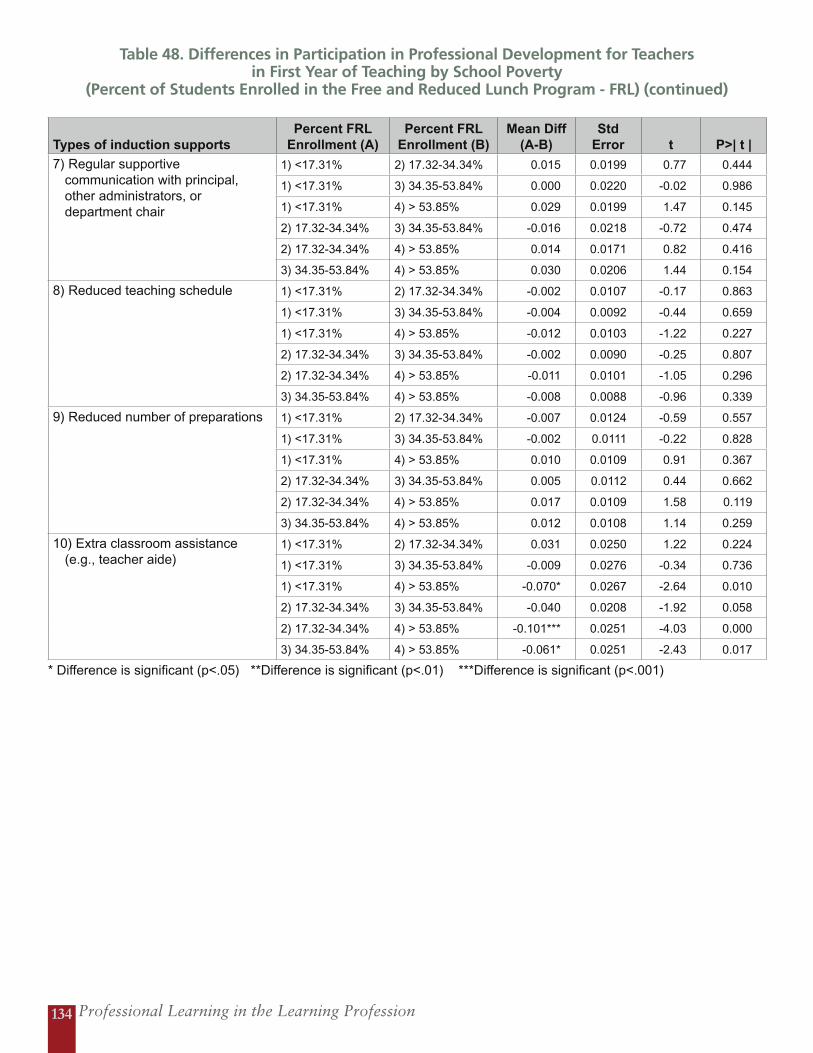
Professional Learning in the Learning Profession134
Table 48. Differences in Participation in Professional Development for Teachers in First Year of Teaching by School Poverty
(Percent of Students Enrolled in the Free and Reduced Lunch Program - FRL) (continued)
Types of induction supportsPercent FRL
Enrollment (A)Percent FRL
Enrollment (B)Mean Diff
(A-B)Std
Error t P>| t |
7) Regular supportive communication with principal, other administrators, or department chair
1) <17.31% 2) 17.32-34.34% 0.015 0.0199 0.77 0.444
1) <17.31% 3) 34.35-53.84% 0.000 0.0220 -0.02 0.986
1) <17.31% 4) > 53.85% 0.029 0.0199 1.47 0.145
2) 17.32-34.34% 3) 34.35-53.84% -0.016 0.0218 -0.72 0.474
2) 17.32-34.34% 4) > 53.85% 0.014 0.0171 0.82 0.416
3) 34.35-53.84% 4) > 53.85% 0.030 0.0206 1.44 0.154
8) Reduced teaching schedule 1) <17.31% 2) 17.32-34.34% -0.002 0.0107 -0.17 0.863
1) <17.31% 3) 34.35-53.84% -0.004 0.0092 -0.44 0.659
1) <17.31% 4) > 53.85% -0.012 0.0103 -1.22 0.227
2) 17.32-34.34% 3) 34.35-53.84% -0.002 0.0090 -0.25 0.807
2) 17.32-34.34% 4) > 53.85% -0.011 0.0101 -1.05 0.296
3) 34.35-53.84% 4) > 53.85% -0.008 0.0088 -0.96 0.339
9) Reduced number of preparations 1) <17.31% 2) 17.32-34.34% -0.007 0.0124 -0.59 0.557
1) <17.31% 3) 34.35-53.84% -0.002 0.0111 -0.22 0.828
1) <17.31% 4) > 53.85% 0.010 0.0109 0.91 0.367
2) 17.32-34.34% 3) 34.35-53.84% 0.005 0.0112 0.44 0.662
2) 17.32-34.34% 4) > 53.85% 0.017 0.0109 1.58 0.119
3) 34.35-53.84% 4) > 53.85% 0.012 0.0108 1.14 0.259
10) Extra classroom assistance (e.g., teacher aide)
1) <17.31% 2) 17.32-34.34% 0.031 0.0250 1.22 0.224
1) <17.31% 3) 34.35-53.84% -0.009 0.0276 -0.34 0.736
1) <17.31% 4) > 53.85% -0.070* 0.0267 -2.64 0.010
2) 17.32-34.34% 3) 34.35-53.84% -0.040 0.0208 -1.92 0.058
2) 17.32-34.34% 4) > 53.85% -0.101*** 0.0251 -4.03 0.000
3) 34.35-53.84% 4) > 53.85% -0.061* 0.0251 -2.43 0.017
* Difference is significant (p<.05) **Difference is significant (p<.01) ***Difference is significant (p<.001)
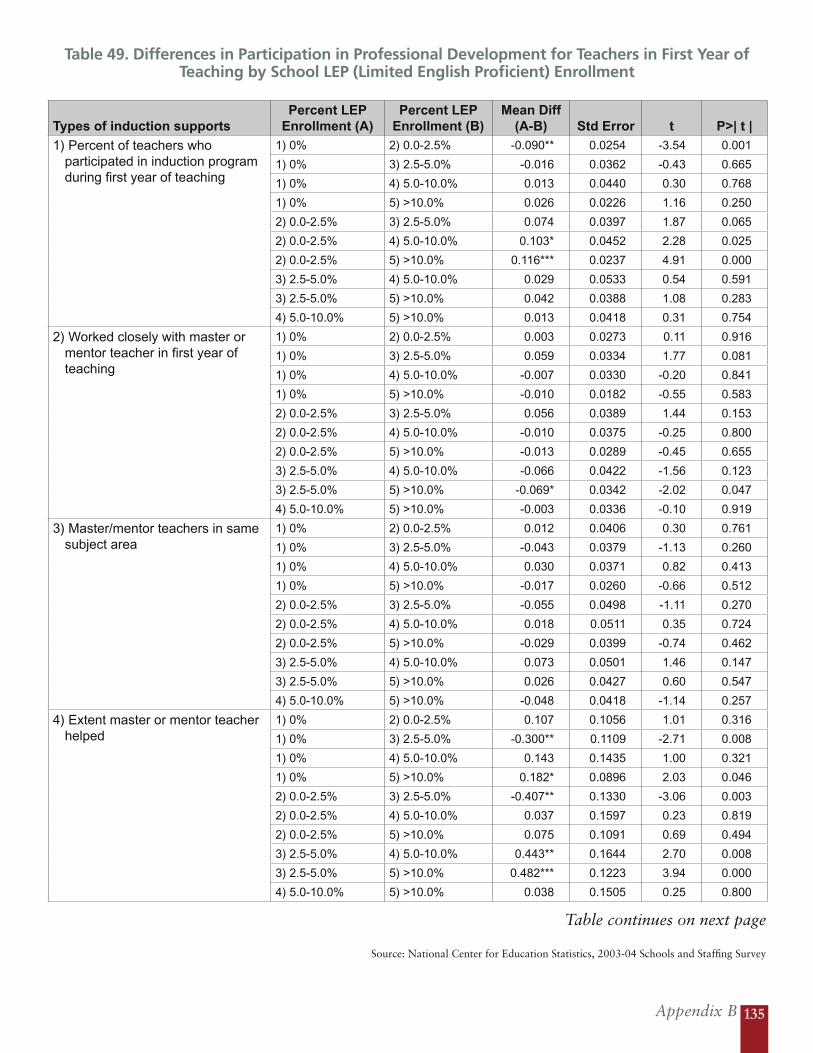
Appendix B 135
Source: National Center for Education Statistics, 2003-04 Schools and Staffing Survey
Table 49. Differences in Participation in Professional Development for Teachers in First Year of Teaching by School LEP (Limited English Proficient) Enrollment
Types of induction supports Percent LEP
Enrollment (A)Percent LEP
Enrollment (B)Mean Diff
(A-B) Std Error t P>| t |
1) Percent of teachers who participated in induction program during first year of teaching
1) 0% 2) 0.0-2.5% -0.090** 0.0254 -3.54 0.001
1) 0% 3) 2.5-5.0% -0.016 0.0362 -0.43 0.665
1) 0% 4) 5.0-10.0% 0.013 0.0440 0.30 0.768
1) 0% 5) >10.0% 0.026 0.0226 1.16 0.250
2) 0.0-2.5% 3) 2.5-5.0% 0.074 0.0397 1.87 0.065
2) 0.0-2.5% 4) 5.0-10.0% 0.103* 0.0452 2.28 0.025
2) 0.0-2.5% 5) >10.0% 0.116*** 0.0237 4.91 0.000
3) 2.5-5.0% 4) 5.0-10.0% 0.029 0.0533 0.54 0.591
3) 2.5-5.0% 5) >10.0% 0.042 0.0388 1.08 0.283
4) 5.0-10.0% 5) >10.0% 0.013 0.0418 0.31 0.754
2) Worked closely with master or mentor teacher in first year of teaching
1) 0% 2) 0.0-2.5% 0.003 0.0273 0.11 0.916
1) 0% 3) 2.5-5.0% 0.059 0.0334 1.77 0.081
1) 0% 4) 5.0-10.0% -0.007 0.0330 -0.20 0.841
1) 0% 5) >10.0% -0.010 0.0182 -0.55 0.583
2) 0.0-2.5% 3) 2.5-5.0% 0.056 0.0389 1.44 0.153
2) 0.0-2.5% 4) 5.0-10.0% -0.010 0.0375 -0.25 0.800
2) 0.0-2.5% 5) >10.0% -0.013 0.0289 -0.45 0.655
3) 2.5-5.0% 4) 5.0-10.0% -0.066 0.0422 -1.56 0.123
3) 2.5-5.0% 5) >10.0% -0.069* 0.0342 -2.02 0.047
4) 5.0-10.0% 5) >10.0% -0.003 0.0336 -0.10 0.919
3) Master/mentor teachers in same subject area
1) 0% 2) 0.0-2.5% 0.012 0.0406 0.30 0.761
1) 0% 3) 2.5-5.0% -0.043 0.0379 -1.13 0.260
1) 0% 4) 5.0-10.0% 0.030 0.0371 0.82 0.413
1) 0% 5) >10.0% -0.017 0.0260 -0.66 0.512
2) 0.0-2.5% 3) 2.5-5.0% -0.055 0.0498 -1.11 0.270
2) 0.0-2.5% 4) 5.0-10.0% 0.018 0.0511 0.35 0.724
2) 0.0-2.5% 5) >10.0% -0.029 0.0399 -0.74 0.462
3) 2.5-5.0% 4) 5.0-10.0% 0.073 0.0501 1.46 0.147
3) 2.5-5.0% 5) >10.0% 0.026 0.0427 0.60 0.547
4) 5.0-10.0% 5) >10.0% -0.048 0.0418 -1.14 0.257
4) Extent master or mentor teacher helped
1) 0% 2) 0.0-2.5% 0.107 0.1056 1.01 0.316
1) 0% 3) 2.5-5.0% -0.300** 0.1109 -2.71 0.008
1) 0% 4) 5.0-10.0% 0.143 0.1435 1.00 0.321
1) 0% 5) >10.0% 0.182* 0.0896 2.03 0.046
2) 0.0-2.5% 3) 2.5-5.0% -0.407** 0.1330 -3.06 0.003
2) 0.0-2.5% 4) 5.0-10.0% 0.037 0.1597 0.23 0.819
2) 0.0-2.5% 5) >10.0% 0.075 0.1091 0.69 0.494
3) 2.5-5.0% 4) 5.0-10.0% 0.443** 0.1644 2.70 0.008
3) 2.5-5.0% 5) >10.0% 0.482*** 0.1223 3.94 0.000
4) 5.0-10.0% 5) >10.0% 0.038 0.1505 0.25 0.800
Table continues on next page
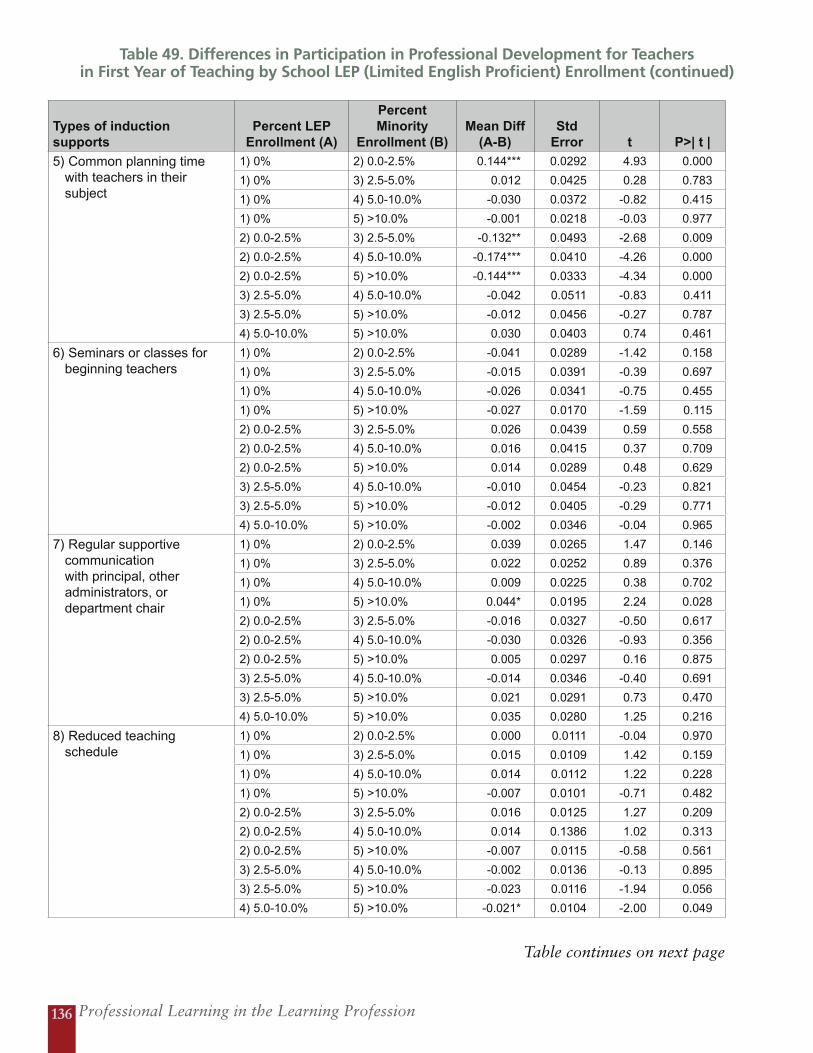
Professional Learning in the Learning Profession136
Table 49. Differences in Participation in Professional Development for Teachers in First Year of Teaching by School LEP (Limited English Proficient) Enrollment (continued)
Types of induction supports
Percent LEP Enrollment (A)
Percent Minority
Enrollment (B)Mean Diff
(A-B)Std
Error t P>| t |
5) Common planning time with teachers in their subject
1) 0% 2) 0.0-2.5% 0.144*** 0.0292 4.93 0.000
1) 0% 3) 2.5-5.0% 0.012 0.0425 0.28 0.783
1) 0% 4) 5.0-10.0% -0.030 0.0372 -0.82 0.415
1) 0% 5) >10.0% -0.001 0.0218 -0.03 0.977
2) 0.0-2.5% 3) 2.5-5.0% -0.132** 0.0493 -2.68 0.009
2) 0.0-2.5% 4) 5.0-10.0% -0.174*** 0.0410 -4.26 0.000
2) 0.0-2.5% 5) >10.0% -0.144*** 0.0333 -4.34 0.000
3) 2.5-5.0% 4) 5.0-10.0% -0.042 0.0511 -0.83 0.411
3) 2.5-5.0% 5) >10.0% -0.012 0.0456 -0.27 0.787
4) 5.0-10.0% 5) >10.0% 0.030 0.0403 0.74 0.461
6) Seminars or classes for beginning teachers
1) 0% 2) 0.0-2.5% -0.041 0.0289 -1.42 0.158
1) 0% 3) 2.5-5.0% -0.015 0.0391 -0.39 0.697
1) 0% 4) 5.0-10.0% -0.026 0.0341 -0.75 0.455
1) 0% 5) >10.0% -0.027 0.0170 -1.59 0.115
2) 0.0-2.5% 3) 2.5-5.0% 0.026 0.0439 0.59 0.558
2) 0.0-2.5% 4) 5.0-10.0% 0.016 0.0415 0.37 0.709
2) 0.0-2.5% 5) >10.0% 0.014 0.0289 0.48 0.629
3) 2.5-5.0% 4) 5.0-10.0% -0.010 0.0454 -0.23 0.821
3) 2.5-5.0% 5) >10.0% -0.012 0.0405 -0.29 0.771
4) 5.0-10.0% 5) >10.0% -0.002 0.0346 -0.04 0.965
7) Regular supportive communication with principal, other administrators, or department chair
1) 0% 2) 0.0-2.5% 0.039 0.0265 1.47 0.146
1) 0% 3) 2.5-5.0% 0.022 0.0252 0.89 0.376
1) 0% 4) 5.0-10.0% 0.009 0.0225 0.38 0.702
1) 0% 5) >10.0% 0.044* 0.0195 2.24 0.028
2) 0.0-2.5% 3) 2.5-5.0% -0.016 0.0327 -0.50 0.617
2) 0.0-2.5% 4) 5.0-10.0% -0.030 0.0326 -0.93 0.356
2) 0.0-2.5% 5) >10.0% 0.005 0.0297 0.16 0.875
3) 2.5-5.0% 4) 5.0-10.0% -0.014 0.0346 -0.40 0.691
3) 2.5-5.0% 5) >10.0% 0.021 0.0291 0.73 0.470
4) 5.0-10.0% 5) >10.0% 0.035 0.0280 1.25 0.216
8) Reduced teaching schedule
1) 0% 2) 0.0-2.5% 0.000 0.0111 -0.04 0.970
1) 0% 3) 2.5-5.0% 0.015 0.0109 1.42 0.159
1) 0% 4) 5.0-10.0% 0.014 0.0112 1.22 0.228
1) 0% 5) >10.0% -0.007 0.0101 -0.71 0.482
2) 0.0-2.5% 3) 2.5-5.0% 0.016 0.0125 1.27 0.209
2) 0.0-2.5% 4) 5.0-10.0% 0.014 0.1386 1.02 0.313
2) 0.0-2.5% 5) >10.0% -0.007 0.0115 -0.58 0.561
3) 2.5-5.0% 4) 5.0-10.0% -0.002 0.0136 -0.13 0.895
3) 2.5-5.0% 5) >10.0% -0.023 0.0116 -1.94 0.056
4) 5.0-10.0% 5) >10.0% -0.021* 0.0104 -2.00 0.049
Table continues on next page
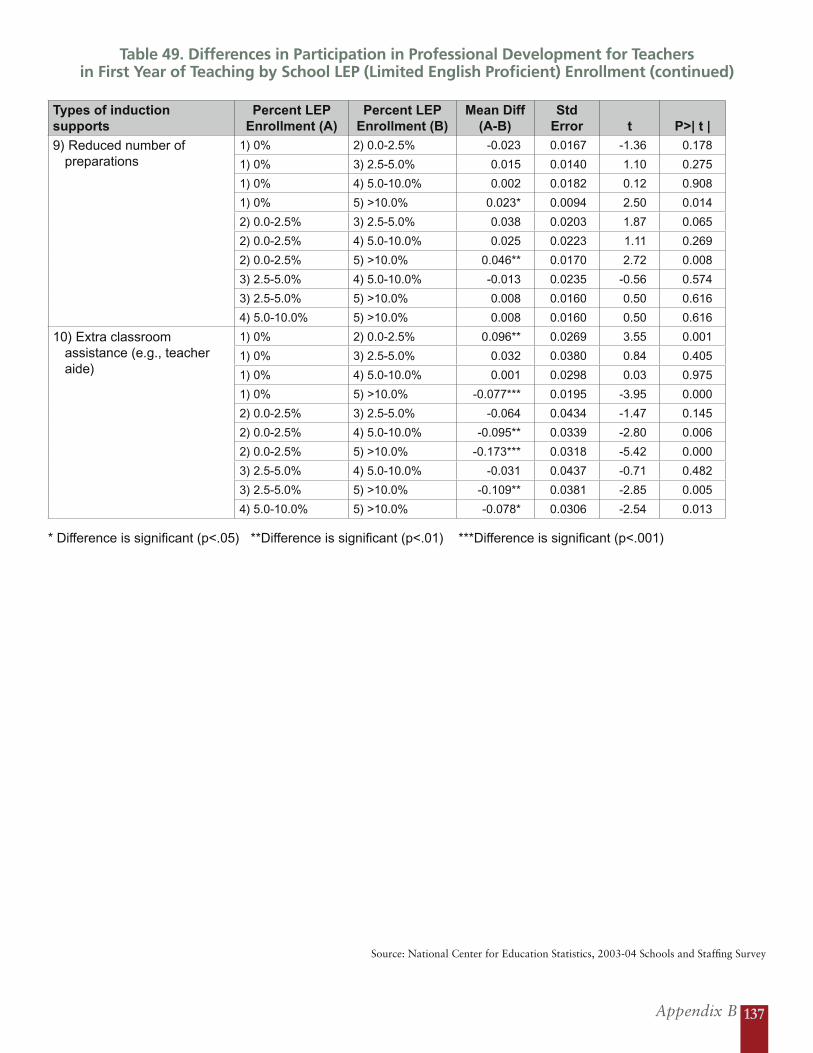
Appendix B 137
Source: National Center for Education Statistics, 2003-04 Schools and Staffing Survey
Table 49. Differences in Participation in Professional Development for Teachers in First Year of Teaching by School LEP (Limited English Proficient) Enrollment (continued)
Types of induction supports
Percent LEP Enrollment (A)
Percent LEP Enrollment (B)
Mean Diff (A-B)
Std Error t P>| t |
9) Reduced number of preparations
1) 0% 2) 0.0-2.5% -0.023 0.0167 -1.36 0.178
1) 0% 3) 2.5-5.0% 0.015 0.0140 1.10 0.275
1) 0% 4) 5.0-10.0% 0.002 0.0182 0.12 0.908
1) 0% 5) >10.0% 0.023* 0.0094 2.50 0.014
2) 0.0-2.5% 3) 2.5-5.0% 0.038 0.0203 1.87 0.065
2) 0.0-2.5% 4) 5.0-10.0% 0.025 0.0223 1.11 0.269
2) 0.0-2.5% 5) >10.0% 0.046** 0.0170 2.72 0.008
3) 2.5-5.0% 4) 5.0-10.0% -0.013 0.0235 -0.56 0.574
3) 2.5-5.0% 5) >10.0% 0.008 0.0160 0.50 0.616
4) 5.0-10.0% 5) >10.0% 0.008 0.0160 0.50 0.616
10) Extra classroom assistance (e.g., teacher aide)
1) 0% 2) 0.0-2.5% 0.096** 0.0269 3.55 0.001
1) 0% 3) 2.5-5.0% 0.032 0.0380 0.84 0.405
1) 0% 4) 5.0-10.0% 0.001 0.0298 0.03 0.975
1) 0% 5) >10.0% -0.077*** 0.0195 -3.95 0.000
2) 0.0-2.5% 3) 2.5-5.0% -0.064 0.0434 -1.47 0.145
2) 0.0-2.5% 4) 5.0-10.0% -0.095** 0.0339 -2.80 0.006
2) 0.0-2.5% 5) >10.0% -0.173*** 0.0318 -5.42 0.000
3) 2.5-5.0% 4) 5.0-10.0% -0.031 0.0437 -0.71 0.482
3) 2.5-5.0% 5) >10.0% -0.109** 0.0381 -2.85 0.005
4) 5.0-10.0% 5) >10.0% -0.078* 0.0306 -2.54 0.013
* Difference is significant (p<.05) **Difference is significant (p<.01) ***Difference is significant (p<.001)

139
Appendix CResults from the 2007-08
Standards Assessment Inventory (nationaL staff deveLopment CounCiL)
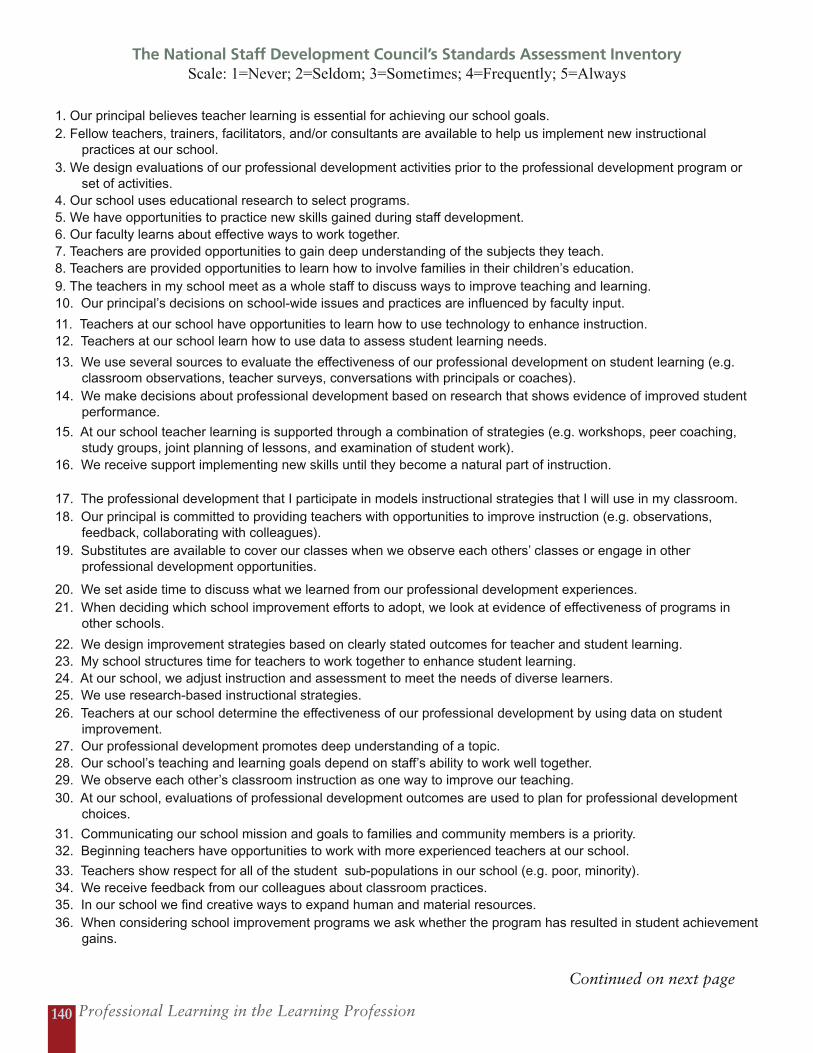
Professional Learning in the Learning Profession140
The National Staff Development Council’s Standards Assessment InventoryScale: 1=Never; 2=Seldom; 3=Sometimes; 4=Frequently; 5=Always
1. Our principal believes teacher learning is essential for achieving our school goals.2. Fellow teachers, trainers, facilitators, and/or consultants are available to help us implement new instructional
practices at our school.3. We design evaluations of our professional development activities prior to the professional development program or
set of activities.4. Our school uses educational research to select programs.5. We have opportunities to practice new skills gained during staff development.6. Our faculty learns about effective ways to work together.7. Teachers are provided opportunities to gain deep understanding of the subjects they teach.8. Teachers are provided opportunities to learn how to involve families in their children’s education.9. The teachers in my school meet as a whole staff to discuss ways to improve teaching and learning.10. Our principal’s decisions on school-wide issues and practices are influenced by faculty input.
11. Teachers at our school have opportunities to learn how to use technology to enhance instruction.12. Teachers at our school learn how to use data to assess student learning needs.
13. We use several sources to evaluate the effectiveness of our professional development on student learning (e.g. classroom observations, teacher surveys, conversations with principals or coaches).
14. We make decisions about professional development based on research that shows evidence of improved student performance.
15. At our school teacher learning is supported through a combination of strategies (e.g. workshops, peer coaching, study groups, joint planning of lessons, and examination of student work).
16. We receive support implementing new skills until they become a natural part of instruction.
17. The professional development that I participate in models instructional strategies that I will use in my classroom.18. Our principal is committed to providing teachers with opportunities to improve instruction (e.g. observations,
feedback, collaborating with colleagues).19. Substitutes are available to cover our classes when we observe each others’ classes or engage in other
professional development opportunities.
20. We set aside time to discuss what we learned from our professional development experiences.21. When deciding which school improvement efforts to adopt, we look at evidence of effectiveness of programs in
other schools.
22. We design improvement strategies based on clearly stated outcomes for teacher and student learning.23. My school structures time for teachers to work together to enhance student learning.24. At our school, we adjust instruction and assessment to meet the needs of diverse learners.25. We use research-based instructional strategies.26. Teachers at our school determine the effectiveness of our professional development by using data on student
improvement.27. Our professional development promotes deep understanding of a topic.28. Our school’s teaching and learning goals depend on staff’s ability to work well together.29. We observe each other’s classroom instruction as one way to improve our teaching.30. At our school, evaluations of professional development outcomes are used to plan for professional development
choices.
31. Communicating our school mission and goals to families and community members is a priority.32. Beginning teachers have opportunities to work with more experienced teachers at our school.
33. Teachers show respect for all of the student sub-populations in our school (e.g. poor, minority).34. We receive feedback from our colleagues about classroom practices.35. In our school we find creative ways to expand human and material resources.36. When considering school improvement programs we ask whether the program has resulted in student achievement
gains.
Continued on next page

Appendix C 141
37. Teachers at our school expect high academic achievement for all of our students.38. Teacher professional development is part of our school improvement plan.39. Teachers use student data to plan professional development programs.40. School leaders work with community members to help students achieve academic goals.
41. The school improvement programs we adopt have been effective with student populations similar to ours.42. At my school, teachers learn through a variety of methods (e.g. hands-on activities, discussion, dialogue, writing,
demonstrations, practice with feedback, group problem solving).43. Our school leaders encourage sharing responsibility to achieve school goals.44. We are focused on creating positive relationships between teachers and students.45. Our principal fosters a school culture that is focused on instructional improvement.46. Teachers use student data when discussing instruction and curriculum.47. Our principal models how to build relationships with students’ families.48. I would use the word, empowering, to describe my principal.49. School goals determine how resources are allocated.50. Teachers analyze classroom data with each other to improve student learning.51. We use students’ classroom performance to assess the success of teachers’ professional development
experiences.52. Teachers’ prior knowledge and experience are taken into consideration when designing staff development at our
school.53. At our school, teachers can choose the types of professional development they receive (e.g. study group, action
research, observations).
54. Our school’s professional development helps me learn about effective student assessment techniques.55. Teachers work with families to help them support students’ learning at home.56. Teachers examine student work with each other.57. When we adopt school improvement initiatives we stay with them long enough to see if changes in instructional
practice and student performance occur.58. Our principal models effective collaboration.
59. Teachers receive training on curriculum and instruction for students at different levels of learning.60. Our administrators engage teachers in conversations about instruction and student learning.
Source: National Staff Development Council Survey, 2007-08
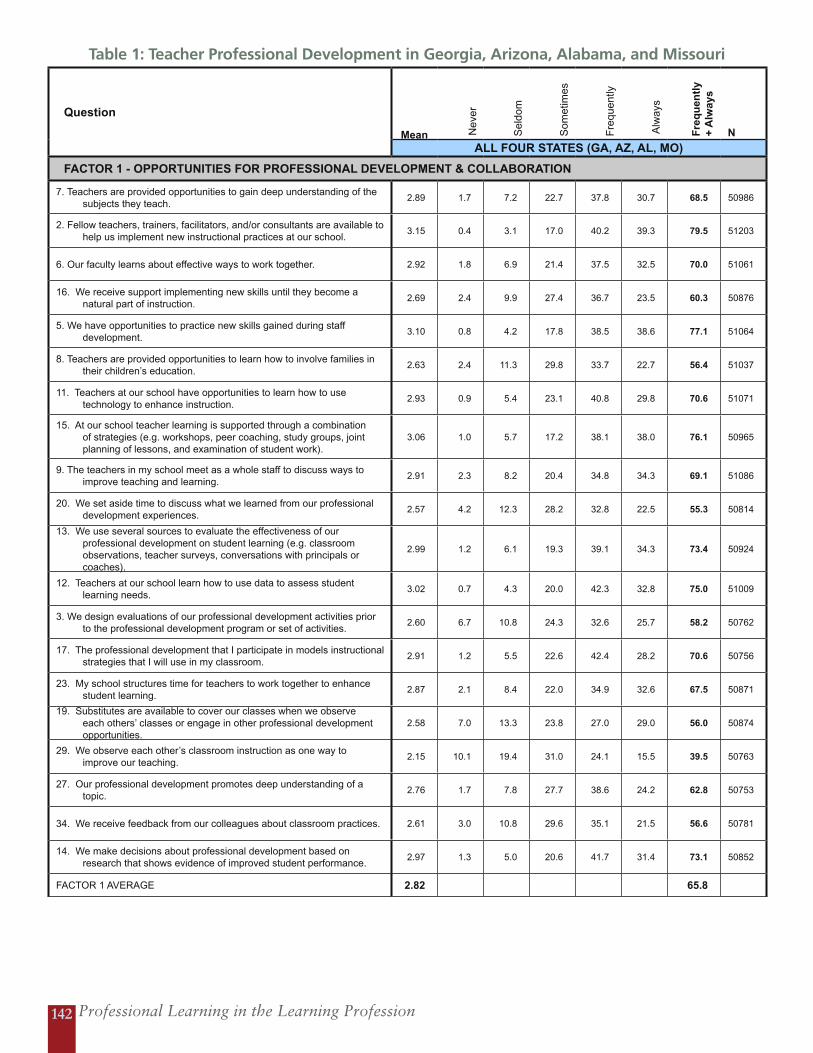
Professional Learning in the Learning Profession142
Table 1: Teacher Professional Development in Georgia, Arizona, Alabama, and Missouri
Question
Mean Nev
er
Sel
dom
Som
etim
es
Fre
quen
tly
Alw
ays
Fre
qu
entl
y
+ A
lway
s
N
ALL FOUR STATES (GA, AZ, AL, MO)
FACTOR 1 - OPPORTUNITIES FOR PROFESSIONAL DEVELOPMENT & COLLABORATION
7. Teachers are provided opportunities to gain deep understanding of the subjects they teach.
2.89 1.7 7.2 22.7 37.8 30.7 68.5 50986
2. Fellow teachers, trainers, facilitators, and/or consultants are available to help us implement new instructional practices at our school.
3.15 0.4 3.1 17.0 40.2 39.3 79.5 51203
6. Our faculty learns about effective ways to work together. 2.92 1.8 6.9 21.4 37.5 32.5 70.0 51061
16. We receive support implementing new skills until they become a natural part of instruction.
2.69 2.4 9.9 27.4 36.7 23.5 60.3 50876
5. We have opportunities to practice new skills gained during staff development.
3.10 0.8 4.2 17.8 38.5 38.6 77.1 51064
8. Teachers are provided opportunities to learn how to involve families in their children’s education.
2.63 2.4 11.3 29.8 33.7 22.7 56.4 51037
11. Teachers at our school have opportunities to learn how to use technology to enhance instruction.
2.93 0.9 5.4 23.1 40.8 29.8 70.6 51071
15. At our school teacher learning is supported through a combination of strategies (e.g. workshops, peer coaching, study groups, joint planning of lessons, and examination of student work).
3.06 1.0 5.7 17.2 38.1 38.0 76.1 50965
9. The teachers in my school meet as a whole staff to discuss ways to improve teaching and learning.
2.91 2.3 8.2 20.4 34.8 34.3 69.1 51086
20. We set aside time to discuss what we learned from our professional development experiences.
2.57 4.2 12.3 28.2 32.8 22.5 55.3 50814
13. We use several sources to evaluate the effectiveness of our professional development on student learning (e.g. classroom observations, teacher surveys, conversations with principals or coaches).
2.99 1.2 6.1 19.3 39.1 34.3 73.4 50924
12. Teachers at our school learn how to use data to assess student learning needs.
3.02 0.7 4.3 20.0 42.3 32.8 75.0 51009
3. We design evaluations of our professional development activities prior to the professional development program or set of activities.
2.60 6.7 10.8 24.3 32.6 25.7 58.2 50762
17. The professional development that I participate in models instructional strategies that I will use in my classroom.
2.91 1.2 5.5 22.6 42.4 28.2 70.6 50756
23. My school structures time for teachers to work together to enhance student learning.
2.87 2.1 8.4 22.0 34.9 32.6 67.5 50871
19. Substitutes are available to cover our classes when we observe each others’ classes or engage in other professional development opportunities.
2.58 7.0 13.3 23.8 27.0 29.0 56.0 50874
29. We observe each other’s classroom instruction as one way to improve our teaching.
2.15 10.1 19.4 31.0 24.1 15.5 39.5 50763
27. Our professional development promotes deep understanding of a topic.
2.76 1.7 7.8 27.7 38.6 24.2 62.8 50753
34. We receive feedback from our colleagues about classroom practices. 2.61 3.0 10.8 29.6 35.1 21.5 56.6 50781
14. We make decisions about professional development based on research that shows evidence of improved student performance.
2.97 1.3 5.0 20.6 41.7 31.4 73.1 50852
FACTOR 1 AVERAGE 2.82 65.8
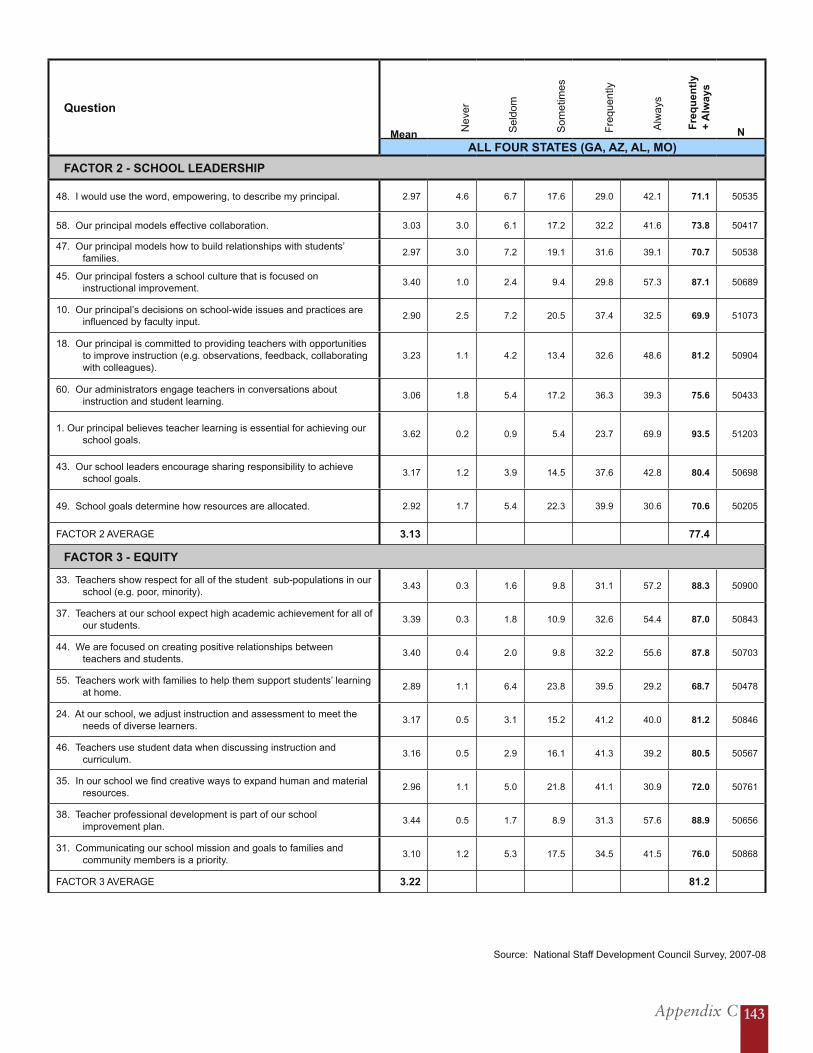
Appendix C 143
Question
Mean Nev
er
Sel
dom
Som
etim
es
Fre
quen
tly
Alw
ays
Fre
qu
entl
y +
Alw
ays
N
ALL FOUR STATES (GA, AZ, AL, MO)
FACTOR 2 - SCHOOL LEADERSHIP
48. I would use the word, empowering, to describe my principal. 2.97 4.6 6.7 17.6 29.0 42.1 71.1 50535
58. Our principal models effective collaboration. 3.03 3.0 6.1 17.2 32.2 41.6 73.8 50417
47. Our principal models how to build relationships with students’ families.
2.97 3.0 7.2 19.1 31.6 39.1 70.7 50538
45. Our principal fosters a school culture that is focused on instructional improvement.
3.40 1.0 2.4 9.4 29.8 57.3 87.1 50689
10. Our principal’s decisions on school-wide issues and practices are influenced by faculty input.
2.90 2.5 7.2 20.5 37.4 32.5 69.9 51073
18. Our principal is committed to providing teachers with opportunities to improve instruction (e.g. observations, feedback, collaborating with colleagues).
3.23 1.1 4.2 13.4 32.6 48.6 81.2 50904
60. Our administrators engage teachers in conversations about instruction and student learning.
3.06 1.8 5.4 17.2 36.3 39.3 75.6 50433
1. Our principal believes teacher learning is essential for achieving our school goals.
3.62 0.2 0.9 5.4 23.7 69.9 93.5 51203
43. Our school leaders encourage sharing responsibility to achieve school goals.
3.17 1.2 3.9 14.5 37.6 42.8 80.4 50698
49. School goals determine how resources are allocated. 2.92 1.7 5.4 22.3 39.9 30.6 70.6 50205
FACTOR 2 AVERAGE 3.13 77.4
FACTOR 3 - EQUITY
33. Teachers show respect for all of the student sub-populations in our school (e.g. poor, minority).
3.43 0.3 1.6 9.8 31.1 57.2 88.3 50900
37. Teachers at our school expect high academic achievement for all of our students.
3.39 0.3 1.8 10.9 32.6 54.4 87.0 50843
44. We are focused on creating positive relationships between teachers and students.
3.40 0.4 2.0 9.8 32.2 55.6 87.8 50703
55. Teachers work with families to help them support students’ learning at home.
2.89 1.1 6.4 23.8 39.5 29.2 68.7 50478
24. At our school, we adjust instruction and assessment to meet the needs of diverse learners.
3.17 0.5 3.1 15.2 41.2 40.0 81.2 50846
46. Teachers use student data when discussing instruction and curriculum.
3.16 0.5 2.9 16.1 41.3 39.2 80.5 50567
35. In our school we find creative ways to expand human and material resources.
2.96 1.1 5.0 21.8 41.1 30.9 72.0 50761
38. Teacher professional development is part of our school improvement plan.
3.44 0.5 1.7 8.9 31.3 57.6 88.9 50656
31. Communicating our school mission and goals to families and community members is a priority.
3.10 1.2 5.3 17.5 34.5 41.5 76.0 50868
FACTOR 3 AVERAGE 3.22 81.2
Source: National Staff Development Council Survey, 2007-08
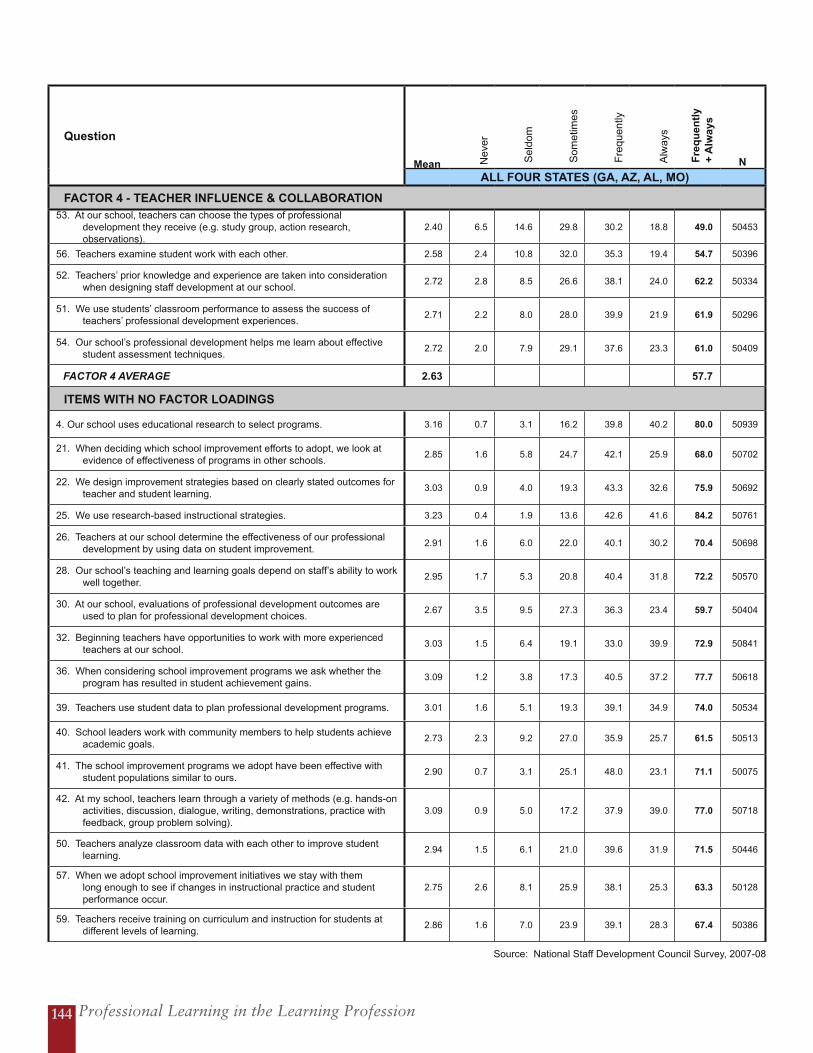
Professional Learning in the Learning Profession144
Question
Mean Nev
er
Sel
dom
Som
etim
es
Fre
quen
tly
Alw
ays
Fre
qu
entl
y +
Alw
ays
N
ALL FOUR STATES (GA, AZ, AL, MO)
FACTOR 4 - TEACHER INFLUENCE & COLLABORATION 53. At our school, teachers can choose the types of professional
development they receive (e.g. study group, action research, observations).
2.40 6.5 14.6 29.8 30.2 18.8 49.0 50453
56. Teachers examine student work with each other. 2.58 2.4 10.8 32.0 35.3 19.4 54.7 50396
52. Teachers’ prior knowledge and experience are taken into consideration when designing staff development at our school.
2.72 2.8 8.5 26.6 38.1 24.0 62.2 50334
51. We use students’ classroom performance to assess the success of teachers’ professional development experiences.
2.71 2.2 8.0 28.0 39.9 21.9 61.9 50296
54. Our school’s professional development helps me learn about effective student assessment techniques.
2.72 2.0 7.9 29.1 37.6 23.3 61.0 50409
FACTOR 4 AVERAGE 2.63 57.7
ITEMS WITH NO FACTOR LOADINGS
4. Our school uses educational research to select programs. 3.16 0.7 3.1 16.2 39.8 40.2 80.0 50939
21. When deciding which school improvement efforts to adopt, we look at evidence of effectiveness of programs in other schools.
2.85 1.6 5.8 24.7 42.1 25.9 68.0 50702
22. We design improvement strategies based on clearly stated outcomes for teacher and student learning.
3.03 0.9 4.0 19.3 43.3 32.6 75.9 50692
25. We use research-based instructional strategies. 3.23 0.4 1.9 13.6 42.6 41.6 84.2 50761
26. Teachers at our school determine the effectiveness of our professional development by using data on student improvement.
2.91 1.6 6.0 22.0 40.1 30.2 70.4 50698
28. Our school’s teaching and learning goals depend on staff’s ability to work well together.
2.95 1.7 5.3 20.8 40.4 31.8 72.2 50570
30. At our school, evaluations of professional development outcomes are used to plan for professional development choices.
2.67 3.5 9.5 27.3 36.3 23.4 59.7 50404
32. Beginning teachers have opportunities to work with more experienced teachers at our school.
3.03 1.5 6.4 19.1 33.0 39.9 72.9 50841
36. When considering school improvement programs we ask whether the program has resulted in student achievement gains.
3.09 1.2 3.8 17.3 40.5 37.2 77.7 50618
39. Teachers use student data to plan professional development programs. 3.01 1.6 5.1 19.3 39.1 34.9 74.0 50534
40. School leaders work with community members to help students achieve academic goals.
2.73 2.3 9.2 27.0 35.9 25.7 61.5 50513
41. The school improvement programs we adopt have been effective with student populations similar to ours.
2.90 0.7 3.1 25.1 48.0 23.1 71.1 50075
42. At my school, teachers learn through a variety of methods (e.g. hands-on activities, discussion, dialogue, writing, demonstrations, practice with feedback, group problem solving).
3.09 0.9 5.0 17.2 37.9 39.0 77.0 50718
50. Teachers analyze classroom data with each other to improve student learning.
2.94 1.5 6.1 21.0 39.6 31.9 71.5 50446
57. When we adopt school improvement initiatives we stay with them long enough to see if changes in instructional practice and student performance occur.
2.75 2.6 8.1 25.9 38.1 25.3 63.3 50128
59. Teachers receive training on curriculum and instruction for students at different levels of learning.
2.86 1.6 7.0 23.9 39.1 28.3 67.4 50386
Source: National Staff Development Council Survey, 2007-08
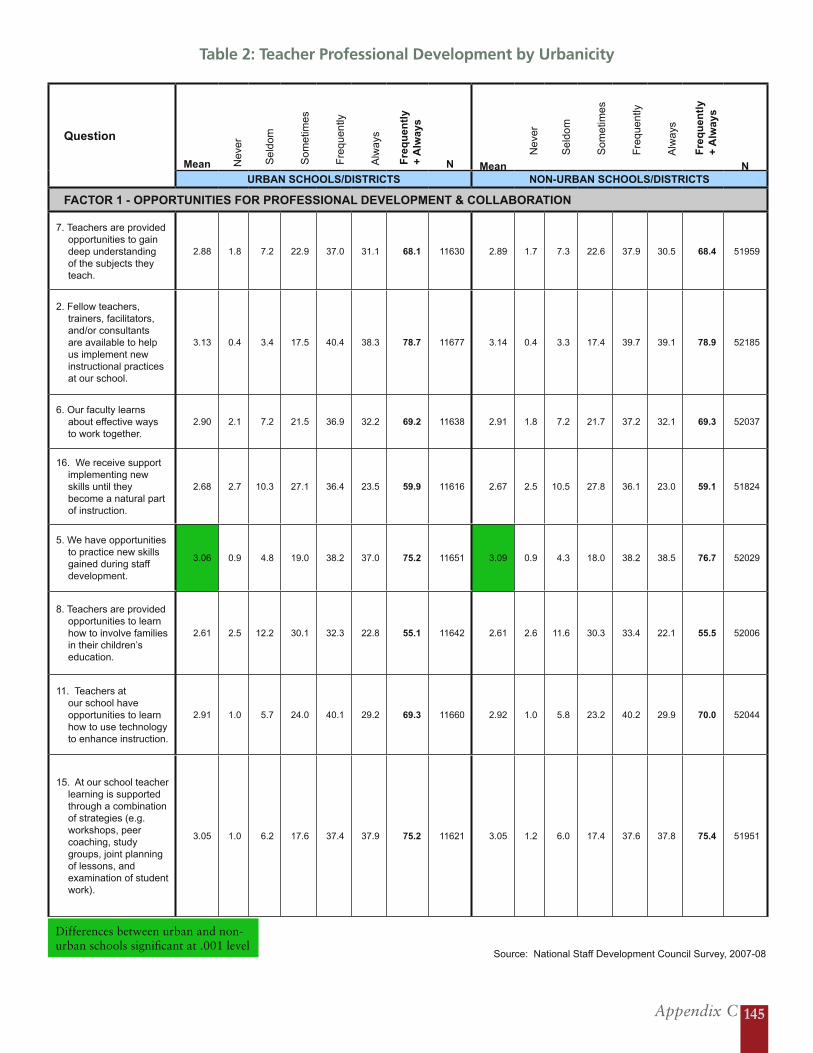
Appendix C 145
Table 2: Teacher Professional Development by Urbanicity
Question
Mean Nev
er
Sel
dom
Som
etim
es
Fre
quen
tly
Alw
ays
Fre
qu
entl
y +
Alw
ays
N Mean N
ever
S
eldo
m
S
omet
imes
F
requ
ently
A
lway
s
F
req
uen
tly
+
Alw
ays
NURBAN SCHOOLS/DISTRICTS NON-URBAN SCHOOLS/DISTRICTS
FACTOR 1 - OPPORTUNITIES FOR PROFESSIONAL DEVELOPMENT & COLLABORATION
7. Teachers are provided opportunities to gain deep understanding of the subjects they teach.
2.88 1.8 7.2 22.9 37.0 31.1 68.1 11630 2.89 1.7 7.3 22.6 37.9 30.5 68.4 51959
2. Fellow teachers, trainers, facilitators, and/or consultants are available to help us implement new instructional practices at our school.
3.13 0.4 3.4 17.5 40.4 38.3 78.7 11677 3.14 0.4 3.3 17.4 39.7 39.1 78.9 52185
6. Our faculty learns about effective ways to work together.
2.90 2.1 7.2 21.5 36.9 32.2 69.2 11638 2.91 1.8 7.2 21.7 37.2 32.1 69.3 52037
16. We receive support implementing new skills until they become a natural part of instruction.
2.68 2.7 10.3 27.1 36.4 23.5 59.9 11616 2.67 2.5 10.5 27.8 36.1 23.0 59.1 51824
5. We have opportunities to practice new skills gained during staff development.
3.06 0.9 4.8 19.0 38.2 37.0 75.2 11651 3.09 0.9 4.3 18.0 38.2 38.5 76.7 52029
8. Teachers are provided opportunities to learn how to involve families in their children’s education.
2.61 2.5 12.2 30.1 32.3 22.8 55.1 11642 2.61 2.6 11.6 30.3 33.4 22.1 55.5 52006
11. Teachers at our school have opportunities to learn how to use technology to enhance instruction.
2.91 1.0 5.7 24.0 40.1 29.2 69.3 11660 2.92 1.0 5.8 23.2 40.2 29.9 70.0 52044
15. At our school teacher learning is supported through a combination of strategies (e.g. workshops, peer coaching, study groups, joint planning of lessons, and examination of student work).
3.05 1.0 6.2 17.6 37.4 37.9 75.2 11621 3.05 1.2 6.0 17.4 37.6 37.8 75.4 51951
Differences between urban and non-urban schools significant at .001 level
Source: National Staff Development Council Survey, 2007-08
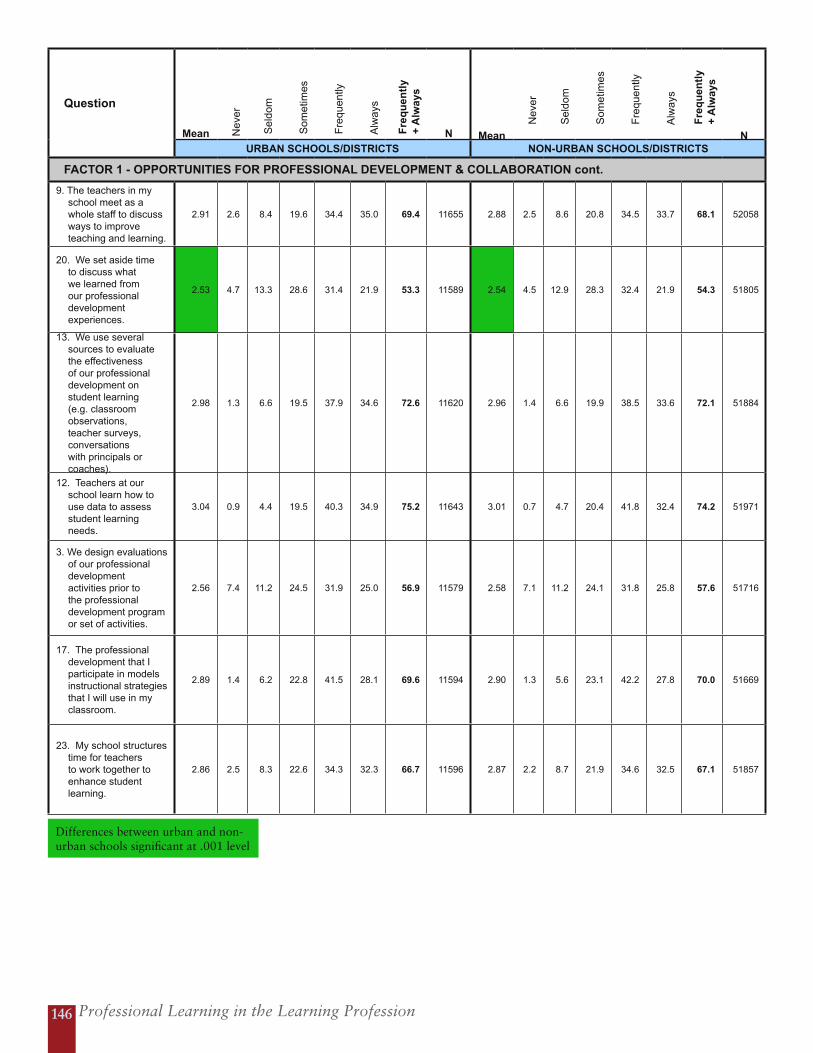
Professional Learning in the Learning Profession146
Question
Mean Nev
er
Sel
dom
Som
etim
es
Fre
quen
tly
Alw
ays
Fre
qu
entl
y +
Alw
ays
N Mean N
ever
S
eldo
m
S
omet
imes
F
requ
ently
A
lway
s
F
req
uen
tly
+
Alw
ays
NURBAN SCHOOLS/DISTRICTS NON-URBAN SCHOOLS/DISTRICTS
FACTOR 1 - OPPORTUNITIES FOR PROFESSIONAL DEVELOPMENT & COLLABORATION cont.
9. The teachers in my school meet as a whole staff to discuss ways to improve teaching and learning.
2.91 2.6 8.4 19.6 34.4 35.0 69.4 11655 2.88 2.5 8.6 20.8 34.5 33.7 68.1 52058
20. We set aside time to discuss what we learned from our professional development experiences.
2.53 4.7 13.3 28.6 31.4 21.9 53.3 11589 2.54 4.5 12.9 28.3 32.4 21.9 54.3 51805
13. We use several sources to evaluate the effectiveness of our professional development on student learning (e.g. classroom observations, teacher surveys, conversations with principals or coaches).
2.98 1.3 6.6 19.5 37.9 34.6 72.6 11620 2.96 1.4 6.6 19.9 38.5 33.6 72.1 51884
12. Teachers at our school learn how to use data to assess student learning needs.
3.04 0.9 4.4 19.5 40.3 34.9 75.2 11643 3.01 0.7 4.7 20.4 41.8 32.4 74.2 51971
3. We design evaluations of our professional development activities prior to the professional development program or set of activities.
2.56 7.4 11.2 24.5 31.9 25.0 56.9 11579 2.58 7.1 11.2 24.1 31.8 25.8 57.6 51716
17. The professional development that I participate in models instructional strategies that I will use in my classroom.
2.89 1.4 6.2 22.8 41.5 28.1 69.6 11594 2.90 1.3 5.6 23.1 42.2 27.8 70.0 51669
23. My school structures time for teachers to work together to enhance student learning.
2.86 2.5 8.3 22.6 34.3 32.3 66.7 11596 2.87 2.2 8.7 21.9 34.6 32.5 67.1 51857
Differences between urban and non-urban schools significant at .001 level
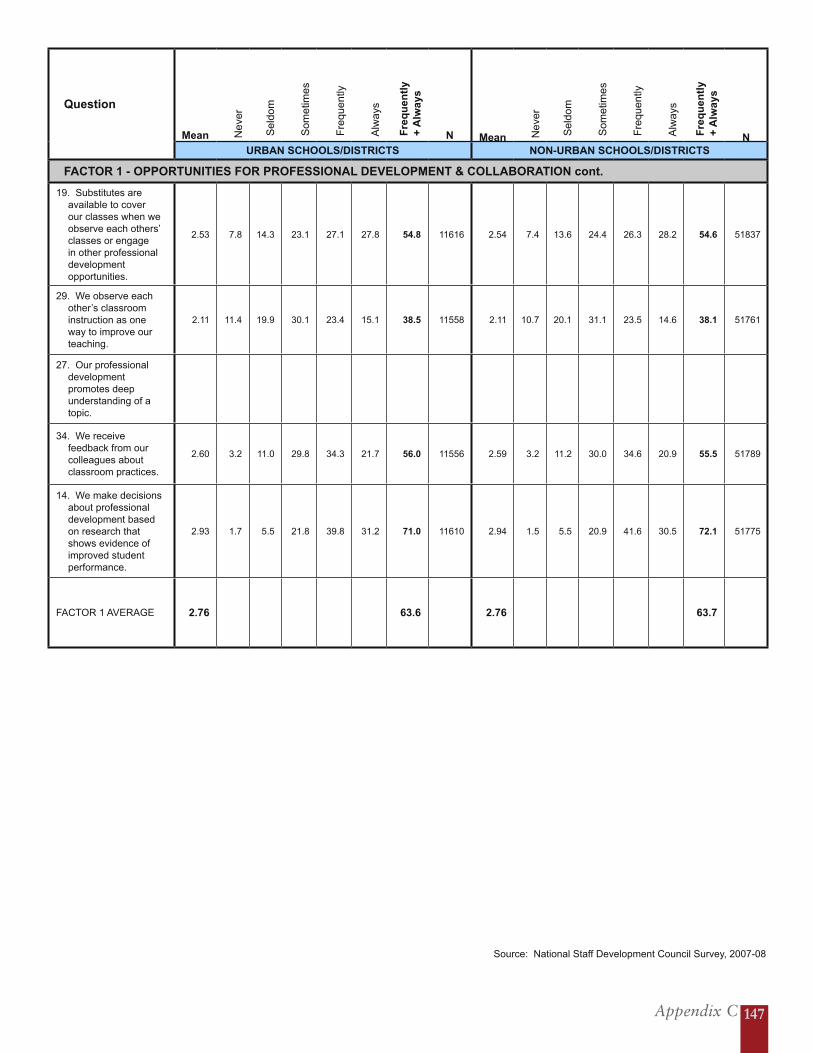
Appendix C 147
Question
Mean Nev
er
Sel
dom
Som
etim
es
Fre
quen
tly
Alw
ays
Fre
qu
entl
y +
Alw
ays
N Mean Nev
er
Sel
dom
Som
etim
es
Fre
quen
tly
Alw
ays
Fre
qu
entl
y +
Alw
ays
NURBAN SCHOOLS/DISTRICTS NON-URBAN SCHOOLS/DISTRICTS
FACTOR 1 - OPPORTUNITIES FOR PROFESSIONAL DEVELOPMENT & COLLABORATION cont.
19. Substitutes are available to cover our classes when we observe each others’ classes or engage in other professional development opportunities.
2.53 7.8 14.3 23.1 27.1 27.8 54.8 11616 2.54 7.4 13.6 24.4 26.3 28.2 54.6 51837
29. We observe each other’s classroom instruction as one way to improve our teaching.
2.11 11.4 19.9 30.1 23.4 15.1 38.5 11558 2.11 10.7 20.1 31.1 23.5 14.6 38.1 51761
27. Our professional development promotes deep understanding of a topic.
34. We receive feedback from our colleagues about classroom practices.
2.60 3.2 11.0 29.8 34.3 21.7 56.0 11556 2.59 3.2 11.2 30.0 34.6 20.9 55.5 51789
14. We make decisions about professional development based on research that shows evidence of improved student performance.
2.93 1.7 5.5 21.8 39.8 31.2 71.0 11610 2.94 1.5 5.5 20.9 41.6 30.5 72.1 51775
FACTOR 1 AVERAGE 2.76 63.6 2.76 63.7
Source: National Staff Development Council Survey, 2007-08

Professional Learning in the Learning Profession148
Question
Mean N
ever
S
eldo
m
S
omet
imes
F
requ
ently
A
lway
s
F
req
uen
tly
+
Alw
ays
N Mean Nev
er
Sel
dom
Som
etim
es
Fre
quen
tly
Alw
ays
Fre
qu
entl
y +
Alw
ays
NURBAN SCHOOLS/DISTRICTS NON-URBAN SCHOOLS/DISTRICTS
FACTOR 2 - SCHOOL LEADERSHIP
48. I would use the word, empowering, to describe my principal.
2.91 6.1 7.1 17.7 28.2 40.8 69.1 11553 2.97 4.5 6.7 17.8 29.0 42.0 71.0 51455
58. Our principal models effective collaboration.
2.97 4.0 6.9 17.7 31.3 40.1 71.5 11499 3.03 2.9 6.1 17.3 32.2 41.6 73.7 51349
47. Our principal models how to build relationships with students’ families.
2.90 4.0 8.0 19.4 31.3 37.3 68.6 11536 2.96 3.1 7.3 19.3 31.5 38.8 70.3 51492
45. Our principal fosters a school culture that is focused on instructional improvement.
3.33 1.4 3.0 10.7 30.4 54.5 84.9 11579 3.41 1.0 2.4 9.4 29.4 57.7 87.2 51630
10. Our principal’s decisions on school-wide issues and practices are influenced by faculty input.
2.83 3.1 8.5 21.3 35.9 31.1 67.0 11641 2.90 2.4 7.1 20.5 37.8 32.2 70.0 52058
18. Our principal is committed to providing teachers with opportunities to improve instruction (e.g. observations, feedback, collaborating with colleagues).
3.19 1.4 4.8 14.4 32.4 47.0 79.5 11612 3.23 1.2 4.4 13.7 32.2 48.6 80.8 51879
60. Our administrators engage teachers in conversations about instruction and student learning.
3.00 2.5 6.3 17.8 35.3 38.1 73.4 11505 3.06 1.7 5.5 17.3 36.2 39.3 75.5 51357
1. Our principal believes teacher learning is essential for achieving our school goals.
3.58 0.3 1.1 6.4 24.3 67.8 92.2 11669 3.63 0.2 0.9 5.3 23.2 70.4 93.6 52186
43. Our school leaders encourage sharing responsibility to achieve school goals.
3.12 1.6 4.5 15.6 37.0 41.3 78.3 11583 3.17 1.1 4.0 14.5 37.5 42.8 80.3 51644
49. School goals determine how resources are allocated.
2.92 2.2 5.6 21.8 39.1 31.3 70.4 11474 2.91 1.7 5.7 22.7 39.9 30.0 69.9 51101
FACTOR 2 AVERAGE3.07 75.5 3.13 77.2
Differences between urban and non-urban schools significant at .001 level
Differences between urban and non-urban schools significant at .01 level
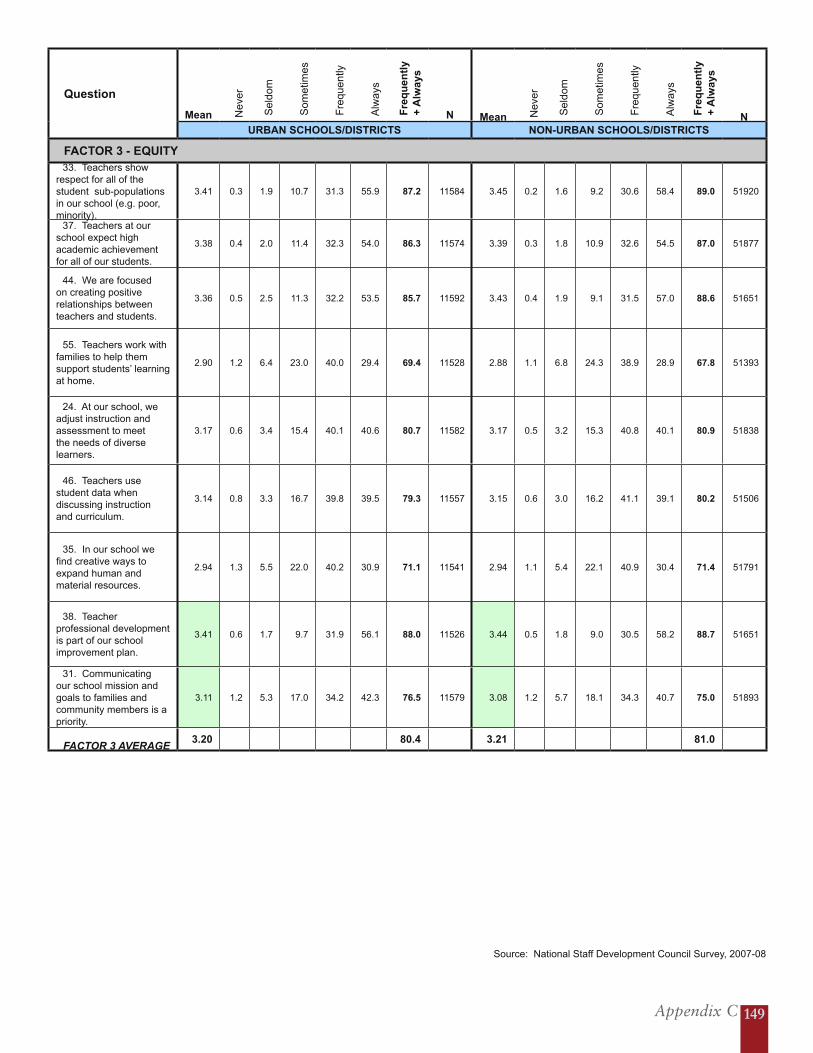
Appendix C 149
Question
Mean Nev
er
Sel
dom
Som
etim
es
Fre
quen
tly
Alw
ays
Fre
qu
entl
y +
Alw
ays
N Mean Nev
er
Sel
dom
Som
etim
es
Fre
quen
tly
Alw
ays
Fre
qu
entl
y +
Alw
ays
NURBAN SCHOOLS/DISTRICTS NON-URBAN SCHOOLS/DISTRICTS
FACTOR 3 - EQUITY33. Teachers show
respect for all of the student sub-populations in our school (e.g. poor, minority).
3.41 0.3 1.9 10.7 31.3 55.9 87.2 11584 3.45 0.2 1.6 9.2 30.6 58.4 89.0 51920
37. Teachers at our school expect high academic achievement for all of our students.
3.38 0.4 2.0 11.4 32.3 54.0 86.3 11574 3.39 0.3 1.8 10.9 32.6 54.5 87.0 51877
44. We are focused on creating positive relationships between teachers and students.
3.36 0.5 2.5 11.3 32.2 53.5 85.7 11592 3.43 0.4 1.9 9.1 31.5 57.0 88.6 51651
55. Teachers work with families to help them support students’ learning at home.
2.90 1.2 6.4 23.0 40.0 29.4 69.4 11528 2.88 1.1 6.8 24.3 38.9 28.9 67.8 51393
24. At our school, we adjust instruction and assessment to meet the needs of diverse learners.
3.17 0.6 3.4 15.4 40.1 40.6 80.7 11582 3.17 0.5 3.2 15.3 40.8 40.1 80.9 51838
46. Teachers use student data when discussing instruction and curriculum.
3.14 0.8 3.3 16.7 39.8 39.5 79.3 11557 3.15 0.6 3.0 16.2 41.1 39.1 80.2 51506
35. In our school we find creative ways to expand human and material resources.
2.94 1.3 5.5 22.0 40.2 30.9 71.1 11541 2.94 1.1 5.4 22.1 40.9 30.4 71.4 51791
38. Teacher professional development is part of our school improvement plan.
3.41 0.6 1.7 9.7 31.9 56.1 88.0 11526 3.44 0.5 1.8 9.0 30.5 58.2 88.7 51651
31. Communicating our school mission and goals to families and community members is a priority.
3.11 1.2 5.3 17.0 34.2 42.3 76.5 11579 3.08 1.2 5.7 18.1 34.3 40.7 75.0 51893
FACTOR 3 AVERAGE3.20 80.4 3.21 81.0
Source: National Staff Development Council Survey, 2007-08

Professional Learning in the Learning Profession150
Question
Mean N
ever
S
eldo
m
S
omet
imes
F
requ
ently
A
lway
s
F
req
uen
tly
+
Alw
ays
N Mean Nev
er
Sel
dom
Som
etim
es
Fre
quen
tly
Alw
ays
Fre
qu
entl
y +
Alw
ays
NURBAN SCHOOLS/DISTRICTS NON-URBAN SCHOOLS/DISTRICTS
FACTOR 4 - TEACHER INFLUENCE & COLLABORATION
53. At our school, teachers can choose the types of professional development they receive (e.g. study group, action research, observations).
2.41 6.9 14.2 29.1 30.6 19.2 49.8 11510 2.37 7.0 15.2 30.1 29.5 18.2 47.8 51370
56. Teachers examine student work with each other.
2.61 2.5 10.4 31.5 35.1 20.5 55.6 11498 2.59 2.4 10.9 31.8 35.4 19.5 55.0 51325
52. Teachers’ prior knowledge and experience are taken into consideration when designing staff development at our school.
2.71 3.2 8.6 26.3 37.6 24.2 61.8 11486 2.71 2.9 8.8 26.8 37.7 23.8 61.5 51216
51. We use students’ classroom performance to assess the success of teachers’ professional development experiences.
2.70 2.6 8.6 27.9 38.6 22.4 61.0 11463 2.68 2.6 8.5 28.3 39.3 21.3 60.6 51178
54. Our school’s professional development helps me learn about effective student assessment techniques.
2.70 2.6 8.5 28.8 36.7 23.4 60.1 11500 2.70 2.1 8.3 29.5 37.1 22.9 60.0 51333
FACTOR 4 AVERAGE 2.62 57.7 2.61 57.0
Differences between urban and non-urban schools significant at .001 level
Differences between urban and non-urban schools significant at .01 level
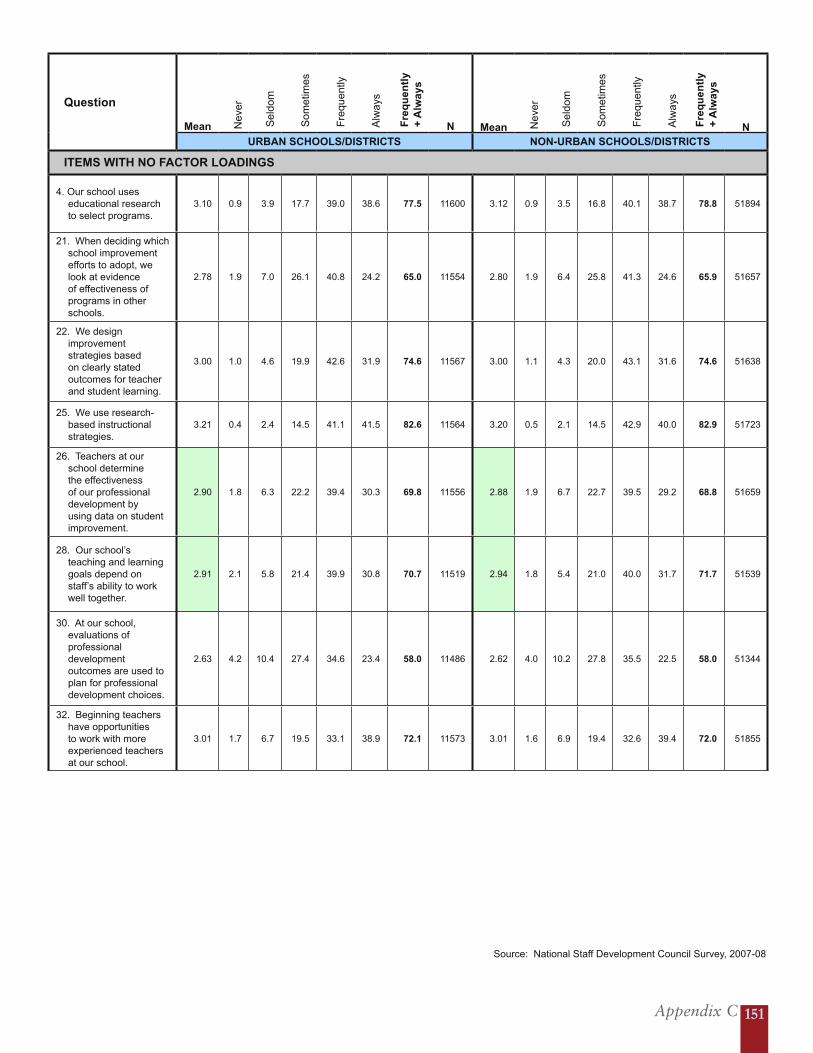
Appendix C 151
Question
Mean Nev
er
Sel
dom
Som
etim
es
Fre
quen
tly
Alw
ays
Fre
qu
entl
y +
Alw
ays
N Mean Nev
er
Sel
dom
Som
etim
es
Fre
quen
tly
Alw
ays
Fre
qu
entl
y +
Alw
ays
NURBAN SCHOOLS/DISTRICTS NON-URBAN SCHOOLS/DISTRICTS
ITEMS WITH NO FACTOR LOADINGS
4. Our school uses educational research to select programs.
3.10 0.9 3.9 17.7 39.0 38.6 77.5 11600 3.12 0.9 3.5 16.8 40.1 38.7 78.8 51894
21. When deciding which school improvement efforts to adopt, we look at evidence of effectiveness of programs in other schools.
2.78 1.9 7.0 26.1 40.8 24.2 65.0 11554 2.80 1.9 6.4 25.8 41.3 24.6 65.9 51657
22. We design improvement strategies based on clearly stated outcomes for teacher and student learning.
3.00 1.0 4.6 19.9 42.6 31.9 74.6 11567 3.00 1.1 4.3 20.0 43.1 31.6 74.6 51638
25. We use research-based instructional strategies.
3.21 0.4 2.4 14.5 41.1 41.5 82.6 11564 3.20 0.5 2.1 14.5 42.9 40.0 82.9 51723
26. Teachers at our school determine the effectiveness of our professional development by using data on student improvement.
2.90 1.8 6.3 22.2 39.4 30.3 69.8 11556 2.88 1.9 6.7 22.7 39.5 29.2 68.8 51659
28. Our school’s teaching and learning goals depend on staff’s ability to work well together.
2.91 2.1 5.8 21.4 39.9 30.8 70.7 11519 2.94 1.8 5.4 21.0 40.0 31.7 71.7 51539
30. At our school, evaluations of professional development outcomes are used to plan for professional development choices.
2.63 4.2 10.4 27.4 34.6 23.4 58.0 11486 2.62 4.0 10.2 27.8 35.5 22.5 58.0 51344
32. Beginning teachers have opportunities to work with more experienced teachers at our school.
3.01 1.7 6.7 19.5 33.1 38.9 72.1 11573 3.01 1.6 6.9 19.4 32.6 39.4 72.0 51855
Source: National Staff Development Council Survey, 2007-08
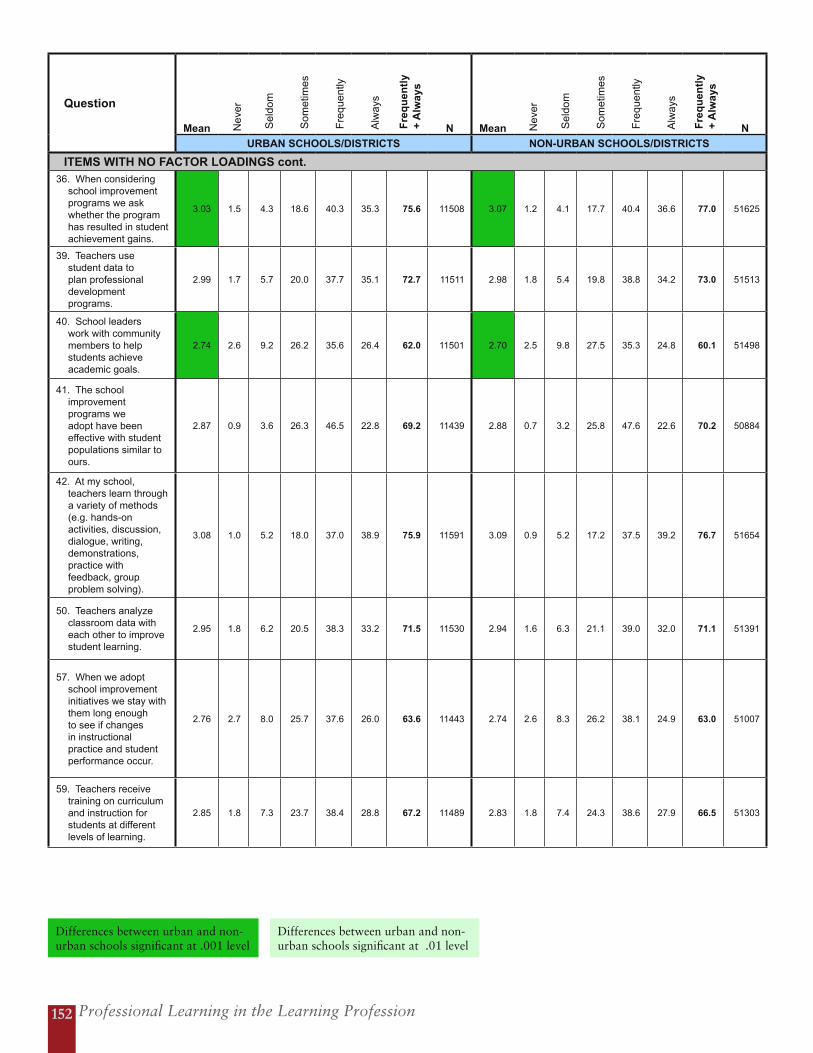
Professional Learning in the Learning Profession152
Question
Mean Nev
er
Sel
dom
Som
etim
es
Fre
quen
tly
Alw
ays
Fre
qu
entl
y +
Alw
ays
N Mean Nev
er
Sel
dom
Som
etim
es
Fre
quen
tly
Alw
ays
Fre
qu
entl
y +
Alw
ays
N
URBAN SCHOOLS/DISTRICTS NON-URBAN SCHOOLS/DISTRICTS
ITEMS WITH NO FACTOR LOADINGS cont.36. When considering
school improvement programs we ask whether the program has resulted in student achievement gains.
3.03 1.5 4.3 18.6 40.3 35.3 75.6 11508 3.07 1.2 4.1 17.7 40.4 36.6 77.0 51625
39. Teachers use student data to plan professional development programs.
2.99 1.7 5.7 20.0 37.7 35.1 72.7 11511 2.98 1.8 5.4 19.8 38.8 34.2 73.0 51513
40. School leaders work with community members to help students achieve academic goals.
2.74 2.6 9.2 26.2 35.6 26.4 62.0 11501 2.70 2.5 9.8 27.5 35.3 24.8 60.1 51498
41. The school improvement programs we adopt have been effective with student populations similar to ours.
2.87 0.9 3.6 26.3 46.5 22.8 69.2 11439 2.88 0.7 3.2 25.8 47.6 22.6 70.2 50884
42. At my school, teachers learn through a variety of methods (e.g. hands-on activities, discussion, dialogue, writing, demonstrations, practice with feedback, group problem solving).
3.08 1.0 5.2 18.0 37.0 38.9 75.9 11591 3.09 0.9 5.2 17.2 37.5 39.2 76.7 51654
50. Teachers analyze classroom data with each other to improve student learning.
2.95 1.8 6.2 20.5 38.3 33.2 71.5 11530 2.94 1.6 6.3 21.1 39.0 32.0 71.1 51391
57. When we adopt school improvement initiatives we stay with them long enough to see if changes in instructional practice and student performance occur.
2.76 2.7 8.0 25.7 37.6 26.0 63.6 11443 2.74 2.6 8.3 26.2 38.1 24.9 63.0 51007
59. Teachers receive training on curriculum and instruction for students at different levels of learning.
2.85 1.8 7.3 23.7 38.4 28.8 67.2 11489 2.83 1.8 7.4 24.3 38.6 27.9 66.5 51303
Differences between urban and non-urban schools significant at .001 level
Differences between urban and non-urban schools significant at .01 level