Embed Size (px)
Citation preview
Swedish University of Agricultural SciencesFaculty of Forest Sciences
Department of Forest Products, Uppsala
Liquid diesel biofuel production in Sweden– A study of producers using forestry-
or agricultural sector feedstock
Produktion av förnyelsebar diesel – en studie av producenter av biobränsle
från skogs- eller jordbrukssektorn
Erik Andræ
Master Thesis ISSN 1654-1367No 28 2009

Swedish University of Agricultural SciencesFaculty of Forest Sciences
Department of Forest Products, Uppsala
Liquid diesel biofuel production in Sweden– A study of producers using forestry-
or agricultural sector feedstock
Produktion av förnyelsebar diesel – en studie av producenter av biobränsle
från skogs- eller jordbrukssektorn
Erik Andræ
Master Thesis, 30 ECTS credits Advanced D-level in Business Administration (EX0485) MSc in Forestry 03/09
Supervisor: Anders Roos (SLU), Johan Vinterbäck (Energi och teknik, Bioenergi),Jonas Höglund (SVEBIO)Examinator: Folke Bohlin

Abstract The transportation sector is the only sector of the Swedish society that is still increasing the emissions of carbon dioxide and other green house gases. Diesel fuel represents one of the fuels that contributes to these emissions and the use of diesel fuels is increasing every year. The main purpose of this study was to make an estimation of the current business situation for producers of liquid diesel biofuels in Sweden such as biodiesel, synthetic diesel and crude tall diesel and examine the forces of competition of the industry today and its future prospects. The study revealed that the rivalry among the existing firms was low mainly due to the geographical spread of the companies. Moreover the success of the biodiesel industry was influenced by a long-term guarantee of the tax exempt for biofuels and by the price level of petroleum diesel. Biodiesel demand also benefits from the increasing trend of using alternative transportation fuels but there was at the same time a tendency of customer skepticism towards the fuel. The producers were therefore also influenced by both government policy and of the media. Expansion of the industry was limited by raw material availability and it was not likely to grow within the next couple of years and the overcapacity was about 20-30% for the whole industry. Most of the biodiesel in Sweden was sold to the oil companies that blended it in with conventional diesel and sold it as regular diesel fuel. The industry was also selling pure biodiesel fuel directly to mainly haulage firms or municipalities with heavy transport vehicles. The small-scale biodiesel producers were hoping that the car manufacturers would allow passenger cars to use pure biodiesel. The industry was also hoping to see that more municipalities included biodiesel as an option in their vehicle fuel procurement plans like ethanol and biogas. The producers of synthetic diesel and crude tall diesel in Sweden were still developing and none were on full commercial scale but respondents expressed that the market potential for their products was “almost unlimited”. A couple of the firms had the option to produce synthetic diesel but were primarily focusing on other fuels that were more raw material efficient. The crude tall diesel production was considered to be more limited by available resources in Sweden than the production of synthetic diesel of cellulosic biomass. The firms using forestry sector feedstock were otherwise facing similar difficulties and mostly with the authorities. As they were getting more established they were expecting competition primarily with the petroleum diesel price. This could be solved by selling the fuels to customers with demands on low emission fuels or with environmental policies. The study was conducted by interviewing all the biodiesel producers in Sweden and several of the companies that were entering the industry of producing biofuels from cellulosic biomass. The firms were asked individually about their perceptions on producing liquid diesel biofuels and the prospects of these fuels in the future. This report is therefore based on their thoughts and comments and presents both a general picture of the industries and what aspects were important to them. Keywords: transportation fuel, strategy, biodiesel, synthetic diesel, crude tall diesel
3
Sammanfattning Transportsektorn är den enda sektorn i Sverige som fortsätter att öka utsläppen av koldioxid och andra växthusgaser. Dieselbränslet är ett av de bränslen som bidrar till dessa utsläpp och användningen ökar för varje år. Syftet med denna studie var att undersöka affärssituationen för producenter av flytande dieselbränslen i Sverige så som biodiesel, syntetisk diesel och råtalldiesel och undersöka konkurrenskrafterna av industrierna idag och deras möjligheter i framtiden. Studien fann att rivaliteten mellan de befintliga biodieselproducenterna var låg eftersom företagen var spridda geografiskt. För framtiden var biodiesel industrin fortsatt beroende av skattebefrielse och utav utvecklingen av prisutvecklingen för fossil diesel. Efterfrågan på biodiesel gynnades av den ökande trenden i Sverige att använda biodrivmedel men det fanns samtidigt en viss misstro mot just biodieseln. Därför var producenterna även indirekt påverkade av politikens inriktning och utav medias rapportering. Biodieselindustrins expansion begränsades i stort av tillgången på råvara och producenterna skulle troligen inte expandera sin befintliga kapacitet de närmsta åren. Dessutom fanns redan 20-30% överkapacitet att utnyttja inom biodieselindustrin. Det mesta av biodieselproduktionen i Sverige såldes vid tidpunkten för studien till oljebolag som sedan låginblandade bränslet i med den fossila dieseln. Biodiesel såldes även ren direkt till främst åkerier och kommuner för användning i lastbilar och bussar. De småskaliga producenterna hoppades på att biltillverkare även skulle ge tillåtelse för personbilar att köra på biodiesel. Industrin som helhet önskade också att landets kommuner i större utsträckning skulle använda sig av biodiesel för kommunala transporter och minska sin ensidiga fokusering på etanol- eller biogasfordon vid upphandlingar. Producenter av råtalldiesel och syntetisk diesel i Sverige var fortfarande under utveckling och inget företag var ännu kommersiellt aktivt men respondenterna utryckte att marknadspotentialen för deras bränslen var ”nära obegränsad”. Ett par av företagen skulle ha möjlighet att producera syntetisk diesel men var primärt inriktade mot andra bränslen som de menade utnyttjade råvarorna effektivare. Produktionen av råtalldiesel var mer begränsad utav tillgången på Svensk råvara än produktionen av syntetisk diesel av cellulosabaserad biomassa. Annars stod producenter av bränslen från skogsbruks eller skogsindustriprodukter inför liknande villkor och förutsättningar för sin utveckling samt inför liknande svårigheter gentemot olika myndigheter. Den främsta konkurrenten som företagen såg för sin verksamhet var billig fossil diesel. Därför inriktade sig företagen mot kundgrupper med uttalad miljöpolicy eller som av andra orsaker efterfrågar bränslen med låga utsläpp. Denna studie baseras på telefonintervjuer mellan januari till mars 2009 med alla befintliga producenter av biodiesel i Sverige och med flera utav företagen i Sverige som etablerar sig inom industrin att producera biobränslen från främst cellulosabaserad biomassa. Företagen intervjuades enskilt om deras åsikter och uppfattningar kring verksamheten och om utsikterna att producera flytande biobränslen i Sverige som substituerar fossil diesel. Studien bygger därmed enbart på respondenternas egna tankar och kommentarer och detta utgör underlaget för att presentera en generell bild utav industrierna och vilka aspekter som var viktiga för företagen. Nyckelord: Biobränsleproduktion, bioenergistrategi, biodiesel, syntetisk diesel, råtalldiesel
4

Acknowledgements This report was written as a final thesis for the department of forest products at the Swedish University of Agricultural Sciences. The report was also written for Svebio, the Swedish Bioenergy Association. I am very thankful for the support of my supervisors and especially to Associate Professor Anders Roos. I am also grateful to Svebio for letting me write my final thesis for them and of assisting me in any of my questions about biofuels. My gratitude goes to all the company directors that have granted me in-depth interviews about their businesses. Also to the experts who have given me their time in explaining the major issues of the fuel industry and about bioenergy.
5
Table of contents Abstract………………………………………………………………………….…………..….3 Sammanfattning………………………………………………………………….……………..4 Acknowledgements………………………………..……………………………………...........5 List of figures and tables.……………………………………………………………..………..7 List of abbreviations and terminology………………………………………….…………...….8 1. INTRODUCTION………………………………..………………….…..….……………….9 1.1 Purpose..………………………………..…………………….…………….…………..…10 2. LIQUID DIESEL BIOFUELS – A LITERATURE REVIEW …………………………….11 3. THEORIES…………………………………...………..………………….………………..16 3.1 The Six Forces model......................……..…………..………...……………………….....16 3.2 PESTEL-analysis……….………………………………..………….…………………….20 3.3 SWOT-analysis……………..…………………..………………………………………....20 3.4 The process of choosing theories………..………………………………………………...21 4. METHODOLOGY………………………………………………..…………………..........22 5. RESULTS - Producers based on agricultural feedstock……………..…………..…....……28 5.1 Production………………………………………………..………………………………..28 5.2 Raw materials and supply…………………………………….………...…………………31 5.3 Markets and distribution..……………………………………….…...……………………34 5.4 Policy and regulations………………………….…………………….…………………...39 5.5 Future development.…………………………………………………….………………...43 6. RESULTS - Producers based on forest sector feedstock...…………..…………...……......47 6.1 Production ………………………………………………………………….……..………47 6.2 Raw materials and supply………………………………………..……….……………….50 6.3 Markets and distribution………………………………..………………….………...........52 6.4 Policy and regulations…………………………………………………………………….55 6.5 Future development…..………………………………………………………………...…58 7. ANALYSIS..……………………………………………………………………………….61 7.1 The Six Forces model: Production from agricultural sector feedstock…………………...61 7.2 The Six Forces model: Production from forest sector feedstock………………………….68 7.3 Pestel-analysis: Production from agricultural sector feedstock…………………………...74 7.4 Pestel-analysis: Production from forest sector feedstock…………………………………75 7.5 Swot-analysis: Production from agricultural sector feedstock……………………………77 7.6 Swot-analysis: Production from forest sector feedstock………………………………….77 8. DISCUSSION..……………………………………...……………………………………...79 8.1 Discussion……………..…………………………………………………………………..79 8.2 Conclusions and recommendations….…..………………………………………………..81 8.3 Limitations of the study………………….……………………………………..…………82 8.4 Further research……………………………….………………………………………..…83 9. REFERENCES...………………………………………………………..………………….84 10. APPENDICES...………………………………………………………..………………....91 Appendix I………….…………………………………………………………………………91 Appendix II…………….……………………………………………………………………...92 Publications from the Institute of forest products at the Swedish university of agricultural sciences.
6
List of figures and tables Figure 1.1 Biodiesel production process Figure 1.2 Synthetic diesel production process Figure 1.3 Crude tall diesel production process Figure 3.1 The Six Force model Figure 5.1 Starting year of biodiesel producers Figure 5.2 Biodiesel production capacity Figure 5.3 Planned changes of production capacity Figure 5.4 Raw materials for biodiesel production Figure 5.5 Effort to obtain raw materials Figure 5.6 Imports of raw materials Figure 5.7 Other feedstock Figure 5.8 Modified crop Figure 5.9 Markets to large and medium producers Figure 5.10 Markets to small-scale producers Figure 5.11 Marketing approach Figure 5.12 Distribution method of biodiesel Figure 5.13 Environmental certification Figure 5.14 Attitudes on means of control Figure 5.15 Dependence on means of control Figure 5.16 Establishment barriers Figure 7.1 Influence of the competitive forces Figure 7.2 Influence of the competitive forces Table 1.1 Barriers to biodiesel producers Table 5.1 Labor for biodiesel production Table 5.2 Origin of raw materials Table 5.3 Producers usage of biodiesel Table 5.4 Regulatory obstacles Table 5.5 Threats to biodiesel production Table 5.6 Opportunities for biodiesel Table 6.1 Type of businesses Table 6.2 Current progression stage Table 6.3 Labor force of the facilities Table 6.4 Feedstock options Table 6.5 Origin of the raw materials Table 6.6 Markets for synthetic diesel Table 6.7 Attitudes towards export Table 6.8 Distribution methods Table 6.9 Standards Table 6.10 Environmental certification Table 6.11 Attitudes on means of control Table 6.12 Dependence on policy measure Table 6.13 Regulatory obstacles Table 6.14 Establishment barriers Table 6.15 Threats Table 6.16 Opportunities Appendix II Map of the biodiesel producers
7
List of abbreviations and terminology Biodiesel = FAME after “fatty acid methyl ester”. Diesel fuel can be made from renewable
resources such as vegetable oils and animal fats (Johnsson, B 2006). Bioenergy = Carriers of energy that origin from biomass like agricultural plants or forests. Biofuel = A liquid or gaseous fuel that is produced from biological material and at combustion does not have net emissions of carbon dioxide. (SPI.se) Biomass = Biological material of products, by-products and residues of the agricultural- or forestry sector, industries and municipal waste. (Johnsson, B 2006) BTL = Biomass-to-liquid. Gasified biomass converted to liquid by the Fischer
Tropsch process. CTL = Coal-to-Liquid. Charcoal converted into liquid diesel using the FT-process. Diesel fuel = A size range of hydrocarbons sorted out from petroleum oil in a refinery. FAME = Fatty acid methyl ester. Oil and methanol make biodiesel and glycerol. Fischer = A process of converting carbon based gases into liquids and the gas can origin Tropsch from many different sources (natural gas, coal, biogas, biomass). The FT- (FT) diesel is a synthetic diesel and it was developed and used by Germany and was
used during the WWII due to limited supplies of imported petroleum. Generations = A categorization of technology development. There is no exact definition what
criteria the categorization is made on for biofuels. (Haraldsson, K 2009) One definition says that raw materials that are not used for the production of food products make up the “second generation” biofuels. (Festel, G 2008) The third generation is sometimes used for hydrogen driven vehicles and electric cars.
GTL = Gas-to-Liquid. Natural gas converted to synthetic diesel with the Fischer
Tropsch process. Liquid diesel = Biofuels of liquid form that substitute petroleum diesel fuel; such as biodiesel, biofuels crude tall diesel, synthetic diesel from biomass. Low admixture = Petroleum diesel with a smaller proportion (5-10%) of a liquid biofuel. LPG = Liquid Petroleum Gas Petroleum = Crude oil; that can be separated into various product categories with unique
characteristics and uses and one them is diesel fuel. RME = Rapeseed methyl ester. Biodiesel made out of rapeseed oil. Synthetic = Diesel fuel made from biomass (wood) or natural gas instead of petroleum.
8
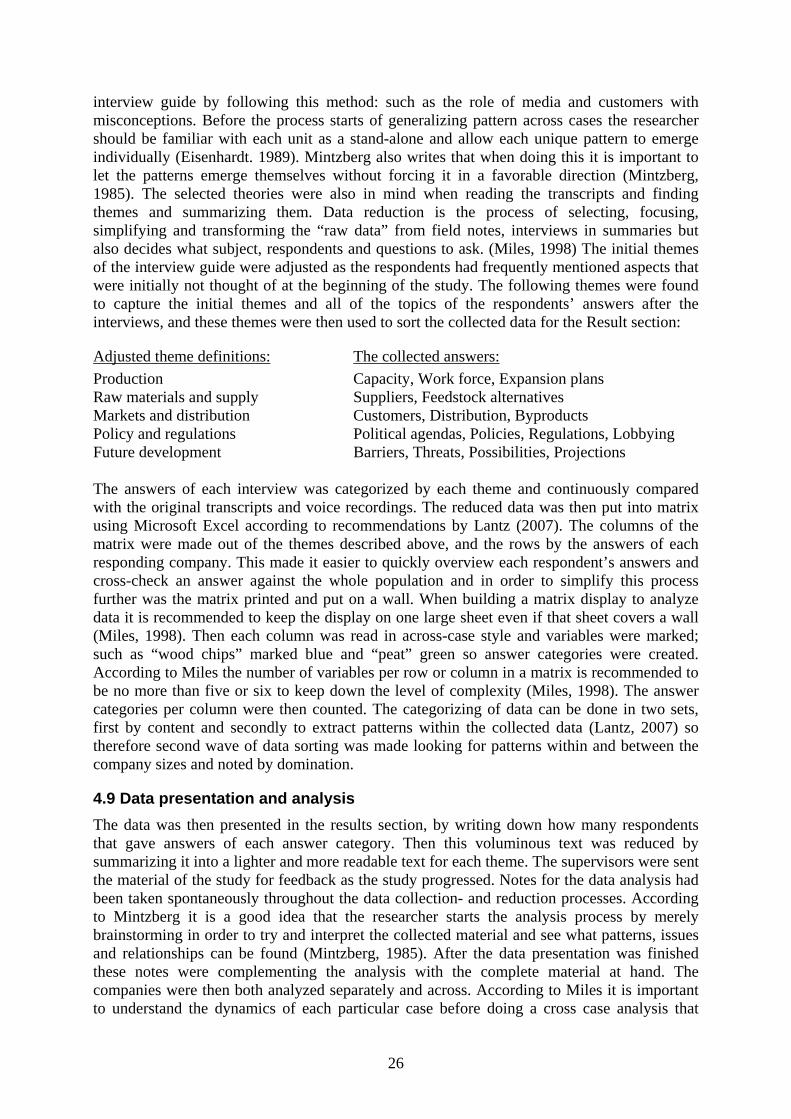
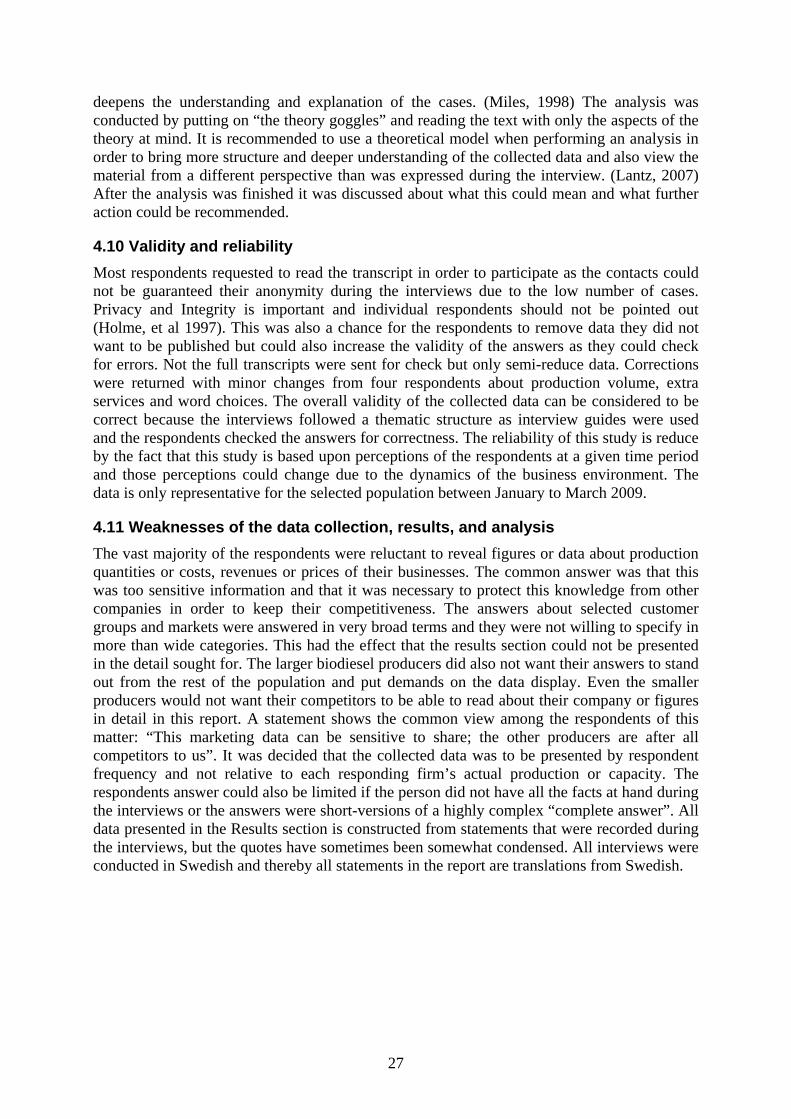
1. Introduction The transportation sector in Sweden accounts for about one quarter of the total energy consumption of the country, and about one third of the total carbon dioxide emissions. And this share is on the increase. This trend is common on a global scale as well. Therefore the European Union decided that by the year of 2020 all European countries must have converted 10% of their energy use of their transport sectors into alternative and renewable energy forms (www, EC, 2009). The transport sector constitutes of various means of transportations on land, in the air and on water. In Sweden the most important transportation form is road traffic. This constitutes of transportation of passengers and of goods where petrol and diesel are main fuels types. Diesel fuel is becoming more common every year and a shift from fossil diesel to diesel biofuel in Sweden would have an important impact on the country’s carbon emissions to the atmosphere. This report is about biofuels that substitute petroleum diesel fuel and how the producers of them are developing in Sweden. Diesel fuel is gaining shares of the total fuel demand in Sweden and at the same time the transport sector is growing annually. In the road based transportation segment diesel fuel is mainly used by heavy vehicles and buses but also by machines used in the industry and agricultural sector. In 2007 increased personal transports by +2.2% and the heavy goods transportation grew with +5.8% (NVV, 2008) but in total only 8.3% (SAE. 2008a) of the Swedish passenger cars had diesel engines. However, the market shares of newly bought diesel passenger cars increased from 10% in 2005 to 40.8% in January 2009 and closing in on the European average of 53% of newly sold vehicles according to BilSweden (2009). Also the use of biofuels in the Swedish transport sector is increasing every year and was 4.9% in 2008 (Energimyndigheten, 2009a) and the potential of biofuels have been estimated to substitute up to about 30% of the fuel consumption of the global transport sector by the year 2050 to 2100. (Energimyndigheten, 2007) The emissions and the environmental impact of the transportation sector could be reduced by replacing fossil fuels with alternative fuels from renewable resources such as electricity, hybrids, fuel cells or biofuels. The advantage of biofuels is that when one plant is combusted then another plant is grown that takes up the “same” amount of emissions so that the net emission is zero. The biofuels are divided into different categories: they can be classified as solid, liquid and gaseous biofuels. This report will only deal with liquid diesel biofuels and the liquid biofuels can furthermore be divided into biochemical and synthetic liquid biofuels. The biofuels can also be separated by origin where the “first generation biofuels” are made out of agricultural plants, and the “second generation biofuels” are made out of cellulosic material such as wood. The liquid diesel biofuel that is produced from agricultural feedstock is commonly called biodiesel or FAME. There are two types of liquid diesel biofuels produced from cellulosic biomass, and one is called synthetic diesel from biomass. The other is produced from a byproduct of the pulp mill processes and the fuel is called crude tall diesel. The situation of the industries that produce these fuels are investigated in this study. Large volumes of diesel biofuels are needed to be produced to substitute the 4.300.000m3 of petroleum diesel that is used annually in the Swedish transport sector. Therefore this study mapped the firms in Sweden that produce biodiesel and is establishing to produce synthetic diesel and crude tall diesel in order to get a picture of the situation of the liquid diesel biofuel production. The investigation has highlighted the important aspects these firms perceive themselves and could be used as a guideline when taking further action to improve the establishment of biofuels for the transportation sector.
9
This study has primarily a business economic perspective - its main interest is to present the competitive situation for the diesel biofuel industry. It does not intend to cover all aspects such as technical, political environmental or social features, unless those are important factors to the development of the industry in Sweden. The description gives an overview of biodiesel and other liquid diesel biofuels in Sweden and not a detailed and complete description of every topic concerning these fuels. On the other hand, this type of overview serves as a good basis for further and more focused studies in specific areas. The mapping of the producers is limited to biofuel producers in Sweden. Although biodiesel is the primary focus of this report other liquid diesel fuels from renewable resources are also considered; and those included in this study are crude tall diesel and synthetic diesel from biomass. Other biofuels are not considered in this study such as ethanol, methanol, DME etc. Furthermore, this report only focuses on perceptions among the biofuel producers during the time period of January to March of 2009. No systematic judgments are made in this study whether fact in of the respondents’ answers are grounded or not. This report is written for SVEBIO; the Swedish Biofuel Association.
1.1 Purpose The main purpose of the study was to make an estimation of the current business situation concerning production, market development and raw material situation for producers of liquid diesel biofuels in Sweden and examine the forces of competition for this industry today and its ability to produce these fuels in the future. The thesis gives the situation as it is perceived by the producers themselves. Liquid diesel biofuels from agricultural sector feedstock are the primary focus of this report although the study also includes an examination of liquid diesel biofuels using forest sector feedstock and an investigation of the prospect they have in becoming established and accepted alternatives in the fuel transport sector in Sweden.
10
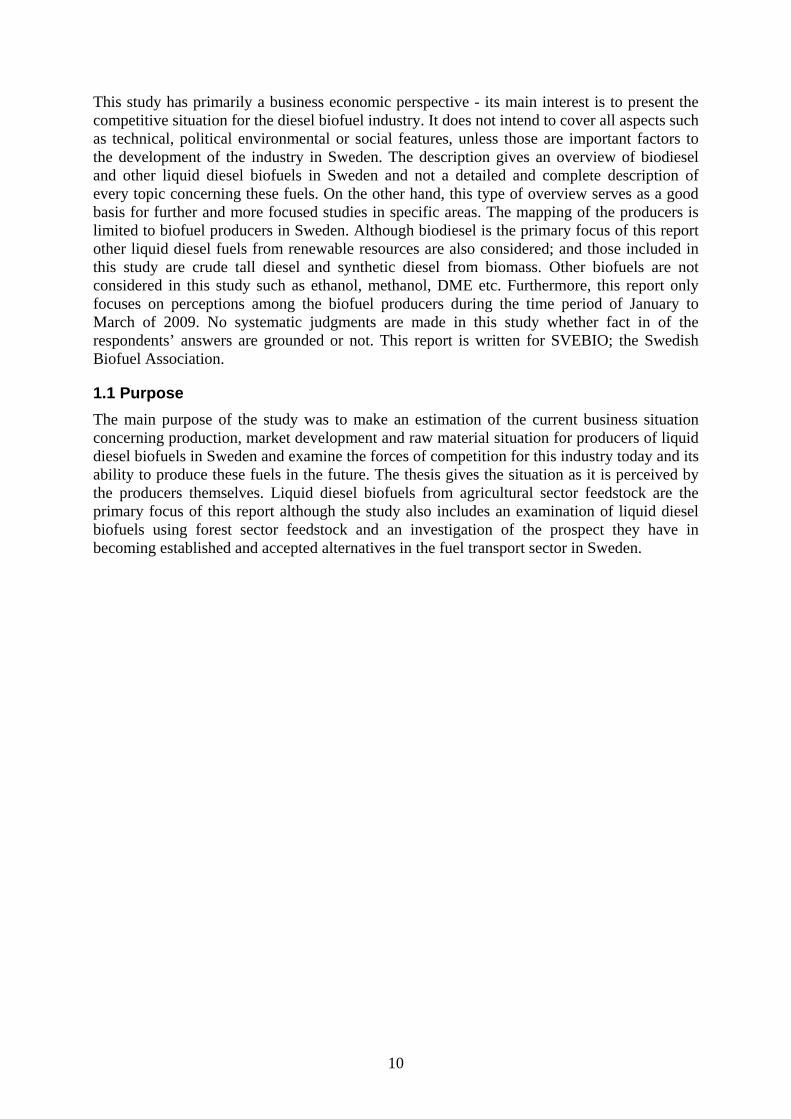
2. Liquid diesel biofuels - a literature review 2.1 Biodiesel Biodiesel is defined as the monoalkyl esters of vegetable oils or animal fats (Knothe, G 2006) that is called “fatty acid alkyl esters” or FAME in short (Akoh, C 2007). The biodiesel quality is influenced by the starting material, production process, handling and other various factors (Knothe, G 2006). There are a number of advantages with biodiesel such as lower emissions of most green-house gases and reduced environmental impact compared to petroleum diesel which is stated in a number of studies. It is also less toxic to handle than petroleum fuels and also biodegradable. There can sometime be some issues with using biodiesel during cold weather conditions. For further reading see Szybist, J 2005; Hill, J 2006; Nabi, M N 2006; Johnsson, B 2006; Demirbas, A 2007; Marchetti, J 2007; Kiss, A 2008; Oliveira, M 2008; Petrou, 2009; Simacek, P 2009. A wide range of feedstock types are used for biodiesel production because any material that contains triglycerides can be used. Additionally, as each feedstock type has different properties the performance of each biodiesel production system is different. (Petrou, 2009; Sinha S 2007) The consequences of available feedstock options have been investigated and can be read further about in Akoh, C. 2007; Hansén, 2008; Achten, 2008; Haraldsson, K 2009; Ma, F 1999; Mondala, 2009. The most common method today is the transesterification process with methanol, see Figure 1.1.
Figure 1.1 Process of biodiesel production. Source: Edited from National Biodiesel Board
According to the Swedish Energy Agency the capacity of growing rape in Sweden is about 160-180.000 hectares and if all of this was rapeseed and used for producing biodiesel (RME) it would correspond to about 140.000 m3 RME of domestic rapeseed oil (EM, 2008a). Biodiesel produced from domestic rapeseed oil in Sweden can cover at maximum 8% of the national diesel demand according to Hansén (2008). To supply for the 5% low-admixture level of RME in diesel fuel in Sweden about 200.000 hectares of rapeseed is required. The quality and properties of the current rapeseed oil was concluded to be sufficient for both food and fuel production and that there is no need at all for further plant breeding. What is needed is only that more rapeseed is grown and harvested. (Hansén, 2008) The actual domestic quantities of rapeseed in 2007 - excluding that for food – covered about 2.4% of the total Swedish diesel consumption. The share would have been 4% if all national rapeseed production had been used for biodiesel. Thus, imports of rapeseed or rapeseed oil are still necessary to reach a 5% low admixture in all petroleum Diesel in Sweden. (Haraldsson, K 2009) This is not unique for Sweden, as a similar situation is found in the USA where only 6% of their diesel demand would be substituted if all their soybean production was dedicated to biodiesel production. (Hill, J 2006) Morrone (2009) gives a broad overview of the main issues for biodiesel producers in the United States today by identifying the major political, economic and perceptual difficulties confronting the biodiesel industry. This study identified perceived technical and non-technical
11
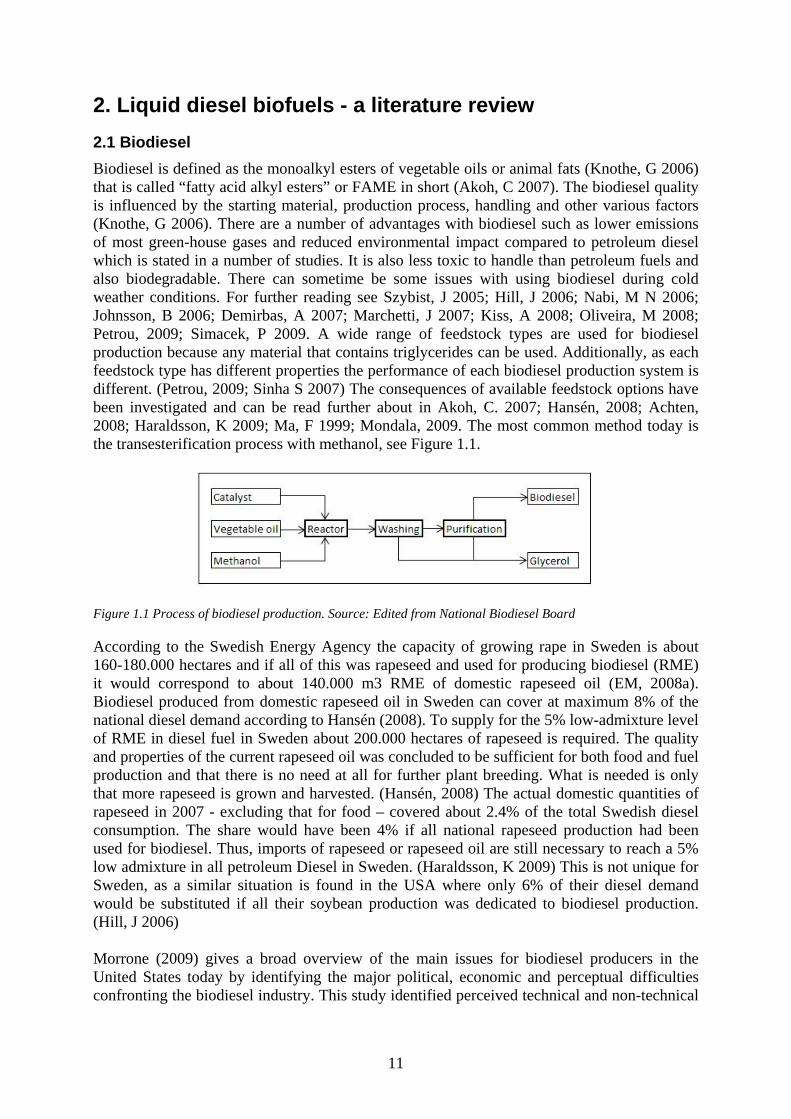
barriers of producing biofuels for five biodiesel producers and Table 1.1 shows the main barriers by frequency. The study found that biodiesel production was dependent on government incentives in the form of tax credits and grants, and that other main factor that affected the competitiveness was the price of petroleum fuels. It was summed up that feedstock availability and price competiveness were the two main obstacles for a further expansion of the industry. Other major barriers were technical issues related to the properties of biodiesel, public skepticism and lack of political leadership to promote the development of biofuels. The major challenge for the small-scale producers was to gain access to financial capital. A question was raised if the biodiesel industry would survive the day government policy changes or incentives expire. Finally it was concluded that biodiesel is only one “piece of the energy puzzle” and may only be able to supply a short-term solution to “buy some time”. Biodiesel would not be making a true contribution to the environmental and economic consequences of society’s energy dependence. (Morrone, M 2009) The two main issues that has been found limiting the market of biodiesel in Sweden are in turn (i) the shortage of rapeseed and rapeseed oil but also (ii) the reluctance of the car manufacturers to accept the use of pure biodiesel and modify the engines for this fuel (Hansén, 2008). These obstacles in Sweden would correspond to the first and third obstacle of the American findings.
Table 1.1 Barriers for five US biodiesel producers. Source: Edited from Morrone, 2009
Perceived barriers Plant A Plant B Plant C Plant D Plant E Number of producers
Feedstock availability √ √ √ √ √ 5 Price competitiveness √ √ √ √ √ 5 Technical problems √ √ √ √ 4 Public skepticism √ √ √ 3 Lack of political leadership √ √ √ 3 Access to finance √ √ 2 Regulatory challenges √ 1
Festel (2008) analyzed the customer acceptance and attitudes towards biofuels and showed that biofuels for transport in general must meet the following criteria in order to at all receive customer acceptance: (i) competitive production costs, (ii) no additional distribution/ /infrastructure costs, (iii) problem-free blending with existing fuel types as well as similar chemical and physical properties. (Festel, G 2008) During the autumn of 2007 the cheap soya based biodiesel imported from the USA hampered the European rapeseed oil based biodiesel to compete on the European market (Hansén, 2008). The problem originated from the fact that the US authorities were granting a so-called blender’s credit of $1 per gallon of pure biodiesel present in petroleum diesel. To avail full blenders' credit in the USA the result was a blend of 99.9% biodiesel and 0.1% petroleum diesel, and the product was thereby called B99. The EU-Commission affirmed that this had caused a price-dumping of biodiesel prices in the EU due to this specific use of American tax-payer money on the European market. This was later regulated and compensated by the EU with an anti-dumping duty in March 2009. (EC, 2009e)
12
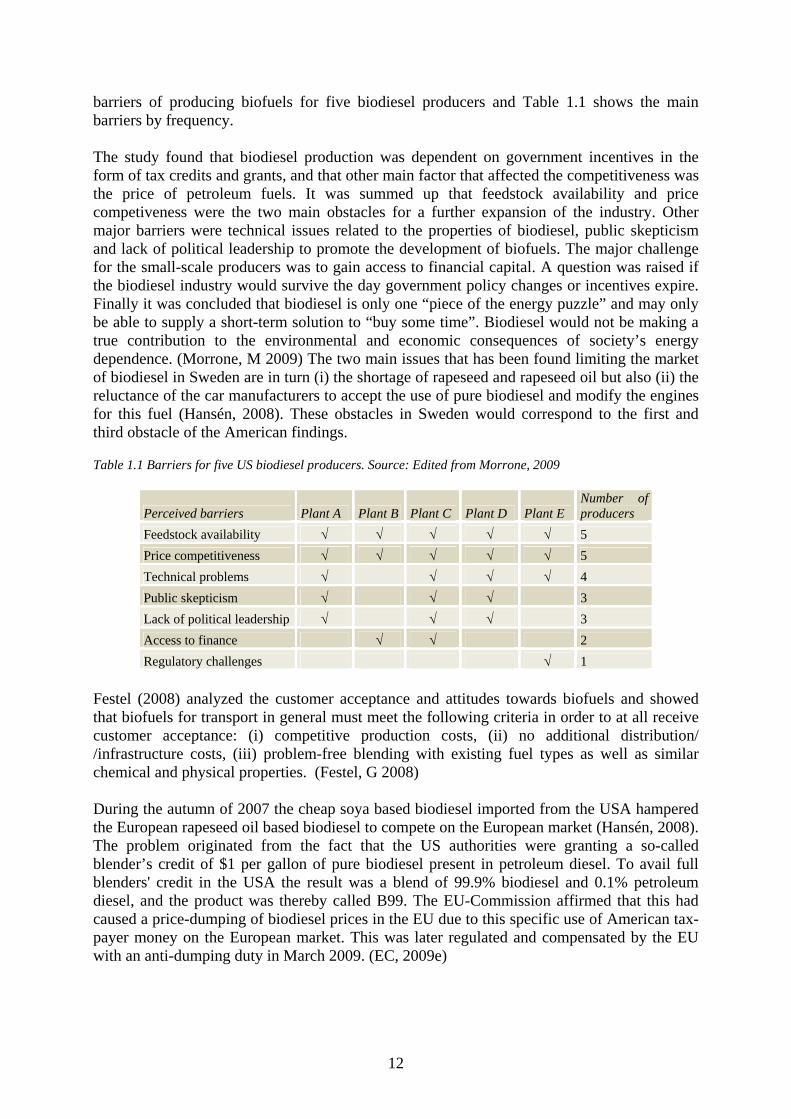
2.2 Synthetic diesel from biomass There are several techniques of turning biomass into transportation biofuels (Pu, Y 2008; Behrendt, F 2008) and there are several biofuel options possible. One option is synthetic diesel and Fischer Tropsch-diesel is one fuel of that type (WWI, 2007; Behrendt, F 2008). To convert complete plants into liquid biofuels the processes that can be used are either gasification- or pyrolysis processes or a conversion directly into liquids. However, the direct liquidification process is far from technically and economically feasible (Behrendt, F 2008). The production of synthesis gas (carbon monoxide and hydrogen) from biomass is usually accomplished in a gasifier as seen in Figure 1.2 (Pu, Y 2008; Biofuels for Transport) and there are various gasification techniques but the differences are mostly the technical stages of separating the gas and the gaseous by-products (Petrou, 2009). The gasification process converts biomass into mainly methane, hydrogen, carbon monoxide and carbon dioxide gases (Petrou, 2009; WWI, 2007) that can then be used to produce many products such as various fuels, chemicals, paints, plastics etc (Haraldsson, K 2009). According to Börjesson et al (2008) is the gasification of biomass and use of cellulosic biomaterial for transportation fuel the best pathway for a sustainable fuel production since it is flexible and lead to the least risks and conflicts (Börjesson, 2008). According to Sandén (2005) it is crucial for the development of synthesis gas and of synthetic diesel fuel production in full scale that pilot plants are built first. The facilities are costly and need funding and in the coming years the government and authorities have to choose which type of plants and technologies will receive subsidies and which will not. This could lock out the development of alternative technologies for a long time. (Sandén, 2005) The synthetic Fischer Tropsch-diesel is a high quality diesel fuel (Dry, M 2001; Takeshita, T 2008) that can be made from gasified biomass and is recommended for use in areas where there are very tight constraints on diesel quality (Dry, M 2002). For further reading see Hamelinck, C 2004; Szybist, J 2005; Löfroth, 2006; SPI, 2006; Festel, G 2008; Koh, L 2008; Pu, Y 2008; Steen, E 2008. Tests with forestry logging machines have shown that synthetic diesel fuel of wood biomass perform just as well as conventional diesel when operating in both summer and winter conditions. No negative effects on fuel consumption, fuel filters, seals or hoses were observed. (Löfgren, 2003b) Moreover, due to this high quality of the FT-diesel, it can also be used to upgrade lower quality diesel fuels (Dry, M 2002).
Figure 1.2. The production of synthetic diesel by gasification and Fischer-Tropsch process. Source: Edited from Hamelinck, 2004.
It has been noted that in the short term and moderate production scale the production cost of FT-diesel are about 2-4 times that of petroleum diesel (Hamelinck, C 2004) and Takeshita have noted that the main drawbacks of FT-fuels are the higher capital costs of FT-conversion plants (Takeshita, T 2008). Still, in the longer terms (~15 years) the costs could decline with
13
large-scale plants, technological development and cheaper biomass. However, FT-diesel can only become economically viable if crude oil prices rise substantially or if environmental benefits are valued higher economically. With the combined effect of tax- and duty exempts plus higher value of environmental effects the FT-diesel could eventually become competitive with petroleum diesel. Still, the success of large-scale FT-plants is strongly dependent on the evolvement of an international biomass-market with low biomass prices. (Hamelinck, C 2004) The amount of biomass used for bioenergy in Sweden is about 70 TWh, where 16 TWh is forest residues, 10 TWh agricultural residues and 44 TWh industrial by-products. From year 2006 and ten years ahead the biomass available for biofuels can increase to 103-120 TWh, of which forest residues then increase up to 34 TWh. (Energimyndigheten, 2009b) Another estimation is that forest residues in Sweden can increase to a maximum of 27TWh annually by year 2020 (www, Skogsindustrierna 2009). The main disadvantages of FT-diesel is that the production of FT fuels has lower energy efficiency compared to other fuels such as hydrogen, methanol, DME and other biofuels and therefore these fuels may be more resource efficient fuel options for a Biomass-to-Liquid plant than synthetic diesel is (Takeshita, T 2008). The conclusion from one particular study was that a large scale central plant would be the most attractive route for a synthesis BTL production. However, disadvantages may be that local logistics aspects could instead require the construction of several small-scale synthesis plants that cause significant economic disadvantages due to lack of economy of scale. (Zwart, R 2006) The process cost of a BTL-production plant can in general be divided into biomass costs; including transshipment and/or transportation, and storage costs, logistics; Capital costs and Operations and maintenance costs. Finally additional utility, by- and rest product costs. A BTL-plant produces much heat that with recovery steam generation in combination with net electricity production can result in cost savings. The biomass costs account for a significant part of the overall production costs (Zwart, R 2006) and some studies estimate that the production of purified synthesis gas in a FT-complex accounts for about 60-75% of the total capital investment and running costs for the overall plant (Dry, M 2002; Steen, E 2008). Storage costs have only a marginal influence on the total production costs but various pretreatments, such as densification of the biomass, can increase the economic feasibility of the fuel production (Zwart, R 2006). The biomass and the gasification process may then at least together dominate the cost frame. Estimations of when a large-scale BTL plant would be realistic conclude that at crude oil prices of about $60/bbl and above the large-scale BTL plants could become considered economically feasible (Zwart, R 2006), or perhaps around 60-70$/bbl (Börjesson, 2008). For the future of the BTL-process it is very important that the production costs become competitive to petroleum fuels as initial tax advantages will only be temporary (Festel, G 2008). In order to make the gas to liquid technology more cost efficient the focus must be on reducing the capital and operating costs of such plants (Vosloo, A 2001). In general the FT-plants are required to be large and with economy of scale. The only realistic solution for that type of facility in Sweden is in co-operation with current petroleum oil refineries. That combination makes sense if the end-product FT-diesel fuel will be used as a blend in conventional diesel. (Haraldsson, K 2009; EM, 2008a) A suitable corporate structure is still not obvious as the FT-process do not only generates synthetic diesel fuels, but a surplus of other products. One way to successful implementation will most likely be in close cooperation between multiple sectors such as the FT-fuel suppliers, the different transportation sectors and with various chemical producers. Joint ventures between companies with patented FT process technologies and resource holders are also probable functional combinations (Takeshita, T
14
2008). The technology for the different FT-process steps are already established, individually optimized and commercially proven but, but mostly for other applications. However, the combined use of all these stages is not widely applied and still needs further development [in 2001]. The challenge for the future will be to obtain the most cost-effective combination of the different unified production stage technologies. (Vosloo, A 2001) For the ”second generation” biofuels, such as FT-diesel, there are yet no market prices available (Haraldsson, K 2009) The price of the fuel will depend on the price level of biomass, but biomass prices will only increase if prime wood is used for synthetic diesel production and not also residuals of cellulosic biomass (Löfgren, 2003b). How competitive the synthetic diesel and alternative fuels will become for logging machines depends on how the fuels are to be taxed in the future (Löfroth, 2006). The first raw materials that were used in Sweden for developing synthetic diesel were wood chips and black-liquor, but less-refined forms of biomass such as logging residue will definitely be used in time (Löfroth, 2006).
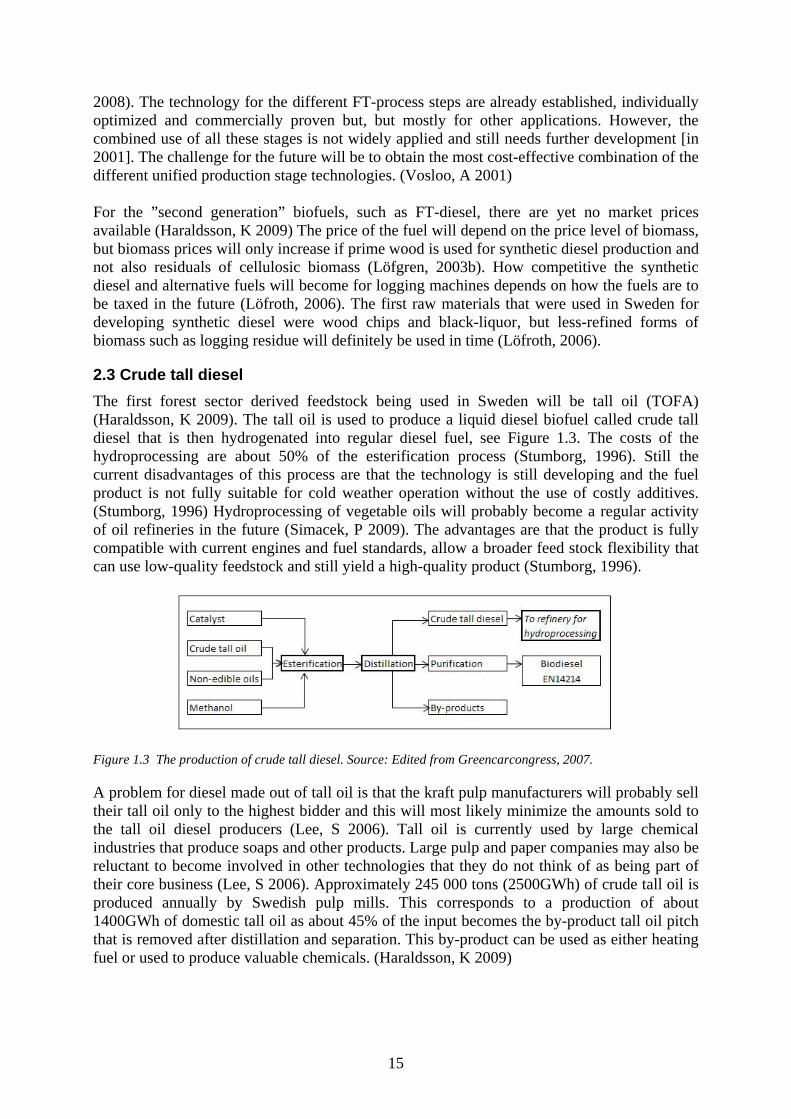
2.3 Crude tall diesel The first forest sector derived feedstock being used in Sweden will be tall oil (TOFA) (Haraldsson, K 2009). The tall oil is used to produce a liquid diesel biofuel called crude tall diesel that is then hydrogenated into regular diesel fuel, see Figure 1.3. The costs of the hydroprocessing are about 50% of the esterification process (Stumborg, 1996). Still the current disadvantages of this process are that the technology is still developing and the fuel product is not fully suitable for cold weather operation without the use of costly additives. (Stumborg, 1996) Hydroprocessing of vegetable oils will probably become a regular activity of oil refineries in the future (Simacek, P 2009). The advantages are that the product is fully compatible with current engines and fuel standards, allow a broader feed stock flexibility that can use low-quality feedstock and still yield a high-quality product (Stumborg, 1996).
Figure 1.3 The production of crude tall diesel. Source: Edited from Greencarcongress, 2007.
A problem for diesel made out of tall oil is that the kraft pulp manufacturers will probably sell their tall oil only to the highest bidder and this will most likely minimize the amounts sold to the tall oil diesel producers (Lee, S 2006). Tall oil is currently used by large chemical industries that produce soaps and other products. Large pulp and paper companies may also be reluctant to become involved in other technologies that they do not think of as being part of their core business (Lee, S 2006). Approximately 245 000 tons (2500GWh) of crude tall oil is produced annually by Swedish pulp mills. This corresponds to a production of about 1400GWh of domestic tall oil as about 45% of the input becomes the by-product tall oil pitch that is removed after distillation and separation. This by-product can be used as either heating fuel or used to produce valuable chemicals. (Haraldsson, K 2009)
15
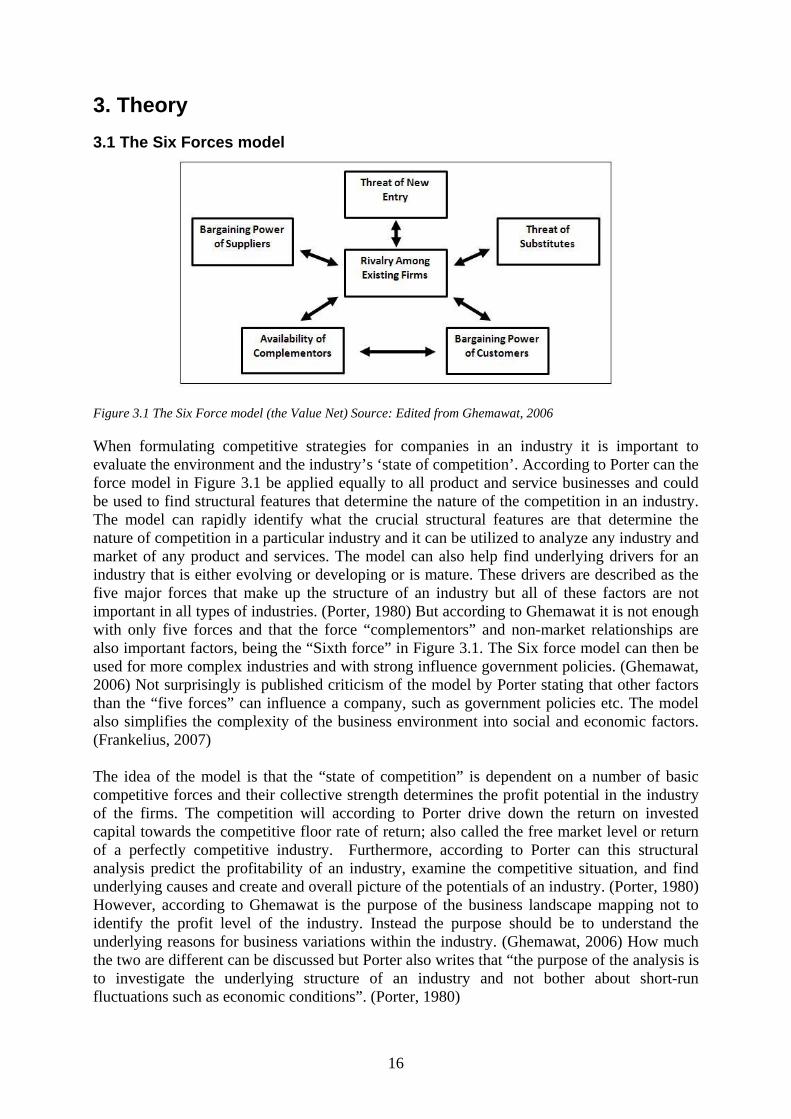
3. Theory 3.1 The Six Forces model
Figure 3.1 The Six Force model (the Value Net) Source: Edited from Ghemawat, 2006
When formulating competitive strategies for companies in an industry it is important to evaluate the environment and the industry’s ‘state of competition’. According to Porter can the force model in Figure 3.1 be applied equally to all product and service businesses and could be used to find structural features that determine the nature of the competition in an industry. The model can rapidly identify what the crucial structural features are that determine the nature of competition in a particular industry and it can be utilized to analyze any industry and market of any product and services. The model can also help find underlying drivers for an industry that is either evolving or developing or is mature. These drivers are described as the five major forces that make up the structure of an industry but all of these factors are not important in all types of industries. (Porter, 1980) But according to Ghemawat it is not enough with only five forces and that the force “complementors” and non-market relationships are also important factors, being the “Sixth force” in Figure 3.1. The Six force model can then be used for more complex industries and with strong influence government policies. (Ghemawat, 2006) Not surprisingly is published criticism of the model by Porter stating that other factors than the “five forces” can influence a company, such as government policies etc. The model also simplifies the complexity of the business environment into social and economic factors. (Frankelius, 2007) The idea of the model is that the “state of competition” is dependent on a number of basic competitive forces and their collective strength determines the profit potential in the industry of the firms. The competition will according to Porter drive down the return on invested capital towards the competitive floor rate of return; also called the free market level or return of a perfectly competitive industry. Furthermore, according to Porter can this structural analysis predict the profitability of an industry, examine the competitive situation, and find underlying causes and create and overall picture of the potentials of an industry. (Porter, 1980) However, according to Ghemawat is the purpose of the business landscape mapping not to identify the profit level of the industry. Instead the purpose should be to understand the underlying reasons for business variations within the industry. (Ghemawat, 2006) How much the two are different can be discussed but Porter also writes that “the purpose of the analysis is to investigate the underlying structure of an industry and not bother about short-run fluctuations such as economic conditions”. (Porter, 1980)
16
Porter mentions that after the structural features and competitive forces have been diagnosed with his model then the firms can identify its strengths and weaknesses relative to the industry. The firms can use the model to shape their competitive strategy with defense against the risks of strong forces or by taking offensive action by anticipating underlying factors of future developments. The strategy should include what capabilities they should use, how to balance the five forces and where the firms should position themselves within the industry. (Porter, 1980) The nuance of the Six Forces model, also called the Value Net, is that the knowledge from the analysis should then be used for strategic action to anticipate long-run performance, to identifying the forces that must be countered or shaped and to make decisions about investment or exit from the industry. (Ghemawat, 2006) The advantage of the force model is to describe a complex industry in a simpler and structured way and is used to analyze the competitive situation for an industry (Frankelius, 2007) which corresponds with the purpose of this study. But according to Ghemawat is it actually impossible to create a single all-purpose framework for analyzing business landscape (Ghemawat, 2006). Firms are also influenced by environmental, economic, social and technological factors (Johnson, G 2007) that are not covered by the “force model”. Instead the framework that is used must be fitted for each individual landscape or situation and it is important to not follow the model strictly and instead think more broadly about what players are involved (Ghemawat, 2006). That is why it is important to determine what type of companies and actors should be defined as the “industry”. The definition of an industry according to Porter includes the firms that are close substitutes for each other. Porter claims that there has been much controversy over the appropriate definition of how close substitutability is needed. So according to him it is “more or less irrelevant where to exactly draw the line and the definition of an industry is not the same as where these businesses want to compete”. The definition of the competitors to an industry is stated to be “all established firms but also customers, suppliers, substitutes and potential entrants”. These are also the five forces of the model, and together they determine the intensity of the competition in and industry. (Porter, 1980) A description of each force will follow next:
Threat of entry New entrants to an industry bring new capacity, take market shares and consume resources, can bring down product prices and result in higher costs for all business in the industry. The number of businesses that tries to enter the industry depends on barriers to enter and on how the existing firms react to the entrants. The sources of the barriers of entry are: (Porter, 1980)
• Economies of scale The advantages of lower unit cost per product. Entrants can be discouraged by having to enter at large scale with connected with much risk and also strong reaction from existing firms. If they would instead come in at small scale they would suffer from cost disadvantages. Another type of economy of scale is if the existing firms share operations or functions with other businesses, because this type of advantage can be difficult to meet for new entrants.
• Product differentiation This can force entrants to spend heavily on overcoming and break existing customer loyalties, and this often takes a long time to achieve.
• Capital requirements The new entrants need to invest large financial resources in order to compete with existing firms, for example in research and development.
• Switching costs This is often a one-time cost for the buyers to change from the products they currently buy from the existing firms, and instead buy the products from the entrants. If it is very costly for
17
the customers to change to buy products of and entrant, then it becomes very difficult to enter this industry. If the customers can change easily, then it becomes easier to enter. The cost does not have to be monetary but can also be relationships etc.
• Access to distribution channels New entrants will need to secure their distribution for their products and this can be costly as all channels could perhaps already be vacant. The entrants might need to put much effort in persuading existing distribution channels to accept their product too, or they even might have to create a completely new distribution channel on their own.
• Cost disadvantages independent of scale This could be proprietary product technology such as patents, copyrights and so on that makes it difficult to enter the industry. The existing firms could also have control or access to most of the raw materials. Another example is that the knowledge and experience level is much higher in existing firms that new entrants will have difficulties to enter due to this matter. But entrants that are already active in other industries that are closely related to the new industry they want to enter could have advantages and use their knowledge base and this could ease their entrance.
• Government policy Governments can limit or even prevent establishment of new entrants. Examples of this could be a demand for licenses or permissions to enter. Standards, safety regulations and pollution control requirements could also make it more difficult for new entrants. The government can also limit or even deny entrants the access to some type raw materials.
Intensity of rivalry among existing competitors Rivalry occurs when existing firms try to improve their position within the industry on the expense of the other actors. This rivalry can be more or less aggressive or polite and becomes more intense with the following factors: (Porter, 1980)
• Numerous of equally balanced competitors If the existing firms are few it will be easy to estimate each others strengths and weaknesses. With only one or two dominating leaders, these can have much influence on the coordination of the entire industry, such as on price levels.
• Slow industry growth If the market growth of the industry is slow then the existing firms will compete more over each others market shares than to try finding new customer groups.
• High fixed or storage costs Unused capacity can be costly with expensive equipment, and that could force production up to full capacity which might lead to a saturated market and lower product prices. If the products are difficult to store then the firms could be force to sell it at even lower prices.
• Lack of differentiation or switching costs If the product in the industry is a commodity then there will be easy for the customers to buy from either one of the companies in the industry, and this can increase the rivalry.
• High exit barriers It can be expensive for an existing firm to exit the industry so the final decision to actually close down the business might wait, even though revenue could be low or even negative. The worst case is when entry barriers are low and exit barriers are high, because there will become a great overcapacity within the industry and this can lower prices significantly for a long time.
Pressure from substitute products All the firms in an industry compete with other industries that produce substitute products. That is products that are different but have the same functions as their own products. These substitutes limit the profit potential by placing a ceiling for the highest price possible, before
18
the customers choose the other alternatives. It is important for the firms in an industry to identify the substitute to their products. There could sometimes be a mutual interest for all firms in within an industry to act collectively to overcome substitutes. The following substitutes are the most difficult for an industry: substitutes that are subjects to trends that can take market shares from the industry and substitutes that are produced by industries with high profits. (Porter, 1980)
Bargaining power of buyers Buyers can make the overall profit of the industry lower as they force prices to go down, demand higher quality of the products and can play the firms within the industry against each other. It is important for the firms in the industry to select proper customers within the market segments. Buyers are strong when some of these factors occur: (Porter, 1980)
• Buyers are concentrated or purchases large volumes relative to the seller sales. The buyers buy large portions of firms’ total sales.
• The product makes out a substantial part of the customers overall costs If the product is costly for the buyer then they will be much more eager to bargain.
• The products of the industry are undifferentiated commodities If the products that produced by the firms in the industry are much similar or standardized then the customers can easily choose by best price.
• The buyer has low switching costs The buyers are not locked to only buy one type of products or from only one firm.
• The buyer have low income or makes low profit • The buyers poses threats of backward integration
The customers could unite and put demands on more favorable prices etc. • The product of the industry is not very important for the buyers • The buyer has full information
If the buyers have all necessary information about alternatives, market prices, supplier costs and more they can be strong bargainers.
Bargaining power of suppliers Suppliers can posses bargaining power if the threaten to raise raw material prices or lower the quality of the components. The suppliers are stronger during the following circumstances: (Porter, 1980)
• The suppliers are few and especially fewer than the number of firms in the industry. • The suppliers do not compete with other substitutes to sell to the firms in the industry • The industry is not an important customer group for the suppliers.
The firms only buy a small portion of the suppliers overall sales. • The products the suppliers offer are very important to the firms in the industry
If the products from the supplier cannot be stored for long, then the firms cannot build up a safety inventory.
• The suppliers products are differentiated or are high switching costs to leave them This reduces the chances for the firms to play the suppliers against each other
• The suppliers pose threats of forward integration This could lower the possibilities for the industry to buy the products at good prices.
Complementors and non-market relationships The five forces are not enough and it is therefore necessary to bring additional players into the analysis, called complementors. These are participants from which customer buy complementary products or suppliers sell complementary resources. They are important and
19
can influence business success or failure. An example to better understand complementors are e.g. doctors that greatly influence the success of pharmaceutical manufacturers by prescribing medicine to patients. The doctors are not part of the five forces, but still they are very important complementors for the product manufacturers’ sales. The complementors should not be thought of as value-maximizer. Instead they should be valued after the amount of influence that they are likely to have over the industry. These are some of the factors when complementors are having much influence: (Ghemawat, 2006)
• Relative concentration Complementors are fewer than the competing firms in the industry.
• Relative buyer/supplier switching costs The cost for buyers/suppliers to switch between complementors is higher than switching across the firms in the industry.
• Relative complementor/competitor switching costs The complementors have less switching cost between firms than firms have switching between complementors. Even more complementors or actors of non-market relationships may need to be added depending on the industry context, and therefore it is important to modify the framework of the model to fit the situation being studied. The non-market relationships are often important and these can be the government, media, activists, interest groups and the public. The government can have different roles, such as a major buyer, regulator, sponsor or regulator. (Ghemawat, 2006) However, Porter also mentioned that the government can be both a buyer and supplier, and their policies and political decision can have strong influence over the competition in an industry. The governmental regulations can also according to Porter limit the behavior of the firms in the industry, but also affect the competitive situation with substitutes through regulations, subsidies, tax incentives, grants and other means of control. Therefore must an analysis of the competitive structure always include a diagnosis of the government policies at all levels affect the industry’s conditions. So according to Porter it is often more practically to consider how the government affects the competitive situation through the five competitive forces rather than to consider it as a force of itself. (Porter, 1980) As noticed the Net Value and Five Forces model does not agree on the matter of this last detail. (Ghemawat, 2006)
3.2 PESTEL - analysis The industry environment is formed by the relationship between the customers, suppliers and other competitor. A couple of sources influence the environment and these “environmental influences” can be classified into political, economic, social and technological factors. Thereby this model is called the PEST analysis. These factors may be critical for the threats and opportunities of a company in the future, and the key issue is how these more general environmental factors affect the industry environment. (Grant, 2008) The origin of the theory is unknown and the model comes in many modified variations where some are static and others dynamic in time. The model is less restrictive than many other concept models as the categories can be broad and therefore well suited to analyze the business environment in a wider view. Criticism of the model is that the aspects within the model can be out of control and difficult to analyze for a particular company. (Frankelius, 2007) Many of these factors are also linked together. Furthermore, one adoption is the PESTEL model that includes two more factors: environmental and legal factors that are described below. (Johnson, G 2007) Political factors can be the political climate, regulations etc and highlights the role of the government and influence risk levels, opportunities and markets for the industry (Frankelius, 2007; Johnson, G 2007). Economic factors determine the economic trend which affects profit
20
potential and customer structures etc (Grant, 2008). Social factors can be demography, lifestyle, cultures and social values in the society that influence the industry and income levels (Frankelius 2007; Johnson, G 2007). Technology factors refer to the development of innovations and research that affect the production potentials (Grant, 2008; Johnson, G 2007). The Environmental factors are “green” issues such as pollution, waste and the debate on global warming that influence the industry’s potentials. Legal factors are legislative constraints, policies, regulations and restrictions. (Johnson, G 2007)
3.3 SWOT - analysis A SWOT-analysis gives a summary of the strengths and weaknesses of the industry together with the opportunities and threats it faces both external and internal. The environment must be analyzed to find attractive opportunities and to avoid environmental threats. Strengths and weaknesses must be analyzed together with current and possible marketing actions to determine which opportunities that can best be pursued. This is made to better anticipate important developments that can have an impact on the firms but not all aspect call for the same attention or concern. The strengths and weaknesses are relative and not absolute, and do not list all the features of the firms but only the critical success factors. The opportunities can be about the economic climate, demographic change, market or technology. The threats can be the competitive activity, channel pressure, demographic changes or politics. (Kotler, et al. 2005)
3.4 The process of choosing theories The force model was chosen because it offered the ability of making a structured analysis of a complex environment. During the process of gathering data it became clear that government policies have great influence over the producers of biofuels and therefore the model was changed for the modified Six force model, see Figure 3.1. This model suited the condition of the selected firms better. The force model was limited to only focus on the forces and leaving other aspects out and therefore the broader PESTEL analysis model was then applied to complement the more narrow view of the force model. The SWOT analysis model was also complementing the force model by pointing out the strengths, weaknesses, opportunities and threats to the firms. All the models had their weaknesses and limitations, such as the force model could show that an industry was always forced towards the profit floor, The PESTEL and SWOT models were too broad and difficult to point of specific details. But together the three models was thought to allow flexibility in the data gathering and at the same time they created a framework of making a systematic analysis of the industry of alternative diesel fuels.
21
4. Methodology 4.1 Study approach The purpose and the theoretical framework was the starting point of the study and the methodology to perform the investigation was then outlined. A qualitative research approach was chosen as the collected data was presumed to include mostly perceptions from the companies about their business situations. It was also chosen to get a general idea on what aspects were currently important to the firms. Choosing a qualitative approach normally result in that the collected data is not statistical valid or and cannot be use to generalize the finding (Holme et al, 1997) Due to the low number of companies all producers were included in the study and even though much of the collected data would be of perceptional nature would the findings be the perceptions of the whole population. This would have the effect of increasing the generalizability of the findings. As little was known initially by about both the targeted industries, products and their processes a survey would not be the most suitable research approach and a questionnaire would not allow the respondents to express themselves freely. The goal was to find out what the companies within the industries were thinking, and therefore it would be better to let the companies speak for themselves. Therefore the appropriate research strategy was to do a qualitative study and as the goal was to describe the industry and the competitive situation a descriptive approach was taken. The attempt was therefore to find all or a majority of the companies within the industries and describe these and their competitive situations. The process of collecting primary data for the study was decided to be done with interviews.
4.3 The population For this study the companies of interest were “businesses with processes for producing biofuels that substitute petroleum diesel”. The vertical scope of this study was chosen to only focus on the producer perspective and it was decided that this study only would cover businesses located in Sweden. It is important to make a good choice in selecting the population to collect the data from and this helps to later define the limits for generalizing the findings (Eisenhardt. 1989). The initial criteria of the population were then set to be: “Producers of liquid diesel fuel of feedstock from either the agricultural or forest sector” and “located in Sweden”. The population in the study was based on a list from the Swedish Bioenergy Association of 10 companies in the business of diesel biofuels. Searches in the Swedish “yellow pages”, Eniro.se and Hitta.se and Google, resulted in 4 more potential companies. One company was found through communications from a manufacturer of biodiesel facilities. One more company was identified in the weekly Swedish newspaper NyTeknik. The list was also compared with the latest list at the time (2007) of registered biofuel producers (www, SEA, 2009). Therefore it was very likely that all producers were found were producing or the last years had been producing liquid diesel fuel of feedstock from the agricultural sector and also the companies involved in liquid diesel fuel production from feedstock from the forest sector. The population was then divided into two groups 1) producers using agricultural feedstock, and 2) producers using feedstock from the forest sector. All the companies that participated in this study are listed further down this chapter.
22
4.3.1 Producers using feedstock from the agricultural sector The following criteria were set for the population of diesel biofuels of feedstock from the agricultural sector: (1) Producer of liquid diesel biofuel (2) Using feedstock mainly from the agricultural sector. (3) Production located in Sweden
Log of interviews: Brunnsholms Säteri Date: 2009-02-19 Norup Gård Date: 2009-02-04 Energigårdarna Date: 2009-02-02 Perstorp Date: 2009-01-21 Gotlands Rapsbränsle Date: 2009-02-12 Skeby gård Date: 2009-03-24 Karaby gård Date: 2009-03-12 Soil Oil Date: 2009-02-06 Lantmännen Ecobränsle Date: 2009-02-13 Tolefors gård Date: 2009-02-25 When the search for producers was over it became evident that they were of different sizes in terms of production capacity. Therefore it was decided that is would be necessary to divide them into categories by production capacity. Guidelines how to classify biodiesel producers by size were found in a scientific report (Morrone) where producers were divided in three categories “(1) small-scale producers/“home brewers” who service a very limited number of customers; (2) medium scale producers who produce biofuels locally and (3) advanced producers who were developing factories for regional production” (Morrone). However, it would soon show that their categorization boundaries for “small-scale” were set very high for the Swedish conditions (5 million gallons per year equal to almost 19 000 m3 per year). This was not considered to be “small” as the common size of small-scale production facilities in Sweden were mainly producing around 1 000m3 per year. Therefore the categorization boundaries were adjusted into the following to better suit the Swedish conditions: (1) Small-scale producers with limited number of customers: < 5000m3 (2) Medium scale produce biofuels locally: >5000 <20000m3 (3) Large-scale producers developing factories for regional production: >20000m3
4.3.2 Producers using feedstock from the forestry sector The population of “producers of diesel biofuels of feedstock from the forestry sector” was more heterogeneous than the biodiesel producers. Nonetheless, all of the companies had stated on either their homepages or in news articles that liquid diesel biofuel was a possible output product from their processes; but during the data collection process it became clear that for some of them this was not their current objective. In total eight companies were found and seven participated. Four of the companies had production of liquid diesel biofuels as their primary objective. One company was a semi-manufacturer of biofuels diesel fuel was only one out of many production pathways. Two other companies could produce diesel biofuels but that was currently not their objective or main objective. So in detail there were two respondents into producing synthetic diesel using two different approaches and a third respondent into constructing facilities that was used to produce synthetic diesel. Additionally, one of the respondents was a producer of crude tall diesel that was later going to be hydroprocessed into a renewable diesel fuel. Three respondents were in the business of producing synthesis gas that could be used for producing synthetic diesel. With their commonalities and differences it was decided it would be interesting to find the similarities of these companies that were going to share the same resource base and produce components and that would or could be produced into liquid diesel biofuels. In that case what bound the respondents together for this study was that all respondents produced or could produce liquid diesel fuel or synthetic gas that is an initial step for producing synthetic diesel. According to Ghemawat it is not necessary to insist
23
on looking at all chosen groups of the population in equal depth as it is better to focus more on some to keep the analysis manageable (Ghemawat, 2006). The focus of the study was on diesel fuel production and less on companies with primarily other activities and therefore the criteria to qualify for this population were finally set to be the following: (1) Using mainly feedstock from the forest sector. (2) From their production process the output would or could end up as a liquid diesel biofuel. (3) Located in Sweden
Log of interviews: Aviosol Date: 2009-02-23 Cortus Date: 2009-03-06 Eco-oil Date: 2009-03-05 Göteborg Energi Date: 2009-03-04 Neova Date: 2009-03-24 VVBGC Date: 2009-03-03 Sunpine Date: 2009-01-30
4.4 Finding contact persons The criteria for contact persons of the companies was that it had to be a person with much experience, influence and rank as this person was going to represent the perceptions of the company – not the actual person. Often the companies were one-man business, so in many cases the contact persons were both the founders and owners of the businesses. For the larger companies the approach was to contact the executive director, and they would then in most cases give out a name of a suitable contact person, such as marketing or facility directors. Two contacts were found through Svebio, one business analyst and one project leader. All contact persons were considered to at fully meet the criteria of reliable company sources with very high level of insight in their companies back ground, current situation and development.
4.5 Data collection approach After the literature study much remained unknown about the specific conditions or situations facing the companies that were producing diesel biofuels or semi-manufacturing components. A pilot interview was therefore made with one biodiesel producer and one producer using feedstock from the forest sector. The pilot interviews were mostly unstructured but followed a few thematic areas as guidelines. The questions were developed from the purpose of the study and from the theory, together with previous research found in the literature review. Guidance was thereby found in a study that had identified the following important topics; technical aspects (raw material, supply, conversion and engine technologies), economic aspects, infrastructure, environmental and political factors and so on (Festel, G 2007). These topics were then used as preliminary themes when shaping the few pilot interview questions. Each thematic area was anticipated to generate answers that would cover aspects of the theoretical framework that would be necessary to perform an analysis and accomplishing the purpose of the study. These were the initial thematic areas of the pilot interviews and what the anticipated answers would be:
Table of thematic areas: Anticipated answers necessary for the analysis: Raw material Competitors, Feedstock alternatives Supply Suppliers, Competitors Engine technologies Fuel markets, Regulations, Opportunities Economic aspects Capacity, Competitors, Markets, Issues, Future Infrastructure Distribution, Substitutes, Potentials Environmental factors Regulations, Issues, Future Political factors Policies, Means of control, Regulations
24
The data from the pilot interviews was saved. The interviews were chosen to be semi-structured so that about the same type of information would be collected from the different respondents but still allow them to speak relatively freely about their unique conditions. Therefore the approach was to make similar telephone interviews with all companies. After the pilot interviews a final interview guide was created with question themes and the questions were formulated from the selected theory an on the mainly descriptive purpose of the study. Specific questions during the data collection can help avoid distortion of the collected material and thereby ease the process of analyzing the data later on (Mintzberg, 1985). The interview questions were also influenced by the previous Svebio reports by Höglund (2008) and Karlhager (2008) of solid biofuel industries. The interview questions of the guide were decided to be mainly open ended to allow the respondents to describe their own unique situations. After the pilot interviews and arrangement of the interview guide it was sent to the supervisors for check and feedback. However, the questions were somewhat altered and continuously refined throughout the interview process as not all predetermined questions would apply for the unique setting of each respondents company. Before the interviews were conducted the persons representing the companies were contacted by email, which was given either by the executive director of the company, found listed on the companies websites or found by using Google. The email was written as a request to book time for a phone interview and also described the purpose of the study shortly. No questions were sent out in advance as the time of the booking was simultaneous with the creation of the interview guide.
4.6 The interviews The detailed interviews were conducted by telephone and the respondents were all talking as representatives of their companies and not as private individuals. The interviews were recorded by a digital tape recorder and field notes were taken continuously on paper. Summaries were made after the interviews. Each transcript was read through, checked for obvious errors and complemented with the field notes. Most interviews took between 30 to 80 minutes which resulted in more than 130 data written transcript pages from over 19 hours of recordings. After the answer processing, which is described below, nine additional follow-up interviews were made to fill in gaps and clear out probable misunderstandings. These follow-up interviews resulted in additionally 11 pages of transcripts. All interviews were conducted from January to March 2009 and the final date for interviews was set to March 25th.
4.7 Response frequency and non-respondents All contacts that were found participated in this study except two companies. One was a small-scale biodiesel producer that had already gone out of business during the last couple of months and did not answer to the request. Efforts were put in reaching the contact and ask why the biodiesel production was ended. The other company to not answer to the request was a producer of mainly DME from the gasification of black liquor from the pulp mill processes. Some information was available on the internet about the producer but most of the data necessary for this study required an interview but an interview could not be booked during the time period of this study.
4.8 Data reduction After the transcripts were read through a general idea of the companies was apprehended. For data condensation Eisenhardt (1989) recommend that the researcher starts by looking for similarities and differences between the interviewed units; but also for dimensions that could be suggested by literature, chosen by the investigator or that emerge from process itself (Eisenhardt. 1989). In some cases additional aspects emerge that had not been part of the
25
interview guide by following this method: such as the role of media and customers with misconceptions. Before the process starts of generalizing pattern across cases the researcher should be familiar with each unit as a stand-alone and allow each unique pattern to emerge individually (Eisenhardt. 1989). Mintzberg also writes that when doing this it is important to let the patterns emerge themselves without forcing it in a favorable direction (Mintzberg, 1985). The selected theories were also in mind when reading the transcripts and finding themes and summarizing them. Data reduction is the process of selecting, focusing, simplifying and transforming the “raw data” from field notes, interviews in summaries but also decides what subject, respondents and questions to ask. (Miles, 1998) The initial themes of the interview guide were adjusted as the respondents had frequently mentioned aspects that were initially not thought of at the beginning of the study. The following themes were found to capture the initial themes and all of the topics of the respondents’ answers after the interviews, and these themes were then used to sort the collected data for the Result section:
Adjusted theme definitions: The collected answers: Production Capacity, Work force, Expansion plans Raw materials and supply Suppliers, Feedstock alternatives Markets and distribution Customers, Distribution, Byproducts Policy and regulations Political agendas, Policies, Regulations, Lobbying Future development Barriers, Threats, Possibilities, Projections The answers of each interview was categorized by each theme and continuously compared with the original transcripts and voice recordings. The reduced data was then put into matrix using Microsoft Excel according to recommendations by Lantz (2007). The columns of the matrix were made out of the themes described above, and the rows by the answers of each responding company. This made it easier to quickly overview each respondent’s answers and cross-check an answer against the whole population and in order to simplify this process further was the matrix printed and put on a wall. When building a matrix display to analyze data it is recommended to keep the display on one large sheet even if that sheet covers a wall (Miles, 1998). Then each column was read in across-case style and variables were marked; such as “wood chips” marked blue and “peat” green so answer categories were created. According to Miles the number of variables per row or column in a matrix is recommended to be no more than five or six to keep down the level of complexity (Miles, 1998). The answer categories per column were then counted. The categorizing of data can be done in two sets, first by content and secondly to extract patterns within the collected data (Lantz, 2007) so therefore second wave of data sorting was made looking for patterns within and between the company sizes and noted by domination.
4.9 Data presentation and analysis The data was then presented in the results section, by writing down how many respondents that gave answers of each answer category. Then this voluminous text was reduced by summarizing it into a lighter and more readable text for each theme. The supervisors were sent the material of the study for feedback as the study progressed. Notes for the data analysis had been taken spontaneously throughout the data collection- and reduction processes. According to Mintzberg it is a good idea that the researcher starts the analysis process by merely brainstorming in order to try and interpret the collected material and see what patterns, issues and relationships can be found (Mintzberg, 1985). After the data presentation was finished these notes were complementing the analysis with the complete material at hand. The companies were then both analyzed separately and across. According to Miles it is important to understand the dynamics of each particular case before doing a cross case analysis that
26
deepens the understanding and explanation of the cases. (Miles, 1998) The analysis was conducted by putting on “the theory goggles” and reading the text with only the aspects of the theory at mind. It is recommended to use a theoretical model when performing an analysis in order to bring more structure and deeper understanding of the collected data and also view the material from a different perspective than was expressed during the interview. (Lantz, 2007) After the analysis was finished it was discussed about what this could mean and what further action could be recommended.
4.10 Validity and reliability Most respondents requested to read the transcript in order to participate as the contacts could not be guaranteed their anonymity during the interviews due to the low number of cases. Privacy and Integrity is important and individual respondents should not be pointed out (Holme, et al 1997). This was also a chance for the respondents to remove data they did not want to be published but could also increase the validity of the answers as they could check for errors. Not the full transcripts were sent for check but only semi-reduce data. Corrections were returned with minor changes from four respondents about production volume, extra services and word choices. The overall validity of the collected data can be considered to be correct because the interviews followed a thematic structure as interview guides were used and the respondents checked the answers for correctness. The reliability of this study is reduce by the fact that this study is based upon perceptions of the respondents at a given time period and those perceptions could change due to the dynamics of the business environment. The data is only representative for the selected population between January to March 2009.
4.11 Weaknesses of the data collection, results, and analysis The vast majority of the respondents were reluctant to reveal figures or data about production quantities or costs, revenues or prices of their businesses. The common answer was that this was too sensitive information and that it was necessary to protect this knowledge from other companies in order to keep their competitiveness. The answers about selected customer groups and markets were answered in very broad terms and they were not willing to specify in more than wide categories. This had the effect that the results section could not be presented in the detail sought for. The larger biodiesel producers did also not want their answers to stand out from the rest of the population and put demands on the data display. Even the smaller producers would not want their competitors to be able to read about their company or figures in detail in this report. A statement shows the common view among the respondents of this matter: “This marketing data can be sensitive to share; the other producers are after all competitors to us”. It was decided that the collected data was to be presented by respondent frequency and not relative to each responding firm’s actual production or capacity. The respondents answer could also be limited if the person did not have all the facts at hand during the interviews or the answers were short-versions of a highly complex “complete answer”. All data presented in the Results section is constructed from statements that were recorded during the interviews, but the quotes have sometimes been somewhat condensed. All interviews were conducted in Swedish and thereby all statements in the report are translations from Swedish.
27
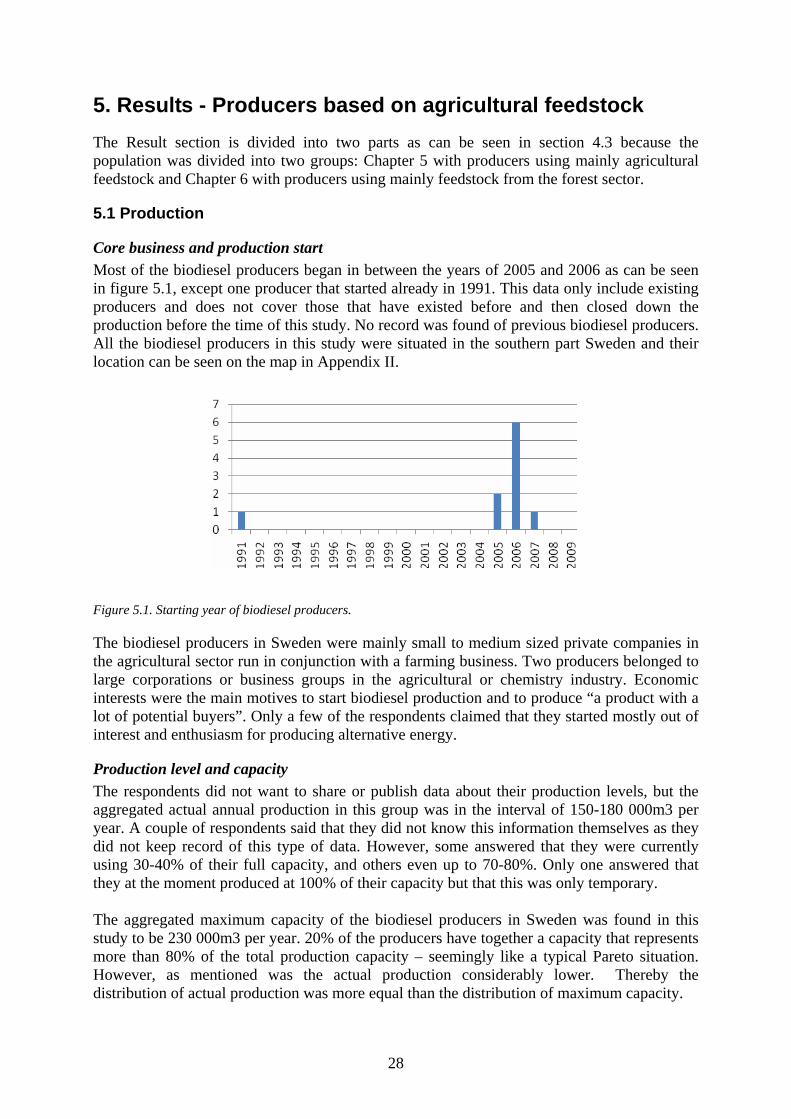
5. Results - Producers based on agricultural feedstock The Result section is divided into two parts as can be seen in section 4.3 because the population was divided into two groups: Chapter 5 with producers using mainly agricultural feedstock and Chapter 6 with producers using mainly feedstock from the forest sector.
5.1 Production
Core business and production start Most of the biodiesel producers began in between the years of 2005 and 2006 as can be seen in figure 5.1, except one producer that started already in 1991. This data only include existing producers and does not cover those that have existed before and then closed down the production before the time of this study. No record was found of previous biodiesel producers. All the biodiesel producers in this study were situated in the southern part Sweden and their location can be seen on the map in Appendix II.
Figure 5.1. Starting year of biodiesel producers.
The biodiesel producers in Sweden were mainly small to medium sized private companies in the agricultural sector run in conjunction with a farming business. Two producers belonged to large corporations or business groups in the agricultural or chemistry industry. Economic interests were the main motives to start biodiesel production and to produce “a product with a lot of potential buyers”. Only a few of the respondents claimed that they started mostly out of interest and enthusiasm for producing alternative energy.
Production level and capacity The respondents did not want to share or publish data about their production levels, but the aggregated actual annual production in this group was in the interval of 150-180 000m3 per year. A couple of respondents said that they did not know this information themselves as they did not keep record of this type of data. However, some answered that they were currently using 30-40% of their full capacity, and others even up to 70-80%. Only one answered that they at the moment produced at 100% of their capacity but that this was only temporary. The aggregated maximum capacity of the biodiesel producers in Sweden was found in this study to be 230 000m3 per year. 20% of the producers have together a capacity that represents more than 80% of the total production capacity – seemingly like a typical Pareto situation. However, as mentioned was the actual production considerably lower. Thereby the distribution of actual production was more equal than the distribution of maximum capacity.
28
Figure 5.2. Distribution of production capacity on individual producers of biodiesel 2009.
The producers’ production capacity in relation to the aggregated production capacity is presented in Figure 5.2. The production was dominated by two producers and was followed by a range of medium to small producers. The maximum production capacity of the two large scale producers was 160 000m3 and 45 000m3 per year respectively, and two medium-scale producers had a maximum capacity of approximately 10 000m3 per year each. Each of the six small-scale producers had a maximum capacity of up to about 1 000m3 per year. The majority of the producers did not intend to expand their capacity within the next two years and none were in need of capacity expansion at the moment; as they still had relatively much available capacity. Half of the producers had the ability to expand but did not see a reason for this within the next couple of years. Further expansions were mainly held back by high investment costs. Only one producer was sure to expand the capacity soon but did not want to reveal how much. Thereby stated most of the producers they were staying on the current production level at least throughout the year 2009. In order for the smaller producers to expand their production most needed to up-scale their whole operation, while the larger producers would only need to add construction modules to their production facilities. Figure 5.3 shows that two producers were going to stop producing biodiesel because of low demand.
Figure 5.3. Producers’ planned changes of production capacity.
Types of technology and energy used for production All producers used the transesterification process with methanol as the alcohol. The equipment that was used by the smaller scale producers was mainly bought from the same biodiesel process manufacturer in Sweden. One producer had previously bought equipment also from England. The larger producers had bought their equipment and one had bought their facility from a supplier in France. Of all the producers said only one respondent that their production processes were “self manufactured”. Furthermore, all producers reduced their energy costs by generating the process heat from internal combustion of production residues or products of the biodiesel production. However, those involved in other processes or
29
business additionally made use of material from these sources too. A minority used “green electricity” and this was good for their marketing.
Labor for biodiesel production Generally was only about one worker needed in order to run the biodiesel production, but the scale of the facilities determined if more than one shift was necessary, see Table 5.1.
Table 5.1 Labor for the biodiesel production
Full-time labor: Number of respondents:
<1 person 4
1-2 person(s) 4
3-4 persons 2*
Distribution of the overall production costs The raw materials dominated the overall costs for the biodiesel producers; however it was not possible to get detailed information in numbers from the respondents. The majority of the respondents only described that the raw materials made up almost all their costs. A producer of biodiesel production equipment and factories confirmed that the raw materials represent about 80% of the total biodiesel production cost.
By-products from biodiesel production Glycerol was the main by-product for all of the biodiesel producers and this was produced in relatively large quantities. More than half of the small and medium scale producers made rapeseed meal that came from their own vegetable oil extractor presses. A majority of the smaller biodiesel producers emphasized that they did not waste any material from their processes and that all their process outputs were recovered for use in various applications as animal feed, chemical compounds, fertilizers etc.
Production of other fuel types The majority said that they were not producing any other fuel and would not in the future. Only two producers were producing biogas by using the glycerol by-product from their biodiesel production. The large producers were not producing other fuels than biodiesel at their production plants. But one corporation had a large-scale plant for production of ethanol and another one was involved in projects of hydrating vegetable oils directly in oil refineries.
Producers perceived competitive situation The vast majority of the respondents answered they had no competitors with other biodiesel producers within their geographical reach. They did not compete for the same customers with other biodiesel producers. Therefore they did not perceive there existed any competitive situation with other biodiesel producers, neither about raw materials nor about market shares. The only type of “competition” that existed was the “media focus”. Most producers were worried that biodiesel did not get as much attention in the media and press as ethanol and biogas did. Their main opinion was that this was an effect of successful lobbying from the other biofuels industries which could be having strong influence on politicians, municipal procurement policies and on customer acceptance and awareness in general. A common statement among the respondents was therefore that they wanted to see more companies produce and sell biodiesel in Sweden as this would make the biodiesel concept more known and accepted as vehicle fuel both by the general public and by special consumer groups.
30
5.2 Raw materials and supply Renewable raw materials used for biodiesel production Most of the producers used rapeseed oil (including methanol and additives) to produce biodiesel (RME), see Figure 5.4. One was producing RME during the winter and biodiesel made out of used cooking oil during the summer so the oil types were used separately and not mixed. Only one produced biodiesel exclusively out of used cooking oil.
Figure 5.4 Raw materials in the biodiesel production.
The used cooking oils were said to be an unknown mix of both sun seed oil and palm oil and perhaps other oils and animal fats as well. The methanol compound that was used for production originated from fossil sources.
Raw material supply The oils that were used for biodiesel production were mostly bought from external vendors or large extractors. The largest biodiesel producers only bought oil, and half of the producers had the capability of extracting vegetable oils themselves from rapeseed with their own presses, see Table 5.2. This covered only partly their demand for oil so they were buying vegetable oils from external sources too. A few respondents had neighboring farms that delivered rapeseed.
Table 5.2 Origin of raw materials
Source Number of respondent
Only own raw materials -
Both own and bought raw materials 5
Only bought raw materials 5 Shortage of feedstock was not a critical issue for the producers but many respondents were still restrictive in answering questions about their raw material situation. Figure 5.5 shows that most producers did not have any difficulties in obtaining the raw materials needed for their biodiesel production, nonetheless, almost all of the respondents at the same time claimed that insufficient raw materials was the major concern for the industry. The differences in these statements were explained by the situation of limited resources for the biodiesel industry in general; but that they themselves did not currently lack access to sufficient feedstock.
31
Figure 5.5. Overall effort in obtaining raw materials for biodiesel production
Yet Figure 5.5 shows that some producers had more difficulties in obtaining raw materials and they all explained that it was not easy to get good contracts from extractors for either rapeseed or rapeseed oil. Some of them had to sign up for large quantities relative to their size in order to get the contracts. The respondents that bought used cooking oil had no problem in finding enough of this for their production. Finally most respondents mentioned that they did not think their businesses had any negative impact on food production potentials. As can be concluded from Figure 5.6 used most of biodiesel producers domestic raw materials for their production. There were producers that imported all or parts of their raw material input. It must be noted that the volume of biodiesel produced in Sweden from imported raw material was significantly larger than the volume produced from domestic raw materials.
Figure 5.6 Imports
The respondents importing raw materials were reluctant to reveal from what specific countries they where importing from or did not want the particular countries to be mentioned in this report. The following could still be summarized in order to describe the geographical reach of imports in general and what criteria the producers had for the raw material sources.
• Most of the imported raw materials were bought from ‘some of the closest European countries south of Sweden.
• Imported vegetable oil was mainly bought from very large European vegetable oil extractors. The extractors of vegetable oil from were possibly importing oilseeds from other countries as well which made the true origin of the vegetable oil unknown.
Domestic feedstock was a strong criterion for the producers who chose to not import raw materials, even though they could. This standpoint was criticized by one respondent that was sometimes importing raw materials and called this “nationalism” and that this was bad for biodiesel development. Those respondents that argued for only using domestic raw materials did however not express any patriotism during the interviews. Their reasons for domestic feedstock were that biodiesel should be produced and consumed locally to minimize the transportation costs and the environmental impact. The rapeseed of the Nordic countries was claimed to have natural qualities better for biodiesel being used in cold weather climate zones.
32
Alternative raw materials The vast majority was either negative towards change or evaluating other raw material options but they were still not convinced that there existed any other suitable alternatives, see Figure 5.7. The problem with other raw materials was their negative effect especially on the cold weather properties of the final biodiesel fuel product.
Figure 5.7. Other feedstock
Almost all of those that were negative to changing feedstock had already investigated other alternatives before, including used cooking oil but they were not satisfied with the results. They had all come to the conclusion that rapeseed oil was “the one and only choice for producing high-quality biodiesel” and claimed that RME was the only biodiesel type that can be used in the Swedish climate zone”. Palm oil was not a feedstock option due its properties but also due to “environmental issues concerning palm oil plantations and clearings of rainforests” and “heavy negative publicity related to palm oil” by the public and the media.
Raw material prices The vast majority of the respondents answered that the prices of rapeseed and/or rapeseed oil have been very high and difficult to predict, and that this has been the main reason why the profit margin for their production had been low lately. The last year the feedstock price had been the equal or higher than the price of biodiesel fuel. It was said that prices on rape and rapeseed oil was following the development of the crude-oil prices. Two producers answered that they had paused their production during the whole year of 2008 directly due to high raw material prices and a third producer had therefore switched to use waste cooking oil instead.
Raw material requirements Generally the respondents stated that they had their own specific criteria for the rapeseed or rapeseed oil they bought but the degree of control varied between the producers. Only one respondent claimed to have no requirements on the raw materials they bought for their biodiesel production. The following criteria were mentioned by the respondents:
• About half of the producers focused mainly on controlling the quality of the raw materials that they were buying. Especially that it would meet their criteria for the Swedish climate zone. These criteria focused on the properties and chemical composition of the oil. They were either inspecting the feedstock quality had good close relations with their suppliers that guaranteed them high-quality raw materials.
• The other half of the respondents were focusing on meeting the biodiesel standard requirements. It was important that the raw materials were of local origin because it was important for environmental reasons and to reduce the transportation costs.
• One producer was extracting rapeseed oil from only Swedish rapeseed due to health reasons. Their rapeseed meal was being sold as feed for milk cows and their customers claimed that foreign rapeseed could be contaminated and damage the milk production.
33
Feedstock development No producer was interested in using feedstock from genetically modified vegetable oil seed plants to improve the vegetable oil composition or increase the yield of the feedstock. There was generally no interest in developing vegetable oil seed plants for biodiesel production utilizing conventional plant breeding. However, as can be noted in Figure 5.8 many respondents were cautious but not rejecting conventional breeding. Their standpoint was that breeding crops could maybe be a solution for solving the cold weather properties of the biodiesel “but as long as this does not involve GMO material”. Still they did not see any reason to develop rapeseed in a direction away from an “edible towards an inedible state just to get away from the conflict between food- and biofuel production”. Instead was the Jatropha plant seen as a better target than the rape to breed towards higher yield and with pleasant properties for biodiesel production and that this would be interesting to buy in the future.
Figure 5.8. Modified crop
A few of the biodiesel producers were completely opposed to any further breeding or modification of the rape or any other vegetable oil plants “as these could get mixed up with the edible plants” and they anticipated that this would cause additional administration and workload. Regardless of that they argued that “the current rapeseed quality is good enough for both food and for biodiesel production” and that “there is no need any further development”.
5.3 Markets and distribution Advantages and disadvantages The answers about advantages could be divided into technical and environmental aspects; Technical advantages:
• “Biodiesel is functional in an ordinary diesel engine” • “Compatible with the current diesel fuel distribution infrastructure” • “The increasing demand for diesel fuel in general is also good for biodiesel demand”. • “Large potential in heavy transport sector” (ethanol, biogas or electricity not options).
Environmental advantages: • “Renewable” and “Is biodegradable in only 21 days” • “Has lower emissions than petroleum diesel” or “has no emissions at all” • “Not poisonous” and “Not harmful to handle” • “The easiest way today to convert the transport sector from using petroleum fuels” • “Probably the best choice of alternative fuels, especially if made of used cooking oil”. • Additionally two small-scale producers added that “Using biodiesel smells good”.
Not many disadvantages were mentioned about biodiesel; however the following aspects were mentioned by a couple of producers:
• “The natural rubber material must be replaced before use in an ordinary diesel engine” • “Can cause some engine problems due to the cold Swedish winter climate” • “Because it is a fresh commodity it cannot be stored for very long”
34
Market segments and development The chosen customer segments are displayed in Figure 5.9 and 5.10. The large- and medium scale producers tended to focus on several distinct market segments while the small-scale producers were narrowed in on a fewer number of market types. Half of the respondents thought the demand for their biodiesel was “already huge” and going to increase in their main customer segments during the next couple of years, mainly haulage firms and bus companies. The others projected that the overall demand would either stay on the same current level, or decrease. The two producers that were exiting the biodiesel production business both claimed that the demand for biodiesel was already low and that it was expected to decline further. Their problem was that they could not attract customers with large consumption of fuel.
Figure 5.9 Main market segments for large and medium scale biodiesel producers
For the large-scale producers the main market was foremost oil companies that then mostly blended it in petroleum diesel fuel and sold the low-admixed diesel as regular diesel. One of the middle-scale producers “sometimes” sold their biodiesel to oil companies too. Another middle-scale producer “could” sell their biodiesel to the oil companies but claimed that they chose to not do this because the oil companies were not offering them enough payment relative to the oil companies’ high quality demands. The large-scale producers were selling biodiesel to other types of customers too as shown in Figure 5.9 but would not reveal their selling volumes or permit exact numbers to be published. Approximately 1-15% of their production volume sold to other markets besides to oil companies. These other markets were similar to the main market segments of the medium-scale biodiesel producers as can also be seen in Figure 5.9. These markets were:
• Larger firms with high consumption level and with a public “environmental policy”. • Municipalities; some very interested in buying biodiesel and others very pessimistic. • Other markets were schools, individual persons, farmers and industry applications.
For the small-scale biodiesel producers the main market segments are shown in Figure 5.10. As can be noticed were they not selling to oil companies at the moment and they where not interest in doing so in the future either - except for one respondent. The majority of the small-scale producers explained their standpoint by the same argument; “we will never sell for low-admixture as our policy is to only sell for the local market”. The following were the small-scale producers’ most common comments about their selected markets segments:
• Most attractive customers had “environmental policy” and high consumption level relative to the respondents’ own production volume. This market segment was often described as “huge” relative to the small-scale producers.
• The respondents opinions on selling biodiesel to the public varied: a few were against this and claimed that only professional transportation firms had the knowledge necessary to use biodiesel. It was claimed that “there are many individuals out there
35
that would like to buy biodiesel but only if they would keep their engine guaranty”; and that this situation was limiting a market expansion.
Figure 5.10. The main markets segments for the small-scale biodiesel producers.
The customers of biodiesel were told to be very price-sensitive and many producers of all sizes mentioned that biodiesel often needed to have the same or lower price as petroleum diesel in order to sell. These were the most frequent comments on this matter:
• Some municipalities demanded guarantees that the biodiesel prices would “always be cheaper than petroleum diesel prices or there would be no deal”.
• Many haulage firms only bought biodiesel that was cheaper than petroleum diesel; which made some producers “question the authenticity of ‘environmental policies’”.
• Contractors working with e.g. road-building or forestry, could have been an “idealistic customer segment” but they were found to “only buy the cheapest fuel possible, thus only petroleum diesel”. It was presumed that this also had to do with motor guaranty.
• The public was said to only be interested in biodiesel cheaper than petroleum diesel.
Extra services The vast majority of the biodiesel producers claimed it was necessary to offer additional services when they sold their biodiesel product. These services often included “information about practical biodiesel use and handling”, “technical support”, “lending or renting of depots and tanks to customers” and some even offered free delivery within a certain range. Among the small-scale producers it was said that some customers appreciated that they could “point-out the fields from where the rape for the biodiesel was grown”.
Exports Occasionally biodiesel was exported but only to other neighboring countries since “biodiesel is a fresh commodity”. The majority of the respondents only sold their product on the domestic market. Some claimed it was out of concern for environmental aspects and others stated “the higher quality of Swedish biodiesel makes it more expensive than the European biodiesel of lower quality, and therefore it cannot compete on the European market”.
Estimated price development of biodiesel The price on RME biodiesel was said to follow the development of the crude-oil prices, but with a slight lag and by lower amplitude. Among producers of smaller scale it was more common to focus on the rapeseed- and other vegetable oil seed prices when predicting future biodiesel prices. Still most respondents claimed that it was not actually possible to predict how biodiesel prices would develop. One revealed that their profit per liter of biodiesel about a year ago was SEK 2:00/liter but that in 2008 it was mostly negative. In the beginning of 2009 the profit marginal had been merely SEK 0:10/liter. The profit marginal was expected to increase again in the next couple of years.
36
Internal consumption Table 5.3 shows that the majority of the producers were using some of their production to fuel their own vehicles; however this action was dominated by mainly smaller producers. One respondent of the larger producers stated that “right now we do not use our own fuel product but we are evaluating the usage of biodiesel for all internal transports within the company”.
Table 5.3 Producers own usage of biodiesel
Number of respondents:
Sell all production to customers 3
Use some of the fuel product themselves 7 Some smaller producers stated that “we use our own product for some of our vehicles even though it is not economical for us to do this as we loose sales. But we do it because we want to show people that there are no problems related with biodiesel”. A few mentioned that “we even use biodiesel in our passenger cars”. Additionally, criticism was aimed towards the SEK 2/liter subvention of petroleum diesel fuel to farmers. It was claimed that this made it more cost efficient to use petroleum diesel instead of using biodiesel and that “this is the only reason why not all farmers use or producer their own biodiesel in Sweden”.
By-product markets The larger producers sold their glycerol to the cosmetic industry, paint- or plastic industry, various chemical industries or to biogas producers depending on how clean the glycerol was. Depending on the price-level of glycerol it could be sold to animal feed producers as well. The medium scale producers sold their by-product but would not give any details. The small-scale producers sold their glycerol mostly to biogas producers but they complained about that “municipal biogas-plants are often very interested in buying glycerol but only if they get it more or less for free!”. Therefore they were looking into ways to refine their glycerol in order to get a higher glycerol price by selling it to chemical industries instead. The producers that extracted vegetable oils sold their rapeseed meal as “high-quality protein animal feed”, and said that all of their by-products were very important for the overall economy. Half of them stated that it was “very easy to find buyers of animal feed” and the other half claimed the opposite. This was probably due to regional differences.
Marketing of biodiesel The most common marketing method was “personal meetings with the customers” as seen in Figure 5.11 by which they meant sitting “face-to-face”. Sometimes it was hard because some haulage firms needed to be convinced. They were often skeptical due to the “oil companies failed introduction of low-admixed diesel the first winter which reduced the interest in biodiesel in Sweden”. When talking to the oil companies it was commented that “we were told by the biodiesel producers that biodiesel had better quality than it actually did. The problem was that they did not have the quality control or routine that was necessary but we were the ones that were criticized by the customers”. Now the quality issues were solved because “we sent out our own people to the biodiesel producers we buy from and educated them on quality control” but that “some customers are still rejecting biodiesel since then”. Two producers had no marketing activities for their product at all and did not reflect much about that. One respondent though that “maybe marketing would be a good thing to do” and another said marketing could be necessary: “people don’t buy champagne if it hasn’t a pretty
37
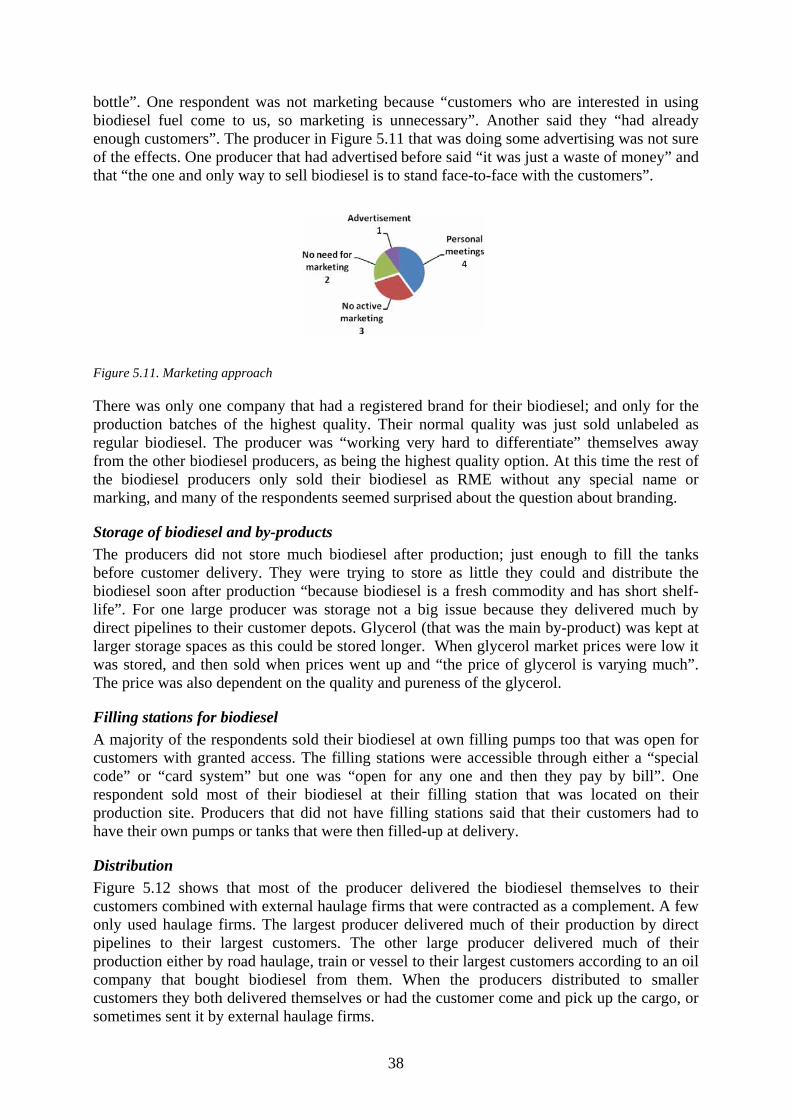
bottle”. One respondent was not marketing because “customers who are interested in using biodiesel fuel come to us, so marketing is unnecessary”. Another said they “had already enough customers”. The producer in Figure 5.11 that was doing some advertising was not sure of the effects. One producer that had advertised before said “it was just a waste of money” and that “the one and only way to sell biodiesel is to stand face-to-face with the customers”.
Figure 5.11. Marketing approach
There was only one company that had a registered brand for their biodiesel; and only for the production batches of the highest quality. Their normal quality was just sold unlabeled as regular biodiesel. The producer was “working very hard to differentiate” themselves away from the other biodiesel producers, as being the highest quality option. At this time the rest of the biodiesel producers only sold their biodiesel as RME without any special name or marking, and many of the respondents seemed surprised about the question about branding.
Storage of biodiesel and by-products The producers did not store much biodiesel after production; just enough to fill the tanks before customer delivery. They were trying to store as little they could and distribute the biodiesel soon after production “because biodiesel is a fresh commodity and has short shelf-life”. For one large producer was storage not a big issue because they delivered much by direct pipelines to their customer depots. Glycerol (that was the main by-product) was kept at larger storage spaces as this could be stored longer. When glycerol market prices were low it was stored, and then sold when prices went up and “the price of glycerol is varying much”. The price was also dependent on the quality and pureness of the glycerol.
Filling stations for biodiesel A majority of the respondents sold their biodiesel at own filling pumps too that was open for customers with granted access. The filling stations were accessible through either a “special code” or “card system” but one was “open for any one and then they pay by bill”. One respondent sold most of their biodiesel at their filling station that was located on their production site. Producers that did not have filling stations said that their customers had to have their own pumps or tanks that were then filled-up at delivery.
Distribution Figure 5.12 shows that most of the producer delivered the biodiesel themselves to their customers combined with external haulage firms that were contracted as a complement. A few only used haulage firms. The largest producer delivered much of their production by direct pipelines to their largest customers. The other large producer delivered much of their production either by road haulage, train or vessel to their largest customers according to an oil company that bought biodiesel from them. When the producers distributed to smaller customers they both delivered themselves or had the customer come and pick up the cargo, or sometimes sent it by external haulage firms.
38
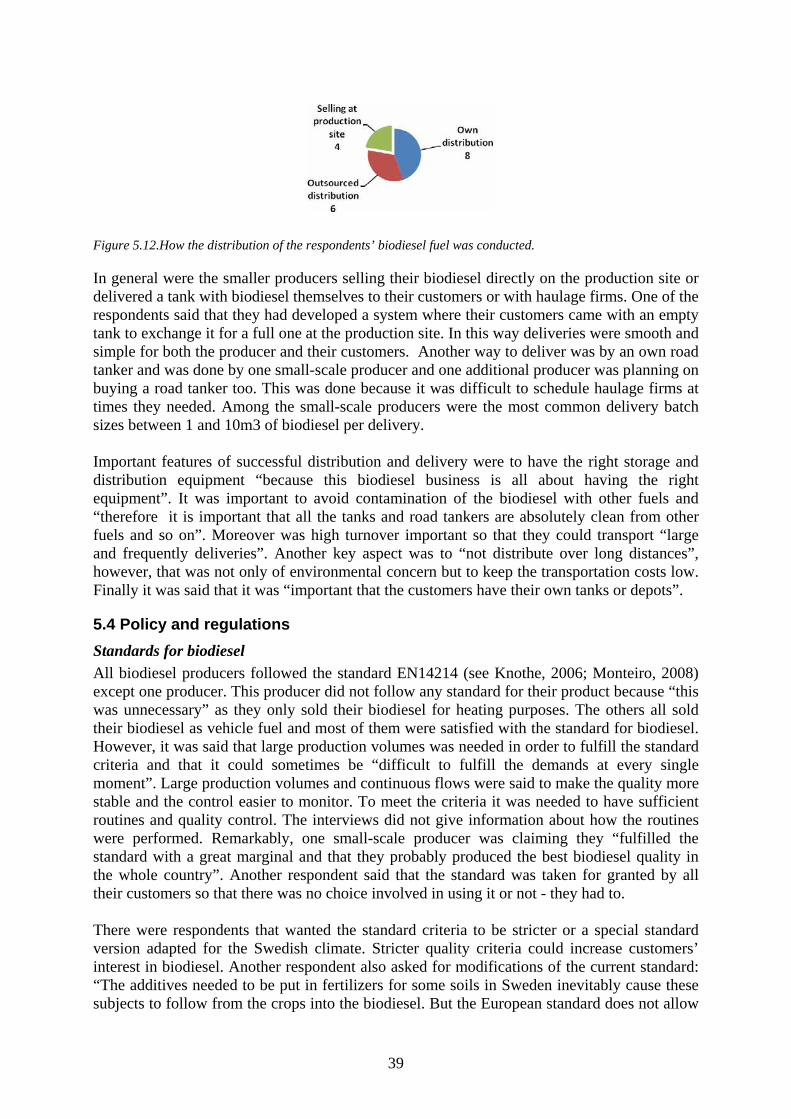
Figure 5.12.How the distribution of the respondents’ biodiesel fuel was conducted.
In general were the smaller producers selling their biodiesel directly on the production site or delivered a tank with biodiesel themselves to their customers or with haulage firms. One of the respondents said that they had developed a system where their customers came with an empty tank to exchange it for a full one at the production site. In this way deliveries were smooth and simple for both the producer and their customers. Another way to deliver was by an own road tanker and was done by one small-scale producer and one additional producer was planning on buying a road tanker too. This was done because it was difficult to schedule haulage firms at times they needed. Among the small-scale producers were the most common delivery batch sizes between 1 and 10m3 of biodiesel per delivery. Important features of successful distribution and delivery were to have the right storage and distribution equipment “because this biodiesel business is all about having the right equipment”. It was important to avoid contamination of the biodiesel with other fuels and “therefore it is important that all the tanks and road tankers are absolutely clean from other fuels and so on”. Moreover was high turnover important so that they could transport “large and frequently deliveries”. Another key aspect was to “not distribute over long distances”, however, that was not only of environmental concern but to keep the transportation costs low. Finally it was said that it was “important that the customers have their own tanks or depots”.
5.4 Policy and regulations Standards for biodiesel All biodiesel producers followed the standard EN14214 (see Knothe, 2006; Monteiro, 2008) except one producer. This producer did not follow any standard for their product because “this was unnecessary” as they only sold their biodiesel for heating purposes. The others all sold their biodiesel as vehicle fuel and most of them were satisfied with the standard for biodiesel. However, it was said that large production volumes was needed in order to fulfill the standard criteria and that it could sometimes be “difficult to fulfill the demands at every single moment”. Large production volumes and continuous flows were said to make the quality more stable and the control easier to monitor. To meet the criteria it was needed to have sufficient routines and quality control. The interviews did not give information about how the routines were performed. Remarkably, one small-scale producer was claiming they “fulfilled the standard with a great marginal and that they probably produced the best biodiesel quality in the whole country”. Another respondent said that the standard was taken for granted by all their customers so that there was no choice involved in using it or not - they had to. There were respondents that wanted the standard criteria to be stricter or a special standard version adapted for the Swedish climate. Stricter quality criteria could increase customers’ interest in biodiesel. Another respondent also asked for modifications of the current standard: “The additives needed to be put in fertilizers for some soils in Sweden inevitably cause these subjects to follow from the crops into the biodiesel. But the European standard does not allow
39
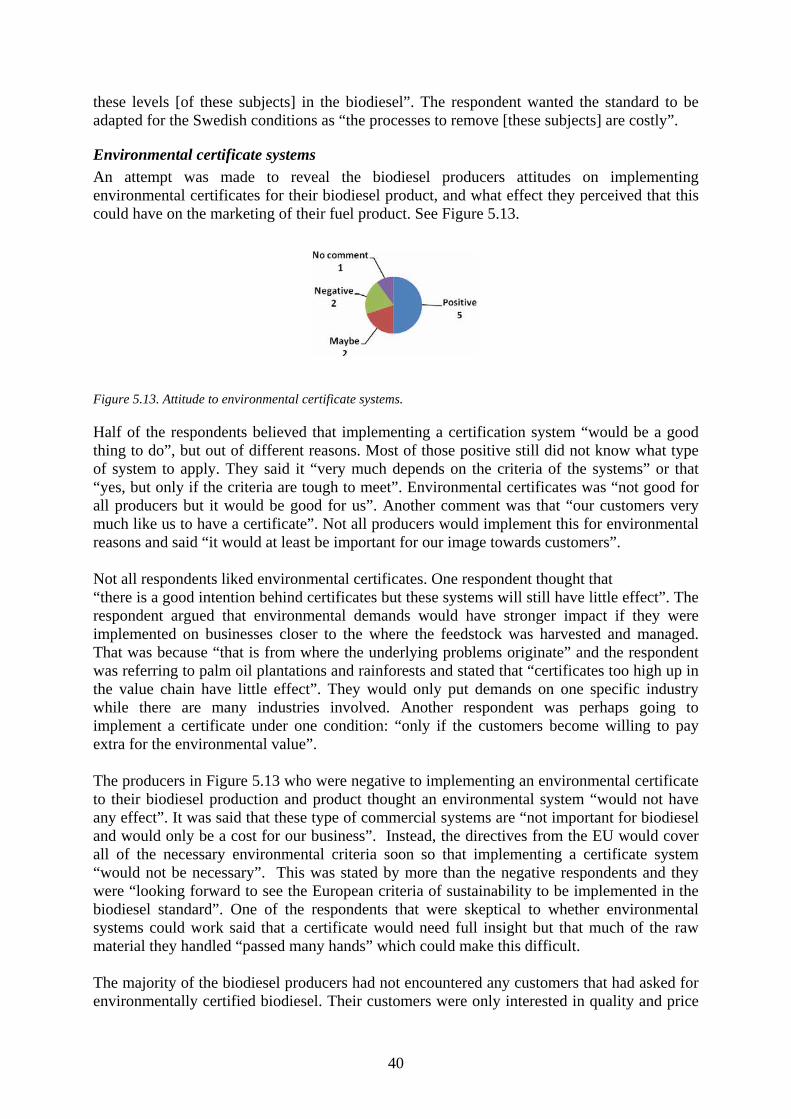
these levels [of these subjects] in the biodiesel”. The respondent wanted the standard to be adapted for the Swedish conditions as “the processes to remove [these subjects] are costly”.
Environmental certificate systems An attempt was made to reveal the biodiesel producers attitudes on implementing environmental certificates for their biodiesel product, and what effect they perceived that this could have on the marketing of their fuel product. See Figure 5.13.
Figure 5.13. Attitude to environmental certificate systems.
Half of the respondents believed that implementing a certification system “would be a good thing to do”, but out of different reasons. Most of those positive still did not know what type of system to apply. They said it “very much depends on the criteria of the systems” or that “yes, but only if the criteria are tough to meet”. Environmental certificates was “not good for all producers but it would be good for us”. Another comment was that “our customers very much like us to have a certificate”. Not all producers would implement this for environmental reasons and said “it would at least be important for our image towards customers”. Not all respondents liked environmental certificates. One respondent thought that “there is a good intention behind certificates but these systems will still have little effect”. The respondent argued that environmental demands would have stronger impact if they were implemented on businesses closer to the where the feedstock was harvested and managed. That was because “that is from where the underlying problems originate” and the respondent was referring to palm oil plantations and rainforests and stated that “certificates too high up in the value chain have little effect”. They would only put demands on one specific industry while there are many industries involved. Another respondent was perhaps going to implement a certificate under one condition: “only if the customers become willing to pay extra for the environmental value”. The producers in Figure 5.13 who were negative to implementing an environmental certificate to their biodiesel production and product thought an environmental system “would not have any effect”. It was said that these type of commercial systems are “not important for biodiesel and would only be a cost for our business”. Instead, the directives from the EU would cover all of the necessary environmental criteria soon so that implementing a certificate system “would not be necessary”. This was stated by more than the negative respondents and they were “looking forward to see the European criteria of sustainability to be implemented in the biodiesel standard”. One of the respondents that were skeptical to whether environmental systems could work said that a certificate would need full insight but that much of the raw material they handled “passed many hands” which could make this difficult. The majority of the biodiesel producers had not encountered any customers that had asked for environmentally certified biodiesel. Their customers were only interested in quality and price
40
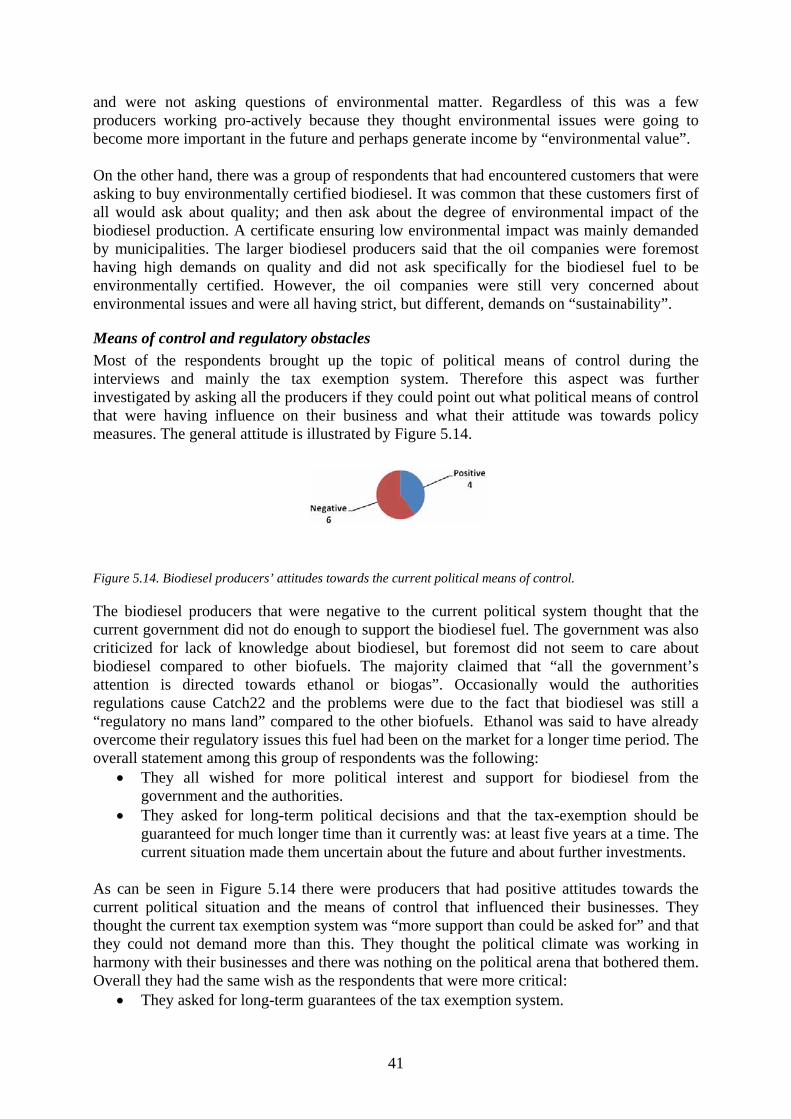
and were not asking questions of environmental matter. Regardless of this was a few producers working pro-actively because they thought environmental issues were going to become more important in the future and perhaps generate income by “environmental value”. On the other hand, there was a group of respondents that had encountered customers that were asking to buy environmentally certified biodiesel. It was common that these customers first of all would ask about quality; and then ask about the degree of environmental impact of the biodiesel production. A certificate ensuring low environmental impact was mainly demanded by municipalities. The larger biodiesel producers said that the oil companies were foremost having high demands on quality and did not ask specifically for the biodiesel fuel to be environmentally certified. However, the oil companies were still very concerned about environmental issues and were all having strict, but different, demands on “sustainability”.
Means of control and regulatory obstacles Most of the respondents brought up the topic of political means of control during the interviews and mainly the tax exemption system. Therefore this aspect was further investigated by asking all the producers if they could point out what political means of control that were having influence on their business and what their attitude was towards policy measures. The general attitude is illustrated by Figure 5.14.
Figure 5.14. Biodiesel producers’ attitudes towards the current political means of control.
The biodiesel producers that were negative to the current political system thought that the current government did not do enough to support the biodiesel fuel. The government was also criticized for lack of knowledge about biodiesel, but foremost did not seem to care about biodiesel compared to other biofuels. The majority claimed that “all the government’s attention is directed towards ethanol or biogas”. Occasionally would the authorities regulations cause Catch22 and the problems were due to the fact that biodiesel was still a “regulatory no mans land” compared to the other biofuels. Ethanol was said to have already overcome their regulatory issues this fuel had been on the market for a longer time period. The overall statement among this group of respondents was the following:
• They all wished for more political interest and support for biodiesel from the government and the authorities.
• They asked for long-term political decisions and that the tax-exemption should be guaranteed for much longer time than it currently was: at least five years at a time. The current situation made them uncertain about the future and about further investments.
As can be seen in Figure 5.14 there were producers that had positive attitudes towards the current political situation and the means of control that influenced their businesses. They thought the current tax exemption system was “more support than could be asked for” and that they could not demand more than this. They thought the political climate was working in harmony with their businesses and there was nothing on the political arena that bothered them. Overall they had the same wish as the respondents that were more critical:
• They asked for long-term guarantees of the tax exemption system.
41
The majority of the biodiesel producers thought a mandatory low-admixture blending for the oil companies would benefit the overall acceptance and demand for biodiesel on the market. At least more than the current voluntary low-admixture was doing. The larger biodiesel producers were less precise on their position in this matter but welcomed an increased allowance for low-admixture. Figure 5.15 shows the producers dependence on political means of control that regulate the fuel market. Especially the tax system was claimed to be essential for the survival to of the respondents businesses. This opinion was shared by both producers with positive and negative attitudes towards the current political situation.
Figure 5.15. What would happen to the biodiesel production if political means of control were not regulating the fuel market.
Those that would close their business claimed that “the biodiesel market would not exist at all” if the tax-exemption on biodiesel was removed; because the biodiesel prices would not be able to compete petroleum diesel prices. The problem was that “the consumers only buy the cheapest fuel”. Two respondents mentioned they understood why the government eventually would need all fuels to be taxed. Much income would otherwise be lost; especially with a growing market of biofuels. Perhaps another solution than tax exemption was said to be needed to protect alternative fuels from low price petroleum fuels; and still generate income for the government. One respondent who stated their businesses would continue said that “the political support could only last a limited period of time and that their need for exemptions would decline, for example due to the decline of our biodiesel facility costs”. The other respondent stated that “it would not be easy but nothing is impossible”. Furthermore, Table 5.4 presents the major obstacles of regulatory nature mentioned by the respondents:
Table 5.4 Regulatory obstacles
Obstacle category Number of respondents The mentioned aspects of each category
Politics and regulations 8 "Price-dumping from imported biodiesel from USA" "Missing long-term political guarantees" "Weak incentives for buyers of renewable fuels" "The pump-law", "Politicians don’t know of biodiesel" "Subvention of petroleum diesel to farmers"
Car manufacturers 6 "Little interest from car manufacturers to allow B100" "Passenger car market closed due to car manufacturers"
Municipal policies 3 “Municipal ‘green policies’ include ethanol and biogas but not RME” Some of the obstacles are commented further: The larger producers both mentioned the “dumping-case” i.e. the price-dumping of biodiesel imported from the USA that was subsidized with American tax-payer money which lowered the price-level of biodiesel in Europe. This issue was some of these respondents’ major concerns during the time of the
42
interviews (January and February 2009). In March 2009 the European Commission decided to put a countervailing anti-dumping duty on this imported biodiesel to the EU, and the problem was then preliminary solved. Then this matter was no longer an issue for these biodiesel producers. When it comes to all of the biodiesel producers the overall issues were:
• The lack of long-term guarantees of the tax-exemption system. • A few technical matters that were of out control for the respondents but were affecting
the available markets. The main issue here was the closed passenger car market; as the car manufacturers suspended the motor engine guaranty for drivers that used pure or high-blends of biodiesel in a diesel engine without permission.
5.5 Future development Establishment barriers Figure 5.16 shows areas in which the respondents mentioned that they were still or had been facing difficulties when they were starting their biodiesel production.
Figure 5.16. The main obstacles when establishing biodiesel production in Sweden.
The most frequent topics are here reviewed shortly:
Low cost substitutes: • For most producers the major challenge was the low price on petroleum diesel due to
low crude-oil prices, but the crude-oil prices were expected to eventually increase again in the future and this would make biodiesel more profitable again.
• A few producers had difficulties in competing with imported biodiesel and especially biodiesel form the Baltic States that was cheaper due to lower production costs.
Building a customer base: • Many respondents said that a crucial factor when starting their business was to find a
stable and reliable first customer that was consuming large and constant flows of fuel. • Those producers that had this kind of customers were very positive as the demand was
higher than they could produce. The potential market for biodiesel was claimed to be large in Sweden but some potential customers were difficult to convince buy biodiesel.
• The difficulties of launching a biodiesel production and finding suitable customers was formulated by one successful small-scale producer: “Establishing a new product on a new market, that is the most difficult task a cultivator can undertake; and we were also surprised that the market was so resistant towards biodiesel at the beginning”.
• The producers that were going to exit the biodiesel business were lacking customers that consumed large volumes. The low interest from customers they met was explained: “the transportation companies were only focusing on price levels and/or said they did not want extra work of handling biodiesel instead of petroleum diesel”.
43
Low profit: • A few producers stated “the current low profit marginal is going to be continuously
low”. One respondent said “those producers with problems today will keep on having problems tomorrow”. The reason for the low profit level was mainly due to the high raw material prices. Regardless the producers were positive to produce biodiesel.
• The respondents often mentioned the significant cost of setting up the expensive biodiesel production sites. However, the largest biodiesel producer had a few benefits when they came into the biodiesel business: “we only had to start looking for raw materials as we had the customers and almost all the necessary infrastructure from the start thanks to the other production processes within the company”.
Logistics: • It was more difficult than some producers had anticipated to get the logistics of the
whole supply-chain to work smooth or “by the clock” with raw materials, biodiesel and by-products. It was especially not easy to get the by-product flow to work well.
Regulations: • Respondents mentioned they had problems getting permission from the authorities to
start producing biodiesel and much effort had been put in overcoming this. • Another issue was that the producers considered they got their tax-exemption approval
for too short time-periods at a time from the authorities. This made them uncertain about the future and to dare making further investments.
• High-consuming customers were important and most producers were therefore looking for large transportation firms or similar, but these were limited in Sweden. If passenger cars were allowed to use biodiesel without losing their motor guaranty then the demand would go up according to some respondents. This conflict was said to be of mainly regulatory nature and that the actual issues with biodiesel was exaggerated. Therefore criticism was expressed towards the car manufactures for closing off the entire passenger car market besides for the low-admixture. These respondents agreed that “if the car manufactures had shown interest in biodiesel” and done only “minor adjustment to the cars” then the demand for biodiesel would increase significantly.
Technology: • Producing biodiesel was in general “quite easy” according to the larger biodiesel
producers. This was because they “already had much experience” within their companies about this type of processes. According to the smaller producers it was not as easy to produce biodiesel as they “were made to believe” when they started. Therefore they were “still learning and we are still not quite there yet”. Many of the small scale producers was working harder than they initially thought was needed to get the processes running smoothly: “It is necessary to understand everything that is going on, the processes, the chemistry – everything. And that is not easy.”
Threats and opportunities Potential threats to the biodiesel production in Sweden can be found in Table 5.5. The overall future threat for the biodiesel producers was the large amounts and widely spread negative prejudgments of biodiesel quality. This was mostly claimed to be a result of the problems of both the lower biodiesel quality during the early 1990’s and due to earlier problems with the low-admixture during the winter.
44
Table 5.5 Threats to the production of biodiesel
Category Respondents The aspects of each category
Markets 10 "Market limitation", "Demand growing slowly" "Customers misconceptions and lack of knowledge" "Less environmental concern during financial crisis" "No diesel culture", "RME only niche fuel"
Raw materials 4 "Limited availability of rapeseed oil” "Rapeseed prices close to upper limit of RME price"
Competitors 2 "Big producers can put the small out of business" "Large producers can make RME of higher quality"
Politics 5 "Politicians favor ethanol/biogas too much" "No long-term guarantees for tax exemption" "Politics have too much control over RME"
Technology 6 "Car manufacturers do not care about RME" "Closed car market due to car manufacturers" "RME quality not sufficient for Swedish climate"
Substitutes 4 "Low oil price" "Customers only buy RME if it is cheaper"
The possible opportunities for the biodiesel production in Sweden can be found in Table 5.6. The major opportunities that were expressed by the biodiesel producers was both that diesel in general would continue to be an important fuel for heavy vehicles for a long time and that the diesel consumption was constantly growing. The “next generation” fuels were not predicted to force biodiesel away, in contrary; the respondents believed that biodiesel would have a share of about 5-10% of total diesel consumption for a long time to come. Biodiesel was believed to be cheaper than the more expensive “next generation” alternatives, both due to earlier decline of facility costs and because of simpler and cheaper production processes.
Table 5.6 Opportunities for the production of biodiesel
Category Respondents The aspects of each category
Markets 8 "biodiesel will co-exist with the next generation fuel types", "heavy vehicles will still use diesel for a long time", "Still big potential in the market", "large demand for diesel", "The general public opinion is supportive to alternative fuels".
Competition 4 "Large and small biodiesel producers do not compete", "Producers will become larger and fewer".
Politics 1 "Subsidies for petroleum diesel to farmers will disappear"
Technology 2 "Car manufacturers prioritize biodiesel and open new markets"
Substitutes 8 "Next generation fuels will not come before 2020", "Lower facility costs give advantages over next generation fuels", "many substitutes increase the interest in all alternative fuels”, "RME will probably be cheaper than the next generation fuels".
45
Projections • When asked about the future of the industry then three respondents said “I do not
know”. Among the other respondents these were the most common: • A majority was convinced that the near future would offer a “palette” of various
alternative fuels on the market and that “now was the time to evaluate all types of alternative fuels”. Biodiesel was just a “piece in the puzzle”. Some of the alternatives that were mentioned were that “oil companies would probably produce more of their own biofuels i.e. hydrated vegetable oils instead of buying biodiesel from biodiesel producers for low-admixture”.
• A majority believed that the petroleum fuels would dominate as fuel in the transportation sector for a long time to come.
• There were different opinions on how large market share the biodiesel fuel would take of the overall diesel consumption in Sweden. Some said that biodiesel would not take very large market shares as “biodiesel cannot compete with petroleum diesel prices as customers only care about prices” or “biodiesel will only be a small niche fuel” or finally that biodiesel will “never be as big in Sweden as in the rest of Europe due to the cold winter climate here”. However, other respondents believed that biodiesel will take between 5-15% of the Swedish diesel fuel market in the future.
• There were different opinions on how long biodiesel would exist as an option on the fuel market. A first group of respondent said that “biodiesel is only a part of the development towards better fuels, so biodiesel will not be the final solution”. Other respondents agreed with that “the ‘first generation’ biofuels will all stay on the market for at least another 10-15 years”. A third group of producers said that the “’second generation’ fuels will only be adding on-top of biodiesel and not replace it”. The latter claimed that the reason would be that “biodiesel will keep on being cheaper to buy than the ‘second generation’ fuels”.
• The future of biodiesel was dependent of three factors: One was whether or not the car manufacturers would “wake up” and start to develop cars that allowed a higher biodiesel admixture. There other was the worries that the disbeliefs in biodiesel would keep on being strong in some consumer groups. The third was that the future of biodiesel could be decided by the politicians and the outcome depended on if they would or would not continue to “focus on ethanol and biogas fuels only”.
• Almost all the producers were sure biodiesel would remain on the diesel market.
46
6. Results - Producers based on forest sector feedstock 6.1 Production Company structures and primary fuel production The respondents of this section are displayed in Table 6.1. As mentioned in section 4.3 focus this part of the study only on the production of liquid diesel biofuels that origin from mainly cellulosic biomass resources. The respondents for this part of the study were selected because they had plans on building factories that would produce diesel fuels or semi-manufactured components that could be used for synthetic diesel production. For a number of the respondents synthetic diesel was an option or a possibility and not their businesses primary objective.
Table 6.1. The type of businesses
Type Number of respondents
Synthetic diesel fuel producer 3
Synthesis gas producer 3
Crude tall diesel producer 1 Companies representing synthetic diesel was a separate division within one of the largest energy companies of solid biofuels in Scandinavia that also possessed more than twenty central heating plants, large peat resources and solid biofuel processing facilities. Another synthetic diesel producer was a private company affiliated within a larger group and it was currently mainly both developing automatic filling stations and distributing alternative transportations fuels such as ethanol to country-side filling stations. The third respondent was a private company with the business of developing and producing synthetic diesel production factories and they possessed a demonstration plant were they currently produced smaller volumes of synthetic diesel. One company was going to produce synthesis gas and process this mainly into methane. The company was owned by both a large municipal energy company and a large private energy company and they were about to start building a demonstration production facility. Fischer-Tropsch diesel was a possible output of their processes but that was not part of their plans at this time. Another company was also only producing synthesis gas and their business was to sell this to other companies that would process the gas into either DME, Fischer-Tropsch diesel or methane. This company was a non-profit project based company that developed technology for the gasification of biomass into various fuels and the company was part of a holding-company of a Swedish University and currently possessed a demonstration plant. Yet another respondent was a private company that had the business of both setting up production facilities and producing synthesis gas as their end-product. They were perhaps going to use some of their components produce smaller volumes of Fischer-Tropsch diesel as a back-up fuel. The producer of crude tall diesel was a company that was owned partly by a private research company, two of the largest forestry industry companies in Sweden and also by an oil company. The company was currently building a full-scale production facility and this was going to be the first commercial-scale facility for crude tall diesel in the world.
Starting year of production None of the respondents were producing fuel at commercial scale at the time of the study, see Table 6.2, however, one respondent was currently producing smaller volumes of synthetic diesel at their demonstration plant since 2007. The other company that would produce
47
synthetic diesel was currently awaiting an investment decision that was due in 2009/2010 to build a full-scale commercial Fischer-Tropsch diesel plant. Another of the companies that would produce synthetic diesel was still awaiting a permission from authorities to build a full-scale plant; but had already been testing smaller volumes of the fuel in other facilities in Germany. One of the producers of synthesis gas had since 1993 been producing smaller quantities of synthesis gas at their demonstration plant for further development into various liquid and gaseous fuels. They were still awaiting investment decisions and clearance from the authorities to build a larger production facility. Another producer of synthesis gas was going to start building a demonstration plant in 2009 that would be finished in 2012. After that a full-scale would produce commercially in about 2016. A third producer was planning to build their demonstration plant in 2010. The crude tall diesel producer was currently building their full-scale production facility and estimated to be ready to start producing commercially in the year of 2010/2011. It would not be meaningful to present the companies on a map as none have a full commercial scale facility yet, and many of the companies did not reveal the exact location of where to build their facilities as this depends on the authorities as well.
Table 6.2. Current progression stage
Stage Number of respondents
Commercial scale -
Building a full-scale factory 1
Currently had a demonstration factory 2
About to build demonstration factory 1
Awaiting investment decision/permission 3
Reason for production start The producers of synthetic diesel had chosen to enter this industry because it was expected to be a high demand for alternative fuels in the future and especially for diesel fuels. Some said diesel was a good choice because heavy trucks would continue to use diesel fuel for many years to come even though passenger cars would convert to electric hybrids and other options. The companies involved with synthesis gas had known about the gasification of biomass for about 10-15 years or more. The company that started already in the early 1990’s said their business began when the local municipality decided to become “fossil-free municipality”. Another respondent said that their company chose to start producing synthesis because their company had the infrastructure and knowledge of currently distributing biogas and wanted to increase their capacity, so to produce synthetic gas from biomass was a natural step of development. One of the reasons for starting to produce crude tall diesel was according to the respondent that they “wanted to find alternative uses of the products or by-products from the forest industry” and “our plans for crude tall diesel began already in the early 1990’s”.
Maximum annual production capacity The synthetic diesel respondents stated that the dimensions of their full-scale production facilities were going to have a maximum capacity from about 20 000m3 to 50 000m3 and 100 000m3 of synthetic diesel annually. There were possibilities open for smaller production sites such as dimensions of 5 000m3 or less. The aggregated maximum capacity of these companies if they would have only one factory each would make 170 000m3 of synthetic diesel annually. The respondent of the companies that would produce synthesis gas stated that they would set up production facilities in the dimensions of 50MW, 100MW and from 100-600MW, however, only one respondent could say how much volume of liquid fuel this represented. It
48
was said that synthesis gas production facility of the dimension of 100MW represented approximately 80.000m3 of liquid transportation fuel. As the respondents synthesis gas would be used for various types of end-products it would not be meaningful to predict how much (or little) of their synthesis gas in total volume that could be used to produce synthetic diesel. The producer of crude tall diesel stated they would have a full-scale production capacity of about 100.000m3 of crude tall diesel annually.
Types of technology and energy used for production All the respondents said their processes used parts of their raw materials or components as energy for the processes. Two of the respondents in the synthetic diesel business were going to use the Fischer-Tropsch process and one synthetic diesel producer was instead going to use a catalytic process for their synthetic diesel production. One of the producers was going to buy all the technology for their production facility as ready-to-use, but the other stated that they were both buying modules and were develop their own technology. The synthesis gas was going to be produced by gasification of biomass but with different technical variations. Two of the respondents companies would mainly buy already existing modules, “but put it together in a new way”. The other producer of synthesis gas was developing most of their technology themselves. However, some parts were patented by others. The process of making crude tall diesel would start by separating the crude tall oil from the black liquor of the pulp mill process. Then this would go through an esterification process similar to that of when producing biodiesel from vegetable oils. After the separation from other compounds the main product crude tall diesel would then be hydroprocessed at an oil company refinery into a diesel fuel with almost identical properties to petroleum diesel. The technology and equipment that was going to be used was both being bought, but some parts were being developed by their own company. The development of their own processes was mostly done by cooperating with or supporting projects at Universities in Sweden such as Chalmers, KTH, LTH, SLU and more. By talking to one University that was developing the gasification of biomass process it was said that several Swedish Universities had been doing research in this area actively during the last 10-15 years or more.
Labor force for production About ten persons was said to be needed per production site with a capacity of 5 000m3 synthetic diesel annually or 15 persons for a 20 000m3 facility, 20 persons for a 50 000m3 facility and up to 50 persons to run a facility that would produce 100 000m3 of synthetic diesel annually. Furthermore it was said for the largest plant that they in total would require about 200 workers to cover for all the additional services and activities that would be needed for this type of process industry, see Table 6.3. The similar relation was with the companies that were going to produce synthesis gas: a five person work force would be needed for a 50MW production site, about 30 persons for a 100MW facility and with additional services in total 50 workers. The largest projected synthesis gas facility of 100-600MW was said to require about 80 persons and in total “several hundred workers” with all additional services. For the production of 100 000m3 annually of crude tall diesel it was estimated that a work force of about 20 persons would be required.
49
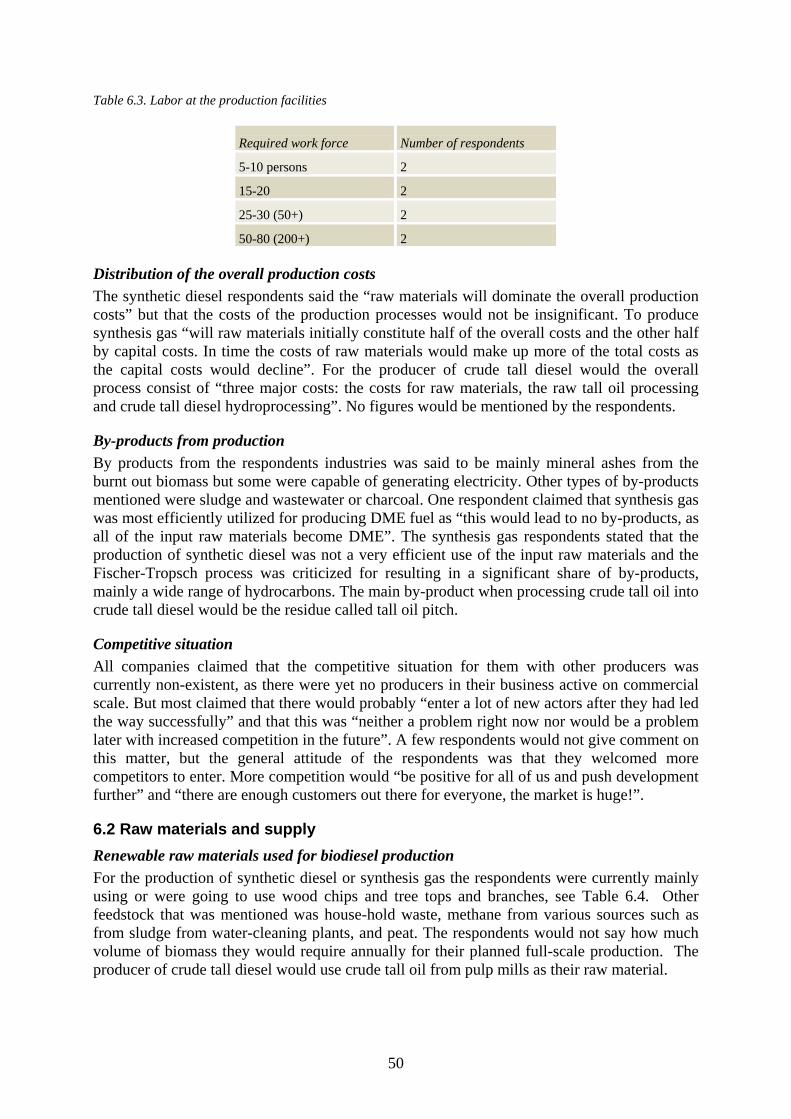
Table 6.3. Labor at the production facilities
Required work force Number of respondents
5-10 persons 2
15-20 2
25-30 (50+) 2
50-80 (200+) 2
Distribution of the overall production costs The synthetic diesel respondents said the “raw materials will dominate the overall production costs” but that the costs of the production processes would not be insignificant. To produce synthesis gas “will raw materials initially constitute half of the overall costs and the other half by capital costs. In time the costs of raw materials would make up more of the total costs as the capital costs would decline”. For the producer of crude tall diesel would the overall process consist of “three major costs: the costs for raw materials, the raw tall oil processing and crude tall diesel hydroprocessing”. No figures would be mentioned by the respondents.
By-products from production By products from the respondents industries was said to be mainly mineral ashes from the burnt out biomass but some were capable of generating electricity. Other types of by-products mentioned were sludge and wastewater or charcoal. One respondent claimed that synthesis gas was most efficiently utilized for producing DME fuel as “this would lead to no by-products, as all of the input raw materials become DME”. The synthesis gas respondents stated that the production of synthetic diesel was not a very efficient use of the input raw materials and the Fischer-Tropsch process was criticized for resulting in a significant share of by-products, mainly a wide range of hydrocarbons. The main by-product when processing crude tall oil into crude tall diesel would be the residue called tall oil pitch.
Competitive situation All companies claimed that the competitive situation for them with other producers was currently non-existent, as there were yet no producers in their business active on commercial scale. But most claimed that there would probably “enter a lot of new actors after they had led the way successfully” and that this was “neither a problem right now nor would be a problem later with increased competition in the future”. A few respondents would not give comment on this matter, but the general attitude of the respondents was that they welcomed more competitors to enter. More competition would “be positive for all of us and push development further” and “there are enough customers out there for everyone, the market is huge!”.
6.2 Raw materials and supply Renewable raw materials used for biodiesel production For the production of synthetic diesel or synthesis gas the respondents were currently mainly using or were going to use wood chips and tree tops and branches, see Table 6.4. Other feedstock that was mentioned was house-hold waste, methane from various sources such as from sludge from water-cleaning plants, and peat. The respondents would not say how much volume of biomass they would require annually for their planned full-scale production. The producer of crude tall diesel would use crude tall oil from pulp mills as their raw material.
50
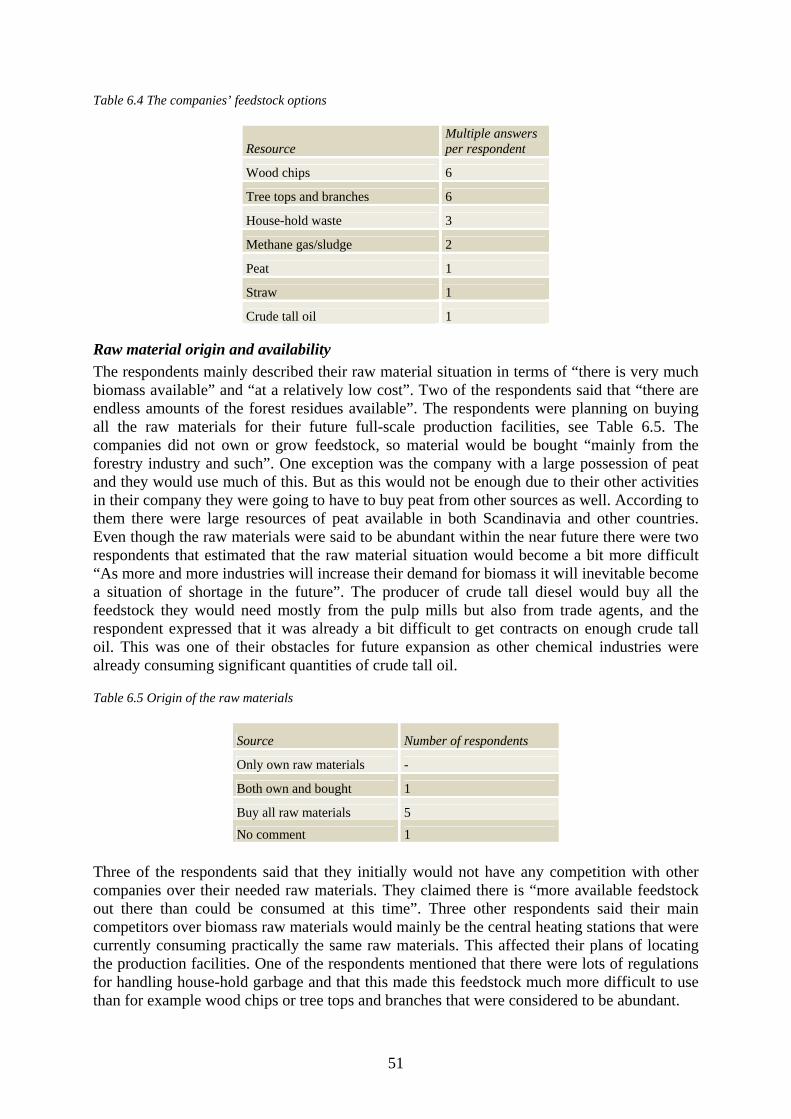
Table 6.4 The companies’ feedstock options
Resource Multiple answers per respondent
Wood chips 6
Tree tops and branches 6
House-hold waste 3
Methane gas/sludge 2
Peat 1
Straw 1
Crude tall oil 1
Raw material origin and availability The respondents mainly described their raw material situation in terms of “there is very much biomass available” and “at a relatively low cost”. Two of the respondents said that “there are endless amounts of the forest residues available”. The respondents were planning on buying all the raw materials for their future full-scale production facilities, see Table 6.5. The companies did not own or grow feedstock, so material would be bought “mainly from the forestry industry and such”. One exception was the company with a large possession of peat and they would use much of this. But as this would not be enough due to their other activities in their company they were going to have to buy peat from other sources as well. According to them there were large resources of peat available in both Scandinavia and other countries. Even though the raw materials were said to be abundant within the near future there were two respondents that estimated that the raw material situation would become a bit more difficult “As more and more industries will increase their demand for biomass it will inevitable become a situation of shortage in the future”. The producer of crude tall diesel would buy all the feedstock they would need mostly from the pulp mills but also from trade agents, and the respondent expressed that it was already a bit difficult to get contracts on enough crude tall oil. This was one of their obstacles for future expansion as other chemical industries were already consuming significant quantities of crude tall oil.
Table 6.5 Origin of the raw materials
Source Number of respondents
Only own raw materials -
Both own and bought 1
Buy all raw materials 5
No comment 1 Three of the respondents said that they initially would not have any competition with other companies over their needed raw materials. They claimed there is “more available feedstock out there than could be consumed at this time”. Three other respondents said their main competitors over biomass raw materials would mainly be the central heating stations that were currently consuming practically the same raw materials. This affected their plans of locating the production facilities. One of the respondents mentioned that there were lots of regulations for handling house-hold garbage and that this made this feedstock much more difficult to use than for example wood chips or tree tops and branches that were considered to be abundant.
51
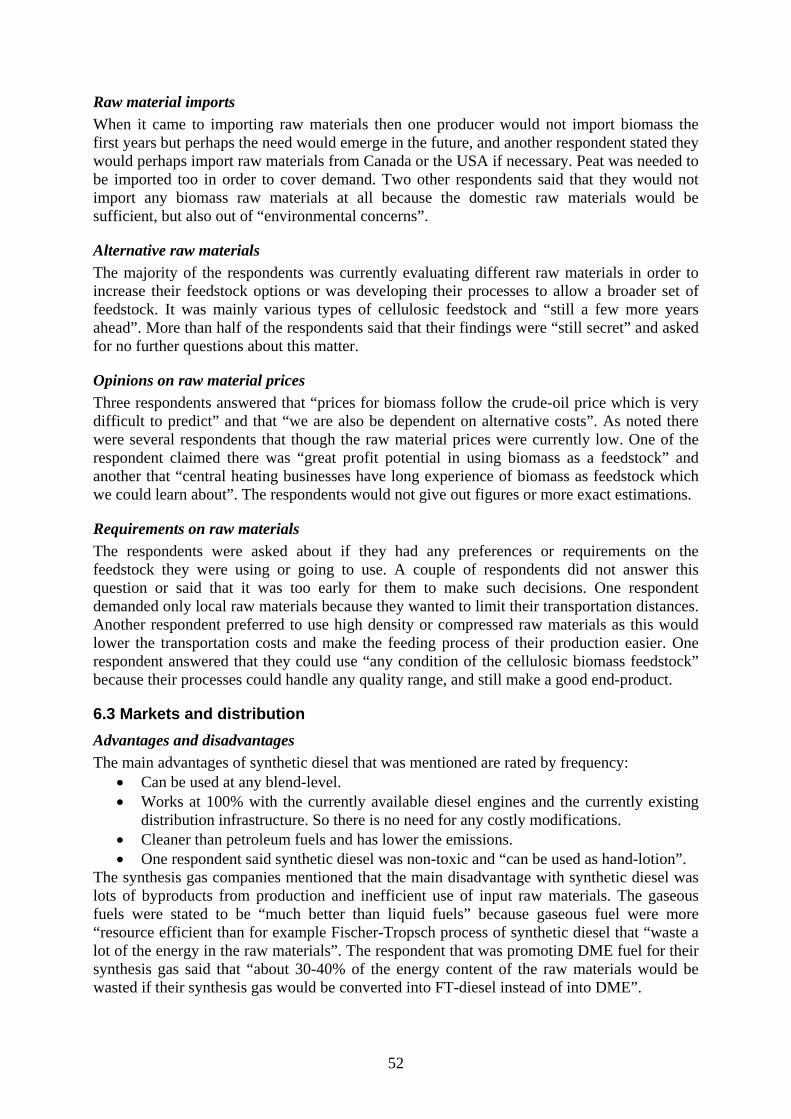
Raw material imports When it came to importing raw materials then one producer would not import biomass the first years but perhaps the need would emerge in the future, and another respondent stated they would perhaps import raw materials from Canada or the USA if necessary. Peat was needed to be imported too in order to cover demand. Two other respondents said that they would not import any biomass raw materials at all because the domestic raw materials would be sufficient, but also out of “environmental concerns”.
Alternative raw materials The majority of the respondents was currently evaluating different raw materials in order to increase their feedstock options or was developing their processes to allow a broader set of feedstock. It was mainly various types of cellulosic feedstock and “still a few more years ahead”. More than half of the respondents said that their findings were “still secret” and asked for no further questions about this matter.
Opinions on raw material prices Three respondents answered that “prices for biomass follow the crude-oil price which is very difficult to predict” and that “we are also be dependent on alternative costs”. As noted there were several respondents that though the raw material prices were currently low. One of the respondent claimed there was “great profit potential in using biomass as a feedstock” and another that “central heating businesses have long experience of biomass as feedstock which we could learn about”. The respondents would not give out figures or more exact estimations.
Requirements on raw materials The respondents were asked about if they had any preferences or requirements on the feedstock they were using or going to use. A couple of respondents did not answer this question or said that it was too early for them to make such decisions. One respondent demanded only local raw materials because they wanted to limit their transportation distances. Another respondent preferred to use high density or compressed raw materials as this would lower the transportation costs and make the feeding process of their production easier. One respondent answered that they could use “any condition of the cellulosic biomass feedstock” because their processes could handle any quality range, and still make a good end-product.
6.3 Markets and distribution Advantages and disadvantages The main advantages of synthetic diesel that was mentioned are rated by frequency:
• Can be used at any blend-level. • Works at 100% with the currently available diesel engines and the currently existing
distribution infrastructure. So there is no need for any costly modifications. • Cleaner than petroleum fuels and has lower the emissions. • One respondent said synthetic diesel was non-toxic and “can be used as hand-lotion”.
The synthesis gas companies mentioned that the main disadvantage with synthetic diesel was lots of byproducts from production and inefficient use of input raw materials. The gaseous fuels were stated to be “much better than liquid fuels” because gaseous fuel were more “resource efficient than for example Fischer-Tropsch process of synthetic diesel that “waste a lot of the energy in the raw materials”. The respondent that was promoting DME fuel for their synthesis gas said that “about 30-40% of the energy content of the raw materials would be wasted if their synthesis gas would be converted into FT-diesel instead of into DME”.
52
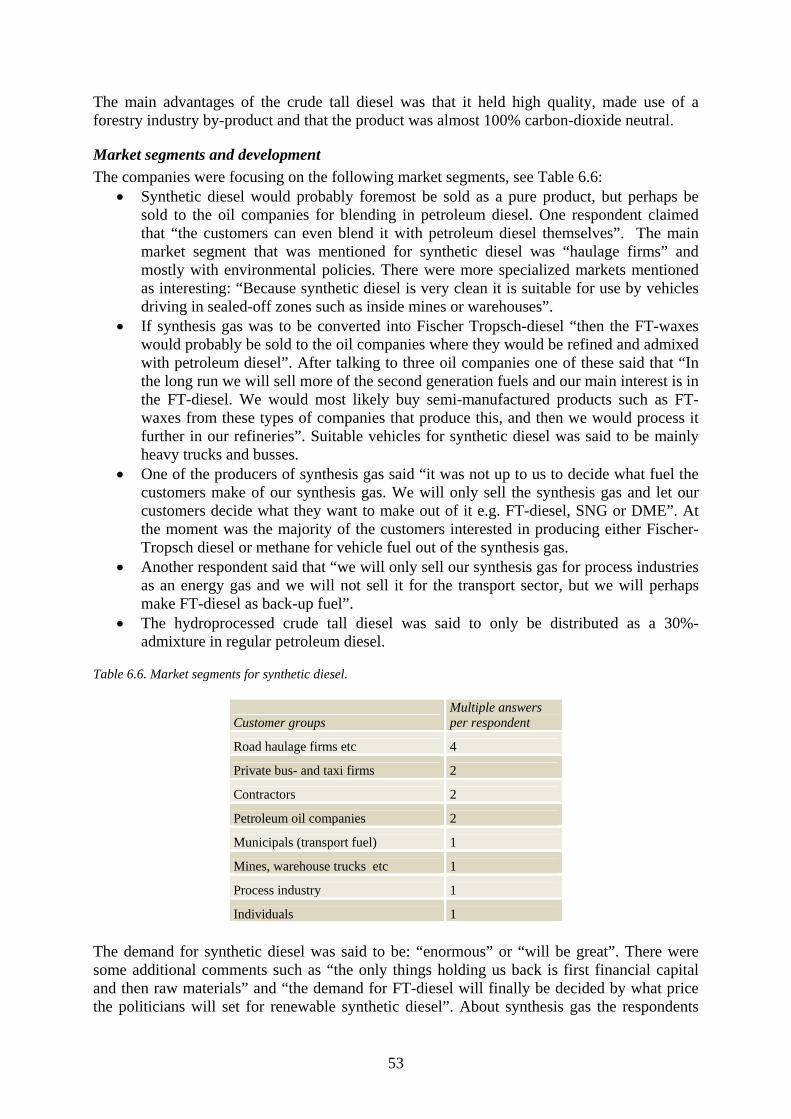
The main advantages of the crude tall diesel was that it held high quality, made use of a forestry industry by-product and that the product was almost 100% carbon-dioxide neutral.
Market segments and development The companies were focusing on the following market segments, see Table 6.6:
• Synthetic diesel would probably foremost be sold as a pure product, but perhaps be sold to the oil companies for blending in petroleum diesel. One respondent claimed that “the customers can even blend it with petroleum diesel themselves”. The main market segment that was mentioned for synthetic diesel was “haulage firms” and mostly with environmental policies. There were more specialized markets mentioned as interesting: “Because synthetic diesel is very clean it is suitable for use by vehicles driving in sealed-off zones such as inside mines or warehouses”.
• If synthesis gas was to be converted into Fischer Tropsch-diesel “then the FT-waxes would probably be sold to the oil companies where they would be refined and admixed with petroleum diesel”. After talking to three oil companies one of these said that “In the long run we will sell more of the second generation fuels and our main interest is in the FT-diesel. We would most likely buy semi-manufactured products such as FT-waxes from these types of companies that produce this, and then we would process it further in our refineries”. Suitable vehicles for synthetic diesel was said to be mainly heavy trucks and busses.
• One of the producers of synthesis gas said “it was not up to us to decide what fuel the customers make of our synthesis gas. We will only sell the synthesis gas and let our customers decide what they want to make out of it e.g. FT-diesel, SNG or DME”. At the moment was the majority of the customers interested in producing either Fischer-Tropsch diesel or methane for vehicle fuel out of the synthesis gas.
• Another respondent said that “we will only sell our synthesis gas for process industries as an energy gas and we will not sell it for the transport sector, but we will perhaps make FT-diesel as back-up fuel”.
• The hydroprocessed crude tall diesel was said to only be distributed as a 30%-admixture in regular petroleum diesel.
Table 6.6. Market segments for synthetic diesel.
Customer groups Multiple answers per respondent
Road haulage firms etc 4
Private bus- and taxi firms 2
Contractors 2
Petroleum oil companies 2
Municipals (transport fuel) 1
Mines, warehouse trucks etc 1
Process industry 1
Individuals 1 The demand for synthetic diesel was said to be: “enormous” or “will be great”. There were some additional comments such as “the only things holding us back is first financial capital and then raw materials” and “the demand for FT-diesel will finally be decided by what price the politicians will set for renewable synthetic diesel”. About synthesis gas the respondents
53
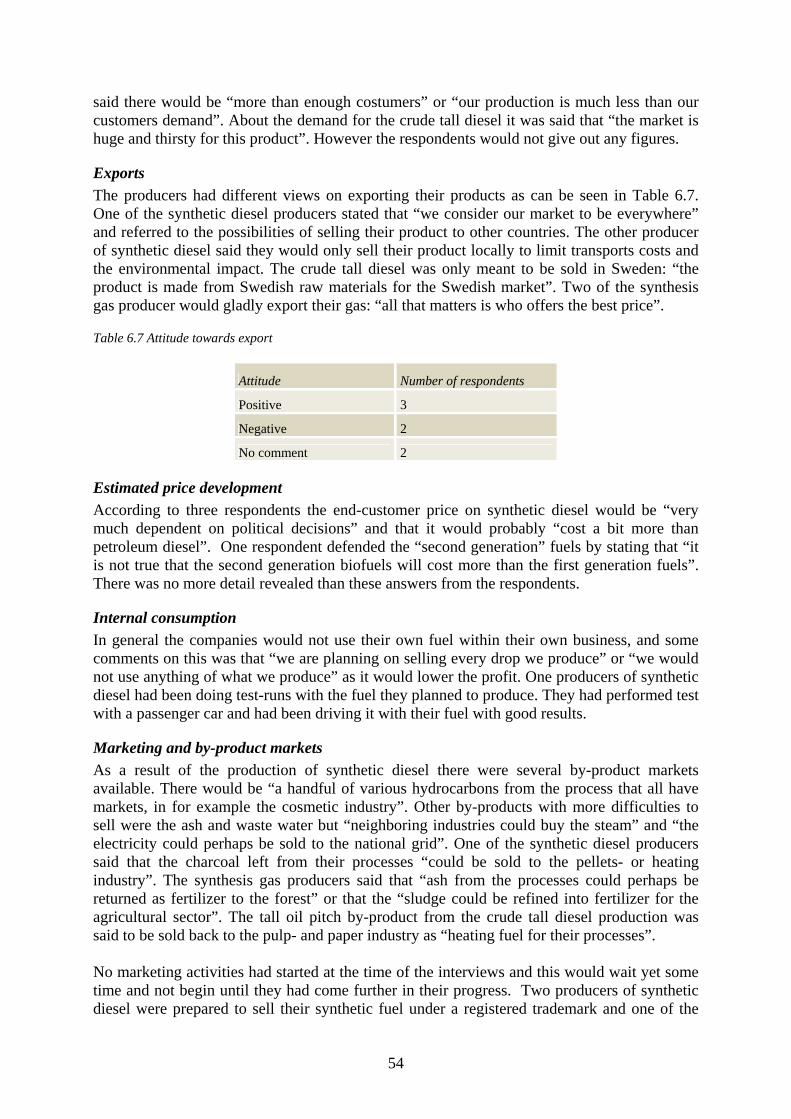
said there would be “more than enough costumers” or “our production is much less than our customers demand”. About the demand for the crude tall diesel it was said that “the market is huge and thirsty for this product”. However the respondents would not give out any figures.
Exports The producers had different views on exporting their products as can be seen in Table 6.7. One of the synthetic diesel producers stated that “we consider our market to be everywhere” and referred to the possibilities of selling their product to other countries. The other producer of synthetic diesel said they would only sell their product locally to limit transports costs and the environmental impact. The crude tall diesel was only meant to be sold in Sweden: “the product is made from Swedish raw materials for the Swedish market”. Two of the synthesis gas producer would gladly export their gas: “all that matters is who offers the best price”.
Table 6.7 Attitude towards export
Attitude Number of respondents
Positive 3
Negative 2
No comment 2
Estimated price development According to three respondents the end-customer price on synthetic diesel would be “very much dependent on political decisions” and that it would probably “cost a bit more than petroleum diesel”. One respondent defended the “second generation” fuels by stating that “it is not true that the second generation biofuels will cost more than the first generation fuels”. There was no more detail revealed than these answers from the respondents.
Internal consumption In general the companies would not use their own fuel within their own business, and some comments on this was that “we are planning on selling every drop we produce” or “we would not use anything of what we produce” as it would lower the profit. One producers of synthetic diesel had been doing test-runs with the fuel they planned to produce. They had performed test with a passenger car and had been driving it with their fuel with good results.
Marketing and by-product markets As a result of the production of synthetic diesel there were several by-product markets available. There would be “a handful of various hydrocarbons from the process that all have markets, in for example the cosmetic industry”. Other by-products with more difficulties to sell were the ash and waste water but “neighboring industries could buy the steam” and “the electricity could perhaps be sold to the national grid”. One of the synthetic diesel producers said that the charcoal left from their processes “could be sold to the pellets- or heating industry”. The synthesis gas producers said that “ash from the processes could perhaps be returned as fertilizer to the forest” or that the “sludge could be refined into fertilizer for the agricultural sector”. The tall oil pitch by-product from the crude tall diesel production was said to be sold back to the pulp- and paper industry as “heating fuel for their processes”. No marketing activities had started at the time of the interviews and this would wait yet some time and not begin until they had come further in their progress. Two producers of synthetic diesel were prepared to sell their synthetic fuel under a registered trademark and one of the
54
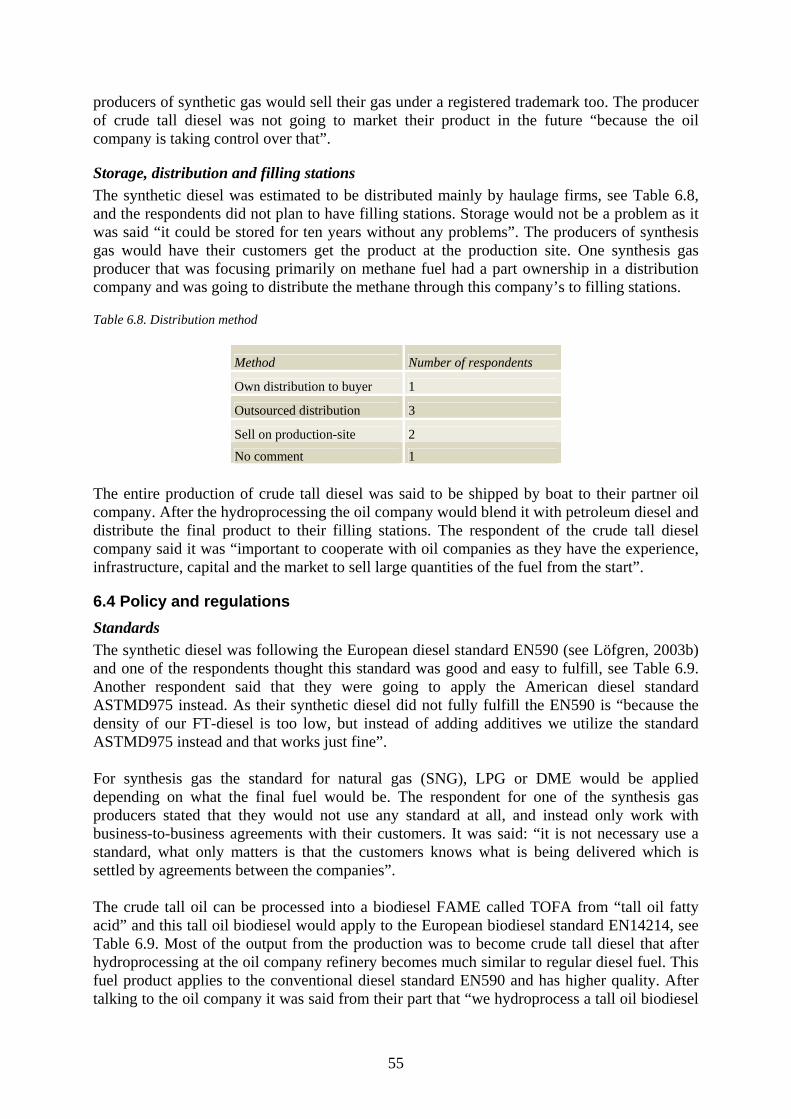
producers of synthetic gas would sell their gas under a registered trademark too. The producer of crude tall diesel was not going to market their product in the future “because the oil company is taking control over that”.
Storage, distribution and filling stations The synthetic diesel was estimated to be distributed mainly by haulage firms, see Table 6.8, and the respondents did not plan to have filling stations. Storage would not be a problem as it was said “it could be stored for ten years without any problems”. The producers of synthesis gas would have their customers get the product at the production site. One synthesis gas producer that was focusing primarily on methane fuel had a part ownership in a distribution company and was going to distribute the methane through this company’s to filling stations.
Table 6.8. Distribution method
Method Number of respondents
Own distribution to buyer 1
Outsourced distribution 3
Sell on production-site 2
No comment 1 The entire production of crude tall diesel was said to be shipped by boat to their partner oil company. After the hydroprocessing the oil company would blend it with petroleum diesel and distribute the final product to their filling stations. The respondent of the crude tall diesel company said it was “important to cooperate with oil companies as they have the experience, infrastructure, capital and the market to sell large quantities of the fuel from the start”.
6.4 Policy and regulations Standards The synthetic diesel was following the European diesel standard EN590 (see Löfgren, 2003b) and one of the respondents thought this standard was good and easy to fulfill, see Table 6.9. Another respondent said that they were going to apply the American diesel standard ASTMD975 instead. As their synthetic diesel did not fully fulfill the EN590 is “because the density of our FT-diesel is too low, but instead of adding additives we utilize the standard ASTMD975 instead and that works just fine”. For synthesis gas the standard for natural gas (SNG), LPG or DME would be applied depending on what the final fuel would be. The respondent for one of the synthesis gas producers stated that they would not use any standard at all, and instead only work with business-to-business agreements with their customers. It was said: “it is not necessary use a standard, what only matters is that the customers knows what is being delivered which is settled by agreements between the companies”. The crude tall oil can be processed into a biodiesel FAME called TOFA from “tall oil fatty acid” and this tall oil biodiesel would apply to the European biodiesel standard EN14214, see Table 6.9. Most of the output from the production was to become crude tall diesel that after hydroprocessing at the oil company refinery becomes much similar to regular diesel fuel. This fuel product applies to the conventional diesel standard EN590 and has higher quality. After talking to the oil company it was said from their part that “we hydroprocess a tall oil biodiesel
55
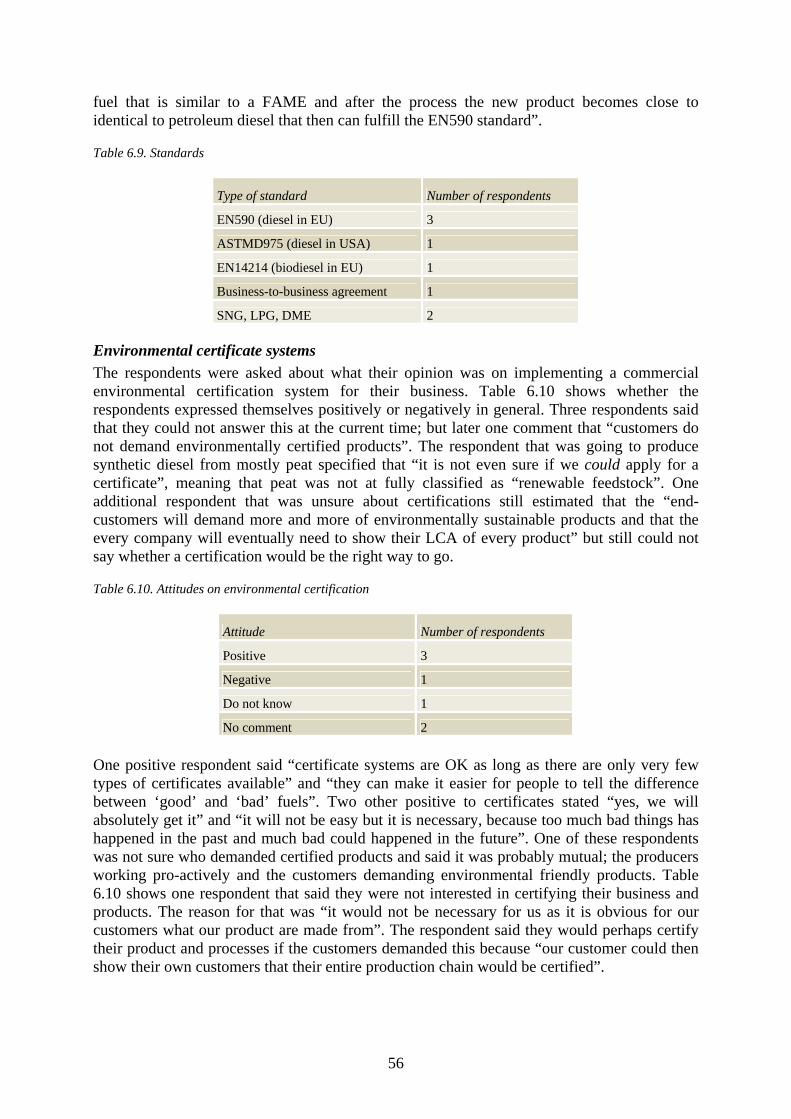
fuel that is similar to a FAME and after the process the new product becomes close to identical to petroleum diesel that then can fulfill the EN590 standard”.
Table 6.9. Standards
Type of standard Number of respondents
EN590 (diesel in EU) 3
ASTMD975 (diesel in USA) 1
EN14214 (biodiesel in EU) 1
Business-to-business agreement 1
SNG, LPG, DME 2
Environmental certificate systems The respondents were asked about what their opinion was on implementing a commercial environmental certification system for their business. Table 6.10 shows whether the respondents expressed themselves positively or negatively in general. Three respondents said that they could not answer this at the current time; but later one comment that “customers do not demand environmentally certified products”. The respondent that was going to produce synthetic diesel from mostly peat specified that “it is not even sure if we could apply for a certificate”, meaning that peat was not at fully classified as “renewable feedstock”. One additional respondent that was unsure about certifications still estimated that the “end-customers will demand more and more of environmentally sustainable products and that the every company will eventually need to show their LCA of every product” but still could not say whether a certification would be the right way to go.
Table 6.10. Attitudes on environmental certification
Attitude Number of respondents
Positive 3
Negative 1
Do not know 1
No comment 2 One positive respondent said “certificate systems are OK as long as there are only very few types of certificates available” and “they can make it easier for people to tell the difference between ‘good’ and ‘bad’ fuels”. Two other positive to certificates stated “yes, we will absolutely get it” and “it will not be easy but it is necessary, because too much bad things has happened in the past and much bad could happened in the future”. One of these respondents was not sure who demanded certified products and said it was probably mutual; the producers working pro-actively and the customers demanding environmental friendly products. Table 6.10 shows one respondent that said they were not interested in certifying their business and products. The reason for that was “it would not be necessary for us as it is obvious for our customers what our product are made from”. The respondent said they would perhaps certify their product and processes if the customers demanded this because “our customer could then show their own customers that their entire production chain would be certified”.
56
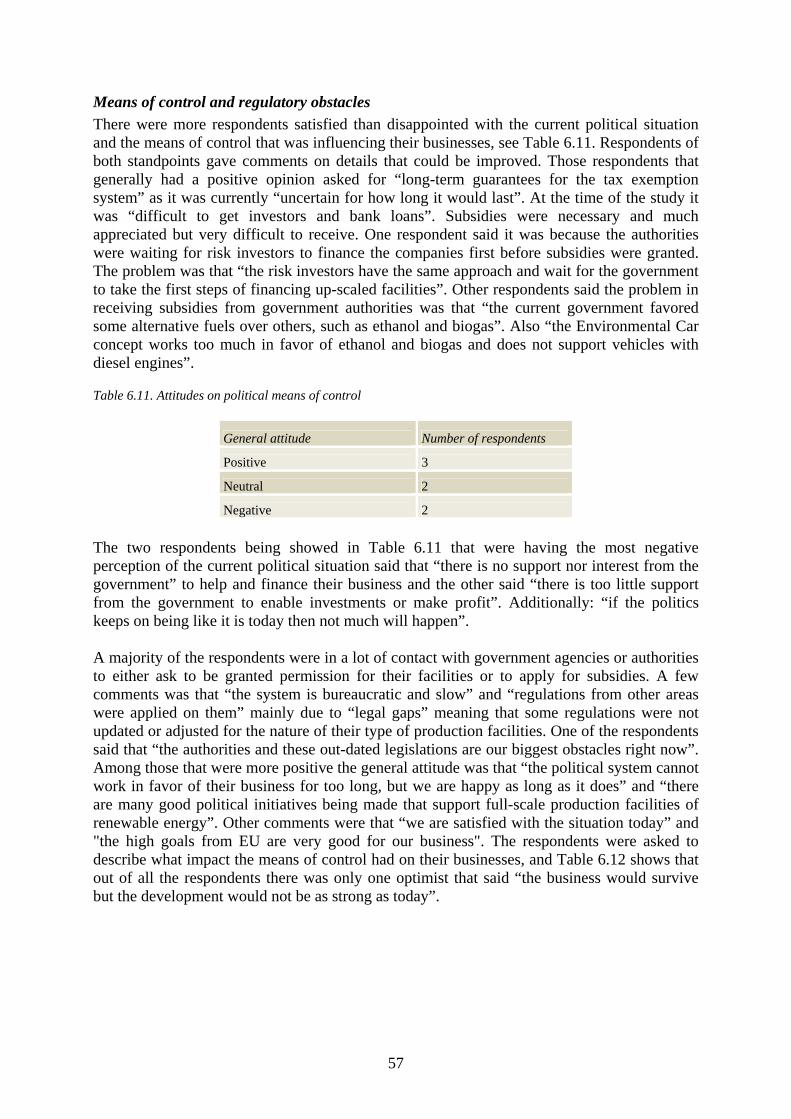
Means of control and regulatory obstacles There were more respondents satisfied than disappointed with the current political situation and the means of control that was influencing their businesses, see Table 6.11. Respondents of both standpoints gave comments on details that could be improved. Those respondents that generally had a positive opinion asked for “long-term guarantees for the tax exemption system” as it was currently “uncertain for how long it would last”. At the time of the study it was “difficult to get investors and bank loans”. Subsidies were necessary and much appreciated but very difficult to receive. One respondent said it was because the authorities were waiting for risk investors to finance the companies first before subsidies were granted. The problem was that “the risk investors have the same approach and wait for the government to take the first steps of financing up-scaled facilities”. Other respondents said the problem in receiving subsidies from government authorities was that “the current government favored some alternative fuels over others, such as ethanol and biogas”. Also “the Environmental Car concept works too much in favor of ethanol and biogas and does not support vehicles with diesel engines”.
Table 6.11. Attitudes on political means of control
General attitude Number of respondents
Positive 3
Neutral 2
Negative 2 The two respondents being showed in Table 6.11 that were having the most negative perception of the current political situation said that “there is no support nor interest from the government” to help and finance their business and the other said “there is too little support from the government to enable investments or make profit”. Additionally: “if the politics keeps on being like it is today then not much will happen”. A majority of the respondents were in a lot of contact with government agencies or authorities to either ask to be granted permission for their facilities or to apply for subsidies. A few comments was that “the system is bureaucratic and slow” and “regulations from other areas were applied on them” mainly due to “legal gaps” meaning that some regulations were not updated or adjusted for the nature of their type of production facilities. One of the respondents said that “the authorities and these out-dated legislations are our biggest obstacles right now”. Among those that were more positive the general attitude was that “the political system cannot work in favor of their business for too long, but we are happy as long as it does” and “there are many good political initiatives being made that support full-scale production facilities of renewable energy”. Other comments were that “we are satisfied with the situation today” and "the high goals from EU are very good for our business". The respondents were asked to describe what impact the means of control had on their businesses, and Table 6.12 shows that out of all the respondents there was only one optimist that said “the business would survive but the development would not be as strong as today”.
57
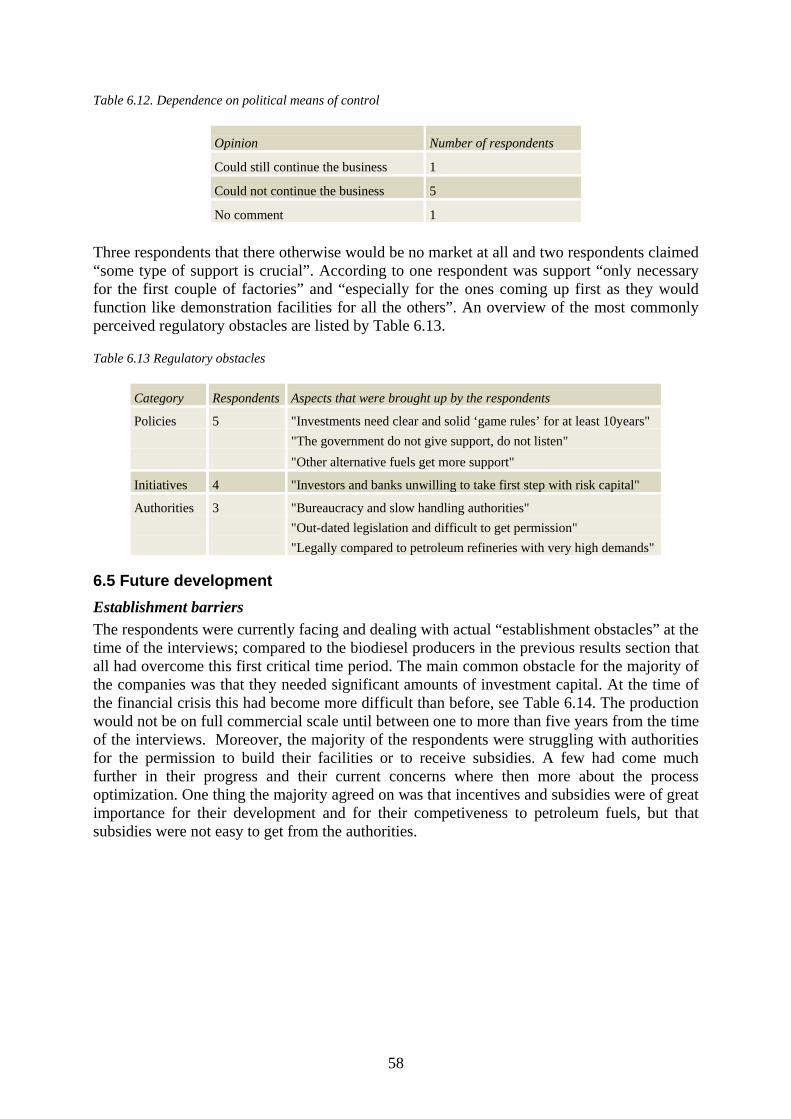
Table 6.12. Dependence on political means of control
Opinion Number of respondents
Could still continue the business 1
Could not continue the business 5
No comment 1 Three respondents that there otherwise would be no market at all and two respondents claimed “some type of support is crucial”. According to one respondent was support “only necessary for the first couple of factories” and “especially for the ones coming up first as they would function like demonstration facilities for all the others”. An overview of the most commonly perceived regulatory obstacles are listed by Table 6.13.
Table 6.13 Regulatory obstacles
Category Respondents Aspects that were brought up by the respondents
Policies 5 "Investments need clear and solid ‘game rules’ for at least 10years" "The government do not give support, do not listen" "Other alternative fuels get more support"
Initiatives 4 "Investors and banks unwilling to take first step with risk capital"
Authorities 3 "Bureaucracy and slow handling authorities" "Out-dated legislation and difficult to get permission" "Legally compared to petroleum refineries with very high demands"
6.5 Future development Establishment barriers The respondents were currently facing and dealing with actual “establishment obstacles” at the time of the interviews; compared to the biodiesel producers in the previous results section that all had overcome this first critical time period. The main common obstacle for the majority of the companies was that they needed significant amounts of investment capital. At the time of the financial crisis this had become more difficult than before, see Table 6.14. The production would not be on full commercial scale until between one to more than five years from the time of the interviews. Moreover, the majority of the respondents were struggling with authorities for the permission to build their facilities or to receive subsidies. A few had come much further in their progress and their current concerns where then more about the process optimization. One thing the majority agreed on was that incentives and subsidies were of great importance for their development and for their competiveness to petroleum fuels, but that subsidies were not easy to get from the authorities.
58
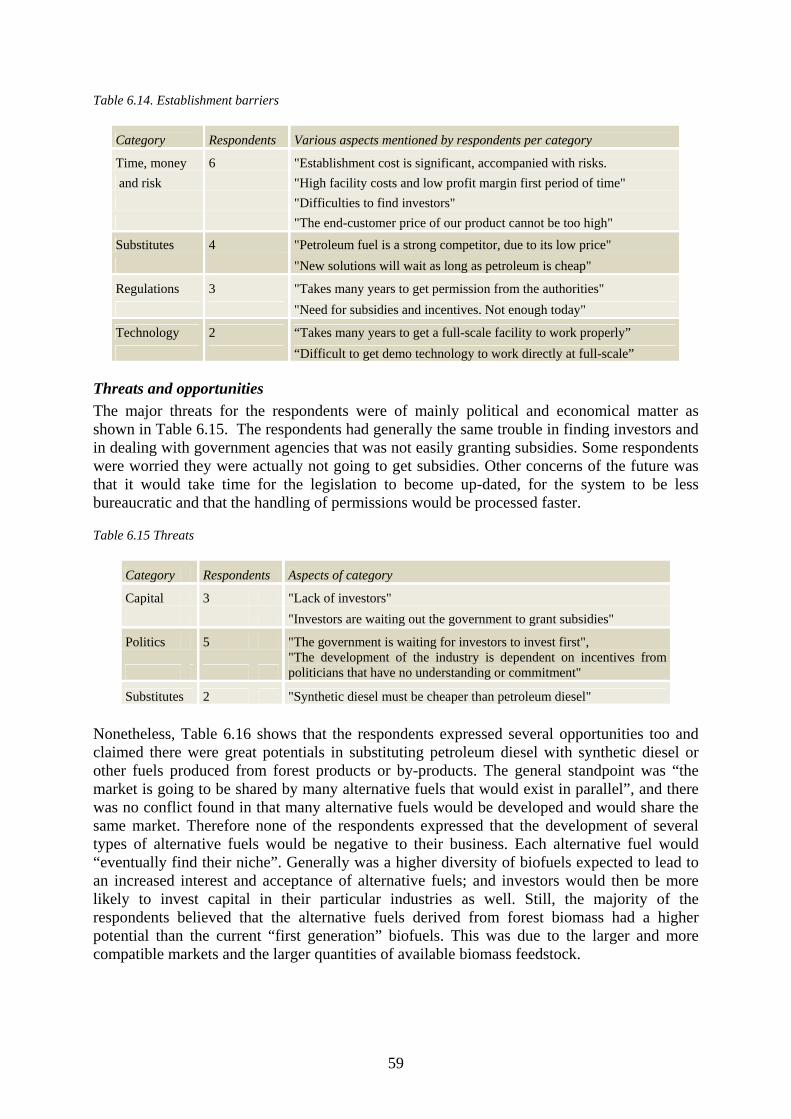
Table 6.14. Establishment barriers
Category Respondents Various aspects mentioned by respondents per category
Time, money 6 "Establishment cost is significant, accompanied with risks. and risk "High facility costs and low profit margin first period of time" "Difficulties to find investors" "The end-customer price of our product cannot be too high"
Substitutes 4 "Petroleum fuel is a strong competitor, due to its low price" "New solutions will wait as long as petroleum is cheap"
Regulations 3 "Takes many years to get permission from the authorities" "Need for subsidies and incentives. Not enough today"
Technology 2 “Takes many years to get a full-scale facility to work properly” “Difficult to get demo technology to work directly at full-scale”
Threats and opportunities The major threats for the respondents were of mainly political and economical matter as shown in Table 6.15. The respondents had generally the same trouble in finding investors and in dealing with government agencies that was not easily granting subsidies. Some respondents were worried they were actually not going to get subsidies. Other concerns of the future was that it would take time for the legislation to become up-dated, for the system to be less bureaucratic and that the handling of permissions would be processed faster.
Table 6.15 Threats
Category Respondents Aspects of category
Capital 3 "Lack of investors" "Investors are waiting out the government to grant subsidies"
Politics 5 "The government is waiting for investors to invest first",
"The development of the industry is dependent on incentives from politicians that have no understanding or commitment"
Substitutes 2 "Synthetic diesel must be cheaper than petroleum diesel" Nonetheless, Table 6.16 shows that the respondents expressed several opportunities too and claimed there were great potentials in substituting petroleum diesel with synthetic diesel or other fuels produced from forest products or by-products. The general standpoint was “the market is going to be shared by many alternative fuels that would exist in parallel”, and there was no conflict found in that many alternative fuels would be developed and would share the same market. Therefore none of the respondents expressed that the development of several types of alternative fuels would be negative to their business. Each alternative fuel would “eventually find their niche”. Generally was a higher diversity of biofuels expected to lead to an increased interest and acceptance of alternative fuels; and investors would then be more likely to invest capital in their particular industries as well. Still, the majority of the respondents believed that the alternative fuels derived from forest biomass had a higher potential than the current “first generation” biofuels. This was due to the larger and more compatible markets and the larger quantities of available biomass feedstock.
59
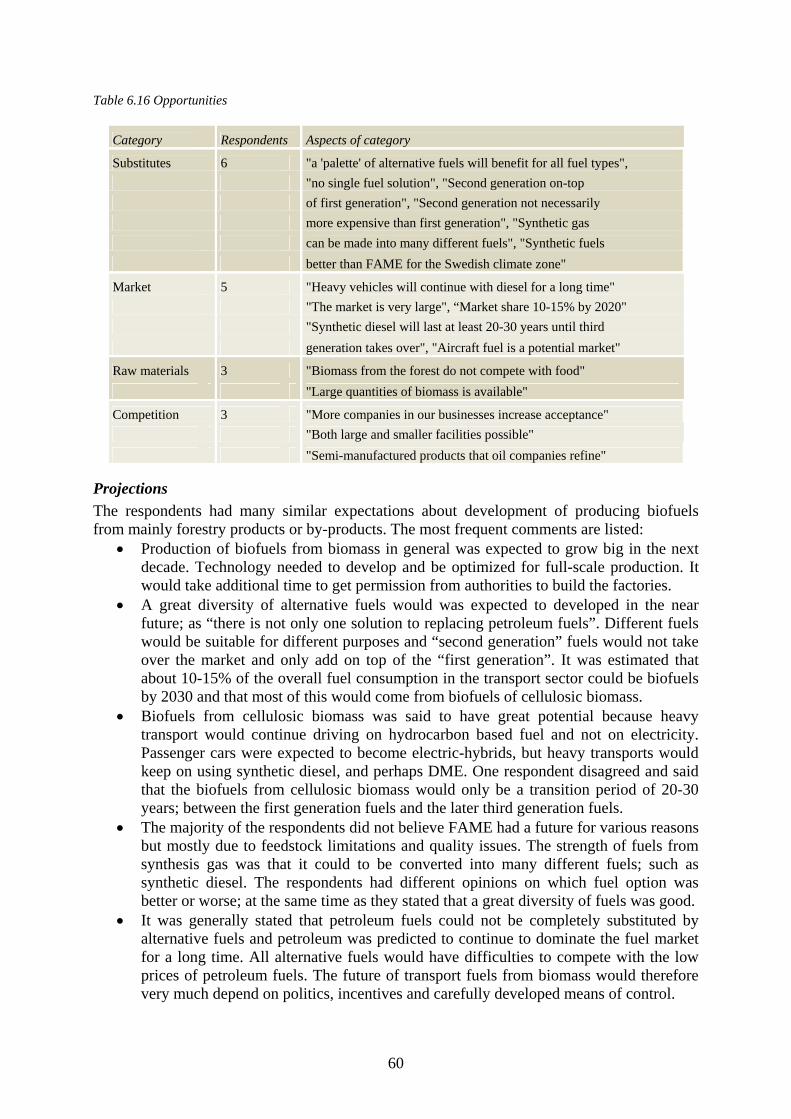
Table 6.16 Opportunities
Category Respondents Aspects of category
Substitutes 6 "a 'palette' of alternative fuels will benefit for all fuel types", "no single fuel solution", "Second generation on-top of first generation", "Second generation not necessarily more expensive than first generation", "Synthetic gas can be made into many different fuels", "Synthetic fuels better than FAME for the Swedish climate zone"
Market 5 "Heavy vehicles will continue with diesel for a long time" "The market is very large", “Market share 10-15% by 2020" "Synthetic diesel will last at least 20-30 years until third generation takes over", "Aircraft fuel is a potential market"
Raw materials 3 "Biomass from the forest do not compete with food" "Large quantities of biomass is available"
Competition 3 "More companies in our businesses increase acceptance" "Both large and smaller facilities possible" "Semi-manufactured products that oil companies refine"
Projections The respondents had many similar expectations about development of producing biofuels from mainly forestry products or by-products. The most frequent comments are listed:
• Production of biofuels from biomass in general was expected to grow big in the next decade. Technology needed to develop and be optimized for full-scale production. It would take additional time to get permission from authorities to build the factories.
• A great diversity of alternative fuels would was expected to developed in the near future; as “there is not only one solution to replacing petroleum fuels”. Different fuels would be suitable for different purposes and “second generation” fuels would not take over the market and only add on top of the “first generation”. It was estimated that about 10-15% of the overall fuel consumption in the transport sector could be biofuels by 2030 and that most of this would come from biofuels of cellulosic biomass.
• Biofuels from cellulosic biomass was said to have great potential because heavy transport would continue driving on hydrocarbon based fuel and not on electricity. Passenger cars were expected to become electric-hybrids, but heavy transports would keep on using synthetic diesel, and perhaps DME. One respondent disagreed and said that the biofuels from cellulosic biomass would only be a transition period of 20-30 years; between the first generation fuels and the later third generation fuels.
• The majority of the respondents did not believe FAME had a future for various reasons but mostly due to feedstock limitations and quality issues. The strength of fuels from synthesis gas was that it could to be converted into many different fuels; such as synthetic diesel. The respondents had different opinions on which fuel option was better or worse; at the same time as they stated that a great diversity of fuels was good.
• It was generally stated that petroleum fuels could not be completely substituted by alternative fuels and petroleum was predicted to continue to dominate the fuel market for a long time. All alternative fuels would have difficulties to compete with the low prices of petroleum fuels. The future of transport fuels from biomass would therefore very much depend on politics, incentives and carefully developed means of control.
60
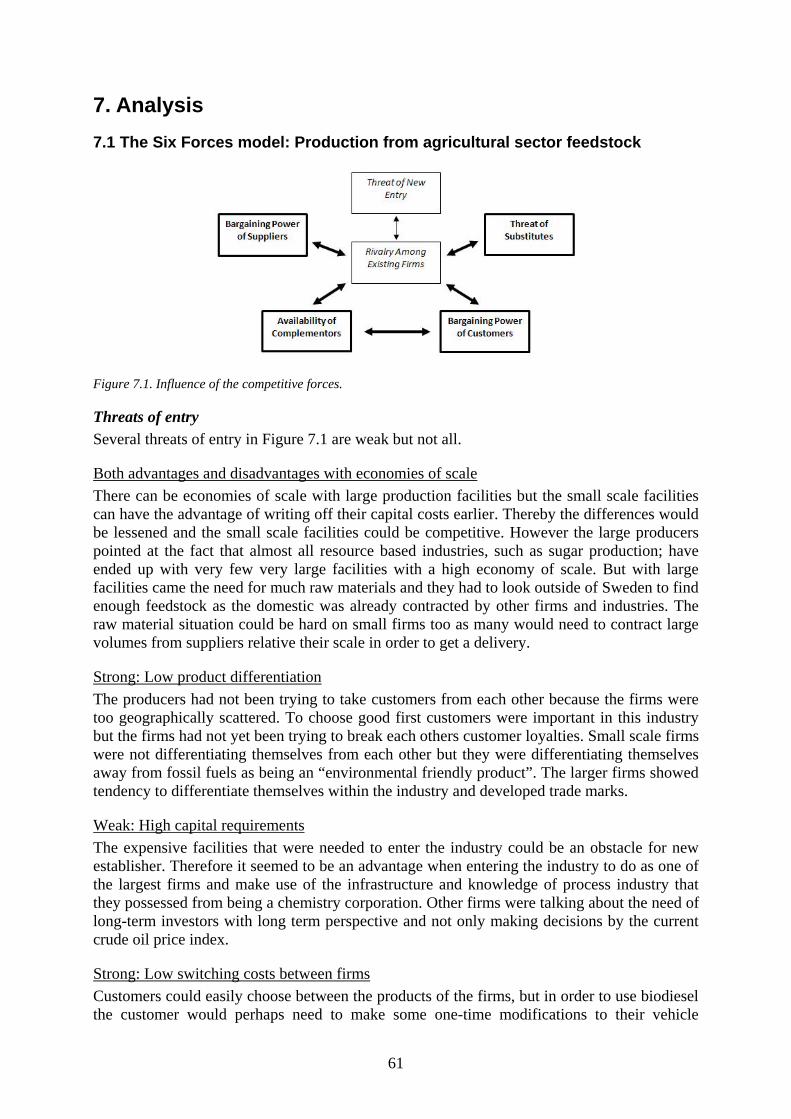
7. Analysis 7.1 The Six Forces model: Production from agricultural sector feedstock
Figure 7.1. Influence of the competitive forces.
Threats of entry Several threats of entry in Figure 7.1 are weak but not all.
Both advantages and disadvantages with economies of scale There can be economies of scale with large production facilities but the small scale facilities can have the advantage of writing off their capital costs earlier. Thereby the differences would be lessened and the small scale facilities could be competitive. However the large producers pointed at the fact that almost all resource based industries, such as sugar production; have ended up with very few very large facilities with a high economy of scale. But with large facilities came the need for much raw materials and they had to look outside of Sweden to find enough feedstock as the domestic was already contracted by other firms and industries. The raw material situation could be hard on small firms too as many would need to contract large volumes from suppliers relative their scale in order to get a delivery.
Strong: Low product differentiation The producers had not been trying to take customers from each other because the firms were too geographically scattered. To choose good first customers were important in this industry but the firms had not yet been trying to break each others customer loyalties. Small scale firms were not differentiating themselves from each other but they were differentiating themselves away from fossil fuels as being an “environmental friendly product”. The larger firms showed tendency to differentiate themselves within the industry and developed trade marks.
Weak: High capital requirements The expensive facilities that were needed to enter the industry could be an obstacle for new establisher. Therefore it seemed to be an advantage when entering the industry to do as one of the largest firms and make use of the infrastructure and knowledge of process industry that they possessed from being a chemistry corporation. Other firms were talking about the need of long-term investors with long term perspective and not only making decisions by the current crude oil price index.
Strong: Low switching costs between firms Customers could easily choose between the products of the firms, but in order to use biodiesel the customer would perhaps need to make some one-time modifications to their vehicle
61
engine. It was perhaps needed that the customers had knowledge about biodiesel when choosing to use it. Choosing biodiesel could mean that the customer would have to invest in separate tanks and other equipment which could raise the switching cost for some customers of leave petroleum diesel. When new established firms enter the industry they might find that many of the most attractive customers that were interested in choosing biodiesel was already taken by the existing firms. This could make it harder for the new establishing firms; being left with customers that would not be as easy to convince.
Weak: Important with access to distribution channels The larger firms were selling much of their product to oil companies and thereby their products would get access to large distribution channels. The smaller firms would instead be in control of their own distribution and a few would even choose to perform the actual delivery themselves in order to keep the product from contamination. But the distribution issues were not only for biodiesel but about by-products too. Those flows were not always easy to make work efficient but important in order to both remove large quantities of by-product material and to get additional income. It was therefore very important to have access to a functional distribution network in order to get established in the biodiesel industry.
Weak: Cost disadvantages independent of scale The learning process of producing biodiesel had been continuous over the last couple of years and that would give the existing firms an advantage over new establishers. However, the larger firms had been supported by the oil companies in how to conduct proper quality control and routines. New establishers would perhaps still be able to enter the industry and lower the profit of the existing firms, but it was still said that establishing the first customer base was not easy. The profit level of the industry was normally low and not dependent on the number of biodiesel producers as much as on alternative costs and prices of substituting fuels. Therefore estimations on profit level development would be difficult.
Weak: Government policy One obstacle for establishing firms to overcome was the difficulties of getting permission from the authorities to start a biodiesel production. This could take years and even end up in court as had happened to a few existing firms. Furthermore would all firms in the industry need to follow a fuel standard in order to sell to the transportation sector, and that was much more difficult for the smaller firms than for the larger. This could be another obstacle for new small scale establishers.
Conclusion New entrants could easily enter the industry due to the products low differentiation and low switch cost for buyers, and the reaction from the other producers would be low. However, the threat of entry would be lowered by the capital requirements, need for distribution networks, knowledge about production and fulfilling the standards. New entrants would need to confront the authorities and get permission for their production.
Rivalry among existing firms There was not much rivalry among the producers at whole, see Figure 7.1. The rivalry was stronger between firms of equal sizes as there was no rivalry between firms of different scales.
Weak: Not numerously of equally balanced competitors The firms of the industry were not equally balanced and the larger firms did for most part not share the same markets with smaller firms. Thereby they were not affecting each other very
62
much and there was not much rivalry between them. Moreover was there no rivalry among smaller firms as they were geographically scattered and out of each others range.
Strong: Currently a slow industry growth The market was in overall currently fixed, but for a few firms it was growing and a couple of others declining so much that they were going out of business. No firms had started any attempts in taking customer shares from other firms; but the firms showed great cautiousness during the interviews of not revealing sensitive data that could reach their competitors. The competitive situation could thereby be describes as “tense” between the firms, but not at all aggressive. One reason for the firms’ moderation would perhaps be that it was often claimed that there were limited numbers of large haulage firms which was an attractive customer group. Therefore the firms would not discuss their market strategies in detail.
Strong: High fixed or storage costs Strong: High exit barriers When the oilseed prices increased in 2008 due to many factors there were still no firms that exit the industry and instead they only ran their production at low speed. That give a hint that it would be costly to close down and no firm would do that unless it would be absolutely necessary. This was shown by the large firm that were pausing their production for one year rather than to shut down their facility, as they though this was a better choice if the market prices would then become more favorable in the future. However, the overcapacity is now significant in the country, which could mean that the market is already saturated. More ways to increase profitability was to store glycerol and sell it when market prices were higher rather than continuously sell it and perhaps cause saturation of the glycerol market.
Strong: Lack of differentiation or switching costs Biodiesel is a commodity that is undifferentiated due to its standardization and thereby the customers could very easily change from biodiesel of one firm to another. However, that would not be likely as the customers were often chosen on a regional basis. Competing firms would have to find ways to compensate for the higher costs of longer transport distances if they would attempt to take customers from the other firms.
Conclusion: The rivalry among the existing firms was not very strong and there was not much competition between them. As the existing firms were of different sizes they competed over different customers. However, due to the current slow market growth, high facility costs and over capacity there could become more competition if the market would not start to grow in the following years.
Pressure from substitute products There is one clearly defined substitute to biodiesel and that is the petroleum diesel, however, biodiesel is itself actually the one being the substitute of the two. In Figure 7.1 The petroleum is the strongest competing fuel due to its low price, and it would not be possible to compete with it if was not for the current high taxation on the fossil fuels. The biodiesel was exempted from taxation which further lessened the price difference between the two. There were also biofuels that compete over the market shares, but most of them would require the customers to buy specially developed vehicles for these specific fuels in order to use them, such as ethanol- or biogas vehicles. Thereby was other biofuels not as close substitutes to biodiesel as was petroleum diesel. The market for biodiesel was said to be potentially very large but limited by the customers’ alternative costs of choosing other fuels, and it was often stated that customers
63
would always buy the cheapest fuel available. Biodiesel could then not have higher end-customer price than its substitutes in order to gain market shares. However the advantage of biodiesel was that the heavy transports mostly used diesel fuels, and not other biofuels such as ethanol or biogas. The biodiesel market was temporarily limited as the crude oil prices were relatively low, but the firms were sure that the crude oil prices would increase and make biodiesel more profitable. Finally the firms would emphasis that they were not against other biofuels even though they were competitors; however they were against petroleum diesel.
Conclusion: The petroleum diesel was the main competing substitute and had much influence. Other biofuels were not seen as actual competitors to biodiesel.
Bargaining power of customer The bargaining power of the customers can be considered as fairly strong in Figure 7.1.
Strong: Buyers are mainly concentrated and purchase large volumes relative to seller sales. No backward integration The firms sold foremost to transportation companies because they would consume large and frequent volumes of fuel relative to the selling firm compared with other types of customers. This would generate larger deliveries but unfortunately for the firms were these large transportation companies limited in number and there was a concern that this customer segment would become saturated. Moreover did not all of these companies have environmental policies and was interested in buying renewable fuels which limited the market further. Many were just interested in the price levels; however, there was no sign of any customers that had joined forces to demand for lower biodiesel prices.
Strong: The product mainly makes out a substantial par of the customers overall costs Both buyers that have very high income and that make lower profit For the oil companies was biodiesel only a marginal activity even though they bought large shares relative to the producers. Moreover did the oil companies have much wealth and the biodiesel they bought would not make up much of their overall costs. However, transportation business was said to be price sensitive and only chooses the fuel that was cheapest because of that fuel makes out their main costs. So using biodiesel was for them often connected with additional costs, and every SEK 1 more per liter would lead to hundreds of thousands SEK more in costs per year for customers that regularly consumes large volumes of fuel. Therefore it was important with customers that was aware of environmental values and voluntarily would pay additional for an alternative fuel. Furthermore were there customers that would gladly use biodiesel; not out of environmental reasons but only if it was cheaper than petroleum diesel. This made them strong bargainers. One category of customers that valued the environmental features high were farmers that was said to be very interested in buying biodiesel but could not due to the subvention on petroleum diesel.
Strong: The products of the industry are undifferentiated commodities. The quality of the biodiesel was very important to the customers for engine safety and security of delivery. Here the larger biodiesel firms would have an advantage of having in general a more sophisticated quality control which could perhaps differentiate the customers’ choice of biodiesel supplier. However, as all firms could show that they met the biodiesel standard then all producers would be considered by the customers to be offering the same quality. It is likely that that is why most biodiesel firms offered additional services along with the biodiesel sales.
64
Furthermore it was not only important to find customers for the biodiesel product; by-products were just as important. There was a tendency that the firms were seeking ways to refine or purify their glycerol in order to increase it price level. The low quality glycerol was sold as an undifferentiated product to biogas producers, but a high quality glycerol could be sold differentiated to various chemical industries.
Strong: The buyers have low switch costs Biodiesel was a standardized commodity and therefore could the customers easily choose between the products of the firms, but in order to use biodiesel they would perhaps need to make some one-time modifications to their vehicle engines. This situation would make customers choose the biodiesel that was offered by best price, as the fuel was often sold directly to customers from the producers. However, as biodiesel was not transported very far in order to keep down transport costs would the closest producer mostly be able to offer a lower price. Some transportation companies would not change from petroleum diesel because it was easier for them with only one fuel – that they were used to. This standpoint would give these customers additional bargaining power as the customer would have nothing to loose in not buying biodiesel, unless they needed to buy an alternative fuel. This could make the selling firms be forced to lower the prices to better match substituting fuels or biodiesel from other firms.
Difficulty: Many buyers have disinformation The acceptance of biodiesel among the various customer groups was depending on the information that the customers had about the fuel, and this would affect the degree of effort needed for the firms to sell biodiesel. It was said that some transportation companies and municipalities had disinformation about the fuel and that this would be an important obstacle for the firms to overcome, perhaps with united force.
Conclusion: The buyers have a somewhat strong bargaining power as they are mostly concentrated and buy large volumes and the product makes out large part of the customers overall costs. Furthermore is the product an undifferentiated commodity and the buyer have low switch cost. There are some difficulties with customer skepticism.
Bargaining power of the supplier The suppliers in Figure 7.1 are strong for those producers that buy vegetable oil but less strong for those who buy oil seeds.
The number of suppliers depends on if the producers buy vegetable oil or oil seeds. Suppliers were few as there was mainly one large vegetable oil extractor in the country. This gave this supplier much influence; however, some biodiesel firms were extracting their own rapeseed oil from rapeseed in order to lower their costs. By buying rapeseed they could choose between more suppliers, and these were often changing every year due to crop rotation.
Strong: The supplier do not compete with other substitutes to sell to the firm in the industry A few firms were considering alternative feedstock and that could be interpreted that they perceived the current raw material situation with rapeseed was too limited. But there were few alternatives if any at all, however, changing feedstock could lead to costly changes of the process equipment.
65
Strong: The biodiesel industry is not the suppliers most important customer group Strong: The products the supplier offer are very important to the firms in the industry The biodiesel firms were competing with other industries over the same feedstock, and the biodiesel industry was smaller than the food sector. Therefore was the biodiesel industry not as important to the feedstock suppliers as the suppliers were to the biodiesel producers. Most biodiesel producers had not many other feedstock options than to compete over the limited rapeseed sources available in the country.
The supplier products are not differentiated and are no switching costs to leave them An advantage of using rapeseed oil as feedstock was that it would be of the same quality that is used for food. That resulted in much larger quantities of available feedstock for the biodiesel producers than if they would had to only use a specific type of plant. Therefore there was no interest in developing rapeseed plants with certain properties for biodiesel production; however, it was still important that the rapeseed oil had good quality. Another aspect of the feedstock was that it could only be bought at certain times of the year and often only in large quantities.
Weak: The suppliers pose threat of forward integration There was no sign that the suppliers were uniting in order to raise feedstock prices for the biodiesel firms. The fluctuations of the raw material prices were due to many factors, not the least crude oil prices, and had been affecting all the various industries using the feedstock.
Conclusion: The bargaining power of the suppliers was mainly strong as the suppliers did not compete with substituting material to the producers and the biodiesel industry was mainly not their most important customer group. On the other hand was the material important for the biodiesel producers. The suppliers offer undifferentiated products so there was a low switch cost between them.
Complementors and non-market relationships The complementors and non-market relationships in Figure 7.1 had strong influence on the biodiesel industry.
Strong: High concentration The government with its authorities was a strong complementor to the biodiesel industry as it decided over the conditions through its policies and regulations.
Strong: High concentration The biodiesel standard was important for all biodiesel to be uniform and function in the current diesel engine vehicles. There was no option to not follow the standard when producing biodiesel for the transportation sector.
Strong: High concentration Companies selling environmental certificate systems were seemingly going to have influence on the biodiesel firms. The firms would be able to choose freely to implement a certificate or not, however, perhaps the customers were demanding this more in the future.
66
Strong: High concentration Strong: Higher switch cost for buyer/supplier between complementors than the switch cost across the firms of the industry Strong: Complementors have lower switching cost between firms than firms have switching between complementors One type of complementors with much influence on the biodiesel industry were the manufacturers of cars. Their attitude towards biodiesel had much indirect effect on what markets biodiesel could be sold to. The main car manufacturing companies were fewer than the biodiesel firms but were deciding what vehicles would be allowed to use pure biodiesel and which were not. The complementor was strong because a customer could easily switch between biodiesel from different biodiesel firms, but it would be much more difficult and expensive for the customer to change car. Moreover would it be fairly easier for the car manufacturers to adjust all the vehicle engines to be able to use biodiesel without limitation, than it would be for the biodiesel producers to produce various biodiesels adapted for each car manufactures demands. Together these relations gave the car manufacturers strong influence on the biodiesel market options. If the car manufacturers would allow biodiesel fully then this would open up currently closed markets.
Strong complementor: High concentration Another strong complementor was the Media. It was said by biodiesel firms that the media was focusing very much on ethanol and biogas when reporting about biofuels, and easily falling for the arguments of the lobbying groups of these alternative fuels. The biodiesel producers wanted to increase acceptance and awareness of biodiesel among the public and they were worried about the rumors and somewhat bad reputation that biodiesel had. This was important to solve. In December 2008 was the first lobbying group for biodiesel founded in Sweden, compared to ethanol and biogas that had been active with lobbying for a couple of years.
Conclusion: There were a couple complementors and non-market relationships with strong influence on the biodiesel producers. One is the government and the authorities but there are also standards and environmental certificates that have influence. The other complementors are the car manufacturers that influence what type of vehicles are allowed to use biodiesel. Another source with influence is the media that affect the public opinion about different biofuels.
67
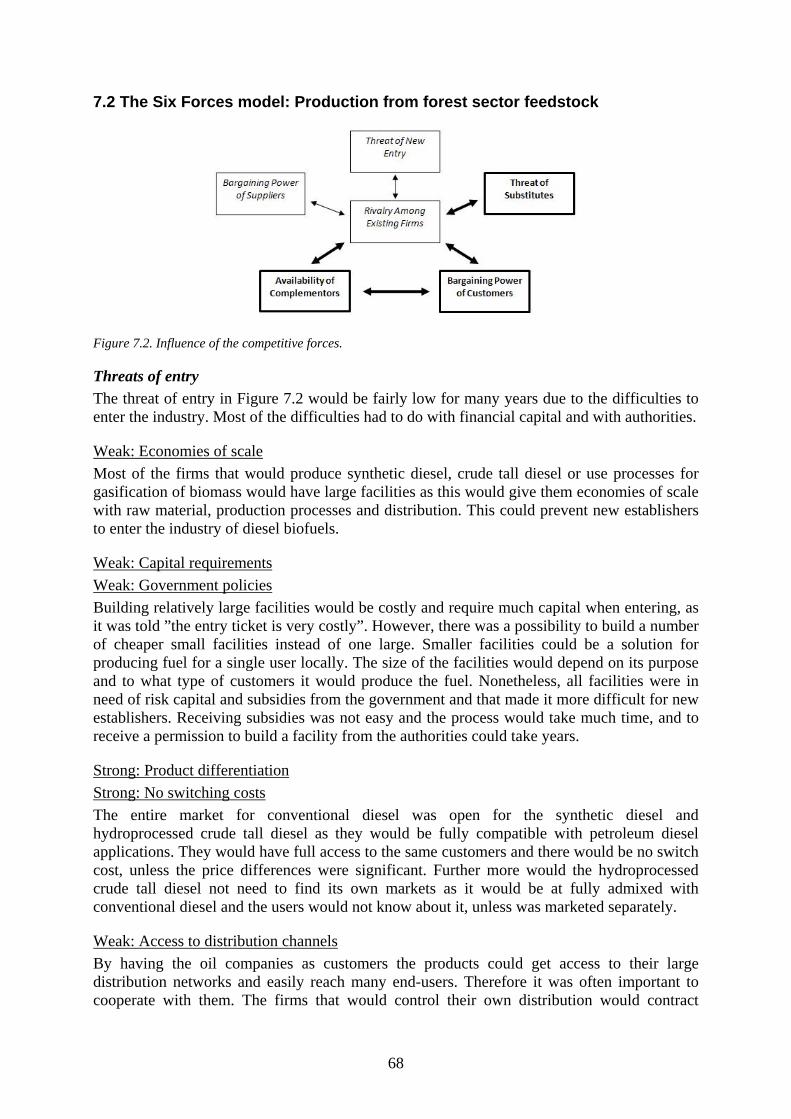
7.2 The Six Forces model: Production from forest sector feedstock
Figure 7.2. Influence of the competitive forces.
Threats of entry The threat of entry in Figure 7.2 would be fairly low for many years due to the difficulties to enter the industry. Most of the difficulties had to do with financial capital and with authorities.
Weak: Economies of scale Most of the firms that would produce synthetic diesel, crude tall diesel or use processes for gasification of biomass would have large facilities as this would give them economies of scale with raw material, production processes and distribution. This could prevent new establishers to enter the industry of diesel biofuels.
Weak: Capital requirements Weak: Government policies Building relatively large facilities would be costly and require much capital when entering, as it was told ”the entry ticket is very costly”. However, there was a possibility to build a number of cheaper small facilities instead of one large. Smaller facilities could be a solution for producing fuel for a single user locally. The size of the facilities would depend on its purpose and to what type of customers it would produce the fuel. Nonetheless, all facilities were in need of risk capital and subsidies from the government and that made it more difficult for new establishers. Receiving subsidies was not easy and the process would take much time, and to receive a permission to build a facility from the authorities could take years.
Strong: Product differentiation Strong: No switching costs The entire market for conventional diesel was open for the synthetic diesel and hydroprocessed crude tall diesel as they would be fully compatible with petroleum diesel applications. They would have full access to the same customers and there would be no switch cost, unless the price differences were significant. Further more would the hydroprocessed crude tall diesel not need to find its own markets as it would be at fully admixed with conventional diesel and the users would not know about it, unless was marketed separately.
Weak: Access to distribution channels By having the oil companies as customers the products could get access to their large distribution networks and easily reach many end-users. Therefore it was often important to cooperate with them. The firms that would control their own distribution would contract
68
haulage firms as these had already established distribution channels. There was an advantage in using existing infrastructure as this would make it easier to quickly take market shares and allow easier and less costly distribution.
Weak: Cost disadvantages independent of scale Much of the technology was already available and the firms would have to pay fees for using it, however, new technology could be developed by them. The existing firms would have a couple of years of experience when new establishers enter the industry. The knowledge of how to run these facilities was said to be a key of success and that it was not easy, even though much of the technology was already known for many years.
Conclusion: The threat of entry of using forest sector material for producing liquid diesel biofuels is lower because major capital investments are required for facilities with economies of scale. There are government policies that make it quite hard to enter. Still the fuels are not differentiated but in order to sell them is access to distribution channels important, as well as good knowledge and experience of using the technology.
Rivalry among existing firms The rivalry among the firms was currently non-existent as can be seen in Figure 7.2. Rivalry would not become strong for many years as the firms of the industry would be taking small market shares of a large market.
Numerous of equally balanced firms The market for diesel fuels was said to be much larger than all the firms together could take shares from, and raw materials was mostly abundant. Thereby would the firms be having only little or perhaps no rivalry between themselves. With time when new establishers would enter this rivalry would increase as the competition over biomass resources would become stronger, due to more central heating plants to compete with. The firms were welcoming new establishers and central heating plants were partly financing the firms production facilities, so the rivalry was initially very low. The industry agreed that more firms would benefit them all and increase the acceptance and awareness of them by the public and politicians.
Slow industry growth The market of diesel fuels was considered to grow steadily and that this trend was going to increase further on which would keep the rivalry low. However, the growth of the industry would be slow and take several years due to massive regulations and need for finance capital because all of the facilities of the industry would be very expensive.
Lack of differentiation or switching costs Most firms would produce products that followed standards but they were not giving any description of how they would differentiate themselves. The end-customers would not be locked to one product but could choose between the fuel options of best price or fit. The end-users would not need to do any modifications to their vehicles when using the synthetic diesel or hydroprocessed crude tall diesel. This would make it easy for the customers to choose between the firms if they would have this option. Most of the firms were focusing on conventional customer segments in the transportation segment but there was an option for more specialized utilities too. In this way the firms could differentiate their products more and focus on markets were currently synthetic diesel of natural gas is established or sell directly to
69
process industries. In the end would the price level of the fuels determine what fuels would be successful, but also if the firms could find customers with environmental policies or not.
High fixed or storage costs High exit barriers As mentioned would the facilities be very expensive to build and take much effort in receiving clearance from the authorities. Therefore the firms would not easily exit the industry in times of low profit levels. The facilities that were currently being built and were about to be built would very likely be kept for as long as they could meet up with the competition of its following new establishers. Still there was no concern for building up over-capacity due to the high demand, which of course would depend on the final price of the products.
Conclusion: There was currently no rivalry among the companies as they were all developing. The demand for the products was large but the industry was growing very slowly due to regulations and lack of capital investments during the financial crisis. The companies were planning on doing some actions to differentiate themselves but the fuels were mostly undifferentiated commodities. Finally there was no risk for over capacity due to the large market for diesel fuels; however the exit barriers would be very high.
Pressure from substitute products Similar to biodiesel was the main competitor the petroleum diesel as seen in Figure 7.2. Therefore it would be necessary that the synthetic diesel and crude tall diesel would be exempted from taxation in order to have a competitive price and be an alternative for the customers. However, the trend of buying alternative fuels was helping the demand for the products of the firms and many had already customers that were interested in buying their products. The trend consisted mainly of customers that were implementing environmental policies for their companies, and this was thought to increase in the future and would increase the competitiveness against the fossil fuels. This would perhaps make the diesel fuels from forest sector feedstock more attractive than biofuels from agricultural sector feedstock. But the products would perhaps be more expensive than for example biodiesel and due to the high quality of the synthetic diesel and hydroprocessed crude tall diesel. However, the firms could differentiate the fuels away from the substitutes as being a more expensive high-quality alternative fuel.
Conclusion: The main substitute would be petroleum diesel and perhaps also other biofuels if these would be cheaper.
Bargaining power of buyers The bargaining power of the buyers can be somewhat strong as seen in Figure 7.2.
Strong: Buyers are concentrated or purchases large volumes relative to seller sales The firms were aiming for mainly customers that would consume large volumes and several firms had already found customers that were interested in their products when they would come out on the market; however these buyers were limited in number. One example was the oil company that would buy all crude tall diesel produced. Oil companies would perhaps distribute or buy much of the semi-manufactured synthetic diesel waxes that would be made from synthesis gas. The oil companies are few and thereby have much influence over the firms’ distribution options. At the same time represented the crude tall diesel only a marginal
70
share of the overall volumes of fuels that the oil company handles daily. The oil companies will therefore have strong bargaining power over the firms of the industry. Other more direct end-customers, for example larger haulage firms or mining companies, were relatively limited in number and would have possibilities to bargain about the price levels and services as the fuel cost makes up much of their costs.
Strong: The products of the industry are undifferentiated commodities The buyer switching costs depends on to what market segment the product is sold. Both the hydroprocessed crude tall diesel and the synthetic diesel would be produced by the diesel standard so it would not be possible to differentiate the fuels much; however the customers could be presented the fuel qualities and the degree of environmental impact. In that sense the fuels will still be differentiated. Some customer groups, such as mining companies, could perhaps not choose any diesel fuel on the market and would only buy diesel fuels with low emission levels and then the synthetic diesel could find it niche in that customer segment with high switch cost. On the other hand, if the firms chose customer segments without any specific demands on the diesel fuel then these customers could very easily choose the cheapest diesel fuel available. Therefore should the firms perhaps not sell their fuel undifferentiated and without emphasis on the environmental aspects, because then the customers would only think the fuel was more costly but without benefits.
Both buyers that have very high income and that make lower profit The benefit of selecting the oil companies as main customers was that they had much capital and stability that guaranteed sales of large volumes of either end-product synthetic diesel or semi-manufactured components: such as crude tall diesel or waxes from synthesis gas processing that could be converted into synthetic diesels at the refineries. An oil company did themselves express their interest in buying waxes for processing into synthetic diesel as their main interest was in only handling fuels that would be compatible with their existing distribution infrastructure and existing vehicles. The oil companies are aware of their strong position as distributers and would be tough price bargainers to the firms. However, not all of the firms were interested in processing the synthesis gas into waxes, and they had other purposes for their synthesis gas. When having haulage firms as customers these would have considerable less capital than oil companies and therefore very concerned to bargain for good prices.
The buyers do not pose threats of backward integration There would probably not be any customer groups that would unite and together bargain for lower prices.
Weak: The product of the industry can be very important for the buyers The firms could choose to sell only to customers with environmental policies or with high-quality or low emission demands, and thereby have customers that would accept a higher price of the fuel products. Customers with the demand for environmentally favorable fuels would be ready to pay additional for the added environmental value.
Strong: The buyer has mainly much information Not all customers was said to know about the alternative fuels that would enter the market, for example the hydroprocessed crude tall diesel; as it would be launched for the first time. But according to the firm the interest was high and the acceptance good, and without the suspicion that was said to be the case with biodiesel. The synthetic diesel was said to have high
71
acceptance and reputation among potential customers, as it was already known from use of synthetic diesel of natural gas.
Conclusion: The customers that the firms are focusing on are often concentrated and buy large volumes relative to the volumes that would be produced by the companies. Furthermore would the products be undifferentiated commodities making it easier for customers to choose by price. The buyers were said to already have information about synthetic diesel, however not about crude tall diesel. Finally was the products said to be important to the buyer depending on chosen customer groups.
Bargaining power of the suppliers The raw material suppliers would be weak for the industry using mainly feedstock from the forest sector, see Figure 7.2.
Weak: The suppliers numerous and more than the number of firms in the industry Weak: The suppliers compete with other substitutes to sell to the firms in the industry According to the firms were there many suppliers of forest sector biomass and their investigations had concluded that there was much raw material available relative their need of biomass such as tree tops and branches and wood chips. The firms would not use primary wood but mainly buy byproducts from the forest industry and tops and branches was currently not an over exploited resource. The suppliers of peat would have a somewhat stronger bargaining power but the peat was also available in large quantities relative the need. The firm that would use this material for producing synthetic diesel owned much peat already and this lessened their need for external suppliers. The suppliers of tall oil were fewer and had more influence as this material came from a limited number of pulp mills and, in accordance to Lee (2006), had the pulp mills already well established customers in various chemistry industries. To increase the quantities of tall oil this was possible to import from abroad.
Weak: The industry can be an important customer group for the suppliers The firms could become important for the suppliers of forest sector biomass by mainly using byproducts from forestry logging activities. The firms can be an additional source of income for the suppliers that after a clearing or a clear sell the tree tops and branches they otherwise leave on the ground. Central heating plants nearby could as well be customers to the suppliers. For the tall oil suppliers was various chemical industries currently the major customers and the crude tall diesel producer would only be one out of many customers of crude tall oil. When it came to alternative feedstock said many firms that their progress was still secret but that they were looking into other options. The forest sector biomass would not be abundant for too long as the competition over this resource would increase from other industries too. Therefore the firms were already preparing on how to meet this in the future and what supplier options they would seek.
The products the suppliers offer are important to the firms of the industry The suppliers would be important for the firms of the industry because they control the raw material that would be essential for the industry. However, the quality of the biomass would not matter much, as it was said that the firms could use mostly biomass of any quality as long as it was not contaminated.
72
Weak: Suppliers’ products are undifferentiated and there is low switching cost to leave them. The main raw material, biomass from the forest sector, would be undifferentiated and therefore make it very easy to change between suppliers. A firm could also play several suppliers against each other in order to lower the prices; if there were enough biomass available within a reasonable transport distance to the production facility. I would be too costly to transport biomass from large distances. How well the suppliers could compress the material would be important. Those firms that would use house-hold garbage was saying that this was more difficult to use as there were much regulations in order to handle this material, and it would perhaps not even be a practical feedstock to use for various reasons.
Weak: The suppliers do not pose threats of forward integration It would not be likely that suppliers would unite in order to force up the prices of biomass or other feedstock such as tall oil, as the suppliers would either be part of different forest industry companies or perhaps private contractors that would be competitors to each other.
Conclusion: The suppliers could be described as weak because the suppliers were said to be numerous and the firms could choose from several types of undifferentiated raw material substitutes. This would make the switch cost low for the firms of changing suppliers. The industry could be an important extra income for the suppliers of some raw material such as tree tops and branches.
Complementors and non-market relationships Figure 7.2 shows complementors were having much influence on this industry just as with the biodiesel industry.
Strong: High concentration There was in particular one complementor and non-market relationship with very much influence on the industry and that was the government and its authorities. It was difficult in general for the firms to get permissions and clearance from the authorities to build their production facilities and to run their businesses. Even if the facilities would be approved the process would take many years for the authorities to complete. Secondly it was not easy to get subsidies as the authorities had many criteria in order to receive that. This entire process had made firms become late with up to three years behind schedule, and the financial crisis had on-top of that reduced the willingness of capital investments and the ability to be granted bank loans. The fact that a few firms were considering establishing their facilities abroad if the situation with the Swedish government and authorities would not improve show that this complementor was having much influence. The positive aspect of this complementor was still that most of the firms would get tax exemption from producing biofuels.
Weak: Relative concentration high, but no or low switching costs. The producers of synthetic diesel and hydroprocessed crude tall diesel would not have issues with the car manufacturers in the same way as the biodiesel industry did. Therefore this complementor would not have much influence on the firms. Both the synthetic diesel and the hydroprocessed crude tall diesel were fully compatible with all existing diesel applications with low switch costs. However, one synthesis gas producer was strongly promoting that DME was a more efficient fuel but that it would require new distribution infrastructure and new vehicle technology, and have much higher switching cost.
73
High concentration The environmental movement was having a positive effect on the firms as it made their businesses become more legitimate. The firms could perhaps have to buy environmental certificate systems from companies that sold this, in order to show the customers that they were good alternative options to the petroleum industry. That would mean that also the certificate industry would have influence on the biofuel firms.
Conclusion: The complementor and non-market relationship with most influence was the government and the authorities that had much power over the development of the industry. Another force was the environmental certificates that would have influence over the firms’ success. However, there would not be many problems with the car manufacturers as the fuels would be of the same standard as petroleum diesel.
7.3 PESTEL-analysis: Production from agricultural sector feedstock Political factors The most important political factor that was influencing the biodiesel industry was the tax exemption. This was important for the producers’ survival but they wanted a guarantee from the authorities that this would last for many years to come. The question was whether the government would allow biofuels be tax exempt for a long time as they lost tax payer money on this system. Another system that was discussed was mandatory blending, that would guarantee a certain amount of for example biodiesel. This would make it easier perhaps to follow the goals set by the European Union but would not likely be supportive for small scale biodiesel producers. The Swedish government and authorities had other influences on the biodiesel industry too, as well as general decision about biofuel from the European Union that gave the prerequisites for the regulations in Sweden. One regulation that was mentioned often was the law that demanded filling stations to offer one alternative fuel, which automatically supported mainly the ethanol biofuel. Even thought the governments policy is to be neutral about technology choices this and other regulations, such as “Environmental cars”. For example was not biodiesel part of many municipalities procurement policies of environmental cars, which lead to that biodiesel was somewhat “discriminated” compared to ethanol and biogas. However, even though the market should make the choices of what fuels are the best, the market cannot decide all by itself because then only the fossil fuels would exist due to its low price. Thereby it is necessary that the government is interfering and supporting the alternative fuels. There is a risk that the market becomes unstable if the government supports one fuel shortly with incentives to customers, and then suddenly removes the incentives and force the market to survive on its own. This approach could make the “rules of the game” difficult to predict and make it hard to know for companies whether or not to make major investments.
Economic factors The economic factors of the biodiesel industry are mainly related to the tax exemption system, world crude oil prices and vegetable oil seed prices. The political interest is additionally influenced by lobbying organizations that work exclusively to promote one or two types of fuels. This type of activities are generally seen as something negative in Sweden however it could be necessary as the politicians making the decisions cannot have all the knowledge about all types of alterative fuels. Until lately the ethanol lobbying groups have been the dominating influence in Sweden, but the biogas is now
74
promoted strongly as well. Not the least in the press and in the media. Biodiesel had just started their lobbying organization during the spring 2009.
Social factors It was said during the interviews that Sweden does not have the culture of using diesel as much as the Swedes are used to petrol. However, the sales figures of newly sold diesel cars in spring 2009 shows that the last ten years have diesel passenger cars gone from a small minority to over 40% of the new passenger car market share and close to the European mean value (www, BilSweden, 2009). If biodiesel could be used by passenger cars freely then perhaps the demand for it could rise substantially. However, currently it was shown that there were a tendency of negative rumors and prejudgments circulating about biodiesel. For the sake of the biodiesel market growth it ought to be on the biodiesel producers’ agenda to do something about this so called “disinformation”. The degree of this matter is cannot be judge by this study. However it is much likely that it derives from the fact that “ordinary people” hardly knows anything about biodiesel, and that much of the disinformation is due to lack of information.
Technological factors The main technical factor was that the car manufacturers were often commented and compared to being an obstacle blocking the market of passenger cars. Perhaps the car manufacturers and the biodiesel industry can find a solution to this through communications so that the technology could be improved cost efficiently. Currently most passenger cars would loose the motor guaranty when using pure biodiesel as it could clog the engine.
Environmental factors Biodiesel benefits of the current trend of using alternative fuels. However, one problem for biodiesel and other biofuels is that the customers do not get any monetary benefits from choosing alternative and “environmentally friendly” fuels; unless customers could improve their marketing thereof and thereby increase their profit. Many companies with “environmental policies” still need alternative fuels to not cost more than petroleum fuels because they do not see monetary benefits of using biodiesel besides “soft” environmental aspects. If reduced environmental impact would be easier to connect with monetary benefits for the end-customer then perhaps the demand for biofuels would increase more. Now the firms mostly said their customers would only buy biodiesel it was cheaper or same price as petroleum diesel. A good example of this relation was when the ethanol prices went up most people with ethanol vehicles switched to use petrol instead.
Legal factors The legal factors are very much similar to the political factor as the laws are directly related to the political focus on environmental issues that affects the legislation. The main legal factors in Sweden that had effect on the potentials for biodiesel production was the tax exempt, the regulations to get permission to start a biodiesel production and the law that demanded filling stations to offer an alternative fuel.
7.4 PESTEL-analysis: Production from forest sector feedstock Political factors The main political factors with influence were the difficulties to get permission to build a factory and to receive subsidies from the authorities. One of the firms described that the authority had demanded that only fully Swedish investors were allowed to invest in their firm
75
and factory if they would in order to get subsidies. This demand was put by the authorities because they did not want the foreign companies to receive the Swedish tax payer money and perhaps later move the facility abroad causing a loss of jobs. However, the authority had changed their mind as it stood clear that there were no fully Swedish companies available that would do this investments. Therefore the authority now only demanded that the companies doing the financial capital investments would be established in Sweden, however they did not need to be “Swedish”. This is just one example of the regulatory jungle that is connected with political decisions and affecting the firms.
Economic factors The financial crisis was temporarily affecting the firms as they would have more difficulties in being granted bank loans or receiving financial capital. More long term economic factors would be that it was said that the biofuels from cellulosic biomass would be too expensive to be competitive. Perhaps the fuels will start off as niche fuels and then when the technology would be further developed then the prices would go down. One respondent said that the learning curve of new technology takes about three full-scale facilities before the processes become efficient enough.
Social factors The social factors of the diesel biofuels from biomass cannot be told much about from this study. However, it was said by the firms that they perceived that their fuels had high status among transportation companies and other users. Especially synthetic diesel as it was already known from natural gas. However, with synthetic diesel made from forest biomass there would not only be high quality fuels but also renewable which was said to be a double bonus.
Technological factors The technological factors with influence would be that the technology for all the production processes is not at fully tested in full-scale, or still needed development. There were many universities in Sweden developing various alternatives of the process of gasification of biomass into biofuels. These processes could be directed into various fuels for various applications. If they would come up with better technology then perhaps the firms would be interested in this instead, however that would be up for the market to decide. The main advantage with synthetic diesel and hydroprocessed crude tall diesel would be that these fuels was said to be fully compatible with the existing distribution infrastructure and diesel engine vehicles. However, one oil company mentioned that they were looking into ways to hydroprocess vegetable oil directly in their refineries into standard diesel quality, which could take away their need of buying more expensive semi-manufactured components such as biodiesel, FT-waxes or crude tall diesel.
Environmental factors The debate on global warming is the driver of the development of biofuels, but also the debate on biofuels contra food production. That made the biofuels using forest residues and other inedible material more interesting for customers, interest groups and politicians. The debate on this matter was strong in press and media during 2008 but cooled down as the correlation between food production and biofuels was questioned. However, the debate is still not over and the question is not solved.
Legal factors The main legal matters were connected with the political factors too. It was hard for the firms to get permission to build the facilities and the regulations were out-dated and needed to be
76
adjusted. Building a biofuel factory was in some cases following the same regulations as when building a petroleum refinery and this legal process was taking many years.
7.5 SWOT-analysis: Production from agricultural sector feedstock. Strengths The strengths of biodiesel were that it was already a functional and currently available alternative to diesel fuel. Biodiesel could be used at a great extent in ordinary diesel engines and had mostly lower emissions than petroleum diesel and was biodegradable.
Weaknesses The weaknesses of biodiesel was said to be that the ordinary diesel engines would require small adjustments in order to fully function with biodiesel. There could be some problems with biodiesel in cold winter conditions and biodiesel would not be stored for very long due to water or biological growth. There was a debate about biofuels and their impact on the food production in the world; however, the producers did not think there was a connection. Still the feedstock was said to be limited.
Opportunities Biodiesel was said to perhaps substitute up to 10% of the diesel fuel consumption in Sweden over time and would from now on be a permanent diesel fuel alternative. The demand for diesel fuel in the transportation sector was steadily increasing which would also give support to biodiesel. Additionally was it predicted that the heavy transport vehicles would continue to use diesel fuels for several decades more and biodiesel would be cheaper than other diesel fuel substitutes. There were opportunities ahead if biodiesel could become as common for municipal transport as ethanol and biogas currently was or if the passenger car market would be opened up by the car manufacturers. Another opportunity was if farmers would loose their subvention of petroleum diesel and instead would use biodiesel for their machines.
Threats The threats for biodiesel would be if the industry would not be able to confront the skepticism about biodiesel and balance the information the public and the customers had about the fuel. Another threat would be if the producers would not be able to fully solve the problems during cold winter conditions no matter where in Sweden it would be used. That treat could be increased if the car manufactures would not put effort in finding technical solutions to this. Another threat would be if the price of biodiesel could not compete with petroleum diesel which would happen if biodiesel would not continue to be tax exempt. If the profit marginal would continue to be low then there could be a threat if the feedstock prices would increase.
7.6 SWOT-analysis: Production from forest sector feedstock Strengths The strengths of producing diesel fuels from the forest sector was that there was much available raw material, either from the forest or the forest industry such as pulp mills. They could be produced in large facilities that could choose from producing many different biofuels. The diesel fuels like synthetic diesel or hydroprocess crude tall diesel could be used in high blends with petroleum diesel. They were said to hold high quality and lower emissions and could be used in conventional diesel engines without any modifications.
77
Weaknesses The current weakness of synthetic diesel production was that it would take up to a decade before the production would become functional and at commercial scale. Hydroprocessed crude tall diesel would be on the market a couple of years earlier. Another weakness was that the fuels could be more expensive than petroleum diesel and other alternative fuels. Additionally it was said that synthetic diesel was not the best option when producing biofuels from forest sector biomass as other biofuel such as methane or DME could be more efficient uses of the raw materials. Furthermore it could be argued that producing solid biofuels would be even more efficient use of the biomass.
Opportunities One opportunity was that the forest sector would offer larger quantities of biomass than the agricultural sector, and thereby have more potential of substituting petroleum diesel. Using forest sector biomass was also in line with the environmental trend and opinion of that biofuels should not compete with food production. Whether or not this was true did not really matter but the discussion could still make the forest sector based biofuels more accepted. Another opportunity was that the heavy transport vehicles would continue to use liquid diesel fuels for many decades and if the producers would cooperate with the petroleum companies then the fuels would have quick access to the market.
Threats The threats for producing the liquid diesel fuels was that the facilities would be very costly to build and run, and thereby make the fuels expensive compared to other alternatives. One of these threats was that the authorities were perhaps not going to subsidize the facilities or delay the processing time further. Another threat would be if other alternative fuels would develop quicker and become cheaper.
78
8. Discussion and conclusions 8.1 Discussion For the biodiesel industry relatively weak competitive forces were the threat of entry and the rivalry among the existing firms. The rivalry may become stronger if the demand for biodiesel would rise in the future and more producers try to enter the industry. Currently the bargaining power of the buyers and the suppliers were stronger forces. The complementors and fossil substitutes were strong competitive forces. In the future the firms will continue in various sizes with their own specific markets. Moreover biodiesel will be a product for mainly heavy vehicles and transportation companies and that is where the firms are and will continue to position themselves towards their competitors and substituting fuels. For the firms using forest sector feedstock for producing liquid diesel biofuels the threat of entry was a low force as there was several barriers to entry. There was only a weak rivalry between the existing firms as they were still developing. The suppliers were going to have a relatively weak bargaining power on the producing firms. On the other hand, the competition from substitutes in the customer segments will be stronger. The complementary force was currently the influencing the firms considerably. A company that was producing ethanol from cellulosic biomass commented the competitive force of substitutes: “Those that see a competitive situation between different biofuels (such as ethanol, biodiesel, biogas) have misunderstood the fundamental conditions” (email com., SEKAB 2009). This opinion would be in line with the opinions of most respondents of this study - different biofuels are not competing against each other in the same manner as they are all competitors to petroleum fuels. Still there is competition between the biofuels when a customer is choosing between buying a biogas bus or a diesel bus running on biodiesel. What is important here is that competition is not automatically negative; it can also be positive for both parts. An increased awareness from competing biofuels could increase the acceptance for all biofuels towards the customers. The synthetic diesel of biomass and crude tall diesel are probably well positioned as fuels distributed directly to either specific customer groups with high-quality needs or sold for further treatment or distribution in the hands of the oil companies. When relating the results from this study with the study of biodiesel producers in the United States (Morrone, 2009) see Table 1.1, it can bee noted that also feedstock availability and price in Sweden have much influence on the firms competiveness and on the biodiesel price. The price of petroleum fuels influenced greatly on the success of the biodiesel, however the petroleum prices was expected to rise again and make biodiesel production more prosperous. There were a few technical issues related to the properties of biodiesel and the most common was those related to cold weather conditions. The public’s lack of knowledge or skepticism was an issue in Sweden similar to that in America (Morrone, 2009): the “fear of trying something new” and “public acceptance” because of the concerns about “cold weather issues” and the solvency effects of biodiesel”. This shows that the situation in Sweden and the US was not only regional problems and should be concerned with the biodiesel producers even though there seemed to be local variations. Efforts in marketing could perhaps solve this easily. Furthermore there was a mutual lack of political leadership according to both the Swedish and American biodiesel producers. However, there were not many Swedish biodiesel producers that mentioned that they had difficulties accessing financial capital. This was perhaps due to the fact that only one of the producers was planning on expanding their capacity within the next couple of years. Still, most of the Swedish biodiesel producers were dependent on government incentives in the form of tax credits and grants and claimed they would not survive the day the government policy would change and the incentives expired. They were
79
thereby asking for long-term guarantees for longer periods of tax-exemption grants. According to the study of American biodiesel producers (Morrone, 2009) biodiesel was considered to be only one “piece of the energy puzzle” and only a short-term solution to “buy some time” to find further alternatives. In Sweden the same situation was stated but the biodiesel producers were sure that biodiesel would be a permanent alternative on the market and there is no reason for biodiesel not to be a continuous diesel fuel option. The development of one biofuel technology will support development of further improved biofuels. Therefore all biofuels are needed in order to substitute petroleum fuels and there will not be only one alternative fuel dominating in the future. However, in order to substitute petroleum fuels it is necessary to first of all develop energy efficient vehicles. According to the answers from the respondents of this study will the forest sector biomass offer a higher potential in substituting petroleum fuels. But no biofuel could single handed be the solution and therefore a similar conclusion is taken in this study as was taken by the study in America; All alternative fuels are needed and their accumulative force could substitute some of the petroleum fuels. An additional report (Festel, 2008) had found that the customer acceptance for biofuels depended on if the producers could fulfill certain factors. First of all it was important that the producers could have competitive production costs and this study have shown that the producers were working very hard on this matter. An industry producing liquid diesel fuels from cellulosic biomass would have more difficult of achieving this as their facilities would be costly and the processes would not be optimized at first. The other factor was that the biofuel would not need any additional distribution or infrastructure costs. Here would a production of liquid diesel biofuels from biomass have an advantage over biodiesel as the first would not need any modification on either the distribution infrastructure or vehicle engines. The biodiesel would require slight modifications on either routines or storage tanks etc. The other factor that was important for biofuels according to the report was problem-free blending with existing fuel types and similar chemical and physical properties. Here would biodiesel not have the same ability as liquid diesel fuels from biomass however, biodiesel would manage well with about 5-7% low-admixture. What turns out to be important when discussing different biofuels is that different biofuels will have different niches and uses that fit one biofuel better than the other. Another report (Hansén, 2008) had stated that the main obstacles for biodiesel in Sweden were the shortage of rapeseed and rapeseed oil but also the reluctance of the car manufacturers to accept pure biodiesel for passenger cars. These two aspects were found in this study too and brought up by the respondents as important obstacles for establishment and industry expansion. Perhaps the biodiesel producers should take advantage of the situation with the crisis in 2009 of the automobile industry and promote more for the use of their fuel. This study has shown that biofuels for transport face a big challenge in that they bring many different actors together and force them to cooperate. The traditional agricultural and forestry sector, the modern car manufacturing industry, the large petroleum companies and a great deal of varying customers segments including municipalities. It is necessary that these actors cooperate in order to further develop and introduce biofuels in the transportation sector. The actors that are involved could for example be divided into four interest groups with different agendas which affect the development of the biodiesel industry, as described below: First of all this study has shown that there is a consumer interest demanding that the fuels are functional and have little environmental impact. These consumers are more or less willing to pay extra for the additional value compared to petroleum fuels. About biodiesel it was said
80
that its advantages was that it was available here and now and had good diesel fuel properties. Perhaps a problem that has to do with customer skepticism is that several biodiesel producers said that they had driven their passenger cars with biodiesel without having any problems for years. If customers would find out that there were still some problems then the disappointment could spread by word-of-mouth. Biodiesel is a good diesel fuel however its restrictions must be put out clearly in order to rebuild the faith in all customer segments. Biodiesel have good potential of being a permanent diesel fuel option and a serious option for both heavy transport vehicles and passenger cars, and it was predicted that the heavy vehicle transport would continue to use diesel fuels for many decades. The synthetic diesel or the crude tall diesel did not seem to have to confront this type of matter. Therefore it is important for the biodiesel industry to better inform the public about biodiesel and confront the perhaps economic forces that have economic gain in spreading rumors about the difficulties of biodiesel. Secondly the producers’ own interest is to lower the production costs as much as possible without losing too much of product quality. This was important as it was necessary that the biofuels would have the same price as petroleum fuels. Much effort was put in analyzing costs and revenues as most producers were into the biodiesel business for economic reasons and only few stated they were foremost producing the fuel for environmental concern. The biodiesel producers had relatively much over-capacity, perhaps over 20-30%, and therefore much more biodiesel could be produced in Sweden. This would mainly be produced from rapeseed oil and the amount of biodiesel will depend on the development of the feedstock prices which was said to in much follow the petroleum prices. Most of the biodiesel that is produced in Sweden will stay in the country as it was not suitable to transport long distances. But for the synthetic diesel it was said that it could possibly be exported at large extent and that could make this yet another export industry for the Swedish economy. Thirdly it could be said that the government and authorities have an agenda with the biofuels; that they are supported because there are political goals that has been set and must be fulfilled. However, there have been problems with some of the regulations that were implemented such as the law that filling stations must offer an alternative fuel. Instead of increasing the amount of biofuels (except ethanol) this could make filling stations close down, due to the cost of installing new equipment. Another problem with regulations could be that biodiesel was not said to be included in the municipalities’ procurement policies over “environmental cars” and fuels. Biodiesel have much potential but this was yet another factor that was limiting the available markets. The last and fourth interest could be the environmental interest that the purpose of the biofuel such as biodiesel is to lower the emissions of green-house gases and lessen the environmental impact caused by fossil fuels. These four interests can be working towards the same goal but for different reasons; and in order for the biofuels to be competitive and economically profitable and sustainable they should at least not work against each other. It is probably up to the biofuel producers to take the leading stick of this process as the other groups have many other aspects they prioritize.
8.2 Conclusions and recommendations Conclusions about the Swedish biodiesel industry using agricultural feedstock:
• It is likely that the rivalry is low among the firms in the biodiesel industry and that the threat of entry is fairly low. It is possible that the main competition currently comes from substitutes, buyers, suppliers and complementors.
81
• Most of the biodiesel produced in Sweden is low admixed in conventional diesel fuel. • Pure biodiesel is in Sweden mainly used by transportation companies. • Biodiesel in Sweden is made out of rapeseed oil. • There is supposedly a need for more active marketing and to improve the image of
biodiesel and the fuel is still fairly unknown by the public. • The biodiesel industry should communicate with car manufacturers to make them
allow biodiesel fully in all diesel passenger cars. • Municipalities should include diesel cars with biodiesel in their Environmental Car
definition and in their procurement plans.
Conclusions for the liquid diesel biofuel industry using mainly forestry sector feedstock: • There was currently no rivalry between the firms, the threat of entry was low due to
high entry barriers and the competition from suppliers was going to be low. The main competition is likely to initially be from substitutes, buyers and complementors.
• The fuel options are synthetic diesel and crude tall diesel. • These fuels are likely not to be competitors to other biofuels and will not decrease the
market for biodiesel. These fuels will possibly only substitute petroleum diesel. • These fuels will perhaps be more expensive than other biofuels such as biodiesel. • The hydroprocessed crude tall diesel is on the market within one to two years from the
date of this report. • Synthetic diesel of biomass is still five to ten years until commercially on the market. • The biomass from the forest sector is larger than the quantities of feedstock for
biodiesel. The generalizability of the results could be additionally sharpened with deeper interviews and with actual measure instead of relying only on perceptions from the respondents. As this report is based on a qualitative study the results presented are not generalizable for all biodiesels or other liquid diesel biofuel producing industries and in every country. The results from this study will only comply with the conditions in Sweden at the time of the study and the geographical locations of the producers that are part of the investigated population. Nonetheless, as most likely every producer of biodiesel in Sweden participated in this study the results could be generalized for the Swedish biodiesel producer industry in early spring 2009 with reservation for errors during the data collection.
8.3 Limitations of the study As this study was only based on interviewing one respondent of each company a lot of data could be missed out and it would perhaps have been better to visit all the production sites and measure all the input data objectively in-situ. It would also have been better to contact all the customer segments directly and ask what they were thinking about biodiesel instead of getting second hand data from the producers. The raw material situation could have been better investigated by going out to the suppliers and by contacting more companies involved with the raw materials. This would have made it possible to objectively measure the potential raw material quantities and supplier development. However, the focus in this report was only on the producers own perceptions. Additionally, it would perhaps have been better to interview a wider number of producers of synthetic diesel and crude tall diesel to get a more homogenous set or respondents for these types of fuels. It would have been favorable if all these companies would have been in full commercial scale for at least a couple of years. However, there were only a few companies
82
available in Sweden during the time of this study, and perhaps the study would have been more accurate if all producers within Europe would hade been interviewed. Perhaps was this report about liquid diesel fuels of forest sector biomass about five to ten years before its time. But by including companies that had a connection to these fuels it gave an insight of what will come in a couple of years.
8.4 Further research It could be interesting if this same study would be conducted in a few years from now (2009) and then compared to see how the industries had developed. It would then be interesting to investigate the actual situation of the biofuel industry as the findings of this report are only based on perceptions of the respondents. One interesting study approach would be to ask a great number of customer groups directly and individually or by making a questionnaire. This could be sent out to a large number of haulage firms in Sweden and ask how many are using alternative fuels and measure the ratio of positive and negative answers about the different biofuels. The same approach could be made towards the car manufacturing companies to investigate their view instead of only relying on the perceptions of the fuel producers. From this particular study it became clear that municipalities are common market segments for biodiesel and that they are consumers of large quantities of alternative fuels. A few interviews could be done to explore this further. Three different municipalities where interviewed: one of the largest, one of the five largest and one of the about hundred largest in Sweden and asked about their thoughts, experience and policy around renewable fuel choices. From this material a tendency was found that municipal policy could have great influence on what fuels are available for consumers in the region. It was suspected that many municipalities in Sweden had procurement policies that did not include biodiesel. A study could be to investigate what alternative fuels are included in the municipalities’ environmental car definition and in their procurement policies. There are over two hundred municipalities in Sweden but a questionnaire could be sent out to all of them to investigate this further. An interesting study in this area could be to see if the municipalities’ actions give equal conditions for the introduction of different alternative fuels; and if this is in line with the government policy of not interfering with technology choice. Furthermore, a study could be done to find out what the paying capability and breaking point would be for farmers to produce and use their own RME or buy this from other farmers; instead of using petroleum diesel. This study initially had the approach of also using the theory Diffusion of innovation (Rogers, E.M. 2003. Free Press, New York). The intent was to make an analysis on how liquid diesel biofuels are developing in becoming accepted alternative fuels. However, this approach would require broader sets of populations that included customers, municipalities, suppliers etc. That study would be interesting to fulfill but would probably require much time and effort. Another approach could be to find out what strategic transformations have been done within the biofuel producing companies. By using the strategic behavior model (Ansoff, I. 1979. Strategisk företagsledning. Liber, Malmö. p. 24) an investigation could be performed to find out what triggers and strategic choices are important for the firms in order to transform their strategies according to changes in the dynamic business environment. This type of investigation study would be based on the respondents’ perceptions too and would require in depth interviews that would specifically target environmental and strategic changes together with the respondents’ actions.
83
9. References 9.1 Literature Day, R. et al, 2006. How to write and publish a scientific paper. 6th edition. Cambridge University Press, UK. Edwards, J.E. et al., 1996, How to conduct organizational surveys: a step-by-step guide, SAGE Publications, USA Frankelius, P. 2007. Omvärldsanalys. Liber AB, Malmö Ghemawat, P. 2006. Strategy and the business landscape. 2nd Edition. Pearson Education, New Jersey Grant, M. G., 2005, Contemporary Strategy Analysis. 5th edition, Blackwell Publishing Kotler, P. et al. 2005. Principles of marketing. 4th European edition. Pearson Education Limited, Spain. Lantz, A. 2007. Intervju metodik. Studentlitteratur. Pozkal, Poland Johansson, B. et al. 2007. Bioenergi - till vad och hur mycket?, Formas Johnson, G et al. 2007. Exploring corporate strategy – text and cases. 8th edition. Prentice Hall. Porter, M E. 1980. Competetive strategy. The Free Press. USA Word Watch Institute. 2007. Biofuels for Transport. Earthscan, UK and USA. Yin, R.K. 2003. Case Study Research: Design and Methods. 3rd edition. Sage Publications, Thousand Oaks, USA
9.2 Reports, articles, magazines and brochures Achten, et al. 2008. Jatropha bio-diesel production and use. Biomass and bioenergy 32: 1063-1084 Akoh, C C. 2007. et al. Enzymatic Approach to Biodiesel Production. J. Agric. Food Chem. 55, (22): 8995-9005. Behrendt, F. et al. 2008. Direct liquefaction of biomass. Chem. Eng. Technol 31, (5): 667-667 Bioenergitidningen. 2008. Nr 1-6. Bioenergi Förlags AB, Stockholm. Börjesson, P. et al. 2008. Hållbara drivmedel – finns de? Department of Technology and Society, Environmental and Energy System studies. Lund University. Rapport 66. Crutzen, P J. et al. 2007. N2O release from agro-biofuel production negates global warming reduction by replacing fossil fuels. Atmos. Chem. Phys. Discuss. 7 (11): 11191-11205.
84
Demirbas, A. 2007a. Imortance of biodiesel as transportation fuel. Energy Policy , 35: 4661-4670. Demirbas, A. 2007b. Progress and recent trends in biofuels. Progress in Energy and Combustions Science , 33 (1): 1-18. Donald Mitchell. 2008. “A Note of Food Prices”. The World Bank. Dry, M. E. (2001). High quality diesel via the Fischer-Tropsch process - a review. Journal of Chemical Technology and Biotechnology , 77: 43-50. Dry, M. E. (2002). The Fischer-Tropsch process: 1950-2000. Catalysis Today , 71: 227-241 EC, 2009e. Imposing a provisional anti-pumping duty on imports of biodiesel originating in the United States of America - Commission regulation (EC) No 193/2009 of March 11 2009. Official Journal of the European Union March 12th: 22-49. Eisenhardt, K. M. 1989. Building Theories from Case Study Research. Stanford University. The Academy of Management Review, 14 (4): 532-550. Energimyndigheten. 2009a. Transportsektorns energianvändning 2008. Energimyndigheten, Sverige Energimyndigheten. 2009b. Utbudet av biobränslen på kort och lång sikt. Energimyndigheten, Sverige. Energimyndigheten. 2008a. Potentiell avsättning av biomassa för production av el, värme och drivmedel inclusive energikombinat. Energimyndigheten, Sverige. Energimyndigheten. 2008b. Transportsektorns energianvändning 2007. Energimyndigheten, Sverige. Energimyndigheten. 2007. Styrmedel för att främja användning och produktion av biodrivmedel. Energimyndigheten, Sverige Fargione J et al. 2008. "Land Clearing and the Biofuel Carbon Debt”. Science, 319 (5867): 1235 - 1238 Festel, G W. Biofuels – Economic Aspects. Chem. Eng. Technol 31 (5): 715-720 Hamelinck, C. N. et al. 2004. Production of FT transportation fuels from biomass; technical options, process analysis and optimization, and development potential. Energy 29: 1743-1771. Hansén, P. Pettersson, O. 2008. Högre kvalitet på rapsolja för tekniskt bruk. JTI - Institutet för jordbruks- och miljöteknik, Uppsala. Haraldsson, K. Widmark, A. 2009. Bränslemarknader, inhemsk produktion av biodrivmedel och kvotpliktssystem. ÅF
85
Hill, J. et al. 2006. Environmental , economic and energetic costs and benefits of biodiesel and ethanol biofuels. PNAS 103, (30): 11206-11210. Höglund, J. 2008. The Swedish Fuel Pellets Industry: Production, market and standardization. Swedish University of Agricultural Sciences, Uppsala. Johnsson, B. Tolke, C. L. 2006. Marknadsöversikt Biodiesel – ett fordonsbränsle på frammarsch?. Rapport 2006:21. Jordbruksverket, Sverige. Jörn P. et al. 2008. How Green Are Biofuels?. Science 319 (5859): 43 - 44 Karlhager, J. 2008. The Swedish market for wood briquettes – production and market development. Swedish University of Agricultural Sciences, Uppsala. Kiss, A A. et al. 2008. Biodiesel by catalytic reactive distillation powered by metal oxides. Energy & Fuels 22: 598-604 Knothe, G. (2006). Analyzing Biodiesel: Standards and Other Methods. Journal of the American Oil Chemists Society, 83: 823-833 Koh, L P. Ghazoul, J. 2008. Biofuels, biodiversity, and people: understanding the conflicts and finding opportunities. Biologicalconservation 141: 2450-2460. Kooperation utan gränser. 2008. Med utveckling I tanken – om biodrivmedel I Afrika som en möjlig väg ut ur fattigdomen. Fakta utan gränser Nr6. Lee, S Y. et al. 2006. Prospects for biodiesel as a byproduct of wood pulping – a review. Bioresources 1 (1): 150-171 Löfgren, B. 2003a. Synthetic diesel environmentally sound. Results from SkogForsk, 2: 3 Löfgren, B. Berg, S. 2003b. Synthetic fuel from forest raw materials - an environmentally sound alternative to diesel. Results from SkogForsk, 15: 1-4 Löfroth, C. Rådström, L. 2006. Fuel consumption in forestry continues to fall. Results from SkogForsk, 3: 1-4 Ma, F., & Hanna, M. A. (1999). Biodiesel production: a review. Bioresource Technology 70: 1-15. Marchetti, J M. et al. 2007. Possible methods for biodiesel production. Renewable and Sustainable Energy Reviews 11: 1300-1311. Mondala, A. et al. 2009. Biodiesel production by in-situ transesterification of municipal primary and secondary sludges. Bioresource Technology 100: 1203-1210. Monteiro, M R. et al. 2008. Critical review on analytical methods for biodiesel characterization. Talanta 77: 593-605.
86
Morrone, M. et al. 2009. The challenges of biofuels form the perspective of small-scale producers in Ohio. Energy Policy 37: 522-530. Mintzberg, H. McHugh, A. 1985. Strategy Formation in an Adhocracy. Administrative Science Quarterly, 30: 160-197 Nabi, M N. et al. 2006. Improvement of engine emissions with conventional diesel fuel and diesel-biodiesel blends. Biosource Technology 97: 372-378 NVV. 2008. Index over nya bilars klimatpåverkan 2007. Naturvårdsverket/Vägverket/ Konsumentverket, Sverige. Olivera, M B. et al. 2008. Prediction of Water Solubility in Biodiesel with the CPA Equation of State. Ind. Eng. Chem. Res. 47 (12): 4278-4285 Petrou, E C. Pappis, C P. 2009. Biofuels: a survey on pros and cons. Energy & Fuels 23: 1055-1066 Pu, Y. et al. 2008. The new forestry biofuels sector. Biofuels, Bioprod. Bioref. 2: 58-73 SAE. 2008a. Energy indicators 2008. The Swedish Energy Agency. SAE 2008b. Energy in Sweden 2008. The Swedish Energy Agency. Sandén, B A. Jonasson, K M. 2005. Variety creation, growth and selection dynamics in the early phases of a technological transition – the development of alternative transport fuels in Sweden 1974-2004. Environmental systems analysis department of energy and environment. Chalmers University of Technology, Gothenburg. Searchinger, T. Use of U.S. Croplands for Biofuels Increases Greenhouse Gases Through Emissions from Land-Use Change. Science 319 (5867) 1238 – 1240 Simacek, P. et al. 2009. Hydroprocessed rapeseed oil as a source of hydrocarbon-based biodiesel. Fuel 88: 456-460. Sinha, S. et al. 2008. Biodiesel development from rice bran oil: transesterification process optimization and fuel characterization. Energy conversion and management 49 (5): 1248-1257 Special Eurobarometer 300. 2008. Europeans’ attitudes towards climate change. September 2008. Requested by the European Parliament and the European Commission. SPI. 2006. Well-to-Wheels analys av framtida drivmedel och drivlinor i ett europeiskt sammanhang – en gemensam studie av EUCAR, JRC, CONCAWE: sammanfattning av Svenska Petroleum Institutet. Steen, E. Claeys, M. 2008. Fischer-Tropsch Catalysts for the Biomass-to-Liquid Process. Chem. Eng. Technol. 31 (5): 655-666 Stumborg, M. et al. 1996. Hydroprocessed vegetable oils for diesel fuel improvement. Bioresource Technology 56: 13-18
87
Szybist, J P. et al. 2005. NOx emissions of alternative diesel fuels: a comparative analysis of biodiesel and FT diesel. Energy & Fuels 19: 1484-1492. Takeshita, T. Yamaji, K. 2008. Important roles of Fischer-Tropsch synfuels in the global energy future. Energy Policy 36: 2773-2784. Vosloo, A C. 2001. Fischer-Tropsch: a futuristic view. Fuel Processing Technology 71 (1-3): 149-155. Zwart, R W R. et al. 2006. The impact of biomass pretreatment on the feasibility of overseas biomass conversation to Fischer-Tropsch products. Energy & Fuels 20: 2192-2197
9.3 Internet web pages BilSweden.se, ”Fyra av tio nya bilar var dieslar i januari”, [Available 2009-02-02] http://www.bilsweden.se/binaryloader.axd?ownerid=cba2f19f-936f-4f41-9f85-cf8cbdac06e5&ownertype=0&propertyname=file1&filename=pressrel0901.pdf BilSweden.se, ”Årsbok: Bilismen i Sverige 2008”, [Available 2009-02-02] http://www.bilsweden.se/web/BIL_Swedens_arsbok_Bilismen_i_Sverige_2008.aspx EU-commission, ”More renewable energy”, [Available 2009-02-13] http://ec.europa.eu/climateaction/eu_action/renewable_energy/index_en.htm EU-Parlament, http://www.europarl.europa.eu, [Available 2009-02-13] Skogsindustrierna, ”Fakta och åsikter om biobränsle från skogen”. [Available 2009-05-02] http://www.skogsindustrierna.se/LitiumDokument20/GetDocument.asp?archive=3&directory=1179&document=7460 SEA, the Swedish Energy Agency, ”Kontroll och utvärdering av pilotprojekt som avses i lagen om skatt på energi” [Available 2009-01-15] http://www.swedishenergyagency.se/infobank/remisser.nsf/0/570BE5575C0728EDC125743B00297A60/$file/Fr%C3%A4mjande%20av%20f%C3%B6rnybara%20drivmedel%20-slutversion.doc SPI, ”Om Olja”, http://www.spi.se/omolja/index.htm, [Available 2009-02-07]
9.4 Figures and tables Figure 1.1 the National Biodiesel Board, USA [Available 2009-01-14] http://www.biodiesel.org/pdf_files/fuelfactsheets/Production.PDF Figure 1.2 Hamelinck, C. N. et al. 2004. Production of FT transportation fuels from biomass; technical options, process analysis and optimization, and development potential. Energy 29: 1745 Figure 1.3 Greencarcongress [Available 2009-01-25] http://www.greencarcongress.com/2007/12/sunpine-develop.html
88
Figure 3.1 Ghemawat, P. 2006. Strategy and the business landscape. 2nd Edition. Pearson Education, New Jersey. p.37 Table 1.1 Morrone, M. et al. 2009. The challenges of biofuels form the perspective of small-scale producers in Ohio. Energy Policy 37: 526
9.5 Personal communications Visit at factory: Perstorp, Stenungsund (RME factory) 2009-03-23
Seminars: Liquid biofuels in Sweden and Canada. The Canadian Embassy, Stockholm 2009-02-05 Biodiesel industry meeting. Arranged by Svebio, Stenungsund. 2009-03-23 Teknik och Tillväxt, KTH Stockholm2009-04-01 Stora Transportdagen, Stockholm 2009-03-30
Personal communications (telephone interviews): Ebba Tamm, SPI 2009-03-10 Johan Biärsjö, Svensk Raps 2009-02-04 Julia Hansson, Chalmers 2009-02-11 Karl Hillman, Chalmers 2009-01-28 Kennert Johansson, Ageratec 2009-03-10 Rikard Gebart, ETC 2009-02-14 Semida Silveira, KTH 2009-01-30 Ulf Söderlind, MIUN 2009-02-27
Email contacts: Jakob Lagercrantz, Gröna Bilister 2009-01-13 Anna Henstedt, BilSweden 2009-01-19 Anders Fredriksson, SEKAB 2009-02-12
Respondents (telephone interviews): Anders Hultgren, Perstorp 2009-01-21 Arne Söderling, Shell 2009-03-19 Axel Lagerfeldt, Tolefors gård 2009-02-25 Bengt Göran Dalman, Göteborg Energi 2009-03-04 Carl-Johan Andersson, Soiloil 2009-02-06 Claes Ramel, Energigårdarna 2009-02-02 Clemen Rasmussen, Biofuel-Express 2009-03-11 Eva Grennfeldt and Stefan Nyström, Preem 2009-03-03 Gunnar Ljungström, Skeby gård 2009-03-24 Kent Johansson, Eco-Oil 2009-03-05 Lars Hedemalm, Aviosol 2009-02-23 Lars Stigsson, SunPine AB 2009-01-30 Lennart Gårdmarker, VVBGC 2009-03-03 Peder Rinman, Brunnsholms Säteri 2009-02-19
89

Per Erlandsson, Lantmännen 2009-02-13 Per Norrby, Gotlands Rapsbränlse AB 2009-02-12 Rolf Ljunggren, Cortus 2009-03-06 Stefan Herminge, Karaby gård 2009-03-12 Stefan Persson, Svensk Biodiesel AB 2009-02-04 Stefan Östlund, Neova 2009-03-24 Sven Norup, Norup gård 2009-02-04 Tonny Gammelgaard, Okq8 2009-03-11
Municipals (telephone interviews): Eric Lundström, Lycksele Kommun 2009-03-04 Eva Sunnerstedt, Stockhom Stads Miljökontor 2009-01-23 Lars Lidström, Uppsala Kommun 2009-03-06
90
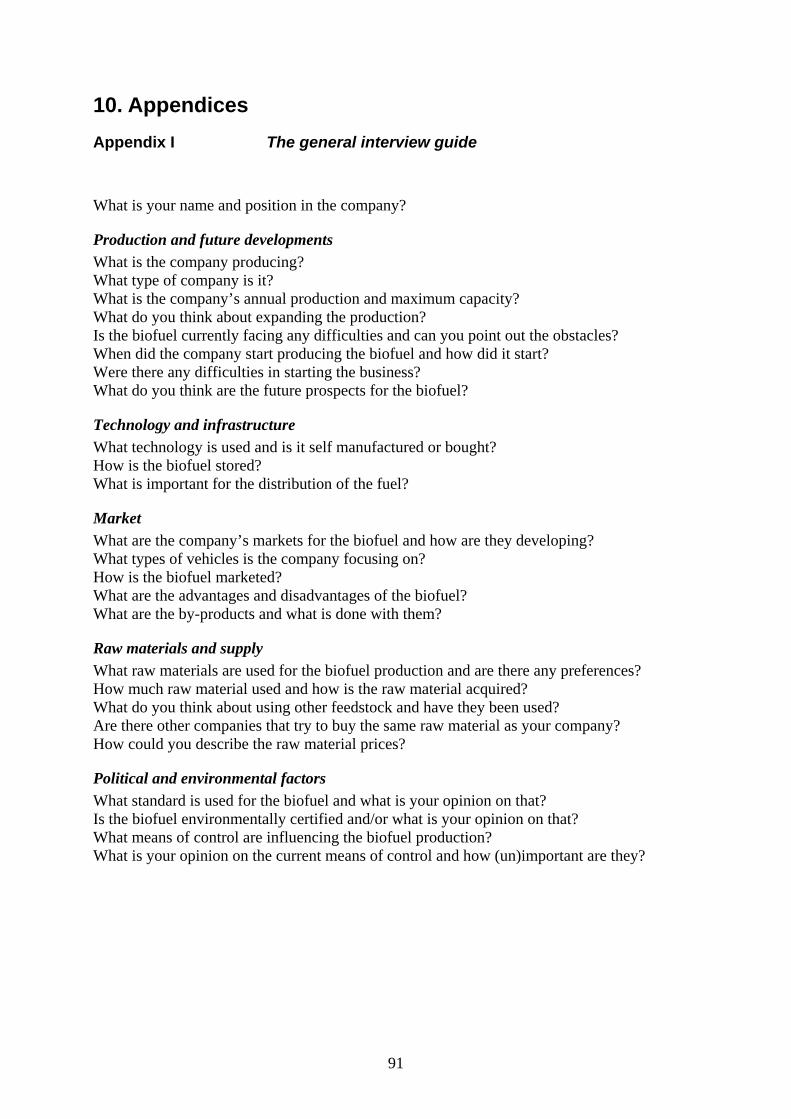
10. Appendices Appendix I The general interview guide What is your name and position in the company?
Production and future developments What is the company producing? What type of company is it? What is the company’s annual production and maximum capacity? What do you think about expanding the production? Is the biofuel currently facing any difficulties and can you point out the obstacles? When did the company start producing the biofuel and how did it start? Were there any difficulties in starting the business? What do you think are the future prospects for the biofuel?
Technology and infrastructure What technology is used and is it self manufactured or bought? How is the biofuel stored? What is important for the distribution of the fuel?
Market What are the company’s markets for the biofuel and how are they developing? What types of vehicles is the company focusing on? How is the biofuel marketed? What are the advantages and disadvantages of the biofuel? What are the by-products and what is done with them?
Raw materials and supply What raw materials are used for the biofuel production and are there any preferences? How much raw material used and how is the raw material acquired? What do you think about using other feedstock and have they been used? Are there other companies that try to buy the same raw material as your company? How could you describe the raw material prices?
Political and environmental factors What standard is used for the biofuel and what is your opinion on that? Is the biofuel environmentally certified and/or what is your opinion on that? What means of control are influencing the biofuel production? What is your opinion on the current means of control and how (un)important are they?
91
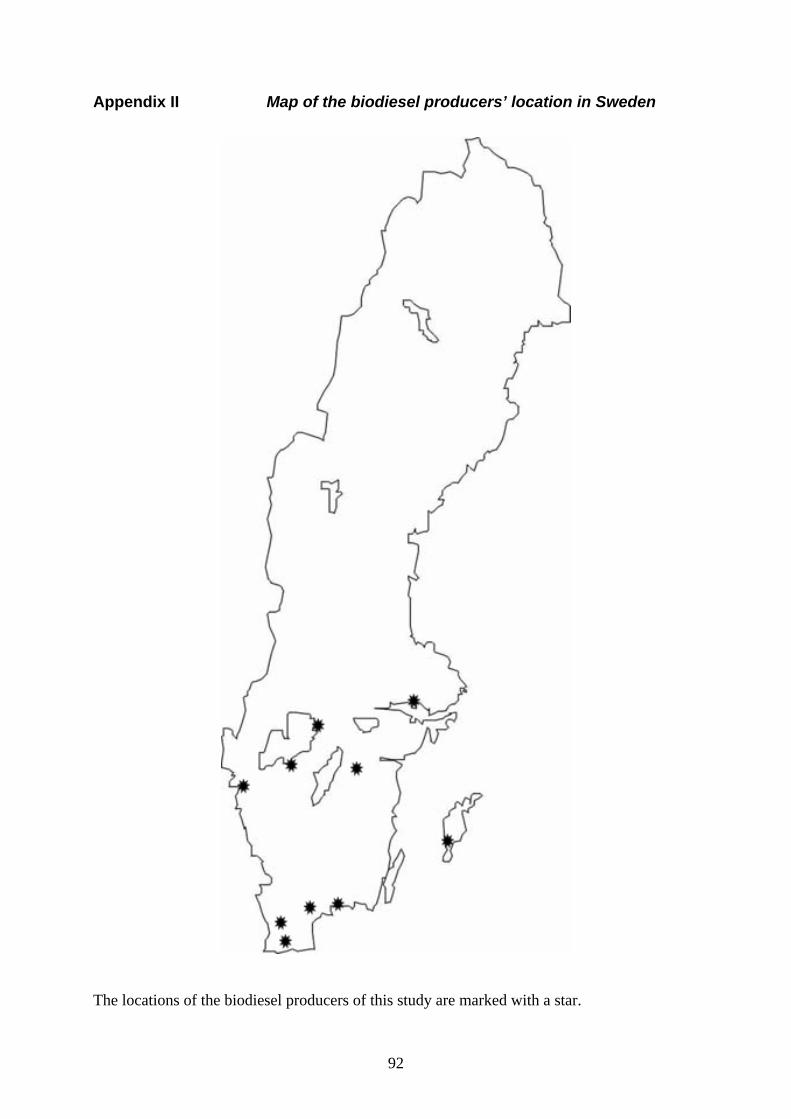
Appendix II Map of the biodiesel producers’ location in Sweden
The locations of the biodiesel producers of this study are marked with a star.
92
Publications from The Department of Forest Products,
SLU, Uppsala
Rapporter/Reports 1. Ingemarson, F. 2007. De skogliga tjänstemännens syn på arbetet i Gudruns spår. Institutionen för skogens
produkter, SLU, Uppsala 2. Lönnstedt, L. 2007. Financial analysis of the U.S. based forest industry. Department of Forest Products, SLU,
Uppsala 4. Stendahl, M. 2007. Product development in the Swedish and Finnish wood industry. Department of Forest Products,
SLU, Uppsala 5. Nylund, J-E. & Ingemarson, F. 2007. Forest tenure in Sweden – a historical perspective. Department of Forest
Products, SLU, Uppsala 6. Lönnstedt, L. 2008. Forest industrial product companies – A comparison between Japan, Sweden and the U.S.
Department of Forest Products, SLU, Uppsala 7. Axelsson, R. 2008. Forest policy, continuous tree cover forest and uneven-aged forest management in
Sweden’s boreal forest. Licentiate thesis. Department of Forest Products, SLU, Uppsala 8. Johansson, K-E.V. & Nylund, J-E. 2008. NGO Policy Change in Relation to Donor Discourse. Department of
Forest Products, SLU, Uppsala 9. Uetimane Junior, E. 2008. Anatomical and Drying Features of Lesser Known Wood Species from
Mozambique. Licentiate thesis. Department of Forest Products, SLU, Uppsala 10. Eriksson, L., Gullberg, T. & Woxblom, L. 2008. Skogsbruksmetoder för privatskogs-brukaren. Forest treatment
methods for the private forest owner. Institutionen för skogens produkter, SLU, Uppsala 11. Eriksson, L. 2008. Åtgärdsbeslut i privatskogsbruket. Treatment decisions in privately owned forestry.
Institutionen för skogens produkter, SLU, Uppsala 12. Lönnstedt, L. 2009. The Republic of South Africa’s Forets Sector. Department of Forest Products, SLU, Uppsala 13. Blicharska, M. 2009. Planning processes for transport and ecological infrastructures in Poland – actors’ attitudes and
conflict. Licentiate thesis. Department of Forest Products, SLU, Uppsala 14. Nylund, J-E. 2009. Forestry legislation in Sweden. Department of Forest Products, SLU, Uppsala
Examensarbeten/Master Thesis 1. Stangebye, J. 2007. Inventering och klassificering av kvarlämnad virkesvolym vid slutavverkning. Inventory
and classification of non-cut volumes at final cut operations. Institutionen för skogens produkter, SLU, Uppsala 2. Rosenquist, B. 2007. Bidragsanalys av dimensioner och postningar – En studie vid Vida Alvesta. Financial
analysis of economic contribution from dimensions and sawing patterns – A study at Vida Alvesta. Institutionen för skogens produkter, SLU, Uppsala
3. Ericsson, M. 2007. En lyckad affärsrelation? – Två fallstudier. A successful business relation? – Two case studies. Institutionen för skogens produkter, SLU, Uppsala
4. Ståhl, G. 2007. Distribution och försäljning av kvalitetsfuru – En fallstudie. Distribution and sales of high quality pine lumber – A case study. Institutionen för skogens produkter, SLU, Uppsala
5. Ekholm, A. 2007. Aspekter på flyttkostnader, fastighetsbildning och fastighetstorlekar. Aspects on fixed harvest costs and the size and dividing up of forest estates. Institutionen för skogens produkter, SLU, Uppsala
6. Gustafsson, F. 2007. Postningsoptimering vid sönderdelning av fura vid Säters Ångsåg. Saw pattern optimising for sawing Scots pine at Säters Ångsåg. Institutionen för skogens produkter, SLU, Uppsala
7. Götherström, M. 2007. Följdeffekter av olika användningssätt för vedråvara – en ekonomisk studie. Consequences of different ways to utilize raw wood – an economic study. Institutionen för skogens produkter, SLU, Uppsala
8. Nashr, F. 2007. Profiling the strategies of Swedish sawmilling firms. Department of Forest Products, SLU, Uppsala 9. Högsborn, G. 2007. Sveriges producenter och leverantörer av limträ – En studie om deras marknader och
kundrelationer. Swedish producers and suppliers of glulam – A study about their markets and customer relations. Institutionen för skogens produkter, SLU, Uppsala
10. Andersson, H. 2007. Establishment of pulp and paper production in Russia – Assessment of obstacles. Etablering av pappers- och massaproduktion i Ryssland – bedömning av möjliga hinder. Department of Forest Products, SLU, Uppsala
11. Persson, F. 2007. Exponering av trägolv och lister i butik och på mässor – En jämförande studie mellan sport- och bygghandeln. Institutionen för skogens produkter, SLU, Uppsala
12. Lindström, E. 2008. En studie av utvecklingen av drivningsnettot i skogsbruket. A study of the net conversion contribution in forestry. Institutionen för skogens produkter, SLU, Uppsala
13. Karlhager, J. 2008. The Swedish market for wood briquettes – Production and market development. Department of Forest Products, SLU, Uppsala
14. Höglund, J. 2008. The Swedish fuel pellets industry: Production, market and standardization. Den Svenska bränslepelletsindustrin: Produktion, marknad och standardisering. Department of Forest Products, SLU, Uppsala
15. Trulson, M. 2008. Värmebehandlat trä – att inhämta synpunkter i produktutvecklingens tidiga fas. Heat-treated wood – to obtain opinions in the early phase of product development. Institutionen för skogens produkter, SLU, Uppsala
16. Nordlund, J. 2008. Beräkning av optimal batchstorlek på gavelspikningslinjer hos Vida Packaging i Hestra. Calculation of optimal batch size on cable drum flanges lines at Vida Packaging in Hestra. Institutionen för skogens produkter, SLU, Uppsala
17. Norberg, D. & Gustafsson, E. 2008. Organizational exposure to risk of unethical behaviour – In Eastern European timber purchasing organizations. Department of Forest Products, SLU, Uppsala
18. Bäckman, J. 2008. Kundrelationer – mellan Setragroup AB och bygghandeln. Customer Relationsship – between Setragroup AB and the DIY-sector. Institutionen för skogens produkter, SLU, Uppsala
19. Richnau, G. 2008. Landscape approach to implement sustainability policies? - value profiles of forest owner groups in the Helgeå river basin, South Sweden. Department of Forest Products, SLU, Uppsala
20. Sokolov, S. 2008. Financial analysis of the Russian forest product companies. Department of Forest Products, SLU, Uppsala
21. Färlin, A. 2008. Analysis of chip quality and value at Norske Skog Pisa Mill, Brazil. Department of Forest Products, SLU, Uppsala
22. Johansson. N. 2008. An analysis of the North American market for wood scanners. En analys över den Nordameri-kanska marknaden för träscanners. Department of Forest Products, SLU, Uppsala
23. Terzieva, E. 2008. The Russian birch plywood industry – Production, market and future prospects. Den ryska björk-plywoodindustrin – Produktion, marknad och framtida utsikter. Department of Forest Products, SLU, Uppsala
24. Hellberg, L. 2008. Kvalitativ analys av Holmen Skogs internprissättningsmodell. A qualitative analysis of Holmen Skogs transfer pricing method. Institutionen för skogens produkter, SLU, Uppsala
25. Skoglund, M. 2008. Kundrelationer på Internet – en utveckling av Skandias webbplats. Customer relationships through the Internet – developing Skandia’s homepages. Institutionen för skogens produkter, SLU, Uppsala
26. Hesselman, J. 2009. Bedömning av kunders uppfattningar och konsekvenser för strategisk utveckling. Assessing customer perceptions and their implications for strategy development. Institutionen för skogens produkter,
SLU, Uppsala 27. Fors, P-M. 2009. The German, Swedish and UK wood based bio energy markets from an investment perspective, a
comparative analysis. Department of Forest Products, SLU, Uppsala 28. Andræ, E. 2009. Liquid diesel biofuel production in Sweden – A study of producers using forestry- or agricultural sector
feedstock. Produktion av förnyelsebar diesel – en studie av producenter av biobränsle från skogs- eller jordbrukssektorn. Department of Forest Products, SLU, Uppsala