Embed Size (px)
Citation preview
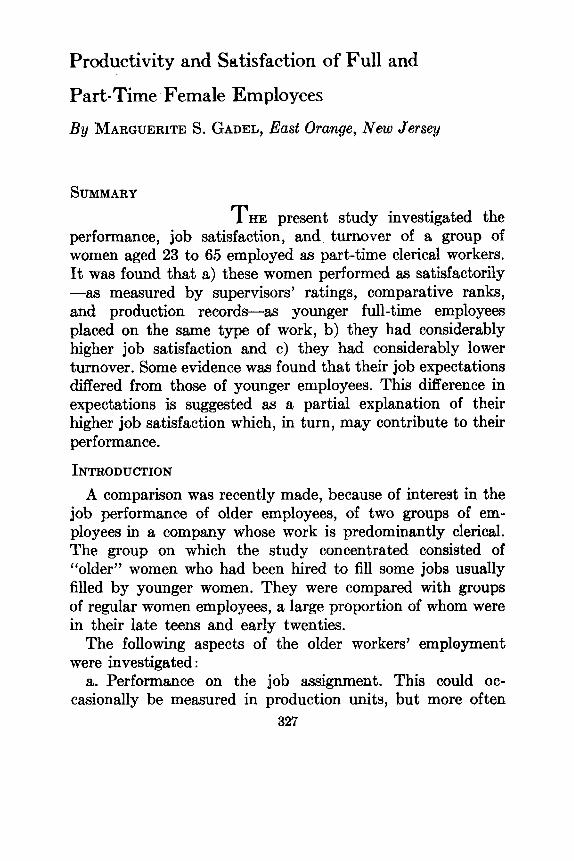
Productivity and Satisfaction of Full and
Part-Time Female Employees By MARGUERITE S. GADEL, East Orange, New Jersey
SUMMARY THE present study investigated the
performance, job satisfaction, and turnover of a group of women aged 23 to 65 employed as part-time clerical workers. It was found that a) these women performed as satisfactorily -as measured by supervisors’ ratings, comparative ranks, and production records-as younger full-time employees placed on the same type of work, b) they had considerably higher job satisfaction and c) they had considerably lower turnover, Some evidence was found that their job expectations differed from those of younger employees. This difference in expectations is suggested as a partial explanation of their higher job satisfaction which, in turn, may contribute to their performance.
INTRODUCTION A comparison was recently made, because of interest in the
job performance of older employees, of two groups of em- ployees in a company whose work is predominantly clerical. The group on which the study concentrated consisted of “older” women who had been hired to fill some jobs usually filled by younger women. They were compared with groups of regular women employees, a large proportion of whom were in their late teens and early twenties.
The following aspects of the older workers’ employment were investigated :
a. Performance on the job assignment. This could oc- casionally be measured in production units, but more often
327
328 MARGUERITE S. GADEL
the sole measure was the judgment of the immediate super- visor, expressed in ratings and rankings.
b. Promotion potential: the ability to handle more re- sponsible jobs. This was estimated by the immediate super- visor.
c. Turnover rate. d. Acceptance as co-workers by the younger employees in
the work groups they entered. This was reported by super- visors of those work groups which contained both older and younger employees.
e, Attitudes toward the job. Obtained in questionnaire form from older and younger employees.
f . Personal factors influencing job attitudes. The analyses used information obtained from the employees.
SUBJECTS Pertinent information was obtained for 301 women em-
ployees, 60% of whom were past 40. The average age of these subjects was 41 years. The distribution of their ages can be seen in Table 2.
Almost all these women were married and many had school age children. Working on a part-time basis, they worked from 20 to 35 hours a week. Most of them were doing routine clerical work and a few were on typing jobs. About one-third of them had worked for the same company previously (usually having left the previous job at the time of their marriage). At the time this study was conducted, 46y0 of them had been on their present jobs between one and three months, 29% of them four to six months, 22y0 seven to nine months, and 3% 10 months to a year.
JOB PERFORMANCE There were three types of job performance information
available: ratings and rankings made by the immediate super- visor, and production records. The latter two measures seemed to be more meaningful because of the leniency factor
FEMALE EMPLOYEES 329
in ratings. Since, however, they were not available for all subjects, ratings were also obtained.
In six work groups the older and the younger women employees could be directly compared. Each of the six super- visors combined her subordinates of both categories in one ranking of the work group on all-round job performance. The individual ranks were converted into standard scores which normalized the distribution of ranks in each work group and gave each work group approximately the same mean and standard deviation (mean of 50 and standard deviation of approximately 18). The higher score indicated the better performance. The average rank, in standard score form, assigned to all older and all younger employees was then obtained. The difference between these average standard score ranks (x = 50.9 for the 67 older, 48.5 for the 50 younger employees) is 2.4. This difference being so small serves only as an indication that according to their supervisors, the older employees are doing at least as well as the younger employees in these work groups.
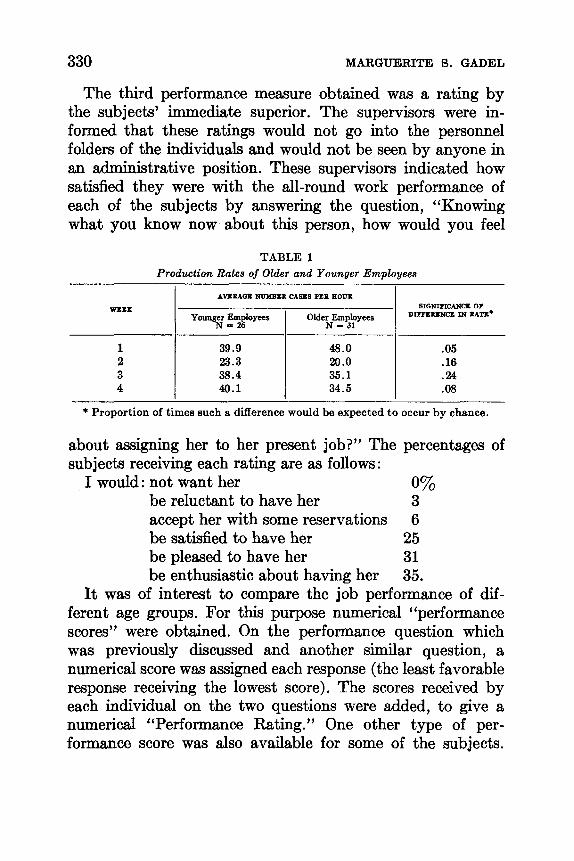
In one fairly large work group it was possible to compare production records of employees over 25 (N = 31) and under 25 (N = 26). The work was a temporary job involving the copying of information from old records onto new cards. The two groups of workers started on the task at the same time. Although production records varied considerably from week to week because of differences in the difficulty of the work, weekly figures for the two groups are based on comparable work. Production figures for four consecutive weeks, which occurred one month after both groups had started on the work, are given in Table 1.
The production rates showed large within group variation. It can be seen from Table 1 that the direction of the one difference approaching significance is in direct opposition to the other three differences. These results are believed to be another indication of the similarity in performance of em- ployees of different ages.
330 MARGUERITE S. GADEL
The third performance measure obtained was a rating by the subjects’ immediate superior. The supervisors were in- formed that these ratings would not go into the personnel folders of the individuals and would not be seen by anyone in an administrative position. These supervisors indicated how satisfied they were with the all-round work performance of each of the subjects by answering the question, “Knowing what you know now about this person, how would you feel
TABLE 1 Production Rates of Older and Younger Employees
WSEK
A M M G E NITYBZP CASES PEP H O W
Younger Employees 1 Older Employees N I 26 N = 31
1 2 3 4
39.9 23.3 38.4 40.1
48.0 20.0 35.1 34.5
SIGNIFICANCE OF DIFFERENCE M PATS’
.05
.16
.24
.08
* Proportion of times such a difference would be expected to occur by chance.
about assigning her to her present job?” The percentages of subjects receiving each rating are as follows:
I would: not want her 0% be reluctant to have her accept her with some reservations be satisfied to have her be pleased to have her be enthusiastic about having her
3 6
25 31 35.
It was of interest to compare the job performance of dif- ferent age groups. For this purpose numerical “performance scores” were obtained. On the performance question which was previously discussed and another similar question, a numerical score was assigned each response (the least favorable response receiving the lowest score). The scores received by each individual on the two questions were added, to give a numerical “Performance Rating.” One other type of per- formance score was also available for some of the subjects.
FEMALE EMPLOYEES 331
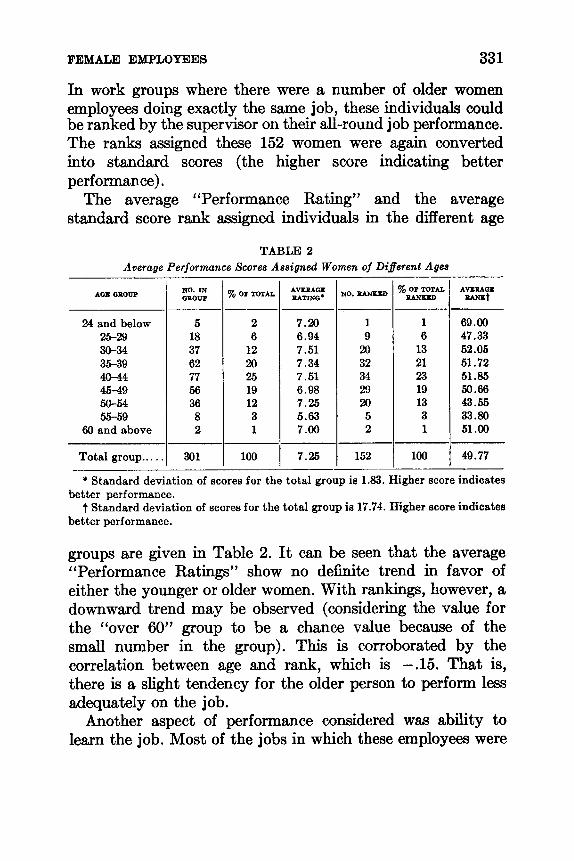
In work groups where there were a number of older women employees doing exactly the same job, these individuals could be ranked by the supervisor on their all-round job performance. The ranks assigned these 152 women were again converted into standard scores (the higher score indicating better performance).
The average “Performance Rating” and the average standard score rank assigned individuals in the different age
TABLE 2 Average Performance Scores Assigned Women of Different Ages
24 and below 25-29 30-34 35-39 40-44 45-49 50-54 55-59
60 and above
Total group.. . . . -
5 18 37 62 77 56 36 8 2
301
2 6 12 20 25 19 12 3 1
100
AVERAGE MTING’
7.20 6.94 7.51 7.34 7.51 6.98 7.25 5.63 7.00
7.25
YO. PANIU)
1 9 20 32 34 29 20 5 2
% OF TOTAL PAlYpLD
1 6 13 21 23 19 13 3 1
152 I 100
AVEMGZ -t
69.00 47.33 52.05 51.72 61.85 60.66 43.55 33.80 51 .OO
49.77
* Standard deviation of scores for the total group is 1.83. Higher score indicates
t Standard deviation of scores for the total group is 17.74. Higher score indicates better performance.
better performance.
groups are given in Table 2. It can be seen that the average “Performance Ratings” show no definite trend in favor of either the younger or older women. With rankings, however, a downward trend may be observed (considering the value for the “over 60” group to be a chance value because of the small number in the group). This is corroborated by the correlation between age and rank, which is -.15. That is, there is a slight tendency for the older person to perform less adequately on the job.
Another aspect of performance considered was ability to learn the job. Most of the jobs in which these employees were
332 MARGUERITE S. GADEL
placed involved a learning period of a few days to as long as a month. While it was not possible to obtain objective measures, the immediate supervisors indicated their estimates of each individual’s learning ability in answering the question, “Compared with most people you have supervised on this type of work, how quickly did this person learn the job to which she is assigned?” They rated 32% as learning faster, 46y0 as learning about the same, and 22% as learning slower. Rater leniency appears to enter the picture here although to an unknown degree.
A summary of the evidence on performance indicates that although the immediate supervisors seemed to view the older women as more desirable employees than the younger workers, production records, comparative rankings, and supervisory estimates of the learning ability of these employees would indicate that the two groups are about equal.
In view of this similarity in the performance of older and younger workers, it is interesting to note that the older employees were slightly inferior in performance on the clerical speed tests used by the Company. On a battery of clerical speed tests one group of 200 obtained a mean score .60 standard deviation units below the mean score obtained by 424 younger employees hired during the same period. Studies conducted on the test abilities of different age groups (1, 2, 3, 6, 7) tend to show a decline in performance with increasing age on tests requiring speed in perception or movement. However, the fact that older people do poorer on certain types of tests does not necessarily imply a similar differential in job Performance, even on jobs where these skills are relevant. The jobs being filled by the older workers studied here require, like many jobs, that such factors as attitude and judgment, as well as clerical ability play a part in performance.
ADVANCEMENT POTENTIAL An estimate of promotability was obtained for each subject
by asking her immediate supervisor, “Knowing what you
FEMALE EMPLOYEES 333
know now about her all-round ability, how would you feel about advancing her to a job with greater responsibility?” The supervisors of 50% of these employees indicated that they would be “pleased” or “enthusiastic” about having them placed on advanced jobs; the supervisors of 27% would be “satisfied,” and the supervisors of 23% said they would “accept her with some reservations,” “be reluctant to have her,” or “not want her” on an advanced job.
TURNOVER The turnover rate of these older employees was found to be
two-fifths that of full-time female turnover for the same eleven-month period. Of the 996 full-time women employees (aged approximately 18 to 25) who had been hired since the beginning of that period, 251 had left by the end of the 11th month, giving a turnover rate of .25 for the period. Of the 481 older, part-time women employees hired during the same period (aged 23 to 62), 50 had left by the end of the 11th month, giving a turnover rate of .lo.
It would also be pertinent to compare absence rates. Such a comparison, however, would be difficult to interpret in the present study because full-time employees are paid for days absent because of illness, while older employees working on a part-time basis are not. Thus the part-time employees are probably more highly motivated to keep their absences at a minimum. In situations where the sick leave pay differential is not present little difference was found in absence rates of various age groups (5, 9).
ACCEPTANCE BY CO-WORKERS AND SUPERVISORS Since the question of how well older women would be
accepted as co-workers by a predominantly younger work group had been raised, this aspect of the problem was con- sidered an important part of a general evaluation. Almost all supervisors commented during the interview that relations between the older and younger employees were good. The
334 MARGUERITE S. GADEL
supervisors themselves got along well with the older employees because they were pleased with the exceptionally responsible and willing attitude they thought these women brought to their jobs. They felt, moreover, that this attitude was some- times communicated to the younger members of the work group. The younger employees, according to the supervisors’ reports, treated the older women with respect and friendliness.
The supervisors were asked in connection with each older employee a) how willing the younger employees had been to help her learn the work when she entered the work group, and b) how well she got along with the younger employees. For 91% of the older employees, the supervisors reported that the younger employees had either “gone out of their way to help” or “been glad to help when asked.” They reported that 89% of the older group got along “very well” with the younger employees and 9% “fairly well.”
It must be kept in mind that there may also have been a tendency to push the answers toward the favorable end of the scale in answering these questions since these responses could be expected to reflect the success of the supervisor in building a good work group.
ATTITUDE TOWARD THE JOB All the older employees answered questions on their attitudes
toward a few important aspects of the job. Three-fourths of the women completed their questionnaires anonymously. For other research purposes, the fourth quarter of the sample was asked to identify its questionnaires. Answers to these identified questionnaires were found to indicate somewhat higher satis- faction on the part of the respondent and are, therefore, not included in the summaries.
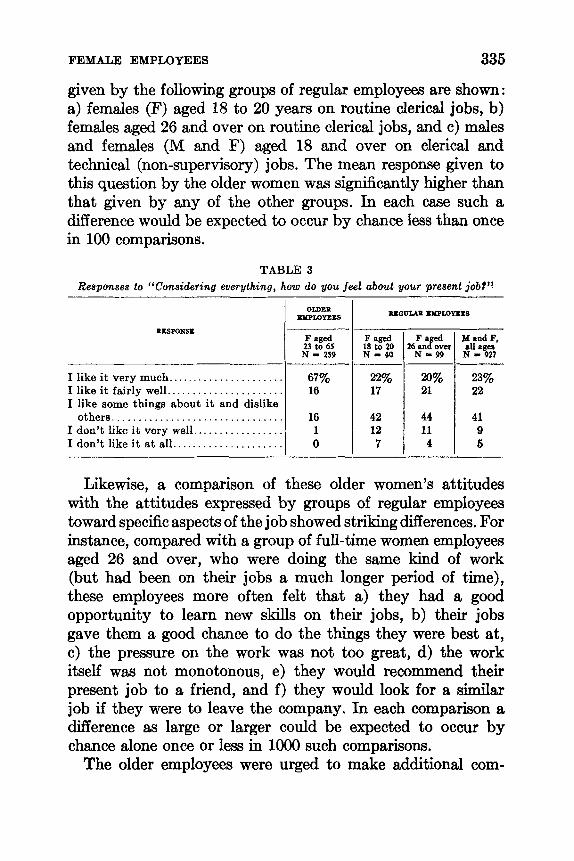
It was found that newly-employed older women have much more favorable attitudes toward their jobs than any other group of employees studied. As an example, their answers to the question on general job satisfaction, ‘Considering every- thing, how do you feel about your present job?” are presented in Table 3. In addition, for purposes of comparison, responses
FEMALE EMPLOYEES 335
F aged 23 to 65 N - a59
67% 16
16 1 0
given by the following groups of regular employees are shown: a) females (F) aged 18 to 20 years on routine clerical jobs, b) females aged 26 and over on routine clerical jobs, and c) males and females (M and F) aged 18 and over on clerical and technical (non-supervisory) jobs. The mean response given to this question by the older women was significantly higher than that given by any of the other groups. In each case such a difference would be expected to occur by chance less than once in 100 comparisons.
TABLE 3 Responses to “Considering everything, how do you feel about your present job?’’
F aged 18 to 20 N = 40
22% 17
42 12 7
- IUCSPONslL
- I like it very much.. .................... I like it fairly well.. .................... I like some things about it and dislike
others. ............................... I don’t like it very well ................. I don’t like it at all. . ...................
F a ed 26 mfover N = W
20% 21
44 11 4
MandF, all ages N-911 ~-
23% 22
41 9 6
Likewise, a comparison of these older women’s attitudes with the attitudes expressed by groups of regular employees toward specific aspects of the job showed striking differences. For instance, compared with a group of full-time women employees aged 26 and over, who were doing the same kind of work (but had been on their jobs a much longer period of time), these employees more often felt that a) they had a good opportunity to learn new skills on their jobs, b) their jobs gave them a good chance to do the things they were best at, c) the pressure on the work was not too great, d) the work itself was not monotonous, e) they would recommend their present job to a friend, and f ) they would look for a similar job if they were to leave the company. In each comparison a difference as large or larger could be expected to occur by chance alone once or less in 1000 such comparisons.
The older employees were urged to make additional com-
336 MARGUERITE 9. GADEL
ments on the job attitude questionnaires regarding any aspect of their jobs. From these comments we learned that there were certain aspects which were viewed unfavorably by some respondents. The main complaint (31% of the comments) was lodged against differentials in treatment (such as differential policies on benefits) between these older part-time workers and the full-time employees of the company.
FACTORS INFLUENCING JOB ATTITUDES At the same time that measures of job attitudes were
obtained, the respondents were asked to indicate their age, the number of years of school they had completed, the number of months they had held their present job, and the nature of their previous working experience. It was thought that any one of these factors might influence an individual’s satisfaction with her job. However, it was found that responses to the question, “Considering everything, how do you feel about your present job?” showed no relationship to any of these four variables. The small variability in answers to this question may account for the lack of relationship. Length of service, of course, was also restricted in range for this sample (no one having been on the present job over one year).
Observing that the satisfaction of these employees was high compared with that of other women employees on similar clerical work, we speculated on the possible differences between the two groups which could contribute to the greater satis- faction of one group. It was felt that one factor might be a difference in job expectations. For example, many of the older women had not been working for several years. They might have kept their previous job values formed during their work experience of 10 or more years ago whereas the values of the working population may have changed.
While we were not able to obtain a complete picture of their job expectations, we were able to obtain from a quarter of the sample (77 individuals) a measure of the relative im- portance of various factors in a job. They completed a “Job
FEMALE EMPLOYEES 337
Preferences” sheet (originated by Jurgensen [4]) on which the respondent ranked 11 factors of a job according to their relative importance to her. The factors ranked are:
(a) advancement, (g) Pay, (b) benefits, (h) security, (c) ease of commuting, (i) supervision, (d) prestige of company, (j) type of work, and (e) co-workers, (k) working conditions. (f) hours,
The respondent marks the factor most important to him with a “1,” while the least important factor is marked “11.”
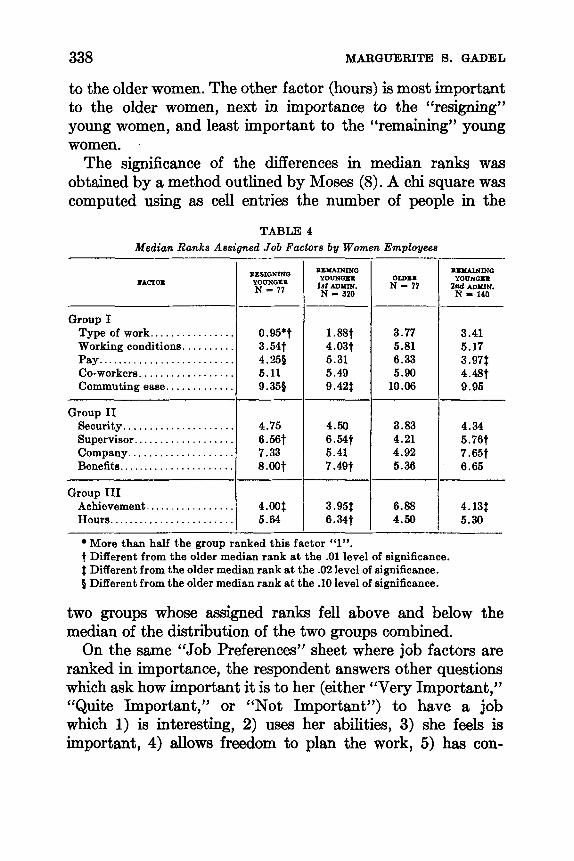
The ranks assigned these 11 factors by a fourth of the older women employees who had been working in the company one to 11 months were compared with the ranks assigned by two groups of young women employees (recent high school graduates) when they began working for this company. One young group included those employees who stayed with the company longer than three months (N = 320). The other young group included those who left their jobs within the first three months of employment for “avoidable” reasons, such as leaving for another job, or to continue schooling (N = 77). The median ranks assigned each factor by these three groups are shown in Table 4. The median ranks assigned on a second administration of the “Job Preferences” sheet by a portion of the “remaining” younger group about one year after they had started working in the company are shown in the last column.
The factors are separated into three groups. Group I contains those factors which are most important to the “resigning” young group, next most important to the “re- maining” young group, and least important to the older employees. Group I1 contains those factors which are most important to the older employees, next in importance to the “remaining” younger employees, and of least importance to the “resigning” younger employees. In Group I11 are the two remaining factors, one of which (advancement) is equally important to the two younger groups and much less important
338 MARGUERITE 8. GADEL
3.77 5.81 6.33 5.90
10.06
3.83 4.21 4.92 5.36
6.88 4.50
to the older women. The other factor (hours) is most important to the older women, next in importance to the “resigning” young women, and least important to the “remaining” young women. .
The significance of the differences in median ranks was obtained by a method outlined by Moses (8). A chi square was computed using as cell entries the number of people in the
TABLE 4 Median Ranks Assigned Job Factors by Women Employees
3.41 5.17 3.97$ 4.48t 9.95
4.34 5.76t 7.65t 6.65
4.13# 5.30
#ACT011 YOIJNGZP I N-’i7
Group I1 Security.. . . . . . . . . . . . . . . . . . . .
Company .................... Supervisor.. .................
Benefits ......................
Group I11 Achievement.. . . . . . . . . . . . . . . . Hours. .......................
Group I Type of work.. . . . . . . . . . . . . . Working conditions. . . . . . . . .
Co-workers ................. Commuting ease.. ..........
Pay. ........................
4.75 6.56t 7.33 8.00t
4.00$ 5.64
0.95*t 3.54t 4.255
9.359 5.11
XEYAINING YOUNGEP
1s: mm. N 5 320
1.88t 4.03t 5.31 5.49 9.42$
4.50 6.54t 5.41 7.497
3.95$ 6.34t
I---
More than half the group ranked this factor “1”. t Different from the older median rank at the .01 level of significance. $ Different from the older median rank at the .02 level of significance. 0 Different from the older median rank at the .I0 level of significance.
two groups whose assigned ranks fell above and below the median of the distribution of the two groups combined.
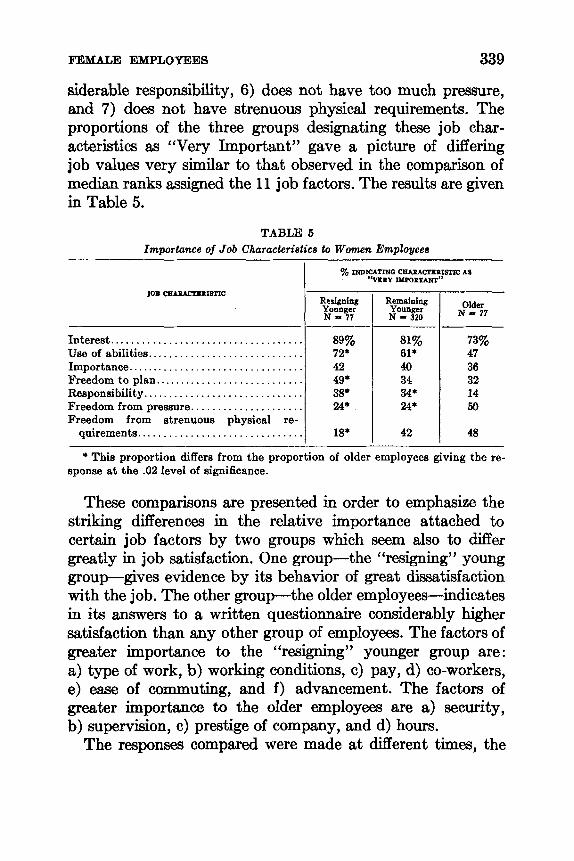
On the same “Job Preferences” sheet where job factors are ranked in importance, the respondent answers other questions which ask how important it is to her (either “Very Important,” “Quite Important,” or “Not Important”) to have a job which 1) is interesting, 2) uses her abilities, 3) she feels is important, 4) allows freedom to plan the work, 5 ) has con-
FEMALE EMPLOYEES 339
................................... Interest. Use of abilities.. ........................... Importance.. ............................... Freedom to plan.. .......................... Responsibility.. ............................ Freedom from pressure.. . . . . . . . . . . . . . . . . . . . Freedom from strenuous physical re-
quirements.. .............................
siderable responsibility, 6) does not have too much pressure, and 7) does not have strenuous physical requirements. The proportions of the three groups designating these job char- acteristics as “Very Important” gave a picture of differing job values very similar to that observed in the comparison of median ranks assigned the 11 job factors. The results are given in Table 5.
89% 72* 42 49* 38* !&I*
18*
TABLE 6 Importance of Job Characteristics to Women Employees
JOB PIST TIC
’% INDICATING CBAXACR.IISTIC AS “ M I Y lXPOITANT” I
Resigning Remaining Younger N - 320
81% 61* 40 34 34* 24*
42
Older N = 77
73% 47 36 32 14 50
48
* This proportion differs from the proportion of older employees giving the re- sponse at the -02 level of significance.
These comparisons are presented in order to emphasize the striking differences in the relative importance attached to certain job factors by two groups which seem also to differ greatly in job satisfaction. One group-the “resigning” young group-gives evidence by its behavior of great dissatisfaction with the job. The other group-the older employees-indicates in its answers to a written questionnaire considerably higher satisfaction than any other group of employees. The factors of greater importance to the “resigning” younger group are: a) type of work, b) working conditions, c) pay, d) co-workers, e) ease of commuting, and f) advancement. The factors of greater importance to the older employees are a) security, b) supervision, c ) prestige of company, and d) hours.
The responses compared were made at different times, the
340 MARGUERITE S. GADEL
young groups giving their responses at the time they began work in the company, and the older employees giving theirs after they had been working in the company from one to 11 months. The comparisons were made in this way because the only responses available for the “resigning” young group were those made when they first started working. However, if working experience changes these values, the responses of the two young groups (many of whom had no previous working experience) were not comparable to those of the older group. For this reason it was necessary to check the consistency of the differences found. This was accomplished by comparing the older women’s rankings of job factors with the rankings made by 140 of the “remaining” young employees about a year after they started working at the company. These 140 employees were representative of the total “remaining” group on the basis of their first job factor rankings. The rankings made at the time of this second administration of the “Job Preferences” sheet are given in the last column of Table 4. Comparison of these rankings with those of the older women’s show that the same differences do exist, some in greater degree, some in lesser degree than the differences found in the first comparisons.
The higher job satisfaction by the older employees may be partially explained if the factors indicated to be more im- portant by the older employees were those more easily satisfied in their jobs, and the factors indicated to be less important to them were those more difficult to satisfy in a beginning clerical job. Although this suggested positive relationship (between the satisfactory nature of different factors in the older women’s jobs and the importance they attach to these factors) is certainly not present in the case of every job factor, there are some job factors in which the relationship is borne out.
For instance, fewer of the older women consider type of work the most important factor; fewer of them consider it “Very Important” that the work be interesting or important, that the work makes use of their abilities, or that it involves
FEMALE EMPLOYEES 341
responsibility or freedom to plan. The younger employees, particularly the “resigning” group, are more unanimous in considering these job factors of great importance. The two groups enter the same jobs, jobs which offer them objectively the same experiences. One group is more satisfied with these jobs than the other-that group which is not so exclusively concerned with type of work. This group of older employees, who are more interested in other factors than are the younger employees, evidently has more opportunity to find in the job, satisfactions which are important to them. Similar analyses could be made of the advancement and pay factors.
A factor of greater importance to the older group is hours. The hours of work are selected (within limits) by these older part-time employees, and are supposedly convenient for them. This convenience would be expected to enhance their job satisfaction. Likewise, the company involved has considerable prestige as an employer in the area. This prestige, which is more important to the older group than to either younger group, probably is contributing further to satisfaction with the job. On the other hand, there were factors ranked as important by the older women-benefits and security-which are not entirely met in the job, and thus probably are not contributing to their higher job satisfaction.
This analysis suggests that one reason for the differences in job satisfaction of the older and the younger groups may be found in their differing job values. It does not explain, of course, why these values differ.
REFERENCES 1. BROWN, C. W. AND GHISELLI, E. E. Age of semiskilled workers in relation to
abilities and interests. Personnel Psychol., 1949, 2 , 497-511. 2. HESTON, J. C. AND CANNELL, C. F. A note on the relation between age and per-
formance of adult subjects on four familiar psychometric tests. J . a p p l . Psychol., 1941, 16, 415-419.
3. JONES, H. E. AND CONRAD, H. 5. The growth and decline of intelligence: a study of a homogeneous group between the ages of ten and sixty. Genet. Psychol. Monogr., 1933, 13, N O . 3, 223-298.
4. JURQENSEN, C. E. Selectedfactors whichinfluence job preferences. J . a p p l . Psychol., 1947, 31, 553-564.

342 MARGUERITE S. GADEL
5. KOSSORIS, M. D. Absenteeism and injury experience of older workers. Monthly Labor Review, 1948,67, No. 1, 16-19.
6. MILES, C. C. AND MILES, W. R. The correlation of intelligence scores and chrono- logical age from early to late maturity. Amer. J . Psychol., 1932, 44, 44-78.
7. MILES, W. R. Age and human ability. Psychol. Rev., 1933,40, 99-123. 8 . MOSES, L. Non-parametric statistics for psychological research. Psychol. Bull.,
9. SCHENET, N. G. An analysis of absenteeism in one war plant. J . app l . Psychol., 1952, 49, 122-143.
1945, aS, 27-39.