Embed Size (px)
Citation preview

Loughborough UniversityInstitutional Repository
Production of food-grademultiple emulsions with highencapsulation yield usingoscillating membrane
emulsi�cation
This item was submitted to Loughborough University's Institutional Repositoryby the/an author.
Citation: VLADISAVLJEVIC, G.T. ... et al., 2014. Production of food-grademultiple emulsions with high encapsulation yield using oscillating membraneemulsi�cation. Colloids and Surfaces A: Physicochemical and Engineering As-pects, 458, pp.78-84.
Additional Information:
• This article was published in the journal, Colloids and Surfaces A: Physic-ochemical and Engineering Aspects [ c© Elsevier B.V.] and the de�nitiveversion is available at: http://dx.doi.org/10.1016/j.colsurfa.2014.05.011
Metadata Record: https://dspace.lboro.ac.uk/2134/14658
Version: Accepted for publication
Publisher: c© Elsevier B.V.
Please cite the published version.

This item was submitted to Loughborough’s Institutional Repository (https://dspace.lboro.ac.uk/) by the author and is made available under the
following Creative Commons Licence conditions.
For the full text of this licence, please go to: http://creativecommons.org/licenses/by-nc-nd/2.5/

1
Production of food-grade multiple emulsions with high encapsulation yield using
oscillating membrane emulsification
Goran T. Vladisavljević1,2*, Bing Wang1,3, Marijana M. Dragosavac1 and Richard G.
Holdich1
1Chemical Engineering Department, Loughborough University, Loughborough LE11 3TU,
UK. 2Laboratory of Chemical Dynamics, Vinča Institute of Nuclear Sciences, PO Box 522, 11001
Belgrade, Serbia. 3Technology Centre, Zhejiang Xinan Chemical Industrial Group Co., Ltd, 7 Shihuiba,
Gongshu District, Hangzhou, 310014 Zhejiang, P.R.China.
*: To whom correspondence should be addressed: [email protected]
Tel: + 44 (0) 1509 222518; Fax: + 44 (0) 1509 223923
Abstract
Food-grade water-in-oil-in-water (W/O/W) multiple emulsions with a volume median
diameter of outer droplets of 50−210 μm were produced by injecting a water-in-oil (W/O)
emulsion at the flux of 30 L m−2 h−1 through a 10-μm pore electroplated nickel membrane
oscillating at 10−90 Hz frequency and 0.1−5 mm amplitude in 2 wt% aqueous Tween® 20
(polyoxyethylene sorbitan monolaurate) solution. The oil phase in the primary W/O emulsion
was 5 wt% PGPR (polyglycerol polyricinoleate) dissolved in sunflower oil and the content of
water phase in the W/O emulsion was 30 vol%. The size of outer droplets was precisely
controlled by the amplitude and frequency of membrane oscillation. Only 3−5 % of the inner
droplets with a mean diameter of 0.54 µm were released into the outer aqueous phase during
membrane emulsification. A sustained release of 200 ppm copper (II) loaded in the inner
aqueous phase was investigated over 7 days. 95% of Cu(II) initially present in the inner water
phase was released in the first 2 days from 56-µm diameter multiple emulsion droplets and
less than 15 % of Cu(II) was released over the same interval from 122 µm droplets. The
release rate of Cu(II) decreased with increasing the size of outer droplets and followed non-
zero-order kinetics with a release exponent of 0.3−0.5. The prepared multiple emulsions can

2
be used for controlled release of hydrophilic actives in the pharmaceutical, food, and
cosmetic industry.
Key words
Multiple emulsion • Oscillating membrane • Sustained release • Membrane emulsification •
Microencapsulation.
1. Introduction
A water-in-oil-in-water (W/O/W) multiple emulsion is a three-liquid-phase system consisting
of aqueous phase droplets dispersed within larger oil droplets, which are themselves
dispersed in another aqueous phase [1]. Due to their hierarchical organisation and multi-
compartmental structure, multiple emulsions may find useful applications in various fields,
such as particle synthesis [2], microencapsulation [3], sustained release [4], separation
processes [5], and formulation of low-fat food products [6]. W/O/W emulsions are usually
prepared via a two-step emulsification process using two sets of surfactants. First, W/O
emulsion is formed under high-shear conditions in the presence of hydrophobic surfactant(s)
dissolved in the oil phase, whereas the second step is carried out in the presence of
hydrophilic surfactant(s) dissolved in the outer aqueous phase and under low shear stress to
minimise the release of inner water droplets. Conventional emulsification devices usually
lead to highly polydisperse outer droplets and/or low yields of inner droplets.
Multiple emulsions with monodispersed outer droplets and 100 % yield of inner droplets can
be prepared using microfluidic strategies, for example using a T-junction or hydrodynamic
flow focusing [7, 8]. Furthermore, microfluidic approaches enable control over the internal
structure of multiple emulsion and can be used for single-step generation of core-shell
droplets [9], high-order multiple emulsion droplets (triple, quadruple, and quintuple)
containing multiple concentric shells [10], multiple emulsion droplets with a controlled
number of inner droplets [11], and multiple emulsion droplets containing two distinct types of
inner droplets [12]. However, microfluidic channels suffer from wetting and clogging
problems and the flow rates of the dispersed phase are very low, typically 0.01−10 ml h-1.
Droplet throughput can be improved by injecting a dispersed phase through silicon
microchannel arrays consisting of hundreds of thousands of parallel microchannels [13, 14].

3
W/O/W emulsions were also prepared by passing a W/O/W pre-emulsion through a
microporous glass membrane multiple times [15, 16] or injecting a W/O emulsion through
membrane into an agitating [17-18] or recirculating [19] continuous phase liquid. Membrane
emulsification devices and processes have been recently reviewed by several authors [20, 21,
8]. Although shear stress on the membrane surface in these methods is very low, the droplets
can be disrupted during prolonged recirculation or agitation. Breakage of droplets in the
product stream can be minimised by delivering the continuous phase in pulsed cross flow
[22] or using rotating membrane [23], which eliminates the need for recirculating or agitating
the product.
Pawlik and Norton [24] prepared food grade W/O/W emulsions using three different
techniques: SPG cross-flow membrane, SPG rotating membrane and high-shear mixer. The
emulsions prepared using the rotating membrane released only small amounts of sodium
chloride from the inner droplets (up to 1.2%) during the emulsification process compared to
the high-shear mixer (up to 2.8% for 10 min mixing) and the cross-flow membrane (up to
7.5% for 45 min recirculation). The amount of salt released during storage was also found to
depend on the emulsification technique (8–20% for the cross-flow membrane, 13% for the
high-shear mixer and 8% for the rotating membrane). Schuch et al. [25] compared production
of W/O/W emulsions in rotor-stator devices (colloid mill and tooth rim dispersing machine),
high pressure homogenizers (standard and modified) and high-shear rotating membrane
device with stainless steel wire mesh membrane. The encapsulation efficiency of inner
droplets, measured by differential scanning calorimetry (DSC), was found to predominantly
depend on the size of the outer oil drops: the bigger the oil drops in W/O/W emulsions, the
higher the measured encapsulation efficiency. Multiple emulsions with comparable oil drop
sizes produced with different devices showed very similar encapsulation efficiency [25].
In this work, we have used a novel membrane emulsification strategy for production of
W/O/W emulsion based on injection of W/O emulsion through oscillating nickel membrane.
In this process, shear stress is generated on the membrane/product interface, but not in the
bulk of the product stream, which preserves the integrity of multiple emulsion droplets after
formation and leads to high yields of inner droplets. Another advantage of oscillating
membrane over stirred and cross-flow emulsification systems is that it can easily be scaled up
because the droplet size is independent on the system geometry.

4
2. Experimental
2.1 Materials
The oil phase in W1/O/W2 emulsions was 5 wt% PGPR (polyglycerol polyricinoleate, Stepan
UK Ltd, Stalybridge) dissolved in refined sunflower oil with a density and viscosity at 25 °C
of 915 kg m-3 and 51 mPa⋅s, respectively. The inner aqueous phase (W1) was 0.9 wt% NaCl
solution, which was isotonic with human blood serum and the content of inner aqueous phase
in the oil phase was 30 vol%. The outer aqueous phase (W2) was 2 wt% Tween® 20
(polyoxyethylene sorbitan monolaurate, Fluka, UK) containing 0.9 wt% NaCl to counteract
the osmotic pressure in the inner droplets and provide osmotic equilibrium. The density and
viscosity of the outer aqueous phase at 25 °C were 1000 kg m-3 and 1.01 mPa⋅s, respectively
and the interfacial tension at the interface between the outer aqueous phase and W/O
emulsion was 0.83 mN m-1. In the controlled release experiments, NaCl from the inner water
phase was replaced by 2000 ppm CuSO4 (Fisher Scientific, UK). Cu(II) in the form of copper
sulphate (Fisher Scientific, UK). Cu(II) was used as a marker, because Cu(II) concentration
in aqueous phase was measured by atomic adsorption spectroscopy down to parts per billion,
so that even the smallest changes in the released Cu(II) could be detected.
2.2 Oscillating membrane emulsification rig
Oscillating membrane emulsification system (Micropore Technology Ltd, Hatton, England)
used in this work is shown in Figure 1. The membrane used was a nickel membrane
containing spatially regular hexagonal array of cylindrical pores with a diameter of dp =
10 μm and interpore distance of L = 200 μm, fabricated by galvanic deposition of nickel onto
a microfabricated template. The membrane porosity was 0.2 %, as calculated from the
equation [26]:
2
32
=
Ld pπε (1)
The membrane was in the form of a vertical hollow tube with a conical stainless steel bottom,
used to reduce turbulence during oscillation. The outside diameter and height of the
5
membrane tube was 15 and 57 mm, respectively. At the top of the membrane tube there was a
1/8 inch BSP fitting to enable the tube to be attached to the inlet manifold. The oscillation
signal was generated by an audio generator (Rapid Electronics), which fed a power amplifier
driving the electro-mechanical oscillator on which the inlet manifold was mounted. The
frequency and amplitude of the oscillation were determined by a PCB Piezotronics analogue
accelerometer (M352C65) attached to the inlet manifold. The accelerometer was connected to
a National Instruments analogue-to-digital converter (NI eDAQ-9172) interfaced to a
LabView executable program, which was used to analyse the output signal from the
accelerometer.
Figure 1. Schematic view of the experimental setup for oscillating membrane emulsification.
A magnified detail at the top right corner is the membrane tube with optical micrograph of
the membrane surface. The inset in the top left corner shows temporal variations of the shear
stress on the membrane surface at 10 and 40 Hz and amplitude of 5.0 and 0.6 mm,
respectively over 100 ms. The peak shear stress was 2.5 Pa in both cases.
2.3 Procedure
W1/O/W2 emulsions were prepared by a two-step emulsification procedure. The primary
(W1/O) emulsion was produced using a homogeniser (Ultra Turrax®, model T25, IKA Works,
USA) at 24,000 rpm for 5 min, which resulted in the mean diameter of water droplets of 0.54
µm. If the pore diameter of the membrane is equal to or smaller than the diameter of the
water particles, the water particles will be rejected by the membrane so that it will be
impossible to obtain a W/O/W emulsion [27]. In this case, the maximum size of the water

6
droplets was one order of magnitude smaller than the pore size. The W1/O emulsion was then
injected through the membrane (pre-soaked in a wetting agent for at least 30 min to increase
the hydrophilicity of the surface) using a Harvard Apparatus model 11 Plus syringe pump.
The transmembrane flux in all experiments was 30 L m−2 h−1 and the final concentration of
W1/O emulsion in W1/O/W2 emulsion was 5 vol%. Once the desired amount of the W1/O
emulsion had passed through the membrane both the pump and the oscillator were switched
off and the droplets were collected and analysed. The membrane was cleaned with 8 M
NaOH in an ultrasonic bath for 5 min followed by treatment in 10 vol% HCl solution for
5 min. To evaluate the drop-size distribution and droplet diameter, a laser diffraction particle
size analyzer (Malvern Mastersizer, Model S) was used. For each emulsion, three separate
samples and measurements were performed and the arithmetic mean of these was reported.
The mean particle size was expressed as the volume median diameter d(v,0.5), which is the
diameter corresponding to 50 vol% on the cumulative distribution curve. The relative span of
a drop size distribution was used to express the degree of drop size uniformity:
span=[d(v,0.9)−d(v,0.1)]/d(v,0.5). The micrograph of membrane surface was taken using a
Leitz Ergolux optical microscope, whereas the micrographs of emulsion droplets were taken
using Medline Scientific microscope in the reflected light mode. The entrapment efficiency
and the release rate of copper (II) were measured using disposable centrifugal ultrafiltration
(UF) unit (Vivaspin 6, Sartorius AG, Goettingen, Germany) to separate the droplets from the
continuous phase and then Atomic Absorbance Spectrometry (using Spectra AA-200 Varian,
UK) to analyse the filtrate. Centrifugal separation was performed at 1300 rpm for 40 min
using a Heraeus Labofuge 400R centrifuge (Thermo Scientific, Germany) and the
polyethersulfone membrane used to separate the droplets from the continuous phase had a
mean pore size of 0.2 µm. The operating parameters used in the range of Cu(II) concentration
of 0.03−10 ppm were: wavelength = 324.7 nm, slit width = 0.2 nm and fuel = acetylene.
The entrapment efficiency (EE) of Cu(II) was defined as a mass of Cu(II) entrapped in
multiple emulsion droplets immediately after the emulsification process (at t=0) divided by
the total mass of Cu(II) added to the inner water phase, Mi:
i
i
MMM
EE 0
added Cu(II) of mass0at t released Cu(II) of mass added Cu(II) of mass −=
=−= (2)

7
where M0 is the mass of Cu(II) released at t=0. The mass of Cu(II) added to the inner water
phase is given by:
wowwowwoii VCM φφ= (3)
where Ci is the initial concentration of Cu(II) in the inner water phase, Vwow is the volume of
the W1/O/W2 emulsion produced, φwo is the volume fraction of the water phase in the W1/O
emulsion, and φwow is the volume fraction of the W1/O emulsion in the W1/O/W2 emulsion.
Neglecting the change in the volume of the outer water phase as a result of expulsion of the
inner droplets, the mass of Cu(II) released at t=0 is given by:
)(VCM wowwow φ−= 100 (4)
where C0 is the concentration of Cu(II) in the outer water phase at t=0. The substitution of
Equations (3) and (4) into Equation (2) gives:
wowow
wow
iCC
EEφφφ−
−=1
1 0 (5)
In this work, Ci = 2000 ppm, φwo=0.3, and φwow=0.05. The release profile of Cu(II) from the
inner droplets was monitored by measuring the concentration of Cu(II) in the permeate after
incubation of the emulsion at room temperature for a specific time period and centrifugal
separation. The maximum concentration of Cu(II) in the permeate corresponding to infinitely
long release time was C∞ = 31.6 ppm, calculated from Equation (5) as C0 value for EE = 0.
3. Results and Discussion
3.1 Influence of parameters of membrane oscillation on droplet size
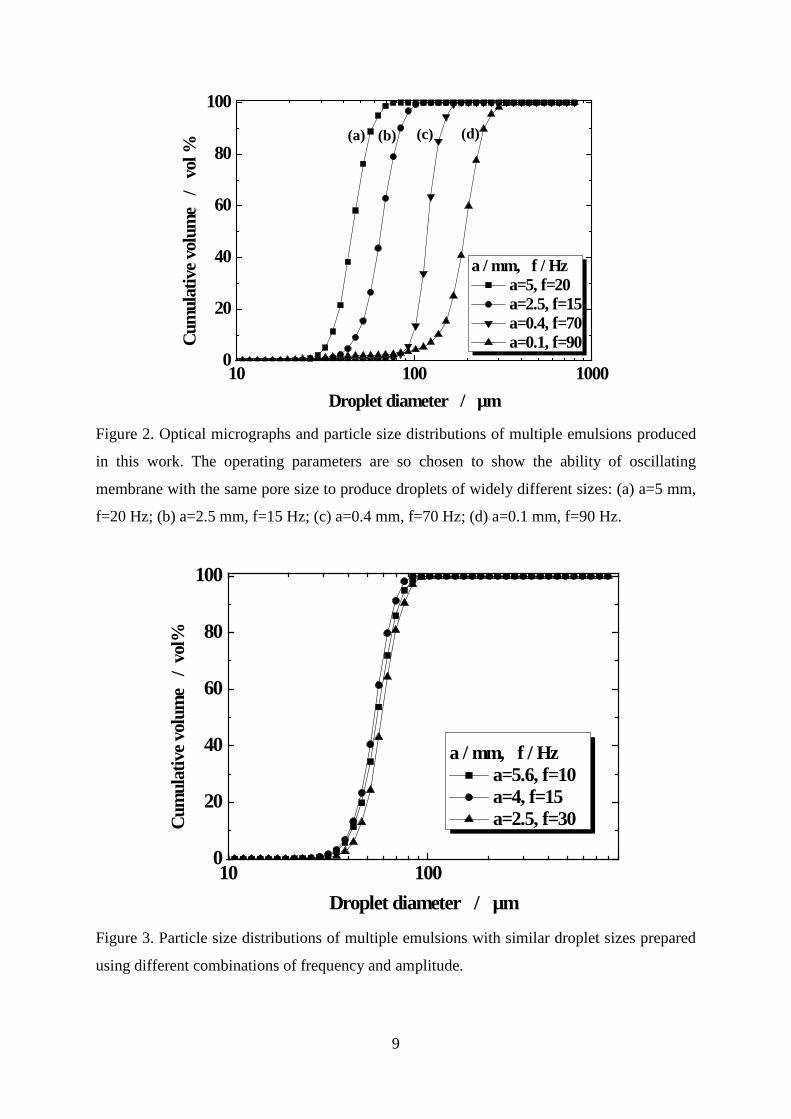
Figures 2 and 3 show the influence of amplitude and frequency of membrane oscillation on
the size of multiple emulsion droplets produced. As shown in Figure 2, the size of outer
droplets was varied from 50 to 212 µm by using different combinations of amplitude and
frequency. Therefore, the droplet size can be controlled without interrupting the process and

8
replacing the membrane. Although the droplets were not monodispersed, a relative span of
the particle size distribution of 0.36−0.56 was comparable to what was achieved in cross-flow
SPG membrane emulsification [28, 29]. The ratio of the droplet size to the pore size of 5−21
is greater than 3−4, found when using Shirasu Porous Glass (SPG) membrane in the dripping
regime [19, 28]. It can be explained by non-spherical tortuous pores of SPG membrane [29-
30], causing a droplet to strongly deform before detachment and providing additional droplet
detaching force based on the system's tendency to lower its interfacial free energy [31-32].
Another reason for high droplet-to-pore size ratio observed for nickel membrane is a high
velocity of the dispersed phase in the pores due to low membrane porosity, which leads to
dripping-to-jetting transition at the lower transmembrane flux than for SPG membrane of the
same pore size. The membrane used in this work had a porosity of only 0.2 %, while SPG
membrane has the porosity between 50 and 60 % [30].
9
Figure 2. Optical micrographs and particle size distributions of multiple emulsions produced
in this work. The operating parameters are so chosen to show the ability of oscillating
membrane with the same pore size to produce droplets of widely different sizes: (a) a=5 mm,
f=20 Hz; (b) a=2.5 mm, f=15 Hz; (c) a=0.4 mm, f=70 Hz; (d) a=0.1 mm, f=90 Hz.
10 1000
20
40
60
80
100
Cum
ulat
ive v
olum
e /
vol
%
Droplet diameter / µm
a / mm, f / Hz a=5.6, f=10 a=4, f=15 a=2.5, f=30
Figure 3. Particle size distributions of multiple emulsions with similar droplet sizes prepared
using different combinations of frequency and amplitude.
10 100 10000
20
40
60
80
100
Cum
ulat
ive v
olum
e /
vol
%
Droplet diameter / µm
a / mm, f / Hz a=5, f=20 a=2.5, f=15 a=0.4, f=70 a=0.1, f=90
(a) (b) (c) (d)

10
In oscillating membrane emulsification, there are two independent parameters affecting shear
stress on the membrane surface: frequency and amplitude of the membrane oscillation. In
order to produce emulsions with the same particle size distribution, the higher amplitude must
be offset by the lower frequency and vice versa (Figure 3). Therefore, the droplet size in
oscillating membrane emulsification is not determined by individual values of the frequency
or amplitude but a combination of both values. Oscillating membrane system provides a
higher degree of control over the droplet size than in a cross-flow, stirred cell or rotating
membrane system, where there is only one hydrodynamic parameter that can be used to
adjust shear stress (cross flow velocity, stirrer speed or membrane rotation speed).
In the dripping regime the diameter x of outer droplets is determined by the balance between
the shear force pulling a droplet tangentially along the membrane surface and the interfacial
tension force resisting that motion. In equilibrium [33]:
max
22max
244max
22max
3
481218
τ
γτττ ppp rrrx
++= (6)
where rp is the pore radius, τmax is the peak shear stress on the membrane surface and γ is the
interfacial tension between the outer aqueous phase and the oil phase. Eq. (6) is valid for the
zero inertial force of the dispersed phase, i.e. for low velocities of the dispersed phase in the
pores. The peak shear stress is the maximum value of the shear stress given by [34]:
2/32/12/3
max )()2( afaqaqρµπτ = (7)
where a and f is the amplitude and frequency and µaq and ρaq is the viscosity and density of
the outer aqueous phase. Eq. (7) indicates that the same τmax value can be obtained for any
pair of a and f values that satisfy the condition: a2/a1 =(f1/f2)3/2. Therefore, the effect of higher
frequency can be counterbalanced by decreasing amplitude, as shown in Figure 3.
Figure 4 shows the volume median diameter as a function of the peak shear stress on the
membrane surface for O/W and W/O/W emulsions prepared at different frequencies ranging
from 10 to 40 Hz. The lines in Figure 4 are model curves constructed using Eqs. (6) and (7).
A droplet should experience at least one peak shear event during formation on the membrane

11
surface for the model to be applicable. Since there are 2/f peak shear events per oscillation,
the droplet formation time should be greater than 50 and 12.5 ms at f = 10 and 40 Hz,
respectively. The droplet formation time depends on the percentage of active pores. The
higher the percentage of active pores, the smaller the velocity of the dispersed phase in the
pores and the longer the droplet formation time becomes. The percentage of active pores can
only be determined by microscopic observation of the membrane surface [30] and therefore,
it was unknown in this work. For f = 40 Hz and d(v,0.5) = 50 µm (the smallest droplet size in
Figure 4), the droplet formation time was estimated to be more than 20 ms for the percentage
of active pores of 10% and 12.5 ms for the percentage of active pores of 6%.
As shown in Figure 4, the droplet size decreased with increasing the peak shear stress, which
is a type of behaviour observed in all membrane emulsification systems (cross flow, pulsed
cross flow, stirred cell, and spinning membrane). It can be seen that the droplets with
different diameters were produced at the same frequency, which was due to different peak
shear stresses imposed on a droplet by using different amplitudes. The droplet size reached a
minimum limiting value at the shear stress of about 5 Pa indicating that the peak shear stress
does not need to be above 5 Pa. The model predicted the size of O/W droplets very well, but
underestimated the size of W/O/W droplets, which could be explained by partial wetting of
the membrane surface, due to presence of PGPR and inner water phase in the oil phase. As a
result of membrane wetting, the dispersed phase was not held in the pore areas, but spread
over the larger area around a pore. However, the span of the particle size distribution was
similar to that for O/W emulsions produced in the same oscillating membrane device [34].

12
1 2 3 4 5 6 7 80
50
100
150
200
250 Frequencies / HzW1/O/W2
10 15 20 30 40 O/W
10 15 20 30 40 Model, γ=0.83 mN m-1 Model,γ=5 mN m-1
d(v,
0.5)
/
µm
τmax / Pa
Figure 4. The volume median diameter as a function of the peak shear stress at the membrane
surface for O/W and W/O/W emulsions prepared at different frequencies. The solid and
dashed line is a model curve for O/W and W/O/W emulsions, respectively, constructed using
Eqs. (1) and (2). For O/W emulsion γ = 5 mN m-1 and for multiple emulsion γ = 0.83 mN m-1.
3.2 Controlled release from the prepared multiple emulsions
The entrapment efficiency of Cu(II) under different experimental conditions was calculated
using Equation (5) and expressed as a percentage. As shown in Figure 5, the entrapment
efficiency of Cu(II) ranged from 95 to 97 % and increased with increasing the Sauter mean
diameter of outer droplets in the range from 56 to 122 µm. The release of copper (II) during
membrane emulsification was probably due to the release of inner water droplets, because
emulsification time was only several minutes. The maximum shear stress at the membrane
surface led to the smallest multiple emulsion droplets and caused the maximum release of the
marker, which corresponds well with previous findings obtained in the Dispersion Cell [17]
and rotating membrane emulsification [25].

13
Figure 5. The entrapment efficiency of Cu(II) in the prepared multiple emulsions as a
function of Sauter mean diameter of outer droplets.
The relative amount of Cu(II) released from the inner droplets at time t was calculated using
the following equation:
0
0
0
0
0
0
1 C)]/([CCC
CCCC
MMMM
Rwowwowowi
tt
i
t
−−−
=−−
=−−
=∞ φφφ
(8)
where Mt is the mass of Cu(II) released at time t, and Ct and C∞ is the concentration of Cu(II)
present in the outer water phase after the incubation period of t and ∞, respectively. Figure 6
shows the percentage of copper (II) released from the oil droplets (R×100) during stationary
storage at room temperature as a function of the Sauter mean diameter of the outer droplets.
Although phase separation (creaming) observed during storage, the oil droplets did not
coalesce. The release of Cu(II) followed non-zero-order kinetics with the release rate
decreasing with time according to the Korsmeyer-Peppas model [35]: Ct/C∞ = Ktn, where K is
the release rate constant and n is the release exponent. To find n value, the portion of the
release curve where Ct/C∞ < 0.6 should only be used. Due to limited number of data points
that satisfy this condition, the release exponent could not be determined very accurately. The
values of n were found to range from 0.3 to 0.5 for different curves in Figure 6. It should be
noted that n=0.5 corresponds to Fickian diffusion mechanism. The release rate was higher for

14
smaller outer droplets, due to higher interfacial area per unit volume, as would be expected
for the transfer by molecular diffusion. The maximum amount of Cu(II) released into the
outer aqueous phase was 95.3−96.0 % and was achieved after 2−6 days for the emulsions
with d3,2 = 53−68 µm. The remaining 4-4.7% of Cu(II) was captured within the droplets and
could not be released, probably because the recovery yield of C(II) from the aqueous phase
was less than 100%. The recovery yield was defined by Regan and Mulvihill [36] as the
concentration of marker in the aqueous phase recovered from an emulsion that has been
separated into a cream layer and an aqueous phase by centrifugation relative to the
concentration of marker present in (or added to) the outer aqueous phase after emulsion
preparation. In addition, Cu(II) could react with free fatty acids from sunflower oil to form
copper salts of fatty acids (soaps). The copper oleate was synthesised by reacting Cu(II) with
sodium oleate in the mixture of ethanol, distilled water and hexane at 70 °C [37]. Although in
this work emulsions were stored at room temperature and sunflower oil differs from the
above mentioned solvent mixture, the formation of copper soups cannot be fully excluded.
Figure 6 shows that the emulsion with the biggest droplets (d2,3=122 µm) prepared by
imposing the minimum shear stress on the membrane surface released the lowest amount of
Cu(II), only 22 % after one week.
Figure 6. The amount of copper(II) released from multiple emulsions during incubation at
room temperature as a function of the Sauter mean diameter d3,2 of outer droplets.
0 1 2 3 4 5 6 7 8 9 100
20
40
60
80
100
d3,2 / µm
53 56 68 87 107 108 122
Cum
ulat
ive %
of C
u(II
) rele
ased
Time / days

15
3.3 Comparison of different emulsification methods
In Figure 7, particle size distribution curves and optical micrographs of multiple emulsions
were compared for the following three emulsification methods: (a) Ultra Turrax at 2000 rpm
for 60 s, (b) magnetic stirrer at 1760 rpm for 300 s, and (c) oscillating membrane at a = 0.4
mm and f = 70 Hz. The multiple emulsion produced by Ultra Turrax had a bimodal
distribution with the first peek between 0.1 and 1 µm and the second peak between 10 and 30
µm. Small micron-sized droplets and large 10-µm droplets are noticeable in the micrograph
in the upper left corner of Figure 7. The droplets produced by magnetic stirrer and oscillating
membrane had very similar mean droplet size (111 and 122 µm), but the oscillating
membrane system produced more uniform droplets then magnetic stirrer. The encapsulation
efficiency, EE, for the emulsion with d3,2 = 111 μm prepared using magnetic stirrer was 96%,
as compared to the EE of just over 97% for the emulsions with d3,2 = 122 μm prepared using
oscillating membrane at 0.4 mm amplitude and 70 Hz frequency. These results confirm
previous findings that W/O/W emulsions with comparable oil drop sizes produced with
different emulsification devices give approximately the same EE [25]. The EE was 70 % for
the homogenisation process performed with Ultra Turrax® at 11,000 rpm for 300 s, but the
EE was improved to 93 % when the mixing time was decreased to 10 s at 11,000 rpm.

16
Figure 7. Optical micrograph and particle size distribution of multiple emulsions produced
using three different emulsification methods: (a) Ultra Turrax at 2000 rpm for 60 s; (b)
Magnetic stirrer at 1760 rpm for 300 s; (c) Oscillating membrane at a=0.4 mm and f = 70 Hz.
The same scale bar applies to micrographs (a), (b), and (c).
Conclusions
Multiple emulsions with high entrapment efficiency of hydrophilic marker (copper salt) of
95−97 % and narrow particle size distribution (span = 0.36−0.56) were produced using
oscillating membrane emulsification. High encapsulation efficiency of the marker was
attributed to low shear stresses imposed in the bulk of the continuous phase during membrane
oscillations. Multiple emulsions with the biggest outer droplets released the smallest amount
of marker (less than 3%) from the inner droplets during the emulsification process. The size
of outer droplets was precisely controlled by the two membrane oscillation parameters:
(a)
0.1 1 10 1000
20
40
60
80
100
Cum
ulat
ive v
olum
e /
vol
. %
Droplet diameter / µm
Stirrer Ultra Turrax
Oscillating system
(b) (c)
Stirrer bar
100 µm
17
frequency and amplitude that can be changed independently and used to calculate the peak
shear stress on the membrane surface, a single parameter that determines the droplet size. The
droplet size was found to decrease with increasing the peak shear stress, irrespectively of the
individual values of frequency or amplitude. The force balance model predicted well the size
of single emulsion droplets, but underestimated the size of multiple emulsion droplets. The
release of copper (II) from inner water droplets was characterised by an initial burst, which
can be attributed to the release of inner droplets into the outer aqueous phase during
membrane emulsification, followed by a sustained release during storage as a result of
molecular diffusion through the oil phase. The rate of copper release decreased with
increasing the droplet size and followed non-zero-order kinetics with a release exponent
ranging between 0.3 and 0.5.
References
[1] N. Garti, C. Bisperink, Double emulsions: Progress and applications, Curr. Opin.
Colloid Interface Sci. 3 (1998) 657−667.
[2] H.Y. Koo, S.T. Chang, W.S. Choi, J.H. Park, D.Y. Kim, O.D. Velev, Emulsion-based
synthesis of reversibly swellable, magnetic nanoparticle-embedded polymer
microcapsules, Chem. Mater. 18 (2006) 3308–3313.
[3] M.E. Rodríduez-Huezo, R. Pedroza-Islas, L.A. Prado-Barragán, C.I. Beristain, E.J.
Vernon-Carter, Microencapsulation by spray drying of multiple emulsions containing
carotenoids, J. Food Sci. 69 (2004) 351–359.
[4] N. Jager-Lezer, I. Terrisse, F. Bruneau, S. Tokgoz, L. Ferreira, D. Clausse, M. Seiller,
J.L. Grossiord, Influence of lipophilic surfactant on the release kinetics of water-
soluble molecules entrapped in a W/O/W multiple emulsion, J. Controlled Release 45
(1997) 1–13.
[5] J. Draxler, W. Fürst, R. Marr, Separation of metal species by emulsion liquid
membranes, J. Membr. Sci. 38 (1988) 281–293.
[6] J. Surh, G.T. Vladisavljević, S. Mun, D.J. McClements, Preparation and
characterization of water/oil and water/oil/water emulsions containing biopolymer-
gelled water droplets, J. Agric. Food Chem. 55 (2007) 175–184.

18
[7] G.T. Vladisavljević, N. Khalid, M.A. Neves, T. Kuroiwa, M. Nakajima, K. Uemura, S.
Ichikawa, I. Kobayashi, Industrial lab on a chip: design, applications and scale up for
drug discovery and delivery, Adv. Drug Delivery Rev. 65 (2013) 1626–1663.
[8] G.T. Vladisavljević, I. Kobayashi, M. Nakajima, Production of uniform droplets using
membrane, microchannel and microfluidic emulsification devices, Microfluid.
Nanofluid. 13 (2012) 151−178.
[9] G.T. Vladisavljević, H.C. Shum, D.A. Weitz, Control over the shell thickness of
core/shell drops in three-phase glass capillary devices, Prog. Colloid Polym. Sci. 139
(2012) 115−118.
[10] A.R. Abate, D.A. Weitz, High-order multiple emulsions formed in
poly(dimethylsiloxane) microfluidics, Small 5 (2009) 2030–2032.
[11] L.Y. Chu, A.S. Utada, R.K. Shah, J.W. Kim, D.A. Weitz, Controllable monodisperse
multiple emulsions, Angew. Chem. Int. Ed. 46 (2007) 8970–8974.
[12] B.J. Sun, H.C. Shum, C. Holtze, D.A. Weitz, Microfluidic melt emulsification for
encapsulation and release of actives, ACS Appl. Mater. Interfaces 2 (2010) 3411–
3416.
[13] I. Kobayashi, X. Lou, S. Mukataka, M. Nakajima, Preparation of monodisperse water-
in-oil-in-water emulsions using microfluidization and straight-through microchannel
emulsification, J. Am. Oil Chem. Soc. 82 (2005) 65–71.
[14] I. Kobayashi, M.A. Neves, Y. Wada, K. Uemura, M. Nakajima, Large microchannel
emulsification device for mass producing uniformly sized droplets on a liter per hour
scale, Green Process. Sci. 1 (2012) 353–362.
[15] G.T. Vladisavljević, M. Shimizu, T. Nakashima, Preparation of monodisperse multiple
emulsions at high production rates by multi-stage premix membrane emulsification, J.
Membr. Sci. 244 (2004) 97–106.
[16] G.T. Vladisavljević, M. Shimizu, T. Nakashima, Production of multiple emulsions for
drug delivery systems by repeated SPG membrane homogenization: Influence of mean
pore size, interfacial tension and continuous phase viscosity, J. Membr. Sci. 284 (2006)
373–383.
[17] M.M. Dragosavac, R.G. Holdich, G.T. Vladisavljević, M. Sovilj, Stirred cell
membrane emulsification for multiple emulsions containing unrefined pumpkin seed
oil with uniform droplet size, J. Membr. Sci. 392–393 (2012) 122–129.

19
[18] M.A. Suárez, G. Gutiérrez, J. Coca, C. Pazos, Geometric parameters influencing
production of O/W emulsions using flat metallic membranes and scale-up, J. Membr.
Sci. 430 (2013) 140–149.
[19] G.T. Vladisavljević, H. Schubert, Influence of process parameters on droplet size
distribution in SPG membrane emulsification and stability of prepared emulsion
droplets, J. Membr. Sci. 225 (2003) 15–23.
[20] F. Spyropoulos, D. Lloyd, R.D. Hancocks, A.K. Pawlik, Advances in membrane
emulsification. Part A: Recent developments in processing aspects and microstructural
design approaches, J. Food Sci. Eng. 94 (2014) 613−627.
[21] A. Nazir, K. Schroën, R. Boom, Premix emulsification: A review, J. Membr. Sci. 362
(2010) 1–11.
[22] R.G. Holdich, M. Dragosavac, G.T. Vladisavljević, E. Piacentini, Continuous
membrane emulsification with pulsed (oscillatory) flow, Ind. Eng. Chem. Res. 52
(2013) 507–515.
[23] G.T. Vladisavljević, R.A. Williams, Manufacture of large uniform droplets using
rotating membrane emulsification, J. Colloid Interface Sci. 299 (2006) 369–402.
[24] A.K. Pawlik, I.T. Norton, Encapsulation stability of duplex emulsions prepared with
SPG cross-flow membrane, SPG rotating membrane and rotor-stator techniques—A
comparison, J. Membr. Sci. 415–416 (2012) 459–468.
[25] A. Schuch, J. Wrenger, H.P. Schuchmann, Production of W/O/W double emulsions.
Part II: Influence of emulsification device on release of water by coalescence, Colloids
Surf., A, http://dx.doi.org/10.1016/j.colsurfa.2013.11.044.
[26] M.M. Dragosavac, M.N. Sovilj, S.R. Kosvintsev, R.G. Holdich, G.T. Vladisavljević,
Controlled production of oil-in-water emulsions containing unrefined pumpkin seed oil
using stirred cell membrane emulsification, J. Membr. Sci. 322 (2008) 178–188.
[27] Y. Mine, M. Shimizu, T. Nakashima, Preparation and stabilization of simple and
multiple emulsions using a microporous glass membrane, Colloids Surf., B 6 (1996)
261–268.
[28] G.T. Vladisavljević, H. Schubert, Preparation and analysis of oil-in-water emulsions
with a narrow droplet size distribution using Shirasu-porous-glass (SPG) membranes,
Desalination, 144 (2002) 167–172.
20
[29] G.T. Vladisavljević, M. Shimizu, T. Nakashima, Permeability of hydrophilic and
hydrophobic Shirasu-porous-glass (SPG) membranes to pure liquids and its
microstructure, J. Membr. Sci. 250 (2005) 69–77.
[30] G.T. Vladisavljević, I. Kobayashi, M. Nakajima, R.A. Williams, M. Shimizu, T.
Nakashima, Shirasu Porous Glass membrane emulsification: Characterisation of
membrane structure by high resolution x-ray microtomography and microscopic
observation of droplet formation in real time, J. Membr. Sci. 302 (2007) 243–253.
[31] S. Sugiura, M. Nakajima, S. Iwamoto, M. Seki, Interfacial tension driven
monodispersed droplet formation from microfabricated channel array, Langmuir 17
(2001) 5562–5566.
[32] M. Rayner, G. Trägårdh, C. Trägårdh, The impact of mass transfer and interfacial
expansion rate on droplet size in membrane emulsification processes, Colloids Surf., A
266 (2005) 1–17.
[33] E. Egidi, G. Gasparini, R.G. Holdich, G.T. Vladisavljević, S.R. Kosvintsev, Membrane
emulsification using membranes of regular pore spacing: Droplet size and uniformity
in the presence of surface shear, J. Membr. Sci. 323 (2008) 414–420.
[34] R.G. Holdich, M.M. Dragosavac, G.T. Vladisavljević, S.R. Kosvintsev, Membrane
emulsification with oscillating and stationary membranes, Ind. Eng. Chem. Res. 49
(2010) 3810–3817.
[35] R.W. Korsmeyer, R. Gurny, E. Doelker, P. Buri, N.A. Peppas, Mechanisms of solute
release from porous hydrophilic polymers, Int. J. Pharm. 15 (1983) 25–35.
[36] J. O’ Regan, D.M. Mulvihill, Water soluble inner aqueous phase markers as indicators
of the encapsulation properties of water-in-oil-in-water emulsions stabilized with
sodium caseinate, Food Hydrocolloids 23 (2009) 2339–2345.
[37] J.J. Wang, J.S. Hu, Y.G. Guo, L.J. Wan, Wurtzite Cu2ZnSnSe4 nanocrystals for high-
performance organic–inorganic hybrid photodetectors, NPG Asia Mater. 4 (2012) e2.