Embed Size (px)
Citation preview

Production and purification of the cellulase enzymatic
complex of Trichoderma reesei Rut-C30
Petar Keković
Thesis to obtain the Master of Science Degree in
Energy Engineering and Management
Supervisors: Prof. Luís Joaquim Pina da Fonseca
Prof. Rafał Janus
Examination Committee
Chairperson: Prof. Francisco Manuel da Silva Lemos
Supervisor: Prof. Luís Joaquim Pina da Fonseca
Member of the Committee: Prof. Pedro Carlos de Barros Fernandes
September 2016

2
Contents
Acknowledgements ................................................................................................................................. 5
Abstract (EN) ........................................................................................................................................... 6
Resumo (PT) ........................................................................................................................................... 7
Index ........................................................................................................................................................ 8
Index of Figures ................................................................................................................................... 8
Index of Tables .................................................................................................................................. 10
Nomenclature and abbreviations ....................................................................................................... 11
1. The biorevolution - creating a sustainable future .............................................................................. 12
1.1 Bioethanol - current development and future prospects .............................................................. 13
1.1.1 Bioethanol production from fermentation of biomass-based feedstock ................................ 13
1.1.2 Bioethanol properties and blending....................................................................................... 15
1.2 The Biorefinery concept and the circular economy ..................................................................... 15
2. Cellulases - structure and application ............................................................................................... 17
2.1 Cellulose structure and properties ............................................................................................... 17
2.2 Properties of cellulolytic enzymes - cellulolytic complex performance and production ............... 20
2.2.1 Fermentation operational conditions and fermentation types ............................................... 24
2.2.2 Cellulase recovery and purification ....................................................................................... 25
3. Trichoderma reesei - history of use and strain improvement ............................................................ 28
3.1. T. reesei cellulolytic system ........................................................................................................ 29
3.2 T. reesei RUT-C30 ....................................................................................................................... 30
4. Materials and Methods ...................................................................................................................... 32
4.1 Cellulase complex production ......................................................................................................... 32
4.1.1 Strain ..................................................................................................................................... 32
4.1.2 Culture media ........................................................................................................................ 32
4.1.2.1 Preculture media ................................................................................................................ 33
4.1.2.2 Main fermentation .............................................................................................................. 33
4.1.2.3 Variations ........................................................................................................................... 33
4.1.3. Sterilization of materials and equipment .............................................................................. 34
4.1.4 Production in shake flasks .................................................................................................... 34

3
4.1.4 Solid-state production ........................................................................................................... 35
4.1.5 Commercial cellulase ............................................................................................................ 36
4.2 Hydrolysis of lignocelulosic materials .......................................................................................... 36
4.2.1 Pretreatment of sugarcane bagasse ..................................................................................... 37
4.2.1.2 Delignification method ........................................................................................................ 37
4.2.2 Determination of unhydrolysed material fraction ................................................................... 38
4.3 Analytical techniques ................................................................................................................... 38
4.3.1 Determination of dry biomass content .................................................................................. 39
4.3.2 Determination of fermentable sugars concentration ............................................................. 39
4.3.3 Determination of enzymatic activity....................................................................................... 40
4.3.4 Determination of extracellular protein concentration............................................................. 40
4.4 Enzyme separation and purification techniques .......................................................................... 41
4.4.1 Centrifugation ........................................................................................................................ 41
4.4.2 Precipitation with Ammonium-sulphate ................................................................................. 41
4.4.3 Ultrafiltration .......................................................................................................................... 41
5. Results and Discussion ..................................................................................................................... 42
5.1 Production in shake flasks ........................................................................................................... 42
5.1.1. Effect of fermentation volume on Filter paper activity .......................................................... 43
5.1.2 Effect of different media on activity ....................................................................................... 45
5.1.3. Cellobiose and wheat bran as cellulase production inducers .............................................. 46
5.1.4. Effect of the addition of Tween 80 on enzymatic activity ..................................................... 47
5.1.5 Impact of fermentable sugar concentration on determining enzymatic activity in Filter paper
assay .............................................................................................................................................. 47
5.1.6 Specific activity of the enzymatic complex ............................................................................ 49
5.2 Sugarcane baggase hydrolysis kinetics....................................................................................... 50
5.3 Separation and purification of the enzymatic complex ................................................................ 52
5.3.1 Results of gel electrophoresis of extracellular proteins obtained during fermentation ......... 52
5.3.1 Precipitation with Ammonium-sulphate - results ................................................................... 53
5.3.2. Ultrafiltration results ............................................................................................................. 54
6. Conclusions ....................................................................................................................................... 56

4
7. Scope for future research .................................................................................................................. 57
References ............................................................................................................................................ 58
Websites: ........................................................................................................................................... 61
APPENDIX I .......................................................................................................................................... 62
Issues with determining cellulolytic activity ........................................................................................ 62
APPENDIX II ......................................................................................................................................... 64
Issues with contamination .................................................................................................................. 64
5
Acknowledgements
I would like to deeply thank my supervisors, Prof. Dr Luís Fonseca and Prof. Dr Rafał Janus for their
support and encouragement during the work on various parts of this thesis. Their presence was
fundamental in overcoming struggles and issues that emerged throughout the experimental work. My
appreciation goes also to the Institute for Bioengineering and Biosciences (IBB) of Instituto Superior
Técnico, as well as its staff and members.
My deep gratitude goes to Darlisson Alexandria, doctorand of University of São Paulo, Brazil, for his
selfless help and constructive advice in performing experiments related to this thesis.
I am very thankful to Prof. Dr M. Joana Neiva Correia and Prof. Dr Francisco Lemos from the
Department of Chemical Engineering of Instituto Superior Técnico for providing me with useful
samples, which gave my work an important practical dimension.
My work and studies abroad were possible due to the guidance and financial support of KIC
Innoenergy, and for this I am deeply appreciative. I am grateful to Prof. Dr Karol Sztekler and Prof. Dr
Fátima Montemor, KIC Innoenergy program supervisors, for being helpful and accessible in time of
need.
I wish to thank my flatmates, friends, and colleagues for the moral encouragement they provided.
Finally, my family's, especially my mother's, backing proved to be indispensable in my work.

6
Abstract (EN)
With growing emissions of greenhouse gasses as a result of burning fossil fuels, a cleaner, renewable
alternative is needed. Bioethanol, one of the most important biofuels, can partially or totally substitute
traditional fuels. Still, bioethanol production competes with the food industry since it relies on
feedstock used for food production. In order to enable the use of lignocelulose materials, the process
of hydrolysis should be improved. The main objective of this work consists of the implementation of
successful processes for production and purification of cellulase enzymatic complex of Tricodherma
reesei Rut-C30, and its possible use in the treatment of by-products and waste cellulose materials, in
particular waste paper and sugarcane bagasse.
The study of the production of the fungus Tricodherma reesei Rut-C30 and the synthesis of its
cellulase enzymatic complex will take place in shake flasks in submerged culture conditions. The
cellulases produced by this mutant strain are extracellular enzymes and have the advantage of their
biosynthesis not being repressed catabolically by high concentrations of glucose in the culture
medium. However, the levels of biosynthesis depend on the composition of other nutrients in the
culture medium, the presence of inductors, in particular, lactose and their fermentation conditions.
In this phase of the work will seek to optimize the various effects on cell growth and on activation of
specific metabolic pathway involved in biosynthesis of the enzymatic complex of cellulase.
The use of raw materials of low economic value, in particular of cellulosic material hydrolysis products
and their derivatives as carbon sources and inductors in the culture medium, can be beneficial in
cases of "fed-batch" and continuous processes.
The analysis of nutrient consumption, production of the fungus, the biosynthesis of enzyme complex of
cellulase and other relevant data of the fermentation will be investigated in order to establish a
strategy for protein synthesis, and starting enzymatic cellulase complex purification at the fermentation
level.
Key words: Cellulase; Bioethanol; Trichoderma reesei RUT-C30; Bagasse, sugarcane
7
Resumo (PT)
Com o crescimento das emissões de gases de efeito estufa, como resultado da queima de
combustíveis fósseis, um produto de limpeza, é necessário alternativa renovável. Bioetanol, um dos
biocombustíveis mais importantes, pode, em parte ou totalmente substituir os combustíveis
tradicionais. Ainda assim, a produção de bioetanol compete com a indústria de alimentos, uma vez
que se baseia em matéria-prima utilizada para a produção de alimentos. A fim de permitir o uso de
materiais de lignocelulose, o processo de hidrólise deve ser melhorada. O objetivo principal deste
trabalho consiste na implementação de processos bem sucedidos para produção e purificação do
complexo de celulase enzimática de Tricodherma reesei Rut-C30, e seu possível uso no tratamento
de subprodutos e materiais de celulose resíduos, em particular resíduos de papel e de cana bagaço.
O estudo da produção do fungo Tricodherma reesei Rut-C30 e a síntese enzimática do seu complexo
de celulase será realizado em frascos de agitação em condições de cultura submersa. As celulases
produzidas por esta estirpe mutante são enzimas extracelulares e tem a vantagem de a sua
biossíntese não ser reprimido catabolically por altas concentrações de glucose no meio de cultura. No
entanto, os níveis de biossíntese dependem da composição de outros nutrientes no meio de cultura,
na presença de indutores, em particular, a lactose e a sua fermentação condições.
Nesta fase do trabalho irá procurar optimizar os diversos efeitos sobre o crescimento celular e na
activação da via metabólica específica envolvida na biossíntese do complexo enzimático de celulase.
A utilização de matérias-primas de baixo valor económico, em particular de produtos de hidrólise de
material celulósico e seus derivados como fontes de carbono e indutores no meio de cultura, pode ser
benéfico em casos de "fed-batch e contínuos" processos.
A análise do consumo de nutrientes, a produção do fungo, a biossíntese do complexo enzima de
celulase e outros dados relevantes da fermentação irá ser investigado a fim de estabelecer uma
estratégia para a síntese de proteínas, e a partir de celulase de purificação de complexo enzimático a
um nível de fermentação.
Palavras-chave: Celulase; Bioetanol; Trichoderma reesei RUT-C30; Bagaço de cana, cana

8
Index
Index of Figures
Figure 1.1: Total consumption of oil from 1971 to 2013 by sector (Mtoe) ............................................. 13
Figure 1.2: Types of feedstock for ethanol production .......................................................................... 14
Figure 1.3: Side-by-side comparison of refineries and biorefineries ..................................................... 16
Figure 2.1: Molecular structure of cellulose........................................................................................... 17
Figure 2.2: Chemicals derived from glucose ......................................................................................... 18
Figure 2.3: Structural model of a cellulose microfibril ........................................................................... 19
Figure 2.4: Different Cellulosic Ethanol production pathways ............................................................... 20
Figure 2.5: Enzyme activities in depolymerization of arabinoxylan. The structure is a generalized
diagram of arabinoglucuronoxylan. Enzyme activities are (1) endoxylanase, (2) acetyl xylan esterase,
(3) a-L-arabinofuranosidase, (4) a-D-glucuronidase, (5) ferulic acid esterase, (6) acetyl esterase, and
(7) h-xylosidase. .................................................................................................................................... 23
Figure 3.1: Lineage of the QM6a strain. ............................................................................................... 28
Figure 3.2: Degradation of cellulose by cellulases and non-enzymatic proteins of T. reesei ............... 30
Figure 4.2: Microscope view of the spores during the counting process (magnification 100x) - spores
visible ..................................................................................................................................................... 34
Figure 4.3: Overall scheme of fermentation procedure ......................................................................... 35
Figure 4.4: Flasks with fermentation media (during sampling procedure) - note the difference in
homogeneity of the flasks on the left (Supplemented media) and flasks on the right (TMM).
Homogeneity and sedimentation occurred due to difference in size of pellets. .................................... 35
Figure 4.5: Solid-state production on wheat bran (dark green spore coloration visible) ....................... 36
Figure 4.6: Equipment used for separating the residual solid matter after 72h of hydrolysis: Büchner
flask connected to vacuum pump .......................................................................................................... 38
Figure 4.7: Well plate with DNS-treated samples ................................................................................. 40
Figure 4.8: General equation for calculating enzymatic activity in mmol ml-1 min-1 .............................. 40
Figure 5.1: Results for dry mass and fermentable sugar content for Trichoderma Minimal Medium,
shake flask production according to procedure by Domingues et al., 2001. ......................................... 43
Figure 5.2: Pelletisation in shake flask production with TMM (left) and Mandels solution (right) - note
precipitiated flocules of mycelium in the flask with TMM, while growth is more pulpy and hevenly
distributed in the other flask................................................................................................................... 46
Figure 5.3: Fermentable sugars conc. for cellobiose and wheat bran .................................................. 46

9
Figure 5.4: Enzymatic activity in FPU for cellobiose and wheat bran ................................................... 47
Figure 5.5: Effect of dilution of sample on result of Filter paper assay (percentage representing the
content of supernatant in diluted sample) ............................................................................................. 48
Figure 5.6: Enzymatic activity of T. reesei grown the three media........................................................ 49
Figure 5.7: Specific activity of cellulase enzymatic complex (Supplemented medium) ........................ 50
Figure 5.8: Kinetics of the reaction of the Trichoderma cellulolytic enzyme complex with sugarcane
bagase ................................................................................................................................................... 51
Figure 5.9: Reduction of solid matter content [%] after 72h of hydrolysis ............................................. 52
Figure 5.10: Results of gel electrophoresis of extracellular proteins obtained during fermentation. The
samples according to lanes are, from left to right: Lane 1 - markers, Lane 2 - comercial cellulase
enzyme, Lane 3 and 4 - Trichoderma reesei fermentation supernatant samples. ................................ 53
Figure 5.11: Equipment used for concentrating the supernatant obtained from fermentation .............. 54
Figure II.i: Contaminated medium, before (left) and after (right) sterilization. Note the darker yellow
colour in the flask after sterilization due to what is most probably the creation of Maillard reaction
products ................................................................................................................................................. 64
Figure II.ii: Sample of fermentation medium with bacteriological contamination (200x magnification) . 65

10
Index of Tables
Table 1.1: Parameters of bioethanol in comparison with petrol [Kemnitz; 2006.] ................................. 15
Table 2.1: Major microorganisms employed in cellulase production [Singhania, 2009.] ...................... 21
Table 2.2: Most commonly used purification techniques and enzyme property that is basis for
separation .............................................................................................................................................. 27
Table 3.1: The extracellular protein and enzyme activities of wild-type T. reesei QM6a and mutants
QM9414, MCG77, NG-14 and RUT-C30, following growth on 6% (w/v) roll-milled cotton in a 10 l
fermenter for 14 days ............................................................................................................................ 29
Table 4.1: Content of the modified Trichoderma Minimal medium, Mandels solution and the
"Supplemented" medium used in the experiments................................................................................ 33
Table 4.2: Raw materials used for hydrolysis testing, and dry matter content ...................................... 36
Table 5.1: Results for fermentation in 250 and 500 ml shake flasks .................................................... 44
Table 5.2: Results for fermentation in 500 ml flasks using TMM, Mandels solution and the
Supplemented medium. ......................................................................................................................... 45
Table 5.3: Structure of sugarcane bagasse, untreated, pretreated, marrow and stalk. ........................ 51
Table 5.4: Comparison of activity of supernatant acquired collected from fermentation (Supplemented
medium, 4th day) and solution of precipitate generated with the addition of ammonium sulphate. ..... 54
Table 5.5: Results of analysis of retentate and permeate samples obtained from ultrafiltration. ......... 55

11
Nomenclature and abbreviations
BGL - β-glucosidase
CBH - cellobiohydrolase
CBM - carbohydrate binding module
CMC - carboxymethylcellulase (endoglucanase)
E.C. number - Enzyme Commission number
EG - endoglucanase
FPU - Filter paper units
HMF - Hydroxymethylfurfural
LA - linear particle accelerator
MSW - Municipal solid waste
NTG - nitrosoguanidine
RCF - Relative centrifugal force
SSF - Solid State Fermentation
SWO - Swollenin
U - Enzymatic units - μmol of glucose produced min-1 in standard assay
UV - UV-light
12
1. The biorevolution - creating a sustainable future
With growing concern for the severe environmental effects that the utilization of fossil fuels has,
particularly greenhouse gas emissions from burning fuels for transportation, developing clean and
renewable alternatives became a world-wide priority. However, the substitute to these traditional fuels
has to be performance-wise comparable, widely-available and economically sustainable. [Trivedi et
al.; 2013.]
A rising level of environmental awareness and the negative effects we have on our environment in
forced to global community the past decades to cooperate in dealing with these issues. There are
several ways to approach this challenging problematic. One major concern stands out when looking
into the cause of the growing levels of greenhouse gasses.
A vast majority of chemicals and materials in widespread use, ranging from the textile and
automotive industry to the production of pharmaceuticals, fuels and fuel additives, depend on the use
of fossil fuels and oil derivatives as their basic feedstock. Modern research aims to deter this harmful
practice by providing alternative ways of utilizing nonconventional materials in the production of
above-mentioned necessities. This supports the idea of a circular economy, where waste streams are
returned to be used again.
An obvious and abundant raw material is biomass. Although having many advantages compared to oil
- it is present on all populated continents in many shapes and forms, breaking it down into its building
blocks in an economically viable and efficient way proved to be a challenge. Another concern is finding
new ways of synthesizing traditionally used chemical compounds using this novel feedstock.
Here, the concept of biorefineries steps into the spotlight. The actualization of a circular economy
through the use of lignocellulosic wastes as renewable resources can lead to reduce the dependence
from fossil-based resources and contribute to a sustainable waste management. The integrated
biorefineries, exploiting the overall lignocellulosic waste components to generate fuels, chemicals and
energy are the pillar of the circular economy. [Liguori and Faraco; 2016.]
Furthermore, according to data obtained from the U.S. Energy Information Administration [EIA; 2016.],
just OECD countries alone consumed about 20 million barrels per day of petroleum and other liquid
fuels in 2012., while non-OECD countries are consuming similar quantities, with a predicted growing
trend of use.
Biofuels play a key role in hindering this. Improvements in production processes - increasing
efficiency, decreasing costs and finding sustainable raw materials for production, all give these
alternative fuels a fighting chance in the oil-dominated market.
Bioethanol is one of the most researched and dominant biofuels, with a large presence in the Western
world. The importance of this fuel, applying lignocellulosic materials in its production and as a raw
material for biorefineries will be discussed.

13
1.1 Bioethanol - current development and future prospects
In the past century, the oil industry grew rapidly, due to the development of internal-combustion
engines and their widespread use in the energy industry. This heavily polluting material, as well as its
derivatives, seemed to be an irreplaceable feedstock in the fuel and chemicals industry. This trend can
be observed in Figure 1.1.
Figure 1.1: Total consumption of oil from 1971 to 2013 by sector (Mtoe) [IEA; 2015.]
It would be unrealistic to expect a rapid switch from these wide-spread energy sources to renewable
ones immediately. If this happened, damage could be done to some communities by making energy
unavailable and a scarce resource, which is unacceptable. The transition will most-likely take time,
since energy is a key element of the world economy that has to adapt to the unavoidable changes in
the near future. A more sensible approach would be gradually making the progression, at first partially
substituting fossil fuels with cleaner alternatives. This is why the biofuels industry has great potential,
in which bioethanol is one of the key elements.[Paris et al.; 2014.]
1.1.1 Bioethanol production from fermentation of biomass-based feedstock
Bioethanol is the main product in the process of anaerobic fermentation. In this process,
microorganisms utilize a carbohydrate-based material in the absence of air, and release significant
quantities of ethanol into the medium, which can be separated and purified.
Although many fungi, bacteria and yeasts are possible working microorganisms in fermentation
processes, the yeast Saccharomyces cerevisiae is most commonly used for converting glucose into
ethanol. It is a well known and thoroughly researched species, in use for millennia and one of the first
microorganisms to have its complete genome sequenced.
With the development of genetic engineering processes, new species with superior performance and
features. Some of the properties of the working microorganism in this case that could be improved in
order to increase the overall success of the process would be increasing resistance to ethanol

14
concentration, alleviating catabolite repression, as well as developing strains that are able to digest a
multitude of carbohydrate groups.
As feedstock for bioethanol production, an array of widely-available feedstock can be used, which is
shown in Figure 1.2.
Figure 1.2: Types of feedstock for ethanol production [Rutz and Janssen; 2007.]
While sugar-based materials can be applied directly, starch and cellulose feedstock has to be
pretreated and hydrolyzed in order to make it digestible by the microorganisms in the main
fermentation. Furthermore, sugar and starch based materials have a major role in the food-production
industry, which is one of the main reasons why lignocellulose-materials got in the spotlight as the
feedstock for future bioethanol production.
Growing global population, as well as food scarcity in certain areas of the world makes the use of
certain feedstock for energy production unethical, since it competes with food production. This can
create undesirable scenarios in which a producer is tempted to sell feedstock to a fuel producer rather
than to the food industry, due to a superior economic offer. This all can be avoided with a widespread
use of lignocellulose feedstock, considering that these materials are usually a waste created in
agriculture, and are regarded as an inconvenience. Adding value to this unavoidable waste gives
benefit to the producers, and motivates them to deal with this potentially environmental hazard. The
main obstacle of this practice, pretreatment and hydrolysis of the raw material, will be thoroughly
discussed further on, as a central theme that this paper aims to resolve.
15
1.1.2 Bioethanol properties and blending
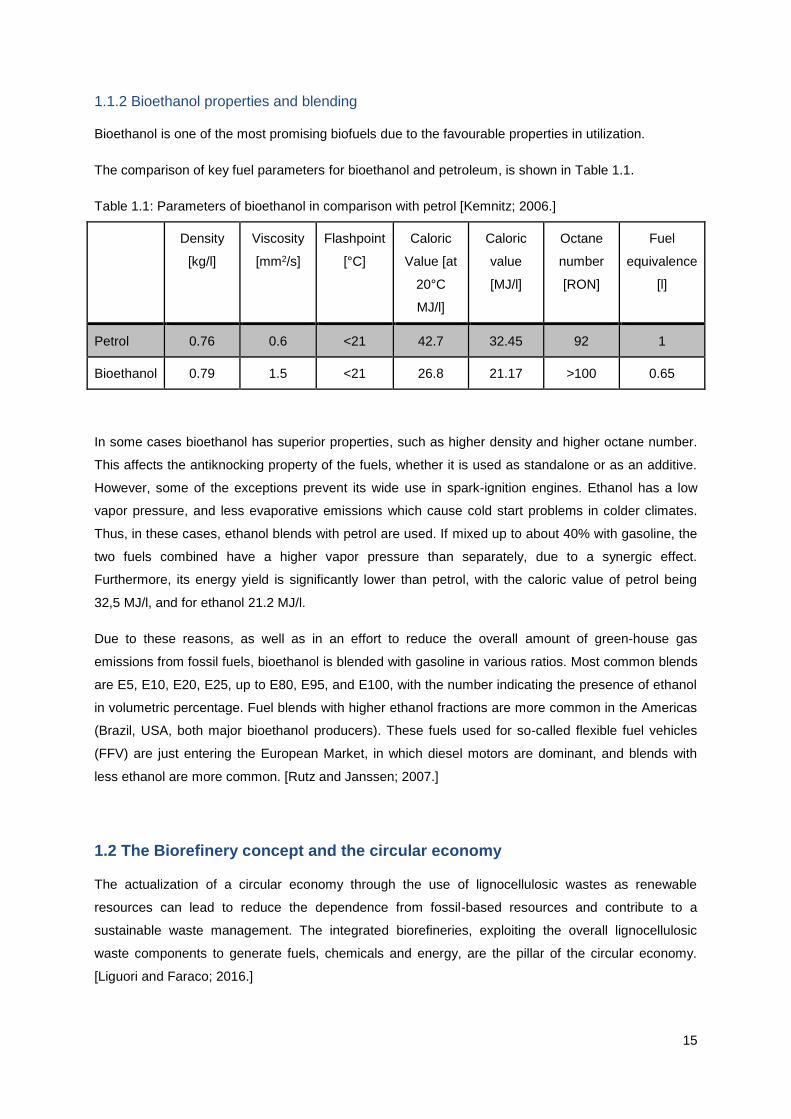
Bioethanol is one of the most promising biofuels due to the favourable properties in utilization.
The comparison of key fuel parameters for bioethanol and petroleum, is shown in Table 1.1.
Table 1.1: Parameters of bioethanol in comparison with petrol [Kemnitz; 2006.]
Density
[kg/l]
Viscosity
[mm2/s]
Flashpoint
[°C]
Caloric
Value [at
20°C
MJ/l]
Caloric
value
[MJ/l]
Octane
number
[RON]
Fuel
equivalence
[l]
Petrol 0.76 0.6 <21 42.7 32.45 92 1
Bioethanol 0.79 1.5 <21 26.8 21.17 >100 0.65
In some cases bioethanol has superior properties, such as higher density and higher octane number.
This affects the antiknocking property of the fuels, whether it is used as standalone or as an additive.
However, some of the exceptions prevent its wide use in spark-ignition engines. Ethanol has a low
vapor pressure, and less evaporative emissions which cause cold start problems in colder climates.
Thus, in these cases, ethanol blends with petrol are used. If mixed up to about 40% with gasoline, the
two fuels combined have a higher vapor pressure than separately, due to a synergic effect.
Furthermore, its energy yield is significantly lower than petrol, with the caloric value of petrol being
32,5 MJ/l, and for ethanol 21.2 MJ/l.
Due to these reasons, as well as in an effort to reduce the overall amount of green-house gas
emissions from fossil fuels, bioethanol is blended with gasoline in various ratios. Most common blends
are E5, E10, E20, E25, up to E80, E95, and E100, with the number indicating the presence of ethanol
in volumetric percentage. Fuel blends with higher ethanol fractions are more common in the Americas
(Brazil, USA, both major bioethanol producers). These fuels used for so-called flexible fuel vehicles
(FFV) are just entering the European Market, in which diesel motors are dominant, and blends with
less ethanol are more common. [Rutz and Janssen; 2007.]
1.2 The Biorefinery concept and the circular economy
The actualization of a circular economy through the use of lignocellulosic wastes as renewable
resources can lead to reduce the dependence from fossil-based resources and contribute to a
sustainable waste management. The integrated biorefineries, exploiting the overall lignocellulosic
waste components to generate fuels, chemicals and energy, are the pillar of the circular economy.
[Liguori and Faraco; 2016.]

16
Figure 1.3: Side-by-side comparison of refineries and biorefineries [Dos Santos et.al., 2011.]
Producing fuels, chemicals and energy depends on breaking down the raw material using different
methods, chemical, physical and biological.
As for chemical methods, a variety of acids, including sulfuric, hydrochloric, hydrofluoric, and nitric
acids can be used for hydrolysis of cellulose and hemicellulose. The hydrolysis process is represented
by the following simple expressions:
cellulose → glucose → HMF → tars
xylan → xylose → furfural → tars
If hydrolysis conditions are severe (e.g. high temperatures or acid concentrations) a large fraction of
the sugars is degraded to other products, e.g. HMF, furfural, and tars. [Katzen and Schell; 2006.]
Recent research found ways of utilizing furfural as a feedstock for production of some useful
chemicals. [Huber, 2006.]
Biological treatment is considered a promising approach for the lignocellulosic waste conversion since
it does not require additional energy or chemicals, thus minimizing the negative impact on the
environment. The presence of lignin, as well as the difference in structure of cellulose and
hemicellulose, requires pretreatment operations of separating these components to be made. This
increases the overall cost of the process. Waste materials (agricultural, pulp and paper industry, food
processing etc.) are a cheap, sustainable resource.
A large variety of important building-block chemicals are produced from lignocellulosic materials,
ranging from organic acids (malic, succinic, fumaric), xylitol (which can be hydrated into ethylene
glycol and propylene glycol), and many others. This concept works hand in hand with biofuel
production, since waste from one can be applied for the other as a raw material.
17
2. Cellulases - structure and application
In order to utilize biomass as a feedstock for fuel and chemical production, its intricate structure must
be broken down to basic building blocks in a clean and efficient way. In order to better understand the
weight of this challenge, the structure of cellulose, as well as the interconnections with other important
components of biomass, lignin and hemicellulose, will be thoroughly discussed in this chapter.
2.1 Cellulose structure and properties
Cellulose is a virtually inexhaustible polymeric raw material. In nature, cellulose is found in plants,
algae and mosses, as the main element of their cell walls. It is also produced by some bacteria and
fungi. It is of great importance as an irreplaceable in production of many products, ranging from paper
products and textiles, to pharmaceuticals and foods. [Ergun et al., 2016.]
Since cellulose is the most abundant biopolymer on the earth, it is the focus of considerable interest
as a renewable energy resource. Cellulosic materials are desirable feedstocks for alternative fuels and
energy carriers such as ethanol, biodiesel, or hydrogen since they are renewable and abundant.
[Rezaei et al., 2008.]
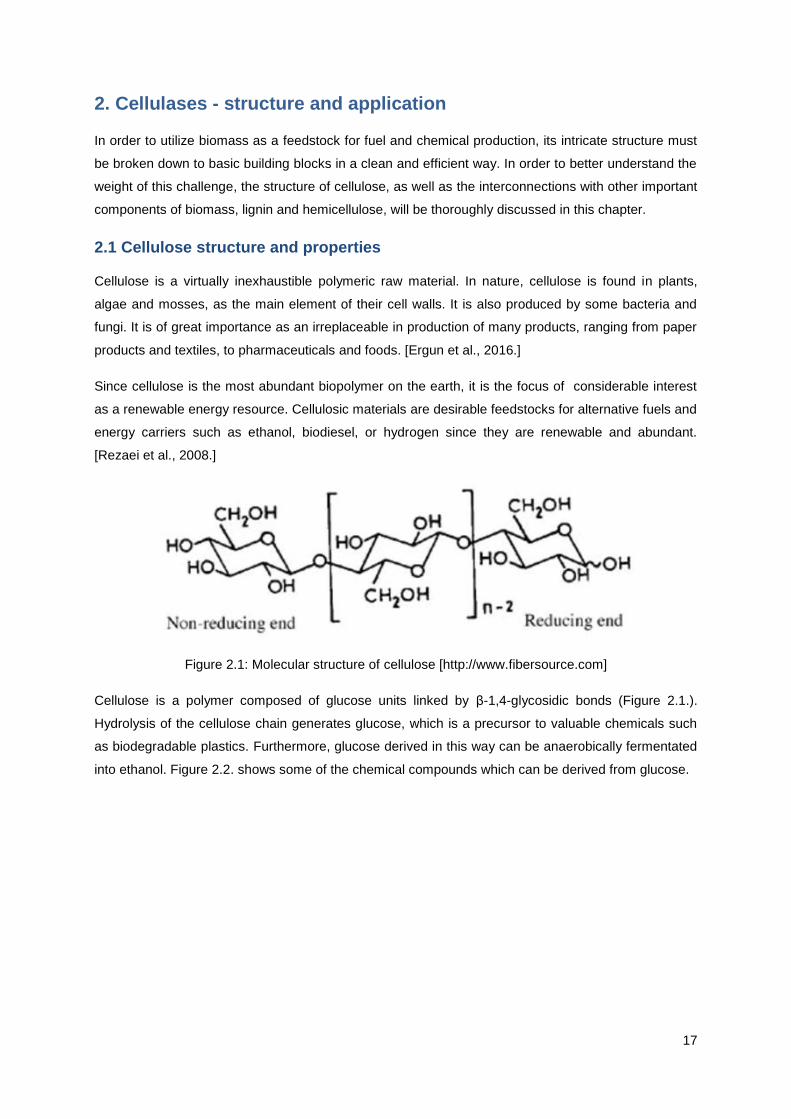
Figure 2.1: Molecular structure of cellulose [http://www.fibersource.com]
Cellulose is a polymer composed of glucose units linked by β-1,4-glycosidic bonds (Figure 2.1.).
Hydrolysis of the cellulose chain generates glucose, which is a precursor to valuable chemicals such
as biodegradable plastics. Furthermore, glucose derived in this way can be anaerobically fermentated
into ethanol. Figure 2.2. shows some of the chemical compounds which can be derived from glucose.

18
Figure 2.2: Chemicals derived from glucose [Yabushita et al., 2014.]
Most of these compounds are expected to be a base for the bio-based industry. For instance, sorbitol
can be converted to polymers and pharmaceuticals, while 5-HMF, gluconic acid, and other derivatives
are a base for various products used in the chemical, pharmaceutical and food industry. Some of
these are coatings, films, membranes, gums, etc.
All this made cellulose a promising sustainable feedstock for the future. However, before these
aspirations become a reality, some key issues regarding the unchaining of the cellulose structure must
be overcome.
In a very few cases in nature, cellulose is found in a pure state. Usually, it is a part of a matrix
containing hemicellulose and lignin and other cell components. If unaccompanied by these elements,
cellulose is prone to degradation. Thus, they play an important role in maintaining the stability of the
cell wall. However, although this is a great benefit for the plant, it creates a lot of difficulties for
utilization of cellulose, due to relatively poor significance of hemicellulose and lignin, and complicated
extraction and purification. Cellulose in a pure form is produced by some bacteria (i.e.
Gluconacetobacter xylinus), fungi, algae, and invertebrates. [Ergun et al., 2016.]

19
Figure 2.3: Structural model of a cellulose microfibril [Taiz and Zeiger, 1991.]
When building the cell wall, cellulose forms complex microfibril structures, with amorphous and
crystalline domains. This structure is presented in Figure 2.3. These different structures are important
since they determine the accessibility of the enzymes to the cellulose molecules. In the crystalline
domains of the microfibril structure, strong intermolecular hydrogen bonds create a compact cellulose
matrix, which prevents cellulase enzymes reacting fully with the polymer, and make the cellulose
insoluble in water.
Effective degradation of cellulose is challenging due to the rigidness of its structure, induced by inter-
and intra-molecular hydrogen-bonding. [Yabushita et al., 2014.] Due to this strong internal hydrogen-
bonding, cellulose is highly crystalline in the center of the microfibril, makes molecular modeling
difficult. The crystalline superstructure of cellulose is difficult to disrupt even under extreme reaction
conditions: cellulose must be heated to 320 °C at a pressure of 25 MPa to remove its cristallinity.
[Maurer et al., 2012.]
20
Although pretreatment is needed to deconstruct the plant cell wall, compounds that are toxic to
fermentative microorganisms are normally formed due to the harsh conditions applied. Furfural and
furan, which affect cell growth, are formed when applying high temperature and pressure, while formic,
acetic, and other weak acids decrease the pH level and affect cell metabolism. Phenolic compounds
can be also formed due to lignin breakdown by aggressive chemicals. [Paris et al., 2014.] All of these
components pose a threat to the yeast used for fermentation, and their removal (if possible) can be a
very expensive inconvenience that can increase the overall cost of the process substantially.
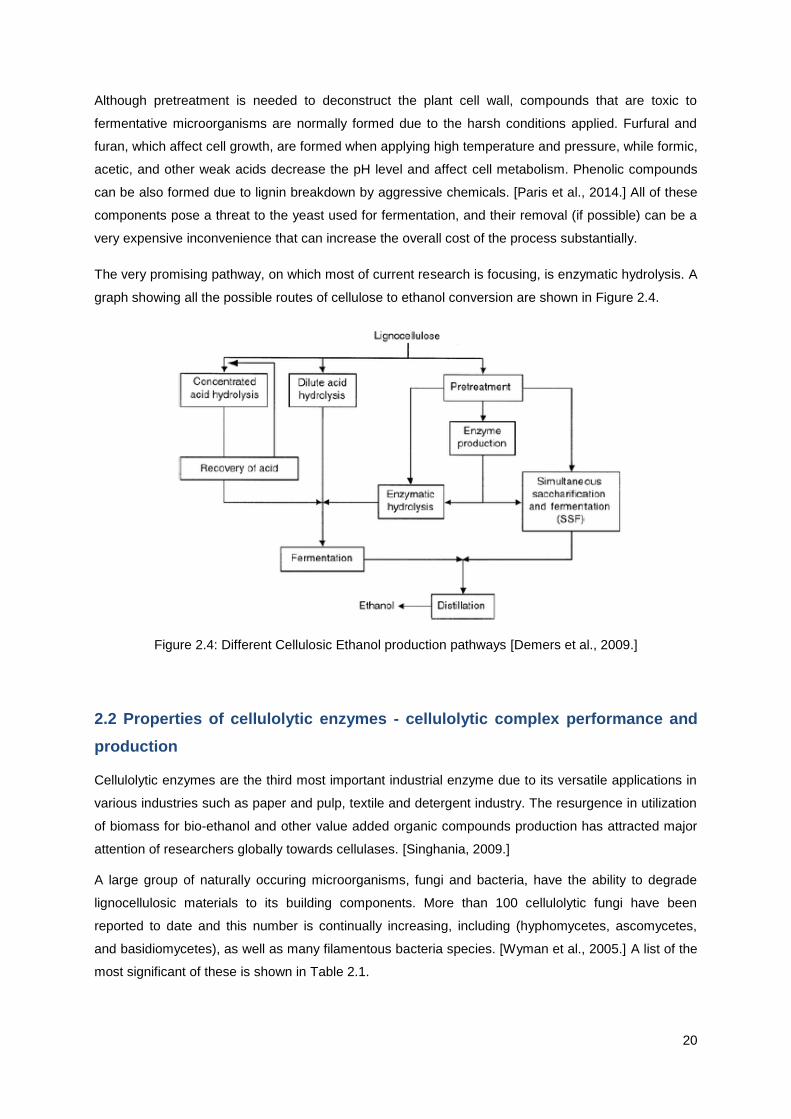
The very promising pathway, on which most of current research is focusing, is enzymatic hydrolysis. A
graph showing all the possible routes of cellulose to ethanol conversion are shown in Figure 2.4.
Figure 2.4: Different Cellulosic Ethanol production pathways [Demers et al., 2009.]
2.2 Properties of cellulolytic enzymes - cellulolytic complex performance and
production
Cellulolytic enzymes are the third most important industrial enzyme due to its versatile applications in
various industries such as paper and pulp, textile and detergent industry. The resurgence in utilization
of biomass for bio-ethanol and other value added organic compounds production has attracted major
attention of researchers globally towards cellulases. [Singhania, 2009.]
A large group of naturally occuring microorganisms, fungi and bacteria, have the ability to degrade
lignocellulosic materials to its building components. More than 100 cellulolytic fungi have been
reported to date and this number is continually increasing, including (hyphomycetes, ascomycetes,
and basidiomycetes), as well as many filamentous bacteria species. [Wyman et al., 2005.] A list of the
most significant of these is shown in Table 2.1.

21
Cellulolytic microorganisms are able to digest a variety of other carbohydrates besides cellulose.
Another property of these organisms is the ability of secreting large quantities of extracellular protein
into the medium.
Table 2.1: Major microorganisms employed in cellulase production [Singhania, 2009.]
Kingdom Genus Species
Fungi Aspergilus A. niger
A. nidulans
A oryzae
A. aculeatus
Fusarium F. solani
F. fusosporioum
Humicola H. insolens
H. griesa
Melanocarpus M. albomyces
Neorospora N. crassa
Phanerochaete P. chrysosporioum
Penicillium P. brasilianum
P. occitanis
P. decumbans
P. purpurogenum
P. janthinellum
Talaromyces T. emersonii
Trichoderma T. reesei
T. harzianum
T. longibrachiatum
Bacteria
Actinomycetes
Acidothermus A. cellulolyticus
Bacillus B. subtilis
Clostridium C. thermocellum
C. acitobutylicum
C. cellulovorans
Pseudomonas P. cellulose
Rhodothermus R. marinus
Cellulomonas C. fumi
C. uda
Streptomyces C. drodzowiczii
S. lividans
Thermomonospora T fusica
T curvata

22
However, cellulase activity in vivo is not mediated by a single enzyme. Rather, it is a complex of
several different enzymes which act in synergy. The cellulase complex forms a unique structure which
has been called a cellulosome and appears to be ubiquitous among cellulolytic microorganisms
[Lamed et al., 1987].
The cellulosome includes:
endoglucanase which hydrolyzes β-1,4 linkages between adjacent glucose molecules within
the amorphous regions of the cellulose polymer thereby breaking the chain in the middle. A
clear indicator of their activity is a decrease in viscosity; (E.C.3.2.1.4)
exoglucanase which degrades the nicked cellulose chains from their non-reducing ends
producing glucose, cellobiose and/or cellotriose. These liberate D-glucose from 1,4-β-D-
glucans and hydrolyze D-cellobiose slowly; (E.C.3.2.1.91)
cellobiohydrolase, another type of exoglucanase which removes larger polysaccharides from
the non-reducing end of the cellulose molecule; EC 3.2.1.91
β-glucosidase, or cellobiase, which converts cellobiose to glucose. [Coughlan, 1985].
(E.C.3.2.1.21) [Polaina, MacCabe; 2006.]
Enzymatic hydrolysis of natural lignocellulosic materials is a very slow process because cellulose
hydrolysis is hindered by structural parameters of the substrate, such as lignin and hemicellulose
content, surface area, and cellulose crystallinity. [Mansfield et al., 1999]
Since hemicellulose can have a significant presence in the material, a "cocktail" of both cellulolytic and
hemicellulolytic enzymes should be applied. Degradation of hemicellulose along with cellulose is
essential for an efficient hydrolysis of lignocellulosic biomass. In fact, co-hydrolysis of xylan can
improve cellulose accessibility to the cellulases as a result of xylan solubilization. [Paris et al., 2014.]
The complex mechanism of the hydrolysis of a typical hemicellulose structure - arabinoxylan, is shown
in Figure 2.5.

23
Figure 2.5: Enzyme activities in depolymerization of arabinoxylan. The structure is a generalized
diagram of arabinoglucuronoxylan. Enzyme activities are (1) endoxylanase, (2) acetyl xylan esterase,
(3) a-L-arabinofuranosidase, (4) a-D-glucuronidase, (5) ferulic acid esterase, (6) acetyl esterase, and
(7) h-xylosidase. [Wyman et al., 2005.]
The main obstacle with enzymatic hydrolysis lies in the enzyme itself. Commercial enzymes are widely
available, but have a considerably high price. Also, since their selectivity is quite low, in the prolonged
time that is needed for full sacharification of the cellulose, formation of inhibitors can occur. In order to
overcome these issues, cheaper production of more efficient enzymes must be developed.
A majority of reports on cellulase production utilizes submerged fermentation technology. This enables
better monitoring of the process, easier handling and simplifies downstream treatment, as opposed to

24
the naturally occurring process that resembles solid state fermentation. [Sukumaran et al., 2005]
However, solid state fermentation is gaining interest for processes that rely on simultaneous cellulose
saccharification and alcoholic fermentation.
Many fungi can grow in submerged culture in different forms ranging from dispersed filaments to
pellets, depending on culture conditions and the strain of organism used. Pellets are spherical or
ellipsoidal masses of hyphae with variable internal structure, ranging from loosely packed hyphae,
forming ‘‘fluffy’’ pellets, to tightly packed, compact, dense pellets [Papagianni, 2004]. The impact of
pellet formation on cellulase yield is discussed briefly in Chapter 2.2.1.
Various factors determine the yield of cellulase from the fermentation. Certain enzyme production
inducers are known, although the exact mechanisms of their influence are not fully understood. These
are carbon sources that are more challenging to metabolize than glucose (usually cellulose
derivatives, such as cellobiose and sophorose), since easily utilizable sugars repress production..
Cellulosic biomass, like cereal husk or straw, can be used as a cellulase inducer. The most commonly
used one in commercial enzyme production is lactose. It is believed that the intracellular galactose-1-
phosphate levels might control the enzyme secretion. [Sukumaran et al., 2005]
Complete utilization of lignocellulosic material is limited due to lack of microorganisms capable of
fermenting a variety of sugars obtained by hydrolysis of lignocellulosic materials. S. cerevisiae, for
instance, is widely used as fermentative organisms, efficiently ferments hexoses, but is not naturally
able to ferment pentoses such as xylose and arabinose. [Paris et al; 2014]
2.2.1 Fermentation operational conditions and fermentation types
Temperatures between 45°C and 50°C are characteristic of enzymatic hydrolysis while the optimal
performance temperature for fermentation using S. cerevisiae is around 30°C. SSF is normally carried
out at 38°C being hydrolysis the rate-limiting process [15]. To enhance SSF performance,
commercially available cocktail enzymes, capable of hydrolyzing the substrate at lower temperature,
or thermotolerant microorganism, such as K. marxianus, should be considered. [Paris et al; 2014]
Proper agitation is necessary for proper growth of the working microorganism. Agitation enables
access of fresh substrate to the microorganism, and decreases the concentration of metabolic
products in the immediate environment around it. Propeller stirrers are most commonly used, but with
moderation, in order to prevent damage to the filamentous morphology of the microorganism. Usually,
aeration and stirrers combined provide sufficient agitation in the medium.
For some microorganisms, poor agitation creates the possibility of formation of pellets, which
decrease the overall efficiency of enzyme production. Sections inside the pellet have poorer growth
conditions, lower availability of nutrients and oxygen levels, which drops the yield of extracellular
enzymes. However, with excessive agitation, poor extracellular enzyme yield is also observed,
probably due to shear stress on the microorganism cells [Lejune and Baron, 1995.] [Domingues,
2001.]
25
As mentioned before, there is a possibility of performing saccharification and fermentation separately
or simultaneously. Generally, hydrolysis is carried out in a separate vessel, since the cellulolytic
enzymes and yeasts used in the fermentation demand different operational conditions. However, if
these conditions are similar, the two processes could be carried out simultaneously. The main
advantage of this process is that the sugars generated by hydrolyzing cellulose can be directly
metabolized in anaerobic digestion to produce ethanol. This prevents inhibition by product of the
cellulase enzymes, since glucose concentration remains low due to the yeast activity. [Paris et al;
2014]
The alternative, separating these two phases, although more technologically demanding and costly,
has certain benefits. That way, both the hydrolysis and fermentation process can be conducted with
optimal operational conditions, without compromise. Usually the cellulose enzymes are separated and
transferred to another environment, where biomass hydrolysis takes place.
Adding the lignocellulosic material directly to the fermentation broth where cellulase enzymes are
generated is possible. Immediately after enzyme production, the saccharification process starts. The
product is a broth containing sugars and nutrients remaining in the medium after the production the
cellulolytic complex, that were not utilized by the microorganism, as well as the sugars originating from
the hydrolyzed biomass. This broth can be sterilized and inoculated with the yeast. This way, waste
generation from the process is minimized.
The relationship between fungal growth conditions and cellulase production has been discussed. From
theoretical assumptions it has been suggested that to be commercially successful it is necessary to
produce 1100 filter paper units L-1 h-1. This amount of enzyme requires a 70 g L-1 h-1 growth rate of the
culture. Under most favorable conditions fungal cultures produce 35 g L-1 h-1 of cell mass. This gap
could be closed if the chosen microorganism would show any one or both of the following properties:
(i) a high-enhanced capacity for cellulase production; (ii) the ability to produce enzymes with a high
specific activity. These desirable properties may be achieved by either new strain selection and/or
strain improvement. [Gosh and Gosh, 1992]
2.2.2 Cellulase recovery and purification
After the production of the cellulolytic enzymatic complex, it has to be separated and purified in order
to obtain a stable product. The separation process in this case involves removal of cellulolytic
enzymes from the medium components, polysaccharides, small molecules and proteins other that
cellulolytic ones.
The purification process involves four main stages:
Removal of insoluble components (solids),
Recuperation of the protein and purification in order to increase their concentration

26
Separation of different fractions of the extracellular enzymes (usually chromatographical
methods)
Preparation of the pure enzyme, in a final form that is ready for commercial use [Domingues,
2001.]
Separation and purification processes vary greatly when it comes to performance, price, and
applicable scale. As defined by Stanbury et al. [Stanbury et. al, 1984.], there are several criteria when
it comes to determining the optimal recovery process:
1. Location of the product: intra- or extracellular
2. Concentration of the product in the fermentation broth
3. Physical and chemical properties of the product
4. Intended use of the product
5. Minimal acceptable purity level
6. Magnitude of bio-hazardous elements in the broth
7. Impurities in the fermentor broth
8. Product's marketable price
The same source mentions that price of product recovery can range from 15 to 70% of total costs.
Although the source is not very recent, not much progress on costliness of these processes has been
made since. It is also stated that protein purification processes correspond belong to the group of the
more expensive ones. This makes sense when taking into consideration the points made in the list
above.
In the case of cellulase purification, there are just a few mitigating factors that reduce the overall
process cost. These are the extracellular location of the enzymes (cell disruption is not necessary,
even undesirable), as well as the low demand for purity, since the enzymes are not used in the food of
pharmaceutical industry. However, thermal and mechanical sensitivity of the enzymes, low
concentration in the broth, as well as the low marketable price, limit the number of possibly applicable
separation techniques, and are the reason for the low cost effectiveness of the process. This is an
issue that has to be solved, and is one of the major problems hampering efficiency of cellulase
production.
Two possible approaches on overcoming costliness issues could be made. Firstly, the problematic
properties themselves could be moderated, for instance production microorganisms with the ability to
secrete higher concentrations of enzymes could be developed. Alternatively, processes that are
currently used in these cases could be made more efficient and cheaper, influencing in that way the
overall cost-effectiveness of the purification process.
In table 2.2., some most commonly used enzyme separation and purification techniques are listed,
along with the exact property of the enzyme that is the basis on which the separation is made.

27
Table 2.2: Most commonly used purification techniques and enzyme property that is basis for
separation [Domingues, 2001.]
Process Property
Gel filtration chromatography Size and shape
Ultrafiltration Size
Ion exchange chromatography Electric charge
Isoelectric focusing Isoelectric point/charge
Precipitation with ammonium sulphate Solubility/Hydrophobicity
Hydrophobic Interaction
Chromatography
Hydrophobicity
Reversed-phase chromatography Hydrophobicity
Phase separation Solubility
Partition Chromatography
Solubility
Affinity Chromatography Specific interactions

28
3. Trichoderma reesei - history of use and strain improvement
The filamentous fungus Trichoderma reesei has a long history of use for production of hydrolytic
enzymes. It was isolated during the Second World War from the Solomon Islands, at the US Army
QuarterMaster Research and Development Center at Natick, Massachusetts, after the military
personnel noticed the fungus was degrading cotton garments and canvases. Originally named "strain
QM6a" and thought to be a T. viride species, later was given a new species name after the Natick
researcher Elwyn T. Reese. [Mandels and Reese, 1957.] [Simmons, 1977.]
After the potential of such a microorganism was realised, an effort was made through strain
development programs using random mutagenesis of the wild species aiming at developing strains
with superior cellulolytic enzyme production capabilities. [Eveleigh, 1982.] All modern commercially
used T. reesei strains descend from the original QM6a strain.
Figure 3.1: Lineage of the QM6a strain. [Seidl et al., 2008.]
Throughout its lineage, as new mutated strains were derived from the original one, improvements
were made in the ability to secrete extracellular protein and improve enzymatic activity. Some of these
properties for various important mutants are presented in Table 3.1.

29
Table 3.1: The extracellular protein and enzyme activities of wild-type T. reesei QM6a and mutants
QM9414, MCG77, NG-14 and RUT-C30, following growth on 6% (w/v) roll-milled cotton in a 10 l
fermenter for 14 days [Ryu & Mandels, 1980]
Strain Soluble protein
(mg/ml)
FPU (U/ml) Productivity
(FPU/lh)
CMC (U/ml) βGl (U/ml)
QM6a 7 5 15 88 0.3
QM9414 14 10 30 109 0.6
MCG77 16 11 33 104 0.9
NG-14 21 15 45 133 0.6
RUT-C30 19 14 42 150 0.3
Recent investigations discovered that the T. reesei is a asexual anamorph of the sexually propagating
fungus Hypocrea jecorina. Although by the "holomorph concept", the name of the sexual for should be
used for the species, due to its historical significance, the Trichoderma reesei is used as a species
name, making an exception to the conventional practise. [Seidl et al., 2009] [Seiboth et al, 2011.]
T. reesei is widely used in the textile, food and feed industry, since it was given the GRAS status
(Generally Recognized As Safe) by the U.S. Food and Drug Administration. It serves as a model
organism for the group of cellulolytic microorganisms, due to its long history of use and extensively
researched genome sequence.
3.1. T. reesei cellulolytic system
A variety of cellulolytic enzymes is needed to degrade cellulose to its building blocks. The T. reesei
cellulosome is composed out of the several typical enzyme groups, which can be derived into four
enzymatic groups, explained in more detail in Chapter 2.2.
Figure 3.2 is a graphical representation of the synergistic performance of different groups on breaking
down the cellulose chain. Besides the three main groups, other important components are presented.
For instance, some of the endoglucanases and cellobiohydrolase are connected to carbohydrate
binding modules, as they form a bipartite structure connected via a flexible linker region. Also, non-
enzymatic proteins such as swollenin (SWO) can be seen disrupting the crystalline structure,
exposing the individual polymer chains to the enzymes and improving the overall efficiency of the
hydrolysis process. [Seiboth et al., 2011.]

30
Figure 3.2: Degradation of cellulose by cellulases and non-enzymatic proteins of T. reesei [Seiboth et
al., 2011.]
3.2 T. reesei RUT-C30
At Rutgers University, New Jersey, a separate line of high-producing mutants was generated. Among
these strains, RUT-C30 has become the most frequently used cellulase hyperproducer in the public
domain. [Seiboth et al, 2011.]
This strain was obtained through a three-step procedure. First, mutagenesis by UV light and screening
for catabolite derepression led to the isolation of strain M7. Further mutagenesis by N-nitroguanidine
led to the isolation of NG14, a partially derepressed strain that produced approximately twice the
extracellular protein, five times the filter paper activity, twice the β-glucosidase activity and twice the
endoglucanase activity of QM9414. Following another round of UV mutagenesis and screening for
high cellulase activity and catabolite derepression by resistance to the antimetabolite 2-deoxyglucose
(2DG), RUT-C30 was isolated. [Peterson and Nevalainen, 2012.]

31
RUT-C30 has the ability to secrete a large amount of extracellular protein. Literature sources
[Eveleigh, 1982] [Bisaria and Ghose, 1981.] reported that the strain produced 20 mg of extracellular
protein ml-1 and displayed cellulase activity of 15 filter paper units ml-1 ,15–20 times higher than that of
QM6a when grown in shake flasks.
The strain possesses certain physiological differences compared to QM6a. These exquisite
ultrastructural properties are connected to its superior potential of enzyme production. Microscopic
analysis exposed a six- to sevenfold higher endoplasmic reticulum (ER) content in RUT-C30 during
secretion than in QM6a. Phospholipid content of the mycelium and the concentration of the nucleoside
diphosphatase, which is a ER marker enzyme, is double that of the QM6a. Mycelial protein content
was about five times higher, and β-glucosidase and endoglucanase activity was three and thirty times
higher, respectively. The RUT-C30 strain lacked the typical Golgi apparatus, and instead contained
saccules associated with the ER. It was undetermined if these saccules were Golgi bodies with an
unusual morphology, or the strain exhibited a Golgi-independant secretory pathway. [Ghosh et al.,
1984.] [Glenn et al., 1985.] [Ghosh et al., 1982.]
Another, more recent study, by Peterson and Nevalainen [Peterson and Nevalainen, 2012.] showed
that this strain lacks annulate lamellae that are abundant in the wild-type QM6a, and possess
excessively transverse parallel cisternae and a small amount of punctate-like bodies, all indicating
cellular stress. As for the strain phenotype, the conidia of RUT-C30 are of a lighter green colour and
the bottom view of colonies growing on an agar plate lack the yellow color (pigment) typical for the
wild-type.
Finally, what makes this strain a promising enzyme producer is, as stated above, is hyperproduction
of cellulase with resistance to catabolite repression . This trait enables submerse production, which
greatly reduces downstream processing costs and simplifies these processes.
Since the strain's genetics are thoroughly researched, homologous recombination could be a major
approach for producing knockout strains in T. reesei. Recent advances in method development have
resulted in high-throughput generation of knockout/gene replacement strains by more efficient
strategies, increasing the efficiency of homologous recombination and allowing sequential gene
deletions. While these strategies have so far been applied to the members of the T. reesei family tree,
they could similarly be applied to the RUT-C30 strain. Sexual crossing can also be used as a fast and
efficient method of eliminating detrimental mutations by complementation with wildtype fungi and
combining favourable features expressed by different successful mutant strains. [Peterson,
Nevalainen; 2012.]

32
4. Materials and Methods
Methods and materials applied in the experiments connected to this thesis were selected based on the
availability of the equipment and working conditions in the laboratories where the experimental work
took place. These are The Institute for Bioengineering and Biosciences (IBB) at Instituto Superior
Técnico (IST), and University of São Paulo, where bagasse pretreatment was done.
4.1 Cellulase complex production
4.1.1 Strain
The strain used in all the experiments is Trichoderma reesei Rut C-30 from the microbial strain
catalogue of the Institute for Bioengineering and Biosciences (IBB) at Instituto Superior Técnico (IST),
Universidade de Lisboa (UL). The strain was originally a gift from Dr M. Pentillä (VTT, Finland). The
properties of this mutant strain are discussed in more detail in chapter 3.1 of this paper.
Fungal spores preserved in a cryogenic vial, kept at −80 °C in 20% (v/v) glycerol, were used to
inoculate potato dextrose/agar (Difco) slants, which were incubated at 28 °C. Five days after
inoculation, the spores were harvested and washed with sterilized water and the spore concentration
was determined in a Neubauer counting chamber after appropriate dilution [Domingues et al., 2000].
4.1.2 Culture media
Cultivations are carried out several different cultivation media, with slight modifications and variations.
The basis for the three main kinds of liquid media used are a modification of the Trichoderma minimal
medium (TMM) [Penttilä et al., 1987], the Mandels solution [Mandels and Reese, 1957], traditionally
used for solid state production, and the third being the one showing pulpy growth in literature
[Domingues et al., 2000.] This media contains a similar content of salts to the TMM, while additionally
containing peptone, similarly to the Mandels solution. However, it is supplemented with yeast extract
as one of its components, and thus, just for clarification purposes, this medium will be regarded as the
"supplemented" medium. The composition of all media bases, without the carbon sources, is given in
Table 4.1.
33
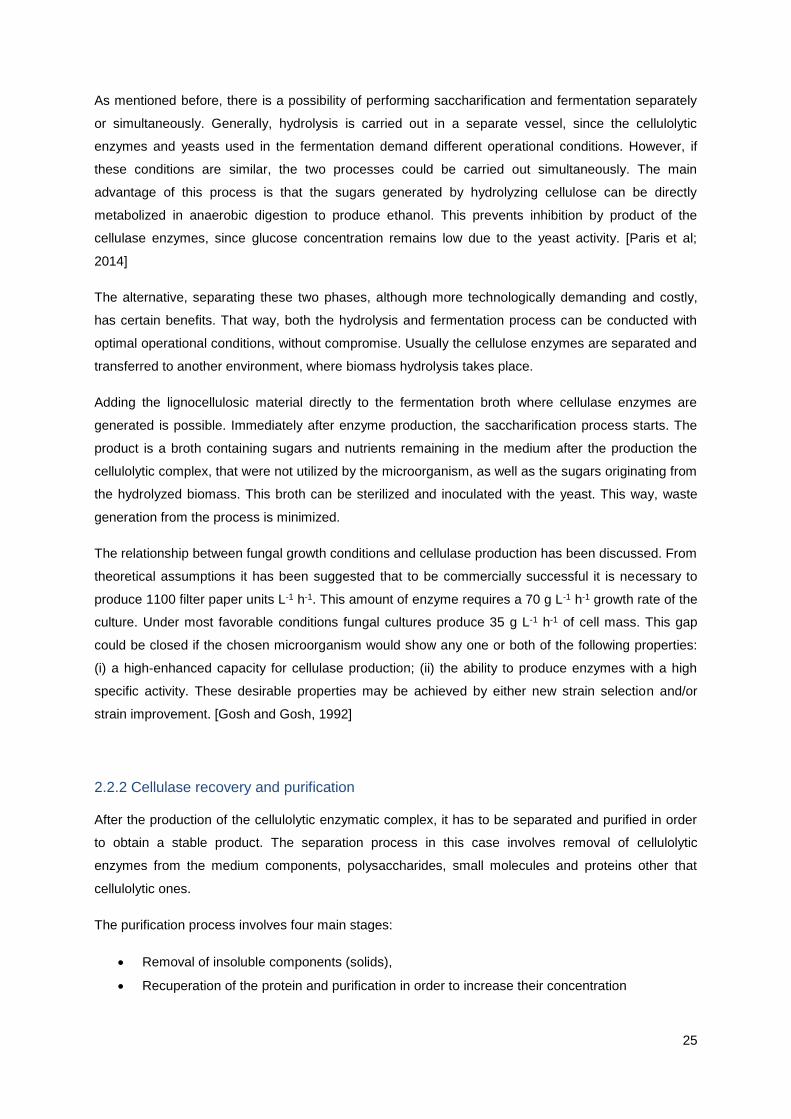
Table 4.1: Content of the modified Trichoderma Minimal medium, Mandels solution and the
"Supplemented" medium used in the experiments
Component in g/l Trichoderma minimal
medium
Mandels solution "Supplemented"
medium KH2PO4 15 2 15
(NH4)2SO4 5 1.4 5
MgSO4*7H2O 1.23 0.3 1.23
CaCl2*2H2O 0.8 0.4 0.8
FeSO4*7H2O 0.0035 0.0035 0.0035
MnSO4*H2O 0.0015 0.0015 0.0015
Zn(O2CCH3)2*H2O 0.0015 0.0015 0.0015
CoCl2*6H2O 0.003 0.003 0.003
Urea / 0.3 /
Peptone / 0.75 0.75
Yeast extract / / 0.3
A list of all the chemicals used in preparation of the different media is presented in Table 4.2. Details
about the manufacturer and purity level are also laid out.
All chemicals used for experimets were of >99% purity. The peptone used is Himedia Bacteriological
Peptone. The yeast extract used for the media is Difco Ultrafiltered Yeast Extract.
As for the carbon sources, glucose was mainly used, while lactose, cellobiose and wheat bran were
added in smaller quantities as enzymatic complex production inducer.
4.1.2.1 Preculture media
Preculture media contained media bases from Table 4.1, and 30 g/l of glucose as the sole source of
carbon.
4.1.2.2 Main fermentation
The composition of production medium for cellulases was the same as that of the corresponding pre-
culture medium, except that it was supplemented with specific enzymatic complex production inducers
(15 g/l of lactose, 20g/l of cellobiose or 10g/l of wheat bran).
4.1.2.3 Variations
In an effort to determine optimal fermentation conditions, experiments with variations of the media
were made. In contrast to the solely synthetic substrate that is the Trichoderma Minimal Medium,
semi-synthetic mediums, Mandels and Supplemented medium, were used, containing peptone and

34
yeast extract. Nevertheless, an effort was made to maintain the needed amount of nutrients for the
growth and enzyme production by the microorganism, as well as maintain the concentration of iron in
the media at adequate levels, since it proved to be a key element influencing mycelial structure and
pellet growth [Domingues et al., 2000.]
4.1.3. Sterilization of materials and equipment
All materials and equipment used for the fermentations (components of the media along with
Erlenmeyer flasks, measuring cylinders, pipette tips, etc.) were sterilized in an autoclave prior to use,
at a temperature of 121°C, at 104 kPa pressure for 20 min. The medium bases from Table 4.1 were
sterilized separately from carbon sources, in order to prevent creation of products of the Mailard
reaction, which lowers the content of N and C sources available to microorganism, as well as possibly
affect its metabolism [Kim and Lee, 2003]. This phenomenon is well known, at it became common
practise to separate these components separately. After attempting to sterilize the mixed components,
a dark yellow coloration appeared in the flasks. Figure II.ii from Appendix II to this thesis shows a
similar occurrence that was observed after a shake flask with the fungal biomass and medium was
sterilized.
Thus, the media bases mentioned above (components without C sources) were prepared in a 200%
concentration, while solutions of glucose and lactose were prepared as 20% and 7.5% solutions,
respectively. After sterilization, the separate components of the media were mixed and diluted with
sterilized water to the adequate concentration required for (pre)fermentation, before being finally
inoculated. Separated components of the media were stored in a cold room, 4°C prior to use.
4.1.4 Production in shake flasks
A 250 ml Erlenmeyer flask containing 50 ml of medium was inoculated with 50 μl of a spore
suspension of 107 spores ml−1, made using a Bürker green counting chamber, which served as a pre-
culture [Domingues et al., 2001]. The pre-culture was incubated for 48 h at 34°C on an orbital shaker
at 200 rev/min−1.
Figure 4.2: Microscope view of the spores during the counting process (magnification 100x) - spores
visible
The flasks used for cellulase production, containing the production media, were inoculated with a 10%
inoculum from the pre-culture. These flasks were incubated at 28° for 5 days, on an orbital shaker at
150 rev/min−1 [Kadam and Kreutzer; 1995.]

35
A scheme of the procedure is given in Figure 4.3.
Figure 4.3: Overall scheme of fermentation procedure
Sampling of was done in a laminar flow chamber, sterilized prior to use for 15 minutes using a UV
lamp. This is illustrated in Figure 4.4.
Figure 4.4: Flasks with fermentation media (during sampling procedure) - note the difference in
homogeneity of the flasks on the left (Supplemented media) and flasks on the right (TMM).
Homogeneity and sedimentation occurred due to difference in size of pellets.
4.1.4 Solid-state production
The Trichoderma reesei was grown on wheat bran in 100 ml Erlenmeyer flasks. 3 grams of wheat
bran was covered with 5 ml of Mandels solution, which was separately sterilized. This step was used
to induce the enzyme production of the fungus after an extended period in cryogenic conditions.
The growth of the fungus on the solid medium is illustrated in Figure 4.5.
Storage in cryogenic
vial
−80°C
Potato-Dextrose Agar
28°C
5 days
Pre-culture
250 ml flask
34°C
200 rev/min−1
48h
Enzyme production
250/500 ml flask
28°C
150 rev/min−1
5 days
50 μl
107 sp/ ml−1
10% inoculum
50 ml
55/110 ml

36
Figure 4.5: Solid-state production on wheat bran (dark green spore coloration visible)
4.1.5 Commercial cellulase
The commercial cellulase used for some tests was cellulase from Trichoderma longibrachiatum -
Sigma C9748. The enzyme activity has originally 1 FPU/mg of powder.
4.2 Hydrolysis of lignocelulosic materials
In order to test the performance of the produced cellulolytic enzymatic complex, several experiments
with conventional feedstocks for bioethanol production were made. The enzymatic kinetics of the
reaction between the cellulolytic complex and several raw materials were examined. These materials,
as well their moisture content are presented in Table 4.2.
Table 4.2: Raw materials used for hydrolysis testing, and dry matter content
Material Dry matter
content [%] Untreated sugarcane bagasse 99%
Sugarcane bagasse,
pretreated for 100 min
99%
Sugarcane shell, pretreated 99%
Sugarcane marrow,
pretreated
99%
Paper pulp 44.20
Pine wood, untreated 90.41
Cow dung 92.73
The sugarcane baggase samples (untreated, pretreated, marrow and shell) were acquired from
Univeristy of Sao Paolo, Brazil. The pine wood, cow dung and paper pulp samples were obtained from
the Department of Chemical engineering of IST, University of Lisbon.
37
Dry matter conversion rate was calculated from difference in the weight of the dry sample and after
hydrolysis. After 72h of hydrolysis, the liquid was centrifuged at 18500 RCF (12000 r/min) for 8
minutes at 4 °C. The supernatant was removed, and the solids were filtered using a vacuum pump
with Whatman No. 1 filter paper. The paper with the sample was dried at 60 °C for 24h, and the weight
was measured.
4.2.1 Pretreatment of sugarcane bagasse
The biomass used in the experiments (bagasse from sugarcane) was obtaned from the Lacanga
located in Lacanga, São Paulo, Brazil. It was obtained in early 2014, and originated from the
2013/2014 harvest. The pretreatment of bagasse was carried out in collaboration with the physical
organic chemistry group coordinated by Prof. Dr. Antonio da Silva Curvelo Aprígio (IQSC-USP).
The sugarcane residue was collected directly from the alcohol production line. In order to remove any
remaining sugars in it, water extraction was done with the Soxhlet solvent, refluxed for about 8 cycles.
The residue was placed to dry in a convection oven at a temperature of about 40 °C, for 2 days, until it
contained a relative humidity percentage below 10% m/m and was subsequently stored at room
temperature. The moisture content was measured using a "Topray" thermobalance produced by "BEL
Engineering".
The different parts of the sugarcane, the bark and the marrow, were separated using a stationary drill.
These fractions were treated identically as the bagasse in the lignification process.
4.2.1.2 Delignification method
For delignification, a reactor with a 304-stainless steel screw cap was used, of total volume 195 cm3
(5.0 x 4.0 x 15.5 cm). 10 g of dried material (bagasse, marrow and skin) was dissolved with 16% Na2O
solution (w/w) and 0.15% anthraquinone solution (w/w) with solid-liquid ratio 1:10 . The method was
customized for laboratory conditions by the staff of University of Sao Paolo, Brazil.
The heating was done using a heat bath containing glycerol as the heating fluid, with digital
temperature control, while the reactors was immersed in the bath only when the fluid has reached the
desired temperature (160 °C). Reactions were terminated after 100 min, after which the reactors were
immediately placed in a water bath with ice. After cooling the pulp liquors were separated by filtration
at atmospheric pressure.
The pulp was subjected to a refining procedure using a shredder for about 5 min. In this procedure,
the cellulose fibers were separated from each other with a water solution. Then the pulp was filtered
under vacuum and washed with distilled water until obtaining a neutral pH in the filtrate. Subsequently,
the slurries were dried at room temperature and, after weighing and determining the moisture, passed
through the mill "Solab" SL31, and stored at room temperature.
38
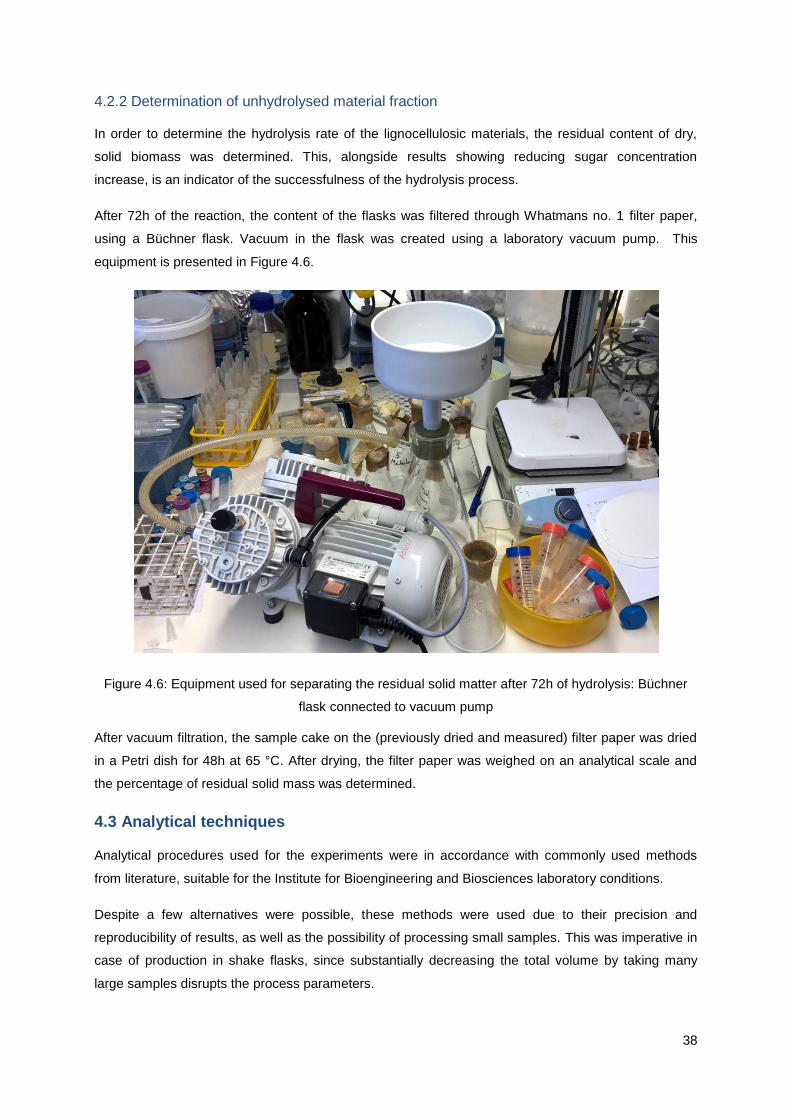
4.2.2 Determination of unhydrolysed material fraction
In order to determine the hydrolysis rate of the lignocellulosic materials, the residual content of dry,
solid biomass was determined. This, alongside results showing reducing sugar concentration
increase, is an indicator of the successfulness of the hydrolysis process.
After 72h of the reaction, the content of the flasks was filtered through Whatmans no. 1 filter paper,
using a Büchner flask. Vacuum in the flask was created using a laboratory vacuum pump. This
equipment is presented in Figure 4.6.
Figure 4.6: Equipment used for separating the residual solid matter after 72h of hydrolysis: Büchner
flask connected to vacuum pump
After vacuum filtration, the sample cake on the (previously dried and measured) filter paper was dried
in a Petri dish for 48h at 65 °C. After drying, the filter paper was weighed on an analytical scale and
the percentage of residual solid mass was determined.
4.3 Analytical techniques
Analytical procedures used for the experiments were in accordance with commonly used methods
from literature, suitable for the Institute for Bioengineering and Biosciences laboratory conditions.
Despite a few alternatives were possible, these methods were used due to their precision and
reproducibility of results, as well as the possibility of processing small samples. This was imperative in
case of production in shake flasks, since substantially decreasing the total volume by taking many
large samples disrupts the process parameters.

39
4.3.1 Determination of dry biomass content
Content of dry biomass was determined by centrifuging a 1 ml sample of the fermentation medium in
an 1.5 ml Eppendorf tube, for 8 minutes at 9600 RCF (12000 r/min), separating the supernatant and
washing the pellet with 1 ml isotonic saline water 3 times, then drying it at 60 °C for 24 hours. The
weight of the pellet was used to calculate the content of dry biomass per ml of medium.
For determining the total dry biomass content of a flask for any day of the fermentation, the whole
content of the Erlenmeyer flash was transferred into 50ml Falcon tubes, centrifuged for 8 minutes at
9600 RCF (12000 r/min) (as described in Chapter 4.4.1.) and dried in a Petri dish (that was previously
dried and weighed). After drying, the pellet was weighed and the content of dry biomass per ml of
medium was calculated. This method proved to give more replicable results with lower variation, but
required a separate flask to be preordained for this method for each day of fermentation.
4.3.2 Determination of fermentable sugars concentration
The concentration of the fermentable sugars present in the media was determined using the 3,5
dinitrosalicylic acid reagent (DNS) method, used for quantitative analysis of reducing sugars. [Miller,
1959.] All Measurements are done in triplicate.
The exact procedure is as follows:
100 μl of sample is transferred to wells in 1 ml well plate. Sample is diluted, if needed, so
concentration of reducing sugars falls into the method range of 0.5 - 5 g/l;
100 μl of DNS reagent is added to the well;
Well plate is heated for 5 minutes in 100 °C water bath; (Coloration of the samples is
presented in Figure 4.7.
500 μl of Milli-Q water is added to each well;
200 μl of sample from each well is transferred to a transparent well plate, used for measuring;
The well plate is transferred to a microplate spectrophotometer, where absorbance is recorded
for each well.

40
Figure 4.7: Well plate with DNS-treated samples
The results were presented as glucose equivalents. Because of this, results showing concentration of
disaccharides in the media (primarily lactose and cellobiose) were lower than their real values (by
about 80% for lactose and 60% for cellobiose).
4.3.3 Determination of enzymatic activity
A modification of the Filter Paper assay for Cellulase by Montenecourt [Montenecourt et al., 1978] was
used for determining the activity of the cellulase complex. This activity was determined by the release
of reducing sugars produced in 60 min from a mixture of 0.2 ml of an appropriately diluted enzyme
solution, 0.8 ml of 0.1 M acetate buffer, pH 4.8 and 20 mg Whatman No. 1 disks filter paper, incubated
at 50 °C. One international filter paper unit (FPU) was defined as the amount of enzyme that releases
1 μmol glucose min−1. The concentration of the reducing sugars in the assay after cellulase activity
was determined using the DNS method, identical to the one described in chapter 4.2.2. As a blank, the
concentration of fermentable sugars in the sample was used.
The general equation for calculating the Filter Paper Unit is showed in Figure 4.8.
𝐹𝑃𝑈 = (𝐶𝑜𝑛𝑐𝑒𝑛𝑡𝑟𝑎𝑡𝑖𝑜𝑛 𝑜𝑓 𝑠𝑢𝑔𝑎𝑟 𝑟𝑒𝑙𝑒𝑎𝑠𝑒𝑑 [𝑚𝑔
𝑚𝑙]) ∗
(𝑡𝑜𝑡𝑎𝑙 𝑣𝑜𝑙𝑢𝑚𝑒 𝑜𝑓 𝑎𝑠𝑠𝑎𝑦 [𝑚𝑙])
𝐺𝑙𝑢. 𝑀 [𝑚𝑔
𝜇𝑚𝑜𝑙] ∗ 𝑠𝑎𝑚𝑝𝑙𝑒 𝑣𝑜𝑙. [𝑚𝑙] ∗ 𝑑𝑢𝑟𝑎𝑡𝑖𝑜𝑛 [𝑚𝑖𝑛]
Figure 4.8: General equation for calculating enzymatic activity in mmol ml-1 min-1
In this part of the experimental work, there were several issues and inconsistencies encountered.
These are elaborated in Chapter 5.1.5, as well as in Appendix I.
4.3.4 Determination of extracellular protein concentration
For determination of enzyme concentration (which are a significant part of the whole extracellularly
secreted protein concentration), BCA (bicinchoninic acid assay) method was used. Also called Smith's

41
assay, it is a modification of the Lowry protein assay. It is a spectrophotometric method in which
assays change colour from light green to purple, based on the concentration of protein in the sample.
A calibration curve was formed, and used for calculation of protein. All samples were tested in
triplicates.
4.4 Enzyme separation and purification techniques
After fermentation, enzyme separation and purification techniques aim to separate enzymes from
other components of the media, as well as the fungus itself, all the while preserving their activity. Due
to available equipment and other circumstances, three basic techniques were used.
4.4.1 Centrifugation
Samples of the whole content of the Erlenmeyer flask was transferred into 50ml Falcon tubes,
centrifuged for 8 minutes at 18500 RCF (12000 r/min) and the firm pellet was separated from the
supernatant.
4.4.2 Precipitation with Ammonium-sulphate
For obtaining the extract of the enzymatic complex, ammonium-sulphate was added in small
increments until reaching saturation. 50 ml of supernatant of the fermentation was used (obtained
using the process from Chapter 4.4.1.).
4.4.3 Ultrafiltration
The equipment used for ultrafiltration was a stirred concentrator produced by Diaflo, with the capacity
of 50 ml. The membrane used in this experiment was a Millipore polysulphonic membrane with pore
diameter equivalent to 5000 Da. Pressure of 3 atm was used, and the equipment was kept at room
temperature.

42
5. Results and Discussion
The group of experiments that was originally planned to be part of this work was different, and the
work plan had to be adapted due to some unexpected issues. To be specific, the original idea was to
test the cellulase production performance of the fungus in shake flasks and proceed to production in
the stirred fermenter. Then, a set of experiments on separating and purifying the cellulase complex
was to be made. However, in the first stages of work a very low enzymatic activity was observed,
which is attributed to loss of activity of the fungus during extensive time in cryotube storage. Also,
problems with low reproducibility of results in some analytical techniques (determination of enzymatic
activity, determination of dry biomass content) demanded additional time to be spent on determining
the reasons for these difficulties, as well as overcoming them.
5.1 Production in shake flasks
Production of the cellulolytic enzyme complex was performed in order to examine production in a
batch cultivation, as well as optimizing the production process.
In order to stimulate the enzymatic complex production, the spore solution from the cryotubes was
grown on solid medium (as described in Chapter 4.1.4.). This was done in order tovercome poor
enzymatic activity that was noticed in the initial laboratory work stages. After this, spores obtained
from the solid medium were propagated on slants in test tubes, and used for inoculating all further
fermentations.
The length of the prefermentation (48h) proved to be optimal, since it proved to be sufficient for
formation of short (2-5 mm) filamentous strands of mycelium to form, enabling equal amounts of
fungus to be transferred to fermentation flasks during inoculation. If the prefermentation time was
prolonged for another 24 hours, the fungus would form large pellets, making the inoculum less
homogeneous.
Initially, an attempt was made to replicate the procedure and results by F.C. Domingues [Domingues
et al., 2001.]. Results of this set of experiments are presented in Figure 5.1.

43
Figure 5.1: Results for dry mass and fermentable sugar content for Trichoderma Minimal Medium,
shake flask production according to procedure by Domingues et al., 2001.
These values and trends seem reasonable, compared to the values obtained in literature. Although
residual fermentable sugar concentrations are quite high to those in large bioreactors, this is
understandable due to inferior production conditions in 250 ml shake flasks.
At this stage, no valid results were obtained for protein concentration and enzyme activity, and thus
these results are omitted from the figure above. Certain discrepancies were observed in the DNS
techniques used for determining sugar concentration after enzymatic activity. These are explained in
Chapter 5.1.5.
5.1.1. Effect of fermentation volume on Filter paper activity
In order to enable taking a higher number of larger samples, an analysis was made to test the effect of
increasing the total volume of the fermenattion liquid. Shake flasks of 250 and 500 ml with 55 and 110
ml of fermentation liquid, respectively, were used. Results of this experment are presented in Table
5.1. Except the shake flask size, all other parameters are identical to the first set of exeriments.
0
5
10
15
20
25
30
35
40
45
50
0 50 100 150 200
Co
ncen
trati
on
[g
/l]
Time [h]
TMM Fermentation
Fermentable sugars content[g/l]
Dry matter content [g/l]
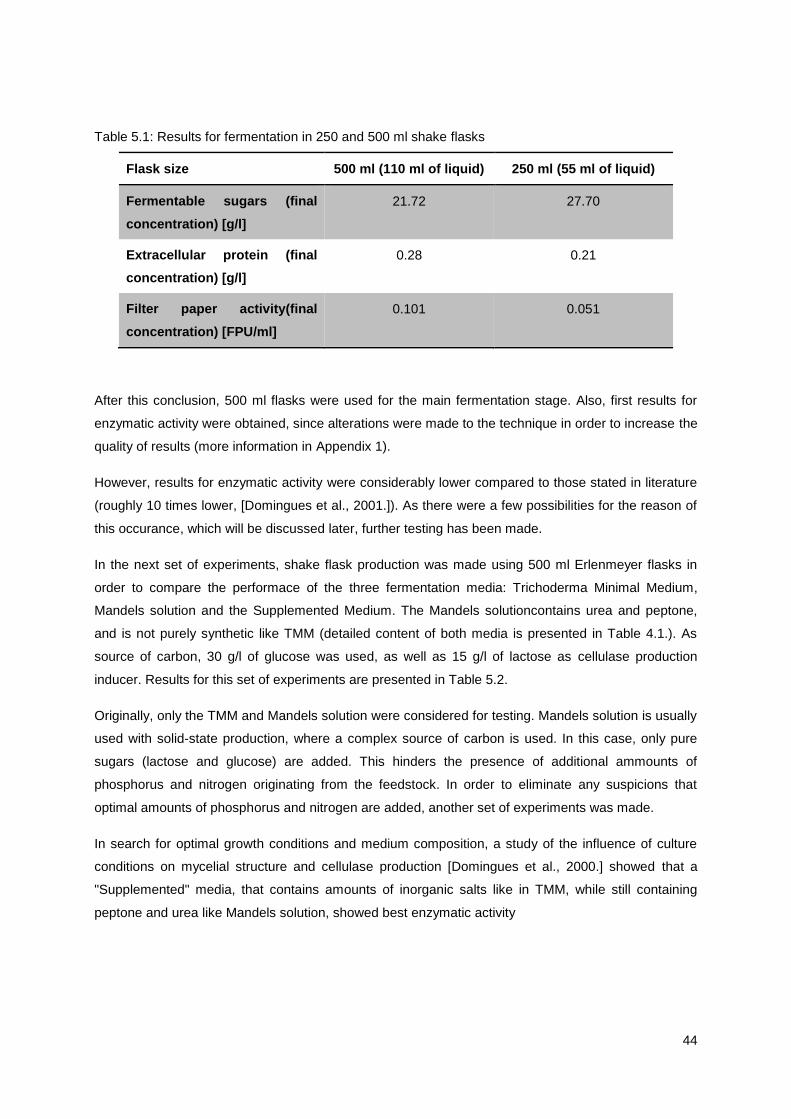
44
Table 5.1: Results for fermentation in 250 and 500 ml shake flasks
Flask size 500 ml (110 ml of liquid) 250 ml (55 ml of liquid)
Fermentable sugars (final
concentration) [g/l]
21.72 27.70
Extracellular protein (final
concentration) [g/l]
0.28 0.21
Filter paper activity(final
concentration) [FPU/ml]
0.101 0.051
After this conclusion, 500 ml flasks were used for the main fermentation stage. Also, first results for
enzymatic activity were obtained, since alterations were made to the technique in order to increase the
quality of results (more information in Appendix 1).
However, results for enzymatic activity were considerably lower compared to those stated in literature
(roughly 10 times lower, [Domingues et al., 2001.]). As there were a few possibilities for the reason of
this occurance, which will be discussed later, further testing has been made.
In the next set of experiments, shake flask production was made using 500 ml Erlenmeyer flasks in
order to compare the performace of the three fermentation media: Trichoderma Minimal Medium,
Mandels solution and the Supplemented Medium. The Mandels solutioncontains urea and peptone,
and is not purely synthetic like TMM (detailed content of both media is presented in Table 4.1.). As
source of carbon, 30 g/l of glucose was used, as well as 15 g/l of lactose as cellulase production
inducer. Results for this set of experiments are presented in Table 5.2.
Originally, only the TMM and Mandels solution were considered for testing. Mandels solution is usually
used with solid-state production, where a complex source of carbon is used. In this case, only pure
sugars (lactose and glucose) are added. This hinders the presence of additional ammounts of
phosphorus and nitrogen originating from the feedstock. In order to eliminate any suspicions that
optimal amounts of phosphorus and nitrogen are added, another set of experiments was made.
In search for optimal growth conditions and medium composition, a study of the influence of culture
conditions on mycelial structure and cellulase production [Domingues et al., 2000.] showed that a
"Supplemented" media, that contains amounts of inorganic salts like in TMM, while still containing
peptone and urea like Mandels solution, showed best enzymatic activity
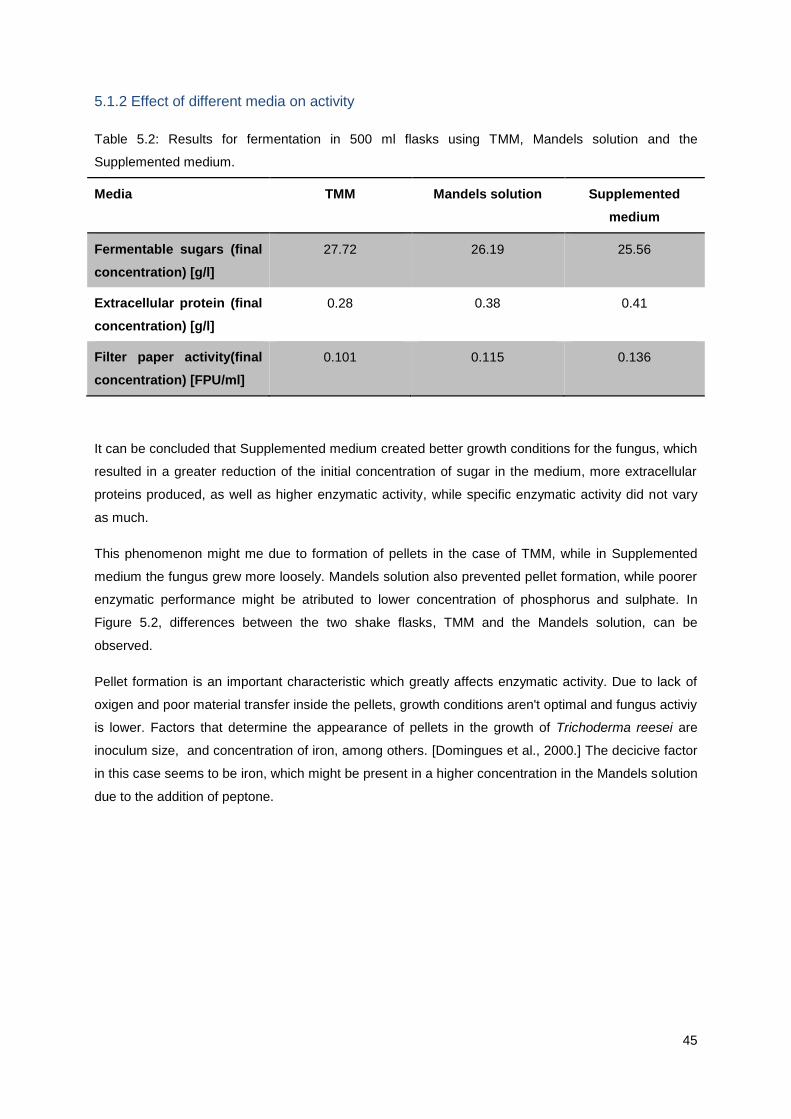
45
5.1.2 Effect of different media on activity
Table 5.2: Results for fermentation in 500 ml flasks using TMM, Mandels solution and the
Supplemented medium.
Media TMM Mandels solution Supplemented
medium
Fermentable sugars (final
concentration) [g/l]
27.72 26.19 25.56
Extracellular protein (final
concentration) [g/l]
0.28 0.38 0.41
Filter paper activity(final
concentration) [FPU/ml]
0.101 0.115 0.136
It can be concluded that Supplemented medium created better growth conditions for the fungus, which
resulted in a greater reduction of the initial concentration of sugar in the medium, more extracellular
proteins produced, as well as higher enzymatic activity, while specific enzymatic activity did not vary
as much.
This phenomenon might me due to formation of pellets in the case of TMM, while in Supplemented
medium the fungus grew more loosely. Mandels solution also prevented pellet formation, while poorer
enzymatic performance might be atributed to lower concentration of phosphorus and sulphate. In
Figure 5.2, differences between the two shake flasks, TMM and the Mandels solution, can be
observed.
Pellet formation is an important characteristic which greatly affects enzymatic activity. Due to lack of
oxigen and poor material transfer inside the pellets, growth conditions aren't optimal and fungus activiy
is lower. Factors that determine the appearance of pellets in the growth of Trichoderma reesei are
inoculum size, and concentration of iron, among others. [Domingues et al., 2000.] The decicive factor
in this case seems to be iron, which might be present in a higher concentration in the Mandels solution
due to the addition of peptone.
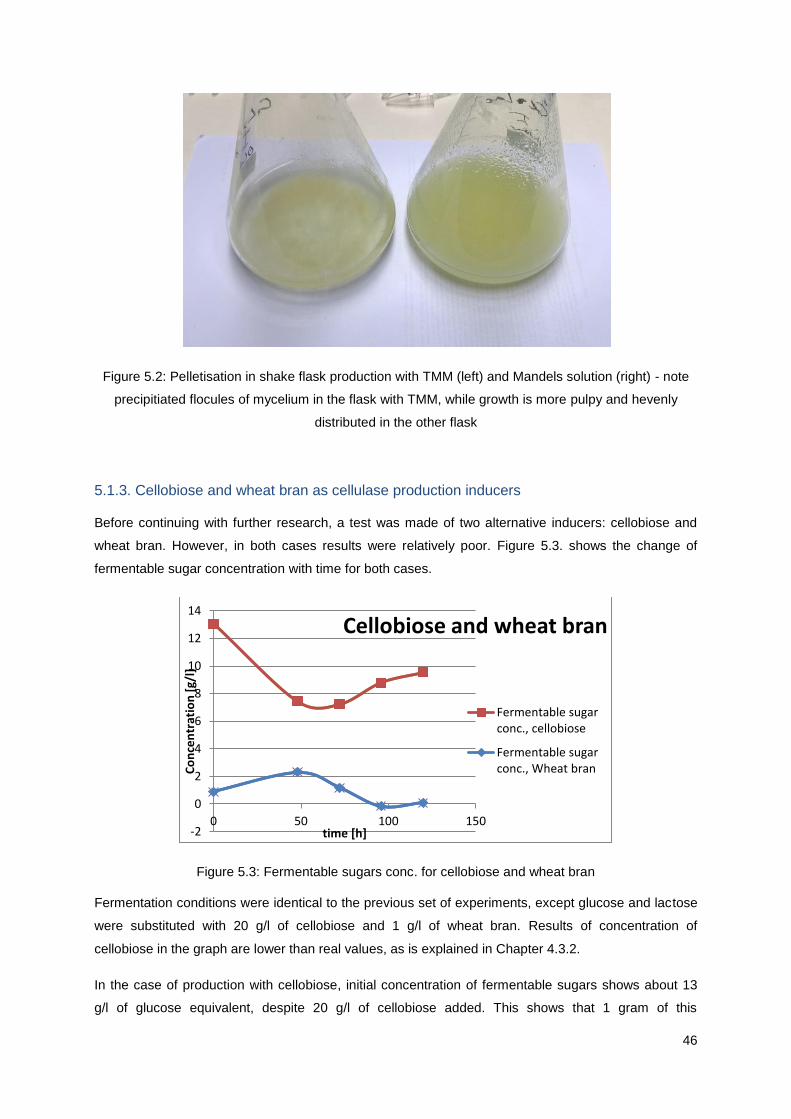
46
Figure 5.2: Pelletisation in shake flask production with TMM (left) and Mandels solution (right) - note
precipitiated flocules of mycelium in the flask with TMM, while growth is more pulpy and hevenly
distributed in the other flask
5.1.3. Cellobiose and wheat bran as cellulase production inducers
Before continuing with further research, a test was made of two alternative inducers: cellobiose and
wheat bran. However, in both cases results were relatively poor. Figure 5.3. shows the change of
fermentable sugar concentration with time for both cases.
Figure 5.3: Fermentable sugars conc. for cellobiose and wheat bran
Fermentation conditions were identical to the previous set of experiments, except glucose and lactose
were substituted with 20 g/l of cellobiose and 1 g/l of wheat bran. Results of concentration of
cellobiose in the graph are lower than real values, as is explained in Chapter 4.3.2.
In the case of production with cellobiose, initial concentration of fermentable sugars shows about 13
g/l of glucose equivalent, despite 20 g/l of cellobiose added. This shows that 1 gram of this
-2
0
2
4
6
8
10
12
14
0 50 100 150
Co
nce
ntr
atio
n [
g/l]
time [h]
Cellobiose and wheat bran
Fermentable sugarconc., cellobiose
Fermentable sugarconc., Wheat bran

47
disaccharide is detected by the DNS method as roughly 0.65 grams of glucose equivalent. However,
after the third day of fermentation, there is an increase in sugar concentration, due to hydrolysis of
cellobiose.
As for wheat bran, a small initial concentration of sugar originates from the prefermentation where
glucose is present, since 10% of inoculum was used. In the following days, an increase of sugar
concentration occurs due to some cellulolytic activity, but after 4 days the sugars released are
metabolysed. As stated above, activity was poor in both cases compared to results obtained in
previous experments. Results are presented in Figure 5.4.
Figure 5.4: Enzymatic activity in FPU for cellobiose and wheat bran
5.1.4. Effect of the addition of Tween 80 on enzymatic activity
In literature, the comercial surfactant Tween 80 is commonly added to the producion media in order to
prevent pellet growth and enable higher enymatic activity. However, our results haven't showed any
noticable impact of the addition of 0.5 g/l of Tween 80 on enzymatic activity. Also, there were issues
with sterilisation of Tween solutions, and they were prone to contamination. In order not to overextend
the span of experimental work, this phenomenon was not studied further.
5.1.5 Impact of fermentable sugar concentration on determining enzymatic activity in Filter
paper assay
In order to examine the reason to poor enzyme activity of the fungus, compared to values in literature,
a test was made to insure that the enzymatic activity measuring procedure itself isn't problematic. In
literature, there is a lot of ambiguity on the exact procedures used in the Filter paper assay method.
The exact method for calculating the enzymatic activity is also rather vaguely explained in literaure.
What is generally mentioned is that the samples should release of 2 mg reducing sugar/h in the assay
conditions. [Montenecourt and Eveleigh, 1978.]
0
0.02
0.04
0.06
0.08
0.1
0 50 100 150
FPU
/ml]
time [h]
Cellobiose and wheat bran
Enzymaticactivity,Cellobiose
Enzymatic activity,wheat bran

48
The sample of the supernatant from the fermentation was diluted and activity was measured. Diluted
solutions contained 1:1, 1:3 and 1:7 of sample to water ratio, respectively. Results of this experiment
are present in Figure 5.5.
Figure 5.5: Effect of dilution of sample on result of Filter paper assay (percentage representing the
content of supernatant in diluted sample)
What is observed from these results is an almost logarithmic dependency of dilution of the sample on
activity. There are three possible reasons for this phenomenon, and most probably all three contribute
in its occurence more or less.
First, there is a high concentration of sugar is present in the sample (30 g/l of glucose and 15 g/l of
lactose are used in the main fermentation), even after 5 days of growth, due to poor growth conditions
in shake flasks. The DNS method, used for determining the concentration of sugar in the samples
ranges from 0.5 to 5 g/l of glucose equivalent. Due to this reason, samples of the supernatant are
diluted prior to measurement 5 to 10 times. The units of enzymatic activity are calculated based on the
difference of sugar concentration in the assay where the cellulase complex hydrolised filter paper and
the blank, which contains only the supernatant with the enzymes. Diluting these assays in order to
make them adequate for the DNS method also "dilutes" the concentration of sugars resulting from
enzymatic activity, which can cause higher standard deviation and low precision in measurement.
Secondly, a high concentration of glucose in the sample can cause inhibition of enzymatic activity by
product. Since a significant amount of the product of the desired reaction is already present in the
solution, the kinetics of the hydrolysis reaction can be affected.
Finally, another reason for higher activity in diluted samples is due to a larger contact surface being
available per enzymatic unit. This enables higher activity, since a smaller fraction of the enzymes
remaines inactive due to lack of binding locations on the paper surface.
0.00
0.05
0.10
0.15
0.20
0.25
0.30
0 20 40 60 80 100
FPU
[/]
Dillution of sample [% of supernatant volume in sample]
Effect of dillution ofsample on result of FPA

49
After these conclusions, in further experiments samples of the supernatant were diluted 4 times prior
to application in the enzymatic assay.
Another group of flask fermentations was made, this time applying the above mentioned correction to
the analytical method. This time, the "Supplemented" media showed higher activity than previously.
These results are presented in Figure 5.6.
Figure 5.6: Enzymatic activity of T. reesei grown the three media
It can be observed from the graph in Figure 5.6 that although, the activity of the TMM and Mandels
solution continued to grow up to 120 hours, the maximum activity for the Supplemented medium
proved to be just after three days of fermentation, and at that point higher that the maximum activity
for the other two media. Lower fermentation time is preferable, and in this case the Supplemented
medium proved supperior. This also coresponds to literature data [Domingues, 2001.]
5.1.6 Specific activity of the enzymatic complex
Although concentration of extracellular protein and filter paper activity are good indicators, specific
activity of the enzymatic complex gives us a better understanding of the enzymes ability of hydrolyzing
cellulose. This value represents the activity of an enzyme per milligram of total protein (expressed in
μmol mg−1). Specific activity gives a measurement of enzyme purity in the mixture.
For this work, samples were taken every 24h, and enzymatic activity and protein content were
measure. These results are presented in Figure 5.7.
0.00
0.05
0.10
0.15
0.20
0.25
0.30
0.35
0.40
0 50 100 150
FPU
[/]
Time (h)
TMM
Mandels solution
Supplementedmedium

50
Figure 5.7: Specific activity of cellulase enzymatic complex (Supplemented medium)
Similarly to what is seen is figure 5.6, the peak activity is on day 3. After that, the specific activity drops
and remains in a constand steady drop. Compared to results obtained in literature [Domingues et al.,
2001.], specific activity in this case is significantly lower - 10 to15 times worse. This is another
indicator that the fungus's ability to secrete working cellulolytic enzyme was compromised. This
spoilage is more prominantly visible here than when comparing values of results for enzymatic activity
and extracellular protein concentration. The possible reasons for these unwanted effects will be
discussed in the conclusions chapter of this paper.
5.2 Sugarcane baggase hydrolysis kinetics
Testing of the Trichoderma enzymatic complex on untreated, pretreated sugarcane baggase, as well
as different parts of the sugarcase were made. Several other waste materials were used, pine wood,
paper pulp and cow dung. A solution of the supernatant in a 0.05M citrate buffer (pH 4.75) was made.
The sample was diluted to obtain 1 FPU/mg of dry material. Thus, 0.1g of dry material was suspended
in a total volume of 50 ml.
For this experiment, the Supplemented medium was used, since it proved to provide the highest
enzymatic activity. The fermentation was stopped after after 3 days, when the activity is highest, by
centrifuging a sample of the medium. This supernatant was used for preparing solutions.
Samples were taken periodically, centrifuged at 9600 RCF (12000 r/min) for 5 minutes to separate the
remaining solids and the supernatant was used to determine the concentration of sugar using the DNS
method. All samples were made in duplicate, and a blind was made with omitting baggase. A separate
flask was used for determining the dry mass after 72h.
0
0.1
0.2
0.3
0.4
0.5
0.6
0.7
0.8
0.9
0 50 100 150
Spe
c ac
tivi
ty (
FPU
/ m
g o
f p
rote
in)
TIme (h)
Specific activity of the enzymatic complex
Specific activity

51
The materials were compared to a comercial cellulolytic enzymatic complex dissolved in the buffer to
adequate concentration and bagasse pretreated for 100 min.
The kinetics of the reaction of the Trichoderma cellulasic enzymatic complex with bagase for the
duration of 72h is presented in Figure 5.8.
Figure 5.8: Kinetics of the reaction of the Trichoderma cellulolytic enzyme complex with sugarcane
bagase
The chemical structure of some of the materials in Figure 5.8. is presented in Table 5.3. As it can be
noticed, untreated bagasse had a significantly higher level of Lignin, which was greatly reduced in the
process of pretreatment. This exposed the cellulose molecules to the enzymes and resulted in a
higher glucose yield in pretreated samples.
Table 5.3: Structure of sugarcane bagasse, untreated, pretreated, marrow and stalk.
Samples Cellulose (%) Hemicellulose
(%)
Lignin (%) Ashes (%) Total
(%)
Untreated
bagasse
41,73±2,52 26,01±0,92 26,54±1,83 0,26 94,5±1,6
Treated
bagasse (100
min)
63,77±3,16 26,24±0,23 9,99±7,16 2,96 102,9±10,1
Medula (100
min)
64,67±5,27 26,40±1,42 9,38±4,98 0,42 100,8±11,7
Casca (100
min)
69,97±2,39 25,67±0,44 9,05±5,49 0,22 104,9±7,4

52
Another important parameter is the reduction of the amount of dry matter as a result of hydrolysis. The
weight reduction was measured as a comparisson of dry matter weight prior to hydrolysis and after
hydrolysis and separation of liquid by filtration. Data for eatch material is presented in Figure 5.9.
Figure 5.9: Reduction of solid matter content [%] after 72h of hydrolysis
As for sugar concentration increase, the pretreated sugarcane marrow had highest overall yield. This
is understandable, since the structure of this part of the sugarcane stalk had porous structure with a
higher cellulose to hemicellulose ratio. Second best are the flasks with 100 min pretreated bagasse.
One with the commercial enzyme had higher activity after 24h, while for the Trichoderma-produced
enzymatic complex yield gradually increased over the period of 72 hours. Poorest yield was with
untreated bagasse and pine wood.
The results for both sets of experiments show that values for pretreated bagasse is the mean of
values for the shell and marrow, since the bagasse sample is composed out of a mix of these two
sugarcane parts.
5.3 Separation and purification of the enzymatic complex
5.3.1 Results of gel electrophoresis of extracellular proteins obtained during fermentation
In order to prove the presence of cellulolytic enzymes, gel electrophoresis was used on samples of
supernatant collected from fermentation. In Figure 5.10, results of this experiment are shown. The
samples according to lanes are, from left to right: Lane 1 - markers, Lane 2 - comercial cellulase
enzyme, Lane 3 and 4 - Trichoderma reesei fermentation supernatant samples. Samples in 3 and 4
are duplicates.
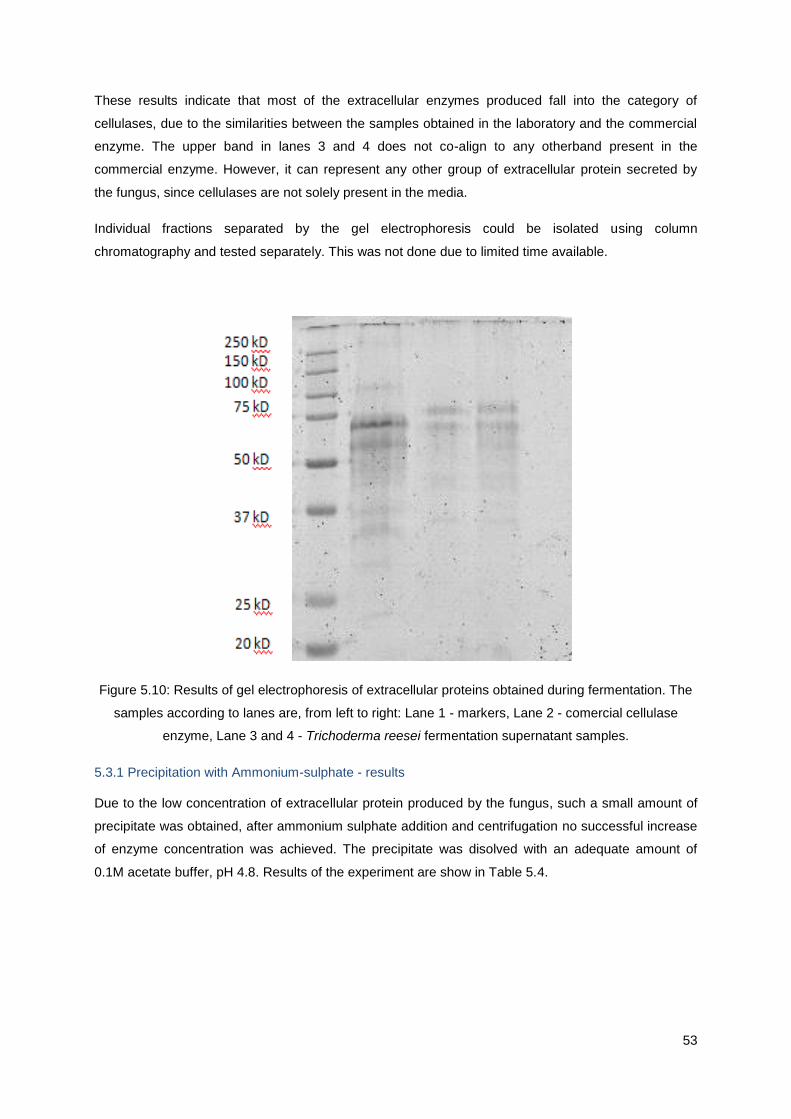
53
These results indicate that most of the extracellular enzymes produced fall into the category of
cellulases, due to the similarities between the samples obtained in the laboratory and the commercial
enzyme. The upper band in lanes 3 and 4 does not co-align to any otherband present in the
commercial enzyme. However, it can represent any other group of extracellular protein secreted by
the fungus, since cellulases are not solely present in the media.
Individual fractions separated by the gel electrophoresis could be isolated using column
chromatography and tested separately. This was not done due to limited time available.
Figure 5.10: Results of gel electrophoresis of extracellular proteins obtained during fermentation. The
samples according to lanes are, from left to right: Lane 1 - markers, Lane 2 - comercial cellulase
enzyme, Lane 3 and 4 - Trichoderma reesei fermentation supernatant samples.
5.3.1 Precipitation with Ammonium-sulphate - results
Due to the low concentration of extracellular protein produced by the fungus, such a small amount of
precipitate was obtained, after ammonium sulphate addition and centrifugation no successful increase
of enzyme concentration was achieved. The precipitate was disolved with an adequate amount of
0.1M acetate buffer, pH 4.8. Results of the experiment are show in Table 5.4.

54
Table 5.4: Comparison of activity of supernatant acquired collected from fermentation (Supplemented
medium, 4th day) and solution of precipitate generated with the addition of ammonium sulphate.
Enz. activity [FPU/ml]
Supernatant from
fermentation
0.28
Precipitate 0.09
5.3.2. Ultrafiltration results
Ultrafiltration proved to be the most effective out of the techniques applied in this work which aim to
concentrate the secreted enzymes. The procedure applied is described in detail in chapter 4.4.3.
Figure 5.11. represents the equipment used for this experiment.
Figure 5.11: Equipment used for concentrating the supernatant obtained from fermentation
The supernatant was obtained from a shake flask fermentation using the "Supplemented" medium,
after 4 days of incubation. After ultrafiltration, the permeate and the retentate fractions were used to
determine protein concentration and enzymatic activity. These results are presented in Table 5.5.

55
Table 5.5: Results of analysis of retentate and permeate samples obtained from ultrafiltration.
Fraction Volume [ml] Enz. activity [U/ml] Protein content [g/l]
Supernatant before
ultrafiltration
48 0.147 0.38
Retentate 12 0.135 0.48
Permeate 36 0.02 0.31
From the results from the table above, we can conclude that although a large amount of protein
passed through the membrane (61.1%), an increase in protein concentration was achieved. However,
since 27,3 % of the enzymes lost their activity, the number of FPU/ ml in the retentate solution is
lower, despite the larger concentration of protein. As for the protein in the permeate, 83.3% of the
protein that passed through the membrane lost their activity.
In conclusion, although this method was the only one in which protein concentrating was achieved,
enzymatic activity of the concentrated solution was lower.

56
6. Conclusions
What greatly determined the course of the experimental work related to this thesis was the obvious
reduction of activity of the fungus that was used for production of the cellulase enzymatic complex.
This was noticed in the first stages of research, when experimental conditions from literature
[Domingues et al., 2001.] were replicated using the same strain. Preliminary results in Filter Paper
activity, extracellular protein concentration and consumption of nutrients in media indicated that the
activity of the fungus was compromised.
In order to determine the reason for these issues, many variations to the original setup were tested.
Size of fermentation flasks, different media, sample volume, various enzyme production inducers and
media additives were tested and selected for further experiments based on their performance.
Although this improved the results greatly compared to the values obtained initially, still they were 2-10
times lower than what was expected based on information from literature.
Reasons for this are hard to determine with limited time and equipment availability. Since the spores
of the T. reesei fungus were stored in a cryogenic vial, in a deeply frozen state, for 15 years, this might
cause the poor performance of the fungus. Although results for extracellular protein concentration are
slightly lower than literature results, cellulolytic activity of the enzymes is disproportionally lower. This
indicates that either the enzymes are secreted, but are inactive for some reason, or they are
inactivated due to the action of proteases.
Nonetheless, based on the setup and experimental conditions that showed best performance in
enzymatic activity, samples of the enzymatic complex were obtained and tested. Some hydrolytic
reactions of various samples containing cellulose were observed, but these were hindered due to low
enzyme concentration. What greatly reduced the ability to properly determine the activity of these
enzymes were high values of residual sugar in the media. This caused the slight variations in glucose
concentration increase (due to hydrolysis of cellulose) to be measured with less accuracy.
In order to overcome these problems, tests were made on applying various methods of enzyme
purification. These attempts proved to be unsuccessful, due to the same general issues with the
fermentation: low protein content and high residual sugar concentration.
Finally, although the initial expectations for this thesis were mostly unachievable, attempts were made
to work with existing conditions in ways that would maximize results. Although these findings might not
be of scientific importance for improvement of cellulase production efficiency, it might have a didactic
value to it. It could show to a younger researcher which paths to take when faced with unexpected
results, and to stay encouraged, since in science all knowledge gained is precious.
57
7. Scope for future research
Since there is many reasons to believe that biomass is a promising feedstock for production of
biofuels and chemicals, certain improvements in the technology of cellulase production have to be
made. Research should be focused on key issues that affect the cost-effectiveness of the process.
Overcoming them would enable this technology to be competitive to conventional methods of (bio)fuel
and chemical production.
Firstly, the expenses on the growth media could be lowered by researching how new substrates would
affect cellulase production. Waste streams from certain industries could be used as a basis for the
fermentation media, not only as a source of carbon, but of other macro- and micronutrients as well.
Also, although applying lower nutrient concentration decreases enzyme production, it results in lower
residual concentrations of medium components after fermentation. This increases efficiency of
production (nutrients used / nutrients spent) and simplifies downstream processing.
Submerged production is beneficial compared to solid-state, and improvements should be made in
this process. Pellet formation affects enzyme production efficiency greatly, and more data about this
poorly understood phenomenon should be collected.
Integrating cellulase hydrolysis with fermentation is promising, since it is logistically simpler and time-
effective. The transition between these two very different steps in the process should be managed by
compromising operational parameters without affecting overall performance.
What greatly affected the structure of this thesis significantly is the obvious loss of activity of the
working microorganism during storage. This indicates that not only stability of mutated strains should
be improved, but an effort should be made to discover new wild species with better properties and
performance. Then, with improving genetic modification technologies, these favourable traits could be
further improved and refined.
Finally, a more well-defined and universally applicable method for measuring enzymatic activity
should be developed. In the work that is on display above, enzyme concentration, as well as the
amount of residual sugars in the sample after fermentation, greatly influence the apparent filter paper
assay results. For same samples a range of enzymatic activity values was obtained dependant on the
dilution of the samples. This can create confusion among researchers when trying to replicate results.
Clarity and brevity is of paramount importance in scientific research.

58
References
Bisaria, V. S. and Ghose, T. K., "Biodegradation of cellulosic materials: substrates, microorganisms,
enzymes and products". Enzyme Microb. Technol. 3, pp. 90–104.; 1981.
Coughlan, M.P, "The properties of bacterial and fungal cellulases with comment on their production
and application". Biotech. Genet. Eng. Rev. 3, pp. 39-109; 1985.
Demers Alexander, Doane Richard, Guzman Scott, Pagano Ryan, "Enzymatic Hydrolysis of Cellulosic
Biomass for the Production of Second Generation Biofuels". Worcester Polytechnic Institute;
2009.
Domingues F.C., Queiroz J.A., Cabral J.M.S., Fonseca L.P., "Production of cellulases in batch culture
using a mutant strain of Trichoderma reesei growing on soluble carbon source". Biotechnology
Letters 23: pp. 771–775; 2001.
Domingues F.C., J.A. Queiroz, J.M.S. Cabral, L.P. Fonseca, "The influence of culture conditions on
mycelial structure and cellulase production by Trichoderma reesei Rut C-30". Enzyme and
Microbial Technology, Issue 26, pp. 394–401; 2000.
Domingues F.C., "Produçaõ e Recuperaçaõ de Celulases de Trichoderma reesei". PhD thesis; 2001.
Dos Santos Márcia França Ribeiro Fernandes, Borschiver Suzana, Couto Maria Antonieta Peixoto
Gimenes, "Initiatives for the use of biomass in Ligno Cellulosic Feedstock Biorefineries: the
sugar platform in the world and in Brazil". Economy & Energy, Year XIV-No 82; 2011.
Ergun R., Guo J., Huebner-Keese B., "Cellulose". Encyclopedia of Food and Health, 694-702; 2016.
Eveleigh, D. E., "Reducing the cost of cellulase production - selection of the hypercellulolytic
Trichoderma reesei RUT-C30 mutant". New Brunswick: Rutgers University; 1982.
Ferreira Susana M. P., Duarte Ana P., Queiroz João A., Domingues Fernanda C., "Influence of buffer
systems on Trichoderma reesei Rut C-30 morphology and cellulase production". Microbial
Biotechnology, Vol. 12 No. 3; 2009.
Glenn, M., Ghosh, A., Ghosh, B. K., "Subcellular fractionation of a hypercellulolytic mutant,
Trichoderma reesei Rut-C30: localization of endoglucanase in microsomal fraction". Appl
Environ Microbiol 50, pp. 1137–1143; 1985.
Ghosh A., Al-Rabiai S., Ghosh B. K., Trimiño-Vazquez, H., Eveleigh D. E. and Montenecourt B. S.,
"Increased endoplasmic reticulum content of a mutant of Trichoderma reesei (RUT-C30) in
relation to cellulase synthesis". Enzyme Microb Technol 4, pp. 110–113; 1982.
Ghosh, A., Ghosh, B. K., Trimiño-Vazquez, H., Eveleigh, D. E., Montenecourt, B. S., "Cellulase
secretion from a hypercellulolytic mutant of Trichoderma reesei Rut-C30". Arch Microbiol 140,
pp. 126–133; 1984.
59
Gosh, B.K., Gosh, A., "Degradation of Cellulose by Fungal Cellullase. In Microbial Degradation of
Natural Products". ed. G. Winkelmann, VCH Publishers, Inc., New York, pp.84-126; 1992.
Huber, George W.; Iborra, Sara; Corma, Avelino, "Synthesis of Transportation Fuels from
Biomass: Chemistry, Catalysts, and Engineering". Chem. Rev. 106 (9): 4044–98.; 2006.
Ilmén M., Thrane C., Pentillä M., "The glucose repressor gene cre1 of Trichoderma: isolation and
expression of a full length and a truncated mutant form". Mol. Gen. Genet. 251: 451–460;
1996.
International Energy Agency (IEA), "KEY WORLD ENERGY STATISTICS". OECD/IEA, France; 2015.
Kadam K, Keutzer W, "Enhancement in cellulase production by Trichoderma reesei Rut-C30 due to
citric acid". Biotechnol. Lett. 17: pp. 1111–1114; 1995.
Katzen Raphael, Schell Daniel J., "Lignocellulosic Feedstock Biorefinery: History and Plant
Development for Biomass Hydrolysis". Biorefineries – Industrial Processes and Products, pp.
129-137; 2006.
Paul, N., Kemnitz, D., "Biofuels- Plant raw materials, Products". Fachagentur, Nachwachsende
Rohstoffe eV (FNR), WPR communications, Beriln, pp.43; 2006.
Kim Kee Woung and Lee Sun Bok, "Inhibitory Effect of Maillard Reaction Products on Growth of the
Aerobic Marine Hyperthermophilic Archaeon Aeropyrum pernix". Appl Environ Microbiol.;
Issue 69(7): pp. 4325–4328; 2003.
Lamed, R., Naimark, J., Morgenstern, E. and Bayer, E.A.. "Specialized cell surface structures in
cellulolytic bacteria". J. Bacterial. 169, pp. 3792-3800; 1987.
Lejeune R., Baron G.V., "Effect of agitation on growth and enzyme production of Trichoderma reesei
in batch fermentation". Appl. Microbiol. Biotechnol., 43, pp. 249-258; 1995.
Liguori Rossana, Faraco Vincenza, "Biological processes for advancing lignocellulosic waste
biorefinery by advocating circular economy". Bioresource Technology;2016.
Mandels Mary, Reese Elwyn T., "Induction of cellulase in trichoderma viride as influenced by carbon
sources and metals". J Bacteriol. Issue 73(2): pp. 269–278; 1957.
Mansfield, S.D., Mooney, C., Saddler, J.N., "Substrate and enzyme characteristics that limit cellulose
hydrolysis". Biotechnol. Prog. 15, pp. 804–816.; 1999.
Marzieh Badiei, Nilofar Asim, Jamilah M Jahim, Kamaruzzaman Sopian, "Comparison of Chemical
Pretreatment Methods for Cellulosic Biomass", APCBEE Procedia 9, pp.170 – 174; 2014.
60
Maurer S. A., Bedbrook C. N., Radke C. J., "Cellulase Adsorption and Reactivity on a Cellulose
Surface from Flow Ellipsometry", Industrial & Engineering Chemistry Research, American
Chemical Society, pp. 11389-11400; 2012.
Miller Gail Lorenz, "Use of DinitrosaIicyIic Acid Reagent for Determination of Reducing Sugar".
Analytical Chemistry, Vol. 31, No. 3, pp. 426-429; 1959.
Montenecourt Bland S., Eveleigh Douglas E., Elmund G. Keith, Parcells John, "Antibiotic Disks - An
Improvement in the Filter Paper Assay for Cellulase". Biotechnology and Bioengineering Vol.
XX, pp. 297-300; 1978.
Papagianni Maria, "Fungal morphology and metabolite production in submerged mycelial processes".
Biotechnology Advances, vol. 22, no. 3, pp. 189-259; 2004.
Paris M. J, Tavares Cardoso M. A. And Fonseca Luis P., "Towards Bioethanol: An Overview Of Whole
Lignocellulose Processing". Research and Reviews in Materials Science and Chemistry, Vol.
4, Issue 2, pp. 55-118; 2014.
Penttilä, M., H. Nevalainen, M. Rättö, E. Salminen, and J. Knowles, "A versatile transformation system
for the cellulolytic filamentous fungus Trichoderma reesei". Gene 61:155–164; 1987.
Peterson Robyn, Nevalainen Helena, "Trichoderma reesei RUT-C30 – thirty years of strain
improvement". Microbiology, 158, pp. 58–68; 2012.
Polaina Julio, MacCabe Andrew P.," Industrial Enzymes, Structure, Function and Applications",
Instituto de Agroquímica y Tecnología de Alimentos, CSIC, Valencia, Spain, 2007.
Rezaei Farzaneh, Richard Tom L., Logan Bruce E., "Enzymatic Hydrolysis of Cellulose Coupled With
Electricity Generation in a Microbial Fuel Cell". Biotechnology and Bioengineering, Vol. 101,
No. 6, pp. 1163-1169, December 15; 2008.
Rutz Dominik, Janssen Rainer, "BioFuel Technology Handbook". WIP Renewable energies; 2007.
Ryu D. D. Y. and Mandels M., "Cellulases: biosynthesis and applications". Enzyme Microb. Technol. 2,
pp. 91–102; 1980.
Seiboth Bernhard, Ivanova Christa, Seidl-Seiboth Verena, Trichoderma reesei: "A Fungal Enzyme
Producer for Cellulosic Biofuels, Biofuel Production-Recent Developments and Prospects".
Chapter 13, pp. 309-340; 2011.
Seidl Verena, Gamauf Christian, Druzhinina Irina S., Seiboth Bernhard, Hartl Lukas and Kubicek
Christian P., "The Hypocrea jecorina (Trichoderma reesei) hypercellulolytic mutant RUT C30
lacks a 85 kb (29 gene-encoding) region of the wild-type genome". BMC Genomics 2008,
pp. 9:327; 2008.

61
Seidl, V.; Seibel, C.; Kubicek, C.P. & Schmoll, M., "Sexual development in the industrial workhorse
Trichoderma reesei". Proceedings of the National Academy of Science U S A, Vol.106, No.
33, pp. 13909-13914, ISSN 1091-6490; 2009.
Simmons, E. G., "Classification of some cellulase-producing Trichoderma species", Second
International Mycological Congress, Abstracts, pp. 618; 1977.
Singhania Reeta Rani, Cellulolytic Enzymes, "Biotechnology for Agro-Industrial Residues Utilisation".
Chapter 20, 2005.
Sukumaran Rajeev K, Singhania Reeta Rani, Pandey Ashok, "Microbial cellulases - Production,
applications and challenges". Journal of Scientific and Industrial Research, Vol. 64, pp. 832-
844; 2005.
Taiz Lincoln, Zeiger Eduardo, "Plant Physiology". Third edition; 1991.
Trivedi Nitin, Gupta Vishal, Reddy C.R.K., Jha Bhavanath, "Enzymatic hydrolysis and production of
bioethanol from common macrophytic green alga Ulva fasciata Delile", Bioresource
Technology, no. 150, pp. 106-112; 2013.
Wyman Charles E., Decker Stephen R, Himmel Michael E., Brady John W., Skopec Catherine E.,
Viikari Liisa, "Polysaccharides, Structural Diversity and Functional Versatility". Second Edition,
Chapter 43; 2005.
Yabushitaa Mizuho, Kobayashia Hirokazu, Fukuokaa Atsushi, "Catalytic transformation of cellulose
into platform chemicals". Applied Catalysis B: Environmental 145, pp. 1-9; 2014.
Yang, B.; Wyman, C. E. "Pretreatment: the Key to Unlocking Low-Cost Cellulosic Ethanol". Biofuels,
Bioprod. Biorefin. 2, pp. 26−40; 2008.
Websites:
www.fibersource.com
62
APPENDIX I
Issues with determining cellulolytic activity
Measuring cellulolytic activity is a paramount method for this work, since it is used for obtaining key
results necessary for fulfilling predetermined objectives. Sadly, it is in these method where problems
were encountered, which greatly redefined the course of research.
At the very beginning of the experimental work, first results obtained from what was a seemingly
simple, straightforward method indicated significantly lower enzymatic activity than what was expected
from results in similar conditions obtained in literature sources, with a standard deviation at times
reaching 100%. Before taking into consideration the less probable option that the cellulase production
ability of the fungus was compromised, an assumption made that there was an error in performing the
assay.
An effort was made to study more deeply this method and correct the flaw. Acording to some literature
sources [Montenecourt et al., 1978.] [Domingues, 2001.] in the applied method, 0.5 ml of appropriately
diluted sample was added to 2 ml of 0.1M acetate buffer pH 4.8 and 50 mg of Note No.1 Whatman
filter paper discs and incubated in a thermostated bath at 50, with a shaking frequency 75U / min for
60 minutes. The first mentioned source is the one referred to in a lot of modern scientific articles
dealing with cellulose activity. The activity was calculatied using the formula in Figure 4.1. The
problematic line the abovementioned source is "appropriately diluted", and the overall vague
explanation of the methodology.
As already discussed in Chapter 5.1.5. of this thesis, the DNS method is used for determining
reducing sugar concentration. As part of the method, there is six instances of using pipettes to transfer
various volumes (adding the sample, the buffer to dilute it, the DNS reagent, transferring from test
tube to microplate). A lot of manipulation increases the total standard deviation.
For determining reducing sugar using the DNS method, a concentration of 0.5 - 5 g/l is needed. Since
in the samples of the fermentation broth contained 20-40 g/l, they need to be diluted before
measurement.
One possibility was to dilute the samples after hydrolysis of filter paper and then multiply the
difference in sugar concentration in the assay and the blank. This is problematic, since the assay is
made with a sample that has a significant concentration of sugar that can suppress the reaction. Also,
by diluting the blank and sample with hydrolysed filter paper after incubation, we "dilute" the difference
that is the basis of determining enzymatic activity, decreasing preciseness and inducing a large
standard deviation.
The other possibility is to dilute the sample of the fermentation broth prior to performing the Filter
Paper Assay, which has the benefit of removing the possibility of anabolic repression. Also, a lower

63
concentration of enzyme could have higher productivity by having an increased ratio of contact
surface area available per enzyme.
Nevertheless, there is space for development: of a more precise, fast method of determining sugar
concentration, as well as of a replicable cellulase assay with low standard deviation that can work with
smaller samples.
Other possibilities for error, although unlikely, were tested. The effect of the presence of the paper in
the sample on sugar concentration was tested. Sugar concentration in samples was measured when
briefly inserting paper, and removing it, without any positive results. Also, solutions of sugar in the
buffer used for the Filter Paper Assay were made and incubated with and without paper, without any
effect on sugar levels. Different tubes (glass test tubes, plastic Eppendorf tubes), as well as different
heaters (incubators, heated baths) were tested, in an attempt to determine if the conditions in the
assay were different from what was intended, without any indication that these factors affected the
ability to determine the enzymatic activity of the enzymatic complex.
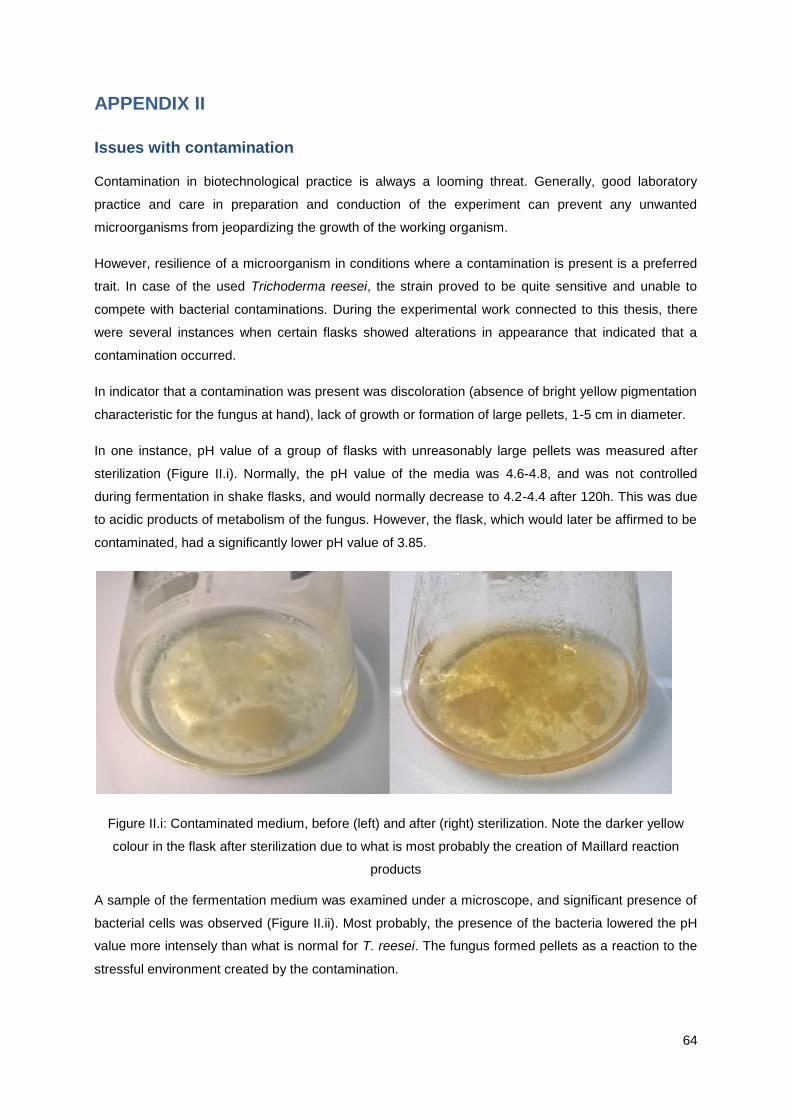
64
APPENDIX II
Issues with contamination
Contamination in biotechnological practice is always a looming threat. Generally, good laboratory
practice and care in preparation and conduction of the experiment can prevent any unwanted
microorganisms from jeopardizing the growth of the working organism.
However, resilience of a microorganism in conditions where a contamination is present is a preferred
trait. In case of the used Trichoderma reesei, the strain proved to be quite sensitive and unable to
compete with bacterial contaminations. During the experimental work connected to this thesis, there
were several instances when certain flasks showed alterations in appearance that indicated that a
contamination occurred.
In indicator that a contamination was present was discoloration (absence of bright yellow pigmentation
characteristic for the fungus at hand), lack of growth or formation of large pellets, 1-5 cm in diameter.
In one instance, pH value of a group of flasks with unreasonably large pellets was measured after
sterilization (Figure II.i). Normally, the pH value of the media was 4.6-4.8, and was not controlled
during fermentation in shake flasks, and would normally decrease to 4.2-4.4 after 120h. This was due
to acidic products of metabolism of the fungus. However, the flask, which would later be affirmed to be
contaminated, had a significantly lower pH value of 3.85.
Figure II.i: Contaminated medium, before (left) and after (right) sterilization. Note the darker yellow
colour in the flask after sterilization due to what is most probably the creation of Maillard reaction
products
A sample of the fermentation medium was examined under a microscope, and significant presence of
bacterial cells was observed (Figure II.ii). Most probably, the presence of the bacteria lowered the pH
value more intensely than what is normal for T. reesei. The fungus formed pellets as a reaction to the
stressful environment created by the contamination.

65
Figure II.ii: Sample of fermentation medium with bacteriological contamination (200x magnification)
This corresponds to observations from literature [Ferreira et al., 2009], that low ph values (around 4) of
the media triggered formation of fluffy or compact pellets.


