Embed Size (px)
Citation preview
International Review of Business Research Papers Vol. 4 No.1 January 2008 Pp.112-139
Producer-Driven Versus Buyer-Driven Network Trade in Manufactures: Evidence from Malaysia
Evelyn Devadason*
The paper addresses two issues of network trade: The extent of producer-driven and buyer-driven networks in aggregate trade in manufactures and in the context of bilateral trade with large “core” industrial markets; and The impact of network trade on quality upgrading of products and skill upgrading of labour. Some stylized facts in network trade patterns exist. First, there are some indications of a ‘new’ transmitter role for Malaysia as a sender and receiver of network links indicating a higher level of integration into production networks. Second, network links with the rest of the world differs distinctly by network structures, with higher producer-driven networks. Third, network strengths and links vary across ‘core’ countries, with China emerging as an important market for component imports. Fourth, there appears to be a quality improvement in network trade with China. The empirical results of the study indicate that import growth in network links in producer-driven industries have a significant bearing on skills in relative terms.
Field of Research: Labour Economics, International Trade 1. Introduction Economic globalization does not merely entail greater trade levels, but the international exchange of some factors and inputs into the production process (Gereffi, 2001). Trade developments in the East Asian region in particular point to a rapid expansion in international network production1 (Ng and Yeats, 2001; Jones et al., 2005, Gaulier et al., 2004, Athukorala and Yamashita, 2006) throughout the 1990s (Ando and Kimura, 2003), which translates into the rising importance of trade in parts and components. In fact, component trade (‘middle products,’ ‘intra-product,’ ‘intermediates’ or ‘fragments of final products’) has grown at a faster pace than trade in final manufactured goods (Athukorala and Yamashita, 2006; Jones et al., 2005). Within the East Asian region, Malaysia provides an interesting case study for network trade given prior evidence of the dominance of international production systems in manufacturing. Based on Srholec’s (2006) clustering of countries into the core and periphery of network trade, Malaysia was said to remain firmly at the “core” of trade in intermediate inputs and capital goods in 1995 and 2004. The share of parts and components in total Malaysian trade is a clear testimony to this. In 2003, parts and components had accounted for 43 per cent and 56 per cent of total Malaysian manufacturing exports and imports respectively. __________________________ *Dr Evelyn Devadason, Department of Economics, Faculty of Economics & Administration, University of Malaya. email: [email protected]
Devadason
113
113
Component trade was found to be heavily concentrated in the electronics2 and electrical industries (reflecting the concentration of export-oriented foreign direct investment), whereby semiconductors and other electronic components (SITC 776) accounted for 66 per cent (68 per cent) of parts and component exports (imports) from Malaysia (see also Athukorala and Yamashita, 2006). Component trade in Malaysia is therefore predominantly producer-driven (PD), given the importance of the electronics and auto industries in regional networks. In fact, Malaysia is said to exceed other Asian electronics producers in terms of it exposure to network trade (Ernst, 2003). The internationalization of the United States (US) and Japanese semiconductor and electronics industries had not only established PD networks (Gereffi, 1999) in the region but also created an East Asian division of labour based on vertical specialization3 (Ernst, 2003). As such, network trade of Malaysia is quite established in bilateral trade with large industrialized markets that are at the core of network trade, such as the US and Japan. Network trade however comes with power shifts over time as new players graduate to the core of network trade. Recently, China has integrated into the regions production networks, having shifted from the first periphery to the core of network trade between 1995 and 2004 (Srholec, 2006). There are mounting fears that China in particular would eventually compete with Malaysia to become a more favourable location, particularly in outsourcing activities given its rapid integration into the region’s production networks (Kwek and Tham, 2005). These fears have already been manifested in mid-2003, when the electrical and electronic firms in Malaysia (particularly Penang) had employed 17 per cent fewer workers than in 2000 (Woo, 2004, see also Kit et al., 2005) due to the reallocation of the production base towards China4. Lall and Albaladejo (2003) show that the export structure of China (reflected in the import share from the Malaysian perspective) has rapidly shifted into complex high technology products (see also Rumbaugh and Blancher, 2004) between 1990 and 2000. In this context, Woo (2004) adds that technological versatility becomes necessary for countries like Malaysia to capitalize on the lengthened production chains (see Rajan, 2005) in manufacturing activities, or face the dismal possibility of de-industrialization (see also Lall and Albaladejo, 2003) or a hollowing-out of the sector (Tham, 2005). Li (2006) claims otherwise indicating that the Malaysia-China trade reflects comparative advantage (see also Kit et al., 2005) in different technology intensive manufactured goods, which are complementarities (instead of substitutes) in heterogeneous intermediate products. It is therefore important to examine the extent and shifts in network trade (referring only to trade in parts and components) of Malaysia. The paper examines whether existing patterns of trade differ in the context of typical industries engaged in a specific network structure, producer-driven and buyer-driven. The study focuses on network trade in aggregate trade in manufactures and in the context of bilateral trade with large “core” markets, the US, Japan and China. The position and strengths of Malaysia’s exports in the quality ladder with these the key market players are examined. In addition to the assessment of quality upgrading of products, the impact of network trade on skill upgrading is also investigated.
Devadason
114
114
2. Internationalization of Production: Producer-Driven and Buyer-Driven Networks
The disintegration of production across borders can arise due to large factor price differentials between countries, which allow for some of the production segments to be produced more cheaply in another country. Put simply, industries across the globe are now characterized by segments with varying skill requirements. From the perspective of an unskilled abundant country, the more skilled intensive segment will be moved abroad. The structure and composition of trade thus changes with the unskilled abundant country abandoning the production of the final good, and instead assembling the imported skilled segment with domestic production (This reasoning follows the Hecksher-Ohlin lines for the basis for trade, see Jones et al., 2005) or even manufacturing certain components (segments) of the product. Hence unskilled labour intensive countries may not only gain a comparative advantage in low-end industries but also low-end production stages of high industries. However Shrolec (2006) adds a twist to the above argument stating that globalization of production within the core countries is driven by different factors than the spread of production networks outside the core. His study shows that trade in parts and components within the core are not related to cross-country differences in skills, whilst exports of parts and components from the core to the rest of the world are correlated with skills. Irrespective of the differences that drive the globalization of production, trade flows that witness greater shipment of parts and components of manufactures between countries, ultimately result in extensive global production (multiplication of supply) networks (Ernst, 2003; Rajan 2005). Gereffi (1999a, 1999b) highlights two different network configurations in global industries as PD and buyer-driven (BD). Though both type of networks evolved mainly through foreign direct investment (FDI) by multinational corporations (MNCs) either through intra-firm or arm’s-length trade, the motives for their establishment differ. PD networks are a result of efforts to gain overseas market access whilst BD networks are mainly due to the global search for cheap labour. The networks established by MNCs in the East Asian region are said to be more efficiency seeking and export-oriented (Gaulier et al., 2004). Table 1 further distinguishes the main characteristics between both networks. Table 1 indicates that PD and BD networks are rooted in distinct industrial sectors. PD networks include capital and technology intensive industries, in which MNCs are central to the coordination of the production networks. In contrast, BD networks typically comprise labour intensive and consumer goods, of which large retailers, marketers and branded manufacturers play pivotal roles in supplying specifications to tiered networks (decentralized factory systems) of third world countries that, make the finished goods. Whilst MNCs establish investment-based vertical networks, the retailers, designers and trading companies set up and coordinate trade-based horizontal networks. The structure of the networks has important implications for local upgrading, industrial-5 and skill upgrading. First, it shapes the capacity to upgrade production activities as the export role shifts. Networks have contributed to the development of new comparative advantages (“recycling comparative advantages”), which is said to be at the core of East Asian industrialization (Gaulier et al., 2004). This may involve
Devadason
115
115
either product shifts, changes in economic functions, intrasectoral progression or intersectoral shifts. Second, it provides for a finer division of labour (Lemoine and Unal-Kesenci, 2001). The sector, which is moving abroad the skilled intensive segment of production and maintaining the unskilled intensive segments, will experience a decrease in the relative demand for skilled labour vis-à-vis unskilled labour. However the opposite could well happen, that is the relative demand for skilled labour may increase even if skill intensive segments are shifted abroad. This occurs when the industry concerned is large enough compared to the overall economy triggering general equilibrium effects on other sectors. In this case, the change in relative demand for skilled labour depends on how factor proportions of segments compare to the average factor intensities within the country. If the segment produced locally is relatively skilled intensive compared to the entire economy and its output increases (because networks have increased the competitiveness of the industry), the relative demand for skilled labour in the economy may well increase (Helg and Tajoli, 2004; Feenstra and Hanson, 2001).
Table 1: Main Characteristics of Producer-Driven and Buyer-Driven Global Commodity Chains
Producer-Driven Buyer-Driven Drivers Industrial capital Commercial capital Core Competencies R&D, production Design, brand, marketing Barriers to Entry Economies of scale Economies of scope Economic Sectors Consumer durables, Consumer non-durables intermediate goods and capital goods Typical Industries Automobiles, computers, Apparel, footwear, furniture, aircraft and semiconductors toys and diamonds Ownership of Firms Multinational Local firms (predominantly in corporations developing economies) Main Network Lines Investment-based Trade-based Predominant Structure Vertical Horizontal Source: Gereffi (1999). The above explanation does not imply that changes in labour composition are necessarily a consequence of networks, but it does not discredit the possibility that the kind of production activities that is taking place in an economy may create pressures for certain labour types. There is a possibility that an increase in demand for skilled labour and hence skill upgrading may accompany an increase in imports of capital and intermediate goods as industries are pressured to upgrade. Imports of components for assembly may become the easiest way to acquire high
Devadason
116
116
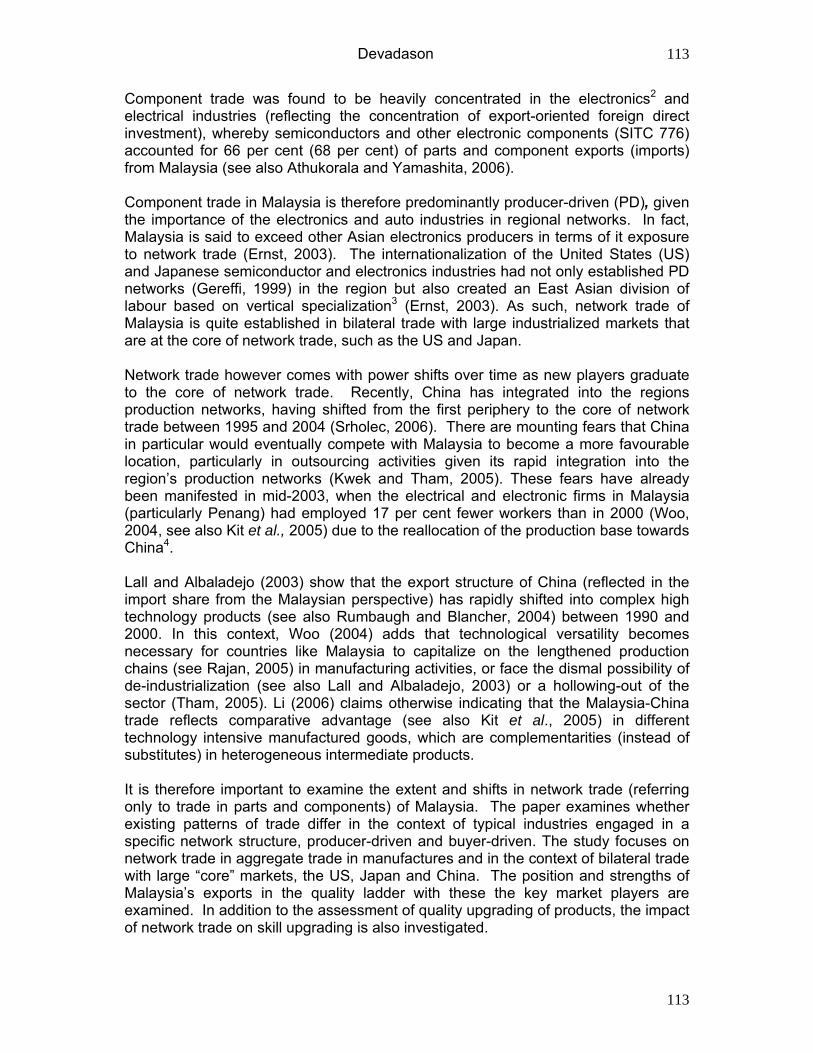
technology and benefit from technological spillovers (Gaulier et al., 2004; Feenstra and Hanson, 2001). In the case of exports, upgrading of workers skills through training and education may also follow from the continuous improvement of products and processes. Networks thus involve knowledge diffusion (both technical and managerial skills) by flagships so that suppliers can meet technical specifications of the latter. This process of knowledge sharing also includes tacit forms of ‘organizational knowledge’ that requires skilled workers. 3. Extent and Structure of Production Networks 3.1 Patterns in Network Trade Figure 1 shows the development of network trade6 (see Appendix 1 for data definitions and sources) over the period 1990 to 2005 for six manufacturing industries in Malaysia, which are electrical and electronics, machinery manufacturing, transport equipment, scientific and measuring equipment, furniture and fixtures and miscellaneous items. The first three industries are highly structured. In the electrical industry, components refer to wires, conductors, power cables, telecommunication cables and fibre optic cables, whilst electronic components comprise semiconductor components, passive components and other components (printed circuit board, metal stamped parts and precision plastic parts). As for machinery manufacturing, the parts and components form and integral part of the industry since it include moulds and dies, jigs and fixtures, actuators, motors, gear boxes and control systems for the four main categories of machinery (power generating machinery and equipment; specialized machinery and equipment for specific industries; metalworking machinery and equipment; and general industrial machinery and equipment). Components for the transport equipment industry include parts and components for motor vehicles (passenger and commercial vehicles) and aircraft.
Devadason
117
117
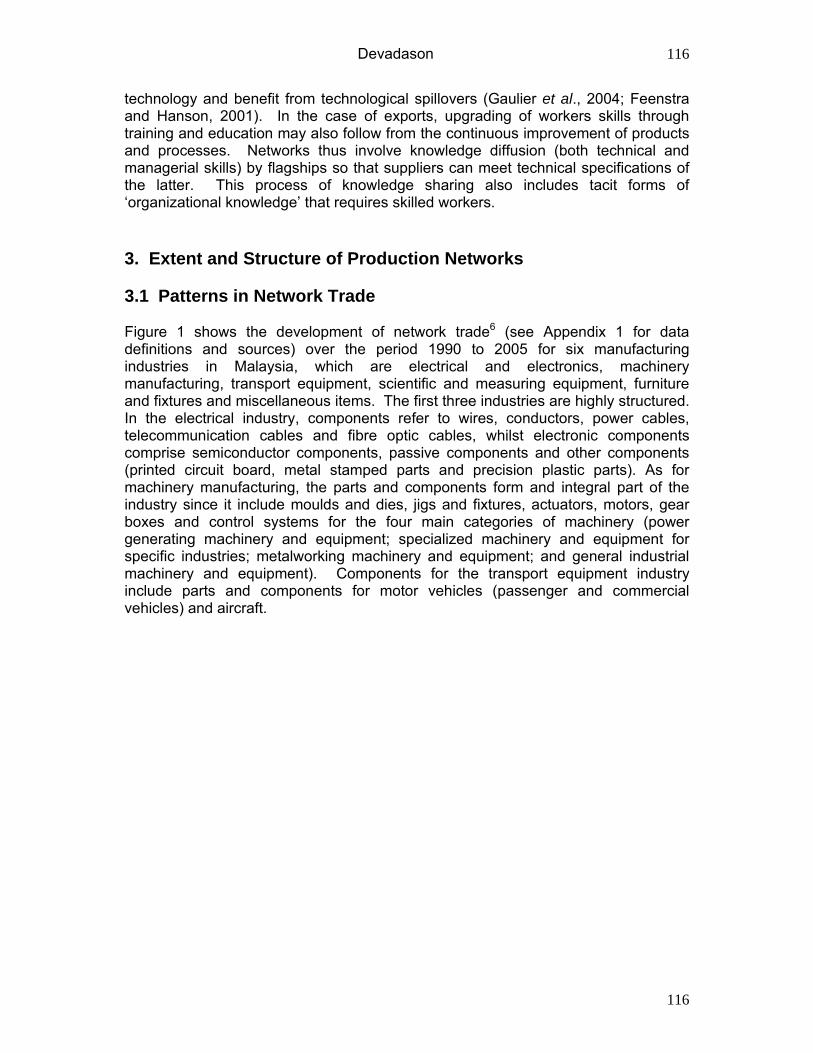
Figure 1: Extent of Network Trade*(in per cent)
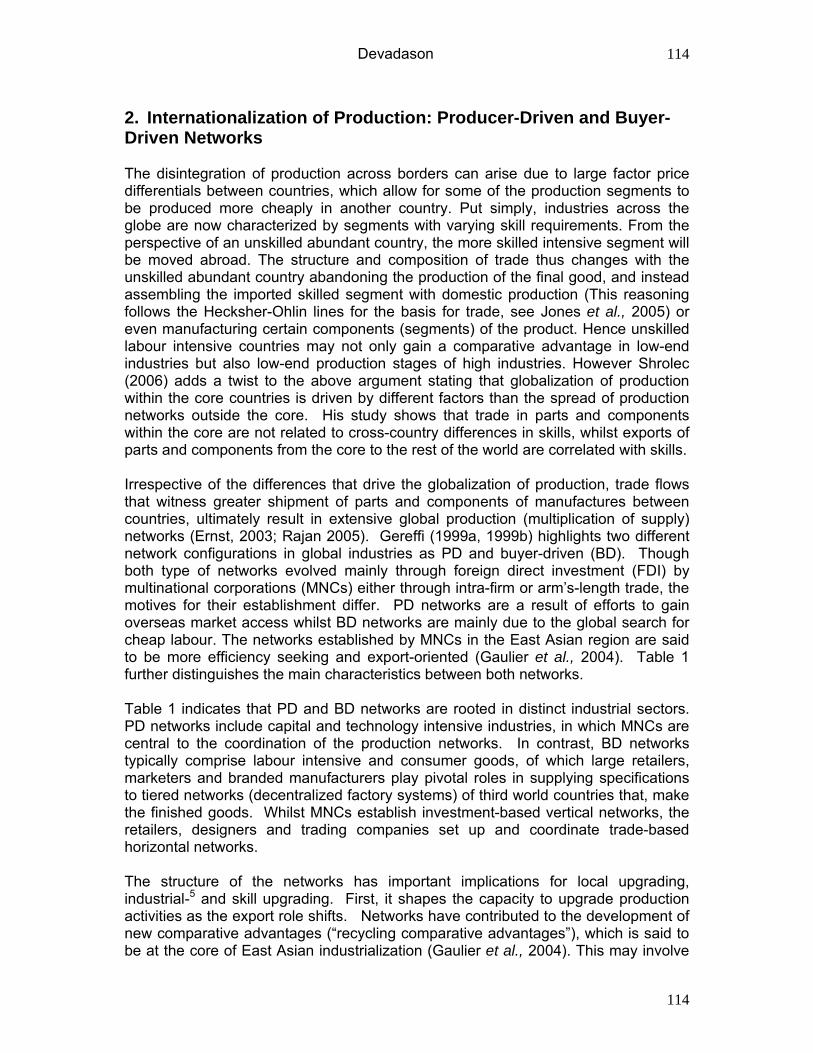
Note: *Refers to the percentage share of parts and components traded in the six manufacturing industries. Fm – import share of parts and components in total imports. Fx – export share of parts and components in total exports. Ftot – trade share of parts and components in total trade. Source: Calculated from the Malaysia: External Trade Statistics, various issues. Based on Figure 1, trade shares in parts and components for the six industries have grown by 13 per cent, from 52 per cent in 1990 to 58 per cent in 2005. The share of parts and components in total imports had increased remarkably from 48 per cent in 1990 to 67 per cent in 20057. In fact, imports of parts and components recorded a higher average annual growth rate of 16 per cent as opposed to 14 per cent for total imports for the entire period. The higher import growth of parts and components vis-à-vis that for total imports signify the importance of the former in the Malaysian manufacturing sector. The share of parts and components in total exports however declined marginally by 5 per cent, from 55 per cent to 52 per cent between 1990 and 2005. Nevertheless, the annual average growth rate of exports of parts and components at 16 per cent was similar to that for total exports for the period under review. This signifies a shift in the export structure of Malaysia given that past growth in exports of components has consistently lagged behind that of final goods. The extent of network trade from the import and export perspectives, distinguished by network structure is presented in Figure 2. The PD industries considered are electrical, electronics, machinery manufacturing, transport equipment, scientific and measuring equipment while BD industries include furniture, fixtures and miscellaneous items. Several interesting differences are identified from Figure 2. First, network trade in exports and imports is dominant in industries that are PD. Second, there is a clear upward trend in network trade in imports relative to exports for PD industries. Third, BD networks have been on the decline and the decline is more pronounced from the import side.

Devadason
118
118
Figure 2: Extent of Network Trade*, by Network Structure (in per cent)
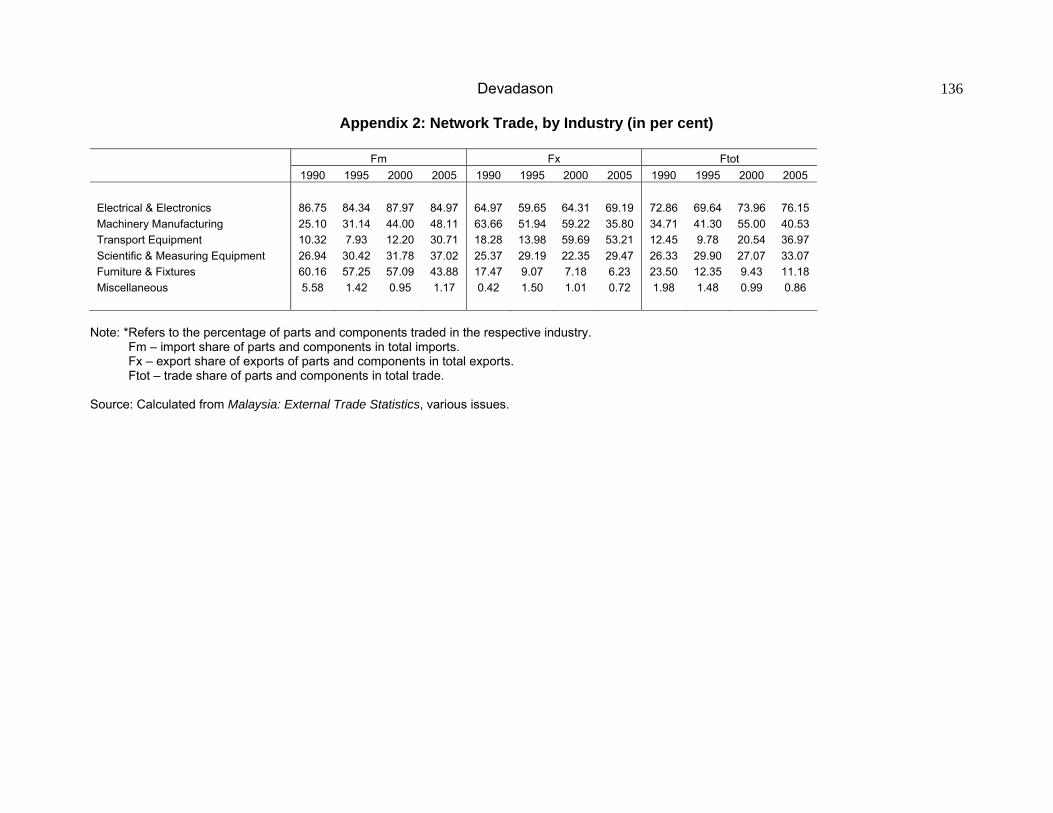
Note: 1. * Refers to the percentage share of parts and components traded in the respective network structures. 2. PD is on the left axis and BD is on the right axis. 3. PD – Producer-Driven; BD – Buyer-Driven Source: 1. Calculated from the Malaysia: External Trade Statistics, various issues. 2. Adapted from Appendix 2. Appendix 2 further shows that network trade is of very different importance for the six selected industries. From the import and export perspectives, network trade is found to be relatively high in the electrical and electronics industry, accounting for 85 per cent and 69 per cent of total imports and exports respectively in 2005. In fact, a primary driver of Malaysia’s success in the electronics industry is the progressive integration into production networks. The networks in the electronics industry were established even in the early 1970s, with offshore chip assembly by US firms, followed with consumer electronics by Japanese firms in the 1980s and then to computer-related equipment by US and Taiwanese firms in the late 1980s. (The most recent driver of growth in electronics is consumer electronics, with shifts form desktop computers to mobile and portable computers, such as laptops, pocket personal computers and handheld personal computers with wireless connectivity functions, see MITI, 2006). Import shares of components are also generally high in machinery manufacturing given that many manufacturers turn to global outsourcing for machinery component and modules (MITI, 2006). In contrast to the electronics industry and machinery manufacturing, the importance of component imports in total imports remains relatively small in the transport equipment8 and miscellaneous industries. Component imports in the transport equipment industry however is expected to increase in future as Malaysia has abolished its Local Material Contents programme and Mandatory Deletion programme in 2002, and trade of components and parts is now treated as a non-sensitive product. Similarly component exports in this industry are also expected to gain a new momentum as the government is currently engaged
Devadason
119
119
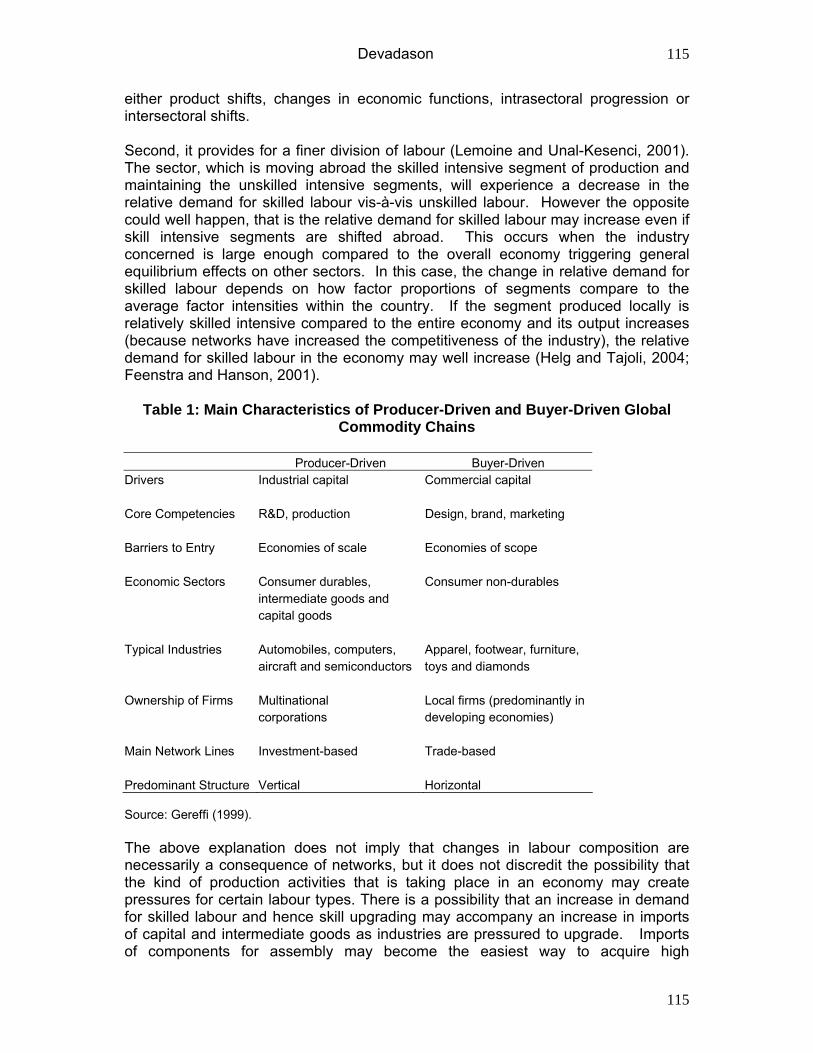
in discussions with Taiwanese firms that are keen to set up industry clusters to manufacture automotive components. Though component shares in total imports and exports had increased in most industries between 1990 and 2005, there are some notable exceptions. The furniture industry experienced a decline in component trade shares for the period of review, and the share of component exports in particular is minimal at 6 per cent in 2005. This is because most furniture exports comprise final goods, such as kitchen furniture, bedroom sets, upholstered furniture and wooden office furniture. A number of companies have also achieved progress in production capabilities, by moving into the manufacture of own design and brand furniture. Malaysia is essentially a net importer of intermediate inputs, which are then assembled into finished products for the domestic and export markets. Thus the share of parts and components in total imports are generally deemed to be higher than that in total exports. Though Malaysia remains a net importer of parts and components (clearly stands as an assembly country similar to that of China, see Gaulier et al., 2004), recent trends depict a gradual change, albeit small, in its role from “sinks” (receive links in the network) to a “transmitter” (send and receive links but with different strengths and to different countries) of intermediate inputs into the production network. This gradual shift towards component supply subcontracting (production of component parts or subassemblies that will be exported for finished goods assembly abroad) from mere export processing/assembly reflects a higher degree of integration of the manufacturing sector with the world economy. The new export role assumed by the manufacturing sector as a “transmitter” is caricatured in Figure 3. Figure 3 presents the extent of trade overlap (two-way trade) in parts and components, as measured by the aggregate Grubel-Lloyd (AGL) index (see Grubel and Lloyd, 1975). The extent of trade overlap is also calculated for PD networks and BD networks separately, denoted by AGLPD and AGLBD respectively.
Devadason
120
120
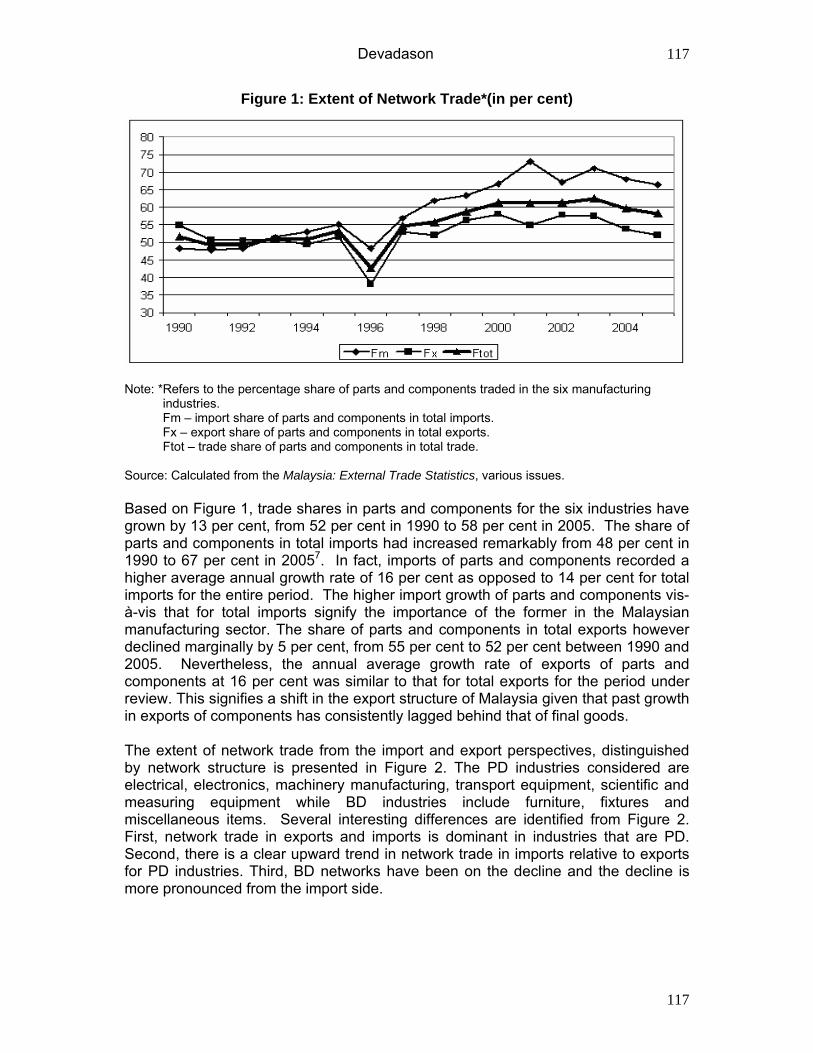
Figure 3: Extent of Overlap* in Network Trade (in per cent)
Note: 1. Measured using the aggregate Grubel-Lloyd (AGL) index, which is calculated based on the 5-digit level of aggregation. 2. The AGL is on the left axis whilst the AGLPD and the AGLBD are on the right axis. 3. AGL – extent of trade overlap in parts and components. 4. AGLPD – extent of trade overlap in producer-driven networks. 5. AGLBD – extent of trade overlap in buyer-driven networks. Source: Calculated from the Malaysia: External Trade Statistics, various issues. The extent of overlap in network trade has increased from 49 per cent to 63 per cent of total trade between 1990 and 2005. In particular, the extent of trade overlap in parts and components for BD industries were generally below 50 per cent of total trade for the years prior to 2002. This again implies that the “transmitter” role of Malaysia in network trade is rather a recent phenomenon. The trends in the AGLPD have followed closely the trends in the AGL, as most of the industries involved in network trade are that of PD. Interestingly though, trade overlap in BD industries have recorded a marked increase, with the AGLBD index rising from a mere 17 per cent of total trade in BD industries to 69 per cent between 1990 and 2005. In fact, the gap between the AGL indices of PD and BD industries narrowed since 1998, and the overlap of network trade in BD industries surpassed 50 per cent of total trade in 2000. The above trends indicate that the receiving and sending links in network trade are not limited just to PD industries, but now involve BD industries too. For the period of review in Figure 3, a decline in trade overlap is observed during the 1997 financial crisis due to a faster reduction in exports of parts and components relative to the corresponding imports. However, both exports and imports of parts and components had rebounded by 1998. Similarly, the downturn in the global electronics industry since late 2000 has also brutally exposed the downside of network trade. However sales in semiconductors are said to have picked up in the second-half of 2005 (MOF, 2005; BNM, 2006). Similarly exports of automotive parts and components such as oil filters, wipers, absorbers and suspension systems had also reached newer heights in 2005. The above discussion highlights three key points. First, network trade from the import perspective in international trade in Malaysian manufactures had grown,

Devadason
121
121
clearly indicating that industries had become increasingly reliant on suppliers in another for essential manufacturing inputs. Second, the extent of network trade differs by network structures, whereby PD networks are found to be more important relative to BD networks, both from the import and export perspectives. Third, the overlap in network trade for both PD and BD networks has grown since the late 1990s, implying a ‘new’ role for Malaysia as a sender and receiver of network links. 3.2 Bilateral Context of Network Trade The US maintained its position as Malaysia’s main trading partner in manufactures, commanding a share of 16.6 per cent of total trade in 2005. Japan, Malaysia’s third most important trading partner (11.7 per cent of total trade in 2005) seems to be losing ground in terms of both export and import market shares of Malaysia in the recent past due to the economic recession in Japan. In fact, Japan has declined from its position as the top-trading partner of Malaysia in 1996. In contrast, the most dynamic trading position was registered by China. Malaysia’s trade with China has grown tremendously to account for 8.8 per cent of total trade in 2005, thus emerging as the fourth largest trading partner of Malaysia since 2001. Kwek and Tham (2005) assert that Malaysia’s trade ties with China have grown faster than that with the rest of the world, particularly since the aftermath of the financial crisis in 1998. A slightly different picture emerges when bilateral flows in network trade alone are considered with the three trading partners mentioned above. Table 2 indicates the strengths and links of the three trading partners to Malaysia as import sources and market destinations for parts and components. The combined market shares of the three trading partners, US, Japan and China, for Malaysian imports and exports of parts and components in 2005 are 46 per cent and 30 per cent respectively. The combined share of the three markets as import sources and export destinations for components has in fact declined for the period under review (53 per cent and 42 per cent of combined market import and export shares respectively in 1990). This decline is largely attributed to the fall in PD network trade (with the exception of the fall in BD network trade with Japan) with the two traditional partners of Malaysia, the US and Japan. The fall in market shares of the US and Japan in PD trade is observed both from the import and export sides. Between both the established markets of the US and Japan, the former market is relatively a more important destination for parts and components from Malaysia. Exports of parts and components to the US are consistently more than triple the share of parts and components destined to Japan. Though the market shares of China in Malaysia’s network trade is the lowest relative to the other two trading partners, the networks with the former have grown tremendously since 2000. This is hardly surprising given that China, though a new player in the region, is currently ranked as one of the “core” economies in network trade. The increase in networks between Malaysia and China is much larger from the import relative to the export side. In 2005, China remained as Malaysia’s fourth major source of imports, which mainly comprised parts and accessories for office machines, transistors and valves and automatic data processing equipment (MOF, 2005).

Devadason
122
122
Table 2: Importance* of Trading Partners for Network Trade, by Network Structure and by Trading Partner (in per cent)
Imports Exports
Industry 1990 1995 2000 2005 1990 1995 2000 2005 US
Producer-Driven 27.84 23.57 22.13 19.96 31.43 27.53 20.56 17.24 Buyer-Driven 0.87 5.89 2.93 6.44 21.97 30.79 25.76 32.34
TOTAL 27.65 23.53 22.10 19.92 31.38 27.54 20.58 17.29 JAPAN
Producer-Driven 24.75 26.84 21.04 13.93 10.24 8.13 9.06 5.68 Buyer-Driven 36.93 41.89 26.31 7.75 11.13 29.27 22.51 15.41
TOTAL 24.84 26.87 21.05 13.91 10.24 8.23 9.10 5.71 CHINA
Producer-Driven 0.08 0.80 2.41 12.31 0.07 0.15 3.47 6.70 Buyer-Driven 2.03 3.75 5.34 15.18 0.26 0.22 1.31 2.68
TOTAL 0.09 0.80 2.41 12.37 0.08 0.38 2.46 6.69 Note: * Measured as the market shares of each country in network trade of Malaysia with the rest of the world.
1. Imports refer to the market share of component imports from each country in total imports of parts and components from the rest of the world.
2. Exports refer to the market share of component exports to each country in total exports of parts and components to the rest of the world.
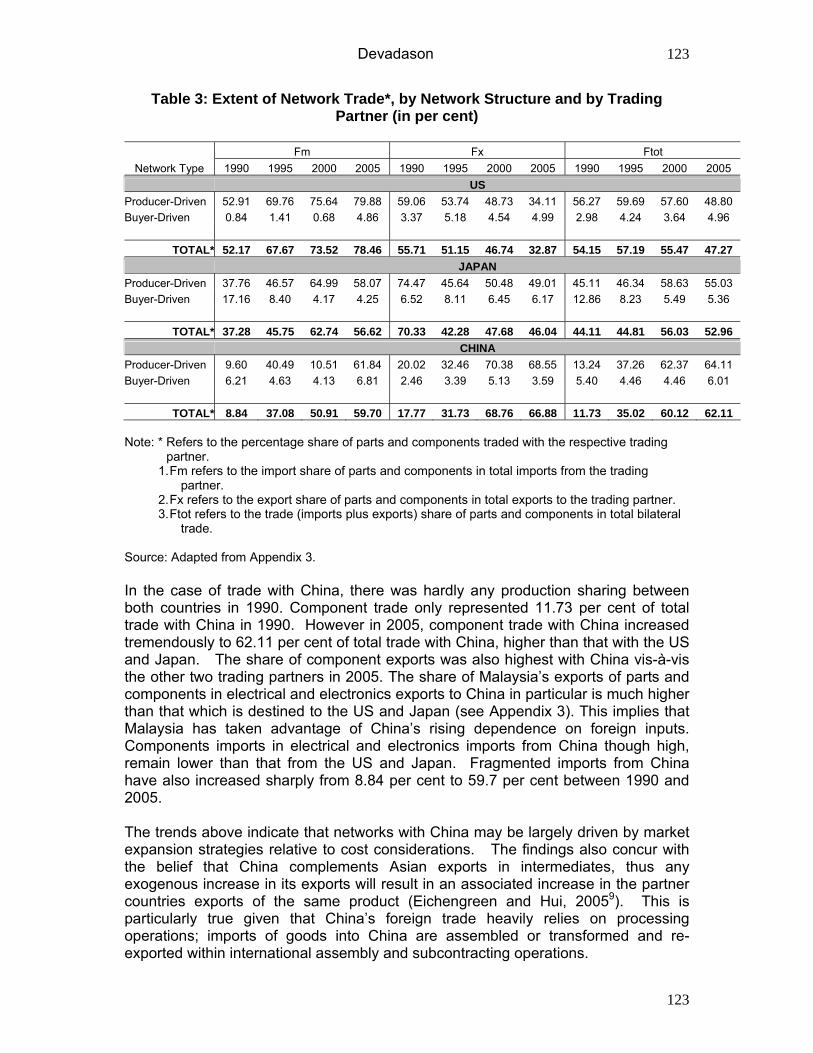
Source: Calculated from the Malaysia: External Trade Statistics, various issues. Some interesting trends are also inferred from Table 2 when the importance of the three markets is considered in terms of the type of network structure. First, PD networks are consistently higher than BD networks with the US from the import perspective whilst the opposite holds true when exports are considered. As for network trade with Japan, parts and components comprise higher shares in exports and imports of BD industries at large. Second, the shares of US and Japan in PD imports in total imports from each country respectively into Malaysia is almost similar over the period of review, implying that both markets are equally important as import sources for PD network trade. Third, BD imports of parts and components from China have grown with time and recorded the largest market share vis-à-vis the other two trading partners in 2005. Table 3 presents the extent of network trade in bilateral trade with China, US and Japan. A large proportion of Malaysia’s total trade in manufactures with the US and Japan comprised parts and components even in 1990. The main products exported to the US are office and automatic data processing machines as well as electrical machinery, apparatus, appliances and parts while imports include parts for electronic integrated circuits and micro assemblies, electrical machinery and parts as well as optical and scientific equipment. Similarly, exports to Japan consist of electrical machinery, apparatus appliances and parts, telecommunication and sound equipment as well as LNG whilst imports include digital monolithic integrated units, machinery, appliances and parts as well as transport equipment (MOF, 2006).
Devadason
123
123
Table 3: Extent of Network Trade*, by Network Structure and by Trading Partner (in per cent)
Fm Fx Ftot
Network Type 1990 1995 2000 2005 1990 1995 2000 2005 1990 1995 2000 2005 US Producer-Driven 52.91 69.76 75.64 79.88 59.06 53.74 48.73 34.11 56.27 59.69 57.60 48.80 Buyer-Driven 0.84 1.41 0.68 4.86 3.37 5.18 4.54 4.99 2.98 4.24 3.64 4.96
TOTAL* 52.17 67.67 73.52 78.46 55.71 51.15 46.74 32.87 54.15 57.19 55.47 47.27 JAPAN Producer-Driven 37.76 46.57 64.99 58.07 74.47 45.64 50.48 49.01 45.11 46.34 58.63 55.03 Buyer-Driven 17.16 8.40 4.17 4.25 6.52 8.11 6.45 6.17 12.86 8.23 5.49 5.36
TOTAL* 37.28 45.75 62.74 56.62 70.33 42.28 47.68 46.04 44.11 44.81 56.03 52.96 CHINA Producer-Driven 9.60 40.49 10.51 61.84 20.02 32.46 70.38 68.55 13.24 37.26 62.37 64.11 Buyer-Driven 6.21 4.63 4.13 6.81 2.46 3.39 5.13 3.59 5.40 4.46 4.46 6.01
TOTAL* 8.84 37.08 50.91 59.70 17.77 31.73 68.76 66.88 11.73 35.02 60.12 62.11 Note: * Refers to the percentage share of parts and components traded with the respective trading partner.
1. Fm refers to the import share of parts and components in total imports from the trading partner.
2. Fx refers to the export share of parts and components in total exports to the trading partner. 3. Ftot refers to the trade (imports plus exports) share of parts and components in total bilateral
trade.
Source: Adapted from Appendix 3. In the case of trade with China, there was hardly any production sharing between both countries in 1990. Component trade only represented 11.73 per cent of total trade with China in 1990. However in 2005, component trade with China increased tremendously to 62.11 per cent of total trade with China, higher than that with the US and Japan. The share of component exports was also highest with China vis-à-vis the other two trading partners in 2005. The share of Malaysia’s exports of parts and components in electrical and electronics exports to China in particular is much higher than that which is destined to the US and Japan (see Appendix 3). This implies that Malaysia has taken advantage of China’s rising dependence on foreign inputs. Components imports in electrical and electronics imports from China though high, remain lower than that from the US and Japan. Fragmented imports from China have also increased sharply from 8.84 per cent to 59.7 per cent between 1990 and 2005. The trends above indicate that networks with China may be largely driven by market expansion strategies relative to cost considerations. The findings also concur with the belief that China complements Asian exports in intermediates, thus any exogenous increase in its exports will result in an associated increase in the partner countries exports of the same product (Eichengreen and Hui, 20059). This is particularly true given that China’s foreign trade heavily relies on processing operations; imports of goods into China are assembled or transformed and re-exported within international assembly and subcontracting operations.
Devadason
124
124
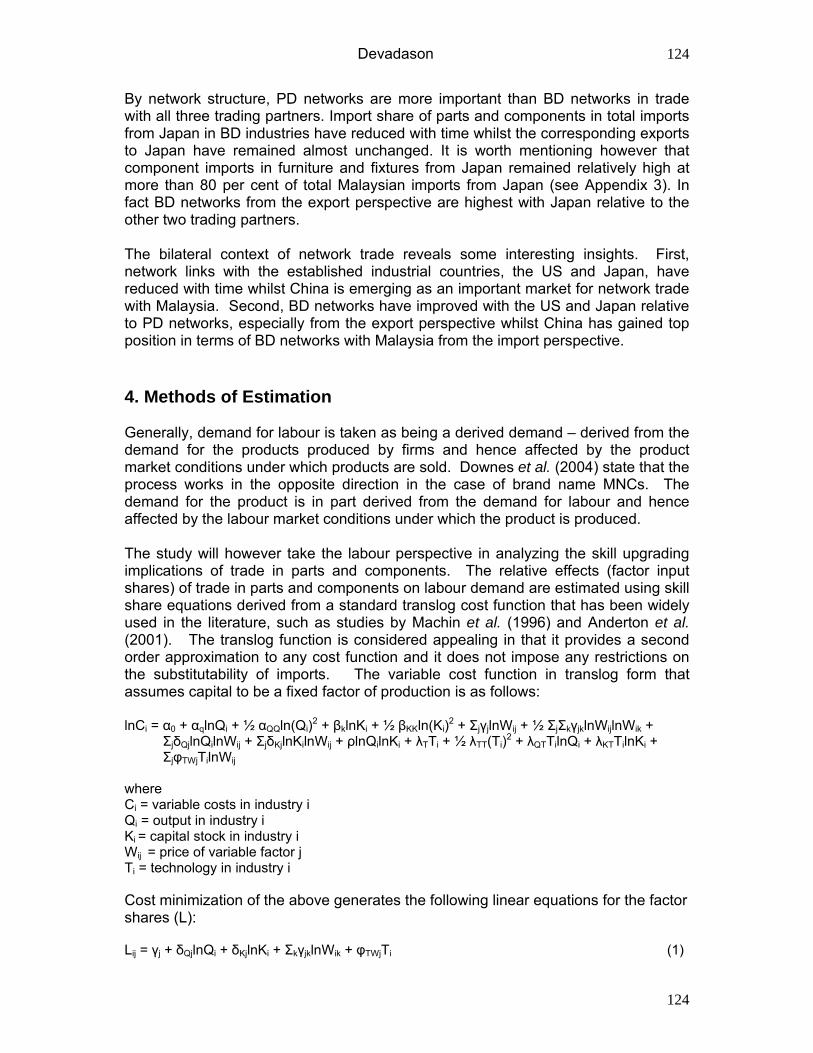
By network structure, PD networks are more important than BD networks in trade with all three trading partners. Import share of parts and components in total imports from Japan in BD industries have reduced with time whilst the corresponding exports to Japan have remained almost unchanged. It is worth mentioning however that component imports in furniture and fixtures from Japan remained relatively high at more than 80 per cent of total Malaysian imports from Japan (see Appendix 3). In fact BD networks from the export perspective are highest with Japan relative to the other two trading partners. The bilateral context of network trade reveals some interesting insights. First, network links with the established industrial countries, the US and Japan, have reduced with time whilst China is emerging as an important market for network trade with Malaysia. Second, BD networks have improved with the US and Japan relative to PD networks, especially from the export perspective whilst China has gained top position in terms of BD networks with Malaysia from the import perspective. 4. Methods of Estimation Generally, demand for labour is taken as being a derived demand – derived from the demand for the products produced by firms and hence affected by the product market conditions under which products are sold. Downes et al. (2004) state that the process works in the opposite direction in the case of brand name MNCs. The demand for the product is in part derived from the demand for labour and hence affected by the labour market conditions under which the product is produced. The study will however take the labour perspective in analyzing the skill upgrading implications of trade in parts and components. The relative effects (factor input shares) of trade in parts and components on labour demand are estimated using skill share equations derived from a standard translog cost function that has been widely used in the literature, such as studies by Machin et al. (1996) and Anderton et al. (2001). The translog function is considered appealing in that it provides a second order approximation to any cost function and it does not impose any restrictions on the substitutability of imports. The variable cost function in translog form that assumes capital to be a fixed factor of production is as follows:
lnCi = α0 + αqlnQi + ½ αQQln(Qi)2 + βklnKi + ½ βKKln(Ki)2 + ΣjγjlnWij + ½ ΣjΣkγjklnWijlnWik + ΣjδQjlnQilnWij + ΣjδKjlnKilnWij + ρlnQilnKi + λTTi + ½ λTT(Ti)2 + λQTTilnQi + λKTTilnKi + ΣjφTWjTilnWij where Ci = variable costs in industry i Qi = output in industry i Ki = capital stock in industry i Wij = price of variable factor j Ti = technology in industry i Cost minimization of the above generates the following linear equations for the factor shares (L): Lij = γj + δQjlnQi + δKjlnKi + ΣkγjklnWik + φTWjTi (1)
Devadason
125
125
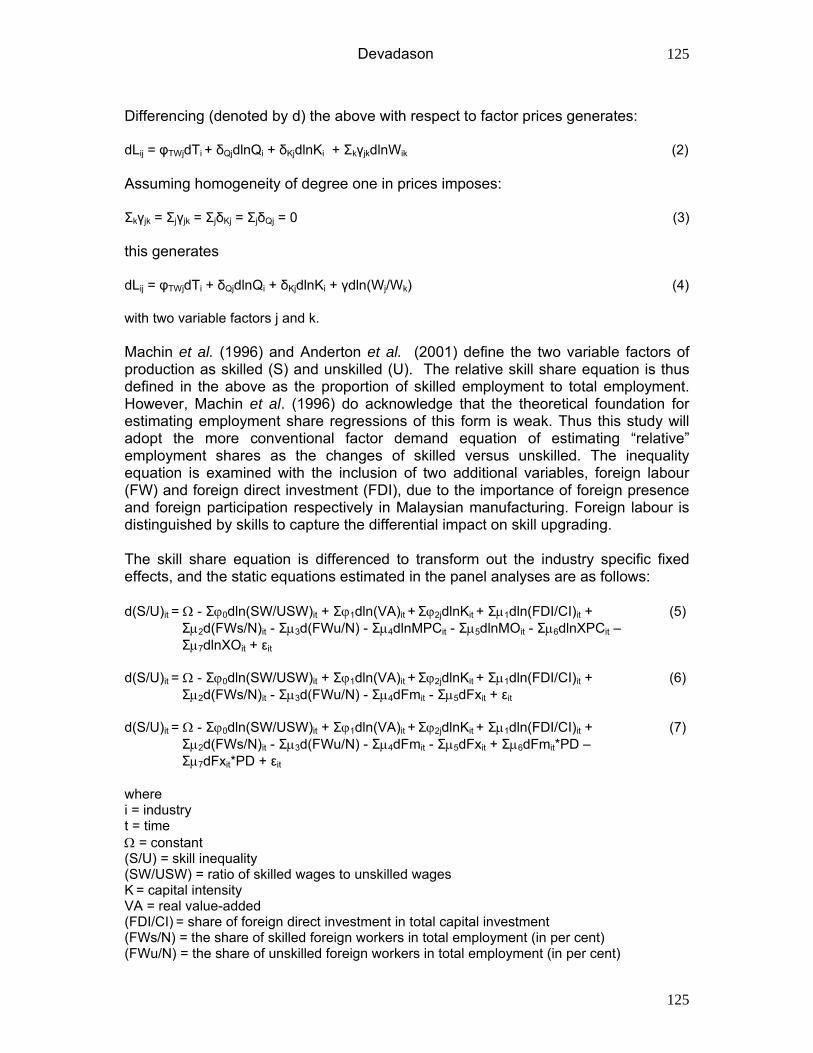
Differencing (denoted by d) the above with respect to factor prices generates: dLij = φTWjdTi + δQjdlnQi + δKjdlnKi + ΣkγjkdlnWik (2) Assuming homogeneity of degree one in prices imposes: Σkγjk = Σjγjk = ΣjδKj = ΣjδQj = 0 (3) this generates dLij = φTWjdTi + δQjdlnQi + δKjdlnKi + γdln(Wj/Wk) (4) with two variable factors j and k. Machin et al. (1996) and Anderton et al. (2001) define the two variable factors of production as skilled (S) and unskilled (U). The relative skill share equation is thus defined in the above as the proportion of skilled employment to total employment. However, Machin et al. (1996) do acknowledge that the theoretical foundation for estimating employment share regressions of this form is weak. Thus this study will adopt the more conventional factor demand equation of estimating “relative” employment shares as the changes of skilled versus unskilled. The inequality equation is examined with the inclusion of two additional variables, foreign labour (FW) and foreign direct investment (FDI), due to the importance of foreign presence and foreign participation respectively in Malaysian manufacturing. Foreign labour is distinguished by skills to capture the differential impact on skill upgrading. The skill share equation is differenced to transform out the industry specific fixed effects, and the static equations estimated in the panel analyses are as follows: d(S/U)it = Ω - Σϕ0dln(SW/USW)it + Σϕ1dln(VA)it + Σϕ2jdlnKit + Σµ1dln(FDI/CI)it + (5) Σµ2d(FWs/N)it - Σµ3d(FWu/N) - Σµ4dlnMPCit - Σµ5dlnMOit - Σµ6dlnXPCit – Σµ7dlnXOit + εit d(S/U)it = Ω - Σϕ0dln(SW/USW)it + Σϕ1dln(VA)it + Σϕ2jdlnKit + Σµ1dln(FDI/CI)it + (6) Σµ2d(FWs/N)it - Σµ3d(FWu/N) - Σµ4dFmit - Σµ5dFxit + εit d(S/U)it = Ω - Σϕ0dln(SW/USW)it + Σϕ1dln(VA)it + Σϕ2jdlnKit + Σµ1dln(FDI/CI)it + (7) Σµ2d(FWs/N)it - Σµ3d(FWu/N) - Σµ4dFmit - Σµ5dFxit + Σµ6dFmit*PD – Σµ7dFxit*PD + εit where i = industry t = time Ω = constant (S/U) = skill inequality (SW/USW) = ratio of skilled wages to unskilled wages K = capital intensity VA = real value-added (FDI/CI) = share of foreign direct investment in total capital investment (FWs/N) = the share of skilled foreign workers in total employment (in per cent) (FWu/N) = the share of unskilled foreign workers in total employment (in per cent)
Devadason
126
126
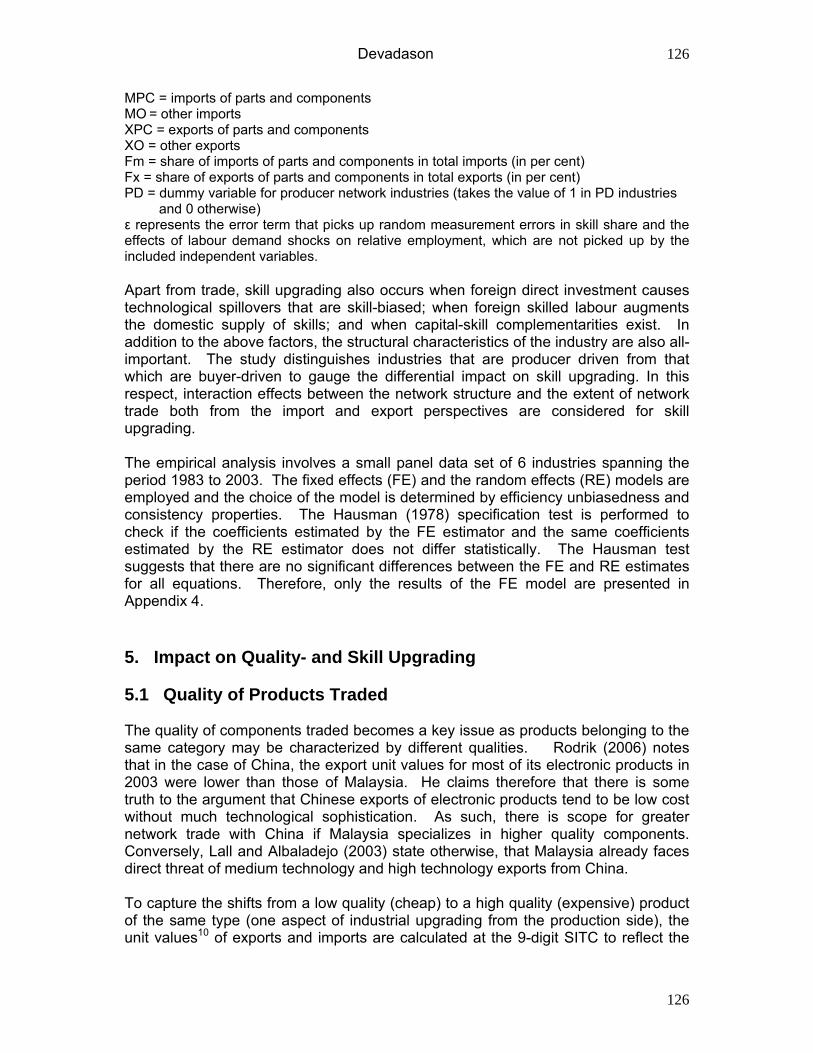
MPC = imports of parts and components MO = other imports XPC = exports of parts and components XO = other exports Fm = share of imports of parts and components in total imports (in per cent) Fx = share of exports of parts and components in total exports (in per cent) PD = dummy variable for producer network industries (takes the value of 1 in PD industries and 0 otherwise) ε represents the error term that picks up random measurement errors in skill share and the effects of labour demand shocks on relative employment, which are not picked up by the included independent variables. Apart from trade, skill upgrading also occurs when foreign direct investment causes technological spillovers that are skill-biased; when foreign skilled labour augments the domestic supply of skills; and when capital-skill complementarities exist. In addition to the above factors, the structural characteristics of the industry are also all- important. The study distinguishes industries that are producer driven from that which are buyer-driven to gauge the differential impact on skill upgrading. In this respect, interaction effects between the network structure and the extent of network trade both from the import and export perspectives are considered for skill upgrading. The empirical analysis involves a small panel data set of 6 industries spanning the period 1983 to 2003. The fixed effects (FE) and the random effects (RE) models are employed and the choice of the model is determined by efficiency unbiasedness and consistency properties. The Hausman (1978) specification test is performed to check if the coefficients estimated by the FE estimator and the same coefficients estimated by the RE estimator does not differ statistically. The Hausman test suggests that there are no significant differences between the FE and RE estimates for all equations. Therefore, only the results of the FE model are presented in Appendix 4. 5. Impact on Quality- and Skill Upgrading 5.1 Quality of Products Traded The quality of components traded becomes a key issue as products belonging to the same category may be characterized by different qualities. Rodrik (2006) notes that in the case of China, the export unit values for most of its electronic products in 2003 were lower than those of Malaysia. He claims therefore that there is some truth to the argument that Chinese exports of electronic products tend to be low cost without much technological sophistication. As such, there is scope for greater network trade with China if Malaysia specializes in higher quality components. Conversely, Lall and Albaladejo (2003) state otherwise, that Malaysia already faces direct threat of medium technology and high technology exports from China. To capture the shifts from a low quality (cheap) to a high quality (expensive) product of the same type (one aspect of industrial upgrading from the production side), the unit values10 of exports and imports are calculated at the 9-digit SITC to reflect the
Devadason
127
127
respective prices. The quality of products is first gleaned from the comparison of export prices of the same product across different bilateral trade flows to gauge quality differences in exports to different key players. In most cases, component exports in PD industries (electrical, electronics, machinery manufacturing and transport equipment) to China have the lowest unit values vis-à-vis similar component exports to the US and Japan. The findings therefore to some extent do support the theoretical prediction that rich countries tend to import relatively more from countries that produce higher quality goods. More important than the comparison of unit values of exports across with different trading partners is the extent of quality upgrading in exports in the various bilateral trade flows. The quality of exports is assessed via the relative prices of exports to imports of the same product within each bilateral trade flow. There are two limitations in the data that are worth mentioning. First, there are a large proportion of bilateral country export-import pairs with zero trade, more so in the BD industries. Thus the unit values in bilateral trade flows are compared for only in the PD industries and pairs with zero-trade are not considered for quality comparison (see Table 4 for number of products considered in the PD industries). Second, the quantity data is missing for numerous products prior to 2000, thus limiting the comparisons to between 2000 and 2005. Table 4 summarizes the exports of high quality products to the US, Japan and China by taking the percentage of the number of parts and components that have relative unit values greater than unity (UVX/UVM > 1, depicting higher quality exports) in total number of products traded.
Devadason
128
128
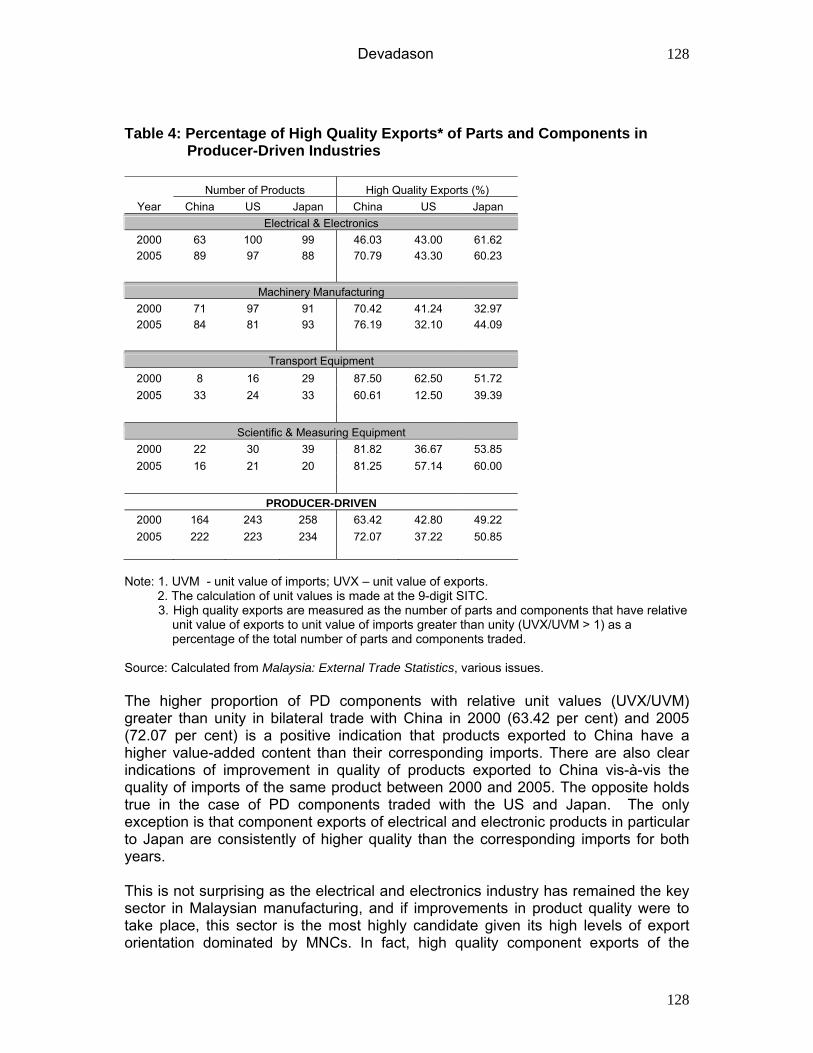
Table 4: Percentage of High Quality Exports* of Parts and Components in Producer-Driven Industries
Number of Products High Quality Exports (%) Year China US Japan China US Japan
Electrical & Electronics 2000 63 100 99 46.03 43.00 61.62 2005 89 97 88 70.79 43.30 60.23
Machinery Manufacturing
2000 71 97 91 70.42 41.24 32.97 2005 84 81 93 76.19 32.10 44.09
Transport Equipment
2000 8 16 29 87.50 62.50 51.72 2005 33 24 33 60.61 12.50 39.39
Scientific & Measuring Equipment
2000 22 30 39 81.82 36.67 53.85 2005 16 21 20 81.25 57.14 60.00
PRODUCER-DRIVEN
2000 164 243 258 63.42 42.80 49.22 2005 222 223 234 72.07 37.22 50.85
Note: 1. UVM - unit value of imports; UVX – unit value of exports.
2. The calculation of unit values is made at the 9-digit SITC. 3. High quality exports are measured as the number of parts and components that have relative unit value of exports to unit value of imports greater than unity (UVX/UVM > 1) as a percentage of the total number of parts and components traded.
Source: Calculated from Malaysia: External Trade Statistics, various issues. The higher proportion of PD components with relative unit values (UVX/UVM) greater than unity in bilateral trade with China in 2000 (63.42 per cent) and 2005 (72.07 per cent) is a positive indication that products exported to China have a higher value-added content than their corresponding imports. There are also clear indications of improvement in quality of products exported to China vis-à-vis the quality of imports of the same product between 2000 and 2005. The opposite holds true in the case of PD components traded with the US and Japan. The only exception is that component exports of electrical and electronic products in particular to Japan are consistently of higher quality than the corresponding imports for both years. This is not surprising as the electrical and electronics industry has remained the key sector in Malaysian manufacturing, and if improvements in product quality were to take place, this sector is the most highly candidate given its high levels of export orientation dominated by MNCs. In fact, high quality component exports of the
Devadason
129
129
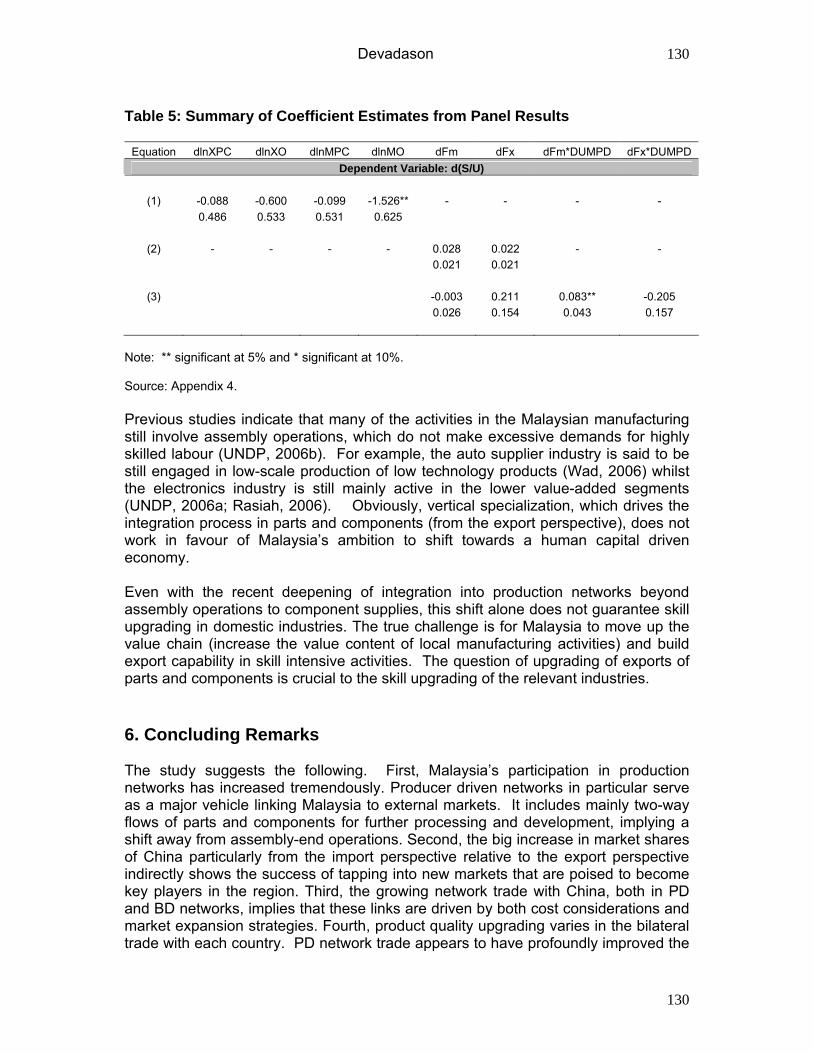
electrical and electronics industry to the rest of the world remained a feature even in 2000 (59.29 per cent of total products traded in electrical and electronics, results not reported in Table 3). (See also MITI, 2006, for discussion on the high value and higher technology content of electrical and electronic parts and components exported by Malaysia to the rest of the world). The findings of Norlela and Figueiredo (2004) also indicate a steady progression in the electronics industry of Malaysia, involving the production of complex and higher value products since 2000. There is even a move from assembly of electronic and semiconductor devices to sub-assembly and component assembly of more complex devices. 5.2 Evidence on Skill Upgrading A summary of the results is reported in Table 5. Equation (1) distinguishes trade in parts and components (XPC and MPC) from that of final goods (XO and MO). Equation (2) captures the trade variables as the share of component imports in total imports (Fm) and the share of component exports in total exports (Fx). Equation (3) considers the interaction effects between the extent of network trade and the type of network structure. In this context, PD networks are considered given their relative importance vis-à-vis BD networks. Based on equation (1) of Table 5, the growth in total imports of final goods results in a decline in the growth of relative labour demand (measured as S/U), implying that higher imports of final goods result in higher demand for unskilled relative to skilled labour. Given that Malaysia’s imports are generally skilled intensive, it is expected that imports will displace skilled labour demand. However, the above results indicate that the negative impact on relative labour demand is only significant when imports of final goods are considered. (Component imports plausibly do not significantly displace skilled labour demand as these higher skilled inputs feed into the domestic production system). Though equation (2) does not point to any significant influence of the growth in the shares of component trade on relative demand, a different picture emerges when the extent of network trade is considered in PD industries. Even though PD industries are generally capital and technology intensive industries, they do not automatically cause spillover effects in the form of skill upgrading. The PD networks that exist from the import and export perspectives have different implications for skill upgrading. The results indicate that the higher the network links from the import side in PD industries, the higher the growth of relative labour demand. From the export perspective, trade in parts and components have no significant bearing on skills in relative terms. Much has been said about human capital deficits in the Malaysian economy that have hindered the upgrading into higher value-added activities. However, the growth in component exports also clearly point to the lack of success to move into higher skill-driven activities (see also Rasiah, 2006).
Devadason
130
130
Table 5: Summary of Coefficient Estimates from Panel Results
Equation dlnXPC dlnXO dlnMPC dlnMO dFm dFx dFm*DUMPD dFx*DUMPD Dependent Variable: d(S/U)
(1) -0.088 -0.600 -0.099 -1.526** - - - -
0.486 0.533 0.531 0.625
(2) - - - - 0.028 0.022 - - 0.021 0.021
(3) -0.003 0.211 0.083** -0.205 0.026 0.154 0.043 0.157
Note: ** significant at 5% and * significant at 10%. Source: Appendix 4. Previous studies indicate that many of the activities in the Malaysian manufacturing still involve assembly operations, which do not make excessive demands for highly skilled labour (UNDP, 2006b). For example, the auto supplier industry is said to be still engaged in low-scale production of low technology products (Wad, 2006) whilst the electronics industry is still mainly active in the lower value-added segments (UNDP, 2006a; Rasiah, 2006). Obviously, vertical specialization, which drives the integration process in parts and components (from the export perspective), does not work in favour of Malaysia’s ambition to shift towards a human capital driven economy. Even with the recent deepening of integration into production networks beyond assembly operations to component supplies, this shift alone does not guarantee skill upgrading in domestic industries. The true challenge is for Malaysia to move up the value chain (increase the value content of local manufacturing activities) and build export capability in skill intensive activities. The question of upgrading of exports of parts and components is crucial to the skill upgrading of the relevant industries. 6. Concluding Remarks The study suggests the following. First, Malaysia’s participation in production networks has increased tremendously. Producer driven networks in particular serve as a major vehicle linking Malaysia to external markets. It includes mainly two-way flows of parts and components for further processing and development, implying a shift away from assembly-end operations. Second, the big increase in market shares of China particularly from the import perspective relative to the export perspective indirectly shows the success of tapping into new markets that are poised to become key players in the region. Third, the growing network trade with China, both in PD and BD networks, implies that these links are driven by both cost considerations and market expansion strategies. Fourth, product quality upgrading varies in the bilateral trade with each country. PD network trade appears to have profoundly improved the
Devadason
131
131
quality of exports (reflecting the ‘moving up of the value chain’) destined to China vis-à-vis the US and Japan. It is thus crucial for Malaysia to further capitalize on China’s booming demand for high-end parts and components that feed into its assembly plants, to maintain China as its big customer. The intensity of competition for market share in China will be based on goods exported on the quality ladder. To reap benefits from mutual trade dependence, Malaysia needs to enhance its technological capacity (see also Tham, 2001, 2005), which is to innovate indigenously, particularly to upgrade exports. According to McKibbin and Woo (2003), much needs to be done given that China ranks almost as high as Malaysia in the indigenous innovation index. Furthermore, Lemoine and Unal-Kesenci (2001) note that the specialization pattern of China is becoming almost similar to that of Malaysia, given the rapid rate of imitation in the latter which has shortened the product cycle tremendously (Tham, 2005). Malaysia needs to ensure constant product upgrading to remain an important cog in network trade with China, particularly through component supply subcontracting. The pursuit of an autarchic national development strategy for industrialization no longer suffices under the present proliferation of global production networks. The Malaysian government recognizes this and initiatives have been outlined in the Third Industrial Master Plan, 2006-2020, to integrate Malaysian companies into the regional and global networks (MITI, 2006). Malaysia will need to reposition itself strategically within the global networks and develop strategies for gaining access to lead firms (key players) in the region and develop learning dynamics in order to strengthen her network position. References Anderton, B., Brenton, P. & Oscarsson, E. 2001, ‘What’s trade got to do with it?
Relative Demand for Skills Within Swedish Manufacturing,’ Working Document No.162, Centre for European Policy Studies, Stockholm University, Sweden.
Ando, M. & Kimura, F. 2003, ‘The formation of international production and distribution networks in East Asia,’ NBER Working Paper 10167, National Bureau of Economic Research, US.
Appelbaum, R.P. 2004, ‘Commodity chains and economic development: one and a half proposals for spatially oriented research,’ paper presented at the CSISS/IROWS Specialist Meeting, University of California at Riverside, 7-8 February.
Athukorala, P. 2003, ‘Production fragmentation and trade patterns in East Asia,’ Working Paper No. 2003/21, Research School of Pacific and Asian Studies, Australian National University: Australia.
Athukorala, P. & Yamashita, N. 2006, ‘Production fragmentation and trade integration: East Asia in a global context,’ North American Journal of Economics and Finance, Vol. XXX, pp.1-24.
Bank Negara Malaysia 2006, Bank Negara Malaysia Annual Report 2005, Bank Negara Malaysia, Kuala Lumpur.
Devadason
132
132
Downes, A., Gomez, R. & Gunderson, M. 2004, ‘The two-way interaction between globalization and labour market policies,” Oxford Development Studies, Vol.32, No.1, pp.135-152.
Economic Planning Unit 2006, Ninth Malaysia Plan 2006-2010, Percetakan Nasional Malaysia Berhad, Kuala Lumpur.
Eichengreen, B. & Hui T. 2005, ‘How China is reorganizing the world economy,’ paper presented at the Inaugural Meeting of the Asian Economic Policy Panel, Tokyo, 22 October.
Ernst, D. 2003, ‘How sustainable are benefits from global production networks? Malaysia’s upgrading prospects in the electronics industry,’ East-West Center Working Paper No. 57, East-West Center, Hawaii.
Feenstra, R.C. & Hanson, G.H. 1996, ‘Globalization, outsourcing and wage inequality,’ American Economic Review, Vol.86, No.2, pp.240-5.
Feenstra, R.C. & Hanson, G.H. 2001, ‘Global production sharing and rising inequality: A survey of trade and wages,’ NBER Working Paper No. 8372, National Bureau of Economic Research, US.
Gaulier, G., Lemoine, F. & Unal-Kesenci, D. 2004, ‘China’s integration in Asian production networks and its implications,’ paper presented at the Conference on Resolving New Global and Regional Imbalances in an Era of Asian Integration, Tokyo, 17-18 June.
Gereffi, G. 1999a, ‘A commodity chains framework for analyzing global industries,’ mimeo, Duke University, US.
Gereffi, G. 1999b, ‘International trade and industrial upgrading in the apparel commodity chain,’ Journal of International Economics, Vol.48, pp.37-70.
Gereffi, G. 2001, “Beyond the producer-driven/buyer-driven dichotomy: The evolution of global value chains in the internet era,” IDS Bulletin, Vol.32, No.3, pp.30-40.
Grubel, H.G. & Lloyd, P.J. 1975, Intra-Industry Trade: The Theory and Measurement of International Trade in Differentiated Products, John Wiley & Sons, New York.
Hallak, J.C. 2006, ‘Product quality and the direction of trade,’ Journal of International Economics, Vol.68, pp.238-265.
Helg, R. & Tajoli, L. 2004, ‘Patterns of international fragmentation of production and implications for the labor markets’, Discussion Paper No.503, Research Seminar in International Economics (RSIE), University of Michigan, US.
Hijzen, A., Gorg, H., & Hine, R.C. 2003, ‘International fragmentation and relative wages in the UK’, IZA Discussion Paper No.717, Institute for the Study of Labor (IZA), Germany.
Hummels, D., Ishii, J. & Yi, K-M 2001, ‘The nature and growth of vertical specialization in world trade,’ Journal of International Economics, Vol.54, pp.75-96.
Jones, R. & Kierzkowski, H. 2005, “International fragmentation and the new economic geography’, North American Journal of Economics and Finance, Vol.16, pp.1-10.
Jones, R.; Kierzkowski, H. & Lurong, C. 2005, “What does evidence tell us about fragmentation and outsourcing?’ paper presented at the UNU-WIDER Jubilee Conference WIDER Thinking Ahead: The Future of Development Economics, Geneva, 17-18 June.
Kit W.Z., Ong, J.W. & Kevin, K.T.Y. 2005, ‘China’s rise as a manufacturing powerhouse: Implications for Asia,’ MAS Staff Paper No. 42, Monetary Authority of Singapore, Singapore.
Devadason
133
133
Kwek, K.T. & Tham, S.Y. 2005, ‘Malaysia-China trade: Growth, opportunities and challenges,’ mimeo.
Lall, S., & Albaladejo, M. 2003, ‘China’s competitive performance: A threat to East Asian manufactured exports?’ QEH Working Paper Series 110, Oxford University, UK.
Lall, S., Albaladejo, M. & Zhang, J. 2004, ‘Mapping fragmentation: Electronics and automobiles in East Asia and Latin America’, Oxford Development Studies, Vol.32, No.3, pp.407-432.
Lee, P.P. & Lee, K.H. 2005, ‘Malaysia-China relations: A review,’ Malaysia, Southeast Asia and the Emerging China: Political, Economic and Cultural Perspectives, in Hou K.C. and Yeoh K.K. (Eds.), Institute of China Studies, University of Malaya, Kuala Lumpur, pp.3-27.
Lemoine, F. & Unal-Kesenci, D. 2001, “China in the global reorganisation of production,’ paper presented at the International Conference on the Chinese Economy: Achieving Growth with Equity, Beijing, China, 4-6 July.
Li, Y. 2006, ‘An analysis of recent Sino-Malaysian trade relations,’ China and Malaysia in a Globalizing World: Bilateral Relations, Regional Imperatives and Domestic Challenges, in Hou K.C. and Yeoh K.K. (Eds.), Institute of China Studies, University of Malaya, Kuala Lumpur, pp.127-136.
Machin, S., Ryan, A. & Reenan, J.V. 1996, ‘Technology and changes in skill structure: Evidence from an international panel of industries,’ Discussion Paper No.297, Centre for Economic Performance, London School of Economics & Political Science, UK
McKibbin, W.J. & Woo, W.T. 2003, ‘The consequences of China’s WTO accession on its neighbours,” Working Paper No.2003/17, Australian National Universit, Australia.
Ministry of Finance 2005, Economic Report 2005/2005, Percetakan Nasional Malaysia Berhad, Kuala Lumpur.
Ministry of Finance 2006, Economic Report 2006/2007, Percetakan Nasional Malaysia Berhad, Kuala Lumpur.
Ministry of International Trade and Industry 2006, Third Industrial Master Plan, 2006-2020: Malaysia – Towards Global Competitiveness, Percetakan Nasional Malaysia Berhad, Kuala Lumpur.
Ng, F. & Yeats, A. 1999, “Production sharing in East Asia: Who does what for whom, and why?’ mimeo, World Bank, US.
Ng, F. & Yeats, A. 2003, ‘Major trade trends in East Asia: What are their implications for regional cooperation and growth?’ World Bank Research Working Paper 3084, World Bank, US.
Norlela A., Figueiredo, P.N. 2004, ‘Internationalization of innovative capabilities: Counter evidence from the Electronics industry in Malaysia and Brazil,’ Oxford Development Studies, Vol.32, No.4, pp.559-583.
Prasad, E. & Rumbaugh, T. 2004, ‘Overview,’ China’s Growth and Integration into the World Economy: Prospects and Challenges, in Eswar Prasad (Ed.), Occasional Paper 232 International Monetary Fund, US, pp.1-4.
Rajan, R.S. 2005, ‘FDI, trade and the internationalization of production in the Asia-Pacific region: Issues and policy conundrums,” mimeo, National University of Singapore, Singapore.
Rasiah, R. 2006, ‘Export-oriented electronics manufacturing in Southeast Asia,’ paper presented at the International Conference on Learning, Innovation and Competitiveness: Achieving Social Welfare through Sustainable Manufacturing in
Devadason
134
134
Southeast Asia, 14-15 June, Faculty of Economics and Administration, University of Malaya, Kuala Lumpur.
Rodrik, D. 2006, ‘What’s so special about China’s exports?’ NBER Working Paper No. 11947, National Bureau of Economic Research, US.
Rumbaugh, T. & Blancher, N. 2004, ‘International trade and the challenges of WTO accession,’ China’s Growth and Integration into the World Economy: Prospects and Challenges, Eswar Prasad (Ed.), Occasional Paper 232, International Monetary Fund: US, pp.5-13.
Srholec, M. 2006, ‘Fragmentation and trade: A network perspective,” paper presented at the 8th ETSG Annual Conference, Vienna, 7-9 September.
Tham, S.Y. 2001, ‘Can Malaysian manufacturing compete with China in the WTO?’ Asia Pacific Development Journal, Vol.8, No.2, pp.1-25.
Tham, S.Y. 2005, ‘Japan’s response to globalization: Learning from Japanese direct investment,” Asia-Pacific Trade and Investment Review, Vol.1, No.2, pp.3-26.
UNDP 2006a, Malaysia: International Trade, Growth, Poverty Reduction and Human Development, United Nations Development Programme, Malaysia.
UNDP 2006b, Asia-Pacific Human Development Report 2006: Trade on Human Terms – Transforming Trade for Human Development in Asia and the Pacific, United Nations Development Programme, Sri Lanka.
Wad, P. 2006, ‘The ASEAN automobile industry: Between the devil and the deep blue sea?’ paper presented at the International Conference on Learning, Innovation and Competitiveness: Achieving Social Welfare through Sustainable Manufacturing in Southeast Asia, 14-15 June, Faculty of Economics and Administration, University of Malaya, Kuala Lumpur.
Wong, K-Y 2004, ‘China’s WTO accession and its trade with the Southeast Asian economies,” paper presented at the WTO, China and the Asian Economies: Free Trade Areas and New Economic Relations, Beijing, China, 18-19 June.
Woo, W.T. 2004, ‘The economic impact of China’s emergence as a major trading nation,’ mimeo, University of California at Davis, US.
Zhang, X. & Mengyang, S. 2004, ‘China – The stabilizer of Asian economy of 21st century,’ paper presented at the WTO, China and the Asian Economies: Free Trade Areas and New Economic Relations, Beijing, China, 18-19 June.
Devadason
135
135
Appendix 1: Data Trade Data (1) Data on exports (X) and imports (M) are derived from the Malaysia: External Trade
Statistics publications. The trade data is compiled at the 5-digit Standard International Trade Classification (SITC) level, for the period 1983 to 2005. The trade data in Malaysia is based on the SITC (Rev.2) for the period 1980 to 1987 and on SITC (Rev.3) for the period 1988 to 2005. Exports are valued f.o.b. while imports c.i.f. Total manufacturing exports and imports are deflated with the export price and import price index (1980 =100) for the entire economy respectively.
(2) Data on trade in parts and components is compiled only for six industries,
categorized as producer-driven (machinery manufacturing, electrical and electronics, transport equipment and scientific and measuring equipment) and buyer-driven (furniture and fixtures and miscellaneous). Since industries based on the SITC scheme do not separate component trade from final goods, the study adopts Athukorala’s (2003) classification of intermediate goods11 inferred from trade statistics (of the SITC, Revision 3) for the industries in sections SITC 7 and 812. For the study, only items termed as “parts and accessories” at the 5 digit level SITC13 are counted as components while others are treated as finished goods. The total number of components for the six industries is 212, of which 200 products are from the producer driven-category and remaining 12 products are that which is buyer-driven.
Labour Data (3) Labour data (employment and wages) are drawn from manufacturing surveys,
conducted annually by the Department of Statistics (DOS) Malaysia. The survey data is collected based on a national classification of manufacturing industries under major Division 3 of the Malaysia Industrial Classification (MIC), 1972 (updated 1979) changed in the year 2000 to Category D of the Malaysia Standard Industrial Classification (MSIC) 2000. Only full-time paid employees (N) are considered, which excludes working proprietors, active business partners, unpaid family workers and part-time paid employees. Similarly, only the wages and salaries of full-time employees are considered for the study. The wage variable (W) refers to the average yearly earnings per full-time employee in each industry. All wage variables are deflated by the Malaysian consumer price index (at constant 1980 prices).
(4) The definition of skills used is solely based on occupational groupings governed by the availability of data. Skilled workers (S) refer to the number of employees in the managerial, professional, technical and supervisory categories. Unskilled workers (U) comprise production/operative workers. The real average wages for skilled (SW) and unskilled workers (USW) are constructed based on their average yearly earnings.
Industry Data (5) Real value-added (VA) is derived as the difference between the gross value of output
and the cost of input. The proxy for technology is the share of foreign direct investment in total capital investment (FDI/CI). Capital intensity (K) refers to the share of real fixed assets in total output.
Devadason
136
Appendix 2: Network Trade, by Industry (in per cent)
Fm Fx Ftot 1990 1995 2000 2005 1990 1995 2000 2005 1990 1995 2000 2005 Electrical & Electronics 86.75 84.34 87.97 84.97 64.97 59.65 64.31 69.19 72.86 69.64 73.96 76.15 Machinery Manufacturing 25.10 31.14 44.00 48.11 63.66 51.94 59.22 35.80 34.71 41.30 55.00 40.53 Transport Equipment 10.32 7.93 12.20 30.71 18.28 13.98 59.69 53.21 12.45 9.78 20.54 36.97 Scientific & Measuring Equipment 26.94 30.42 31.78 37.02 25.37 29.19 22.35 29.47 26.33 29.90 27.07 33.07 Furniture & Fixtures 60.16 57.25 57.09 43.88 17.47 9.07 7.18 6.23 23.50 12.35 9.43 11.18 Miscellaneous 5.58 1.42 0.95 1.17 0.42 1.50 1.01 0.72 1.98 1.48 0.99 0.86
Note: *Refers to the percentage of parts and components traded in the respective industry. Fm – import share of parts and components in total imports. Fx – export share of exports of parts and components in total exports. Ftot – trade share of parts and components in total trade. Source: Calculated from Malaysia: External Trade Statistics, various issues.

Devadason
137 Appendix 3: Network Trade with US, Japan and China, by Industry (in per cent) Fm Fx Ftot
Industry 1990 1995 2000 2005 1990 1995 2000 2005 1990 1995 2000 2005 US Electrical & Electronics 96.36 94.72 93.79 94.28 65.22 58.56 41.08 50.57 74.51 70.83 60.89 68.01 Machinery Manufacturing 37.26 45.77 44.68 51.09 46.18 51.83 61.91 17.11 39.90 49.74 58.62 22.91 Transport Equipment 7.61 6.72 23.18 53.16 5.36 4.79 37.58 78.41 7.19 6.07 25.50 58.37 Scientific & Measuring Equipment 18.93 31.53 29.20 36.54 1.02 5.96 12.74 28.57 12.23 20.69 22.05 32.69 Furniture & Fixture 10.02 34.20 24.46 32.04 17.91 8.37 6.74 6.91 17.68 8.79 6.90 8.01 Miscellaneous 0.56 0.59 0.22 0.26 0.04 2.19 1.11 1.35 0.13 1.58 0.73 0.99
TOTAL* 52.17 67.67 73.52 78.46 55.71 51.15 46.74 32.87 54.15 57.19 55.47 47.27 JAPAN Electrical & Electronics 73.33 85.27 87.76 85.00 85.17 47.66 48.07 48.72 77.33 72.66 70.62 70.81 Machinery Manufacturing 18.25 7.05 35.75 30.06 39.59 39.87 56.07 53.99 20.44 13.27 46.65 37.57 Transport Equipment 7.32 7.72 15.92 10.81 26.49 60.35 80.95 89.92 7.67 8.49 17.44 13.04 Scientific & Measuring Equipment 29.16 36.41 37.63 53.05 35.31 41.65 29.94 34.92 30.12 38.00 34.45 45.81 Furniture & Fixture 85.74 75.78 79.73 87.99 15.02 11.68 7.69 5.09 43.85 18.23 11.45 9.64 Miscellaneous 0.00 0.99 0.60 0.69 0.14 3.49 4.63 7.33 0.05 2.06 2.09 3.39
TOTAL* 37.28 45.75 62.74 56.62 70.33 42.28 47.68 46.04 44.11 44.81 56.03 52.96 CHINA Electrical & Electronics 12.46 61.55 60.34 69.55 24.90 70.85 74.30 84.17 20.95 64.52 67.01 75.42 Machinery Manufacturing 6.30 20.55 42.47 56.40 9.50 12.93 66.00 42.39 6.64 16.69 57.24 52.91 Transport Equipment 54.63 33.61 59.28 29.28 2.17 9.52 69.30 77.56 29.13 21.24 63.43 39.51 Scientific & Measuring Equipment 9.59 17.23 14.89 34.92 7.24 14.61 54.55 29.53 8.94 16.72 31.82 32.32 Furniture & Fixture 1.93 19.12 20.13 31.75 26.84 11.21 30.52 39.57 18.23 14.54 24.74 32.74 Miscellaneous 6.26 4.11 2.62 0.86 0.00 0.20 1.01 0.30 5.01 3.68 2.11 0.70
TOTAL* 8.84 37.08 50.91 59.70 17.77 31.73 68.76 66.88 11.73 35.02 60.12 62.11 Note: *Refers to the percentage of parts and components traded with the respective trading partner. Fm – import share of parts and components in total imports from the trading partner. Fx – export share of exports of parts and components in total exports to the trading partners. Ftot – trade share of parts and components in total bilateral trade. Source: Calculated from Malaysia: External Trade Statistics, various issues.
Devadason
138
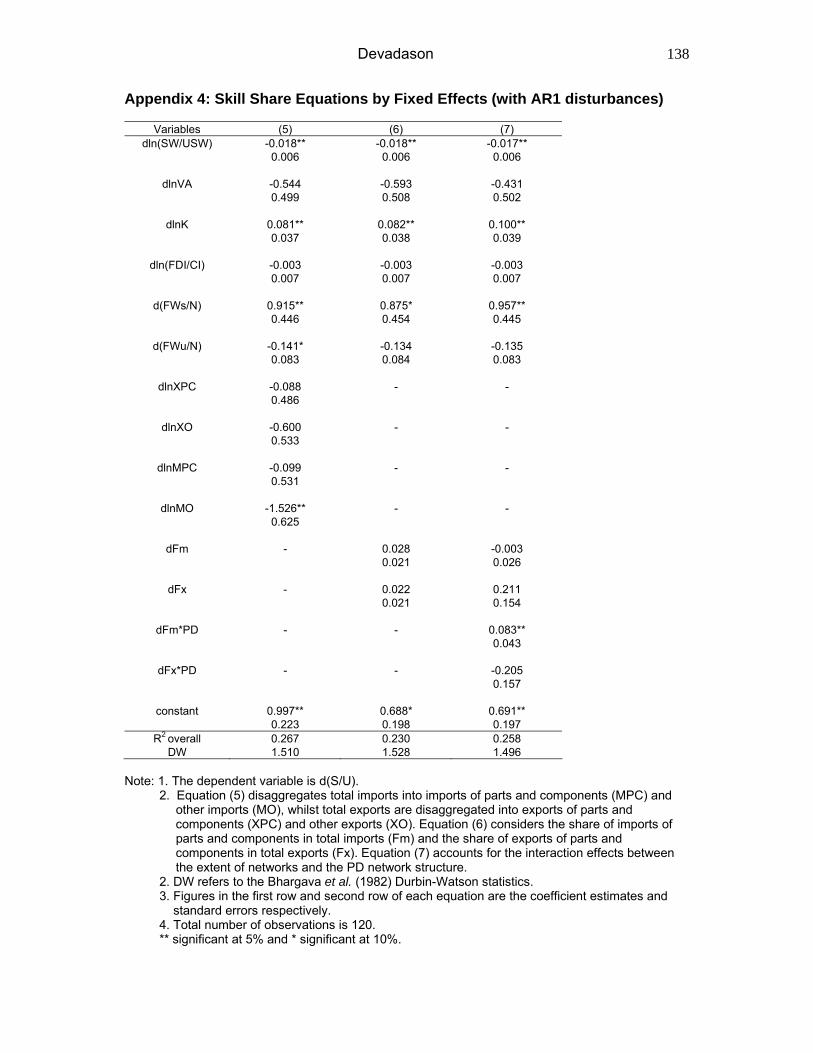
Appendix 4: Skill Share Equations by Fixed Effects (with AR1 disturbances)
Variables (5) (6) (7) dln(SW/USW) -0.018** -0.018** -0.017**
0.006 0.006 0.006
dlnVA -0.544 -0.593 -0.431 0.499 0.508 0.502
dlnK 0.081** 0.082** 0.100** 0.037 0.038 0.039
dln(FDI/CI) -0.003 -0.003 -0.003 0.007 0.007 0.007
d(FWs/N) 0.915** 0.875* 0.957** 0.446 0.454 0.445
d(FWu/N) -0.141* -0.134 -0.135 0.083 0.084 0.083
dlnXPC -0.088 - - 0.486
dlnXO -0.600 - - 0.533
dlnMPC -0.099 - - 0.531
dlnMO -1.526** - - 0.625
dFm - 0.028 -0.003
0.021 0.026
dFx - 0.022 0.211 0.021 0.154
dFm*PD - - 0.083**
0.043
dFx*PD - - -0.205 0.157
constant 0.997** 0.688* 0.691**
0.223 0.198 0.197 R2 overall 0.267 0.230 0.258
DW 1.510 1.528 1.496 Note: 1. The dependent variable is d(S/U). 2. Equation (5) disaggregates total imports into imports of parts and components (MPC) and
other imports (MO), whilst total exports are disaggregated into exports of parts and components (XPC) and other exports (XO). Equation (6) considers the share of imports of parts and components in total imports (Fm) and the share of exports of parts and components in total exports (Fx). Equation (7) accounts for the interaction effects between the extent of networks and the PD network structure.
2. DW refers to the Bhargava et al. (1982) Durbin-Watson statistics. 3. Figures in the first row and second row of each equation are the coefficient estimates and standard errors respectively. 4. Total number of observations is 120. ** significant at 5% and * significant at 10%.
Devadason
139
Notes 1 Alternative terms have been given to reflect the same concept, such as segmentation, integrated production, outward processing (see Lall et al., 2004), intra-product specialization, super-specialization (see Helg and Tajoli, 2004), multi-stage production (Hummels et al., 2001), de-localization, disintegration (see Hijzen et al., 2003), production sharing, vertical specialization, slicing the value chain and outsourcing (see Feenstra and Hanson, 1996; Athukorala and Yamashita, 2006), kaleidoscope comparative advantage and intra-mediate trade (Rajan, 2005). 2 Lall et al. (2004) argue that electronics is fragmenting faster than automobiles due to the fact that the former has discrete processes, of which several are labour intensive, and more importantly is the high value-to-weigh ratio of components that makes distant locations economical (see also Eichengreen and Hui, 2005). 3 Specialization along the production chain, which implies specific gains since it involves products of different qualities. 4 The leading export product category to China from the rest of the world is electrical and electronic products, particularly key components (electronic integrated circuits and micro assemblies) used in the assembly of electronic products 5 Gereffi (1999a, 1999b) states that industrial upgrading includes: (a) within factories - a movement from cheap to expensive items and simple to more complex goods (product characteristics); (b) within inter firm enterprise networks - a movement from low-value labour intensive industries to capital and technology intensive industries or mass production of standardized goods to flexible production of differentiated goods (intersectoral shifts); (c) within local or national economies - a movement from simple assembly of imported inputs to higher value-added goods and services involving forward and backward linkages along the supply chain (intrasectoral progression); and (d) within regions – a movement towards phases of the production chain that involves raw material supply, production, marketing and design (economic activities). 6 There is no comprehensive relevant statistics that allow for precisely measuring the role of international production and trade networks. This paper draws evidence from the analysis of trade flows for the period 1990 to 2005. The 1980s is not considered due to the change in national classification of trade statistics (see Appendix 1), which yields measurement errors in analyzing trade flows in parts and components. 7 The changes in the patterns of imports reflect the growing share of intermediate goods and a declining share of consumption goods (UNDP, 2006b). 8 The automobile industry in particular has become rather globalized. Malaysia has become the core site of passenger car manufacturing within the ASEAN-4. Since 2003, the intra-ASEAN market has been opened up for rather free trading of auto components and parts in formal terms (Wad, 2006). 9 The study by Eichengreen and Hui (2005) indicate overall positive effects for Malaysia due to trade with China, reflecting the specialization of Malaysia in exports of components and other capital goods that are much demanded by the latter. 10 Average unit values are used as a proxy for determining the quality of goods traded (see also Appelbaum, 2004 for other measures that tap into dimensions of the production side of industrial upgrading). Unit values measured at the finest level of aggregation of which data are available minimize the incidence of composition problems (Hallak, 2006). 11 Athukorala’s (2003) classification of ‘parts and components’ are found to be more comprehensive than that of Ng and Yeats (1999) given that the latter does not include semiconductor products in their classification. Therefore the Ng and Yeats (1999) classification will understate the true importance of this exchange. However it is acknowledged that this classification is not an exhaustive measure of the phenomenon of international fragmentation, which goes beyond trade in parts and components to include the delocalization of specific segments of the production process. 12 Various ways have been adopted in the literature to identify trade in parts and components. Athukorala and Yamashita (2006) identify 225 products at the 5-digit level SITC as parts and components belonging to sections SITC 7 (machinery and transport equipment) and SITC 8 (miscellaneous goods) while Lall et al. (2004) concentrate on the 4-digit SITC 7. 13 See Lall et al. (2004) for the limitations in capturing fragmentation (partially) by merely separating finished goods from parts and components.