Embed Size (px)
Citation preview

Process Modeling and Optimizationof Resistance Welding for
Thermoplastic Composites
ZIYA SEYHAN COLAK, FAZIL ONDER SONMEZ* AND
VAHAN KALENDEROGLU
Department of Mechanical Engineering
Bogazici University
Istanbul, Bebek, 80815
Turkey
(Received March 14, 2000)(Revised January 25, 2001)
ABSTRACT: Resistance welding is a suitable technique for joining thermoplasticcomposites. Like other fusion bonding processes, it involves heating, melting andcooling steps. Productivity depends on the time that passes during these steps. This isthe first study that tries to increase the productivity of the process in a systematicway. The objective of the present study is to determine the optimum set of processparameters to minimize the processing time. In order to ensure that the resultingjoint satisfied the requirements of quality, the relationship between process variablesand quality of the welded joint was established through process modeling. First, aone-dimensional transient heat transfer analysis was carried out using a finitedifference method to find the temperature profiles across the thickness of the weldingstack. Then, the heat transfer analysis was coupled with a degradation kinetics modelin order to determine whether the resulting part has undergone excessive thermaldegradation, or not. Finally, a bonding model adapted to the resistance weldingprocess was used to determine the degree of bonding between the laminates. Theprocess model was eventually combined with an optimization algorithm to minimizethe processing time without violating the quality requirements. The algorithm wasbased on a search method called Nelder–Mead. Finally, optimum processparameters were obtained for different thicknesses of APC-2 laminates.
INTRODUCTION
FIBER REINFORCED THERMOPLASTIC composites have been introduced as structuralmaterials for high performance applications as an alternative to thermoset composites.
Because of the limited deformation capacity of continuous fiber reinforcements, only
*Author to whom correspondence should be addressed.
Journal of COMPOSITE MATERIALS, Vol. 36, No. 06/2002 721
0021-9983/02/06 0721–24 $10.00/0 DOI: 10.1106/002199802023507� 2002 Sage Publications

structures having relatively simple geometry can effectively be produced from thesematerials in order to conserve the potential for rapid and low-cost production. In order tocreate large and complex structures, several of these simple components must be joinedtogether. The thermoplastic matrix in such composites enables the application of fusionbonding techniques to replace the traditional joining methods such as adhesive bondingand mechanical fastening.
Fusion bonding is accomplished by raising the temperature of the joint above the melttemperature of the thermoplastic polymer at the interface, and then allowing the joint tocool down while intimate contact is maintained by the applied pressure [1]. Theadvantages of fusion bonding over other joining techniques include the elimination ofstress concentrations and damaging of fibers, which is inevitable in mechanical fastening,and the possibility of achieving bond performance similar to the bulk properties of thejoined parts. The processing times for welding are much shorter than those involved inadhesive bonding which requires extensive surface preparation [2]. It also offers the chanceof reprocessing if inspection shows that bonding is not complete.
Fusion bonding can be performed by supplying heat to the system, which can beachieved in a number of ways. Resistance welding is a simple way of generating heat. Bypassing an electric current through the carbon fibers of a ply, sandwiched between twothermoplastic composite laminates, fusion bonding can be achieved quickly (Figure 1). Toaccomplish this, a single unidirectional carbon fiber prepreg with a thermoplastic matrix isused as the resistance heating element [1]. Since the heating element will become part of thebond, it must be compatible with the matrix of the composite laminates to be joined. Yet,the range of compatible materials seems to be large. Indeed, use of a steel mesh as heatingelement was reported to produce strong joints [3]. The inclusion of a thin thermoplasticfilm between the heating element and the laminate was recommended, in order to give a
Figure 1. Resistance welding setup for joining thermoplastic composites [2,5].
722 ZIYA SEYHAN COLAK, FAZIL ONDER SONMEZ AND VAHAN KALENDEROGLU

degree of resin richness that facilitates the welding process [4]. A plate is used for thepurpose of insulating the parts to be joined and creating a uniform pressure.
During the welding process, the electrical heating must be sufficient to melt thethermoplastic matrix of the single ply, the thermoplastic film and the thermoplastic matrixon the inner surfaces of the laminates. If the supplied thermal energy exceeds the heatloss from the joint, temperature increases, and thus melting and fusion of the interfacetake place. The current is switched off after nominal melting of the interface isachieved, and the joint is allowed to cool down, while consolidation pressure is maintained[1]. The consolidation pressure impedes the void growth, and sustains the intimate contact.
Resistance welding has been studied by several research groups in recent years. Benatarand Gutowski [6] investigated a variety of methods for joining advanced thermoplasticcomposites, including resistance welding. They found the resistance welding process to beone of the most successful bonding techniques. Eveno and Gillespie [7] investigatedexperimentally resistance welding of preconsolidated unidirectional graphite (AS4)reinforced polyetheretherketone (PEEK) composite laminates (APC-2). They conductedexperiments to identify important process variables governing the efficiency of the weldingprocess. Maffezzoli et al. [8] developed a mathematical model in order to describe thewelding behavior of APC-2 laminates. By using the model, they determined thetemperature and crystallinity profiles along the thickness of the welding system.Jakobsen et al. [9] developed a transient two-dimensional anisotropic thermal model ofthe resistance welding process for semicrystalline thermoplastic composites. Theyinvestigated resistance-welded double cantilever beam specimens made of unidirectionalgraphite-reinforced-polyetheretherketone plies. Bastien and Gillespie [10] studied the non-isothermal fusion bonding of thermoplastic composites (graphite/PEEK) using anamorphous film (PEI) at the interface. They proposed a model, based on the healingtheory of amorphous polymers to predict strength and toughness as a function of non-isothermal process history. Holmes and Gillespie [11] developed one-dimensional and two-dimensional thermal models for large-scale sequential resistance welding processes. Theyconducted a parametric study to investigate the influence of welding parameters. Don et al.[1,12] performed extensive experimental work to find lap-shear strength and interlaminarfracture toughness of resistance-welded APC-2 laminates in both unidirectional and quasi-isotropic configurations, using PEEK and polyetherimide (PEI) films at the joint interface.Hou et al. [13] experimentally investigated resistance welding of CF-fabric/PEI compositesand developed a processing window using power level and heating time as processvariables. Xiao et al. [5] considered the use of resistance welding for the purpose ofrepairing thermoplastic composite structures and examined different fusion bondingtechniques. They also developed a two-dimensional finite element model for resistancewelding of APC-2 lap-shear specimens. Ageorges et al. [2] proposed a transient three-dimensional finite element model for resistance welding of thermoplastic composite lap-shear specimens. Later, they extended their work on resistance welding by modelingconsolidation and crystallization [14,15]. They also evaluated different welding config-urations for lap-shear specimens, namely APC-2 laminate/PEEK film, APC-2 laminate/PEI film and CF-PEI laminate/PEI film.
Model-based analyses and experimental studies of the resistance welding process werecarried out in the previous studies. Parametric studies or experimentation were the usualmethods for determining a suitable set of process parameters. However, the problem ofdetermining the processing conditions in which one can achieve the process in the shortestpossible time without compromising the quality of the resulting joint has not been
Process Modeling and Optimization of Resistance Welding 723

attacked so far. The objective of the present study is to create a process model forresistance welding and obtain the optimum set of process parameters that minimizes theprocessing time. Requirements of full consolidation and limited thermal degradationconstitute the constraints of the optimization problem. In order to produce a joint with thedesired properties, one should compromise two contradictory effects. Supplying a largeramount of heat results in higher temperature levels and thus facilitates consolidation butalso accelerates degradation. On the other hand, if one chooses a smaller amount of heat,consolidation is adversely affected but degradation becomes less severe. Therefore,consolidation and degradation set the lower and upper limits on the amount of the heatsupplied. Since thermal degradation and consolidation depend on the temperature duringthe process, a one-dimensional transient heat transfer analysis was carried out using afinite difference method which gave the temperature profiles across the thickness of thewelding stack. Then, the heat transfer analysis was coupled with a degradation kineticsmodel in order to determine whether or not the resulting part has undergone excessivethermal degradation. Finally, a bonding model adapted to the resistance welding processwas used to determine the degree of bonding between the laminates.
Since the effects of process parameters on the quality of the joint interact with eachother, a parametric study is not feasible for this problem. Therefore, the use of anoptimization algorithm is needed. Accordingly, the process model was combined with anoptimization algorithm to obtain the optimum process state, which minimized theprocessing time without violating quality constraints, and thus achieving highproductivity. The process state was defined in terms of the power input and the heatingtime during which the power is applied.
THE HEAT TRANSFER ANALYSIS
In this study, we assume that heat loss predominantly occurs through the top andbottom surfaces of the composite. The results of the previously reported two- and three-dimensional thermal models of Xiao et al. [5] and Ageorges et al. [2], respectively, did notshow any significant change in temperature along the length and width of the composite,in comparison with the temperature variation across the thickness. Therefore, these studiessupport our assumption. The problem is thus reduced to that of one-dimensional transientheat transfer across the thickness of the composite. The governing equation can then bewritten as
@
@Xk@T
@X
� �þ _qq ¼ �c
@T
@tð1Þ
where k, �, c and _qq are thermal conductivity, density, specific heat and heat generation rateper unit volume, respectively. The symmetry of the welding system about the y–z plane(Figure 1) implies that heat transfer does not occur through that plane, and thus it can beconsidered as an insulated surface (Figure 2).
The boundary condition at x¼ 0 therefore becomes
@Tð0, tÞ
@x¼ 0 ð2Þ
724 ZIYA SEYHAN COLAK, FAZIL ONDER SONMEZ AND VAHAN KALENDEROGLU

The outer boundary surface at x¼ x4, dissipates heat by convection to the surroundingair. If the ambient temperature is T1 the following boundary condition holds on the top:
�k4@Tðx4, tÞ
@x¼ h½Tðx4, tÞ � T1� ð3Þ
where k4 is the thermal conductivity of the insulator; and h is the heat transfer coefficienton the top surface.
In the model, it is assumed that heat is directly conducted between individual layers ofthe welding stack, which is true only when full intimate contact is achieved. To simulateimperfect intimate contact, a gap conductance term may be introduced to account for thepartial contact at the interfaces. However, Ageorges et al. [2] observed that introducing thegap conductance concept to simulate the presence of rough contact surfaces between theheating element, the neat thermoplastic film and the thermoplastic composite laminatedoes not affect the predictions significantly. These observations thus validate the perfectintimate contact assumption. For the other interface at x¼ x3, the same assumption can bemade.
The interface conditions can then be expressed as
Tðxm� , tÞ ¼ Tðxmþ , tÞ m ¼ 1, 2, 3 ð4Þ
km@Tðxm� , tÞ
@x¼ kmþ1
@Tðxmþ , tÞ
@xm ¼ 1, 2, 3 ð5Þ
Considering that polymer properties are quite sensitive to the change in temperature,and joining operation requires considerable temperature change from the roomtemperature to above the melting temperature, thermal properties may not be assumedto be constant during the process. Therefore, in order to determine the temperature fieldaccurately, temperature-dependent material properties should be used. In this study,
Figure 2. Schematic of the one-dimensional modeling case.
Process Modeling and Optimization of Resistance Welding 725

the temperature-dependent material properties, reported by Ageorges et al. [2] for PEEKand APC-2, are used.
The transient thermal analysis becomes non-linear if the material properties areassumed to be temperature-dependent. Because of the non-linearity caused by theassumption of a variable thermal conductivity, we cannot apply an analytical method tosolve the governing differential equations. For this reason, we employed the Crank–Nicolson scheme to solve the transient heat conduction problem, which is an implicitmethod. An explicit method was not used to avoid the restriction imposed by the stabilityrequirement on the size of the time increment. The resulting finite difference equation canbe expressed as [16]
1
2
ðki�1 þ ki=2Þ ðTnþ1i�1 � Tnþ1
i Þ � ðki þ kiþ1=2Þ ðTnþ1i � Tnþ1
iþ1 Þ
ð�xÞ2
"
þðki�1 þ ki=2Þ ðT
ni�1 � Tn
i Þ � ðki þ kiþ1=2Þ ðTni � Tn
iþ1Þ
ð�xÞ2
�þ _qq ¼ �ici
Tnþ1i � Tn
i
�t
ð6Þ
where the subscripts (i� 1), (i) and (iþ 1) represent the nodal points in the direction; thesuperscripts (n) and (nþ 1) represent conditions at times (t) and (tþ�t); �x representsthe step size in length; and represents the size of the time increment. Ozisik [16] usedthe method of lagging the evaluation of the temperature- dependent properties by one timestep, in order to write Equation (6).
Heat Generation
In a resistance welding process, the heat generation per unit volume within the solutiondomain can be expressed as [9]
_qq ¼
_qqelec þ _qqcrys � _qqmelt 0 x < x1_qqcrys � _qqmelt x1 x < x3
0 x3 x < x4
8<: ð7Þ
where _qqelec is the rate at which electrical energy is generated per unit volume; _qqmelt is therate at which energy is absorbed per unit volume during melting of the crystals; and _qqcrys isthe rate at which energy is released per unit volume during the crystallization of thethermoplastic matrix. The effect of latent heat resulting from crystallization and melting ofcrystals on the heat transfer, appears to be very small as compared to _qqelec and thus isnegligible [9,15]. The energy corresponding to latent heat is only of the order of a fewpercent of the total electrical energy supplied to the heating element. Therefore, _qqmelt and_qqcrys in Equation (7) are neglected. The electrically generated _qqelec is related to theresistance, R, of the heating element. The resistance of the heating element is very criticalto the welding process and can be found from the following expression [9]:
R ¼ �1
wð8Þ
726 ZIYA SEYHAN COLAK, FAZIL ONDER SONMEZ AND VAHAN KALENDEROGLU

where � is the resistivity per thickness of the rectangular heating element (�) of length land width w. The APC-2 prepreg heating elements have an average resistivity, �, of0.175W per prepreg thickness [5]. The electrical power is supplied through the heatingelement. The power delivered is simply
P ¼ UI ¼ I2R ð9Þ
where U is the voltage; and I is the applied current. The volumetric heat generation rate,_qqelec, can then be expressed as
_qqelec ¼P
V¼
I2R
Vð10Þ
where V is the volume of the heating element:
V ¼ lwh ð11Þ
where h is the thickness of the heating element. From Equations (8) to (11), the followingequation is obtained:
_qqelec ¼I
w
� �2�
hð12Þ
THE DEGRADATION ANALYSIS
When a polymer is exposed to high temperatures, it tends to degrade and decomposebecause of unstable or reactive condition of covalent bonds. Day et al. [17] suggested thatthe degradation of PEEK in air is dependent on both the rate of oxygen diffusion to thepolymer and the rate of volatilization of degraded fragments. The controlling mechanismof degradation in air is, therefore, the transport of oxygen through the melt. In theresistance welding process, the maximum temperature occurs at the center of the heatingelement. Thus, the start of serious degradation can be checked by calculating the amountof degradation at the center of the heating element. Since it has no contact with thesurrounding air, a degradation kinetics model, which was developed in nitrogenatmosphere, can be applied to the resistance welding process without much compromiseof the accuracy of the results.
Thermal degradation, as considered in this study, pertains to the material weight loss ofthe thermoplastic matrix. While other chemical mechanisms like cross-linking mayadditionally affect the properties and the overall performance of the composite, thematerial weight loss has been the principal measure of degradation modeled in theliterature [18]. The amount of degradation �d is given by the ratio of the current weightloss to the final weight loss:
�d ¼M0 �M
M0 �Mfð13Þ
Process Modeling and Optimization of Resistance Welding 727

where M, M0 and Mf are the current, initial and final weights of the polymer, respectively.Nam and Seferis [19] developed a non-isothermal model to describe the polymer weightloss caused by thermal degradation. Their model was applicable to PEEK in a nitrogenatmosphere, and the rate of change in weight loss was given by
d�d
dt¼ kðTÞf ð�dÞ ð14Þ
where k(T) is a rate constant and f (�d) is the degradation factor. The temperaturedependence of the rate constant was described by an Arrhenius expression:
kðTÞ ¼ A exp �E
RT
� �ð15Þ
where A is a pre-exponential factor and for PEEK it is equal to 8.265 1012 s�1 [19]; E isthe activation energy and for PEEK it is equal to 240.2 103 J/mol [19]; and R¼ 8.3145 J/molK is the universal gas constant. For PEEK, the degradation factor f (�d) can beexpressed as
f ð�dÞ ¼ w1ð1� �dÞ þ w2�d ð1� �dÞ ð16Þ
where w1¼ 0.0215 and w2¼ 0.9785 are the weight factors [19]. Nam and Seferis considered36% of the original weight as the main weight loss capacity of PEEK. The percentage ofreduction in the weight of the polymer is then expressed as
� ¼ 100M0 �M
M0¼ 36�d ð17Þ
THE CONSOLIDATION ANALYSIS
Consolidation in a composite manufacturing process is accomplished by applyingpressure and heat to the material system to squeeze out the air and volatiles, or melt themwithin the material. Incomplete consolidation results in high void content, which mayseriously degrade inter-laminar shear strength of the composite, which has a significanteffect on compressive strength, impact resistance and fatigue life [20]. Therefore, accuratemodeling of the consolidation process plays an important role in ensuring the quality ofthe resulting composite structure. In resistance welding, consolidation can be characterizedby a polymer to polymer interface healing process [14], which involves diffusion ofpolymer chains through the interface. The establishment of intimate contact is requisite forthe development of autohesion.
Intimate Contact
Loos and Dara [21] developed a model to describe the development of intimate contactand bond formation between plies during processing of amorphous thermoplastic
728 ZIYA SEYHAN COLAK, FAZIL ONDER SONMEZ AND VAHAN KALENDEROGLU

composites. They assumed that irregular surfaces of the plies can be represented by a waveof rectangular elements having different sizes and analyzed the behavior of these elements.Lee and Springer [22] proposed a model for intimate contact based on the work of Loosand Dara for processing of thermoplastic composites. They followed the model of Loosand Dara but considered the elements of the same size. Mantell and Springer [23] adaptedthe model developed by Lee and Springer to tape laying and filament winding processes.Since these are non-isothermal processes, their model is also suitable for resistancewelding. The expression for the degree of intimate contact was given as [23]:
DicðtÞ ¼ a�Z t
0
Papp
�mfd�
�ð18Þ
where Papp is the applied pressure. To prevent void formation, this consolidation pressureshould be applied until the maximum temperature in the welding stack becomes lowerthan 143�C, which corresponds to the glass transition temperature of PEEK matrix. Incontrast to tape laying, in resistance welding the pressure is uniform. Therefore, it waskept constant during the simulation. The geometric factor a* can be determined by fittingthe model to the experimental data. Ageorges et al. [14] determined a* to be 0.147 for theinterface between APC-2 laminate and PEEK film. This value was also used in the presentstudy in order to calculate the effect of surface roughness on consolidation. The viscosityof the material, �mf, was assumed to be temperature-dependent. For the APC-2 matrix-fiber system, viscosity is expressed as [23]
�mf ¼ 132:95 exp2969
T
� �ð19Þ
where the temperature T is given in K.
Autohesion
Once two surfaces are brought into intimate contact and, thus, the physical barrierbetween the two surfaces is removed, molecules are free to move across the interface in theso-called autohesion process [14]. Diffusion of macromolecules across the interface startsbecause of random thermal motions. After sufficient time has passed, some of the chainswill have diffused across the interface and entangled with molecular chains on the otherside of the interface, so that interface is no longer distinguishable from the bulk polymer.The development of autohesion can be described by the reptation theory which was firstdeveloped by de Gennes [24]. The reptation theory is suitable to describe the motion of achain at the interface. The theory was successfully applied by Wool et al. [25,26] for theprediction of mechanical properties during healing. Cho and Kardos [27] performedisothermal experiments for PEEK and confirmed Wool’s findings. Bastien and Gillespie[10] applied the reptation theory to resistance welding of APC-2 laminates using a PEI film.Sonmez and Hahn [28] modified the reptation model of de Gennes in order to simulateautohesion under non-isothermal process conditions for thermoplastic composite tapeplacement. Ageorges et al. [14] used amodel for autohesion based on thework of Bastien andGillespie for the resistance welding of thermoplastic-matrix composite lap-shear specimens.
Process Modeling and Optimization of Resistance Welding 729

Diffusion of molecular chains across an interface is a temperature-driven process. Inorder to consider non-isothermal processes, the temperature history is divided into finitetime intervals during which the temperature is assumed to be constant. This is an approachsimilar to that of Bastien and Gillespie [10]. In each isothermal step, the healing theory canthen be applied. The resulting expression is as follows [28,29]:
DauðtÞ ¼
Z i
0
d�
2ffiffiffiffiffiffiffiffiffiffiffi�trð�Þ
p" #1=2
ð20Þ
where the reptation time tr is related to the temperature through an Arrhenius law:
tr ¼ C expR�
R
1
T�
1
Tref
� � �ð21Þ
where the following values for the above constants apply for PEEK: C is the parameterfor the reptation time and is equal to 0.11 sec [30]; Ea is the activation energy of diffusionof the polymer and is equal to 57300 [30]; Tref is the reference temperature and is equalto 673.15 [30]; T is the inter-ply temperature; and R is the universal gas constant.
Degree of Bond
In general, the processes of intimate contact and autohesion are coupled, in thatintimate contact is a prerequisite for the initiation of autohesion. Once intimate contactis established at a point along the interface, autohesion, and thus bonding process starts.The area that is in contact increases with time. The degree of bond Db can be defined asthe area average of bond strengths calculated for each of the incremental areas that comeinto intimate contact throughout the duration of the bonding process. Considering a timeinterval between � and �þ�� during the process, the incremental dimensionless area thatcomes into intimate contact in this period is given by (dDic/d�)d�. The extent of autohesionfor this incremental area, observed at a final time tb, may be denoted as Dau(tb� �), wheretb� � is the time available for the incremental area to heal. The net bond strengthdeveloped at the interface after a time tb is an area average of the bond strengths of each ofthe incremental areas. The degree of bond Db may be expressed in a dimensionless form asfollows [30]:
DbðtbÞ ¼
Z tb
0
Dauðtb � �ÞdDicð�Þ
d�d� ð22Þ
where tb is the duration of the process. Bonding is complete when Db becomes unity.
PROCESS WINDOW DEVELOPMENT
The ultimate goal of the process modeling for resistance welding is to quantify theprocess parameters that will result in a joint satisfying the quality requirements. A processwindow is defined by feasible ranges of values of process parameters that result in joints
730 ZIYA SEYHAN COLAK, FAZIL ONDER SONMEZ AND VAHAN KALENDEROGLU

with desired properties. In this study, a process window for resistance welding is developedusing weight loss through thermal degradation and interlaminar shear strength as productquality criteria. Previously described analyses for heat transfer, degradation andconsolidation are combined to build the process window for resistance welding.
As the first quality requirement, the extent of thermal degradation of the materialshould not be excessive so that its effect on the overall performance of the composite partis negligible. As mentioned previously, thermal degradation of the polymer results fromprolonged exposure of the laminates to high temperatures during the process, which inturn degradates the properties and performance of the products. Among its effects arethe loss in the material modulus, and the increase in the glass transition temperature of thepolymer [18]. The increase in the glass transition temperature may significantly affectthe bonding of the layers and the final strength of the product. It is therefore importantto ensure that the amount of degradation remains within allowable limits. Cogswell [31]suggested the maximum process times at different processing temperatures for APC-2 inan oxygen-free environment. Sonmez and Hahn [32] compared the results of thedegradation kinetics model of Nam and Seferis [19] to the data given by Cogswell [31]. Intheir work [32], they estimated the maximum allowable weight loss to be 0.01%, whichfully satisfied the suggested maximum process times given by Cogswell [31].
The objective in resistance welding is to fully achieve consolidation during the joiningprocess, so that bulk properties are realized at the joint. The resulting void content in thecomposite is an important parameter affecting the product quality. Voids may alter themechanical and thermal properties of the composite considerably, as well as initiate andaccelerate material failure mechanisms [18]. Furthermore, the presence of voids reducesload-carrying capacity of the laminate.
Although the process pressure favorably affects the development of intimate contact,excessive process pressures should be avoided because of possible fiber damage, fiber-bedspread or resin starvation. Xiao et al. [5] conducted experiments to compare the lap-shearstrengths and the void contents of APC-2 specimens welded by resistance welding underdifferent pressures. In their work, they observed experimentally that a pressure as low as1.2 was sufficient to prevent deconsolidation of APC-2 laminates during resistancewelding. In this study, as in some previous studies [1,12,14], the welding pressure is takenas 1.38MPa.
In the process model (Figure 3), the degree of bond was calculated at the interfacebetween the PEEK film and the APC-2 laminate. This is because this interface experiencesa lower temperature compared to the interface between the heating element and the PEEKfilm and accordingly, a lower degree of bonding is expected.
The bonding process continues as long as the temperature is high enough to allowmolecular mobility. Cho and Kardos [27] reported that bonding below 270�C was veryslow. Accordingly, bonding calculations are continued as long as the temperature at theinterface is above 270�C.
Because of the restricted movement of crystallized polymer chains, the autohesionprocess starts at temperatures above 320�C, which corresponds to the transition tem-perature between crystallization and melting [33]. During cooling, crystallization starts atabout 320�C, but it takes time to complete. Therefore, autohesion calculations arecontinued until 270�C.
The process time tw is the time that passes between the onset of power delivery andcooling below the glass transition temperature. During this time, pressure and thusintimate contact is maintained.
Process Modeling and Optimization of Resistance Welding 731

The process model is used in order to calculate some input parameters for theoptimization procedure. These input parameters are the weight loss through thermaldegradation �, degree of bonding Db and welding (process) time tw.
OPTIMIZATION
The purpose of optimization is to find the best possible solution among the manypotential solutions for the given problem in terms of a performance criterion. Theobjective of the process optimization problem for resistance welding is to minimizethe process time without violating the product quality constraints. Processing times canbe reduced by increasing the power input as much as possible without violating theconstraints. Since our process modeling is based on a numerical method, it is difficult to
Figure 3. Solution procedure in the process model for resistance welding. th is the welding time and I/w is thecurrent intensity per unit width.
732 ZIYA SEYHAN COLAK, FAZIL ONDER SONMEZ AND VAHAN KALENDEROGLU

use the optimization algorithms that require the derivative of the objective and theconstraint functions. In this respect, zero order methods are more suitable. Among themare stochastic and deterministic methods. The advantage of stochastic methods likeSimulated Annealing and Genetic Algorithms is that they may easily converge to theglobal minimum and start from any set of values of process parameters whether it issatisfying the constraints, or not. However, they are difficult to apply and expensive interms of computational time. Zero order deterministic methods like Nelder–Mead andPowel’s methods are much easier to apply but they do not necessarily converge to theglobal optimum. A deterministic algorithm should be employed many times starting fromdifferent points within the feasible region of process parameters. Then, the lowest value ischosen as the global minimum of the objective function. In this study, the search foroptimum process parameters was started with the use of the Nelder–Mead method [34].Using this method, the solution domain was proven to be containing a low number oflocal minima. Therefore, the Nelder–Mead method was found to be a suitable choice.
Polymer Degradation Constraint
The degradation in this study is quantified as the material weight loss during theprocess. This constraint may be written as an inequality relationship of the form
� �max ð23Þ
where � is the degree of degradation at the center of the heating element, the locationwhere the temperature is highest during the welding process; and �max is the maximumallowable degree of degradation, which is 0.01% polymer weight loss, as mentionedbefore. Equation (17) is used to calculate �.
Interlaminar Shear Strength Constraint
Shear strength at the joint is supposed to reach its ultimate value or, equivalently, thedegree of bond, Db, should reach unity, i.e. complete interfacial bonding should beachieved:
¼ 1 or Db ¼ 1 ð24Þ
Since a relationship has already been established between the shear strength and thedegree of bond Db, only the degree of bond will be considered. For full consolidation,the interface between the APC-2 laminate and the neat PEEK film should have Db¼ 1 atthe end of the welding process.
Objective Function
Since two quality criteria (Equations 23 and 24) should be satisfied in the resulting joint,our problem is a constrained optimization problem in which degradation andconsolidation act as constraints. However, by using penalty functions, a constrainedoptimization problem can be transformed into an unconstrained problem. As a result,
Process Modeling and Optimization of Resistance Welding 733

much simpler algorithms can be employed for the minimization such as the one that weuse. A combined objective function may be constructed [35] with the aforementionedconstraints (Equations 23 and 24):
f ¼twtmax
þ C1ð1�DbÞ2þ C2 �� �maxh i2, �� �maxh i ¼
0 for � �max
�� �max for � > �max
ð25Þ
where tw is the welding (process) time, which is normalized by a maximum time,(tmax¼ 1000 s); C1 is the weighting factor for consolidation; C2 is the weighting factor fordegradation. The optimization procedure used for the resistance welding process isillustrated in Figure 4. Here, I is the applied current intensity (A); w is the width of theheating element (m); and th is the heating time during which power is supplied (s). Usingthe Nelder–Mead method, values for the controllable process variables (I and th) aredetermined leading to minimum processing time, tw. The Nelder–Mead algorithmproceeds from three initial values of the objective function because the number ofvariables is two, Iw and th, and then calculates the next iteration values. At the start of theoptimization, initial values of the weighting factors are taken as 10 and 1000, respectively.These low values are chosen to preclude the penalty terms getting very large values duringthe initial stages of the optimization where severe constraint violations are possible.
Figure 4. The optimization procedure for the resistance welding process.
734 ZIYA SEYHAN COLAK, FAZIL ONDER SONMEZ AND VAHAN KALENDEROGLU
During optimization, these values are increased in each iteration until they reach a certainlimit. Their limiting values are 1 106 and 1 1012, respectively. These values areappropriate in the sense that if lower values are chosen, the solution may not converge to apoint within the feasible region or very close to it, but to a point that can be considered tobe too far from the feasible region. On the other hand, if higher values are used, thesolution will not improve.
RESULTS AND DISCUSSIONS
Verification
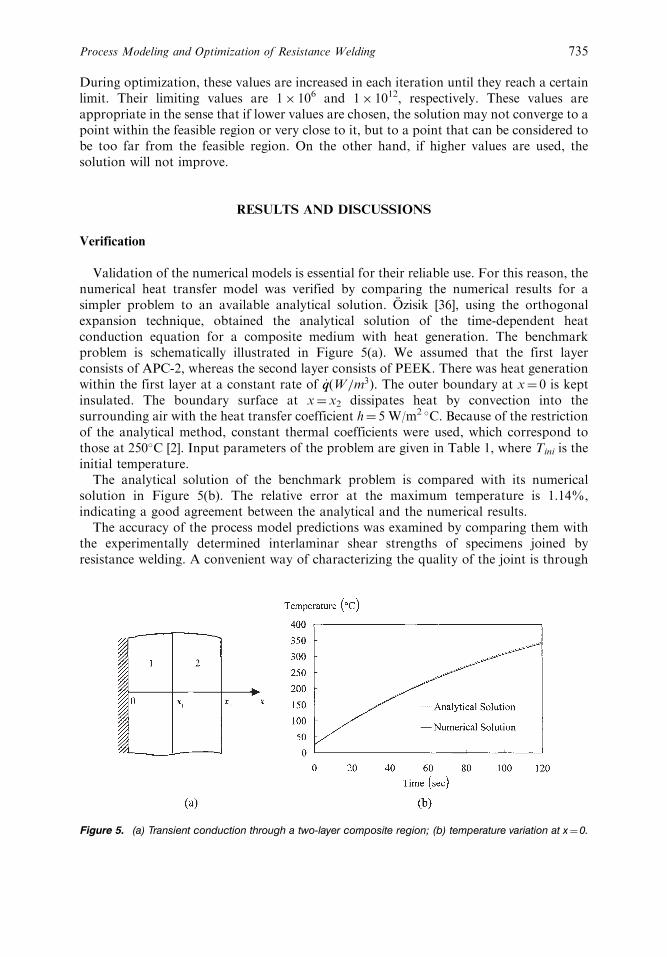
Validation of the numerical models is essential for their reliable use. For this reason, thenumerical heat transfer model was verified by comparing the numerical results for asimpler problem to an available analytical solution. Ozisik [36], using the orthogonalexpansion technique, obtained the analytical solution of the time-dependent heatconduction equation for a composite medium with heat generation. The benchmarkproblem is schematically illustrated in Figure 5(a). We assumed that the first layerconsists of APC-2, whereas the second layer consists of PEEK. There was heat generationwithin the first layer at a constant rate of _qqðW=m3Þ: The outer boundary at x¼ 0 is keptinsulated. The boundary surface at x¼ x2 dissipates heat by convection into thesurrounding air with the heat transfer coefficient h¼ 5 W/m2 �C. Because of the restrictionof the analytical method, constant thermal coefficients were used, which correspond tothose at 250�C [2]. Input parameters of the problem are given in Table 1, where Tini is theinitial temperature.
The analytical solution of the benchmark problem is compared with its numericalsolution in Figure 5(b). The relative error at the maximum temperature is 1.14%,indicating a good agreement between the analytical and the numerical results.
The accuracy of the process model predictions was examined by comparing them withthe experimentally determined interlaminar shear strengths of specimens joined byresistance welding. A convenient way of characterizing the quality of the joint is through
Figure 5. (a) Transient conduction through a two-layer composite region; (b) temperature variation at x¼0.
Process Modeling and Optimization of Resistance Welding 735

measuring the bond strength. Don et al. [1,12] experimentally investigated fusionbonding of two 16-ply APC-2 laminates by resistance welding. At the joint, they used aheating element sandwiched between two layers of neat PEEK film, and experimentallyquantified the influence of processing time and power input on the performance of thejoint through lap-shear testing. Using the same process parameters, the strengths ofthe welded joints were numerically quantified by the present process model. The valuesfor the degree of bonding were calculated by Equation (22). The comparison of thenumerical results and the experimental data reported by Don et al. is given in Table 2.Here, _qq is the power level; and th is the heating time during which the current is applied.The calculated values for the degree of bonding, Db, and the measured values of /1,which is the ratio of the measured shear strengths to the ultimate shear strengths, are ingood agreement. The ultimate lap-shear strength for APC-2 was reported to be65.55MPa [37].
Processing Windows
Using the process model, a parametric study was conducted in order to observethe feasible range of controllable process variables, which were the current intensity,I/w, and heating time, th. The results are shown in Figures 6 and 7. As seen in thesefigures, the feasible area for the controllable process variables consists of a narrowband. Increasing heating time or current intensity may result in excessive degradation.Decreasing them may lead to insufficient consolidation. Therefore, one should becareful in choosing appropriate values for the variables during the resistance weldingprocess.
Minimum Processing Times
Using the Nelder–Mead method [34], optimum values for controllable process vari-ables were calculated. As given by Don et al. [1,12], the thickness of the ceramic insula-tor was taken as 2.5 cm. The material properties of the ceramic insulator are givenin Table 3. The heat transfer coefficient, h, for the still air was given by Cogswell [31]
Table 2. Comparisons of the degrees of bonding obtained using themodel, and the shear strength ratios obtained experimentally.
_qqðkW=m2Þ th (sec) (MPa) / Db
52 225 42.1 0.64 0.7271 116 39.4 0.60 0.6371 124 44.8 0.68 0.69
Table 1. Input parameters for the simplified problem.
I/w (A/m) X1 (mm) X2 (mm) �x (mm) T (�C) Tini (�C)
120 0.127 0.254 0.0127 23 25
736 ZIYA SEYHAN COLAK, FAZIL ONDER SONMEZ AND VAHAN KALENDEROGLU

as 10 W/m2 �C. The obtained results for different APC-2 laminate thicknesses areillustrated in Figures 8 and 9.
For each laminate thickness, the optimization algorithm was employed about 20 timesusing randomly chosen initial values for the process parameters. Nearly 80% of times, the
Figure 6. Joining 16-ply APC-2 laminates with constant heating time th¼120 s.
Figure 7. Joining 16-ply APC-2 laminates with constant heating time I/w¼666 A/m.
Process Modeling and Optimization of Resistance Welding 737

algorithm converged to the same value of local minimum. Also, the corresponding degreesof degradation were very close to the allowable amount of degradation. Theseobservations assure us that the results represent the global minimum of the objectivefunction.
As the thickness of the APC-2 laminate is increased, which has lower transverseconductivity than that of the ceramic insulator, heat loss becomes more difficult. For this
Figure 9. Corresponding optimum process parameters.
Figure 8. Minimum welding times, tw, for different laminate thicknesses.
Table 3. Material property data for the pressure plates [38].
Ceramic Steel Aluminum
k, conductivity (W/m �C) 1 45 210C, specific heat (J/kg �C) 830 473 896�, density (kg/m3) 2600 7800 2707
738 ZIYA SEYHAN COLAK, FAZIL ONDER SONMEZ AND VAHAN KALENDEROGLU

reason, for a thick laminate less power is needed to achieve consolidation. Even if thecurrent intensity is lower for the thicker laminates, the rate of temperature increase ishigher as seen in Figure 10, which shows the resulting change of temperature with time atthe center of the heating element when the optimum process parameters corresponding to4-, 16- and 32-ply APC-2 laminates are used. Paradoxically, cooling is also fast. Coolingoccurs mainly due to conduction heat transfer from the heated element to the cooler(unheated) parts. When the volume of the unheated parts is larger because of thickerlaminate, the increase in their temperature through heat conduction becomes smaller dueto their increased heat capacity (J/�C). Consequently, temperature difference betweenheated and unheated parts becomes larger, and thus heat transfer (and cooling) rateincreases.
Figure 11 shows the variation of minimum welding times, tw, for different thicknesses ofceramic insulator. When it is thin, welding times are very long. The reason lies in the
Figure 10. Temperature variation at the center of the heating element during welding with the optimumprocess parameters of 4-, 16- and 32-ply APC-2 laminates.
Figure 11. Mimimum welding times, tw for different thicknesses of ceramic insulator. Laminate contains32 plies.
Process Modeling and Optimization of Resistance Welding 739

reduced heat capacity (J/�C), which leads to large increases in the temperature of theinsulator during welding. This could even be higher than the glass transition temperature.Cooling then can only be achieved through heat loss to the air, which is a very slowprocess (Figure 12). On the other hand, when the insulator is thick, main coolingmechanism is heat conduction throughout the welding process. Therefore, cooling time,and thus process time, is shorter. However, further increase in thickness beyond a certainlimit does not reduce the welding time. If the thickness of the ceramic insulator is greaterthan 25mm, it does not experience any significant temperature rise, and consequentlyincrease in its thickness does not affect the cooling rate.
The resistance welding process can be achieved using pressure plates made of metalinstead of using ceramic insulator. As Figure 13 shows, metal plates lead to shorterwelding times. This is because they provide more effective cooling, but at the expense of ahigher requirement regarding current intensity and heating time (I/w¼ 888 A/m andth¼ 94 s for steel as opposed to I/w¼ 814 A/m and th¼86 s for ceramic). In comparison to
Figure 13. Minimum welding times, tw, corresponding to the cases where different materials are used for thepressure plates. Laminate contains 32 plies.
Figure 12. Temperature variation at the center of the heating element during welding corresponding todifferent ceramic insulator thicknesses.
740 ZIYA SEYHAN COLAK, FAZIL ONDER SONMEZ AND VAHAN KALENDEROGLU

aluminum, steel would be a better choice because of its higher heat capacity per unitvolume (J/�Cm3).
Figure 14 depicts the variation of minimum welding time with pressure. If the appliedpressure is low, full consolidation becomes more difficult and a longer dwell time at hightemperatures is required. This can be achieved by increasing the heating time, but alsoreducing the current intensity in order not to cause degradation. Consequently, weldingtime would be longer. On the other hand, when the pressure is increased, consolidationcan sooner be achieved. (I/w¼ 651 A/m and th¼ 236 s for P¼ 0.6MPa, as opposed toI/w¼ 892 A/m and th¼ 67 s for P¼ 1.8MPa.) However, after a certain limit this effectsubsides.
Crystallinity of a semi-crystalline polymer is known to affect its mechanical properties.Recommended levels of crystallinity for APC-2 are between 25 and 35% [31]. Accordingto the experimental data of Velisaris and Seferis [39] and Talbott et al. [40], cooling ratesbetween 10 and 100�C/min result in recommended levels of crystallinity. The experimentaldata given by Motz and Schultz [33] showed that crystallization phenomenonapproximately occurs between temperatures of 320 and 160�C. As seen in Figure 10,cooling rates are about 50–60�C within this temperature range. Therefore, crystallinitylevels corresponding to optimum process parameters are expected to be withinrecommended levels.
CONCLUSIONS
In this study, process modeling of resistance welding for thermoplastic composites wascarried out. Heat transfer, degradation kinetics and consolidation models were developed,and then combined to establish the process window, which is defined as the feasible rangesof the controllable process parameters. The optimization method, called Nelder–Mead,was employed in order to determine the process parameters, which resulted in theminimum processing time with desired quality of the welded joint. The controllableprocess parameters were the current intensity and the heating time. For differentthicknesses of APC-2 laminates, the optimum process parameters and corresponding
Figure 14. Minimum welding times, tw, corresponding to different values of applied pressure. Laminatecontains 16 plies.
Process Modeling and Optimization of Resistance Welding 741

welding times were found. As the thickness of the APC-2 laminate was increased, thepower requirement reduced, and welding times decreased. Thickness of the insulator wasfound to affect the welding time. Very thin plates should be avoided since they lead toquite long welding times. Use of steel plates instead of ceramic insulator was advised.Welding can then be achieved in a very short time. Applied pressure should not be low, butalso should not be unnecessarily high.
ACKNOWLEDGMENT
This paper is based on the work supported by the Research Fund of Bogazici Universitywith the code number 97HA602.
REFERENCES
1. Don, R.C., Gillespie, J.W., Jr. and Lambing, C.L.T. (1992). Experimental characterization ofprocessing-performance relationships of resistance welded graphite/polyetherether-ketonecomposite joints. Polymer Engineering and Science, 32(9): 620–631.
2. Ageorges, C., Ye, L., Mai, Y.-W. and Hou, M. (1998). Characteristics of resistance welding oflap shear coupons. Part I: heat transfer. Composites Part A, 29(8): 899–909.
3. Hou, M., Yang, M., Beehag, A., Mai, Y.-W. and Ye, L. (1999). Resistance welding of carbonfibre reinforced thermoplastic composite using alternative heating element. CompositeStructures, 47: 667–672.
4. Smiley, A.J., Halbritter, A., Cogswell, F.N. and Meakin, P.J. (1991). Dual polymer bonding ofthermoplastic composite structures. Polymer Engineering and Science, 31(7): 526–532.
5. Xiao, X.R., Hoa, S.V., and Street, K.N. (1992). Processing and modelling of resistance weldingof APC-2 composite. Journal of Composite Materials, 26(7): 1031–1049.
6. Benatar, A. and Gutowski, T.G. (1986). Methods for fusion bonding thermoplastic composites.SAMPE Quarterly, 18(1): 35–41.
7. Eveno, E.C. and Gillespie, J.W., Jr. (1988). Resistance welding of graphite polyetheretherketonecomposites: an experimental investigation. Journal of Thermoplastic Composite Materials, 1: 322–338.
8. Maffezzoli, A.M., Kenny, J.M. and Nicolais, L. (1989). Welding of PEEK/carbon fibercomposite laminates. SAMPE Journal, 25(1): 35–39.
9. Jakobsen, T.B., Don, R.C. and Gillespie, J.W., Jr. (1989). Two-dimensional thermal analysisof resistance welded thermoplastic composites. Polymer Engineering and Science, 29(23):1722–1729.
10. Bastien, L.J. and Gillespie, J.W., Jr. (1991). A non-isothermal healing model for strength andtoughness of fusion bonded joints of amorphous thermoplastics. Polymer Engineering andScience, 31(24): 1720–1730.
11. Holmes, S.T. and Gillespie, J.W., Jr. (1992). Thermal analysis for resistance welding of large-scale thermoplastic composite joints. In: Proceedings of the American Society for Composites7th Technical Conference. Lancaster, PA: Technomic Publishing Co., pp. 135–146.
12. Don, R.C., Bastien, L., Jakobsen, T.B. and Gillespie, J.W., Jr. (1990). Fusion bonding ofthermoplastic composites by resistance heating. SAMPE Journal, 26(1): 59–66.
13. Hou, M., Ye, L. and Mai, Y.-W. (1999). An experimental study of resistance welding of carbonfibre fabric reinforced polyetherimide (CF fabric/PEI) composite material. Applied CompositeMaterials, 6: 35–49.
14. Ageorges, C., Ye, L., Mai, Y.-W. and Hou, M. (1998). Characteristics of resistance welding oflap shear coupons. Part II: consolidation. Composites Part A, 29(8): 911–919.
742 ZIYA SEYHAN COLAK, FAZIL ONDER SONMEZ AND VAHAN KALENDEROGLU

15. Ageorges, C., Ye, L., Mai, Y.-W. and Hou, M. (1998). Characteristics of resistance weldingof lap shear coupons. Part III: crystallinity. Composites Part A, 29(8): 921–932.
16. Ozisik, M.N. (1993). Heat Conduction. New York: John Wiley.
17. Day, M., Cooney, J.D. and Wiles, D.M. (1989). The kinetics of the oxidative degradation ofpoly(aryl-ether-ether-ketone) (PEEK). Thermochimica Acta, 147(1): 189–197.
18. Pitchumani, R., Gillespie, J.W., Jr. and Lamontia, M.A. (1997). Design and optimization of athermoplastic tow-placement process with in-situ consolidation. Journal of Composite Materials,31(3): 244–275.
19. Nam, J.-D. and Seferis, J.C. (1992). Generalized composite degradation kinetics for polymericsystems under isothermal and nonisothermal conditions. Journal of Polymer Science: Part B(Polymer Physics), 30(5): 455–463.
20. Bowles, K.J. and Frimpong, S. (1992). Void effects on the interlaminar shear strength ofunidirectional graphite-fiber-reinforced composites. Journal of Composite Materials, 26(10):1487–1509.
21. Loos, A.C. and Dara, P.H. (1987). Processing of thermoplastic matrix composites. Review ofProgress in Quantitative Nondestructive Evaluation, 6B: 1257–1265.
22. Lee, W.I. and Springer, G.S. (1987). A model of the manufacturing process of thermoplasticmatrix composites. Journal of Composite Materials, 21(11): 1017–1055.
23. Mantell, S.C. and Springer, G.S. (1992). Manufacturing process models for thermoplasticcomposites. Journal of Composite Materials, 26(16): 2348–2377.
24. De Gennes, P.G. (1971). Reptation of a polymer chain in the presence of fixed obstacles. Journalof Chemical Physics, 55(2): 572–579.
25. Wool, R.P. and O’Connor, K.M. (1981). A theory of crack healing in polymers. Journal ofApplied Physics, 52(10): 5953–5963.
26. Kim, Y.H. and Wool, R.P. (1983). A theory of healing at a polymer–polymer interface.Macromolecules, 16(7): 1115–1120.
27. Cho, B.-R. and Kardos, J.L. (1995). Consolidation and self-bonding in poly(ether ether ketone)(PEEK). Journal of Applied Polymer Science, 56: 1435–1454.
28. Sonmez, F.O. and Hahn, H.T. (1997). Analysis of the on-line consolidation process inthermoplastic composite tape placement. Journal of Thermoplastic Composite Materials, 10(6):543–572.
29. Colak, Z.S. (2000). Process modeling of resistance welding for thermoplastic composites. M.S.Thesis, Department of Mechanical Engineering, Bogazici University, Istanbul.
30. Pitchumani, R., Ranganathan, S., Don, R.C., Gillespie, J.W., Jr. and Lamontia, M.A. (1996).Analysis of transport phenomena governing interfacial bonding and void dynamics duringthermoplastic tow-placement. International Journal of Heat and Mass Transfer, 39(9):1883–1897.
31. Cogswell, F.N. (1992). Thermoplastic Aromatic Polymer Composites. Butterworth-HeinemannLtd.
32. Sonmez, F.O. and Hahn, H.T. (1997). Process modeling of heat transfer and crystallization forthermoplastic composite tape placement. Journal of Thermoplastic Composite Materials, 10(3):198–240.
33. Motz, H. and Schultz, J.M. (1989). The solidification of PEEK. Part II: kinetics. Journal ofThermoplastic Composite Materials, 2: 267–279.
34. Nelder, J.A. and Mead, R. (1965). A simplex method for function minimization. ComputerJournal, 7(4): 308–313.
35. Siddall, J.N. (1982). Optimal Engineering Design: Principles and Applications. New York: MarcelDekker.
36. Ozisik, M.N. (1968). Boundary Value Problems of Heat Conduction. Scranton: InternationalTextbook Co.
37. Mantell S.C., Wang, Q. and Springer, G.S. (1992). Processing thermoplastic composites ina press and by tape laying experimental results. Journal of Composite Materials, 26(16):2378–2401.
Process Modeling and Optimization of Resistance Welding 743

38. Geankoplis, C.J. (1983). Transport Processes and Unit Operations. Allyn and Bacon Inc.
39. Velisaris, C.N. and Seferis, J.C. (1986). Crystallization kinetics of polyetheretherketone (PEEK)matrices. Polymer Engineering and Science, 26(22): 1574–1581.
40. Talbott, M.F., Springer, G.S., and Berglund, L.A. (1987). The effects of crystallization on themechanical properties of PEEK polymer and graphite fiber reinforced PEEK. Journal ofComposite Materials, 21: 1056–1081.
744 ZIYA SEYHAN COLAK, FAZIL ONDER SONMEZ AND VAHAN KALENDEROGLU