Embed Size (px)
Citation preview
Bureau of Mines Report of Investigations/1988
Probability of Spark Ignition in Int rinsically Safe Circuits
By James C. Cawley
UNITED STATES DEPARTMENT OF THE INTERIOR
Report of Investigations 9183
Probability of Spark Ignition in Intrinsically Safe Circuits
By James C. Cawley
UNITED STATES DEPARTMENT OF THE INTERIOR Donald Paul Hodel, Secretary
BUREAU OF MINES T S Ary, Director
Library of Congress Cataloging in Publication Data:
Cawley, James C.
Probability of spark ignition in intrinsica lly safe circuits.
(Report of investigations; 9183)
Bibliography: p.IS.
Supt. of Docs. no.: I 28.23:9183.
1. Mine gases--Safety measures. 2. Mining machinery--Electric equipment--
Safety measures. I. Title. II. Series: Report of investigations (United
States. Bureau of Mines); 9183.
TN23.U43 [TN305] 622s [622' .8] 88-600054
CONTENTS
Abstract ••.• "........................................... . ........... . ......... . 1 Introduction....... . ........ . . ................ . .. . ... .. .... . . . .. . .. . ..... . ..... 2 Acknowledgments •• ••• ••. 0 • • • • • • •• • • • • • • • • • • • ••• • • • •• • • • • • • • • • • • • • • • • • • • • • • • • • • • • 4 Statistical design of experiment ... . . . . . . .... .. ....... .. ..... . ... . . . . ... ..... . . 4 Experimental apparatus............. ... ... . ..... . ........... . .... ... . . .. .. ...... 6 Experimental results........... . .. .. ........... .. .. . ...... . .... ... .......... . .. 7
Resistor circuits............................................................ 7 Inductor circuits.... . ...... . ....... . .. . . . ........ . . .... . .. . . ... ...... . ..... . 9 Capacitor circuits . .. . .... . ...... . . ... ........... . ............ . ... . . ... .. .. . . 11
Conclusions. . . . . . . . . . . . . . . . . . . . .. . . . . . .. . . . . . . . . . . . . . . . . . . . . . . . •• . •. . . . . . . ... . • 15 References..... . . .. . . . . ... .. ... .. ...... . . .......... .. ... . . . ......... . .......... 15
ILLUSTRATIONS
1. General relationship between probability of ignition and current when plotted on log-log coordinates...... . . . .... . ... . .......... ... ... .... ..... 3
2. Shape of distribution of spark ignitions as e increases from 1 to 5....... 5 3. Gas mixing system used in experiment........ . ..... . . . . . . . . . .......... . .... 6 4. Test setup showing gas mixing system, breakflash machines, and gas
analyzer. • • . . • • •• •• • . • • . • • • • • • • • • • • • • •• • • • • • • •• • • • • • • • • • •• •• • • • • • • •• • • • • • 7 5. Bureau estimates of spark ignition probability from previous safety
experiments •••••••.••••••.•••••.•••••••••••••••••••••••••••••••• " . • • • • • • • 8 6. Test circuit used to establish spark ignition probability for resistors... 8 7 Probability of spark ignition for resistor test circuits versus current in
8.3% methane-air atmospheres............................................. 8 8. Current versus voltage for resistor test circuits showing probability of
ignition (PI) as a parameter........ . .................. .. . .. . .... ... . . . .. 10 90 Test circuit used to establish spark ignition probability for inductors. . . 10
10. Probability of spark ignition for inductor test circuits versus current in 8.3% methane-air atmospheres.......................... . .................. 11
11. Inductance versus current for inductor test circuits showing probability of ignition (PI) as a parameter...................... . ................... 12
12. Test circuit used to establish spark ignition probability for capacitors.. 12 13. Probability of spark ignition for capacitor test circuits versus voltage
in 8.3% methane-air atmospheres.......................................... 13 14. Capacitance versus voltage for capacitor test circuits showing probability
of ignition (PI) as a parameter.......................................... 14
TABLES
1. Safety factor (k) for four gases in three circuit elements................ 3 2. Poisson ignition probabilities............................................ 5 3. Current (I) versus probability of ignition (PI) for resistor circuits..... 9 4. Current (I) versus probability of ignition (PI) for inductor circuits at
24Vdc • •••• • • • • • ••• • •• • • • ••• •• • ••••••••••• •• •••••••••••••••••••••••••• u. 10 5. Capacitor test circuit characteristics.................................... 12 6. Ignition energy contribution from power supply (V2td/R) versus 1/2 CV 2
(for methane)...... •••••••••..••••• •••••••• ••••••••••••• •••••••••• ••••••. 13 7. Voltage (V) versus probability of ignition (PI) for capacitor test
circuits........................... . ........... . ......................... 14
UNIT OF MEASURE ABBREVIATIONS USED IN THIS REPORT
k~ kilohm 1-1 S microsecond
rnA milliampere ~ ohm
1-1F microfarad rpm revolution per minute
mH mi llihenry s second
mJ mi llij oule V volt
1-1 J microjoule V dc volt, direct cu rrent
ms millisecond W watt
PROBABILITY OF SPARK IGNITION IN INTRINSICALLY SAFE CIRCUITS
By James C. Cawley 1
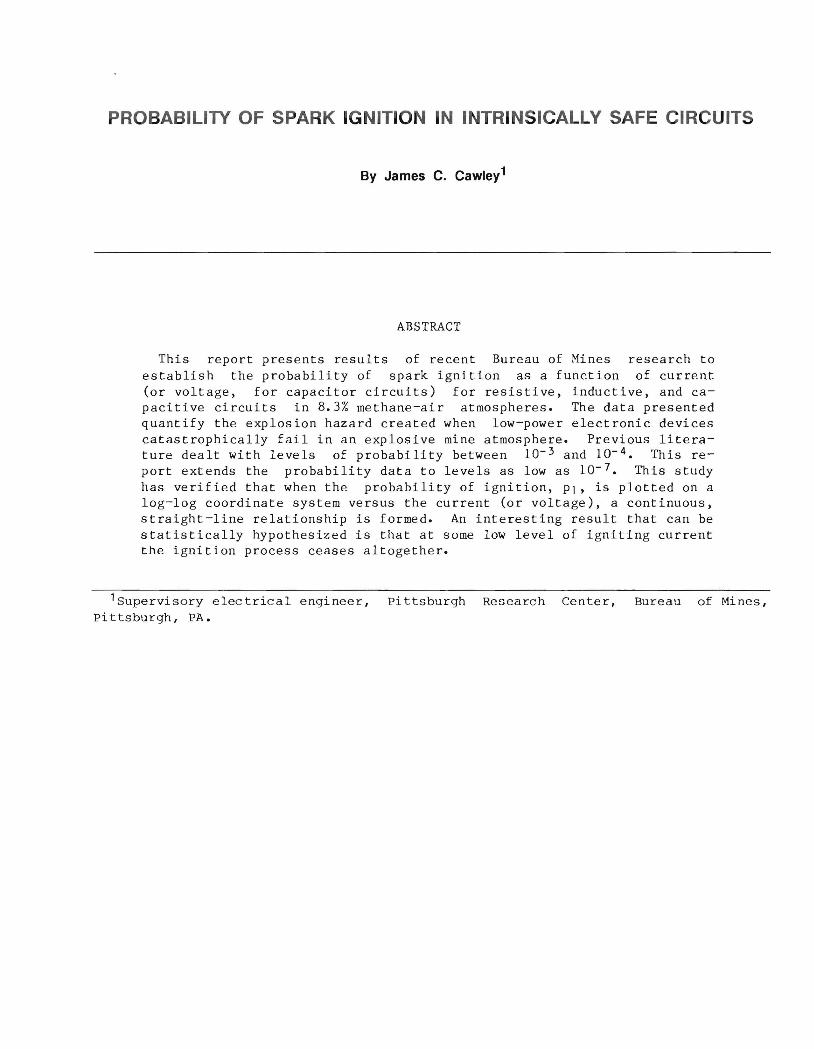
ABSTRACT
This report presents results of recent Bureau of Mines research to establish the probability of spark ignition as a function of current (or voltage, for capacitor circuits) for resistive, inductive, and capacitive circuits in 8.3% methane-air atmospheres. The data presented quantify the explosion hazard created when low-power electronic devices catastrophically fail in an explosive mine atmosphere. Previous literature dealt with levels of probability between 10- 3 and 10- 4 • This report extends the probability data to levels as low as 10- 7 • This study has verified that when the probability of ignition, PI, is plotted on a log-log coordinate system versus the current (or voltage), a continuous, straight-line relationship is formed. An interesting result that can be statistically hypothesized is that at some low level of igniting current the ignition process ceases altogether.
'Supervisory electrical engineer, Pittsburgh Research Center, Bureau of Mines, Pittsburgh, PA.
2
INTRODUCTION
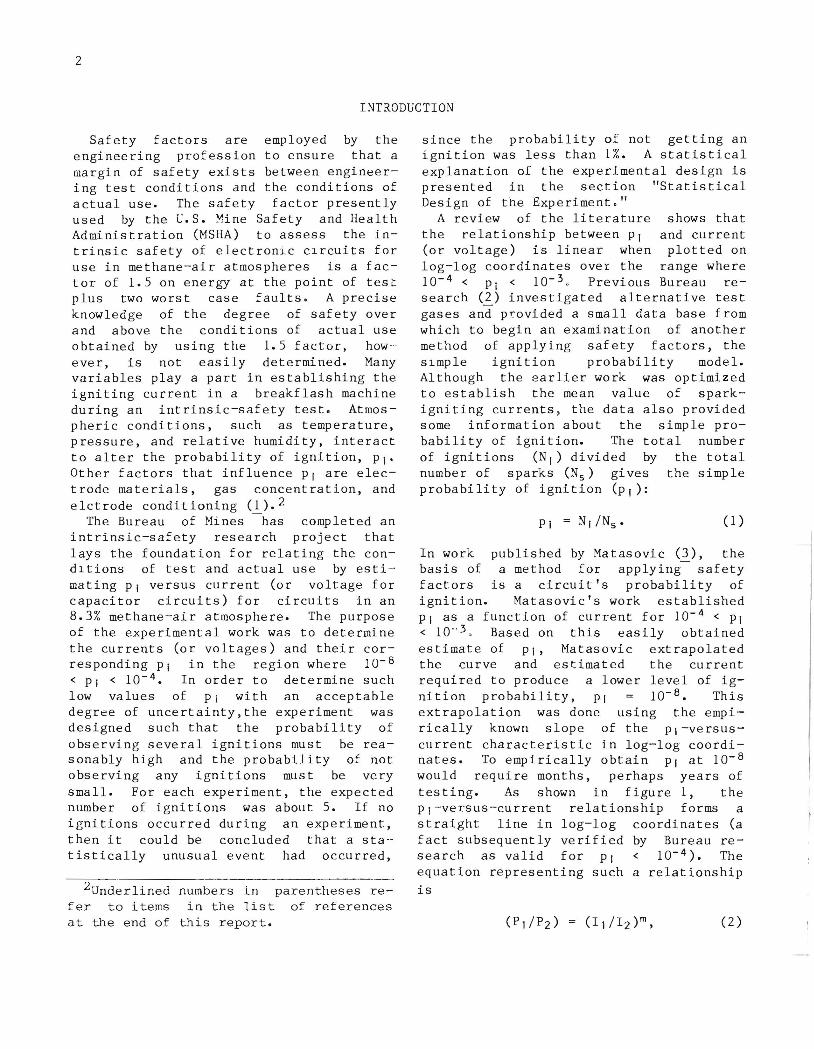
Safety factors are employed by the engineering profession to ensure that a margin of safety exists between engineering test conditions and the conditions of actual use. The safety factor presently used by the U.S. Mine Safety and Health Administration (MSHA) to assess the intrinsic safety of electronic clrcuits for use in methane-air atmospheres is a factor of 1.5 on energy at the point of test plus two worst case faults . A precise knowledge of the degree of safety over and above the conditions of actual use obtained by using the 1. 5 factor, however, is not easily determined. Many variables play a part in establishing the igniting current in a breakflash machine during an intrinsic-safety test . Atmospheric conditions, such as temperature, pressure, and relative humidity, interact to alter the probability of ignition, PI" Other factors that influence PI are electrode materials, gas concentration, and elctrode conditioning (l).2
The Bureau of Mines has completed an intrinsic-safety research project that lays the foundation for relating the conditions of test and actual use by estimating PI versus current (or voltage for capacitor circuits) for circuits in an 8.3% methane-air atmosphere. The purpose of the experimental work was to determine the currents (or voltages) and their corresponding PI in the region where 10- 8
< PI < 10- 4 • In order to determine such low values of PI with an acceptable degree of uncertainty,the experiment was designed such that the probability of observing several ignitions must be reasonably high and the probability of not observing any ignitions must be very small. For each experiment, the expected number of ignitions was about 5. If no ignitions occurred during an experiment, then it could be concluded that a statistically unusual event had occurred,
2Und~rlined numbers in parentheses refer to items in the list of references at the end of this report.
since the probability of not getting an ignition was less than 1%. A statistical explanation of the experimental design is presented in the section "Statistical Design of the Experiment."
A review of the literature shows that the relationship between PI and current (or voltage) is linea r when plotted on log-log coordinates over the range where 10- 4 < PI < 10- 3 • Previous Bureau research (l) investigated alternative test gases and provided a small data base from which to begin an examination of another method of applying safety factors, the slmple ignition probability model. Although the earlier work was optimized to establish the mean value of sparkigniting currents , the data also provided some information about the simple probability of ignition. The total number of ignitions (N I ) divided by the total number of sparks (N s ) gives the simple probability of ignition (PI):
(1)
In work published by Matasovic (1), the basis of a method for applying safety factors is a circuit's probability of ignition. Matasovic's work established PI as a function of current for 10- 4 < Pi < 10·'3 . Based on this easily obtained estimate of PI, Matasovic extrapolated the curve and estimated the current required to produce a lower level of ignition probability, PI 10- 8 • This extrapolation was done using the empirically known slope of the Pl-versuscurrent characteristic in log-log coordinates. To empirically obtain PI at 10- 8
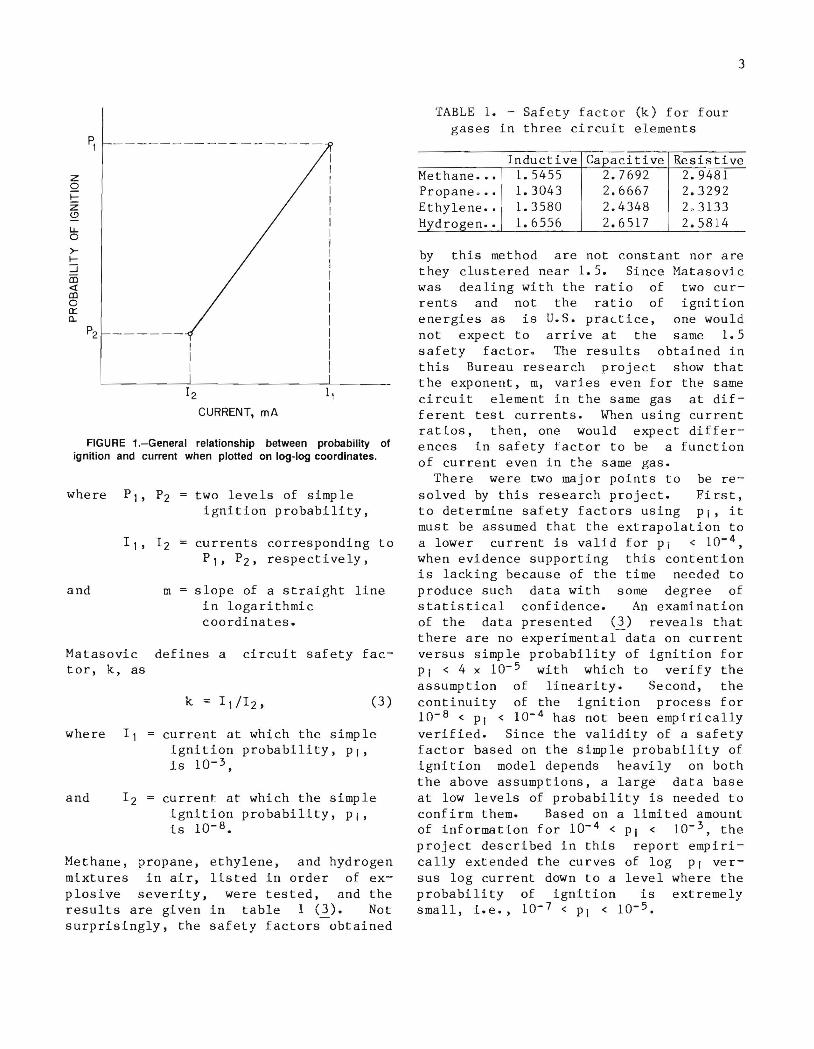
would require months, perhaps years of testing. As shown in figure 1, the Pl-versus-current relationship forms a straight line in log-log coordinates (a fact subsequently verified by Bureau research as valid for PI < 10- 4 ). The equation representing such a relationship
is
(2)
~ ------------------
z Q ~
Z ~ u.. 0
>-~
::J iIi « ro 0 0:: tl.
P2
12 1,
CURRENT, rnA
FIGURE 1.-General relationship between probability of ignition and current when plotted on log-log coordinates.
where P l , P2 two levels of simple ignition probability,
and m
currents corresponding to P l , P2 , respectively,
slope of a straight line in logarithmic coordinates.
Matasovic defines a circuit safety factor, k, as
where 11
k = 1 1/1 2 , (3)
current at which the simple ignition probability, PI, is 10- 3 ,
curren~ at which the simple ignition probability, PI, is 10- 8 •
Methane, propane, ethylene, and hydrogen mixtures in air, listed in order of explosive severity, were tested, and the results are given in table 1 (1). Not surprisingly, the safety factors obtained
TABLE 1. - Safety facto r (k) for four gases in three circuit elements
3
Inductive CaQaci ti ve Resis ti ve Methane ••• 1. 5455 2.7692 2.9481 Propane .•. 1.3043 2.6667 2.3292 Ethylene •• 1. 3580 2.4348 2,3133 Hydrogen .• 1.6556 2.6517 2.5814
by this method are not constant nor are they clustered near 1. 5. Since Matasovic was dealing with the ratio of two currents and not the ratio of ignition energies as is U.S. practice, one would not expect to arrive at the same 1.5 safety factor. The results obtained in this Bureau research project show that the exponent, m, varies even for the same circuit element in the same gas at different test currents. When using current ratios, then, one would expect differences in safety factor to be a function of current even in the same gas.
There were two major points to be resolved by this research project. First, to determine safety factors using PI, it must be assumed that the extrapolation to a lower current is valid for Pi < 10- 4 , when evidence supporting this contention is lacking because of the time needed to produce such data with some degree of statistical confidence. An examination of the data presented (1) reveals that there are no experimental data on current versus simple probability of ignition for Pi < 4 x 10- 5 with which to verify the assumption of linearity. Second, the continuity of the ignition process for 10- 8 < Pi < 10- 4 has not been empirically verified. Since the validity of a safety factor based on the simple probability of ignition model depends heavily on both the above assumptions, a large data base at low levels of probability is needed to confirm them. Based on a limited amount of information for 10- 4 < Pi < 10- 3 , the project described in this report empirically extended the curves of log PI versus log current down to a level where the probability of ignition is extremely small, i.e., 10- 7 < Pi < 10- 5 •
4
ACKNOWLEDGME[\'TS
The author wishes to thank Michael DiMartino, electronics technician, and Robert Kemp, physical science technician, Pittsburgh Research Center, Bureau of Mines, for their tireless effort s in compiling the ignition test data for this
report, and Shail Butani, mathematical statistician, Twin Cities Research Center, Bureau of Mines, for her suggestions regarding computation of statistical confidence levels and sample s izes.
STATISTICAL DESIGN OF EXPERIMENT
The purpose of this project was to run a large number of electrical sparks and count the number of ignitions that resulted, thus yielding PI . The experiment was designed to yield an expected number of ignitions, e, of five. Therefo~e,
when the required number of sparks was run, five ignitions should have occurred, subject to normal statistical variations. The experiments were designed to have less than a 1% chance of randomly producing no ignitions. Therefore, when no ignitions occurred during n sparks, it pointed to a statistical anomaly. The following discussion first presents an intuitive approach to determining the random chance of not seeing an ignition in n sparks for a circuit having PI ; 10- 6 , followed by a mo r e formal computation of the sample size required to produce a 98% confidence interval about the PI statistic.
The process of gathering statistical information on ignitions that have a low probability of occurrence requires a large number of sparks in order to ensure a high degre e of statistical confidence. Gas ignitions can be considered binomial events since only two outcomes are possible, i.e., ignition or nonignition. A binomial event can be described by the following equation:
where P(X)
X! (4)
probability of observing e xactly X ignitions in n sparks,
and
PI = probability of observing an ign i tion during any g1ven spark,
q probability of not observing an i g nition in any given spark ; therefore , PI + q ; 1, or q ; 1 - PI
As n becomes large and PI approaches zero, the Poisson approximation to the binomial distribution becomes appropriate. In the case considered here, PI < 10- 3 and n > 5,000 for all cases . The Poisson di s tribution is g iven by
P(X) (5)
where e n x PI from the binomial dis tribution and is the expected number of ignitions in n sparks,
X the e xact number of ignitions,
and e 2.718.
Consider a rare event whose PI is 10- 6 ; therefore, the probability of not observing an i g nition, q, on a given spark is
q 1 - PI
1 - 10- 6 ; 0.999999. (6)
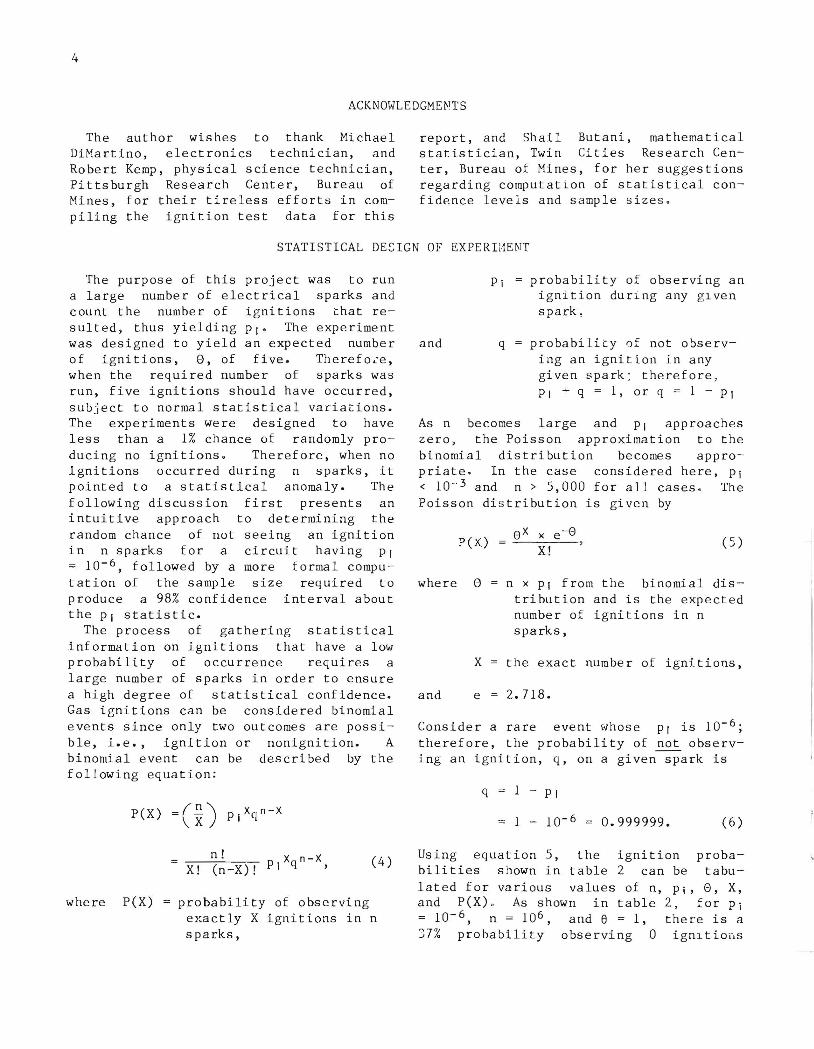
Using equation 5, the ignition probabilities shown in table 2 can be tabulated for various values of n, PI, e, X, and P(X) , As shown in table 2 , for PI ; 10- 6 , n = 106 , and 8 ; 1, theroe is a 37 % probability obse r vi ng 0 ign1tions
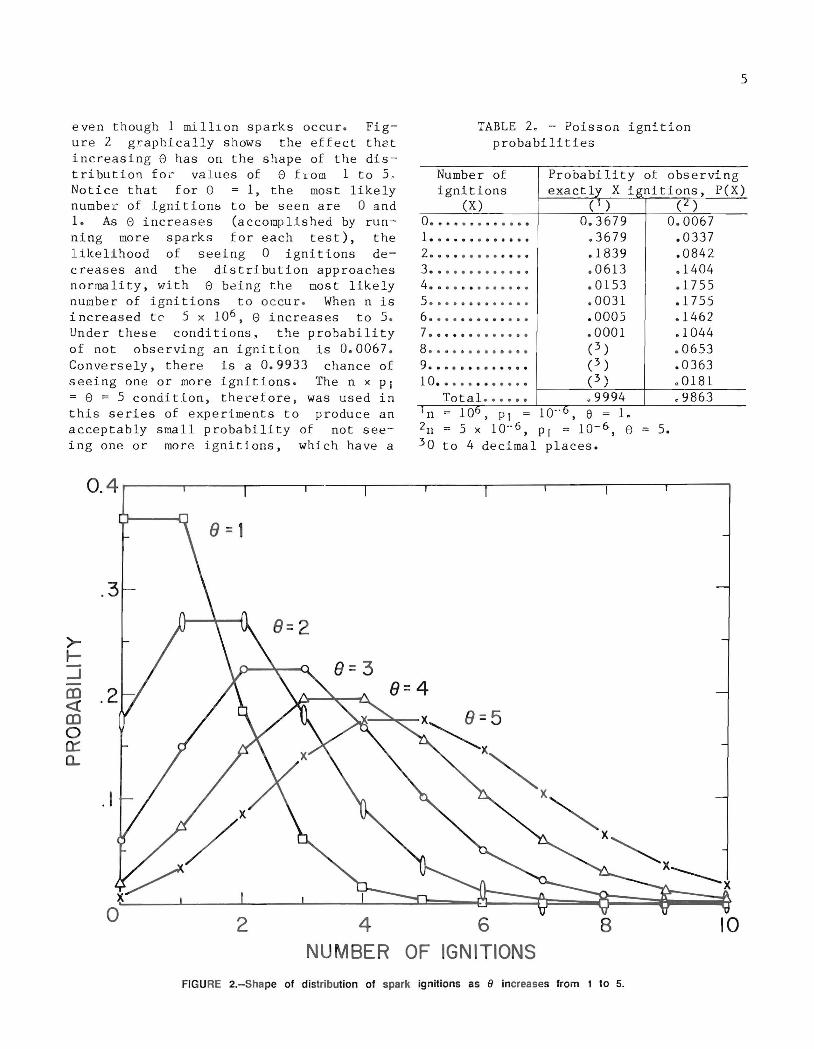
TABLE 2. - Poisson ignition probabilities
Number of Probability of observing
5
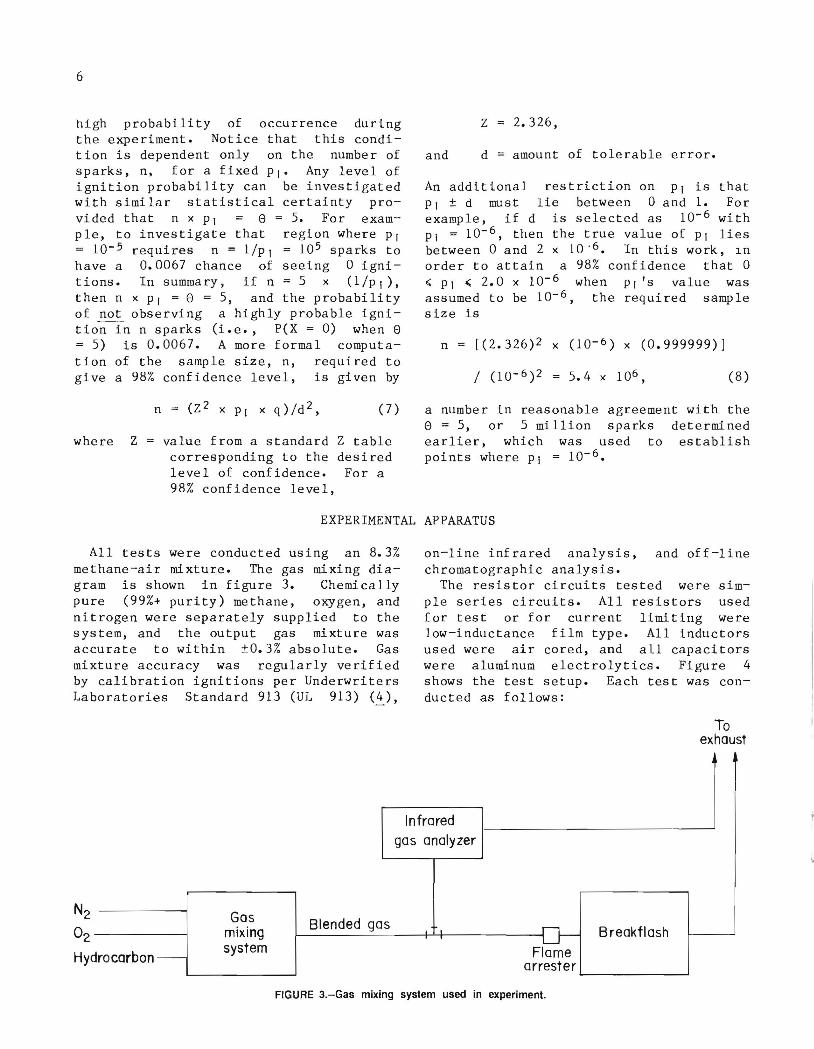
even though 1 milllon sparks occur. Figure 2 graphically shows the effect th8.t increasing 8 has on the shape of the distribution for values of 8 flom 1 to 5. Notice that for 8 = I , the most likely number of ignitions to be seen are 0 and 1 . As 8 increases (accomplished by running more sparks for each test), the likelihood of seeing 0 ignitions decreases and the distribution approaches normality, with 8 being the most likely number of ignit i ons to occur. When n is increased to 5 x 10⁶ , 8 increases to 5 . Under these conditions. the probability of not observing an ignition is 0. 0067 . Conversely, there is a 0.9933 chance of seeing one or more ignitions . The n x PI = 8 = 5 condition, therefore, was used in this series of experiments to produce an acceptably small probability of not seeing one or more ignitions, which have a
ignitions exactly X ignitions, P(X) (X) ( I ) (Z)
O ••••••••••••• 0.3679 0.0067 1 • • •••• • •••••• . 3679 .0337 2 •••• •••••• • •• .1839 .0842 3 •• •••••••••• • . 0613 . 1404 4 •• •• •• ••••• •• .0153 .1755 5 ••••••••••••• . 0031 .1755 6 • ••• •••••• ••• .0005 .1462 7 •• •••• ••••••• .0001 .1044 8 ••••••••••••• (3 ) . 0653 9 ••••••• • ••• • • (3) .0363 10 •• •.. .• •••• • (3 ) ,0181
Total •••••• .9994 c9863 I = 10 = · ·0 = n 10, PlIO ,8 1. 2n 5 x 10·,,6, PI = 10- 6 , 8 5. 30 to 4 decimal places.
0. 4 r-------r----r-------,,..-- ---.--------r----,---,-----,----.----,
8 = 1
o 2 4 6 8 10 NUMBER OF IGNITIONS
FIGURE 2.-Shape of distribution of spark ignitions as 8 increases from 1 to 5.
6
high probability of occurrence during the experiment. Notice that this condition is dependent only on the number of sparks, n, for a fixed PI. Any level of ignition probability can be investigated with similar statistical certainty provided that n x PI 8 = 5. For example, to investigate that region where PI = 10- 5 requires n = l/PI = 10 5 sparks to have a 0.0067 chance of seeing 0 ignitions. In summary, if n = 5 x (1/PI), then n x PI = 8 = 5, and the probability of not observing a highly probable ignition in n sparks (i.e., P(X = 0) when 8 = 5) is 0.0067. A more formal computation of the sample size, n, required to give a 98% confidence level, is given by
where Z
n = (Z2 x PI x q)/d 2 , (7)
value from a standard Z table corresponding to the desired level of confidence. For a 98% confidence level,
Z 2.326,
and d amount of tolerable error.
An additional restriction on PI is that PI ± d must lie between 0 and 1. For example, if d is selected as 10- 6 with PI = 10- 6 , then the true value of PI lies between 0 and 2 x 10. 6 • In this work, ~n order to attain a 98% confidence that 0 " PI .;; 2.0 x 10- 6 when PI'S value was assumed to be 10- 6 , the required sample size is
n = [(2.326)2 x (10- 6 ) x (0.999999)]
5.4 x 10⁶ , (8)
a number in reasonable agreement with the 8 = 5, or 5 million sparks determined earlier, which was used to establish points where PI = 10- 6 •
EXPERIMENTAL APPARATUS
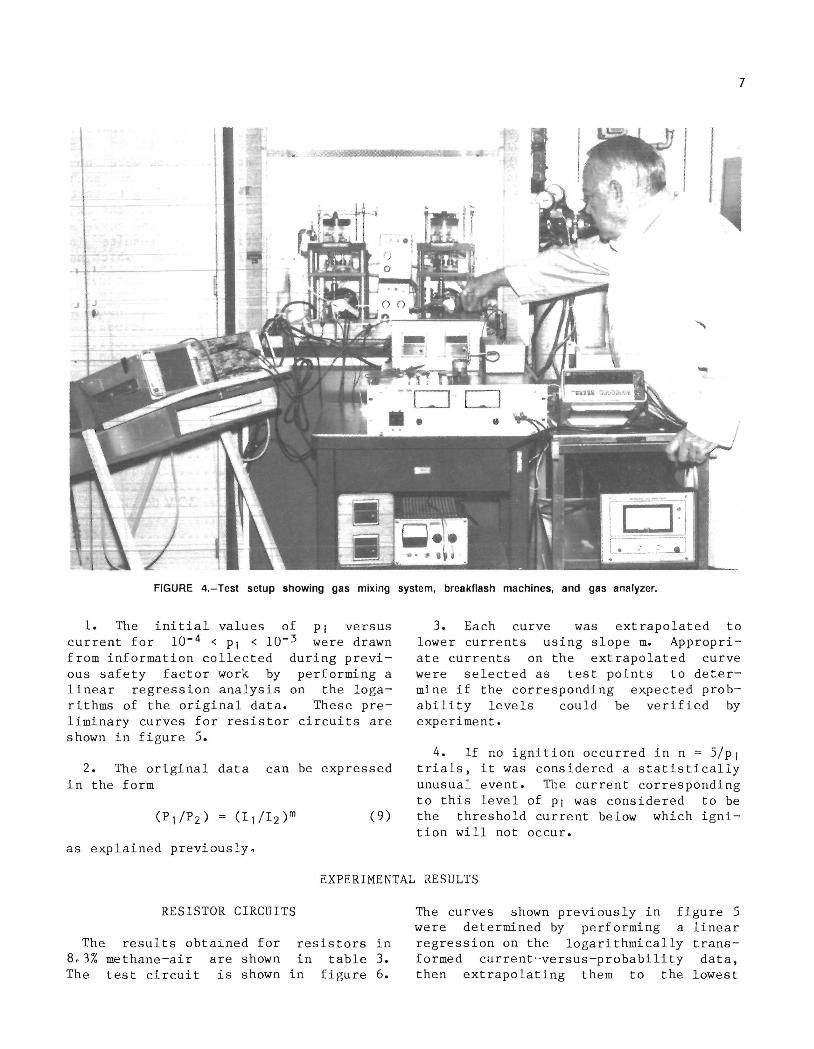
All tests were conducted using an 8.3% methane-air mixture. The gas mixing diagram is shown in figure 3. Chemically pure (99%+ purity) methane, oxygen, and nitrogen were separately supplied to the system, and the output gas mixture was accurate to within ±0.3% absolute. Gas mixture accuracy was regularly verified by calibration ignitions per Underwriters Laboratories Standard 913 (UL 913) (±),
on-line infrared analysis, and off-line chromatographic analysis.
The resistor circuits tested were simple series circuits. All resistors used for test or for current limiting were low-inductance film type. All inductors used were air cored, and all capacitors were aluminum electrolytics. Figure 4 shows the test setup. Each test was conducted as follows:
Infrared
To exhaust
1 gas analyzer
Gas Blended gas mixing 0- Breakflash
rocarbon-system Flame
arrester
FIGURE 3.-Gas mixing system used in experiment.
7
It:J:i ;::: .. ...=..=-==-.....:=-::-,
l. . _.~ '-*-J
FIGURE 4.-Test setup showing gas mixing system, breakflash machines, and gas analyzer.
1. The initial values of PI versus current for 10- 4 < PI < 10- 3 were drawn from information collected during previous safety factor work by performing a linear regression analysis on the logarithms of the original data. These preliminary curves for resistor circuits are shown in figure S.
2. The original data can be expressed in the form
(9)
as explained previously.
3. Each curve was extrapolated to lower currents using slope m. Appropriate currents on the extrapolated curve were selected as test points to determine if the corresponding expected probability levels could be verified by experiment.
4. If no ignition occurred in n = Sip I trials, it was considered a statistically unusual event. The current corresponding to this level of PI was considered to be the threshold current below which ignition will not occur.
EXPERIMENTAL RESULTS
RESISTOR CIRCUITS The curves shown previously in figure S were determined by performing a linear
The results obtained for resistors in regression on the logari thmically trans-8.3% methane-air are shown in table 3. formed current-versus-probability data, The test circuit is shown in figure 6. then extrapolating them to the lowest
.. f
8
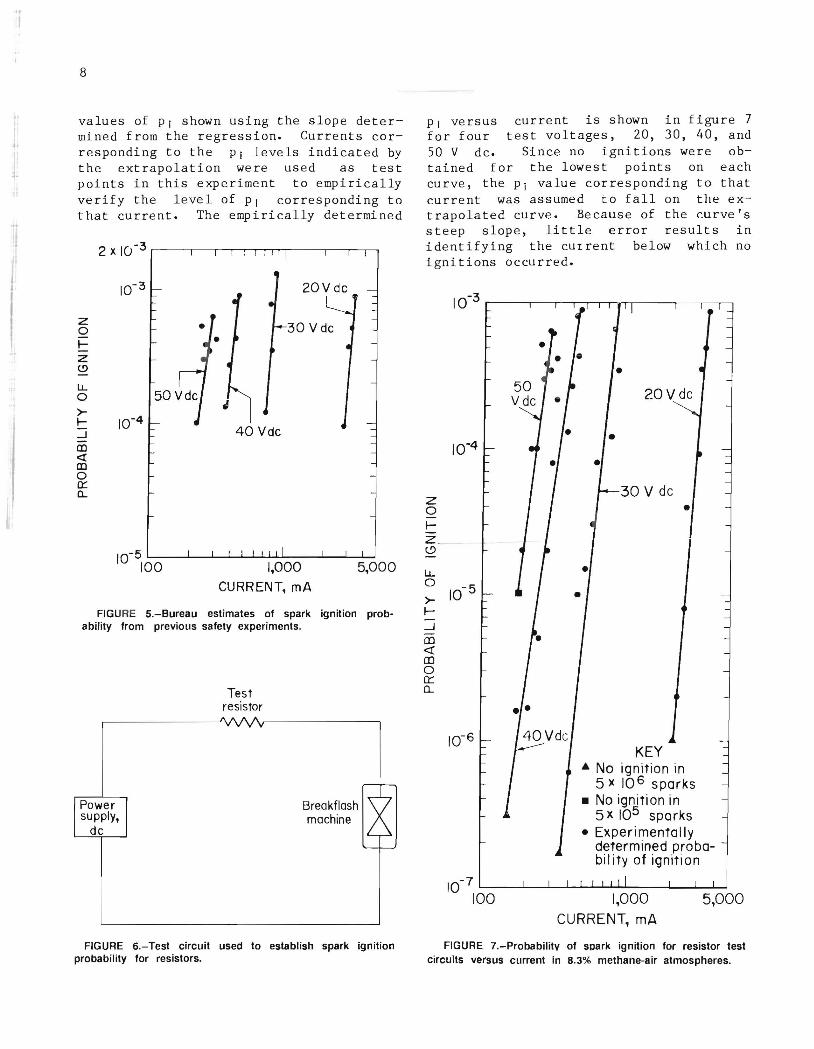
values of PI shown using the slope determined from the regression. Currents corresponding to the PI levels indicated by the extrapolation were used as test points in this experiment to empirically verify the level of PI corresponding to that current. The empirically determined
10- 3 20Vdc
z 30 Vdc 0 I-z 52 LL 0
~ >-I- 10-4 :i 40 Vdc CD <l: CD 0 0:: Cl..
10-51 0L....0----�....----1--L.---'-J...J....J~----I....----1--L.....J 1,000 5,000
CURRENT, rnA
FIGURE 5.-Bureau estimates of spark ignition probability from previous safety experiments.
Power supply,
dc
Test resistor
Breakflash machine
FIGURE 6.- Test circuit used to establish spark ignition probability for resistors.
PI versuS current is shown in figure 7 for four test voltages, 20, 30, 40, and 50 V dc. Since no ignitions were obtained for the lowest points on each curve, the PI value corresponding to that current was assumed co fallon the extrapolated curve. Because of the curve's steep slope, little error results in identifying the current below which no ignitions occurred.
z o Iz _ lSI
LL o >I-..J
iii <! CD o n::: CL
•
•
• •
30 V de
•
•
KEY & No ignition in
5)( 10 6 sparks • No ignition in
5 x 10⁵ sparks • Experimentally
determined probability of ignition
1,000 CURRENT, mA
5,000
FIGURE 7.-Probabilitv of spark ignition for resistor test circuits versus current in 8.3% methane-air atmospheres.
9
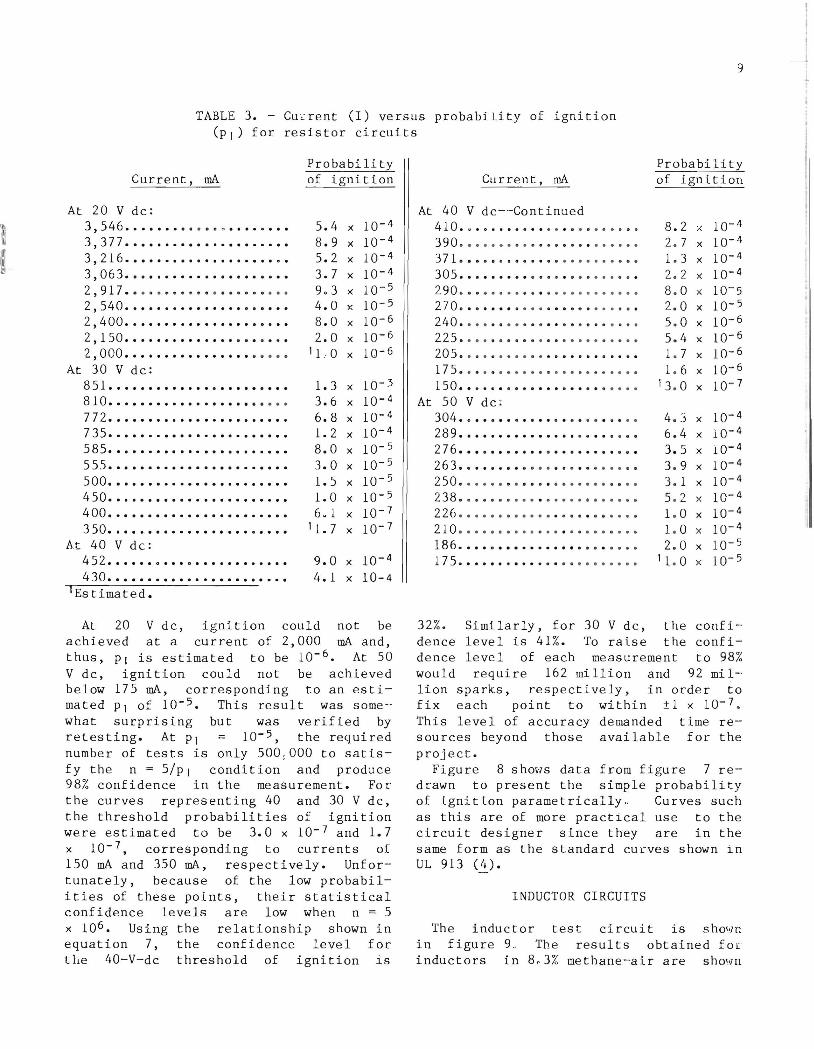
TABLE 3. - CUirent (I) versus probability of ignition (PI) for resistor circuits
Current, rnA
At 20 V dc: 3,546 ••••••••• • • • 0 ••••••••
3,377 ••••••••••••••••••••• 3,216 ••••••••••••••••••••• 3,063 ••••••••••••••••• • ••• 2,917 •• • • • • •••• • • ••• • •• ••• 2,540 ••••••••••••••••••••• 2,400 ••••••••••••••••••••• 2 , 1 50 •••••••••••••• • •• • ••• 2,000 •••••••••••••••• •• •• •
At 30 V dc: 851 ••••••••••••••••••••••• 8 10 ••••••••••••••••••• • ••• 772 ••••••••••••••••••••••• 735 •••••..•••••••••••••••• 585 •••••••••••••••••••.••• 555 ••••••••••••••••••••••• 500 ••••••••••••••••••••••• 450 ••••••••••••••••••••••• 400 ••••••••••••••••••••••• 350 ••••••••••••••••••.••••
At 40 V de: 452 ••••••••••••••••••••••• 430 •••••••••••••••••••••••
1 Es tima ted.
Pro ba bi Ii ty of ignition
5.4 x 10- 4
8.9 x 10- 4
5.2 x 10- 4
3.7 x 10- 4
9.3 x 10 - 5
4.0 x 10 - 5
8.0 x 10- 6
2.0 x 10- 6
'LO x 10- 6
1. 3 x 10- 3
3.6 x 10- 4
6.8 x 10- 4
1.2 x 10- 4
8.0 x 10- 5
3.0 x 10- 5
1.5 x 10- 5
1.0 x 10- 5
6.1 x 10- 7
'1. 7 x 10- 7
9.0 x 10- 4
4.1 x 10⁻⁴
At 20 V dc, ignition could not be achieved at a current of 2,000 rnA and, thus, PI is estimated to be 10- 6 • At 50 V dc, ignition could not be achieved below 175 rnA, corresponding to an estimated p, of 10- 5 • This result was some-what surprising but was verified by retesting. At p, 10- 5 , the required number of tests is only 500 , 000 to satisfy the n = 5/PI condition and produce 98% confidence in the measurement. For the curves representing 40 and 30 V dc, the threshold probabilities of ignition were estimated to be 3.0 x 10- 7 and 1.7 x 10- 7 , corresponding to currents of 150 rnA and 350 rnA, respectively. Unfortunately, because of the low probabilities of these points, their statistical confidence levels are low when n = 5 x 10 6 • Using the relationship shown in equation 7, the confidence level for the 40-V-dc threshold of ignition is
Current, rnA
At 40 V dc- - Continued 410. " ••.•••••• •• • • • • •••• • • 390 • •••••••• • • • •• • •• •••••• 371 • •• ••• • •• ••• • ••••••• •• • 305 ••••.••••• • •••• •• ••• •• • 290 •••• • • •• • • • • ••••••••••• 270 • •••••• • ••• •••• • • ••• • •• 240 • ••• •• •• • • • •••• •• • • • •• • 225 • ••• • ••• •• • •• • •••• • • • •• 205 • • • • • •••• • • •••••••••••• 175 • • • • • •••••••••••• •• ••• • 150 •••••• • ••••••••••• • ••••
At 50 V dc: 304 • • •• • •• • •••••• • • •• ••• •• 289 ••••••••••••••••••• ••• • 276 ••• • ••••••• • ••••••••• • • 263 ••••••••• • •• ••••• •••• • • 250 •• •••• • • •••• •• • • ••• •• •• 238 •• • •••• ••• • • ••••••••••• 226 •••••• • ••••• • ••• • • • • •• • 210 •••••••••• • •• • • • ••• • ••• 186 •••• • ••••••••••• •• • • • • • 175 ••••••••••• • • • •••••••••
Probability of ignition
8.2 A 10- 4
2 . 7 x 10- 4
1. 3 x 10 - 4
2 . 2 x 10- 4
8 . 0 x 10- 5 2.0 x 10- 5
5 . 0 x 10- 6
5. 4 x 10- 6
1.7 x 10 - 6
1.6 x 10- 6
'3 . 0 x 10- 7
4 . 3 x 10- 4
6.4 x 10- 4
3.5 x 10- 4
3 . 9 x 10- 4
3. 1 x 10- 4
5 . 2 x 10- 4
1 . 0 x 10- 4
1. 0 x 10- 4
2 . 0 x 10 - 5
' 1. 0 x 10- 5
32%. Similarly, for 30 V dc, the confidence level is 41%. To raise the confidence level of each measurement to 98% would require 162 million and 92 million sparks, respectively , in order to fix each point to within ±1 x 10- 7 • This level of accuracy demanded time resources beyond those available for the proj e c t .
Figure 8 shows data from figure 7 redrawn to present the simple probability of ignition parametrically- Curves such as this are of more practical use to the circuit designer since they are in the same form as the standard CUL"ves shown in UL 913 (~).
INDUCTOR CIRCUITS
The inductor test circuit is shol·m in figu r e 9.. The results obtained foe inductors in 803% methane-air are shm;7ll
...
r ••
10
4,000
2,000
« 1,000 E 800
....... ffi 600 a:: a:: :J 400 u
200
KEY --p.: 10-3
I
_ _ p.: 10-4 I
-----p. : 10-5 I
_ ... _p. : 10-6 I
I 00 __ --..11--"""'-"""'-"'---"' .................
20 40 60 80100 VOLTAGE, V de
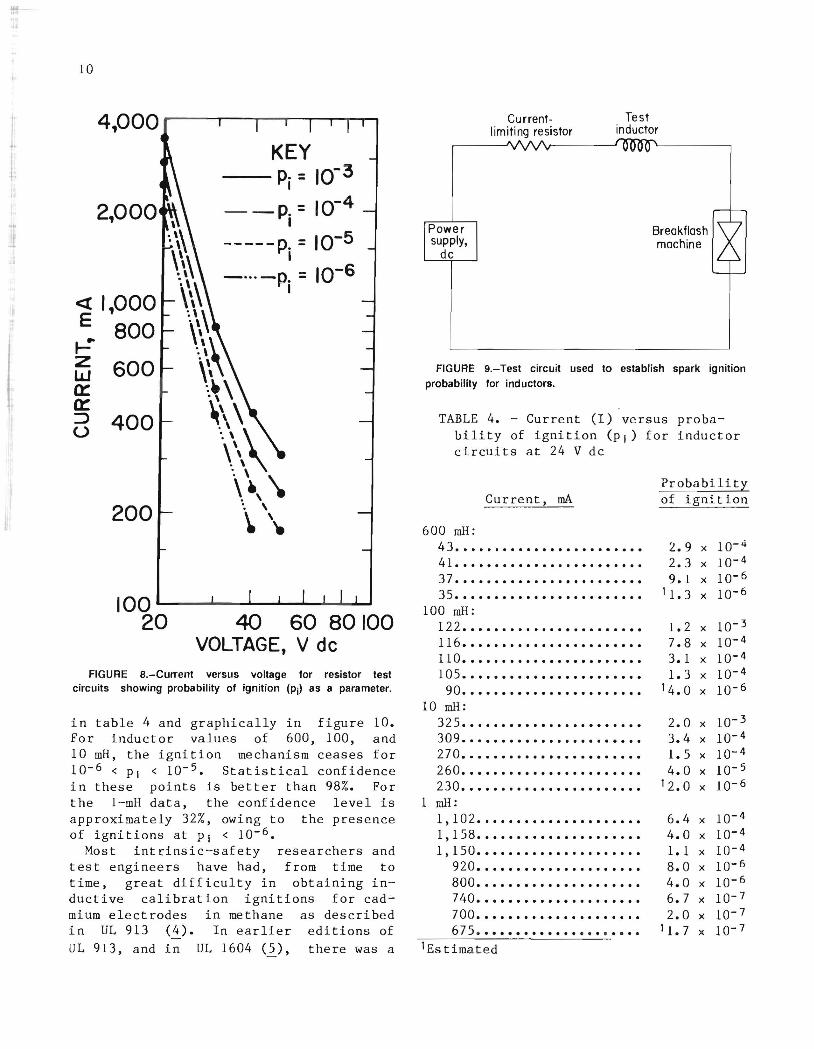
FIGURE 8.-Current versus voltage for resistor test circuits showing probability of ignition (Pi) as a parameter.
in table 4 and graphically in figure 10. For inductor values of 600, 100, and 10 mR, the ignition mechanism ceases for 10- 6 < PI < 10- 5 • Statistical confidence in these points is better than 98%. For the I-mH data, the confidence level is approximately 32%, owing to the presence of ignitions at PI < 10- 6 •
Most intrinsic-safety researchers and test engineers have had, from time to time, great difficulty in obtaining inductive calibration ignitions for cadmium electrodes in methane as described in UL 913 (~). In earlier editions of
UL 913, and in UL 1604 (2), there was a
Currentlimiting resistor
Test inductor
Power supply,
dc
Breakflash machine
FIGURE 9.-Test circuit used to establish spark ignition probability for inductors.
TABLE 4. - Current (I) versus probability of ignition (PI) for inductor circuits at 24 V dc
Current, rnA
600 mH:
43" " " " " " " " " " " " " " " " " " " " " " " " 41 " " " " " " " " " " " " " " " " " " " " " " " " 37" " " " " " " " " " " " " " " " " " " " " " " " 3 5" " " " " " " " " " " " " " " " " " " " " " " "
100 mH:
122" " " " " " " " " " " " " " " " " " " " " " " 116" " " " " " " " " " " " " " " " " " " " " " " 110 ••••••••••••••••••••••• 105 •••••••••••••••••••••••
90" " " " " " " " " " " " " " " " " " " " " " " 10 mH:
325 ••••••••••••••••••••••• 309 •••••••••••••••••••••••
27 0" " " " " " " " " " " " " " " " " " " " " " " 2 6 0" " " " " " " " " " " " " " " " " " " " " " " 2 3 O •••••••••••••••••••••••
1 mH: 1,102 ••••••••••••••••••••• 1,158 •••••••••••••••••••••
1,150.""""""""""""""""""" " 9 20" " " " " " " " " " " " " " " " " " " " " 800" " " " " " " " " " " " " " " " " " " " " 7 40" " " " " " " " " " " " " " " " " " " " " 7 0 0" " " " " " " " " " " " " " " " " " " " " 6 7 5" " " " " " ••••••••• • • ••••
lEstima t ed
Probabilitl of ignition
L.9 x 10- 4
2.3 x 10- 4
9.1 x 10- 6
1 1.3 x 10- 6
1.2 x 10- 3
7.8 x 10- 4
3.1 x 10- 4
1.3 x 10- 4
14.0 x 10- 6
2.0 x 10- 3
3.4 x 10- 4
1.5 x 10- 4
4.0 x 10- 5
12.0 x 10- 6
6.4 x 10- 4
4.0 x 10- 4
1. 1 x 10- 4
8.0 x 10- 6
4.0 x 10- 6
6.7 x 10- 7
2.0 x 10- 7
1 1. 7 x 10- 7
z 0 i= z Q
LL 0
>-I-::J as <I: 0Cl 0 0:: 0...
10-3
10-4
10-5
100 mH
600 mH
KEY -0- Measured Pi
No ignition in 5xl06 sparks
10 mH
ImH
-7 10 10~--~~~5~0~1~0-0--~~5~0~0~1.0~0-0--~~5~POO
CURRENT. mA
FIGURE 1 a.-Probability of spark ignition for inductor test circuits versus current in 8.3% methane-air atmospheres.
provision for a methane-only calibration current that was eliminated in UL 913, third edition. This methane-only calibration used an 8.3±0.3% by volume in air test mixture and allowed for a 110-rnA test current using a 95-mH air-cored inductor. Since no special provisions are now made for methane-only calibrations, the required calibration current for methane-only approvals in the third edition of UL 913 is 100 rnA, the same as for a group D (propane) approval. Although no data were obtained specifically for 95 mH, the 100-mH curve from figure 10 is sufficient to explain why calibration ignitions are difficult to obtain in
methane using 100 iliA and 95 mHo The PI corresponding to 100mH at 100 rnA is 5 x 10- 5 , and the corresponding value for q is 0.99995. If a standard calibration test of 400 revolutions is conducted , with 4 sparks per revolution, 1,600 sparks will result. Therefore,
q1600 = 0.923 , (l0)
giving a 0.923 chance of no ignition occureing during a standard calibrat ion test. Fortunately, in practice , more than 1,600 sparks are genera ted during a test, owing to the grooves in the disk and to random sparking while the two electrodes are in contact, thus lowering the chance of no ignition. When a calibration current of 110 rnA is used , the corresponding Pi is 3.1 x 10- 4 and the corresponding value of q is 0.99969, During a standard calibration test
q1600 = 0609, (11 )
which significantly lowers the chance of no calib r ation ignition. Using the above values for q, 3,466 breakflash revolutions are required to be 50% certain that an inductive calibration ignition will occur when using 100 rnA, and 559 revolutions are required when using 110 rnA . The author believes that the 110-rnA provision foe methane-only calibration currents should be restored to UL 913 or its eventual successor document ANSI/UL 4913 .
Figure 11 shows data from figure 10 redrawn with PI as a parameter , to emphasize the probabilistic natur2 of spa r k ignition and as an aid for the circuit designer.
CAPACITOR CIRCUITS
When examining capacitor circuits, one must consider the characteristics of the test circuit, shown in figure 12, to be sure that the energy contribution fL'om the power supply during the capacito~
discharge time through the breakflash machine does not have a significant effect on the ('esults- The measured characteristics of each test circuit are
12
KEY
- -Pi
- ----- Pi
100 I E
W u z ~ u ::> 0 z
10
FIGURE 11.-lnductance versus current for inductor test circuits showing probability of ignition (Pi) as a parameter.
Power supply,
dc
Charging resistor v'\j\./'-
RL
Test ~ capacitor ......
~ -Breakflash ,\ machine
~ >rd
- I---
FIGURE 12.-Test circuit used to establish spark ignition probability for capacitors.
shown in table 5 . The charging resistor, R L , was selected in each case to provide a 100-ms charging time constant , but the discharge path was through the breakflash contact s, whose dc resistance was 0 . 1 n . I n practice the discharge resistance , rd, proved to be dependent on breakflash contact resistance and on the level of instantaneous current being dischacged. Although the measured discharge times vary somewhat from the time give Ly
td = rd x C = 0 . 1 x C fJF (s), (2)
where td = circuit discharge time through the breakflash cOD.tactE' , s,
an1 nom!nal brea~fl£sh ccntact resistance, n
the measured and calculated discharge times are ~n ~easonable agreement . The capacitors were charged fo r approximately five time constants before being discharged th r ough the b~eakflash contacts . This was accomplished by using only one tungsten elect r ode instead of the normal four electrodes and running the break flash machine slower than 80 rpm. Consequently, it took much longer to gener-·· ate capacitor circuit data than resistor or inductor circuit data .
TABLE 5 . - Capacitor test circuit characteristics
Capacitance fJF ••
Charging resistor CRL) •••• kn ••
Charging time constant
s •• Discharge
time C t d) 5 us ••
1 At 250 V dc. 2At 50 V dc. 3At 100 V de .
Mallory Sprague TC56 TC50100 TE1407 TE1211
1 1.2 21 , 330 310. 3 4106
87 . 0 0.075 10 . 0 LO
0.104 0 . 100 0.103 0.106
0.7 500 3.5 200 4 At 10 V dc . 5Measured from test
eireui ts.
The energy cont r ibution fiom the power supply (E) during the dischaige time (t d ) can be estimated by assuming a rectangular discharge pulse at the mean ignition voltage (l) for the duration of the discharge as
(13)
whe r e P total powe r contribution from power 3upply, W,
v mean ignition voltage , V dc ,
a'1d curren t -limiting resistance value (from table 5) , kQ .
This relation yields the r esults shown in table 6 . In all cases, the energy contributed to the spark in the breakflash by the power supply , (V2 td )/R L, during the capacitor discharge period is less than 1% of the mean stored energy in the capacitor required for ignition (1/2 CV2), On the basis of the foregoing discussion, the energy contribution from the power supply is neglected in the capacitor data presented in this report .
The experimental results for capacitors, shown in figure 13 and table 7, show increasing variability in the data as capacitor size decreases . This is consistent with the results obtained for both resistors and inductors. The threshold of ignition occurs for 10 .. 7
< PI < 10 .. 6 • For capacitors greater than 100 ~F, the voltage values obtained for
TABLE 6. - Ignition energy contribution from power supply (V2 td /R) versus 1/2 CV 2 (for methane)
Capacitance •• ~F • • 1. 2 10 . 3 106 1,330 Voltage •••• V de •• 124 36.8 19 . 9 1( · 9 Discharge time
(td) · · · ·····~s •• 0.7 305 200 500 Charging resis-tor (R L ) •••• kQ •• 87 . 0 10 1 0,075
Energy (V2 td /R L ) •••••••• ~J • • 12 . 4 47 79 1, 100
Energy (l/2 CV2) •••• ••• • mJ •• 9 . 2 7 . 2 21 1 11
z o Iz ~ LL o >I-...J m « m o a::: CL
107 fL F
•
• •
KEY
•
A No ignit ion in 5 x 10⁶
sparks • Experimentally
determined probability of ignition
13
100 300
VOLTAGE, V de FIGURE 13.-Probability of spark ignition for capacitor
test circuit~ ','ersus voltage in 8.3% methane-air atmospheres.
14
PI ~ 4 x 10 .. 4 (approximately the 50th percentile of ignition for a 400- rotation, 80-rpm test per UL 913) agree well with data published in UL 913 (!:' "e + 0 Q (Cd)" curve) . For capacitors less than 100 ~F, however, the UL 913 values are
TABLE 7. - Voltage (V) versus probability of ignition (PI) for capacitor circuits
Voltage, V dc
1,330 ~F: 13. 7 •••••••••••••••••••••• 13. 1 . •• .. . .. .•••.••• ... ••. 12. 4 .•.••.. •. •.•••....•..• 12. O •••••••••••••••••••••• 11. 5 ..•..•.•...• .•..••..• .
107 ~F: 21. 4 ..... . •....••.•.•••••• 20.4 •••••••••••••• •• •••••• 19. 5 ......•......•........ 18. 5 ...........•...•...... 18. O •••••••••••••••••••••• 17 . O •••••••••••••••••••••• 16 . O . ••• ..• •.••..•.•••••••
10 ~F: 42 ••••••••••••••••• • • • • • •• 39 • • ••••••••• • • • ••• ••••••• 38 •••••••.••••••••.••••••• 37 •••••••••••• • ••••••••••• 36 • ••••••••••••••••••••••• 35 ••• ••••••••••••••••••••• 34 •••••••••••••••••••••••• 33 • ••••••••••••••••••••••• 31 •...••....•••........••. 30 .....•. •.......•.....•.. 28 •••• • ••••••••••••••••••• 23 •• ••• • •••••••••••••••••• 20 1 •••• •••••••••••••••••••
).IF: 149 •• . ••••• • ••• •• • •..• n •• o
145 ••• .•••••.••.•.•••..... 142 •.•. • •.•••..•••••.••..• 129 • . ••. .•..•••••.••••.•.• 12.3 ••••••• • • ••••• ••••••• • • 117 • •.•.••••••••••..•..... 112 ••• ..•..•.•.....•...•.. 110 •••..•..••...•...•.•••. 106 ••• •••••••••••••••••••• 100 .... . ... .. ............. .
95 ••••• ••• • •• • ••• ••• ••••• 1 9 O • • • • ••••• ' ••••••••••••••
IEstimated
Probabi lity of ignition
2.5 x 10- 3
6.7 x 10- 3
2.2 x 10- 5
2.0 x 10- 6
13.0 x 10- 7
8.8 x 10- 4
904 x 10- 4
3.5 x 10- 4
3.1 x 10- 4
2.4 x 10- 4
2.3 x 10- 5
15.0 x 10- 7
6.5 x 10- 4
5.8 x 10- 4
6.9 x 10- 4
1. 1 x 10- 4
5.5 x 10- 4
2.9 x 10- 3
3.3 x 10- 4
4.3 x 10- 4
8.8 x 10- 5
2.0 x 10- 5
1.8 x 10- 5
3.6 x 10- 6
5.0 x 10- 7
7.4 x 10- 4
1.5 x 10- 5
2.3 x 10- 4
1. 1 x 10- 3
5.4 x 10- 4
4.6 x 10- 4
2.8 x 10- 4
1.2 x 10- 4
2.6 x 10- 4
5.5 x 10- 6
2.9 x 10- 6
1.0 x 10- 6
considerably less than those measured here. For example, for 1 ~F, PI'" 4 x 10- 4 corresponds to 130 V dc, while the value published in UL 913 is approximately 80 V dc. In general, for capacitors greater than 100 ~F, the experimental results obtained are more conservative than those in UL 913, while for capacitors less than 100 ~F, the UL curves are more conservative. Figure 14 shows the data from figure 13 presented with PI as a pa ra.mete r.
1,000 800
600
400
200
u.. 100 ::l.. ..
W U Z
~ U
~ <t u
80 60
40
20
10 8
6
4
2
I 10
KEY Pi = 10-3
-- Pi =10-4
----- p . = 10-5 I
_ ... - Pi = 10-6
50 100
VOLTAGE, V de
300
FIGURE 14.-Capacitance versus voltage for capacitor test circuits showing probability of ignition (Pi) as a parameter.
15
CONCLU3IONS
The probability of ignition and its corresponding currents have been estimated for resistor, inductor, and capacitor circuits in 8.3±0.3% methane-air atmospheres. The circuit values used in this determination represent the range of values most likely to be encountered when designing portable, battery-powered devices and fixed-point monitoring equipment for gassy, underground mines· for resistors, 20 to 50 V dc; for inductors, 1 to 1,000 mH; and for capacitors, 1 to 1,330 ~F. The PI data are valuable for relating the conditions under which equipment is tested to the real-world conditions in which the equipment will operate, i.e., that PI indicates the true "safety factor."
This project has shown that the spark ignition phenomenon is continuous for PI
< 10- 4 , a fact not previously known for certain. A straight-line relationship exists between PI and current or voltage validating equation 2 as a predictor of PI given the current.
For 10- 7 < Pi < 10- 5 , however, a "threshold" has been identified below which spark ignitions do not occur, even though the experimental design limits the probability of ignitions not occurring to less than 1%. For each type of circuit, the spark ignition phenomena stopped below some level of current or voltage. This point was estimated by extrapolating the experimental data. Operation of circuits below this ignition threshold may imply an infinite safety factor.
REFERENCES
1. Magison, E. Electrical Instruments in Hazardous Locations. ISA, Research Triangle Park, NC, 1978, 3d ed., 394 pp.
2. Cawley, J. C. A Statistical Determination of Spark Ignition Safety Factors in Methane, Propane, and Ethylene Mixtures in Air. BuMines RI 9048, 1986, 15 pp.
3. Matasovic, M. Research Into the Probability of Ignition in Intrinsically Safe Circuits. S-Comm. Bull. (Zagreb, Yugoslavia), v. 6, No. 12, 1977, pp. 58-73.
U.S. GOVERNMENT PRINTING OFFICE: 1988 - 547·000/80,064
4. Underwriters Laboratories, Inc. (Northbrook, IL). Intrinsically Safe Apparatus and Associated Apparatus for Use in Class I, II, and III, Division 1, Hazardous Locations. Standard 913, 3d ed., Feb. 18,1980, p. 33.
5. ____ Elect rical Equipment for Use in Hazardous Locations, Class I Class II, Division 2, and Class Divisions 1 and 2. Standard 1604, ed., Nov. 8, 1982, p. 18.
and III,
Is t
INT.-BU.OF MINES,PGH.,PA. 28747