Embed Size (px)
Citation preview

CHAPTER 4
PROBABILITY DISTRIBUTIONS
Microsoft Excel has built-in functions that can be used to calculate the probabilities associated with several probability distributions. In this Chapter we will continue to use Microsoft Excel to
Create discrete probability distributions Find the binomial probabilities, and to Find mean, variance and standard deviation of a probability distribution.
Random Variables and Probability Distributions Assume a study consists of randomly selecting 14 newborn babies and counting the number of girls. Assume that boys and girls are equally likely, and let x = number of girls among the 14 babies. Look at the following probability distribution.
79

A B 1 x(girls) P(x) 2 0 0.000 3 1 0.001 4 2 0.006 5 3 0.022 6 4 0.061 7 5 0.122 8 6 0.183 9 7 0.209
10 8 0.183 11 9 0.122 12 10 0.061 13 11 0.022 14 12 0.006
15 13 0.001
16 14 0.000
We will work with the given values to create a probability histogram, and use Excel to compute the mean and standard deviation of the probability distribution. Creating a Probability Histogram
- Open a new worksheet. Type x in cell A1 and P(x) in the cell B1. - Enter the values of x from the previous table in column A starting
from cell A2. - Enter the values of probabilities, P(x) from the previous table in
column B starting from cell B2. - Click on the Chart Icon, or click Insert in the menu bar, then click on
Chart. - Select column under Chart type and the first option under Chart sub-
type. Then click Next. - In the Data Range box select the cells containing probabilities. That is
cells B2 to B16. - Make sure the bubble in front of columns is selected.
80

- Click on the series tab and in the dialog box “Category (x) axis Labels” select the cells containing the x values.
- Name your graph “Probability Distribution” and click next. - Name the Axes then click Finish. - Modify your graph according to chapter 2. Click on the legend box,
and delete it. Double click on the bars, and in the Format Data series dialog box, click in options, and set your gap width to 0 [see Figure 4.1]. Also, we may remove the gridlines as we did in chapter 2.
Figure (4.1)
81

Computing the Mean, Variance, and Standard Deviation of a probability Distribution Microsoft Excel doesn’t have tools that automatically compute the mean, variance, and standard deviation for a probability distribution described by a table. Recall that the Mean (μ), Variance (δ²) and the Standard deviation (δ) can be computed by using the following formulas. μ =Σ xp(x) δ²=Σ(x-μ)²=Σx²p(x)-μ² δ=√(Σ(x-μ)²)=√(Σx²p(x)-μ²) Variance and Standard deviation are computed here using formulas other than the ones used in the textbook. In the following example we will explain how to compute the mean, variance and standard deviation of a probability distribution. Example 4.1: Compute the Mean (μ), Variance (δ²), and Standard deviation (δ) of the probability distribution described by the following table.
x P(x) 0 0.0000 1 0.0015 2 0.0060 3 0.0220 4 0.0610 5 0.1220 6 0.1830 7 0.2090 8 0.1830 9 0.1220 10 0.0610 11 0.0220 12 0.0060
13 0.0015
14 0.0000
82

Solution:
- In cell A1 type x and in cell B1 type P(x). - In cells A2 to A16 enter the values of x. - In cell B2 to B16 enter the corresponding probabilities. - In cell C1 enter x * P(x). Then in cell C2, enter the formula = A2 *
B2. This tells Excel to multiply the random variable in cell A2 by its associated probability in cell B2.
- Make cell C2 the active cell and use the lower right handle to drag it to fill the cells through cell C16.
- In Cell D1, enter x*x. Then in cell D2, enter the formula = A2*A2, This tell Excel to multiply the random variable in cell A2 by itself.
- Make cell D2 the active cell and use the lower right handle to fill the cells through D16.
- In cell E1, enter x²* P(x). Then in cell E2 enter the formula = D2*B2. This tells excel to multiply the square of the random variable in cell D2 by its associated probability in cell B2 (i.e. x²p(x)).
- Make cell E2 the active cell and use the lower right handle to fill the cells through E16.
- In cell A17 type total. In cell C17 enter the formula =Sum (C2: C16) or use Σ symbol and press Enter to calculate the sum of the products of the random variable and its associated probability.
- Similarly, in cell E17 we can calculate the sum of the products of x² and its associated probability.
- In cells B19, B20, B21 type Mean, Variance, and Standard deviation, respectively.
- In cell C19 enter the formula =$C$17. This Command will copy the Σxp(x), which is the mean, into this cell.
- In cell C20 enter the formula =$E$17-$C$17², this will take the sum of the product and subtract the square of the mean from the sum.
- In cell C21 enter the formula =sqrt ($C$20). This will take the square root of the variance, which will produce the standard deviation. Your worksheet should look similar to the one given in Figure (4.2).
Expected Value Notice that the value computed in Example (4.1) for the summation of the products of the random variables and their corresponding probabilities can also be called the expected value of a discrete random variable.
83

Figure (4.2)
Binomial Probability Distribution Microsoft Excel can be used to compute probabilities for a binomial distribution. A binomial distribution is a probability distribution controlled by the Number of Trials, n, and the probability of successes in a single trial, p. The Excel function that generates binomial probability is BINOMDIST (Number-s, Trials, Probabilitiy-s, Cumulative), where Number-s is the number of successes x in the n trials, Trials is the number of independent trials n, Probability-s is the probability of success in a single trial, p, and Cumulative (true/false or1/0) is used to indicate whether x, the number of observed successes, is cumulative or not cumulative. Using “true” or 1 returns the cumulative probability of obtaining no more than x successes in n trials, and using “false” or 0 returns the probability of obtaining exactly x successes in n trials. BINOMDIST (number-s, trials, probability-s, cumulative) returns the individual term binomial probability.
84

Calculating Binomial Probabilities with BINOMDIST Let us find the probability of exactly three successes out of 5 trials where the probability of success on a single trial is 0.5.
- Click on cell A1 to place the output there. - Click Insert Function or click fx. - Select the Statistical category. Then select BINOMDIST function and
click OK. - Complete the BINOMDIST dialog box shown in Figure (4.3), then
click OK. The BINOMDIST function returns a result of 0.3125 [i.e. p(x=3) = 0.3125].
- To calculate P (x ≤ 3), we follow the same procedure except that we use true or 1 for the Cumulative instead of false or 0 used above.
Figure (4.3)
To obtain the probability of each possible outcome of a binomial distribution with n=10 and p=0.25, use the following Commands.
85

- Create a Column with the values of x for which you wish to find the corresponding probabilities. Input the values 0 to10 into column A.
- In cell B1, type p(x). - Activate Cell B2, and select Insert Function. - Select Statistical category and select BINOMDIST then click OK. - Complete the BINOMDIST dialog box as follows
Number-s: A2 Trials: 10 Probability: 0.25 Cumulative: false Then click OK.
- Activate cell B2 and drag the lower right handle to fill the cells through B12. The results will be as shown in Figure (4.4).
Figure (4.4)
86
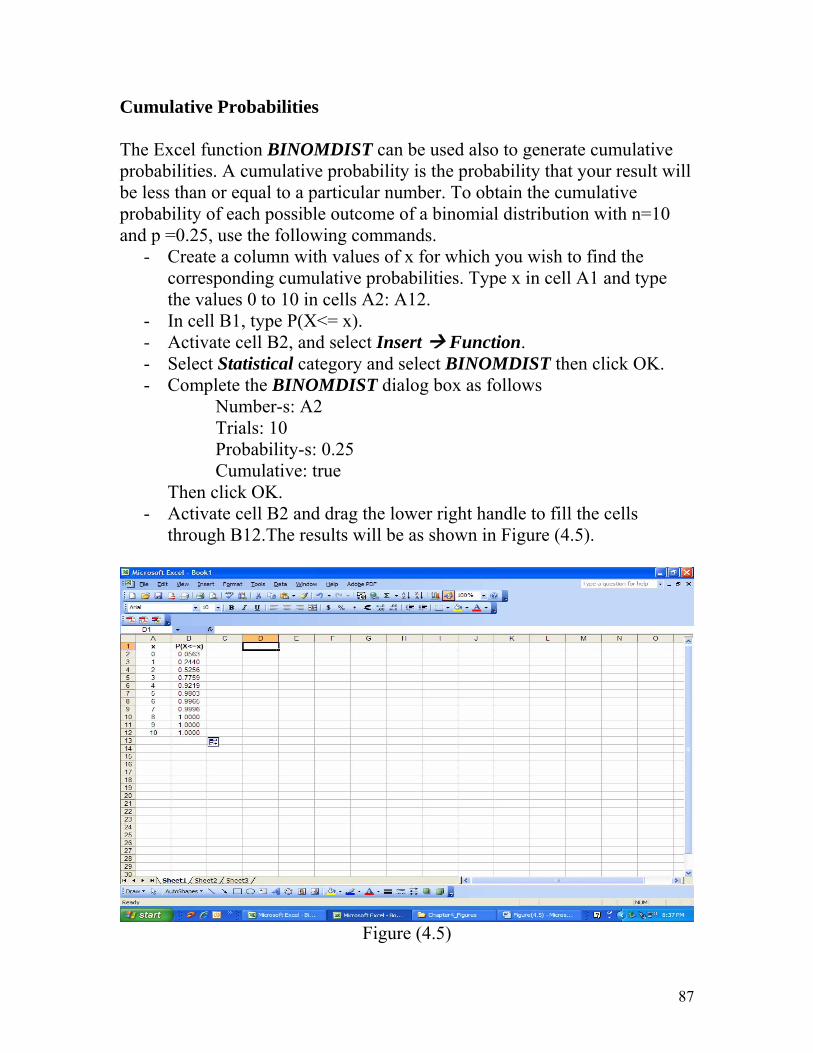
Cumulative Probabilities The Excel function BINOMDIST can be used also to generate cumulative probabilities. A cumulative probability is the probability that your result will be less than or equal to a particular number. To obtain the cumulative probability of each possible outcome of a binomial distribution with n=10 and p =0.25, use the following commands.
- Create a column with values of x for which you wish to find the corresponding cumulative probabilities. Type x in cell A1 and type the values 0 to 10 in cells A2: A12.
- In cell B1, type P(X<= x). - Activate cell B2, and select Insert Function. - Select Statistical category and select BINOMDIST then click OK. - Complete the BINOMDIST dialog box as follows
Number-s: A2 Trials: 10 Probability-s: 0.25 Cumulative: true Then click OK.
- Activate cell B2 and drag the lower right handle to fill the cells through B12.The results will be as shown in Figure (4.5).
Figure (4.5)
87

Graphing a Binomial Distribution To create a graph of the binomial distribution table
- Select the Chart Wizard from the standard toolbar. Select column type and the first chart sub-type. Click Next.
- Click the icon next to the Data Range box to minimize the dialog box. Highlight the cells, for example B2: B17, and then click the icon to return to the dialog box.
- Select the series tab. Click the icon next to the Category (X) axis table box. From the worksheet, highlight, for example cells A2: A17. Click Next. Label as necessary, then click Next and Finish.
Example 4.2: Construct the binomial distribution table for n =15 and p= 0.40 and graph the corresponding probability Histogram. Solution:
- Type x in cell A1 and P(x) in cell B1. - In cells A2 through A17 type the values 0 to 15. - Activate cell B2, and select Insert Function. - Select Statistical category and select BINOMDIST then click OK. - Complete the BINOMDIST dialog box as follows
Number-s: A2 Trials: 15 Probability-s: 0.40 Cumulative: false Then Click OK.
- Activate cell B2 and drag the lower right handle to fill the cells through B17.
- Select the Chart Wizard from the standard toolbar and the first chart sub-type. Click Next.
- Click the icon next to the Data Range box to minimize the dialog box. Highlight the cells B2: B17 and then click the icon to return to the dialog box.
88

- Select the series tab. Click the icon next to the category (X) axis Label axis table box. From the worksheet, highlight cells A2: A17 Click Next.
- Name your graph and axes then click Finish. - Modify your graph as you did at the beginning of this chapter [See
Figure (4.6)].
Figure (4.6)
Mean, Variance and Standard Deviation for Binomial Distribution Since Binomial Distribution is a probability distribution, we can compute the Mean, Variance and the Standard deviation in similar way as we did for Probability distribution. But there are easier formulas to work with for this particular distribution. Let n denotes the number of trials in a Binomial probability distribution and denotes the probability of success in a single trial by p and the probability of failure by q. Then the mean, variance, and standard deviation of a binomial probability distribution can be computed as follows:
89

Mean: μ = np Variance: δ² = npq Standard Deviation: δ = √npq Example 4.3: Suppose in a binomial distribution n = 24, p= 0.4, and q = 0.6. Compute the Mean, Variance and standard deviation. Solution:
- Open a new worksheet and create a title for it. Say, for example “Mean, Variance and Standard Deviation for a Binomial Distribution”. Since the name took up more than one cell, select the cells that the title spans and then click Format, click cells, then click on the tab Alignment and click in the box before Merge Cells and click OK.
- In cells A2, A3, A4, A5, A6, and A7 type sample size (n), Probability of success (p), Probability of failure (q), Mean, Variance and standard deviation, respectively.
- In cells B2, B3, and B4, type 24, 0.4, and 0.6, respectively. - To calculate the Mean, in cell B5, type the formula = B2* B3, then
click the Enter key. - In cell B6, type the formula =SQRT($B$6). Then click the Enter key. - A table similar to the one given below will be generated [see Figure
(4.7)].
90

Figure (4.7)
91

Microsoft Excel Lab Experiments Lab Experiment 4.1: Compute the mean, variance, and standard deviation of the probability distribution described in the following table.
x P(x) 0 0.3487 1 0.3874 2 0.1937 3 0.0574 4 0.0112 5 0.0015 6 0.0001 7 0.0000 8 0.0000
Lab Experiment 4.2: A coin is tossed n times. Assume the coin is fair and the probability of getting head in a single toss is p=0.5. Use BINOMDIST function to find the following probabilities.
(a) Find the probability of getting 7 heads out of 10 tosses. (b) Find the probability of getting exactly 30 heads out of 100 tosses. (c) Find the probability of getting at least 7 heads out of 10 tosses. (d) Find the probability of getting at least 30 heads out of 100 tosses. (e) Find the probability of getting at most 70 heads out of 100 tosses.
92

Lab Experiment 4.3:
(a) Consider a binomial distribution with 20 trials and the probability of success on a single trial is 0.35. Create a worksheet showing values of x and the corresponding binomial probabilities. Construct the probability Histogram.
(b) Consider a binomial distribution with 20 trials and the probability of success on a single trial is 0.65. Create a worksheet showing values of x and the corresponding binomial probabilities. Construct the probability Histogram.
(c) Compare the Graphs of parts (a) and (b). Discuss the skewness and the symmetry of each graph.
Lab Experiment 4.4: Use Microsoft Excel to find the binomial probabilities corresponding to n = 5 and p= 0.10. Enter the results below, along with the corresponding results found in Table 2 from your textbook.
x P(x) from Excel P(x) from Table 2 0 1 2 3 4 5
Lab Experiment 4.5: Assume the P(boy) = 0.54, P(girl) = 0.46, and that 100 births are randomly selected. Use Microsoft Excel to find the probability that the number of boys among 100 babies is
(a) fewer than 65 (b) fewer than 45 (c) at most 35 (d) at least 55 (e) more than 40
93